INTERIM REPORT AND UNAUDITED FINANCIAL STATEMENTS For the six month period ended 31st October 2017 MFM TECHINVEST SPECIAL SITUATIONS FUND

Welcome message from author
This document is posted to help you gain knowledge. Please leave a comment to let me know what you think about it! Share it to your friends and learn new things together.
Transcript
INTERIM REPORT AND UNAUDITED FINANCIAL STATEMENTS
For the six month period ended 31st October 2017
MFMTECHINVEST SPECIAL SITUATIONS FUND

MFM TECHINVEST SPECIAL SITUATIONS FUND Registered Office Marlborough House 59 Chorley New Road Bolton BL1 4QP Authorised Corporate Director and Registrar Marlborough Fund Managers Ltd Marlborough House 59 Chorley New Road Bolton BL1 4QP Investor Support: (0808) 145 2500 (FREEPHONE) Authorised and regulated by the Financial Conduct Authority. Depositary HSBC Bank plc 8 Canada Square London E14 5HQ Authorised by the Prudential Regulation Authority and regulated by the Financial Conduct Authority and the Prudential Regulation Authority. Investment Manager Techinvest Ltd Merchants House 27/30 Merchants Quay Dublin 8 Republic of Ireland Authorised and regulated by the Central Bank of Ireland. Auditor Barlow Andrews LLP Carlyle House 78 Chorley New Road Bolton BL1 4BY

MFM TECHINVEST SPECIAL SITUATIONS FUND
CONTENTS PAGE
AUTHORISED INVESTMENT MANAGER’S REPORT 1
AUTHORISED STATUS AND GENERAL INFORMATION 4
AUTHORISED CORPORATE DIRECTORS’ STATEMENT 4
FUND INFORMATION
Price and distribution record 5
Number of shares in issue / Net asset value per share 5
Ongoing charges 5
Synthetic risk and reward indicator 6
PORTFOLIO STATEMENT 7
PORTFOLIO TRANSACTIONS 8
UNAUDITED INTERIM FINANCIAL STATEMENTS
STATEMENT OF TOTAL RETURN 9
STATEMENT OF CHANGE IN NET ASSETS ATTRIBUTABLE TO SHAREHOLDERS 9
BALANCE SHEET 10
NOTES TO THE INTERIM FINANCIAL STATEMENTS 10

MFM TECHINVEST SPECIAL SITUATIONS FUND
AUTHORISED INVESTMENT MANAGER’S REPORT for the six month period ended 31 October 2017
Percentage change and sector position to 31 October 2017
Six Months 1 year 3 years 5 years Since launch* MFM Techinvest Special Situations Fund 4.33% 26.72% 85.17% 147.50% 92.28% Quartile Ranking** 4 4 1 2 4 * Launched 14.06.2005 (performance calculated from first pricing point 05.07.05).
** Based on ranking within The Investment Association’s UK Smaller Companies sector.External Source of Economic Data: Morningstar.
For the half year to midnight on 31 October 2017, your Fund’s Class A shares rose 4.33%, equating to an annual gain of 26.72%. This compares with an annual increase of 7.75% for London’s main market index, the FTSE 100, and a climb of 9.28% for the broader-based FTSE All-Share. The Fund is focused on smaller companies and is a constituent of The IA (The Investment Association) UK Smaller Companies sector. London’s index of smaller companies, the FTSE SmallCap, achieved an annual increase of 17.34%, lagging your Fund by more than nine percentage points over the same period.
As we’ve written before, your Fund’s managers take a multi-year view on investment decisions and, therefore, it is instructive to consider fund performance over a long-term period. On a five-year return basis, the Fund achieved a gain of 147.5%. This compares with 29.58% for the FTSE 100 and 36.15% for the FTSE All-Share. The smaller company-focused FTSE SmallCap fared better, returning 79.08%. It’s worth noting that more than 80% of the portfolio is made up of equities listed on London’s junior exchange, AIM. Over five years, the index for this venue, the FTSE AIM All-Share, achieved a gain of 48.92%. Moreover, that performance lags your Fund by more than 98 percentage points over the same five-year period.
In general, smaller company equities are more exposed to the UK domestic economy than the larger caps that make up the FTSE 100 Index. In your Fund’s Annual Report for the year ended 30 April 2017, we noted that, despite a broadly positive business climate at the time, uncertainty around Brexit negotiations could weigh negatively on business investment. However, despite some fears regarding the economic landscape, UK small company shares held up well during the half year to 31 October. During that period, the FTSE Small Cap recorded a rise of 5.52%, eclipsing the wider European-focused MCSI Europe Small Cap Index which gained 4.34%.
As at 31 October, the ten largest holdings in the Fund were, in alphabetical order, Blue Prism (a leading player in the relatively new technology category of Robotic Process Automation; it operates in a highly attractive market, driven by rapidly growing awareness and increasing adoption of software robots by large enterprises with significant back-office operations), Cairn Homes (a major builder of residential homes in Ireland which is now, through development of its substantial land bank, capitalising on strong price appreciation in the Irish residential sector), D4t4 Solutions (the ‘Big Data’ analytics specialist is progressively shifting its mix of sales towards higher-margin licence software, supporting the drive to increased profitability), Eckoh (the provider of secure payment products and customer contact solutions is successfully penetrating the US market, winning seven new client contracts in the first half of its financial year), Fulcrum Utility Services (the utility infrastructure specialist is a long-time core holding for the Fund; it continues to grow its gas asset estate and recently obtained an Independent Distribution Network Operator (IDNO) licence, enabling the Company to adopt and own electricity assets once industry qualification completes early next year), GYG (a provider of refit and painting services to the superyacht industry which was admitted to London’s AIM market in May of this year; clients include 25 of the 50 largest superyachts globally), Lombard Risk Management (the provider of cross-product collateral management and regulatory reporting solutions for the financial services sector), N Brown (following significant investments in business and IT systems, the Company has largely completed the transition from traditional home shopping to an online-focused business, targeting underserved customer groups (size 20+, age 45+) via a range of distinct brands), Statpro (the provider of cloud-based portfolio analysis software has completed the transformational acquisition of the risk and performance analytics service of UBS) and Yu Group (an independent supplier of electricity and gas to the UK corporate sector; the Company has secured significant new contracts and the most recent half year results showed revenue up over 400% year-on-year).
The Fund ended the period with 9.6% of the portfolio in cash. While this is down from the 13% recorded six months previously, it is higher than the average of the past few years. Smaller company equities tend to exhibit a higher level of price volatility than their larger peers and a strong cash position provides the Fund’s managers with the flexibility to take advantage of undervalued opportunities as they arise.
Recent new additions to the portfolio include FairFX, an international payment services provider to retail and corporate customers in the UK. The Company hosts a cloud-based platform, enabling personal and business customers to make low-cost multicurrency payments. It also offers prepaid currency cards and a range of additional services via a mobile app. The business broke into profit during the first half of 2017 and ended the period with approximately 640,000 customers. Plans to disrupt banking in the small and medium-sized company sector were further boosted with August’s acquisition of CardOne. Your Fund had discussions with FairFX management during this period and took part in an equity fundraise to support the acquisition.
The consumer adoption of e-commerce continues to gather pace, with the UK in the vanguard of this trend. Your Fund has invested in a number of companies that use e-commerce as a platform to disrupt traditional industries. One of these is eve Sleep, a direct to consumer e-commerce sleep brand that designs and sells eve-branded mattresses and other sleep products, targeting the £26 billion European sleep market. Through the outsourcing of manufacturing, eve operates a low cost model that has allowed it to grow internationally with moderate capital investment. Partnerships with Next Home (UK) and Karstadt (Germany) have helped to increase brand awareness in Europe’s two largest mattress markets.
1
MFM TECHINVEST SPECIAL SITUATIONS FUND AUTHORISED INVESTMENT MANAGER’S REPORT for the six month period ended 31 October 2017 Investors in UK small caps may take heart from the resilience of share prices since the EU Referendum result last year. Negative sentiment surrounding the possibility of a bad outcome for the Brexit negotiations has become widespread in the media and is now well-reflected in equity valuations. Therefore, the emergence of moderately positive news could have a significant upside impact for share prices. Recent data on the UK economy has been mixed. GDP figures announced late October showed 0.4 percent growth for the third quarter, higher than consensus forecasts. This cleared the way for the Bank of England to raise interest rates for the first time in a decade. UK inflation is currently running at the fastest for five years and domestic wage growth is increasing, leading to predictions that borrowing costs may rise further. However, many observers remain cautious on the prospects of significant increases in interest rates, pointing to continued weakness in business investment due to Brexit uncertainty. This suggests the miserly returns currently available on cash and bonds could continue for the foreseeable future. In turn, this maintains the relative attractiveness of the stock market as an asset class and especially those shares paying substantial cash dividends. From our perspective, investors appear somewhat wary of UK small caps currently. This view is backed by recent data from The Investment Association in the UK which showed that, despite record inflows into UK-listed funds during September, money continues to be pulled out of UK equity funds, with bond-focused funds being the main beneficiaries. Such ‘crowded trades’ can be an instructive contrary indicator. In our experience, periods of weak stock market sentiment are the best time to increase investments in the ‘best ideas’ in an equity portfolio. Small company shares are characterised by short bursts of significant outperformance and, for most investors, a patient long-term focus proves far more fruitful than attempting to predict short-term market direction based on prevailing macroeconomic conditions. The Fund is valued once a week at 12:00pm each Wednesday. The latest price is normally posted by 5:30pm that day on the Techinvest home-page at www.techinvest.ie. It can also be found in the Financial Times each day and at www.marlboroughfunds.com. A fact-sheet is updated each month with the latest data on the Fund and can be found on the Techinvest website. Techinvest Ltd. Investment Manager 17 November 2017 This report contains FTSE data. Source: FTSE International Limited (“FTSE”) © FTSE 2017. “FTSE®” is a trade mark of the London Stock Exchange Group companies and is used by FTSE International Limited under licence. All rights in the FTSE indices and / or FTSE ratings vest in FTSE and / or its licensors. Neither FTSE nor its licensors accept any liability for any errors or omissions in the FTSE indices and / or FTSE ratings or underlying data. No further distribution of FTSE Data is permitted without FTSE’s express written consent.
2
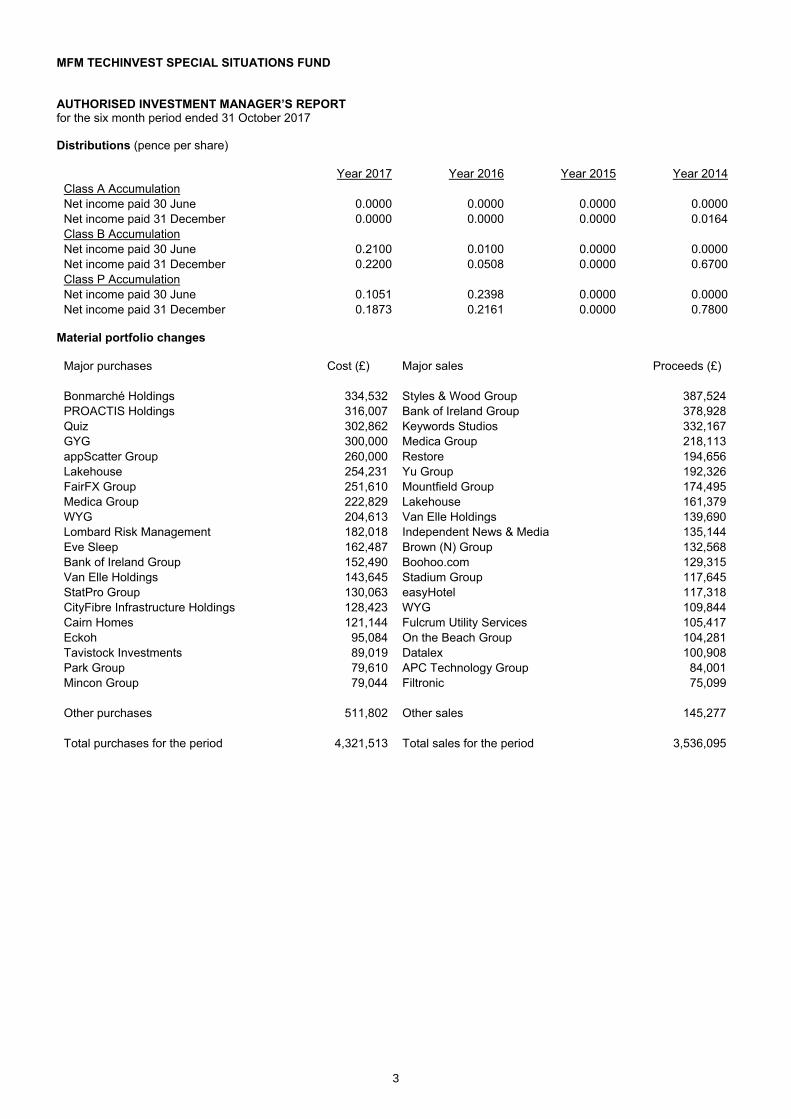
MFM TECHINVEST SPECIAL SITUATIONS FUND AUTHORISED INVESTMENT MANAGER’S REPORT for the six month period ended 31 October 2017 Distributions (pence per share)
Year 2017 Year 2016 Year 2015 Year 2014 Class A Accumulation Net income paid 30 June 0.0000 0.0000 0.0000 0.0000 Net income paid 31 December 0.0000 0.0000 0.0000 0.0164 Class B Accumulation Net income paid 30 June 0.2100 0.0100 0.0000 0.0000 Net income paid 31 December 0.2200 0.0508 0.0000 0.6700 Class P Accumulation Net income paid 30 June 0.1051 0.2398 0.0000 0.0000 Net income paid 31 December 0.1873 0.2161 0.0000 0.7800
Material portfolio changes
Major purchases Cost (£) Major sales Proceeds (£)
Bonmarché Holdings 334,532 Styles & Wood Group 387,524 PROACTIS Holdings 316,007 Bank of Ireland Group 378,928 Quiz 302,862 Keywords Studios 332,167 GYG 300,000 Medica Group 218,113 appScatter Group 260,000 Restore 194,656 Lakehouse 254,231 Yu Group 192,326 FairFX Group 251,610 Mountfield Group 174,495 Medica Group 222,829 Lakehouse 161,379 WYG 204,613 Van Elle Holdings 139,690 Lombard Risk Management 182,018 Independent News & Media 135,144 Eve Sleep 162,487 Brown (N) Group 132,568 Bank of Ireland Group 152,490 Boohoo.com 129,315 Van Elle Holdings 143,645 Stadium Group 117,645 StatPro Group 130,063 easyHotel 117,318 CityFibre Infrastructure Holdings 128,423 WYG 109,844 Cairn Homes 121,144 Fulcrum Utility Services 105,417 Eckoh 95,084 On the Beach Group 104,281 Tavistock Investments 89,019 Datalex 100,908 Park Group 79,610 APC Technology Group 84,001 Mincon Group 79,044 Filtronic 75,099 Other purchases 511,802 Other sales 145,277 Total purchases for the period 4,321,513 Total sales for the period 3,536,095
3
MFM TECHINVEST SPECIAL SITUATIONS FUND AUTHORISED STATUS AND GENERAL INFORMATION Authorised status MFM Techinvest Special Situations Fund is an investment company with variable capital incorporated under the Open Ended Investment Company (OEIC) Regulations 2001. It is a UCITS scheme as defined in the Collective Investment Schemes Sourcebook (COLL). The Company is incorporated in England and Wales with the registration number IC000385 and is authorised and regulated by the Financial Conduct Authority with effect from 7 April 2005. The shareholders are not liable for the debts of the Company. Investment objective The investment objective of the Fund is to provide long term capital growth and the accumulation of income through an actively managed portfolio of equities whose future prospects do not appear to be fully reflected yet in the current stock market price. The focus will be on smaller UK companies, although opportunities outside the UK may also be included, where appropriate. Particular attention will be paid to new emerging growth stocks and to recovery situations where change in a company’s underlying dynamics or direction can be expected to lead to an improvement in its reported results. There may be occasions when the investment manager, in order to ensure liquidity or stability, chooses to hold bonds, government securities, collective investment schemes or a high level of cash or money market instruments. Rights and terms attaching to each share class Each share of each class represents a proportional entitlement to the assets of the Fund. The allocation of income and taxation and the rights of each share in the event the Fund is wound up are on the same proportional basis. Changes in prospectus No changes have been made since the last report. Up to date key investor information documents, the full prospectus and reports and accounts for any fund within the manager’s range, can be requested at any time. AUTHORISED CORPORATE DIRECTOR’S STATEMENT This report has been prepared in accordance with the requirements of the Collective Investment Schemes Sourcebook as issued and amended by the Financial Conduct Authority. ALLAN HAMER JOINT MANAGING DIRECTOR G R HITCHIN INVESTMENT DIRECTOR MARLBOROUGH FUND MANAGERS LTD 8 December 2017
4

MFM TECHINVEST SPECIAL SITUATIONS FUND
FUND INFORMATION
Accumulation shares were first offered at 100p on 14 June 2005. On 31 December 2012, the existing shares were reclassified as Class A shares and Class B and P shares became available for purchase.
Price and distribution record
Financial year to Highest price Lowest price Net income per share
Class A Accumulation 30 April 2015 112.97p 102.47p 0.0164p 30 April 2016 144.92p 114.23p 0.0000p 30 April 2017 182.38p 131.86p 0.0000p 30 April 2018* 196.44p 184.57p 0.0000p Class B Accumulation 30 April 2015 113.98p 103.23p 0.6700p 30 April 2016 146.80p 115.26p 0.0100p 30 April 2017 186.06p 133.81p 0.2608p 30 April 2018* 200.81p 188.50p 0.2200p Class P Accumulation 30 April 2015 114.55p 103.75p 0.7800p 30 April 2016 147.88p 115.84p 0.2398p 30 April 2017 187.67p 134.82p 0.3212p 30 April 2018* 202.81p 190.26p 0.1873p
* six month period to 31 October 2017.
Number of shares in issue/Net asset value per share
Net asset value of Number of Net asset value scheme property shares in issue per share
Class A Accumulation 30 April 2015 £3,185,076 2,860,743 111.34p 30 April 2016 £9,426,862 6,719,919 140.28p 30 April 2017 £9,937,950 5,475,073 181.51p 31 October 2017 £10,498,155 5,549,912 189.16p Class B Accumulation 30 April 2015 £112 100 112.34p 30 April 2016 £142 100 142.16p 30 April 2017 £185 100 185.19p 31 October 2017 £193 100 193.46p Class P Accumulation 30 April 2015 £113 100 112.91p 30 April 2016 £10,954 7,648 143.23p 30 April 2017 £1,460,657 781,929 186.80p 31 October 2017 £1,901,864 973,217 195.42p
Ongoing charges
Class A Class B Class P 30 April 2017 1.64% 1.14% 0.89% 31 October 2017 1.62% 1.12% 0.87%
The ongoing charge figure is based on expenses for the year. This figure may vary from year to year. It excludes: Performance fees Portfolio transaction costs, except in the case of an entry/exit charge paid by the Fund when buying or selling
units in another collective investment scheme.
5

MFM TECHINVEST SPECIAL SITUATIONS FUND FUND INFORMATION Synthetic risk and reward indicator Lower risk Higher risk Typically lower rewards Typically higher rewards
The risk and reward indicator above aims to provide you with an indication of the overall risk and reward profile of the Fund. It is calculated based on the volatility of the Fund using weekly historic returns over the last five years. If five years data is not available for a fund, the returns of a representative portfolio are used. This Fund has been measured as 5 because it has experienced significant volatility historically.
1 2 3 4 5 6 7
6
MFM TECHINVEST SPECIAL SITUATIONS FUND
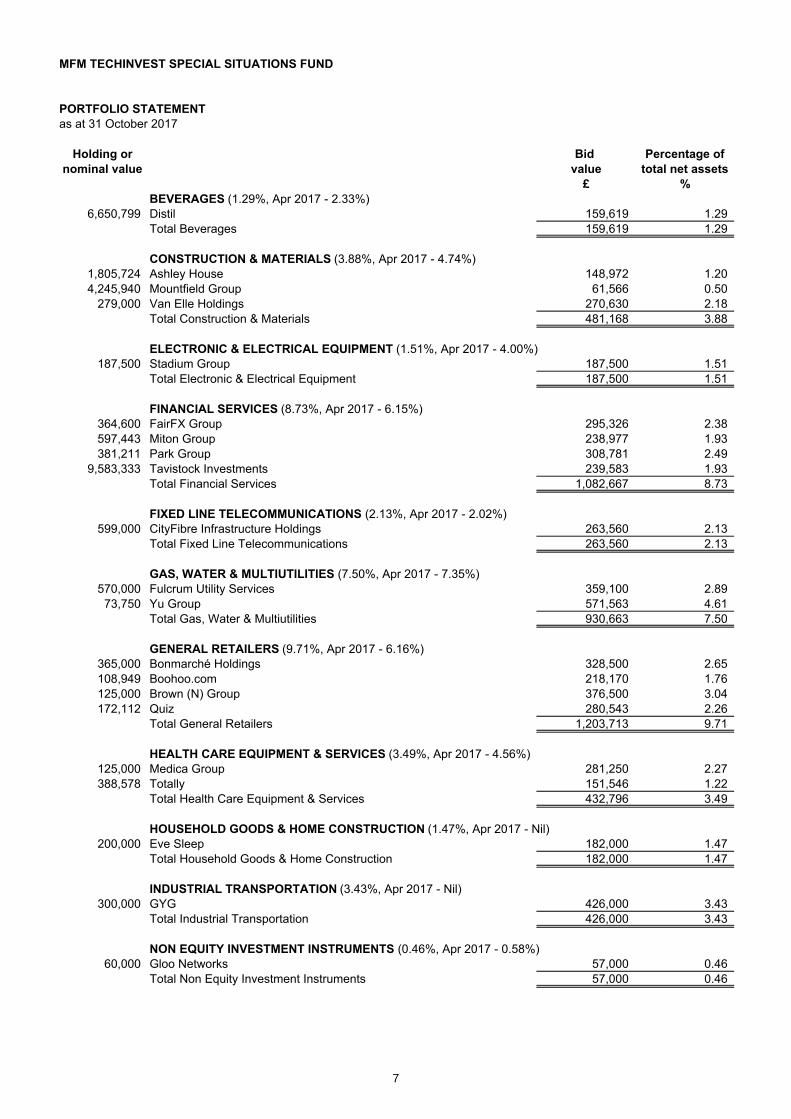
PORTFOLIO STATEMENTas at 31 October 2017
Holding or Bid Percentage ofnominal value value total net assets
£ %BEVERAGES (1.29%, Apr 2017 - 2.33%)
6,650,799 Distil 159,619 1.29Total Beverages 159,619 1.29
CONSTRUCTION & MATERIALS (3.88%, Apr 2017 - 4.74%)1,805,724 Ashley House 148,972 1.204,245,940 Mountfield Group 61,566 0.50
279,000 Van Elle Holdings 270,630 2.18Total Construction & Materials 481,168 3.88
ELECTRONIC & ELECTRICAL EQUIPMENT (1.51%, Apr 2017 - 4.00%)187,500 Stadium Group 187,500 1.51
Total Electronic & Electrical Equipment 187,500 1.51
FINANCIAL SERVICES (8.73%, Apr 2017 - 6.15%)364,600 FairFX Group 295,326 2.38597,443 Miton Group 238,977 1.93381,211 Park Group 308,781 2.49
9,583,333 Tavistock Investments 239,583 1.93Total Financial Services 1,082,667 8.73
FIXED LINE TELECOMMUNICATIONS (2.13%, Apr 2017 - 2.02%)599,000 CityFibre Infrastructure Holdings 263,560 2.13
Total Fixed Line Telecommunications 263,560 2.13
GAS, WATER & MULTIUTILITIES (7.50%, Apr 2017 - 7.35%)570,000 Fulcrum Utility Services 359,100 2.89
73,750 Yu Group 571,563 4.61Total Gas, Water & Multiutilities 930,663 7.50
GENERAL RETAILERS (9.71%, Apr 2017 - 6.16%)365,000 Bonmarché Holdings 328,500 2.65108,949 Boohoo.com 218,170 1.76125,000 Brown (N) Group 376,500 3.04172,112 Quiz 280,543 2.26
Total General Retailers 1,203,713 9.71
HEALTH CARE EQUIPMENT & SERVICES (3.49%, Apr 2017 - 4.56%)125,000 Medica Group 281,250 2.27388,578 Totally 151,546 1.22
Total Health Care Equipment & Services 432,796 3.49
HOUSEHOLD GOODS & HOME CONSTRUCTION (1.47%, Apr 2017 - Nil)200,000 Eve Sleep 182,000 1.47
Total Household Goods & Home Construction 182,000 1.47
INDUSTRIAL TRANSPORTATION (3.43%, Apr 2017 - Nil)300,000 GYG 426,000 3.43
Total Industrial Transportation 426,000 3.43
NON EQUITY INVESTMENT INSTRUMENTS (0.46%, Apr 2017 - 0.58%)60,000 Gloo Networks 57,000 0.46
Total Non Equity Investment Instruments 57,000 0.46
7

MFM TECHINVEST SPECIAL SITUATIONS FUND
PORTFOLIO STATEMENTas at 31 October 2017
Holding or Bid Percentage ofnominal value value total net assets
£ %SOFTWARE & COMPUTER SERVICES (27.46%, Apr 2017 - 20.14%)
400,000 appScatter Group 224,000 1.8136,564 Blue Prism Group 511,896 4.13
230,000 D4t4 Solutions 338,100 2.73880,000 Eckoh 444,400 3.58380,000 Elecosoft 163,400 1.32750,000 GAN 232,500 1.87
5,800,000 Lombard Risk Management 391,500 3.1671,102 Osirium Technologies 110,208 0.89
176,277 PROACTIS Holdings 282,043 2.27465,000 StatPro Group 706,800 5.70
Total Software & Computer Services 3,404,847 27.46
SUPPORT SERVICES (2.80%, Apr 2017 - 9.16%)8,886 Keywords Studios 141,998 1.14
2,740,000 Redhall Group 205,500 1.66Total Support Services 347,498 2.80
TECHNOLOGY HARDWARE & EQUIPMENT (1.56%, Apr 2017 - 1.28%)1,291,515 Filtronic 193,727 1.56
Total Technology Hardware & Equipment 193,727 1.56
TRAVEL & LEISURE (4.84%, Apr 2017 - 6.64%)56,798 Best of the Best 147,675 1.1952,000 On the Beach Group 214,500 1.73
474,948 Safestay 237,474 1.92Total Travel & Leisure 599,649 4.84
OVERSEAS SECURITIES (10.11%, Apr 2017 - 11.88%)320,000 Cairn Homes 499,202 4.03
58,000 Dalata Hotel Group 272,777 2.2075,000 Datalex 233,573 1.88
266,206 Mincon Group 247,569 2.00Total Overseas Securities 1,253,121 10.11
UNQUOTED SECURITIES (0.00%, Apr 2017 - 0.00%)90,000 Infoserve Group 0 0.00
Total Unquoted Securities 0 0.00
Portfolio of investments 11,205,528 90.37Net current assets on capital account 1,194,684 9.63Net assets 12,400,212 100.00
PORTFOLIO TRANSACTIONS £for the six month period ended 31 October 2017
Total purchases costs, including transaction charges 4,321,513
Total sales proceeds, net of transaction charges 3,536,095
The investments of the Fund have been valued at their fair value at close of business on 31 October 2017. Fair value isnormally the bid value of each security by reference to quoted prices from reputable sources; that is the market price. If theauthorised corporate director (ACD) believes that the quoted price is unreliable, or if no price exists, a valuation technique isused whereby fair value is the ACD's best estimate of a fair and reasonable value for that investment. The fair value excludesany element of accrued interest. Infoserve Group is deemed to be valueless by the fund manager.
8

MFM TECHINVEST SPECIAL SITUATIONS FUND
STATEMENT OF TOTAL RETURNfor the six month period ended 31 October 2017
31 October 2017 31 October 2016£ £ £ £
Income:Net capital gains/(losses) 498,964 476,606Revenue 66,874 51,024
Expenses (96,338) (75,040)Net revenue/(expense) before taxation (29,464) (24,016)
Taxation 0 0
Net revenue/(expense) after taxation (29,464) (24,016)
Total return before distributions 469,500 452,590
Distributions (1,058) 1,517
Change in net assets attributable to shareholders frominvestment activities 468,442 454,107
STATEMENT OF CHANGE IN NET ASSETS ATTRIBUTABLE TO SHAREHOLDERSfor the six month period ended 31 October 2017
31 October 2017 31 October 2016£ £ £ £
Opening net assets attributable to shareholders * 11,398,792 9,437,959
Amounts receivable on issue of shares 2,511,094 1,487,680Amounts payable on cancellation of shares (1,979,748) (2,123,590)Amounts payable on share class conversions (191) (537)
531,155 (636,447)
Change in net assets attributable to shareholders frominvestment activities 468,442 454,107
Retained distribution on accumulation shares 1,823 856
Closing net assets attributable to shareholders 12,400,212 * 9,256,475
* These figures are not the same as the comparatives are taken from the preceding interim period and not the last final accounts.
9

MFM TECHINVEST SPECIAL SITUATIONS FUND
BALANCE SHEETas at 31 October 2017
31 October 2017 30 April 2017
£ £Assets:Fixed Assets:Investments 11,205,528 9,916,265
Current Assets:Debtors 4,721 171,123Cash and bank balances 1,223,934 1,359,099Total assets 12,434,183 11,446,487
Liabilities:Creditors:Bank overdrafts 15,950 32,088Other creditors 18,021 15,607Total liabilities 33,971 47,695
Net assets attributable to shareholders 12,400,212 11,398,792
NOTES TO THE INTERIM FINANCIAL STATEMENTSfor the six month period ended 31 October 2017
Basis for preparation
Accounting policies
The interim financial statements have been prepared in compliance with FRS102 and in accordance with the Statement ofRecommended Practice for UK Authorised Funds issued by The Investment Association in May 2014.
The financial statements are prepared in sterling, which is the functional currency of the Fund. Monetary amounts in thesefinancial statements are rounded to the nearest pound.
The financial statements have been prepared on the historical cost convention, modified to include the revaluation ofinvestments and certain financial instruments at fair value.
The accounting policies applied are consistent with those of the annual financial statements for the year ended 30 April 2017and are described in those annual financial statements.
10

Marlborough Fund Managers LtdMarlborough House,59 Chorley New Road,Bolton BL1 4QP
Investor Support: 0808 145 2500 (FREEPHONE)Dealing: 0808 145 2501 (FREEPHONE)Fax: 01204 533045
Email: [email protected]: www.marlboroughfunds.com
Marlborough Fund Managers Ltd. Registered in England No. 2061177Authorised and regulated by the Financial Conduct Authority and a member of The Investment Association
Related Documents