Mexico’s coasts: Half-way to sustainability Georges Seingier a , Ileana Espejel b, * , José Luis Fermán-Almada a , Gabriela Montaño-Moctezuma c , Isaac Azuz-Adeath d , Guillermo Aramburo-Vizcarra e a Facultad de Ciencias Marinas, Universidad Autónoma de Baja California (UABC), México b Facultad de Ciencias, Universidad Autónoma de Baja California (UABC), México c Instituto de Investigaciones Oceanológicas, Universidad Autónoma de Baja California (UABC), México d Centro de Enseñanza Técnica y Superior (CETYS Universidad), México e Instituto Municipal de Investigación y Planeación de Ensenada (IMIP), Mexico article info Article history: Available online 5 November 2010 abstract Sustainability was estimated through a Sustainable Capacity Index defined as the combination of three aspects (state of the environment, quality of life of the human population, and pressure applied by human activities), used as a guideline for the differentiation of sustainability situations. We identified five different municipality groups, in terms of sustainability, as well as two thresholds, beyond which sustainable capacity was not present: below the sustainable capacity lower threshold, close to the sustainable capacity threshold, optimum situation, close to the sustainable capacity higher threshold, and above the sustainable capacity higher threshold. In general Mexico was found to be in an apparent balanced situation, in the sense that it is not overweighed around extreme values, the majority of the coastal municipalities falling in the optimum sustainable situation, within the cross comparison, char- acterized by medium coastal cities. We can conclude that Mexico has reached a critical point where it has to decide about the direction its coastal development has to take, since our results suggest that Mexican’s municipalities are half way to sustainability. The ideal situation would be that the optimum situation would maintain its actual low pressure with high state, but could increase its quality of life. This work provided a rapid monitoring and cross comparison tool for an estimation of the sustainable situation of Mexico’s coasts, repeatable in time, and in phase with the recent national coastal zone management principles and strategies. Ó 2010 Elsevier Ltd. All rights reserved. 1. Introduction Although various definitions of sustainability are found, all agree that it is related to the interaction of two components: the human society and the environmental/ecological system, both affecting and being affected by the other. If we follow the weak or strong sustainability concept, we define very weak sustainability is when nature resources and services could integrally be replaced by manufacture products, case in which ecological system’s sustainability is considered only when necessary for the sustain- ability of the human, economic and social, component (Turner, 1993). On the other extreme, a very strong sustainability focuses on sustaining the ecological system first, with the belief that natural resource cannot be substituted by human made capital. Our definition of sustainability is of a systematic approach, close to that described by Gallopín (2003), which considers a complete human-ecological system as the system to be considered, as a combination of the two previously described anthropocentric and biocentric point of views. We will therefore talk of sustainability when both socio-economic and natural ecosystem are healthy. The main questions that we considered relevant to estimate the sustainability were: what is the state of the environment? what are the pressures of society on the environment? and what is the state of the human society (socially and economically)? To answer these questions this work generated a model close to the Driving force, State, Response vision (DSR model of EC, 1996) which will be described in the next section. Both environmental quality and pressure have been estimated by numerous indicators, and depend on the particularity of a studied area, as well as of the scale of the work (Boyd, 2001; Ward et al., 1998; EEA, 2006; CIAT-World Bank-UNEP, 2000; Dauber et al., 2003; Kurtz et al., 2001, Tasser et al., 2008; US EPA, 2000). The consideration of natural coverage and land use for estimating the environmental state and pressure of society has the advantages of providing * Corresponding author. Fax: þ52 (646) 1744560. E-mail address: [email protected] (I. Espejel). Contents lists available at ScienceDirect Ocean & Coastal Management journal homepage: www.elsevier.com/locate/ocecoaman 0964-5691/$ e see front matter Ó 2010 Elsevier Ltd. All rights reserved. doi:10.1016/j.ocecoaman.2010.10.034 Ocean & Coastal Management 54 (2011) 123e128

Welcome message from author
This document is posted to help you gain knowledge. Please leave a comment to let me know what you think about it! Share it to your friends and learn new things together.
Transcript
lable at ScienceDirect
Ocean & Coastal Management 54 (2011) 123e128
Contents lists avai
Ocean & Coastal Management
journal homepage: www.elsevier .com/locate/ocecoaman
Mexico’s coasts: Half-way to sustainability
Georges Seingier a, Ileana Espejel b,*, José Luis Fermán-Almada a, Gabriela Montaño-Moctezuma c,Isaac Azuz-Adeath d, Guillermo Aramburo-Vizcarra e
a Facultad de Ciencias Marinas, Universidad Autónoma de Baja California (UABC), Méxicob Facultad de Ciencias, Universidad Autónoma de Baja California (UABC), Méxicoc Instituto de Investigaciones Oceanológicas, Universidad Autónoma de Baja California (UABC), MéxicodCentro de Enseñanza Técnica y Superior (CETYS Universidad), Méxicoe Instituto Municipal de Investigación y Planeación de Ensenada (IMIP), Mexico
a r t i c l e i n f o
Article history:Available online 5 November 2010
* Corresponding author. Fax: þ52 (646) 1744560.E-mail address: [email protected] (I. Esp
0964-5691/$ e see front matter � 2010 Elsevier Ltd.doi:10.1016/j.ocecoaman.2010.10.034
a b s t r a c t
Sustainability was estimated through a Sustainable Capacity Index defined as the combination of threeaspects (state of the environment, quality of life of the human population, and pressure applied byhuman activities), used as a guideline for the differentiation of sustainability situations. We identifiedfive different municipality groups, in terms of sustainability, as well as two thresholds, beyond whichsustainable capacity was not present: below the sustainable capacity lower threshold, close to thesustainable capacity threshold, optimum situation, close to the sustainable capacity higher threshold,and above the sustainable capacity higher threshold. In general Mexico was found to be in an apparentbalanced situation, in the sense that it is not overweighed around extreme values, the majority of thecoastal municipalities falling in the optimum sustainable situation, within the cross comparison, char-acterized by medium coastal cities. We can conclude that Mexico has reached a critical point where it hasto decide about the direction its coastal development has to take, since our results suggest that Mexican’smunicipalities are half way to sustainability. The ideal situation would be that the optimum situationwould maintain its actual low pressure with high state, but could increase its quality of life. This workprovided a rapid monitoring and cross comparison tool for an estimation of the sustainable situation ofMexico’s coasts, repeatable in time, and in phase with the recent national coastal zone managementprinciples and strategies.
� 2010 Elsevier Ltd. All rights reserved.
1. Introduction
Although various definitions of sustainability are found, allagree that it is related to the interaction of two components: thehuman society and the environmental/ecological system, bothaffecting and being affected by the other. If we follow the weak orstrong sustainability concept, we define very weak sustainabilityis when nature resources and services could integrally be replacedby manufacture products, case in which ecological system’ssustainability is considered only when necessary for the sustain-ability of the human, economic and social, component (Turner,1993). On the other extreme, a very strong sustainability focuseson sustaining the ecological system first, with the belief thatnatural resource cannot be substituted by humanmade capital. Ourdefinition of sustainability is of a systematic approach, close to
ejel).
All rights reserved.
that described by Gallopín (2003), which considers a completehuman-ecological system as the system to be considered, asa combination of the two previously described anthropocentric andbiocentric point of views. We will therefore talk of sustainabilitywhen both socio-economic and natural ecosystem are healthy.
The main questions that we considered relevant to estimate thesustainability were: what is the state of the environment? whatare the pressures of society on the environment? and what is thestate of the human society (socially and economically)?
To answer these questions this work generated a model close tothe Driving force, State, Response vision (DSR model of EC, 1996)which will be described in the next section. Both environmentalquality and pressure have been estimated by numerous indicators,and depend on the particularity of a studied area, as well as ofthe scale of the work (Boyd, 2001; Ward et al., 1998; EEA, 2006;CIAT-World Bank-UNEP, 2000; Dauber et al., 2003; Kurtz et al.,2001, Tasser et al., 2008; US EPA, 2000). The consideration ofnatural coverage and land use for estimating the environmentalstate and pressure of society has the advantages of providing
Naturalcoverage
Perforationby locality
StateIndex
Populationdensity
Land use
PressureIndex
Poverty
Quality of LifeIndex
SustainableCapacity Index
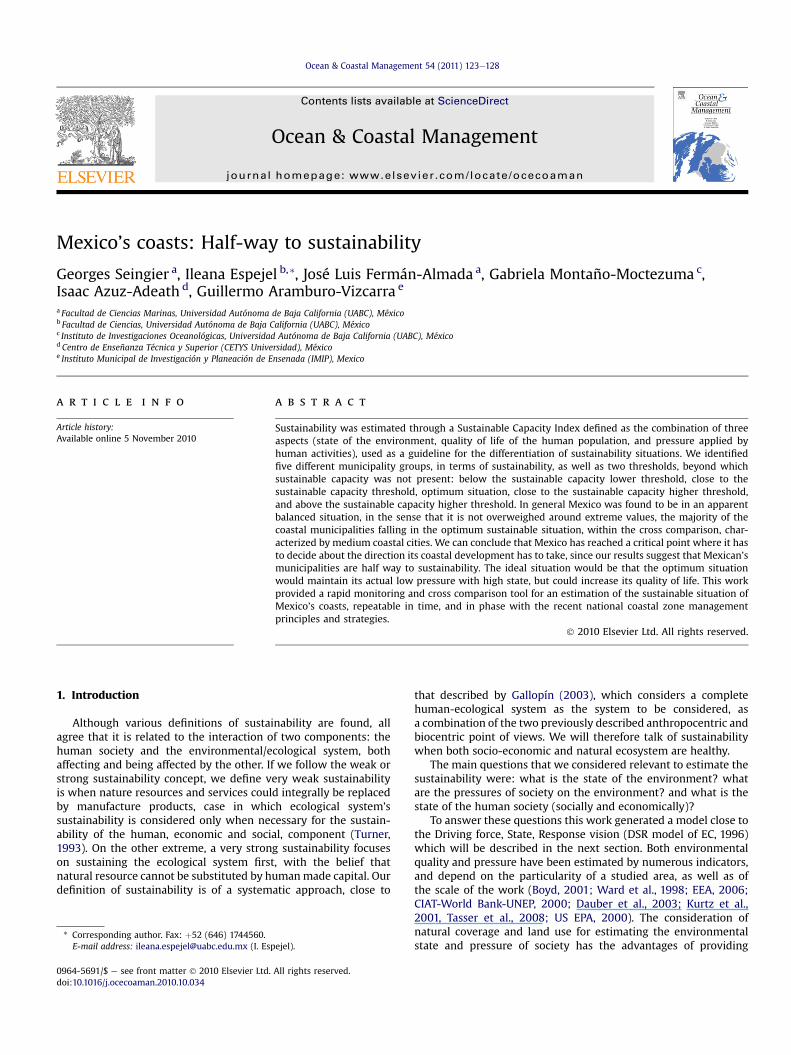
Fig. 1. The 3-component concept of the sustainable capacity index and correspondingsubindexes.
G. Seingier et al. / Ocean & Coastal Management 54 (2011) 123e128124
spatially homogeneous data that can be obtained at recurrent timescales with remote sensing imagery, and this resource is ofcommon use now in Mexico, and data reliability of these nationalcensuses is well documented (Mas et al., 2009).
The state of the human society is an estimation of the quality oflife. Definition has been more economic (Gross domestic product),but recently international efforts have been made to develop moreholistic indicators. United Nations Development program’s Humandevelopment Index (UNDP, 1990), which added life expectancy andliteracy to the monetary indicator, has been used to estimatehuman development sustainability (Neumayer, 2001). In Mexico,the named “índice de marginación” in Spanish (MarginalizationIndex MI) or poverty index, is available for each Mexican locality,municipality and state, every ten years, and considers education,health, housing, monetary income and gender (CONAPO, 2000) andhas been used at different dates (Sánchez Almanza, 2000). The useof official national census data has the advantage of providinggeoreferencied data at recurrent dates that can be easily integratedin a geographical information system, which facilitates the spatialanalysis of interdisciplinary data.
The pressure put on the environment for the consumption ofnatural resource, is done by society to seek benefit and a betterstate. Therefore, the development of the coasts could justify thediminution of natural resources if the population social benefitswould increase. InMexico, efforts to formalize coastal developmentand management are relatively recent and we can cite the recentOcean and Coast sustainable development National EnvironmentalPolicy (PANDSOC, 2009) published by the Environment and NaturalResource Secretary (SEMARNAT, 2007). Work zonified on a regionalcoastal basis (coastal floristic regions), has described that wheremore natural coverage has been lost is also where more margin-alization has occurred (Seingier et al., 2009). Other detailed work,but in a little part of the coast, has shown a low social conditioncompared to economic and environmental aspects (Barrera-Roldánand Saldívar-Valdés, 2002). This work proposes to go deeper intothe understanding of the relations between environmental state,human pressure on the latter, and the resulting quality of lifethrough a cross comparison of the situation of sustainabilitycapacity for the entire country’s coastal municipalities.
In 2005, Mexico counted nearly 104 millions inhabitants anda 16% increased is hoped for 2030, when it will reach 120 million.However, the 15 millions inhabitants of the coastal municipalitiesare expected to increase 39%, two times more than the nationallevel. The future will bring more pressures, both internal: ruralurban migration within the coastal municipalities, and external:population migration towards the coast (Partida Bush, 2008).Moreover, relatively small in comparison, natural pressures willhave to be dealt with: sea level rise, frequency change of meteo-rological events, associated to climate change (Seingier et al., 2009).The resulting changes in the environmental state and in the qualityof life of the population will depend on the characteristic of eachmunicipality, of which estimation is proposed in this work, whichcan serve as a basis for future comparison.
2. Methods
2.1. Sustainable capacity model
Sustainability was defined as the combination of three aspects:state of the environment, quality of life of the human population,and pressure applied by human activities, as summarized in Fig. 1.Indicators representative of three components were obtained fromofficial national censuses: percentage of natural vegetationcoverage and perforation of natural vegetation by localities for thestate index StI, population density and percentage of transformed
land use (SEMARNAT, 2000, INEGI, 2000, and CONAPO, 2000) forpressure index PI, and poverty index to estimate the quality of life(QoLI), as a function of education, health, housing and incomeindicators calculated from population census (CONAPO, 2000).
The model was integrated via a geographical informationsystem and was applied for Mexico’s 169 coastal municipalities(with coastline, estuary o coastal water bodies) (Fig. 1) with 2000population census data (INEGI, 2000), resulting in a cross-comparison of all indexes. Results were also grouped by theseventeen coastal states, to provide a regional and other adminis-trative scale interpretation.
2.2. Sustainable capacity index SCI
A sustainable capacity index SCI was calculated as the sum of PI,StI and QoLI:
SCI ¼X
ðStI; QoLI; PIÞwhere SCI ¼ sustainable capacity index; StI ¼ State index;QoLI ¼ Quality of life index; and PI ¼ pressure index.
The values obtained for the index were not designed as a directestimation of the sustainability but rather as a guideline for theanalysis of the different sustainability situations observed, thatwould have to consider the relative contribution of PI, StI and QoLIin the SCI, as well as threshold values betweenwhich sustainabilitycan be observed.
2.2.1. State index StISquare kilometers of natural vegetation within the municipality
divided by the total municipal area gave an estimation of thequantity of natural environment covering the municipality (naturalcoverage subindex NCI). The quality of this environment was esti-mated by a landscape quality indicator as is the number of local-ities to municipal area ratio (perforation by locality subindex). Thesum of both subindexes represent the State Index (StI), constructedso that it increases with more natural vegetation coverage anddecreases with developing perforation (more towns and cities).
2.2.2. Quality of life index QoLIThe National Population Council (CONAPO) develops a margin-
alization index, calculated by several indicators from the nationalcensuses (INEGI), which is updated every 10 years. In part, thisindex was performed to estimate the poverty of Mexicans, but itsdesign is biased to best value urban indicators. Indeed the higherthe index the more urbanized the municipality is. Although therelation between quality of life, poverty, and urbanization can be
G. Seingier et al. / Ocean & Coastal Management 54 (2011) 123e128 125
discussed, it is the index used to estimate the quality of life of thepopulation in international comparisons. Here the index wasdefined by the inverse of the municipal poverty index, such thatQoLI decreases when poverty grows.
2.2.3. Pressure index PIPressure from land use considered two main activities: agri-
culture and urbanization. Because urban use impacts more thanagriculture, which is more resilient to changes, it was considered togenerate more pressure than agriculture. Land use index wastherefore constructed as the weighted sum of two subindexeslinked to the agriculture area and to the urban area (as a percentageof municipal area), with assigned weights of 2 for urban and 1 foragriculture.
Pressure form population was taken into account as a secondsubindex of pressure as the municipal population density. The sumof both subindexes produced a pressure index that increases withboth population and territory transformation.
All indicators, subindexes and indexes were normalized toobtain dimensionless quantities, ranging from 0 to 1, in order to becomparable, following Nijkamp et al., (1990).
3. Results and discussion
3.1. State index
In this cross comparison of Mexicanmunicipalities, a majority ofmunicipal StI values are High or Very High, to the exception oflargely transformed Veracruz, followed by highly perforated Chia-pas, which concentrate low to medium StI values (Table 1). Threestates have very high municipal StI values: mostly large naturalwith little population concentrated on the coast (very high naturalcoverage subindex combined with low perforation by localitysubindex (Table 1)): Baja California Sur on the Pacific side, andQuintana Roo and Campeche in the Yucatan peninsula. These stateshave large or many protected coastal areas where coastal cities ortowns are absent or the existing ones are growing but not increasingin number as is common in other unprotected coastal states.
3.2. Pressure index
We observed an overall symmetric behavior of PI compared toStI (very high state corresponding to low pressure, high state to
Table 1Occurrence distribution of index classes, grouped by states. Equal interval classes: low (L
State Index Pressure Index
L M H VH L M H VH
B.C. 1 2 1 1 2 1B.C.S. 5 5Sonora 1 1 4 7 6 5 2Sinaloa 1 6 3 1 7 2Nayarit 7 1 7 1Jalisco 1 4 1 4Colima 1 2 2 1Michoacán 3 1 2Guerrero 3 7 2 12Oaxaca 3 12 10 4 18 3Chiapas 3 7 8 2Tamaulipas 1 5 1 1 3 1 2Veracruz 16 15 1 12 18 2Tabasco 1 3 1 3 2Campeche 1 6 4 3Yucatan 1 6 6 2 11Q.R. 1 6 5 2
Total: 21 34 61 53 31 101 33 4
medium pressure, low state to high pressure, as seen in Table 1)which could have relatively been expected since more pressureon the environment will cause more impacts and a lower quality ofthe environment. However, the application to our case studiesshowed various interesting asymmetries in this relation.
The majority of the PI values are on the low to medium side, aswould dictate the behavior just described if most StI values are highto very high. The low tomedium State index of Chiapas correspondsonly tomedium pressure, although wewould expect higher PI. Thisindicates Chiapas’ municipalities’ vulnerability, or low capacity tosustain pressure without deterioration of environment quality.
Only two states havemunicipalitieswith very high (VH) pressureindex PI: Veracruz, as would have been expected from the low stateindex, and Tamaulipas in the northwestern part of the Gulf ofMexico. As Tamaulipas is not one of the two lowStI described before,we can say the opposite as of Chiapas: that Tamaulipas has lessvulnerability thanVeracruz, or than Chiapas, i.e., has higher capacityto sustain pressure without deterioration of environment quality.
3.3. Quality of life index
Municipalities of the Baja California Peninsula obtain highestQoLI values, followed by the other northwestern states adjacent tothe Gulf of California, down to Colima. The northeastern munici-palities of Tamaulipas manage a good score, probably due to moreelevated incomes characteristic of border states as well as portactivities and fisheries (Sanchez-Gil et al., 2004). Medium to highQoLI were seen in Yucatan peninsula (dependent of fisheries andtourism), while lowest values were characteristic of municipalitiesin the Guerrero, Oaxaca and Veracruz states.
State grouping for analysis showed to prove a relative regionalhomogeneity, except maybe for state of Michoacán QoLi, wheremunicipalities have larger range of QoLI, from low to very high, dueto the presence of small rural municipalities, next to one of thecountries most important harbor, Lázaro Cárdenas.
3.4. Sustainable capacity index SCI
SCI was calculated for each municipality. The geographicalinformation system produced a sustainable capacity index map(Fig. 2) enabling us to read its spatial variability and immediatelyassociate the index values to the municipalities. Results are alsopresented in Fig. 3, along with PI, StI and QoLI values, ordered for
), medium (M), high (H) y very high (VH). Digit refers to number of municipalities.
Quality of Life Index Sustainable Capacity Index
L M H VH L M H VH Tot.
4 3 1 45 5 5
5 8 3 9 1 132 5 3 3 7 10
7 1 8 81 2 2 2 2 1 5
2 1 1 2 31 1 1 1 1 1 33 6 3 10 2 127 12 5 1 3 17 5 25
7 3 6 4 103 4 3 2 2 7
4 13 9 6 9 17 5 1 322 3 3 2 54 2 1 3 4 76 6 1 8 5 132 2 3 2 4 1 7
15 55 58 41 19 77 66 7 169
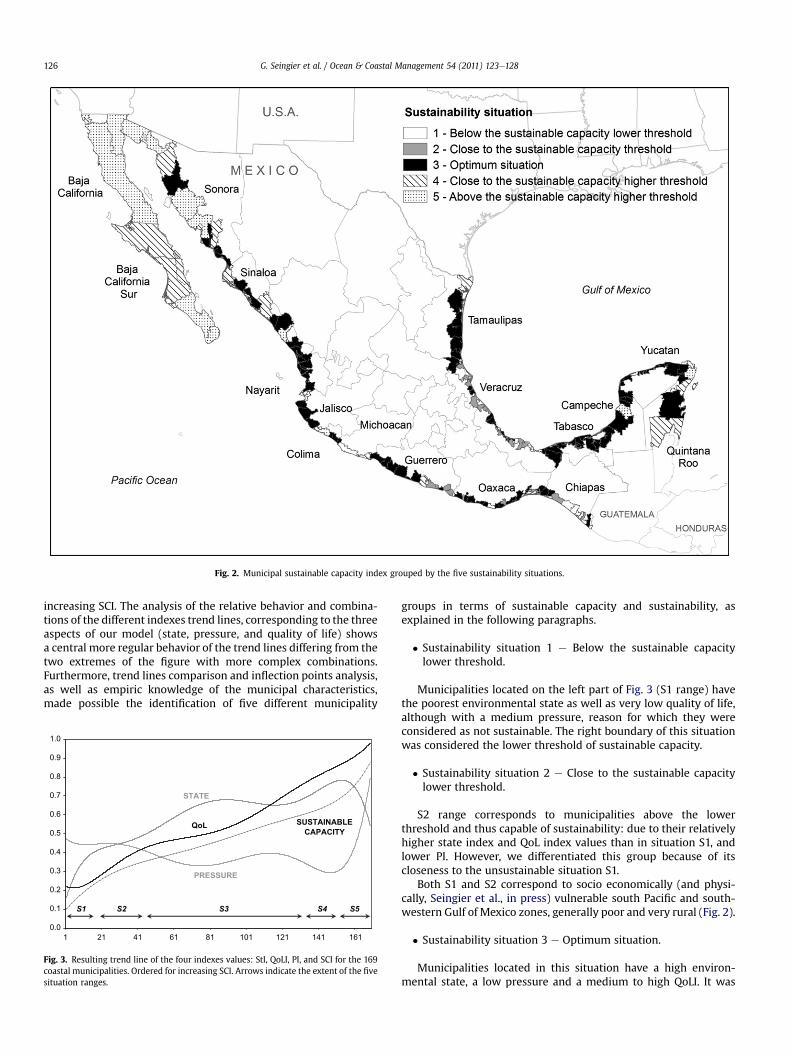
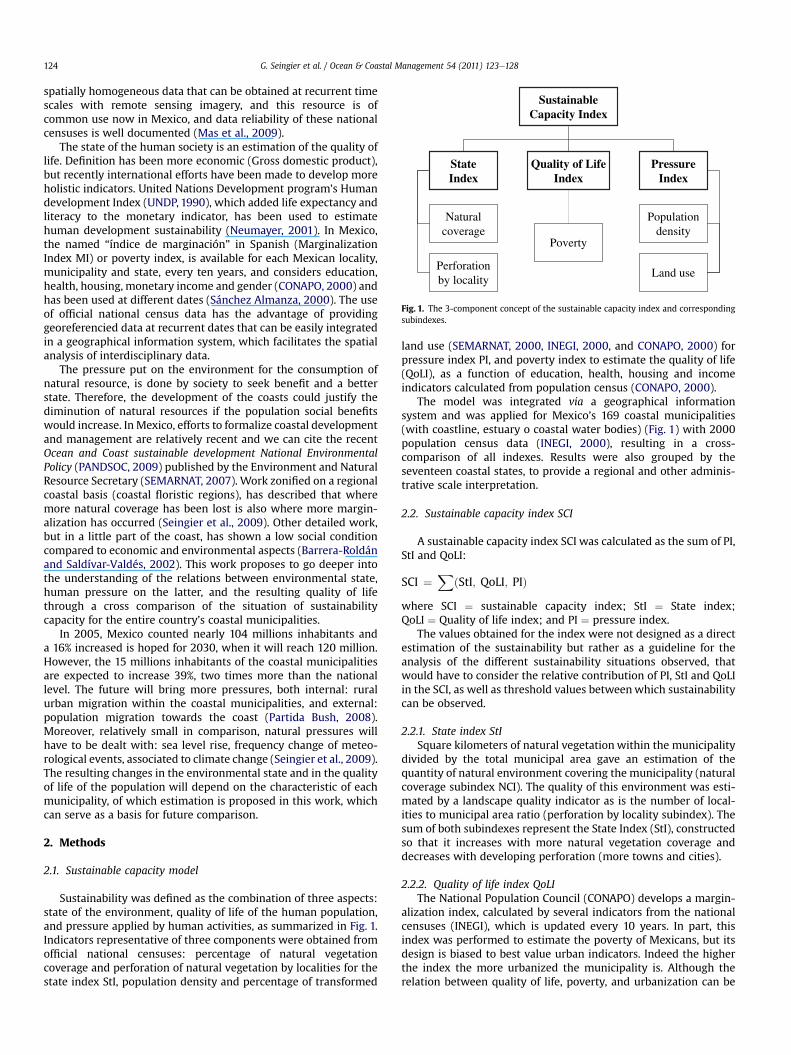
Fig. 2. Municipal sustainable capacity index grouped by the five sustainability situations.
G. Seingier et al. / Ocean & Coastal Management 54 (2011) 123e128126
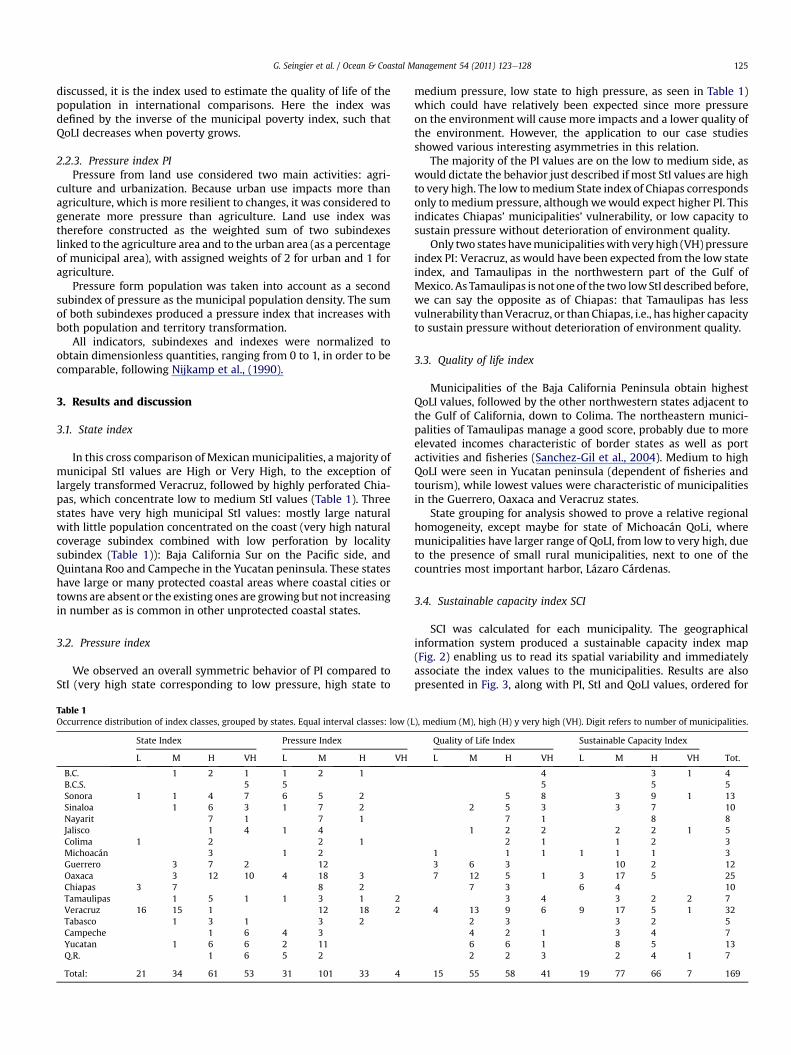
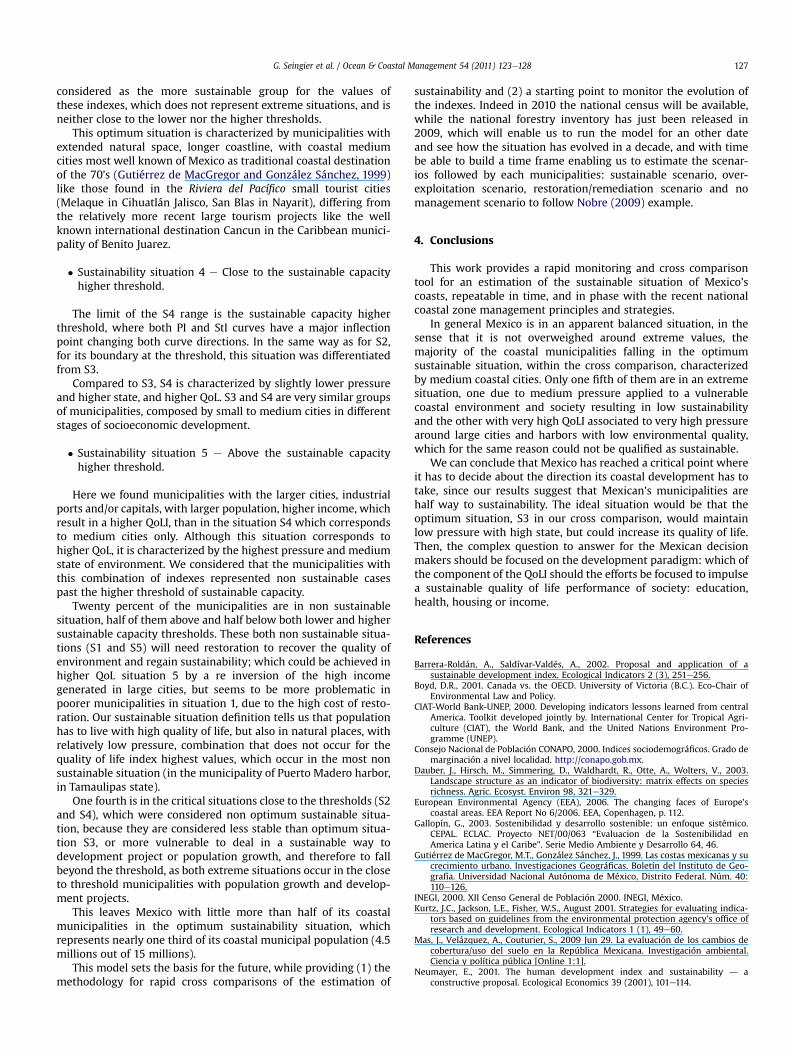
increasing SCI. The analysis of the relative behavior and combina-tions of the different indexes trend lines, corresponding to the threeaspects of our model (state, pressure, and quality of life) showsa central more regular behavior of the trend lines differing from thetwo extremes of the figure with more complex combinations.Furthermore, trend lines comparison and inflection points analysis,as well as empiric knowledge of the municipal characteristics,made possible the identification of five different municipality
STATE
PRESSURE
SUSTAINABLE
CAPACITY
QoL
0.0
0.1
0.2
0.3
0.4
0.5
0.6
0.7
0.8
0.9
1.0
1 21 41 61 81 101 121 141 161
4S2S 5S3S1S
Fig. 3. Resulting trend line of the four indexes values: StI, QoLI, PI, and SCI for the 169coastal municipalities. Ordered for increasing SCI. Arrows indicate the extent of the fivesituation ranges.
groups in terms of sustainable capacity and sustainability, asexplained in the following paragraphs.
� Sustainability situation 1 e Below the sustainable capacitylower threshold.
Municipalities located on the left part of Fig. 3 (S1 range) havethe poorest environmental state as well as very low quality of life,although with a medium pressure, reason for which they wereconsidered as not sustainable. The right boundary of this situationwas considered the lower threshold of sustainable capacity.
� Sustainability situation 2 e Close to the sustainable capacitylower threshold.
S2 range corresponds to municipalities above the lowerthreshold and thus capable of sustainability: due to their relativelyhigher state index and QoL index values than in situation S1, andlower PI. However, we differentiated this group because of itscloseness to the unsustainable situation S1.
Both S1 and S2 correspond to socio economically (and physi-cally, Seingier et al., in press) vulnerable south Pacific and south-western Gulf of Mexico zones, generally poor and very rural (Fig. 2).
� Sustainability situation 3 e Optimum situation.
Municipalities located in this situation have a high environ-mental state, a low pressure and a medium to high QoLI. It was
G. Seingier et al. / Ocean & Coastal Management 54 (2011) 123e128 127
considered as the more sustainable group for the values ofthese indexes, which does not represent extreme situations, and isneither close to the lower nor the higher thresholds.
This optimum situation is characterized by municipalities withextended natural space, longer coastline, with coastal mediumcities most well known of Mexico as traditional coastal destinationof the 70’s (Gutiérrez de MacGregor and González Sánchez, 1999)like those found in the Riviera del Pacífico small tourist cities(Melaque in Cihuatlán Jalisco, San Blas in Nayarit), differing fromthe relatively more recent large tourism projects like the wellknown international destination Cancun in the Caribbean munici-pality of Benito Juarez.
� Sustainability situation 4 e Close to the sustainable capacityhigher threshold.
The limit of the S4 range is the sustainable capacity higherthreshold, where both PI and StI curves have a major inflectionpoint changing both curve directions. In the same way as for S2,for its boundary at the threshold, this situation was differentiatedfrom S3.
Compared to S3, S4 is characterized by slightly lower pressureand higher state, and higher QoL. S3 and S4 are very similar groupsof municipalities, composed by small to medium cities in differentstages of socioeconomic development.
� Sustainability situation 5 e Above the sustainable capacityhigher threshold.
Here we found municipalities with the larger cities, industrialports and/or capitals, with larger population, higher income, whichresult in a higher QoLI, than in the situation S4 which correspondsto medium cities only. Although this situation corresponds tohigher QoL, it is characterized by the highest pressure and mediumstate of environment. We considered that the municipalities withthis combination of indexes represented non sustainable casespast the higher threshold of sustainable capacity.
Twenty percent of the municipalities are in non sustainablesituation, half of them above and half below both lower and highersustainable capacity thresholds. These both non sustainable situa-tions (S1 and S5) will need restoration to recover the quality ofenvironment and regain sustainability; which could be achieved inhigher QoL situation 5 by a re inversion of the high incomegenerated in large cities, but seems to be more problematic inpoorer municipalities in situation 1, due to the high cost of resto-ration. Our sustainable situation definition tells us that populationhas to live with high quality of life, but also in natural places, withrelatively low pressure, combination that does not occur for thequality of life index highest values, which occur in the most nonsustainable situation (in the municipality of Puerto Madero harbor,in Tamaulipas state).
One fourth is in the critical situations close to the thresholds (S2and S4), which were considered non optimum sustainable situa-tion, because they are considered less stable than optimum situa-tion S3, or more vulnerable to deal in a sustainable way todevelopment project or population growth, and therefore to fallbeyond the threshold, as both extreme situations occur in the closeto threshold municipalities with population growth and develop-ment projects.
This leaves Mexico with little more than half of its coastalmunicipalities in the optimum sustainability situation, whichrepresents nearly one third of its coastal municipal population (4.5millions out of 15 millions).
This model sets the basis for the future, while providing (1) themethodology for rapid cross comparisons of the estimation of
sustainability and (2) a starting point to monitor the evolution ofthe indexes. Indeed in 2010 the national census will be available,while the national forestry inventory has just been released in2009, which will enable us to run the model for an other dateand see how the situation has evolved in a decade, and with timebe able to build a time frame enabling us to estimate the scenar-ios followed by each municipalities: sustainable scenario, over-exploitation scenario, restoration/remediation scenario and nomanagement scenario to follow Nobre (2009) example.
4. Conclusions
This work provides a rapid monitoring and cross comparisontool for an estimation of the sustainable situation of Mexico’scoasts, repeatable in time, and in phase with the recent nationalcoastal zone management principles and strategies.
In general Mexico is in an apparent balanced situation, in thesense that it is not overweighed around extreme values, themajority of the coastal municipalities falling in the optimumsustainable situation, within the cross comparison, characterizedby medium coastal cities. Only one fifth of them are in an extremesituation, one due to medium pressure applied to a vulnerablecoastal environment and society resulting in low sustainabilityand the other with very high QoLI associated to very high pressurearound large cities and harbors with low environmental quality,which for the same reason could not be qualified as sustainable.
We can conclude that Mexico has reached a critical point whereit has to decide about the direction its coastal development has totake, since our results suggest that Mexican’s municipalities arehalf way to sustainability. The ideal situation would be that theoptimum situation, S3 in our cross comparison, would maintainlow pressure with high state, but could increase its quality of life.Then, the complex question to answer for the Mexican decisionmakers should be focused on the development paradigm: which ofthe component of the QoLI should the efforts be focused to impulsea sustainable quality of life performance of society: education,health, housing or income.
References
Barrera-Roldán, A., Saldívar-Valdés, A., 2002. Proposal and application of asustainable development index. Ecological Indicators 2 (3), 251e256.
Boyd, D.R., 2001. Canada vs. the OECD. University of Victoria (B.C.). Eco-Chair ofEnvironmental Law and Policy.
CIAT-World Bank-UNEP, 2000. Developing indicators lessons learned from centralAmerica. Toolkit developed jointly by. International Center for Tropical Agri-culture (CIAT), the World Bank, and the United Nations Environment Pro-gramme (UNEP).
Consejo Nacional de Población CONAPO, 2000. Indices sociodemográficos. Grado demarginación a nivel localidad. http://conapo.gob.mx.
Dauber, J., Hirsch, M., Simmering, D., Waldhardt, R., Otte, A., Wolters, V., 2003.Landscape structure as an indicator of biodiversity: matrix effects on speciesrichness. Agric. Ecosyst. Environ 98, 321e329.
European Environmental Agency (EEA), 2006. The changing faces of Europe’scoastal areas. EEA Report No 6/2006. EEA, Copenhagen, p. 112.
Gallopín, G., 2003. Sostenibilidad y desarrollo sostenible: un enfoque sistémico.CEPAL. ECLAC. Proyecto NET/00/063 “Evaluacion de la Sostenibilidad enAmerica Latina y el Caribe”. Serie Medio Ambiente y Desarrollo 64, 46.
Gutiérrez de MacGregor, M.T., González Sánchez, J., 1999. Las costas mexicanas y sucrecimiento urbano. Investigaciones Geográficas. Boletín del Instituto de Geo-grafía. Universidad Nacional Autónoma de México, Distrito Federal. Núm. 40:110e126.
INEGI, 2000. XII Censo General de Población 2000. INEGI, México.Kurtz, J.C., Jackson, L.E., Fisher, W.S., August 2001. Strategies for evaluating indica-
tors based on guidelines from the environmental protection agency’s office ofresearch and development. Ecological Indicators 1 (1), 49e60.
Mas, J., Velázquez, A., Couturier, S., 2009 Jun 29. La evaluación de los cambios decobertura/uso del suelo en la República Mexicana. Investigación ambiental.Ciencia y política pública [Online 1:1].
Neumayer, E., 2001. The human development index and sustainability d aconstructive proposal. Ecological Economics 39 (2001), 101e114.
G. Seingier et al. / Ocean & Coastal Management 54 (2011) 123e128128
Nijkamp, P., Rietveld, P., Voogd, H., 1990. Multicriteria evaluation in physical plan-ning. Elsevier Science LTD, The Netherlands, p. 219.
Nobre, A., 2009. An ecological and economic assessment methodology for coastalecosystem management. Environmental Management 44, 185e204.
PANDSOC, 2009. Política Ambiental Nacional par el Desarrollo Sustentable deOcéanos y Costas (PANDSOC). www.semarnat.gob.mx.
Partida Bush, V., 15 de enero de 2008. Proyecciones de la población de México, delas entidades federativas, de los municipios y de las localidades, 2005e2050(Documento Metodológico), Primera edición. Consejo Nacional de Población,ISBN 970-628-933-X.
Sánchez Almanza, A., 2000. Marginación e ingreso en los municipios de México,Análisis para la asignación de recursos fiscales, México. Instituto de Inves-tigaciones Económicas-UNAM, Miguel Ángel Porrúa, p. 278.
Sanchez-Gil, P., Yanez-Arancibia, A., Ramirez-Gordillo, J., Day, J.W., Templet, P.H.,2004. Some socio-economic indicators in the Mexican states of the Gulf ofMexico. Ocean & Coastal Management 47 (2004), 581e590.
Seingier, G., Espejel, I., Ferman, J.L., 2009. Cobertura vegetal y marginación en lacosta mexicana. Investigación ambiental. Ciencia y política pública [Online, 1:1].
Seingier, G., Espejel, I., Ferman, J.L., Delgado, O., Moreno-Casasola, P, García, A., andM.C. Arredondo-Garcia. Vulnerabilidad de las poblaciones costeras ante lapeligrosidad natural, enfoque estatal y municipal. In: Rivera Arriaga E., Villa-lobos, G., Alpuche, L., Azuz-Adeath y Ortega, A. (Eds). El Cambio Climático en
México: un enfoque costero-marino. Sección 3. Habitantes y patrimonio. Parte I.in press.
SEMARNAT, INEGI and Instituto de Geografía UNAM (2000), Inventario NacionalForestal 2000.
SEMARNAT, 2007. Estrategia Nacional para el Ordenamiento Ecológico del Territorioen Mares y Costas. Colección Legal. Semarnat, p. 33.
Tasser, E., Sternbach, E., Tappeiner, U., 2008. Biodiversity indicators for sustainabilitymonitoring at municipality level: an example of implementation in an alpineregion. Ecological Indicators 8, 204e223.
Turner, R.K., 1993. Sustainability: principles and practice. In: Kerry Turner, R. (Ed.),Sustainable nevironmental economics and management: principles and prac-tise. Belhaven Press, Londres, pp. 3e36.
UNDP, 1990. United Nations Development Programme: Human DevelopmentReport 1990. Oxford University Press, New York.
United States Environmental Protection Agency (US EPA), 2000. In: Jackson, L.E.,Kurtz, J.C., Fisher, W.S. (Eds.), Evaluation guidelines for ecological indicators.EPA/620/R-99/005. US Environmental Protection Agency, Office of Research andDevelopment, Research Triangle Park, NC.
Ward, T., Butler, E., Hill, B., 1998. Environmental indicators for national state of theenvironment reporting e Estuarios and the Sea, Australia: State of the Envi-ronment (Environmental Indicator Reports). Department of the Environment,Canberra.
Related Documents