Medical Engineering & Physics 32 (2010) 339–348 Contents lists available at ScienceDirect Medical Engineering & Physics journal homepage: www.elsevier.com/locate/medengphy Metrological characterization of a cycle-ergometer to optimize the cycling induced by functional electrical stimulation on patients with stroke Lorenzo Comolli a,∗ , Simona Ferrante b , Alessandra Pedrocchi b , Marco Bocciolone a , Giancarlo Ferrigno b , Franco Molteni c a Dipartimento di Meccanica, Politecnico di Milano, Via La Masa 1, Milano, Italy b Neuroengineering and Medical Robotics Lab, Dipartimento di Bioingegneria, Politecnico di Milano, P.zza Leonardo da Vinci 32, 20133 Milano, Italy c Valduce Hospital, Villa Beretta Rehabilitation Center, Via N. Sauro 17, Costamasnaga, LC, Italy article info Article history: Received 1 July 2009 Received in revised form 15 January 2010 Accepted 18 January 2010 Keywords: Cycle-ergometer Wireless data transmission Mechanical measurements Data analysis Rehabilitation FES cycling Hemiplegia abstract Functional electrical stimulation (FES) is a well established method in the rehabilitation of stroke patients. Indeed, a bilateral movement such as cycling induced by FES would be crucial for these patients who had an unilateral motor impairment and had to recover an equivalent use of limbs. The aim of this study was to develop a low-cost metrologically qualified cycle-ergometer, optimized for patients with stroke. A commercial ergometer was instrumented with resistive strain gauges and was able to provide the torque produced at the right and left crank, independently. The developed system was integrated with a stimulator, obtaining a novel FES cycling device able to control in real-time the movement unbalance. A dynamic calibration of the sensors was performed and a total torque uncertainty was computed. The system was tested on a healthy subject and on a stroke patient. Results demonstrated that the proposed sensors could be successfully used during FES cycling sessions where the maximum torque produced is about 9 N m, an order of magnitude less than the torque produced during voluntary cycling. This FES cycling system will assist in future investigations on stroke rehabilitation by means of FES and in new exercise regimes designed specifically for patients with unilateral impairments. © 2010 IPEM. Published by Elsevier Ltd. All rights reserved. 1. Introduction Stroke is the leading neurological cause of long-term disabil- ity [1,2]. The leg cycling task has been recently demonstrated to be a treatment able to improve significantly the recovery of the lower extremity function in neurological patients [3–6]. In partic- ular, cycling could be applied at an early stage after stroke also on patients with reduced locomotion and cognitive function. The cycling movement induced by the stimulation of the major mus- cles of the lower limbs is now becoming a spread application [7–9]. In the following this artificial movement will be named functional electrical stimulation (FES) cycling. The use of FES during cycling gives the subjects the proprioceptive afference of the task (the term afferent, carried toward the nervous system, applies to all infor- mation reaching the central nervous system from the periphery) thus enhancing the synaptic controls needed to produce a well organized movement and re-educating subjects about the exact activation sequence of the muscles in the paretic leg [10]. A previ- ous study on stroke patients showed that a rehabilitation treatment including FES cycling was more effective in increasing muscular ∗ Corresponding author. Tel.: +39 02 2399 8443. E-mail address: [email protected] (L. Comolli). strength and motor recovery of the lower limbs than standard reha- bilitation alone [11]. Because of the laterality of the pathology, the most important aim of the rehabilitation of stroke patients is the recovery of a symmetrical movement. In a previous study [11], an attempt to recreate the symmetry of the movement was carried out by giving the same stimulation strategy to both legs. Indeed, the stimulation ranges were set according to predetermined crank angular ranges so that the only difference between the ranges used for the two legs was a shift of 180 ◦ with respect to the crank angle. The major limitation of the previous study was that only the total torque provided by both legs at the crank (the total torque) was measured. This crank total torque shows the summed up effect of the forces produced by the muscle contractions of both legs and, therefore, it cannot be used to distinguish the contribution pro- vided by the impaired and healthy leg. Indeed, the total torque provided during the pushing phase of the right leg can be pro- duced by the contraction of the right quadriceps, but also by the contraction of the left hamstrings. Using the crank total torque, the unbalance between the right and left leg is computed com- paring the mean value of the crank total torque obtained in each semi-revolution. Therefore, this pedalling unbalance could be quite accurate on able-bodied subjects which are characterized by a symmetric use of the legs during the task. Instead, in asymmetric patients one of the legs may offer a relevant resistance during the 1350-4533/$ – see front matter © 2010 IPEM. Published by Elsevier Ltd. All rights reserved. doi:10.1016/j.medengphy.2010.01.005

Welcome message from author
This document is posted to help you gain knowledge. Please leave a comment to let me know what you think about it! Share it to your friends and learn new things together.
Transcript

Mi
LGa
b
c
a
ARRA
KCWMDRFH
1
ibluoccIegamtoaoi
1d
Medical Engineering & Physics 32 (2010) 339–348
Contents lists available at ScienceDirect
Medical Engineering & Physics
journa l homepage: www.e lsev ier .com/ locate /medengphy
etrological characterization of a cycle-ergometer to optimize the cyclingnduced by functional electrical stimulation on patients with stroke
orenzo Comolli a,∗, Simona Ferranteb, Alessandra Pedrocchib, Marco Bocciolonea,iancarlo Ferrignob, Franco Moltenic
Dipartimento di Meccanica, Politecnico di Milano, Via La Masa 1, Milano, ItalyNeuroengineering and Medical Robotics Lab, Dipartimento di Bioingegneria, Politecnico di Milano, P.zza Leonardo da Vinci 32, 20133 Milano, ItalyValduce Hospital, Villa Beretta Rehabilitation Center, Via N. Sauro 17, Costamasnaga, LC, Italy
r t i c l e i n f o
rticle history:eceived 1 July 2009eceived in revised form 15 January 2010ccepted 18 January 2010
eywords:ycle-ergometer
a b s t r a c t
Functional electrical stimulation (FES) is a well established method in the rehabilitation of stroke patients.Indeed, a bilateral movement such as cycling induced by FES would be crucial for these patients who hadan unilateral motor impairment and had to recover an equivalent use of limbs. The aim of this studywas to develop a low-cost metrologically qualified cycle-ergometer, optimized for patients with stroke.A commercial ergometer was instrumented with resistive strain gauges and was able to provide thetorque produced at the right and left crank, independently. The developed system was integrated witha stimulator, obtaining a novel FES cycling device able to control in real-time the movement unbalance.
ireless data transmissionechanical measurementsata analysisehabilitationES cyclingemiplegia
A dynamic calibration of the sensors was performed and a total torque uncertainty was computed. Thesystem was tested on a healthy subject and on a stroke patient. Results demonstrated that the proposedsensors could be successfully used during FES cycling sessions where the maximum torque producedis about 9 N m, an order of magnitude less than the torque produced during voluntary cycling. This FEScycling system will assist in future investigations on stroke rehabilitation by means of FES and in new
d spe
exercise regimes designe. Introduction
Stroke is the leading neurological cause of long-term disabil-ty [1,2]. The leg cycling task has been recently demonstrated toe a treatment able to improve significantly the recovery of the
ower extremity function in neurological patients [3–6]. In partic-lar, cycling could be applied at an early stage after stroke alson patients with reduced locomotion and cognitive function. Theycling movement induced by the stimulation of the major mus-les of the lower limbs is now becoming a spread application [7–9].n the following this artificial movement will be named functionallectrical stimulation (FES) cycling. The use of FES during cyclingives the subjects the proprioceptive afference of the task (the termfferent, carried toward the nervous system, applies to all infor-ation reaching the central nervous system from the periphery)
hus enhancing the synaptic controls needed to produce a well
rganized movement and re-educating subjects about the exactctivation sequence of the muscles in the paretic leg [10]. A previ-us study on stroke patients showed that a rehabilitation treatmentncluding FES cycling was more effective in increasing muscular∗ Corresponding author. Tel.: +39 02 2399 8443.E-mail address: [email protected] (L. Comolli).
350-4533/$ – see front matter © 2010 IPEM. Published by Elsevier Ltd. All rights reserveoi:10.1016/j.medengphy.2010.01.005
cifically for patients with unilateral impairments.© 2010 IPEM. Published by Elsevier Ltd. All rights reserved.
strength and motor recovery of the lower limbs than standard reha-bilitation alone [11]. Because of the laterality of the pathology, themost important aim of the rehabilitation of stroke patients is therecovery of a symmetrical movement. In a previous study [11], anattempt to recreate the symmetry of the movement was carriedout by giving the same stimulation strategy to both legs. Indeed,the stimulation ranges were set according to predetermined crankangular ranges so that the only difference between the ranges usedfor the two legs was a shift of 180◦ with respect to the crank angle.The major limitation of the previous study was that only the totaltorque provided by both legs at the crank (the total torque) wasmeasured. This crank total torque shows the summed up effect ofthe forces produced by the muscle contractions of both legs and,therefore, it cannot be used to distinguish the contribution pro-vided by the impaired and healthy leg. Indeed, the total torqueprovided during the pushing phase of the right leg can be pro-duced by the contraction of the right quadriceps, but also by thecontraction of the left hamstrings. Using the crank total torque,the unbalance between the right and left leg is computed com-
paring the mean value of the crank total torque obtained in eachsemi-revolution. Therefore, this pedalling unbalance could be quiteaccurate on able-bodied subjects which are characterized by asymmetric use of the legs during the task. Instead, in asymmetricpatients one of the legs may offer a relevant resistance during thed.
340 L. Comolli et al. / Medical Engineering & Physics 32 (2010) 339–348
corn
ml
aoatimsIwuiaatmb
scfc
2
2
ibt
cdmutrtla
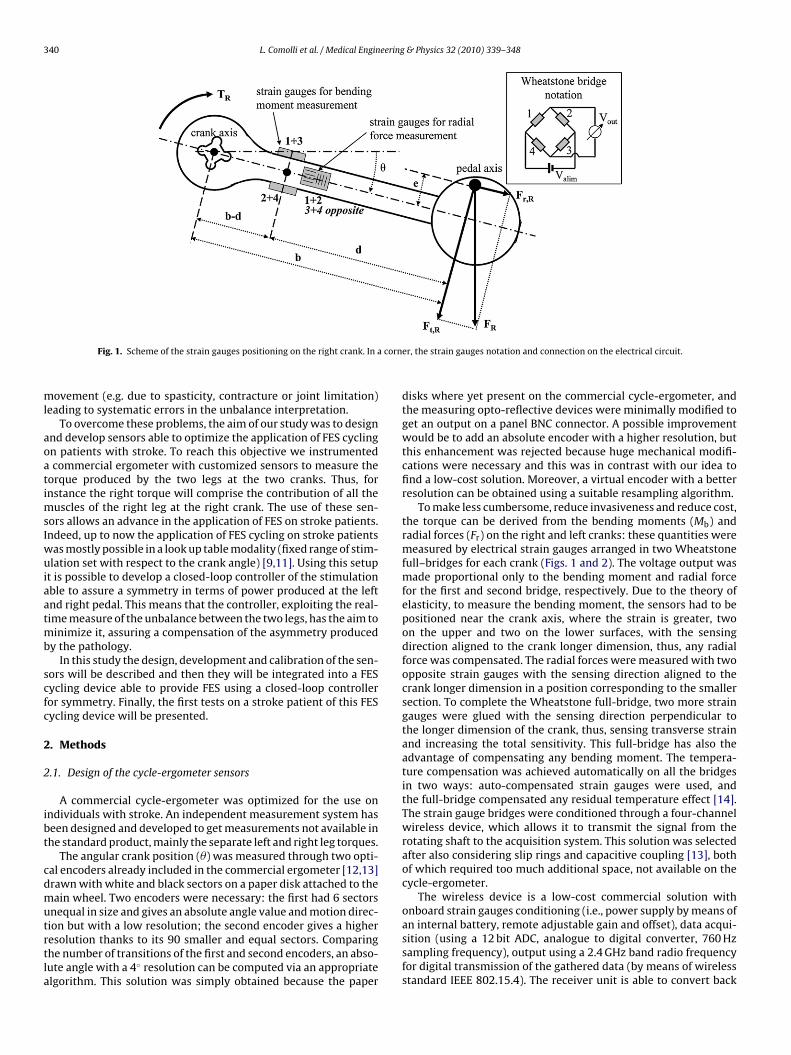
Fig. 1. Scheme of the strain gauges positioning on the right crank. In a
ovement (e.g. due to spasticity, contracture or joint limitation)eading to systematic errors in the unbalance interpretation.
To overcome these problems, the aim of our study was to designnd develop sensors able to optimize the application of FES cyclingn patients with stroke. To reach this objective we instrumentedcommercial ergometer with customized sensors to measure the
orque produced by the two legs at the two cranks. Thus, fornstance the right torque will comprise the contribution of all the
uscles of the right leg at the right crank. The use of these sen-ors allows an advance in the application of FES on stroke patients.ndeed, up to now the application of FES cycling on stroke patients
as mostly possible in a look up table modality (fixed range of stim-lation set with respect to the crank angle) [9,11]. Using this setup
t is possible to develop a closed-loop controller of the stimulationble to assure a symmetry in terms of power produced at the leftnd right pedal. This means that the controller, exploiting the real-ime measure of the unbalance between the two legs, has the aim to
inimize it, assuring a compensation of the asymmetry producedy the pathology.
In this study the design, development and calibration of the sen-ors will be described and then they will be integrated into a FESycling device able to provide FES using a closed-loop controlleror symmetry. Finally, the first tests on a stroke patient of this FESycling device will be presented.
. Methods
.1. Design of the cycle-ergometer sensors
A commercial cycle-ergometer was optimized for the use onndividuals with stroke. An independent measurement system haseen designed and developed to get measurements not available inhe standard product, mainly the separate left and right leg torques.
The angular crank position (�) was measured through two opti-al encoders already included in the commercial ergometer [12,13]rawn with white and black sectors on a paper disk attached to theain wheel. Two encoders were necessary: the first had 6 sectors
nequal in size and gives an absolute angle value and motion direc-
ion but with a low resolution; the second encoder gives a higheresolution thanks to its 90 smaller and equal sectors. Comparinghe number of transitions of the first and second encoders, an abso-ute angle with a 4◦ resolution can be computed via an appropriatelgorithm. This solution was simply obtained because the paperer, the strain gauges notation and connection on the electrical circuit.
disks where yet present on the commercial cycle-ergometer, andthe measuring opto-reflective devices were minimally modified toget an output on a panel BNC connector. A possible improvementwould be to add an absolute encoder with a higher resolution, butthis enhancement was rejected because huge mechanical modifi-cations were necessary and this was in contrast with our idea tofind a low-cost solution. Moreover, a virtual encoder with a betterresolution can be obtained using a suitable resampling algorithm.
To make less cumbersome, reduce invasiveness and reduce cost,the torque can be derived from the bending moments (Mb) andradial forces (Fr) on the right and left cranks: these quantities weremeasured by electrical strain gauges arranged in two Wheatstonefull–bridges for each crank (Figs. 1 and 2). The voltage output wasmade proportional only to the bending moment and radial forcefor the first and second bridge, respectively. Due to the theory ofelasticity, to measure the bending moment, the sensors had to bepositioned near the crank axis, where the strain is greater, twoon the upper and two on the lower surfaces, with the sensingdirection aligned to the crank longer dimension, thus, any radialforce was compensated. The radial forces were measured with twoopposite strain gauges with the sensing direction aligned to thecrank longer dimension in a position corresponding to the smallersection. To complete the Wheatstone full-bridge, two more straingauges were glued with the sensing direction perpendicular tothe longer dimension of the crank, thus, sensing transverse strainand increasing the total sensitivity. This full-bridge has also theadvantage of compensating any bending moment. The tempera-ture compensation was achieved automatically on all the bridgesin two ways: auto-compensated strain gauges were used, andthe full-bridge compensated any residual temperature effect [14].The strain gauge bridges were conditioned through a four-channelwireless device, which allows it to transmit the signal from therotating shaft to the acquisition system. This solution was selectedafter also considering slip rings and capacitive coupling [13], bothof which required too much additional space, not available on thecycle-ergometer.
The wireless device is a low-cost commercial solution withonboard strain gauges conditioning (i.e., power supply by means of
an internal battery, remote adjustable gain and offset), data acqui-sition (using a 12 bit ADC, analogue to digital converter, 760 Hzsampling frequency), output using a 2.4 GHz band radio frequencyfor digital transmission of the gathered data (by means of wirelessstandard IEEE 802.15.4). The receiver unit is able to convert back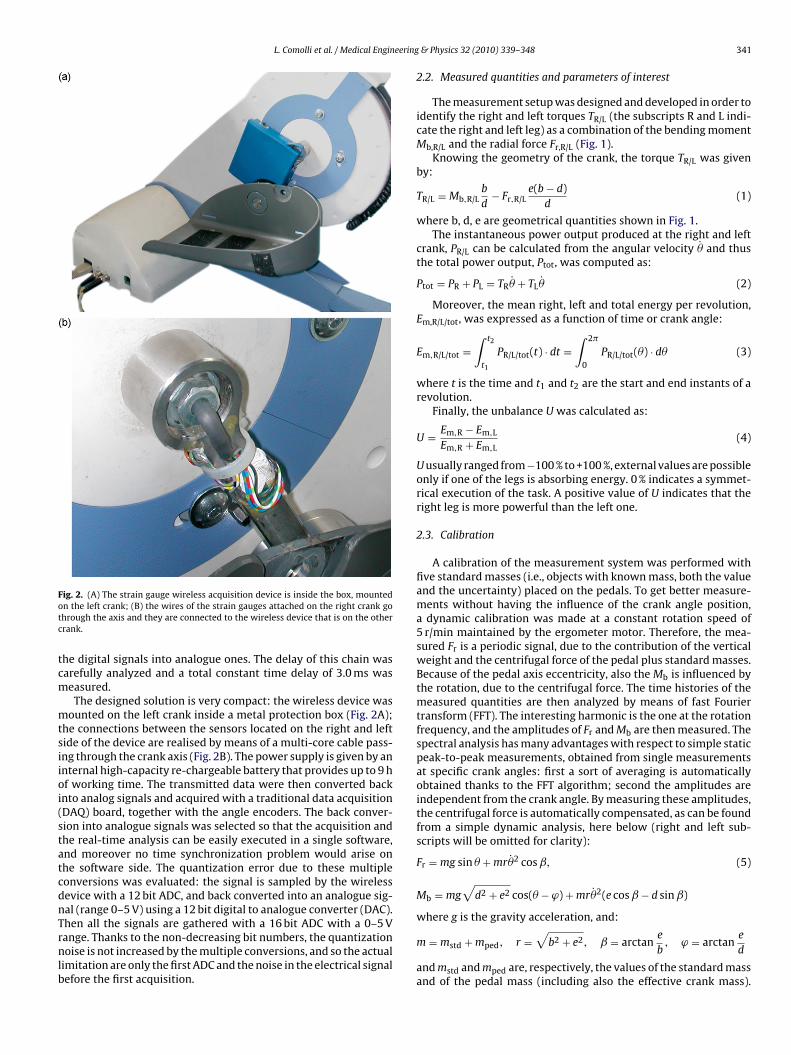
L. Comolli et al. / Medical Engineering
Fotc
tcm
mtsiioi(statcdnTrnlb
ig. 2. (A) The strain gauge wireless acquisition device is inside the box, mountedn the left crank; (B) the wires of the strain gauges attached on the right crank gohrough the axis and they are connected to the wireless device that is on the otherrank.
he digital signals into analogue ones. The delay of this chain wasarefully analyzed and a total constant time delay of 3.0 ms waseasured.The designed solution is very compact: the wireless device was
ounted on the left crank inside a metal protection box (Fig. 2A);he connections between the sensors located on the right and leftide of the device are realised by means of a multi-core cable pass-ng through the crank axis (Fig. 2B). The power supply is given by annternal high-capacity re-chargeable battery that provides up to 9 hf working time. The transmitted data were then converted backnto analog signals and acquired with a traditional data acquisitionDAQ) board, together with the angle encoders. The back conver-ion into analogue signals was selected so that the acquisition andhe real-time analysis can be easily executed in a single software,nd moreover no time synchronization problem would arise onhe software side. The quantization error due to these multipleonversions was evaluated: the signal is sampled by the wirelessevice with a 12 bit ADC, and back converted into an analogue sig-al (range 0–5 V) using a 12 bit digital to analogue converter (DAC).
hen all the signals are gathered with a 16 bit ADC with a 0–5 Vange. Thanks to the non-decreasing bit numbers, the quantizationoise is not increased by the multiple conversions, and so the actualimitation are only the first ADC and the noise in the electrical signalefore the first acquisition.
& Physics 32 (2010) 339–348 341
2.2. Measured quantities and parameters of interest
The measurement setup was designed and developed in order toidentify the right and left torques TR/L (the subscripts R and L indi-cate the right and left leg) as a combination of the bending momentMb,R/L and the radial force Fr,R/L (Fig. 1).
Knowing the geometry of the crank, the torque TR/L was givenby:
TR/L = Mb,R/Lb
d− Fr,R/L
e(b − d)d
(1)
where b, d, e are geometrical quantities shown in Fig. 1.The instantaneous power output produced at the right and left
crank, PR/L can be calculated from the angular velocity �̇ and thusthe total power output, Ptot, was computed as:
Ptot = PR + PL = TR�̇ + TL�̇ (2)
Moreover, the mean right, left and total energy per revolution,Em,R/L/tot, was expressed as a function of time or crank angle:
Em,R/L/tot =∫ t2
t1
PR/L/tot(t) · dt =∫ 2�
0
PR/L/tot(�) · d� (3)
where t is the time and t1 and t2 are the start and end instants of arevolution.
Finally, the unbalance U was calculated as:
U = Em,R − Em,L
Em,R + Em,L(4)
U usually ranged from−100 % to +100 %, external values are possibleonly if one of the legs is absorbing energy. 0 % indicates a symmet-rical execution of the task. A positive value of U indicates that theright leg is more powerful than the left one.
2.3. Calibration
A calibration of the measurement system was performed withfive standard masses (i.e., objects with known mass, both the valueand the uncertainty) placed on the pedals. To get better measure-ments without having the influence of the crank angle position,a dynamic calibration was made at a constant rotation speed of5 r/min maintained by the ergometer motor. Therefore, the mea-sured Fr is a periodic signal, due to the contribution of the verticalweight and the centrifugal force of the pedal plus standard masses.Because of the pedal axis eccentricity, also the Mb is influenced bythe rotation, due to the centrifugal force. The time histories of themeasured quantities are then analyzed by means of fast Fouriertransform (FFT). The interesting harmonic is the one at the rotationfrequency, and the amplitudes of Fr and Mb are then measured. Thespectral analysis has many advantages with respect to simple staticpeak-to-peak measurements, obtained from single measurementsat specific crank angles: first a sort of averaging is automaticallyobtained thanks to the FFT algorithm; second the amplitudes areindependent from the crank angle. By measuring these amplitudes,the centrifugal force is automatically compensated, as can be foundfrom a simple dynamic analysis, here below (right and left sub-scripts will be omitted for clarity):
Fr = mg sin � + mr�̇2 cos ˇ, (5)
Mb = mg√
d2 + e2 cos(� − ϕ) + mr�̇2(e cos ˇ − d sin ˇ)
where g is the gravity acceleration, and:
m = mstd + mped, r =√
b2 + e2, ˇ = arctane
b, ϕ = arctan
e
d
and mstd and mped are, respectively, the values of the standard massand of the pedal mass (including also the effective crank mass).

342 L. Comolli et al. / Medical Engineering & Physics 32 (2010) 339–348
Wi
oob(s
iamsaf
m
Table 1Calibration results.
Quantity Value
Right Left
encoders) was connected to a PC running Linux. A real-time solu-
Fig. 3. Calibration charts for the bending moments (A) and radial forces (B).
ith a constant speed rotation the only variable quantity in Eq. (5)s the angle �, and the amplitude of the above signals are:
Fr,amp = mg = mstdg + mpedg = Fr,amp,std + Fr,amp,ped,
Mb,amp = mg√
d2 + e2 = mstdg√
d2 + e2 + mpedg√
d2 + e2
= Mb,amp,std + Mb,amp,ped (6)
The amplitudes of the output voltage signals are proportionalnly to these reference quantities, and a calibration chart can bebtained. But the input quantity in the charts (Fig. 3A and B) cannote directly Fr,amp and Mb,amp because the pedal masses are unknowneven if they can be measured by dismounting the parts), so theelected input quantities are Fr,amp,std and Mb,amp,std.
An inspection of the graphs shows that the linear least squarenterpolations intersect the zero output level with non-zero (neg-tive) values of Fr,amp,std and Mb,amp,std: this is due to the pedalasses that can be evaluated measuring the interpolation inter-
ection with the zero output level, giving the values of −Fr,amp,pednd −Mb,amp,ped. The pedal mass mped can be found independently
rom these two:ped,Fr = Fr,amp,ped
g, mped,Mb = Mb,amp+ped
g√
d2 + e2(7)
Sensitivity of radial force [mV/N] 0.68 1.16Pedal mass [kg] (from radial force) 2.25 2.34Sensitivity of bending moment [mV/(N m)] 45.7 48.1Pedal mass [kg] (from bending moment) 2.26 2.36
The two quantities obviously should be compatible (for a def-inition of compatibility of measurement results, see Ref. [15]). Acrosstalk evaluation of the 4 channels was carried out, even if acalibration matrix was impossible to measure due to the physicalsystem limitations. However, some of the mechanical and all ofthe electrical crosstalks were evaluated and their contribution wasfound to be negligible, in the order of less than 0.1 %. The resultsfrom the interpolation of the bending moment and radial forcecalibration charts are reported in Table 1.
The mass of the left pedal was found to be greater than the rightone by about 0.1 kg, that is nearly the mass of the wireless device,positioned on the left crank. The use of five standard masses hadtwo main advantages respect to using only one: first, it improvesthe accuracy of the sensitivity value through a linear interpolation,and, second, it verifies the linearity of the measurement system.
According to Ref. [16], an evaluation of the uncertainty of themeasured torque was performed. First the calibration uncertaintyof the bending moment and radial forces was analyzed and iden-tified. The calibration uncertainty of each quantity can be foundas a contribution of the standard error of the interpolation and theuncertainty of the reference. The standard error of the interpolation(i.e., the standard deviation of the residuals, alias the differencesbetween the measured and computed points) was found to be0.015 N m and 2.2 N, respectively, for bending moment and radialforces. The uncertainty of the reference depends in both cases onthe uncertainty of the standard masses used in the calibration, thatis 0.010 kg, giving an uncertainty of 0.0086 N m and 0.098 N. Thecombined calibration uncertainty can be found by a quadratic sumof the two components, and gave a result of 0.017 N m and 2.2 N,respectively, for bending moment uMf and radial force uFr uncer-tainties.
A second step was to compute the combined uncertainty of thetorque, as the contribution of the bending moment and radial forcesuncertainties. Considering Eq. (1), the combined uncertainty of thetorque uT can be computed as:
uT =√(
b
duMf
)2
+(
e(b − d)d
uFr
)2
(8)
that gives a result of 0.023 N m, a value that is very small comparedto the torque usual values: previous tests on stroke patients found amaximum torque of about 9 N m, on average [17]. Considering thisas a reference value, a relative torque uncertainty can be found,with a value of 0.3 %. This is good for the biomedical purposes ofthe measurements.
2.4. The FES cycling acquisition and control system
The instrumented cycle-ergometer was included in the proto-type setup of a FES cycling device, as it is shown in Fig. 4. TheDAQ board used to acquire the signals from all the transducersof the cycle-ergometer (wireless strain gauges devices and shaft
tion specifically developed for Matlab/Simulink was adopted toacquire data and to control the stimulation device. The actual acqui-sition delay of all the channels was evaluated and is due to tworeasons: the DAQ and wireless device. The DAQ samplings of our

L. Comolli et al. / Medical Engineering & Physics 32 (2010) 339–348 343
bcssseapblv
n(p1tbdctfipi
ccmssitcm1gTriamlb
defines e = 0 and e = T − T . Therefore, the controller increases
Fig. 4. The complete experimental setup.
oard are not exactly simultaneous, as the time delay between eachhannel is 1 �s, totalling 5 �s from the first to the last nominallyynchronous sample. As explained in Section 2.1, the bigger delayource is due to the wireless device (constant delay of 3 ms). Theignals from the angle encoders are not delayed and so a phase shiftrror could arise: considering that the ergometer allows a goodnd reliable working in the speed range 5–50 r/min, the maximumhase shift is 0.9◦ at 50 r/min (i.e., the maximum properly allowedy the ergometer). This delay is very small compared with the angu-
ar resolution of 4◦ and thus, it can be neglected or compensatedia a suitable software algorithm.
The PC was connected via USB to a current–controlled 8 chan-el stimulator. This stimulator possesses two independent modulesnamed A and B in the following) which are multiplexed to 4 out-ut each. The stimulation module A hosts the stimulation channels–4, stimulation module B hosts the channels 5–8. Pulse generationakes place on the selected channels, ordered by the channel num-ers. Between each channel of the same module there is a timeelay of 1.5 ms. The stimulation modules A and B processes thehannel list in parallel with a time offset of 0.6 ms [18]. This meanshat when all the 8 channels are used, the time delay between therst and the eighth channel is 6.6 ms. This delay corresponds tohase shift of 2◦ in the worst case that is when a speed of 50 r/min
s used.The stimulation controller is shown in Fig. 5. The stimulation
ontroller used a stimulation frequency of 20 Hz for all the mus-les (fstim) and a stimulation amplitude set individually on eachuscle (I1.8) and maintained constant during the whole trial. The
timulation controller compares crank position in real-time toome predetermined angle ranges (activation ranges check blockn Fig. 5). Indeed, the activation range check block in Fig. 5 showshe crank angular ranges used for the muscle groups of the left legonsidering that the zero angle corresponds to the position of maxi-um flexion of the left hip; the ranges for the right leg are shifted of
80◦. Thus, the stimulation controller chose the appropriate muscleroups to be stimulated sequentially and in antiphase bilaterally.he muscles involved are the quadriceps, hamstrings, tibialis ante-ior and gluteus maximus. We chose to stimulate 8 muscle groupsn order to provide the patient with a more complete proprioceptive
fference of the task trying to re-educate them to produce the wholeotor strategy during cycling. In particular, the muscle choice fol-owed a previous work [11] in which the stimulation strategy wasased on the physiological strategy used by healthy subjects dur-
Fig. 5. The stimulation controller implemented in Matlab/Simulink on a PC runningLinux. The schematic of the activation ranges of the stimulated muscle groups of theleft leg are reported in the activation range check block. 0◦ is defined where the lefthip is maximally flexed.
ing voluntary pedalling together with functional tests performedon patients with spinal cord injury; starting from this biomimeticstimulation strategy the stimulation of the gastrocnemius medi-alis was substituted with the tibialis anterior in order to achieve abetter rehabilitation against the problem of drop foot.
To compensate for the dynamic response of the muscle (i.e., thetime taken for maximal force to be produced following onset ofstimulation), the stimulation patterns have to be shifted forwardin time as cycle cadence increases. According to values alreadypresent in literature, a constant time delay of about 130 ms for allthe muscles was chosen [7]. This corresponded to a shift of about16◦ for a cadence of 20 r/min. The output of the activation rangesblock was a vector of 8 elements which are 1 or 0 if the muscle hasor has not to be stimulated in correspondence to that crank angle.
The stimulation pulse width was changed once per revolution bya stimulation controller in order to assure symmetry in pedalling.The structure of the developed symmetry controller is shown inFig. 5 (symmetry controller block). It includes two parallel branchesin order to control two systems at the same time: the left and rightleg. The inputs (control signals) of the two systems are the val-ues of PW used to stimulate the selected muscles of the left (PWL)and right (PWR) leg; while the outputs (controlled signals) are thetorques, TR and TL, produced at the right and left cranks, respec-tively. In each revolution the mean value of TL and TR are comparedin order to define the reference signal and, consequently, to obtainthe two error signals, eL and eR. Then, each error signal enters ina pure integral controller (IC), as shown in Fig. 5. Thus, both con-trollers depend only on the integral gain (KC), as shown in Eq. (9):
PWi(k) = PWi(k − 1) + KC × ei(k), with i = R, L. (9)
Each revolution only one error signal is different from zero, thus,each revolution the PW of one leg changes and the other maintainsthe value of the previous revolution. For instance, if the right legis the weaker leg (TR < TL) and PWR < PWRmax then the controller
L R L RPWR and PWL is maintained at the value of the previous revolu-tion. Otherwise, if (TR < TL) but PWR = PWRmax then the controllerdefines eR = 0 and eL = TR − TL and the PW of the stronger leg (PWL)is decreased. The behaviour is dual when TL < TR. KC is set at the
3 eering & Physics 32 (2010) 339–348
sspbtt(
2
ipjR
2
appmtw(asa
2
ct
Table 2Current amplitude used by all the 8 muscles of the stroke patient during protocol 2.The left leg was the impaired one.
Muscle Current amplitude [mA]
Right leg Left leg
Quadriceps 50 50
Fa
44 L. Comolli et al. / Medical Engin
ame value for both controllers (30 �s/N). This value assured thetability of the closed-loop system according to a stability analysiserformed in simulation [19]. Then, the stimulation PW is obtainedy the product of the output of the symmetry controller block andhe activation ranges check block (Fig. 5) and sent to the stimulatorogether with the stimulation current intensity (I1.8) and frequencyfstim).
.5. Experimental protocol
The complete setup was used to carry out two different exper-mental sessions, one on a healthy subject and one on a strokeatient. Written informed consent was obtained from both the sub-
ects. The study was approved by the Ethical Board of Villa Berettaehabilitation Centre.
.5.1. Protocol 1: voluntary pedallingFirst, the developed system was tested during voluntary ped-
lling of a healthy subject. The protocol required the subject toerform one trial lasting 2 min. In the first 30 s, the subject cycledassively which means that the limbs were moved solely by theotor at a constant speed of 25 r/min; then the subject performed
hree periods 30 s long in which he was asked to pedal pushing onlyith the right leg (from 30 to 60 s), pushing only with the left leg
from 60 to 90 s) and pushing with both legs (from 90 to 120 s). Inll the active phases the cycling cadence was self selected by theubject and the torsional resistance was set at the highest valuellowed by the ergometer (i.e., level 15, corresponding to 0.1 N m).
.5.2. Protocol 2: FES cycling on a patient with strokeBefore using the experimental setup on stroke patients, the
ycle-ergometer was equipped with two ankle foot orthoses fixedo the pedals and used to stabilize the legs and to constrain the
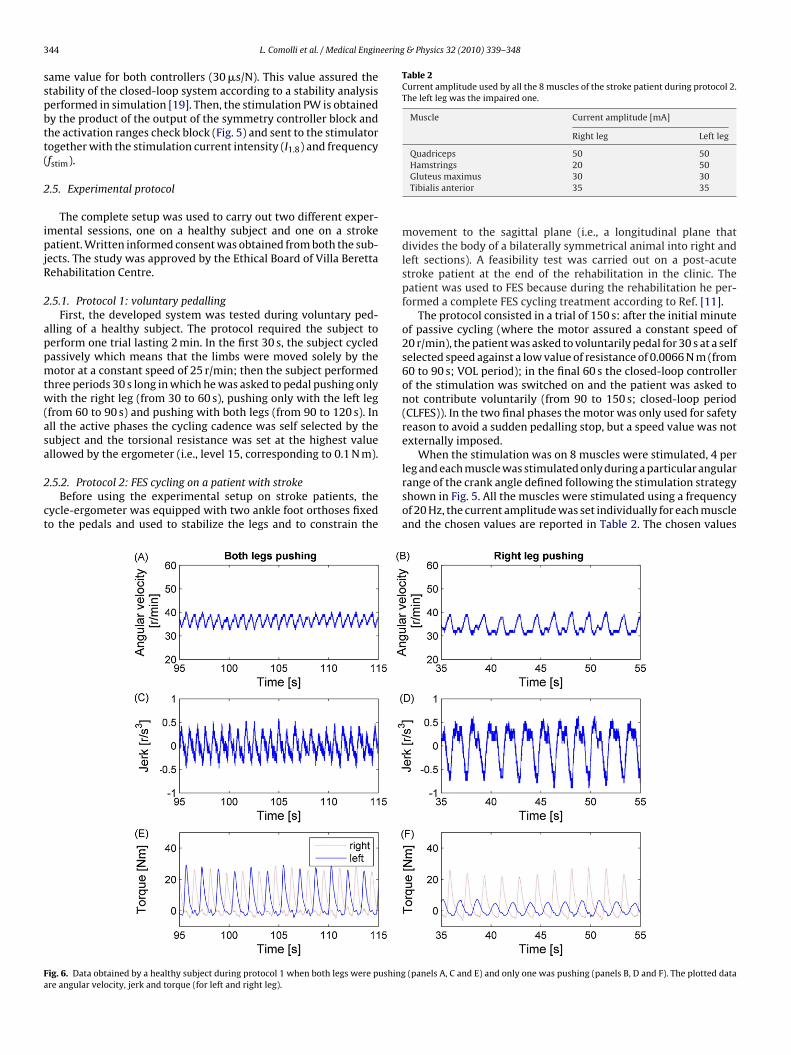
ig. 6. Data obtained by a healthy subject during protocol 1 when both legs were pushingre angular velocity, jerk and torque (for left and right leg).
Hamstrings 20 50Gluteus maximus 30 30Tibialis anterior 35 35
movement to the sagittal plane (i.e., a longitudinal plane thatdivides the body of a bilaterally symmetrical animal into right andleft sections). A feasibility test was carried out on a post-acutestroke patient at the end of the rehabilitation in the clinic. Thepatient was used to FES because during the rehabilitation he per-formed a complete FES cycling treatment according to Ref. [11].
The protocol consisted in a trial of 150 s: after the initial minuteof passive cycling (where the motor assured a constant speed of20 r/min), the patient was asked to voluntarily pedal for 30 s at a selfselected speed against a low value of resistance of 0.0066 N m (from60 to 90 s; VOL period); in the final 60 s the closed-loop controllerof the stimulation was switched on and the patient was asked tonot contribute voluntarily (from 90 to 150 s; closed-loop period(CLFES)). In the two final phases the motor was only used for safetyreason to avoid a sudden pedalling stop, but a speed value was notexternally imposed.
When the stimulation was on 8 muscles were stimulated, 4 perleg and each muscle was stimulated only during a particular angular
range of the crank angle defined following the stimulation strategyshown in Fig. 5. All the muscles were stimulated using a frequencyof 20 Hz, the current amplitude was set individually for each muscleand the chosen values are reported in Table 2. The chosen values(panels A, C and E) and only one was pushing (panels B, D and F). The plotted data
L. Comolli et al. / Medical Engineering & Physics 32 (2010) 339–348 345
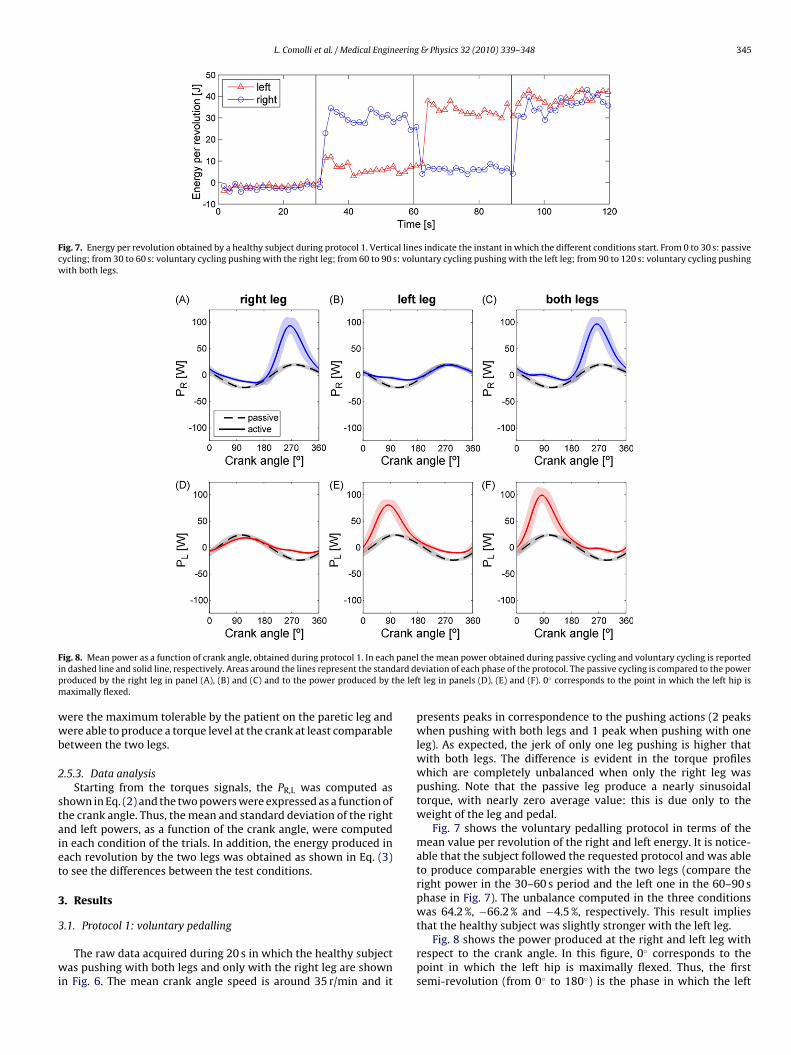
Fig. 7. Energy per revolution obtained by a healthy subject during protocol 1. Vertical lines indicate the instant in which the different conditions start. From 0 to 30 s: passivecycling; from 30 to 60 s: voluntary cycling pushing with the right leg; from 60 to 90 s: voluntary cycling pushing with the left leg; from 90 to 120 s: voluntary cycling pushingwith both legs.
F paneli ard dp he lefm
wwb
2
staiet
3
3
wi
ig. 8. Mean power as a function of crank angle, obtained during protocol 1. In eachn dashed line and solid line, respectively. Areas around the lines represent the standroduced by the right leg in panel (A), (B) and (C) and to the power produced by taximally flexed.
ere the maximum tolerable by the patient on the paretic leg andere able to produce a torque level at the crank at least comparable
etween the two legs.
.5.3. Data analysisStarting from the torques signals, the PR,L was computed as
hown in Eq. (2) and the two powers were expressed as a function ofhe crank angle. Thus, the mean and standard deviation of the rightnd left powers, as a function of the crank angle, were computedn each condition of the trials. In addition, the energy produced inach revolution by the two legs was obtained as shown in Eq. (3)o see the differences between the test conditions.
. Results
.1. Protocol 1: voluntary pedalling
The raw data acquired during 20 s in which the healthy subjectas pushing with both legs and only with the right leg are shown
n Fig. 6. The mean crank angle speed is around 35 r/min and it
the mean power obtained during passive cycling and voluntary cycling is reportedeviation of each phase of the protocol. The passive cycling is compared to the powert leg in panels (D), (E) and (F). 0◦ corresponds to the point in which the left hip is
presents peaks in correspondence to the pushing actions (2 peakswhen pushing with both legs and 1 peak when pushing with oneleg). As expected, the jerk of only one leg pushing is higher thatwith both legs. The difference is evident in the torque profileswhich are completely unbalanced when only the right leg waspushing. Note that the passive leg produce a nearly sinusoidaltorque, with nearly zero average value: this is due only to theweight of the leg and pedal.
Fig. 7 shows the voluntary pedalling protocol in terms of themean value per revolution of the right and left energy. It is notice-able that the subject followed the requested protocol and was ableto produce comparable energies with the two legs (compare theright power in the 30–60 s period and the left one in the 60–90 sphase in Fig. 7). The unbalance computed in the three conditionswas 64.2 %, −66.2 % and −4.5 %, respectively. This result implies
that the healthy subject was slightly stronger with the left leg.Fig. 8 shows the power produced at the right and left leg withrespect to the crank angle. In this figure, 0◦ corresponds to thepoint in which the left hip is maximally flexed. Thus, the firstsemi-revolution (from 0◦ to 180◦) is the phase in which the left

346 L. Comolli et al. / Medical Engineering & Physics 32 (2010) 339–348
F g condd
lpcltlqsbsp
3
ptcooiV
Fc
ig. 9. Data obtained by a stroke patient during protocol 2, in three different cyclinata are angular velocity, jerk and torque (for impaired and healthy leg).
eg is pushing forward. This figure shows that the most importantositive contribution to the task was produced by the quadricepsontraction which is used mostly to extend the knee. When theeft leg was pushing (Fig. 8B and E) it is noteworthy to observehat a significant positive peak of power was produced by theeft leg during the first half of the revolution, i.e., when the leftuadriceps was pushing (Fig. 8E). Correspondingly there was alight positive contribution also on the right leg (Fig. 8B). The sameehaviour is observable also comparing Fig. 8A and D in the secondemi-revolution and also in both the semi-revolutions in the trialserformed pushing with both legs (Fig. 8C and F).
.2. Protocol 2: FES cycling on a patient with stroke
Fig. 9 shows the raw data acquired on the stroke patients duringrotocol 2. Data are referred to 20 s of each different period of therial. The mean angular velocity was about 20 r/min during passive
ycling and increases to about 25 r/min during the other two peri-ds. The CLFES phase seems to be slightly more jerky than the VOLne. The torque profiles produced by the two legs are really similarn the CLFES when the symmetry controller was on and not in theOL phase.ig. 10. Energy per revolution obtained by a stroke patient during protocol 2. Vertical lineycling; from 60 to 90 s: voluntary cycling VOL; from 90 to 150 s: CLFES.
itions: passive cycling, voluntary cycling and closed-loop FES (CLFES). The plotted
The mean value per revolution of the right and left energy isshown in Fig. 10. During the VOL phase it is clear that the patientproduced less energy with the left leg that was the impaired one.The mean value of the impaired leg is lower than the one obtainedby the healthy leg (Fig. 10) although the positive peaks of the twotorques were comparable in the VOL phase (Fig. 9H). Therefore,observing the raw data it seems that the difference between thetorque produced by the two legs is not the quadriceps action corre-sponding to the positive peaks but the hamstrings action. It seemsthat the patient offers a greater stiffness when the impaired leg hasto be dragged to the point in which its pushing action starts. In theCLFES phase the energy per revolution obtained by the two legswere quite similar.
The unbalance computed in the VOL and CLFES phases were38.1 % and −2.8 %, respectively. Thus, the instrumented cycle-ergometer provides signals to the closed-loop controller that wasable to produce a symmetric task.
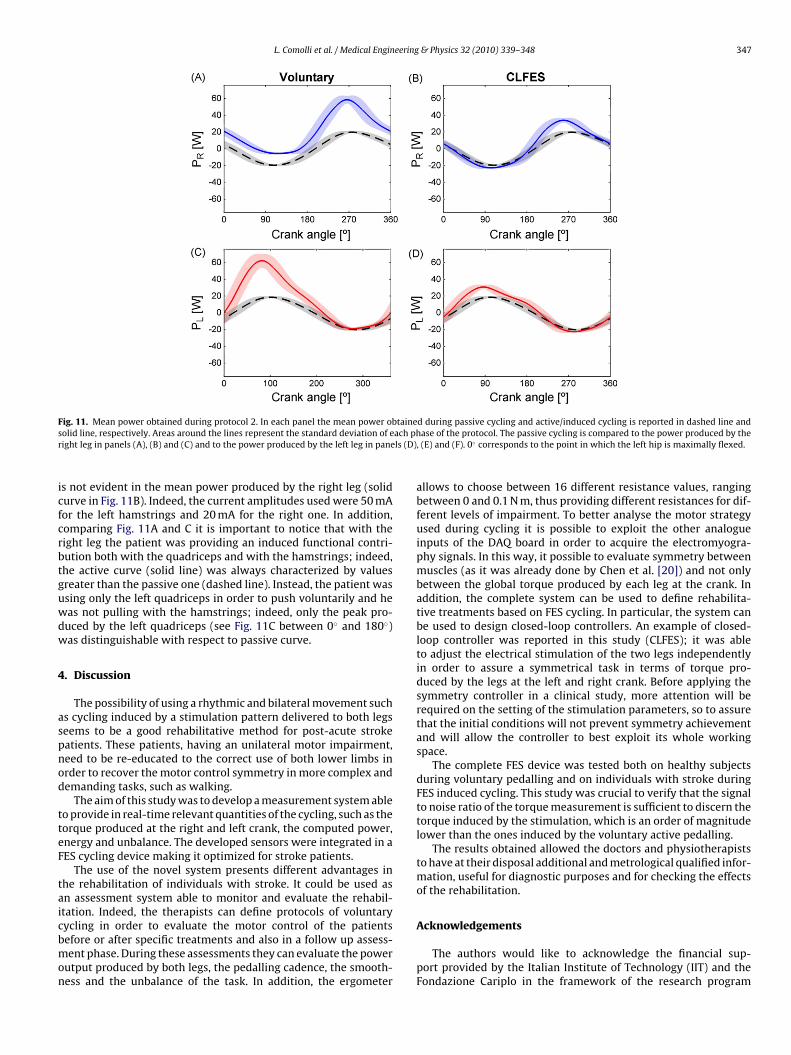
Fig. 11 shows the power produced at the right and left leg withrespect to the crank angle. During the CLFES phase it is importantto highlight the power produced by the left hamstrings which is thesecond small peak of the solid curve (Fig. 11D) that is visible in theangular range comprised between 100◦ and 200◦. This second peak
s indicate the instant in which the different conditions start. From 0 to 60 s: passive
L. Comolli et al. / Medical Engineering & Physics 32 (2010) 339–348 347
F taines ach phr ls (D)
icfcrbtguwdw
4
aspnod
tteF
taicbmon
ig. 11. Mean power obtained during protocol 2. In each panel the mean power obolid line, respectively. Areas around the lines represent the standard deviation of eight leg in panels (A), (B) and (C) and to the power produced by the left leg in pane
s not evident in the mean power produced by the right leg (solidurve in Fig. 11B). Indeed, the current amplitudes used were 50 mAor the left hamstrings and 20 mA for the right one. In addition,omparing Fig. 11A and C it is important to notice that with theight leg the patient was providing an induced functional contri-ution both with the quadriceps and with the hamstrings; indeed,he active curve (solid line) was always characterized by valuesreater than the passive one (dashed line). Instead, the patient wassing only the left quadriceps in order to push voluntarily and heas not pulling with the hamstrings; indeed, only the peak pro-uced by the left quadriceps (see Fig. 11C between 0◦ and 180◦)as distinguishable with respect to passive curve.
. Discussion
The possibility of using a rhythmic and bilateral movement suchs cycling induced by a stimulation pattern delivered to both legseems to be a good rehabilitative method for post-acute strokeatients. These patients, having an unilateral motor impairment,eed to be re-educated to the correct use of both lower limbs inrder to recover the motor control symmetry in more complex andemanding tasks, such as walking.
The aim of this study was to develop a measurement system ableo provide in real-time relevant quantities of the cycling, such as theorque produced at the right and left crank, the computed power,nergy and unbalance. The developed sensors were integrated in aES cycling device making it optimized for stroke patients.
The use of the novel system presents different advantages inhe rehabilitation of individuals with stroke. It could be used asn assessment system able to monitor and evaluate the rehabil-tation. Indeed, the therapists can define protocols of voluntary
ycling in order to evaluate the motor control of the patientsefore or after specific treatments and also in a follow up assess-ent phase. During these assessments they can evaluate the powerutput produced by both legs, the pedalling cadence, the smooth-ess and the unbalance of the task. In addition, the ergometer
d during passive cycling and active/induced cycling is reported in dashed line andase of the protocol. The passive cycling is compared to the power produced by the
, (E) and (F). 0◦ corresponds to the point in which the left hip is maximally flexed.
allows to choose between 16 different resistance values, rangingbetween 0 and 0.1 N m, thus providing different resistances for dif-ferent levels of impairment. To better analyse the motor strategyused during cycling it is possible to exploit the other analogueinputs of the DAQ board in order to acquire the electromyogra-phy signals. In this way, it possible to evaluate symmetry betweenmuscles (as it was already done by Chen et al. [20]) and not onlybetween the global torque produced by each leg at the crank. Inaddition, the complete system can be used to define rehabilita-tive treatments based on FES cycling. In particular, the system canbe used to design closed-loop controllers. An example of closed-loop controller was reported in this study (CLFES); it was ableto adjust the electrical stimulation of the two legs independentlyin order to assure a symmetrical task in terms of torque pro-duced by the legs at the left and right crank. Before applying thesymmetry controller in a clinical study, more attention will berequired on the setting of the stimulation parameters, so to assurethat the initial conditions will not prevent symmetry achievementand will allow the controller to best exploit its whole workingspace.
The complete FES device was tested both on healthy subjectsduring voluntary pedalling and on individuals with stroke duringFES induced cycling. This study was crucial to verify that the signalto noise ratio of the torque measurement is sufficient to discern thetorque induced by the stimulation, which is an order of magnitudelower than the ones induced by the voluntary active pedalling.
The results obtained allowed the doctors and physiotherapiststo have at their disposal additional and metrological qualified infor-mation, useful for diagnostic purposes and for checking the effectsof the rehabilitation.
Acknowledgements
The authors would like to acknowledge the financial sup-port provided by the Italian Institute of Technology (IIT) and theFondazione Cariplo in the framework of the research program
3 eering
Hi
C
R
[
[
[
[
[
[
[[
[
48 L. Comolli et al. / Medical Engin
INT@Lecco. An acknowledgement to Hasomed GmbH for provid-ng the stimulator.
onflict of interest statement
None.
eferences
[1] Aminoff MJ, Greenberg DA, Simon RP. Clinical neurology. 6th ed. McGraw-Hill/Lange; 2005.
[2] Francescutti C, Mariotti S, Simon G, D’Errigo P, Di Bidino R. The impact ofstroke in Italy: first step for a national burden of disease study. Disabil Rehabil2005;27(5):229–40.
[3] Brown DA, Nagpal S, Chi S. Limb-load cycling program for locomotor interven-tion following stroke. Phys Ther 2005;85(2):159–68.
[4] Brown DA, Kautz SA. Increased workload enhances force output during pedal-ing exercise in person with poststroke hemiplegia. Stroke 1998;29:598–606.
[5] Katz-Leurer M, Sender I, Keren O, Dvir Z. The influence of early cycling trainingon balance in stroke patients at the sub-acute stage. Results of a preliminarytrial. Clin Rehabil 2006;20:398–405.
[6] Jones EG. Cortical and subcortical contributions to activity-dependentplasticity in primate somatosensory cortex. Annu Rev Neurosci 2000;23:1–37.
[7] Hunt K, Stone B, Negard N, et al. Control strategies for integration of electric
motor assist and functional electrical stimulation in paraplegic cycling: utilityfor exercise testing and mobile cycling. IEEE Trans Neural Syst Rehabil Eng2004;12(1):88–101.[8] Trumbower RD, Faghri PD. Kinematic analyses of semireclined leg cyclingin able bodied and spinal cord injured individuals. Spinal Cord 2005;43(9):543–9.
[
[
& Physics 32 (2010) 339–348
[9] Szecsi J, Krause P, Krafczyk S, Brandt T, Straube A. Functional output improve-ment in FES cycling by means of forced smooth pedaling. Med Sci Sports Exerc2007;39(5):764–80.
10] Scheffler LR, Chae J. Neuromuscular electrical stimulation in neurorehabilita-tion. Muscle Nerve 2007;35:562–90.
11] Ferrante S, Pedrocchi A, Ferrigno G, Molteni F. Cycling induced by functionalelectrical stimulation improves the muscular strength and the motor controlof individuals with post-acute stroke. Eur J Phys Rehabil Med 2008;44(2):159–67.
12] Gföhler M, Angeli T, Eberharter T, et al. Test bed with force-measuring crank forstatic and dynamic investigations on cycling by means of functional electricalstimulation. IEEE Trans Neural Syst Rehabil Eng 2001;9(2):169–80.
13] Mimmi G, Pennacchi P, Frosini L. Biomechanical analysis of pedalling for reha-bilitation purposes: experimental results on two pathological subjects andcomparison with non-pathological findings. Comput Methods Biomech BiomedEng 2004;7(6):339–45.
14] Hoffmann K. An introduction to measurements using strain gauges. 1st ed.Darmstadt: Hottinger Baldwin Messtechnik GmbH; 1989.
15] ISO. International vocabulary of metrology—basic and general concepts andassociated terms. VIM; 2008.
16] ISO. Guide to the expression of the uncertainty in measurement. GUM; 1995.17] Ferrante S, Comolli L, Pedrocchi A, Bocciolone M, Ferrigno G, Molteni
F. Optimization of a FES cycling neuroprosthesis on stroke patients bymeans of the left and right crank measurements. In: Proc. of Biode-vices 2008, Int. Conf. of Biomedical Electronics and Devices. 2008.p. 206–11.
18] Schauer T. Feedback control of cycling in spinal cord injury using functionalelectrical stimulation. PhD dissertation. University of Glasgow, October; 2005.
19] Ambrosini E, Ferrante S, Schauer T, Pedrocchi A, Ferrigno G. Simulation andexperimental design of a symmetry controller for FES cycling optimised onstroke patients. In: Proc. Biodevices 2009. 2009.
20] Chen HY, Chen HY, Chen SC, Chen J-JJ, Fu LL, Wang YL. Kinesiological andkinematical analysis for stroke subjects with asymmetrical cycling movementpatterns. J Electromyogr Kinesiol 2005;15:587–95.
Related Documents