FLORIDA STATE UNIVERSITY COLLEGE OF ARTS AND SCIENCES METRICS AND TECHNIQUES TO GUIDE SOFTWARE DEVELOPMENT By SUBHAJIT DATTA A Dissertation submitted to the Department of Computer Science in partial fulfillment of the requirements for the degree of Doctor of Philosophy Dissertation Defended: Spring Semester, 2009

Welcome message from author
This document is posted to help you gain knowledge. Please leave a comment to let me know what you think about it! Share it to your friends and learn new things together.
Transcript

FLORIDA STATE UNIVERSITY
COLLEGE OF ARTS AND SCIENCES
METRICS AND TECHNIQUES TO GUIDE SOFTWARE DEVELOPMENT
By
SUBHAJIT DATTA
A Dissertation submitted to theDepartment of Computer Science
in partial fulfillment of therequirements
for the degree ofDoctor of Philosophy
Dissertation Defended:Spring Semester, 2009

The members of the Committee approve the Dissertation of Subhajit Datta defended on
March 2, 2009.
Robert van EngelenProfessor Directing Dissertation
Ian DouglasOutside Committee Member
Lois HawkesCommittee Member
Theodore BakerCommittee Member
Daniel SchwartzCommittee Member
Michael MascagniCommittee Member
The Graduate School has verified and approved the above named committee members.
ii

To my father:
ÌAö ÌAö èAS ©c OÌHÞÉ© ÀöTT ÞÀËÌ ~ÉÀw ~ÉÀw ||
iii

ACKNOWLEDGMENTS
I thank my advisor Dr Robert van Engelen for all his support through these years of
graduate study. He gave me independence in pursuing my research topic, and guidance in
addressing the expectations of the PhD program. Dr van Engelen has helped me discern
unifying threads among diverse areas of computer science. His assistance was vital in
disseminating results, engaging in collaborations and travel related to my research.
I thank Dr Ian Douglas for serving as the external committee member. He has taken
keen interest in my research and clarified many questions related to the dissertation. Dr
Lois Hawkes has been an ever-present source of counsel since I joined FSU. I thank her for
the suggestions in improving this dissertation. Dr Theodore Baker’s exacting standards of
graduate research have inspired me to meet those standards to the best of my abilities. I
thank him for his specific guidance as well as general advice on research orientation. Dr
Daniel Schwartz’s classes were the source of many of my research ideas. I deeply appreciate
his interest in my dissertation. My interactions with Dr Michael Mascagni form a memorable
part of my graduate student experience; every time I spoke to him, I was endowed with new
insights. I thank him for all the time and attention.
I have received invaluable support from several individuals and groups for accessing and
interpreting the real life data that was used to validate my research. I thank Mr Sean
Campion, Dr Animikh Sen, and Mr Jeff Bauer for their help with my case studies. Ms
Shaila Kagal, Director of the Symbiosis Center for Information Technology (SCIT), has
been a key facilitator of my collaboration with SCIT. I wish to thank the bright students
of SCIT – Kshitiz Goel, Pooja Mantri, Prerna Gandhi, Sidharth Malhotra, Nitin Maurya,
Praful Dhone, Prashant Pareek, Sandeep Malpani, Mandar Kulkarni, Huzaifa Asgarli, Nidhi
Chaudhry, and Avinash Iyer – who participated with such enthusiasm in the conception and
development of AMDEST – A Metrics Driven Enterprise Software Tool – that was used
iv

extensively in processing the data from the case studies.
Finally, my thanks to those who deserve all the gratitude but desire none: To my wife,
who began as the best friend, and with each passing day, becomes a better friend; to my
mother, whose courage and zest for life, I wish I had; to my brother, who instilled in me
many of the interests now very much my own, and shared his original perception of research
that helped shape mine; and to those others, whose lives I extend.
v

TABLE OF CONTENTS
List of Tables . . . . . . . . . . . . . . . . . . . . . . . . . . . . . . . . . . . . . . ix
List of Figures . . . . . . . . . . . . . . . . . . . . . . . . . . . . . . . . . . . . . xi
Abstract . . . . . . . . . . . . . . . . . . . . . . . . . . . . . . . . . . . . . . . . xiii
1. INTRODUCTION . . . . . . . . . . . . . . . . . . . . . . . . . . . . . . . . . 11.1 Overview . . . . . . . . . . . . . . . . . . . . . . . . . . . . . . . . . . . 11.2 Organization of the Dissertation . . . . . . . . . . . . . . . . . . . . . . . 21.3 Summary . . . . . . . . . . . . . . . . . . . . . . . . . . . . . . . . . . . 8
2. A HISTORICAL OVERVIEW OF RELATED WORK . . . . . . . . . . . . . 92.1 Overview . . . . . . . . . . . . . . . . . . . . . . . . . . . . . . . . . . . 92.2 Metrics in Software Engineering . . . . . . . . . . . . . . . . . . . . . . . 92.3 The Challenge of Changing Requirements . . . . . . . . . . . . . . . . . 282.4 A Brief Overview of Automated Software Development . . . . . . . . . . 332.5 UML 2.0 – Towards Model Driven Development . . . . . . . . . . . . . . 352.6 Summary . . . . . . . . . . . . . . . . . . . . . . . . . . . . . . . . . . . 38
3. PRELIMINARIES, DEFINITIONS, AND ASSUMPTIONS . . . . . . . . . . 403.1 Overview . . . . . . . . . . . . . . . . . . . . . . . . . . . . . . . . . . . 403.2 Scope of Research . . . . . . . . . . . . . . . . . . . . . . . . . . . . . . . 403.3 A Model for the Software Development Space . . . . . . . . . . . . . . . 443.4 Characteristics of Software Design . . . . . . . . . . . . . . . . . . . . . 493.5 Summary . . . . . . . . . . . . . . . . . . . . . . . . . . . . . . . . . . . 51
4. REQ-CHANGE: A TECHNIQUE TO ANALYZE THE DYNAMICS OFCHANGING REQUIREMENTS . . . . . . . . . . . . . . . . . . . . . . . . . 524.1 Overview . . . . . . . . . . . . . . . . . . . . . . . . . . . . . . . . . . . 524.2 Motivation . . . . . . . . . . . . . . . . . . . . . . . . . . . . . . . . . . 524.3 Assumptions . . . . . . . . . . . . . . . . . . . . . . . . . . . . . . . . . 534.4 Defining the Metrics . . . . . . . . . . . . . . . . . . . . . . . . . . . . . 544.5 Range of the Metrics Values . . . . . . . . . . . . . . . . . . . . . . . . . 584.6 The REQ-CHANGE Technique . . . . . . . . . . . . . . . . . . . . . . . 594.7 Empirical Validation . . . . . . . . . . . . . . . . . . . . . . . . . . . . . 604.8 Summary . . . . . . . . . . . . . . . . . . . . . . . . . . . . . . . . . . . 82
vi

5. COM-REF: A TECHNIQUE TO GUIDE THE DELEGATION OF RESPON-SIBILITIES TO COMPONENTS IN SOFTWARE SYSTEMS . . . . . . . . . 835.1 Overview . . . . . . . . . . . . . . . . . . . . . . . . . . . . . . . . . . . 835.2 Motivation . . . . . . . . . . . . . . . . . . . . . . . . . . . . . . . . . . 835.3 A Model for the Software Development Space . . . . . . . . . . . . . . . 855.4 The Concepts of Aptitude and Concordance . . . . . . . . . . . . . . . . 865.5 Defining the Metrics . . . . . . . . . . . . . . . . . . . . . . . . . . . . . 885.6 COMP-REF: A Technique to Refine the Organization of Components . . 895.7 Experimental Validation . . . . . . . . . . . . . . . . . . . . . . . . . . . 925.8 Related Work . . . . . . . . . . . . . . . . . . . . . . . . . . . . . . . . . 1005.9 Discussion . . . . . . . . . . . . . . . . . . . . . . . . . . . . . . . . . . . 1015.10 Summary . . . . . . . . . . . . . . . . . . . . . . . . . . . . . . . . . . . 101
6. RESP-DIST: A REFINEMENT OF THE COMP-REF TECHNIQUE TOADDRESS REORGANIZATION OF COMPONENT RESPONSIBILITIESTHROUGH MERGING AND SPLITTING . . . . . . . . . . . . . . . . . . . 1036.1 Motivation . . . . . . . . . . . . . . . . . . . . . . . . . . . . . . . . . . 1036.2 The RESP-DIST Technique . . . . . . . . . . . . . . . . . . . . . . . . . 1036.3 Experimental Validation . . . . . . . . . . . . . . . . . . . . . . . . . . . 1066.4 Related Work . . . . . . . . . . . . . . . . . . . . . . . . . . . . . . . . . 1146.5 Summary . . . . . . . . . . . . . . . . . . . . . . . . . . . . . . . . . . . 114
7. CROSSCUTTING SCORE: AN INDICATOR METRIC FOR ASPECT ORI-ENTATION . . . . . . . . . . . . . . . . . . . . . . . . . . . . . . . . . . . . . 1167.1 Motivation . . . . . . . . . . . . . . . . . . . . . . . . . . . . . . . . . . 1167.2 The context of AOP . . . . . . . . . . . . . . . . . . . . . . . . . . . . . 1177.3 Recurrent motifs and Related Work . . . . . . . . . . . . . . . . . . . . . 1187.4 Aspect Orientation – Different Coordinates . . . . . . . . . . . . . . . . 1197.5 A Thumb Rule - Immediate Motivations . . . . . . . . . . . . . . . . . . 1207.6 Crosscutting Score . . . . . . . . . . . . . . . . . . . . . . . . . . . . . . 1217.7 Motivating Example . . . . . . . . . . . . . . . . . . . . . . . . . . . . . 1227.8 Discussion . . . . . . . . . . . . . . . . . . . . . . . . . . . . . . . . . . . 1257.9 Summary . . . . . . . . . . . . . . . . . . . . . . . . . . . . . . . . . . . 126
8. FIDELITY REGISTER: A METRIC TO INTEGRATE THE FURPS+ MODELWITH USE CASES . . . . . . . . . . . . . . . . . . . . . . . . . . . . . . . . 1278.1 Motivation . . . . . . . . . . . . . . . . . . . . . . . . . . . . . . . . . . 1278.2 Background . . . . . . . . . . . . . . . . . . . . . . . . . . . . . . . . . . 1288.3 Fidelity Register . . . . . . . . . . . . . . . . . . . . . . . . . . . . . . . 1298.4 The Approach in Perspective . . . . . . . . . . . . . . . . . . . . . . . . 1308.5 Discussion . . . . . . . . . . . . . . . . . . . . . . . . . . . . . . . . . . . 1308.6 Summary . . . . . . . . . . . . . . . . . . . . . . . . . . . . . . . . . . . 131
vii

9. AGILITY MEASUREMENT INDEX: A METRIC FOR THE CROSSROADSOF SOFTWARE DEVELOPMENT METHODOLOGIES . . . . . . . . . . . 1329.1 Motivation . . . . . . . . . . . . . . . . . . . . . . . . . . . . . . . . . . 1329.2 The Methodology Fray . . . . . . . . . . . . . . . . . . . . . . . . . . . . 1349.3 And the Need for a Way . . . . . . . . . . . . . . . . . . . . . . . . . . . 1349.4 Discussion . . . . . . . . . . . . . . . . . . . . . . . . . . . . . . . . . . . 1359.5 Summary . . . . . . . . . . . . . . . . . . . . . . . . . . . . . . . . . . . 137
10.PROJECT-ENTROPY: A METRIC TO UNDERSTAND RESOURCE ALLO-CATION DYNAMICS ACROSS SOFTWARE PROJECTS . . . . . . . . . . 13810.1 Overview . . . . . . . . . . . . . . . . . . . . . . . . . . . . . . . . . . . 13810.2 Introduction and Motivation . . . . . . . . . . . . . . . . . . . . . . . . . 13810.3 Project-entropy . . . . . . . . . . . . . . . . . . . . . . . . . . . . . . . . 13910.4 An Example Scenario . . . . . . . . . . . . . . . . . . . . . . . . . . . . . 14110.5 Discussion . . . . . . . . . . . . . . . . . . . . . . . . . . . . . . . . . . . 14210.6 Summary . . . . . . . . . . . . . . . . . . . . . . . . . . . . . . . . . . . 142
11.PREDICTUX – A FRAMEWORK FOR PREDICTING LINUX KERNELRELEASE TIMES . . . . . . . . . . . . . . . . . . . . . . . . . . . . . . . . . 14311.1 Motivation . . . . . . . . . . . . . . . . . . . . . . . . . . . . . . . . . . 14311.2 The Predictux Framework . . . . . . . . . . . . . . . . . . . . . . . . . . 14411.3 Experimental Validation . . . . . . . . . . . . . . . . . . . . . . . . . . . 14511.4 Discussion . . . . . . . . . . . . . . . . . . . . . . . . . . . . . . . . . . . 14511.5 Summary . . . . . . . . . . . . . . . . . . . . . . . . . . . . . . . . . . . 151
12.TOOL SUPPORT FOR RESEARCH . . . . . . . . . . . . . . . . . . . . . . . 15212.1 Overview . . . . . . . . . . . . . . . . . . . . . . . . . . . . . . . . . . . 15212.2 Motivation . . . . . . . . . . . . . . . . . . . . . . . . . . . . . . . . . . 15212.3 AMDEST – A Metrics Driven Enterprise Software Tool . . . . . . . . . . 15312.4 Summary . . . . . . . . . . . . . . . . . . . . . . . . . . . . . . . . . . . 156
13.CONCLUSIONS . . . . . . . . . . . . . . . . . . . . . . . . . . . . . . . . . . 157
APPENDIX . . . . . . . . . . . . . . . . . . . . . . . . . . . . . . . . . . . . . . 158
A. DESIGN ARTIFACTS OF AMDEST . . . . . . . . . . . . . . . . . . . . . . 158
B. SCREEN IMAGES OF AMDEST . . . . . . . . . . . . . . . . . . . . . . . . 169
REFERENCES . . . . . . . . . . . . . . . . . . . . . . . . . . . . . . . . . . . . . 174
BIOGRAPHICAL SKETCH . . . . . . . . . . . . . . . . . . . . . . . . . . . . . 187
viii

LIST OF TABLES
2.1 Software Metrics Trends . . . . . . . . . . . . . . . . . . . . . . . . . . . . . 10
2.2 Software Metrics Trends contd. . . . . . . . . . . . . . . . . . . . . . . . . . 11
4.1 REQ-CHANGE: Levels of Impact due to Change in Requirement Rn . . . . 60
4.2 Mutation Value, Mutation Index and Dependency Index for I1 of the SimpleExample . . . . . . . . . . . . . . . . . . . . . . . . . . . . . . . . . . . . . . 62
4.3 Mutation Value, Mutation Index and Dependency Index for I2 of the SimpleExample . . . . . . . . . . . . . . . . . . . . . . . . . . . . . . . . . . . . . . 64
4.4 Mutation Value, Mutation Index for I3 of the Simple Example . . . . . . . . 65
4.5 Requirements for the FAA System: Iteration I1 . . . . . . . . . . . . . . . . 68
4.6 Components for the FAA System: Iteration I1 . . . . . . . . . . . . . . . . . 70
4.7 Metric Values for the FAA System: Iteration I1 . . . . . . . . . . . . . . . . 71
4.8 Requirements for the FAA System: Iteration I2 . . . . . . . . . . . . . . . . 72
4.9 Morphbank Browse Requirements across Iterations . . . . . . . . . . . . . . 74
4.10 Morphbank Browse Code Components across Iterations . . . . . . . . . . . . 77
4.11 Metrics for I1 of Morphbank Browse Functionality . . . . . . . . . . . . . . . 78
4.12 Metrics for I2 of Morphbank Browse Functionality . . . . . . . . . . . . . . . 78
5.1 COMP-REF: Experimental Validation Results . . . . . . . . . . . . . . . . . 95
5.2 COMP-REF: Experimental Validation Results contd. . . . . . . . . . . . . . 96
5.3 Metrics Values and LP solution for iteration I1 of the FAA System . . . . . . 97
6.1 RESP-DIST: Experimental Validation Results . . . . . . . . . . . . . . . . . 108
6.2 RESP-DIST: Experimental Validation Results contd. . . . . . . . . . . . . . 109
6.3 RESP-DIST: Details for Project A . . . . . . . . . . . . . . . . . . . . . . . 110
ix

7.1 Components and their Primary Responsibilities . . . . . . . . . . . . . . . . 123
7.2 Calculation of Crosscutting Score . . . . . . . . . . . . . . . . . . . . . . . . 123
8.1 Calculating Fidelity Register: An Example . . . . . . . . . . . . . . . . . . . 129
9.1 Sample Calculation of Agility Measurement Index (AMI) and Specific Dimen-sion(SD) . . . . . . . . . . . . . . . . . . . . . . . . . . . . . . . . . . . . . . 136
10.1 Satisfaction Levels for Projects A, B, C at times T2 > T1 . . . . . . . . . . . 141
x

LIST OF FIGURES
1.1 Facets of Research . . . . . . . . . . . . . . . . . . . . . . . . . . . . . . . . 3
1.2 Dimensions of Problem Analysis . . . . . . . . . . . . . . . . . . . . . . . . . 4
3.1 A Model of the Software Development Space . . . . . . . . . . . . . . . . . . 46
3.2 The One-to-One Scenario . . . . . . . . . . . . . . . . . . . . . . . . . . . . 48
3.3 The One-to-Many Scenario . . . . . . . . . . . . . . . . . . . . . . . . . . . . 49
3.4 The Many-to-One Scenario . . . . . . . . . . . . . . . . . . . . . . . . . . . . 50
4.1 Variation of MI(n) across Iterations for the Simple Example . . . . . . . . . 65
4.2 Variation of DI(n) across Iterations for the Simple Example . . . . . . . . . 66
4.3 Morphbank: Browse by View Screen Image . . . . . . . . . . . . . . . . . . . 75
4.4 Variation of the Number of Code Components for Browse across Iterationsfor Morphbank 2.0 and 2.5 . . . . . . . . . . . . . . . . . . . . . . . . . . . . 80
5.1 COMP-REF: Outline of the Technique . . . . . . . . . . . . . . . . . . . . . 93
5.2 an values from LP solution(top) and AI(n) vs. Cn (bottom) . . . . . . . . . 99
6.1 RESP-DIST: Outline of the Technique (extends from Figure 5.1) . . . . . . . 107
6.2 Values of an, AI(n), MI(m) and CI(n) corresponding to the componentsC1,...,C8 for Project A. The RESP-DIST technique suggests merging for C4
and splitting for C8 . . . . . . . . . . . . . . . . . . . . . . . . . . . . . . . . 112
7.1 Different Views of Aspects . . . . . . . . . . . . . . . . . . . . . . . . . . . . 120
7.2 Components vs. Crosscutting Score . . . . . . . . . . . . . . . . . . . . . . . 124
10.1 Flow of Endeavor across Projects and the Entropic Limit . . . . . . . . . . . 140
11.1 Predictux: Outline of the Approach . . . . . . . . . . . . . . . . . . . . . . . 146
11.2 Predictux: Interaction of the Pre-processor Components . . . . . . . . . . . 147
xi

11.3 Predictux: Part of the Data Set used for Decision-tree Learning . . . . . . . 147
11.4 Predictux: The Pruned Decision-tree . . . . . . . . . . . . . . . . . . . . . . 148
11.5 Incremental Times of Linux Kernel Releases 2.6.20 to 2.6.1: Actual andPredicted . . . . . . . . . . . . . . . . . . . . . . . . . . . . . . . . . . . . . 149
11.6 Percent deviation between predicted and actual incremental times . . . . . . 150
12.1 AMDEST: Logical Components . . . . . . . . . . . . . . . . . . . . . . . . . 155
A.1 Sequence Diagram for the implementation of the REQ-CHANGE technique . 159
A.2 Sequence Diagram for the implementation of the COMP-REF technique . . . 160
A.3 Class Diagrams 1 . . . . . . . . . . . . . . . . . . . . . . . . . . . . . . . . . 161
A.4 Class Diagrams 2 . . . . . . . . . . . . . . . . . . . . . . . . . . . . . . . . . 162
A.5 Class Diagrams 3 . . . . . . . . . . . . . . . . . . . . . . . . . . . . . . . . . 163
A.6 Class Diagrams 4 . . . . . . . . . . . . . . . . . . . . . . . . . . . . . . . . . 164
A.7 Class Diagrams 5 . . . . . . . . . . . . . . . . . . . . . . . . . . . . . . . . . 165
A.8 Class Diagrams 6 . . . . . . . . . . . . . . . . . . . . . . . . . . . . . . . . . 166
A.9 Class Diagrams 7 . . . . . . . . . . . . . . . . . . . . . . . . . . . . . . . . . 167
A.10 Class Diagrams 8 . . . . . . . . . . . . . . . . . . . . . . . . . . . . . . . . . 168
B.1 AMDEST: Main Screen . . . . . . . . . . . . . . . . . . . . . . . . . . . . . 170
B.2 AMDEST: Add Iteration Details . . . . . . . . . . . . . . . . . . . . . . . . 171
B.3 AMDEST: Review/Modify Iteration Details . . . . . . . . . . . . . . . . . . 172
B.4 AMDEST: Metric Values and Levels of Impact for REQ-CHANGE . . . . . 173
xii

ABSTRACT
The objective of my doctoral dissertation research is to formulate, implement, and validate
metrics and techniques towards perceiving some of the influences on software development,
predicting the impact of user initiated changes on a software system, and prescribing
guidelines to aid decisions affecting software development. Some of the topics addressed in
my dissertation are: Analyzing the extent to which changing requirements affect a system’s
design, how the delegation of responsibilities to software components can be guided, how
Aspect Oriented Programming (AOP) may be combined with Object Oriented Programming
(OOP) to best deliver a system’s functionality, whether and how characteristics of a system’s
design are influenced by a outsourced and offshore development. The metrics and techniques
developed in my dissertation serve as heuristics across the software development life cycle,
helping practitioners evaluate options and take decisions. By way of validation, the metrics
and techniques have been applied to more than 10 real life software systems. To facilitate
the application of the metrics and techniques, I have led the development of automated
tools which can process software development artifacts such as code and Unified Modeling
Language (UML) diagrams. The design and implementation of such tools are also discussed
in the dissertation.
xiii

CHAPTER 1
INTRODUCTION
1.1 Overview
As Stroustrup has observed [Stroustrup, 2007], our technological civilization depends on
software. Today, we use software systems to address many of our needs – from the casual to
the critical. With such penetration of software into our lives, software systems have to address
issues of deepening complexity. All complex systems of human ingenuity, barring software, –
mechanical, electrical, structural, to name a few – depend on the underpinnings of physical
laws for the soundness of their design. For example, an electrical circuit, however simple or
complicated, has its moorings in the ultimate certitude of the Ohm’s and Kirchhoff’s Laws.
But there are no such laws of universal validity to guide the process of software
development. At least, they are not discovered yet. So how do we build software to deliver
our complex needs?
Designing and developing software systems is much a subjective pursuit at present; often
drawing on personal insights, experience, rules of the thumb, folklore of the trade, or “tribal
memory” [Booch, 2008]. Situations are made more difficult by the fact that that every non-
trivial software system has to function in a constant flux, due to changes in user requirements,
environmental and stakeholder conditions, technological landscape etc.
In the above context, this dissertation seeks to formulate, implement, and validate mech-
anisms to facilitate some of the decisions that needs to be taken with consistency, purpose
and discipline for software development to succeed in meeting user needs (Figure 1.1).
With reference to Figure 1.2, the mechanisms include metrics-based techniques, standalone
metrics, as well as frameworks to predict, prescribe, and perceive the factors, guidelines, and
influences that affect software development at the varying scopes of individual or local team,
distributed development, organizations, and open-source development.
1

The mechanisms have been applied on a number of real life software projects, and I
report the results from these studies. The results include situations where the mechanisms
do not work satisfactorily, and I have tried to analyze the reasons for such limitations. I
also discuss the design and implementation of tools and frameworks such as AMDEST – A
Metrics Driven Enterprise Software Tool – which connect the application of the mechanisms
to the most concrete aspects of software development, viz. code and UML design artifacts.
The next section describes the organization of this dissertation document.
1.2 Organization of the Dissertation
Except for the first and last chapters, each chapter corresponds to a particular research
problem I have examined in my dissertation research and published results on. In these
chapters, I introduce a research problem, discuss how a solution has evolved and present
results from its validation. After this Introduction, Chapter 2 outlines the broad contours
of existing study in the areas of my interest. (References to more specific related work are
also given in each chapter.) In Chapter 3, I discuss some preliminaries, definitions, and
assumptions underlying my research. Chapter 12 highlights the tool support developed for
my research. Chapter 13 presents concluding remarks. The discussions of the remaining
chapters can be outlined as:
• In Chapter 4, we address the question: How can the impact of changing functional
requirements on the components of a software system be quantified? We derive
the metrics Mutation Index, Component Set, and Dependency Index and present the
REQ-CHANGE technique to specify levels of impact due to changing requirements
across iterations. Results from applying the technique on real life software systems
are discussed. Additionally, we highlight how some of these ideas have been used
in the development of a timeline prediction framework. In this chapter, we consider
the hypothesis, Given a model of software development aligned to an iterative and
incremental methodology, the REQ-CHANGE technique quantitatively indicates the
level of impact on components due to changing requirements.
The discussions of this chapter have been published in [Datta and van Engelen, 2006],
[Datta et al., 2007], [Berkling et al., 2008].
2

Form
ulat
e
Impl
emen
tVa
lidat
e
Mut
atio
n In
dex
Depe
nden
cy In
dex
Aptit
ude
Inde
x
Conc
orda
nce
Inde
x
Cros
scut
ting
Scor
e
Fide
lity
Regi
ster
Agili
ty M
easu
rem
ent I
ndex
Proj
ect-e
ntro
py
REQ
-CHA
NGE
COM
P-RE
F
RESP
-DIS
T
FAA
proj
ect
Mor
phba
nkFi
leZi
llaSC
IT w
orks
hop
…AM
DEST
Pred
ictu
x
Tim
elin
e pr
edic
tion
fram
ewor
k
Fig
ure
1.1:
Fac
ets
ofR
esea
rch
3

Scop
e of
sof
twar
e de
velo
pmen
t
Insights
Perc
eive
Pres
crib
e
Pred
ict
Dist
ribut
ed
deve
lopm
ent
Orga
niza
tions
Open
-sou
rce
REQ
-CH
AN
GE,
Cha
pter
4
CO
MP-
REF
, Cha
pter
5R
ESP-
DIS
T, C
hapt
er 6
Cro
sscu
tting
Sco
re,
Cha
pter
7
Pred
ictu
x,C
hapt
er 1
1A
dapt
ive
effo
rtpr
edic
tion,
Cha
pter
4
Agi
lity
Mea
sure
men
tIn
dex,
Cha
pter
9
Fide
lity
Reg
iste
r,C
hapt
er 8
Loca
tion
&Pe
rcep
tiona
lA
sync
hron
y,C
hapt
er 6
Proj
ect-
entr
opy,
Cha
pter
10
Indi
vidu
al,
loca
l tea
ms
Scop
e of
sof
twar
e de
velo
pmen
t
Insights
Perc
eive
Pres
crib
e
Pred
ict
Dist
ribut
ed
deve
lopm
ent
Orga
niza
tions
Open
-sou
rce
REQ
-CH
AN
GE,
Cha
pter
4
CO
MP-
REF
, Cha
pter
5R
ESP-
DIS
T, C
hapt
er 6
Cro
sscu
tting
Sco
re,
Cha
pter
7
Pred
ictu
x,C
hapt
er 1
1A
dapt
ive
effo
rtpr
edic
tion,
Cha
pter
4
Agi
lity
Mea
sure
men
tIn
dex,
Cha
pter
9
Fide
lity
Reg
iste
r,C
hapt
er 8
Loca
tion
&Pe
rcep
tiona
lA
sync
hron
y,C
hapt
er 6
Proj
ect-
entr
opy,
Cha
pter
10
Indi
vidu
al,
loca
l tea
ms F
igure
1.2:
Dim
ensi
ons
ofP
roble
mA
nal
ysi
s
4

• Chapters 5 and 6 investigate ways to guide the delegation of responsibilities to com-
ponents of a software system. We introduce the concepts of aptitude and concordance
to reflect upon some of the interesting aspects of component collaboration; derive
the metrics Aptitude Index, Requirement Set, and Concordance Index ; and develop the
COMP-REF technique to suggest reorganization of component responsibilities through
merging. COMP-REF is then extended into the RESP-DIST technique to suggest
splitting, as well as merging towards an expedient distribution of responsibilities.
Both COMP-REF and RESP-DIST use the aforementioned metrics as well as a linear
programming based algorithm. Empirical validation of COMP-REF and RESP-DIST
are presented in detail.
Chapter 5 examines the hypothesis: Given a model of software development aligned
to an iterative and incremental methodology, the COMP-REF technique guides design
decisions to reduce the number of components that fulfill a given set of requirements,
under a set of constraints. In Chapter 6, the hypothesis is extended to The COMP-
REF technique can be refined into the RESP-DIST technique which guides design
decisions to reduce or increase the number of components to best fulfill a given set
of requirements, under a set of constraints. In this chapter, we also explore whether
outsourced and offshore development of software systems – an increasingly widespread
trend in large scale software development of the present – influence ways in which
responsibilities are delegated to components in software systems. We abstract two
points of influence, perceptional asynchrony and locational asynchrony and examine
their influences on how the RESP-DIST technique can be run on a range of projects
representing varying degrees of dispersion in development. The related hypothesis
examined in Chapter 6 is: The RESP-DIST technique can be used to measure the effects
of offshore and outsourced software development on the delegation of responsibilities to
components.
Results from these chapters have been published in [Datta and van Engelen, 2008a],
and [Datta and van Engelen, 2008b].
• When we are trying to leverage the utility of the aspect-oriented software development
paradigm in association with object-oriented technologies, how do we decide whether a
piece of functionality is best modeled as a class or an aspect? Chapter 7 addresses this
5

question by introducing our proposed Crosscutting Score metric. The metric is applied
to an example scenario. The discussion of this chapter is built around validating the
hypothesis: The Crosscutting Score metric can help designers decide whether a piece
of functionality is best modeled as a class or an aspect.
Discussions related to the Crosscutting Score have been published in [Datta, 2006b]
and partly in [Datta and van Engelen, 2008a], and [Datta and van Engelen, 2008b].
• So far we have been solely concerned with functional requirements, that is, what the
system explicitly does for users. However, user experience from a system (as well as
developer interaction with it) is also affected to a large extent by the system’s “ilities”
– usability, reliability, supportability etc. Chapter 8 introduces the metric Fidelity
Register to integrate the FURPS+ model of requirements with use cases. In this
chapter we intend to validate the hypothesis: The Fidelity Register metric can help
integrate the FURPS+ model with use cases.
Materials from this chapter have been published in [Datta, 2005].
• For software development organizations, often a key challenge is deciding which
development methodology to choose for a particular project. The three major options
are the conventional waterfall model, the more recent agile techniques such as extreme
programming, or the Unified Software Development Process. In Chapter 9, the Agility
Measurement Index metric is derived to help organizations make the decision with
more discipline and purpose. In this chapter, the following hypothesis is examined:
The Agility Measurement Index metric can guide the choice of a particular development
methodology that best fits a given project.
Discussions around the Agility Measurement Index have been published in [Datta, 2006a].
• It is very common in large organizations with numerous projects running in parallel to
move around resources between projects to ensure higher customer satisfaction. How
far does this strategy work? Chapter 10 hypothesizes the existence of an entropic
limit beyond which reallocation of resources will not lead to a concomitant increase in
user satisfaction. Inspired by the idea of entropy which indicates disorder and lack of
organized outcome – as an antithesis to the notion of energy – we propose the project-
entropy metric to understand the dynamics of resource allocation across projects
6

[Datta and van Engelen, 2009]. This chapter considers validating the hypothesis: The
Project Entropy metric quantifies the relationship between developer effort and user
satisfaction in a software project.
• Currently, much of software development is in the open-source domain. In Chapter 11
we try to find out whether release times of a large scale open source system can
be predicted from few simple, easily available parameters. The decision-tree based
predictux framework is presented and the results of applying it on a set of releases
of the Linux kernel are discussed [Datta et al., 2009]. In this chapter’s discussion, we
claim that: The Predictux framework can predict the Linux kernel release times by
analyzing publicly available release data.
Across the chapters outlined above, the following software systems were used to validate
the research formulations.
• FSU University Computing Service’s Financial Aid Application – Migration of paper
based student aid application system to a Web based system.
• Morphbank: A Web-based collaborative biological research tool.
• FileZilla – An open source cross-platform file transfer application.
• A software system to execute standard text classification algorithms against bodies
of text, allowing for different algorithm implementations to be added, configured and
used.
• A software system to define, read, and build an object representation of an XML driven
business work flow, allowing manipulation and execution of the workflow through a rich
API interface for the easy addition of workflow operations.
• An email response management system that allows for emails from users across six
product segments to be processed and placed in designated queues for customer
associates to respond, and deliver the responded messages back to the users within
prescribed time limits.
7

• A Web based banking application which provides users the facility to check their profile
and account information, send messages to the bank; and allows administrators to
manage user accounts, transactions, and messages.
• An automated metrics driven tool to guide the software development life cycle
activities.
• SCIT workshop – Two separate groups designed a software system with and without
using some of the techniques developed in this dissertation.
• Linux kernel releases – Publicly available Linux kernel release data.
• Osbert Oglesby Case Study – A detailed text-book case study across software devel-
opment life cycle workflows.
1.3 Summary
In this chapter, I gave an overview of my dissertation research, and outlined the organization
of this dissertation document. The research problems considered in the subsequent chapters
have been outlined, as well as the extent of experimental validation and publication of the
results. In the next chapter, a review of related work is presented.
8
CHAPTER 2
A HISTORICAL OVERVIEW OF RELATED WORK
2.1 Overview
In this chapter, I will review some of the existing work as a historical overview of research
in the area of my dissertation. The journey of the conception and use of metrics in software
engineering, the challenge of changing requirements, the quest for automation in software
design, and recent developments in modeling of software systems are discussed. This is by
no means an exhaustive overview; in following chapters I refer to more specific instances of
related work.
2.2 Metrics in Software Engineering
The study of software metrics has come a long way; yet it has a long way to go. Software
engineering as a discipline is grappling with deepening complexity, more illuminating metrics
are being called upon to aid monitoring, feedback, and decision-making. In this chapter we
survey the study – and to some extent, practice – of software metrics.
Given the centrality of metrics in our research scheme, we summarize the major trends
of software metrics research by the decades in Table 2.1 and Table 2.2. We also highlight
the leading works which contributed towards the trend. This classification is not exhaustive
and intended to give a preliminary idea only. We discuss the details in the following section.
2.2.1 Early Perspectives
Any discussion of software metrics must begin with due deference to the first and probably
still the most visible of all software measures, lines of code (LOC) or its inflated cousin kilo
lines of code (KLOC). LOC is so primal, no definite source can be cited as its origin. It is
perhaps natural that counting lines of program instruction was the very first software metric.
9

Table 2.1: Software Metrics Trends
DECADE MAJOR THEME1970s Efforts at formulating “laws” of software and complexity measures
• Belady and Lehman [Belady and Lehman, 1976],[Belady and Lehman, 1979] scrutinize the behavior of large systems andcome up with their First, Second, and Third Laws of Program EvolutionDynamics.
• McCabe introduces the Cyclomatic Complexity metric [McCabe, 1976].
• Halstead’s book, Elements of Software Science [Halstead, 1977] bringsin new vistas in the study of structure and behavior of software systems.
1980s Building enterprise-wide metrics culture
• Conte et al. [Conte et al., 1986] present an extensive study of howmetrics are used towards productivity, effort estimation, and defectdetection.
• Grady et al. [Grady and Caswell, 1987] report their endeavors in estab-lishing a company-wide metrics program at Hewlett-Packard.
• DeMarco and Lister’s book Peopleware argues strongly infavor of using metrics to enhance organizational productivity[DeMarco and Lister, 1987].
1990s Object oriented measures and quality concerns
• Lorenz et al. [Lorenz and Kidd, 1994] present a set of metrics for thedesign of object oriented systems.
• Chidamber and Keremer [Chidamber and Kemerer, 1991],[Chidamber and Kemerer, 1994] propose the CK suite object orientedmetrics.
• Scott A. Whitemire’s Object Oriented Design Measurement[Whitmire, 1997] builds a rigorous theoretical foundation for objectoriented measurements.
10

Table 2.2: Software Metrics Trends contd.
DECADE MAJOR THEME2000s Measuring across the spectrum: product, people, process, project
• Lanza introduces the Evolution Matrix to understand of software evolu-tion [Lanza, 2001].
• COCOMO II [CSE, 2002] is proposed as a model for estimating cost,effort, schedule.
• Solingen advocates measuring the ROI of SPI [van Solingen, 2004].
Lines of program instruction, after all, is the closest software gets to physical tangibility.
LOC or KLOC gives software “size” in a very blunt sense of the term. Counting the number
of bricks or stone units of the pyramids of Giza will give an idea of the monuments’ size.
But to anyone familiar with the structural brilliance and complexity of the pyramids the
vacuity of such an idea will be apparent. Strangely, even somewhat sadly, to this day many
measures of software are sought to be normalized by somehow bringing in the LOC angle.
LOC was a helpful metric when software systems in general were less complex, and there was
far shallower understanding of the dynamics of working software. In all but trivial systems
of the present, there is almost nothing insightful LOC can measure. Misgivings about the
LOC measure abound in current literature. As an example, Armour [Armour, 2004] cautions
against “counting” LOC and highlights how it is high time now the so-called estimation of
system size through LOC gave way to more mature quests for measuring knowledge content.
One of the reasons why software development – although now accepted to have enough
criticality in our practical lives to be called an engineering – is so less amenable to precise
measurements is the absence of physical laws that underpin other sciences and engineerings.
As Watt S. Humphrey explains so succinctly, “Physicists and engineers make approximations
to simplify their work. These approximations are based on known physical laws and verified
engineering principles. The software engineer has no Kirchoff’s law or Ohm’s law and no
grand concepts like Newtonian mechanics or the theory of relativity.” [Humphrey, 2005]
Ironically, it was the very quest for laws of software that started initial explorations in soft-
11

ware measurement. Belady and Lehman [Belady and Lehman, 1976], [Belady and Lehman, 1979]
scrutinized the behavior of large systems and came up with their First, Second, and Third
Laws of Program Evolution Dynamics respectively as:
1. Law of continual change – A system that is used undergoes continual change until it
is judged to be more cost effective to freeze and recreate it.
2. Law of increasing entropy – The entropy of a system (its unstructuredness) increases
with time, unless specific work is executed to maintain or reduce it.
3. Law of statistically smooth growth – Growth trend measures of global system attributes
may appear to be stochastic locally in time and space, but, statistically, they are
cyclically self-regulating, with well-defined long-range trends.
The beauty of these laws lie in the fact that even three decades after their conception, they
remain so current. The authors backed up their assertions with adequate empirical data,
and introduced sound techniques for understanding and documenting the behaviors of large
systems.
In a paper evocatively titled Metrics and Laws of Software Evolution – The Nineties View
[Lehman et al., 1997] Lehman et al., review their earlier notions twenty years later. Using
results from case studies, the authors conclude, “... The new analysis supports, or better
does not contradict, the laws of software evolution, suggesting that the 1970s approach to
metric analysis of software evolution is still relevant today.”
McCabe’s Cyclomatic Complexity is one of the most widely referenced, (and strongly
contended) quantitative notions for software complexity [McCabe, 1976]. This metric gives
a measure of how difficult testing for a particular module is likely to be; empirical studies have
also established correlations between the McCabe metric and the number of errors in source
code. The derivation of Cyclomatic Complexity is grounded in graph theory and it takes
into considerations factors such as the number of independent paths through code. Based
on practical project data, McCabe concluded that the value of 10 for cyclomatic complexity
serves as a upper limit for module size. McCabe has given a more recent perspective on
software complexity in a paper in Crosstalk [McCabe and Watson, 1994].
Arguably, the very first book devoted entirely to metrics in software engineering is Tom
Gilb’s Software Metrics [Gilb, 1977]. The author, seemingly aware of his pioneering position,
12

comments in the preface, “... I have had few examples to build on, and felt very alone during
the preparation of the text.” As the first attempt at structuring a nascent discipline, the book
does a very good job. It treats the subject with maturity, even touching upon areas such as
“motivational” metrics for human communication, and automating software measurement.
The book ends with reflections on measuring such abstract notions as information, data,
evolution, and stability. The author also provides copious code samples and examples to
corroborate his points. In subsequent years Gilb has gone on to become a metrics guru, with
several percipient works to his credit.
Halstead’s book, Elements of Software Science [Halstead, 1977] introduced significant
new vistas in the study of structure and behavior of software systems. The book highlights
attributes such as program length (N), program volume (V), relations between operators
and operands, and very interestingly, a quantification of “Intelligence Content.” Taking n1,
n2, N1, and N2 to respectively denote the number of distinct operators, number of distinct
operands, total number of operator occurrences, total number of operand occurrences in a
program, Halstead shows that N = N1 + N2 and V = Nlog2(n1 + n2). Program volume
varies with programming language and indicates the volume of information in bits needed to
describe a program. The work illustrates that theoretically a minimum volume must exist
for a particular algorithm; volume ratio is defined as the most compact form of a program
to the volume of the actual program. The rigor of this work’s mathematical treatment is
notable, and many of the ideas are still relevant today, even after close to three decades
of scrutiny. However, consistent with the extant view of software being merely computer
programs, the author presents an overly algorithmic understanding of software. Thus some
of the results have become dated in the light of more recent perception of software systems
in terms of challenges such as concurrency, data volume, performance demands, usability
criteria.
Cavano et al. [Cavano and McCall, 1978] may be credited with the first organized effort
towards a software quality metric. They identify quality dimensions as Product Operations,
Product Revision and Product Transition and factors within these dimensions such as
correctness, reliability, efficiency, integrity, usability, maintainability, testability. The major
contribution of this work is the framework – though rudimentary – that is introduced in
measuring software quality.
Albrecht [Albrecht, 1979] proposed a function-oriented metric which has subsequently
13
gained wide currency: the function point. Function points are computed using the experi-
mental relationship between the direct measures of the software’s information domain and
estimation of its complexity on a weighted scale. The information domain values are based
on the following criteria: number of user inputs, number of user outputs, number of user
inquiries, number of files, number of external interfaces. Once they are computed, function
points are used in a manner similar to lines-of-code to normalize measures for software
productivity, quality, and other attributes such as, errors per function point, defects per
function point etc. Feature points – an extension of the function point idea was suggested
by Jones [Jones, 1991]. This is a superset of the function point measure, and in a sense it
expands the former’s domain of applicability from business information system applications
to general software engineering systems. In addition to the information domain values of
function points, feature point identifies a new software characteristic – algorithms, which
Jones defines as “a bounded computational problem that is included within a specific
computer program.” The main benefit of function and feature point based approaches is
highlighted as their programming language independence. But detractors often point out,
these technique involve some “hand-waving”, i.e. there is notable influence of subjective
judgment vis-a-vis objective analysis.
2.2.2 A Maturing Discipline
Somewhat similar to the overall intent of the function point metric, the bang metric developed
by DeMarco [DeMarco, 1982] “is an implementation independent indication of system size.”
Calculating the bang metric involves examining a set of primitives from the analysis model
– atomic elements of analysis that can not be broken down further. Following are some of
the primitives that are counted: functional primitives, data elements, objects, relationship,
states, transitions. DeMarco asserts that most of software can be differentiated into the
types function strong or data strong depending on the ratio of the primitives, relationships
and functional primitives. Separate algorithms are given for calculating the bang metric for
these two types of applications. After calculation of the bang metric, history of completed
projects can be used to associate it with time and effort.
Conte et al. [Conte et al., 1986] present an extensive study of the state of the art of
software metrics in the mid 1980s. Expectedly, the introductory material covers arguments
and counter arguments for regarding software as an engineering vis-a-vis a science. The only
14

development methodology considered is the Waterfall model, and the authors base their
metrics view on the physical attributes of code such as size and volume. The book also
introduces some models for productivity, effort estimation, and defect detection.
Grady et al. [Grady and Caswell, 1987] report their endeavors at establishing a company-
wide metrics program at Hewlett-Packard in the 1980s. The book underscores many of the
challenges large organizations face in producing industrial software, and how a consistent
metrics culture can help deliver better solutions. This work remains memorable for the first
exposition of the FURPS (Functionality-Usability-Reliability-Performance-Supportability)
approach to classifying requirements: this approach has since become a de-facto industry
standard. Some extensions to this approach through a metrics based technique can be
found in a paper titled Integrating the FURPS+ Model with Use Cases - A Metrics Driven
Approach by Datta [Datta, 2005].
DeMarco and Lister’s modest sized book Peopleware [DeMarco and Lister, 1987] is the
fount of many a lasting wisdom of the software trade. The title of the first chapter has become
something of a shibboleth, “Somewhere Today, A Project Is Failing.” The book unravels the
chemistry of diverse factors – technological, social, political, and inter-personal – that go
into the making of successful software. Although not entirely devoted to software metrics,
the authors come up with many schemes to measure various dimensions of the development
process. Though often lacking in pedagogy, these measures are intuitive and easy to use.
The Environmental Factor or E-Factor is a good example. While discussing the effect of
environmental factors on the quality of developer effort, the E-Factor is defined as a ratio of
“uninterrupted hours” to “body-present hours.” Empirical data cited by the authors show
large variation of E-Factor values from site to site within the same organization, and higher
values closely correspond to instances of higher personnel productivity. Similar insights make
Peopleware a classic work on software engineering.
2.2.3 Towards A Deeper Perception
Baker et al. [Baker et al., 1990] calling themselves the “Grubstake Group” in a jocular vein,
present a serious view of the state of software measurements. The authors are convinced of
the need to create an environment for software measures, which can only be done, “... if
there exists a formal and rigorous foundation for software measurement. This foundation
will not have to be understood by the users of the software measures, but it will have to be
15

understood by those who define, validate, and provide tool support for the measures.” The
paper applies notions of formal measurement theory to software metrics, stressing on the
need for the identification and definition of:
• Attributes of software products and processes.
• Formal models or abstractions which capture the attributes.
• Important relationships and orderings which exist between the objects (being modeled)
and which are determined by the attributes of the models.
• Mappings from the models to number systems which preserve the order relationships.
The authors also rue “...a general lack of validation of software measures” and highlight
the role of sound validation schemes towards the reliability of a software measure. In
summary, the paper establishes that software metrics should and can be developed within a
measurement theory framework.
Card et al. [Card and Glass, 1990] have defined three software design complexity
measures, structural complexity, data complexity, and design complexity. The structural
and design complexity measures use the fan-out idea which indicates the number of modules
immediately subordinate to a module, i.e. which are directly invoked by the module. System
complexity is defined as the sum of the structural and data complexities. The authors
conjecture that as each of these complexities increase, overall architectural complexity of the
system also increases, leading to heightened integration and testing efforts.
Similar to Grady et al.’s report of initiating a metrics program at their organization
discussed earlier, Daskalantonakis [Daskalantonakis, 1992] has recounted the experience of
implementing software measurement initiatives at Motorola. Based on the practical issues
faced during implementation, the author concludes that metrics can expose areas where
improvement is needed. Whether or not actual improvement comes about depends entirely
on the actions taken on the results of analyzing metrics data. This paper highlights
the important learning that metrics are only the means to an end; the ultimate goal of
improvement comes through measurement, analysis, and feedback.
Extending the discussions of his earlier book on introducing metrics in a large organi-
zation, Grady [Grady, 1992] points to the twin benefits of using metrics - expedient project
16

management, and process improvement. Grady first takes up the tactical application of
software metrics in project management and follows it up by the strategic aspects in process
improvement. The book gives a rare insight into the human issues of applying metrics in
a chapter titled “Software Metrics Etiquette”, which has a number of enduring messages,
most notably that metrics are not meant to measure individuals. Lack of understanding of
this cardinal credo has lead, and still leads, to the failure of many metrics initiatives.
Layout appropriateness is a metric proposed by Sears [Sears, 1993] for the design of
human-computer interfaces. The metric seeks to facilitate an optimal layout of graphical
user interface (GUI) components that is most suitable for the user to interact with the
underlying software. Sears’ work stands out among one of the few metric formulations for
understanding human-computer interfaces.
Davis et al. [Davis et al., 1993] suggest a set of metrics for gauging the quality of the anal-
ysis model, based on corresponding requirement specifications: completeness, correctness,
understandability, verifiability, internal and external consistency, achievability, concision,
traceability, modifiability, precision, and reusability. Many of these attributes are usually
considered deeply qualitative. However the authors establish quantitative metrics for each.
As an example, specificity (i.e. lack of ambiguity) is defined as a ratio of the number of
requirements for which all reviewers had identical interpretation, to the total number of
requirements.
Summarizing his experiences with implementing metrics programs in a large organization,
Grady puts forward a set of tenets in his article Successfully Applying Software Metrics
[Grady, 1994]. He highlights four main areas of focus which contribute substantially to the
outcome of the overall metrics effort: project estimation and progress monitoring, evaluation
of work products, process improvement through failure analysis, and experimental validation
of best practices. In conclusion, Grady gives the following three recommendations for project
managers involved in a metrics initiative.
• Define your measures of success early in your project and track your progress towards
them.
• Use defect data trends to help you decide when to release a product.
• Measure complexity to help you optimize design decisions and create a more maintain-
able project.
17

Paulish et al. [Paulish and Carleton, 1994] report results of measuring software process
improvement initiatives in Siemens software development organizations. The authors’
recommendation include:
• Use of Capability Maturity Model.
• Conducting assessments to start software process improvement programs.
• Selecting a few process improvement methods and implementing them diligently.
• Paying equal or more attention to the implementation of the method tha to the method
itself.
• Recognizing the variation in the ease of introduction and implementation across process
improvement methods.
Lorenz et al. [Lorenz and Kidd, 1994] present a set of metrics for the design of
object oriented systems as well as projects that develop such systems. Building up from
basic concepts such as inheritance and class size, the authors introduce metrics to better
understand and control the development process. A selection of the metrics include class
size, number of operations overridden by a subclass, number of operations added by a subclass,
specialization index etc. Some metrics are backed up by empirical results from projects
implemented in languages such as Smalltalk, C++ etc.
One of the most widely referenced set of object oriented metrics were put for-
ward by Chidamber and Keremer in two related papers [Chidamber and Kemerer, 1991],
[Chidamber and Kemerer, 1994]. The set has come to be called the CK metrics suite and
consists of the six class-based design metrics with explanatory names: weighted methods
per class, depth of inheritance tree, number of children, coupling between object classes,
response for a class, and lack of cohesion in methods. In the latter paper, the authors
provide analytical evaluation of all the metrics and claim that, “this set of six metrics is
presented as the first empirically validated proposal for formal metrics for OOD.” The paper
also mentions several applications of these metrics in the development of industrial software.
Weller tackles the practical yet contentious issue of using metrics to manage software
projects [Weller, 1994]. Three levels of project management are suggested and the expediency
metrics can bring to each highlighted. The author concludes that defect data can be used as
18

a key element to improve project planning. However, he mentions the biggest bottleneck of
any defect data based approach to be developers’ reluctance for sharing such data with the
management. This, and other human aspects of metrics based approaches remains a lasting
challenge of the software engineering discipline.
Fenton in his paper Software Measurement: A Necessary Scientific Basis [Fenton, 1994]
argues strongly in favor of adhering to fundamental measurement theory principles for
software metrics. He also asserts, “...the search for general software complexity measures
is doomed to failure” and backs up his claim with detailed analysis. The paper reviews
the tenets of measurement theory that are closely allied to software measurement, and
suggests a“Unifying Framework for Software Measurement.” Fenton also stresses on the
need to validate software measures. The author mentions that in his observation, the most
promising formulations of software metrics have been grounded in measurement theory.
Usually studies on software metrics tend to neglect post delivery woes. Whatever happens
in the realm of the loosely labeled “maintenance” is seldom subjected to systematic scrutiny.
A notable exception is the IEEE suggested software maturity index (SMI) [IEEE, 1994] that
reflects on the level of stability of a software product as it is maintained and modified through
continual post production releases. Denoting the number of modules in the current release,
the number of modules in the current release that have been changed, the number of modules
in the current release that have been added, and the number of modules from the preceding
release that were deleted in the current release respectively as MT , Fc, Fa, Fd, the formula is
given as SMI = [MT − (Fa + Fc + Fd)]/MT . As SMI approaches 1.0, the product begins
to stabilize. Although maintenance issues can arise independent of the modules added or
modified, such as lack of user awareness, environmental failures etc., the SMI is indeed a
valuable abstraction for quantifying post delivery challenges for large software systems.
Binder [Binder, 1994] underscores the importance of metrics in object oriented testing.
In fact software testing, on account of its easily quantifiable inputs (effort in person-hours,
number of units being tested etc.) and outputs (number of defects, defects per unit etc.) is
the development activity most amenable to measurement.
Cohesion and coupling are powerful ideations of some inherent characteristics of com-
ponent interaction. In a way, they can be viewed as the yin and yang of software design,
contrary yet complementary forces that influence component structure and collaboration.
Biemman et al. [Bieman and Ott, 1994] have studied cohesion of software components in
19

great detail. They present a set of metrics, defined in terms of the notions of data slice,
data tokens, glue tokens, superglue tokens, and stickiness. The authors develop metrics for
strong functional cohesion, weak functional cohesion, and adhesiveness (the relative measure
to which glue tokens bind data slices together). All of the cohesion measures have values
between 0 and 1. Dhama [Dhama, 1995] proposes a metric for module coupling subsuming
data and control flow coupling, global coupling, and environmental coupling. The module
coupling indicator, makes use of some proportionality constants whose values depend on
experimental verification.
Basili et al. have adapted the Goal-Question-Metric approach to software development
[Basili et al., 1994]. According to the authors, “The Goal Question Metric (GQM) approach
is based upon the assumption that for an organization to measure in a purposeful way it
must first specify the goals for itself and its projects, then it must trace those goals to the
data that are intended to define those goals operationally, and finally provide a framework
for interpreting the data with respect to the stated goals.” This measurement model has
three levels: conceptual level (GOAL), operational level (QUESTION), and quantitative
level (METRIC). The approach is ultimately a “a mechanism for defining and interpreting
operational and measurable software. It can be used in isolation or, better, within the
context of a more general approach to software quality improvement.”
Churcher et al. [Churcher and Shepperd, 1995] make an important point underlining the
preoccupation with class as dominant entity of interest in object oriented measurements,
“Results of recent studies indicate that methods tend to be small, both in terms of number
of statements and in logical complexity [Wilde et al., 1993], suggesting that connectivity
structure of a system may be more important than the context of individual modules.” The
work of Lorenz et al. [Lorenz and Kidd, 1994] defines three simple metrics that analyze
the characteristics for methods: average operation size, operation complexity, and average
number of parameters per operation.
Berard [Berard, 1995] examines the special place object-oriented metrics have in the
study of software metrics. He identifies five points that set apart OO metrics:
• Localization
• Encapsulation
• Information hiding
20

• Inheritance
• Object abstraction techniques
In the introductory part of the article, the author asserts: software engineering metrics are
seldom useful in isolation, “ ... for a particular process, product, or person, 3 to 5 well-chosen
metrics seems to be a practical upper limit, i.e., additional metrics (above 5) do not usually
provide a significant return on investment.”
Humphrey’s Personal Software Process (PSP) [Humphrey, 2005] and Team Software
Process (TSP) [Humphrey, 2006] have found wide currency in the industry as effective
methodologies for enhancing productivity of software development practitioners and teams.
In a paper titled Using a Defined and Measured Personal Software Process [Humphrey, 1996],
Humphrey demonstrates how measurements can assist in the understanding and implemen-
tation of individual skills and expertise. A cornerstone of Humphrey’s techniques lie in
continual monitoring of the development process, and metrics can go a long way towards
this end.
Garmus et al. [Garmus and Herron, 1996] introduce functional techniques to measure
software process. Their approach is based primarily on function point analysis, which is
customized towards process measurement. The chapter on the success stories from applying
these methods certainly adds weight to the arguments.
Scott A. Whitemire’s Object Oriented Design Measurement [Whitmire, 1997] is a seminal
work in the study of object oriented metrics. Whitemire is rigorous in his treatment:
putting measurement into context, building up the theoretical foundations, and capturing
design characteristics through his metrics. Whitemire proposes metrics to cover aspects of
size, complexity, coupling, sufficiency, completeness, cohesion, primitiveness, similarity, and
volatility. Within each area, motivations and origins, empirical views, formal properties,
empirical relational structures, potential measures etc. are discussed. The author presents
an original perspective on many issues of software measurements. The most important
contribution of Whitemire’s book is the establishment of a sound mathematical framework
for understanding and measuring by far the most recondite activity of software development,
design. The book’s intense focus on rigor also leads to a drawback. The grind of industrial
software development hardly leaves practitioners with the latitude to master the theory that
is necessary to fully understand and apply Whitemire’s results.
21

Harrison et al. [Harrison et al., 1998] have reviewed a set of object oriented metrics
referred to as the MOOD Metrics Set [Abreu, 1995]. The set includes the metrics, method
inheritance factor, coupling factor, polymorphism factor etc. The reviewers examine the
validity of these metrics in the light of certain criteria and conclude, “as far as information
hiding, inheritance, coupling, and dynamic binding are concerned (with appropriate changes
to existing problematic discontinuities) the six MOOD metrics can be shown to be valid
measures ...” within the theoretical framework they had chosen.
In the keynote address titled OO Software Process Improvement with Metrics, Henderson-
Seller underlines vital links between product and process metrics [Henderson-Sellers, 1999].
He also explores the interconnections of measurement and estimation, and outlines his vision
for a software quality program. While summarizing his discussion, the author makes a very
important point, “... instigating a metrics programme does not bring immediate ’magical’
answers to all software development. It cannot and should not be used to assess the
performance of the developers themselves; nor can it create non-existent skills in developers
... A metrics programme (sic) provides knowledge and understanding; it does not provide
quick fixes.”
Wiegers, in an article titled, A Software Metrics Primer [Wiegers, 1999] goes deep into
the insights of software measurements. The author gives the following list of “appropriate
metrics” for three categories of software engineering practitioners:
• Individual developers – work effort distribution, estimated vs. actual task duration
and effort, code covered by unit testing, number of defects found by unit testing, code
and design complexity.
• Project teams – product size, work effort distribution, requirements status (number
approved, implemented, and verified), percentage of test cases passed, estimated
vs. actual duration between major milestones, estimated vs. actual staffing levels,
number of defects found by integration and system testing, number of defects found
by inspections, defect status, requirements stability, number of tasks planned and
completed.
• Development organization – released defect levels, product development cycle time,
schedule and effort estimating accuracy, reuse effectiveness, planned and actual cost.
22

Though far from an exhaustive list, this provides a valuable starting point for metrics
orientation. Wiegers also gives several “tips for metric success”: start small, explain why,
share the data, define data items and procedures, understand trends. This article has notable
motivational value for people and organizations starting out with software metrics.
2.2.4 Metrics in the New Millennium
Demeyer et al. [Demeyer et al., 2000] “... propose a set of heuristics for detecting refactorings
by applying lightweight, object-oriented metrics to successive versions of a software system.”
The authors make the following assumptions regarding the implications of certain structural
changes in the code:
• Method Size – A decrease in method size is a symptom method split.
• Class Size – A change in class size is a symptom for a shift of functionality to sibling
classes (i.e., incorporate object composition). Also, it is part of a symptom for the
redistribution of instance variables and methods within the hierarchy (i.e.,optimization
of class hierarchy).
• Inheritance – A change in the class inheritance is a symptom for the optimization of a
class hierarchy.
While these assumptions are not beyond contention – for example, a method may shrink
in size due to the introduction of a smarter algorithm, not necessarily indicative of method
split – the authors show important correlations between refactoring and design drift and how
metrics can aid in identifying and understanding them.
Pressman treats the discipline of software metrics deeply in his wide-ranging book
Software Engineering: A Practitioner’s Approach [Pressman, 2000] – the standard text for
many graduate courses. Pressman makes a distinction between the so called technical metrics
which seek to capture the progression and behavior of the software product, vis-a-vis the
metrics relevant for project management and process compliance. The book also devotes an
entire chapter to metrics related to object-oriented systems.
Sotirovski [Sotirovski, 2001] underlines the inherent challenges of iterative software
development, “... If the iterations are too small, iterating itself could consume more energy
than designing the system. If too large, we might invest too much energy before finding out
23

that the chosen direction is flawed.” To tackle this quagmire, the author highlights the role
of heuristics in iteration planning and monitoring. Successful metric efforts frequently lead
to the encapsulation of their wisdom in heuristics. And in the absence of physical laws to
fall back upon, heuristics are often vital to expedient software design and implementation.
Lanza takes an unconventional and interesting approach towards a metrics based un-
derstanding of software evolution [Lanza, 2001]. The author proposes an Evolution Matrix
which, “... displays the evolution of the classes of a software system. Each column of the
matrix represents a version of the software, while each row represents the different versions
of the same class.” Based on this construct, classes are categorized into groups with maverick
names: Pulsar, Supernova, White Dwarf, Red Giant, Stagnant, Dayfly, and Persistent. Based
on case study data Lanza delineated phases in a system’s evolution characterized by specific
categories of classes. Though the paper points out several limitations of the approach, it
remains a novel perspective on the mutation of software systems.
Understanding and mitigating the effects of change on enterprise software system remains
an important concern of software engineering research. It is interesting to note how Kabaili
et al. [Kabaili et al., 2001] have tried to interpret cohesion as a changeability indicator for
object-oriented systems. The authors seek to establish a correlation between cohesion and
changeability and have used empirical data from C++ projects to support their assertions.
However in conclusion, the authors comment that based on their studies, coupling, vis-a-vis
cohesion appears to be a better changeability indicator. This study presents a novel approach
on how design characteristics may reveal more than they are initially intended to.
Mens et al. in their paper, Future Trends in Software Evolution Metrics, underline the
relevance of predictive analysis and retrospective analysis in studying software evolution
[Mens and Demeyer, 2001]. They mention the following areas as promising fields of future
metrics research, in spite of the fact some of them have already been closely examined:
• Coupling or cohesion metrics
• Scalability issues
• Empirical validation and realistic case-studies
• Long term evolution
• Detecting and understanding different types of evolution
24

• Data gathering
• Measuring software quality
• Process issues
• Language independence
Ramil et al. [Ramil and Lehman, 2001] study the relevance of applying measurements to
long term software evolution processes and their products. An example using empirical data
from the Feedback, Evolution, and Software Technology (FEAST) program is presented.
The example illustrates the use of a sequential statistical test (CUSUM) on a suite of eight
evolution activity metrics. The authors underline the need for precise definition of metrics,
as small differences in defining can lead to inordinately large divergence in the measured
values.
Rifkin [Rifkin, 2001] takes a perspective view of why software metrics are so difficult
to put into practice, given the business needs enterprise software has to fulfill first. Four
different software development domains are reviewed and their attitudes to measurements
compared: Wall Street brokerage house, civilian government agency, computer services
contractor, the nonprofit world. The author advocates a measurement strategy suited to
each type of organization, and concludes, “We need to develop a whole new set of measures
for all those customer–intimate and product–innovative organizations that have avoided
measurement thus far.”
Fergus, in his book How to Run Successful Projects III – The Silver Bullet in apparent
allusion to the classic essay in Brooks’ classic book The Mythical Man-Month: Essays on
Software Engineering [Brooks, 1995] discusses how measurement techniques can make great
difference to the outcome of projects [O’Connell, 2001]. His probability of success indicator
(PSI) metric is especially insightful.
Software measurement initiatives in an organization usually focus on the concrete, from
lines of code, developer productivity and the likes. Buglione et al. [Buglione and Abran, 2001]
investigate how creativity and innovation at an organizational level can be measured. Based
on the structure of commonly used software process improvement models such as CMMI and
P–CMM, the authors view how both process and people aspects of creativity and innovation
can be measured.
25

COCOMO and COCOMO II [CSE, 2002] are primary among several models for esti-
mating cost, effort, and schedule of software development activity. These are useful in
the planning and execution of large software projects. It consists of three sub models:
application composition, early design, and post-architecture. The original COCOMO was
first published by Boehm in 1981 [Boehm, 1981] and this work still remains the best
introductory reference to the model. The COCOMO model has been kept current by regular
updates and refinements, as software engineering has undergone many paradigm shifts from
1981 till date.
Clark, in an article titled Eight Secrets of Software Measurement [Clark, 2002] enumerates
some tricks of making a software measurement scheme work. Some of the eight “secrets”,
not unexpectedly, sound somewhat cliched. But the author still makes some perceptive
observations such as “... measurement is not an end in itself; its a vehicle for highlighting
activities and products that you, your project team, and your organization value so you can
reach your goals.”
Fenton et al. [Fenton et al., 2002] argue the typical way of using software metrics is
detrimental to effective risk management. They identify two specific roles of software
measurement as quality control, and effort estimation and point to most commonly used
factors to assess software while it is being developed as complexity measures, process
maturity, and test results. The problems with widely used regression models are discussed.
The authors recommend a Bayesian network based defect prevention model, and explain
details of the AID (assess, improve, decide) tool built on it. The authors see the dawn of
“an exciting new era” in software measurement with wider applications of Bayesian networks.
Krutchen in his widely referenced book on the Rational Unified Process [Krutchen, 2004]
makes an important categorization of measures. He calls measure “a concrete numeric
attribute of an entity (e.g., a number, a percentage, a ratio)” whereas primitive measure
is “an item of raw data that is used to calculate a measure.” The book only mentions
measurement in the context of the project management discipline, which may be viewed as
a gratuitous constriction of the scope of metrics. Effective metrics, in addition to facilitating
project management, may and can aid the planning and execution of developer and team
activities.
In their book Software by Numbers, Denne et al. [Denne and Cleland-Huang, 2004]
introduce the ideas of Incremental Funding Methodology (IFM), Minimum Marketable
26

Feature (MMF) etc., to facilitate business decisions in enterprise software development. This
work makes a notable attempt at bridging the seemingly “never the twain shall meet” chasm
between those who build software and those who commission the building of software.
Eickelmann makes an interesting distinction between the measurements of maturity and
process in the context of the CMM levels [Eickelmann, 2004]. The author underlines that
an organization’s process maturity can be viewed from multiple perspectives and reflects on
the cost of quality across various levels.
Return on investment (ROI) and Software Process Improvement (SPI) are two of the most
audible buzzwords in the software engineering industry today, customarily called by their
acronyms. Solingen addresses the cornerstone of ROI and SPI by establishing the practicality
of measuring the former in terms of the latter [van Solingen, 2004]. The author bases his
discussion on the ROI numbers for several major software development organizations across
the world.
Rico [Rico, 2004] examines how the use of metrics by project managers and software
engineers alike can lead to better return on investment on software process improvement. The
book discusses investment analysis, benefit analysis, cost analysis, net present value etc. and
integrates these ideas within the parameters of established methodologies such as Personal
and Team Software Processes, Software Capability Maturity Model, ISO 9001. Although the
author’s focus is primarily on process improvement rather than the development process,
there are interesting pointers to the positioning of metrics in the “bigger picture” of the
development enterprise.
Continuing on the ROI theme, Pitt’s article Measuring Java Reuse, Productivity, and
ROI [Pitt, 2005] uses the effective lines of code (ESLOC) metric to measure the extent of
reuse in Java code and the resultant return on investment achieved. The author reaches some
expansive conclusions, but the choice of the ESLOC metric may not reflect all significant
nuances of a software system. Also, the author’s remark that “Many elements are generated
from an IT project, but arguably the most important element is the source code” is open
to counter arguments. With increasing trends towards model driven development, larger
and larger portions of source code are being automatically generated; analysis and design
artifacts (that finally drive code generation) can lay legitimate claims to being the so called
“most important element.”
27

Bernstein’s work [Bernstein and Yuhas, 2005] embodies a modern outlook to software
measurements: metrics should not only reflect the merely the countable aspects of a software
product, such as lines of code, but must encompass the spectrum of people, product, process,
and project that makes up software engineering in totality. The author presents interesting
quantitative strategies on software development. However, some chapters present ready
nuggets of wisdom, modulated as “Magic Number” – for example, in Page 142 it is stated,
“The goal for the architecture process is to reduce the number of function points by 40% ”
– which seem somewhat arbitrary.
Napier et al. in their book Measuring What Matters: Simplified Tools for Aligning Teams
and Their Stakeholders [Napier and McDaniel, 2006] discuss techniques for management to
harness the potential of measurement seamlessly and painlessly. The book provides several
interesting measurement templates and leverages the industry experience of the authors to
significant effect.
In this section, we traced the course of development of software metrics from its earliest
forms to the present. As new ways of conceiving and constructing software are being
introduced, ways of devising, applying, and interpreting software metrics are also undergoing
significant changes.
2.3 The Challenge of Changing Requirements
Requirements are, in a way, the very raison d’etre of enterprise software systems. The
dynamic nature of business and technological environments in which present day enterprise
applications require to function have lead to an enhanced focus on requirement management.
The main issue with requirements is that they change. And when they do, the whole
development process, as well as the software product being developed stands to be affected.
We have proposed a mechanism to gauge the effects of changing requirements on system
design and modify the design accordingly [Datta and van Engelen, 2006]. In this section, we
review some of the other studies in this area.
Lam et al. in the paper Requirements Evolution in the Midst of Environmental Change:
A Managed Approach [Lam and Loomes, 1998] report their findings on the EVE (EVolution
Engineering) project to develop techniques for dealing with evolving requirements. The
authors recognize four basic types of change:
28

• Environment change (E-change)– These are changes that occur within the environment,
e.g. usability breakdowns, the introduction of new laws, policy changes and volatile
business circumstances.
• Requirement change (R-Change) – These are new (or modified) requirements. R-
changes are derived from an analysis of E-changes.
• Viewpoint change (V-Change) – also called impact. R-changes, if implemented, are
likely to impact stakeholders in different ways.
• Design change (D-Change) – R-changes may have implications to the existing design
of the system, known as D-changes.
An interesting point is made in the paper: as software systems play an increasingly important
role within society, any attempt to change them must be accompanied by an assessment of
social and environmental impact.
An important aspect of requirements elicitation is to develop a sense of how much value
a particular requirement has for the users. All requirements can not be equally important;
and understanding this differential is vital to deliver software that satisfies user needs.
Karlsson et al. [Karlsson and Ryan, 1997] describe a cost-value approach for prioritizing
requirements. The authors advocate the use of the “ Analytic Hierarchy Process, which
compares requirements pairwise according to their relative value and cost.” Results from a
case study of the fourth release of one Performance Management Traffic Recording project
are furnished to establish the usefulness of the approach. The authors believe that the
cost-value approach will facilitate trade-off analysis that is significantly lacking in software
engineering.
The so-called “softness” of software has been taken to mean many things. Sometimes
it points to the seeming malleability of the software medium, at others (notably during
the dot-com-dot-bust times) the word insinuated volatility of the fortunes of software trade.
Stiemerling et al. take a less exciting and more sensible connotation of softness in their paper
How to Make Software Softer - Designing Tailorable Applications [Stiemerling et al., 1997].
They demonstrate how the notions of “evolutionary and participative software-engineering”
can be combined with tailorability to provide sound software solutions for application areas
marked by differentiation and dynamics. The authors focus on end-user tailoring and
29

recommend strategies such as interviews, workshops, user advocacy, thinking aloud, mockups
and prototyping. Empirical data from a couple of projects are presented to bolster the main
thrust of making software development a more participative activity, thereby enhancing
scope of better fitting user needs.
Kemerer et al. [Kemerer and Slaughter, 1999] conclude prior research in software evo-
lution was mainly limited to two major areas: understanding and describing the dynamics
of software evolution and developing a taxonomy of maintenance categories. The authors
advocate the need for a more “longitudinal” research of software maintenance and present
an approach that “enlarges the scope of the empirical data available on software evolution
so that evolution patterns could be examined across multiple levels of analysis (system and
module), over longer periods of time, and could be linked to a number of organizational
and software engineering factors.” A large scale database chronicling of the historical growth
and change of twenty three software applications spread over two decades is reported, which
the authors believe can serve as valuable reference for future studies in this direction. The
authors also believe this corpus of empirical data can be used in simulations to predict the
occurrence of evolution patterns in software systems.
Leffingwell et al. present an “unified approach” for managing software requirements
[Leffingwell and Widrig, 2000]. They define requirements management as “a systematic
approach to eliciting, organizing, and documenting the requirements of the system, and
a process that establishes and maintains agreement between the customer and the project
team on the changing requirements of the system.” The key point to note is how the event of
requirement change (and the allied need for concurrence among stakeholder on the cause and
consequence of such change) is integrated within the very definition. The authors develop
the book’s idea as seven team skills starting from analyzing the problem to building the right
system. The book introduces a set of easy and intuitive techniques towards more efficient
way of working with requirements.
Continual change in software systems have been thought to usher in a process of
irreversible disorder. Bianchi et al. [Bianchi et al., 2001] have studied software degradation
using the idea of entropy. Entropy, in the author’s view, is a class of metrics to assess the
degree of disorder in a software system traceability. Rigorous definitions of entropy are given,
based on enhancements of earlier work. The authors concentrate their entropy interpretations
on three primary factors: direct measures of software degradation, the number of detected
30

defects, maintenance effort and the number of slipped defects. Although the paper has
notable empirical data, the authors mention the need for more, in order to give their
formulations a firmer footing.
With increasing complexity of enterprise software systems, the perspective of crosscutting
functionality has been found to be helpful in terms of design and maintenance. Baniassad
et al. in their paper Managing Crosscutting Concerns During Software Evolution Tasks:
An Inquisitive Study [Baniassad et al., 2002] examine the relevance of crosscutting notions
as software systems undergo evolutionary changes. The authors conclude that while
implementing changes in existing software systems, developers frequently face difficulties
in the management of crosscutting code. The authors identified three different strategies
usually employed by developers in such situations:
• Altering the crosscutting code to accommodate change.
• Making the change work in the context of the crosscutting code.
• Working around the crosscutting code.
The paper concludes that Aspect Oriented Programming (AOP) solutions can be helpful in
addressing the continual change of software systems. On a related theme, the paper titled
Crosscutting Score - An Indicator Metric for Aspect Orientation [Datta, 2006b] proposes a
metric to help decide which component is best modeled as aspect vis-a-vis a class.
In the context of evolving systems, Demeyer et al. [Demeyer et al., 2001] confront a
touchy topic of software engineering research: how reliable and rigorous are many of the
case studies whose results are cited to corroborate new techniques? The authors flay the
use of carefully crafted “toy” scenarios that unduly lean in favor of the approach being
presented. A detailed review of case study tools and techniques is followed by a set of open
questions which the authors feel needs to be addressed by the research community: Does
it make sense to define benchmarks? Are the characteristics complete/minimal? Are the
cases representative? Are the cases replicable? The paper highlights the importance of
benchmarks in setting up standard methods to compare and evaluate different techniques of
describing software evolution.
Sagheb-Tehrani et al. present the following three techniques for managing business rules
and requirements [Sagheb-Tehrani and Ghazarian, 2002]:
31

• Categorize requirements into logically coherent categories and sub-categories.
• Categorize business requirements and rules according to basic operations (Domain
processes) in the domain.
• Use predefined tags to indicate the current status and attributes of each requirement.
The authors mention the rules to be amenable to implementation using CASE tools.
Although these are helpful pointers, sometimes such clear-cut categorization may not be
practicable as requirements may span across categories.
Cleland-Huang et al. [Cleland-Huang et al., 2003] seek to establish that an event-
notification based traceability model can significantly improve the state-of-the-art in the
maintenance of artifacts that stand to be affected as a system undergoes changes. In their
system, traceable artifacts need not be closely bound together to keep them in sync, but
are loosely connected via an event service that helps update affected artifacts in the event
of changes. The paper demonstrates the effectiveness of Event Based Traceability method
through an example change management scenario. This study makes important contribution
in a situation where it is almost the rule than exception that system artifacts will be outdated
once a project moves into production, capturing none of the subsequent enhancement and
maintenance updates.
“Requirements interaction management (RIM) is the set of activities directed toward the
discovery, management, and disposition of critical relationships among sets of requirements
... .” Robinson et al. [Robinson et al., 2003] make a detailed survey of the discipline
through an issue-based framework for reviewing processes and products. They point out
four areas which require further attention before RIM can become more widely practiced:
strategies, integration, visualization, and case studies and experiments. Once these issues are
addressed, the authors believe that RIM has the potential to become a critical component
of requirements engineering.
Davis’ book Great Software Debates [Davis, 2004] is a source of many rich and promising
ideas in the practice of software engineering, and in particular, in the field of requirements
engineering which is the author’s special interest. With zest and humor Davis makes a
persuasive point of the need to understand that success with software requirements call for a
range of skills, including some very “human” ones. He also describes how many – almost all
– ills of software development may have their origin in inadequately managed requirements.
32

Gonzales in her article Developing the Requirements Discipline: Software vs. Systems
[Gonzales, 2005] makes a strong case for integrating the system and software engineering
attitude and approaches to requirements management. The author rues the “cultural
differences” that exist between the two communities and calls for the diffusion of ideas
that can benefit both. The article gives a timeline of the development of the two disciplines
which limns some of the reasons for their unaligned perspectives on requirements. The
authors views clearly bring out the multi-cultural and multi-disciplinary awareness that has
become vital for successful management of software requirements.
In this section, we discussed several approaches for managing requirements and their
changes. In the ideal world of Waterfall driven development, requirements once documented
were not supposed to change. But they do, and that is why Waterfall has given way to the
iterative and incremental model. With this paradigm shift, issues with changing requirements
are increasingly coming to the fore. This is a phenomenon of the past decade, and one which
is still being actively investigated.
2.4 A Brief Overview of Automated SoftwareDevelopment
In this chapter we survey efforts at automating different activities of software development.
Automation is an expansive term; and one which is used to mean many things in many
contexts. Our points of interest are mechanisms that seek to automate decisions, and not
merely the drudgery, of software development.
Freeman’s paper, Automating Software Design, is one of the earliest expositions of the
ideas and issues relating to design automation [Freeman, 1973]. The author starts from
the basics by defining terms such as program, software, design, and creation and explores
two paradigms of semi-automated and automated software creation. Important distinctions
between design automation and program automation are made, and the needs of knowledge
representation and structuring of problem solving skills highlighted. Although the paper
hardly delves deeply into the automation issues that have subsequently assumed importance,
it is a significant work in terms of an overview of automation ideas in the 1970s.
Karimi et al. [Karimi and Konsynski, 1988] report their experiences with the implemen-
tation of an automated software design assistant tool. The authors accept that the software
design process is difficult to generalize, as it depends to a large extent on personal judgment
33

and individual styles and preferences. However, in their opinion striking similarities exist in
spite of the unique nature of each design effort. Several “manual” design methodologies are
first reviewed, followed by the description of the process of development of a computer aided
tool that offers “intelligent assistance” in the “determination of program modulus in the
design of software.” The paper describes the mechanism used to derive a set of quantifiable
measures towards a “scientific” basis for automated design assistance. The results cited in
the paper were reached through the use of a process structuring workbench called Computer
Aided Process Organization (CAPO) which seeks to derive “... a nonprocedural specification
of modules, given the logical model of a system.” The empirical data from the use of CAPO
leads to the specification of program modules with more cohesion, less coupling, and what
the authors claim follows consequently, more maintainable systems. Although the advent
of the object oriented paradigm has resulted in a significantly different “view” of software
system organization, this paper presents a thorough and detailed discussion of building and
applying an automated design tool.
As software systems are extended, enhanced, and modified to accommodate changing
requirements, the original intent of design is often subverted, leading to serious problems
in their maintenance. Ciupke, in the paper Automatic Detection of Design Problems in
Object-Oriented Reengineering [Ciupke, 1999], presents a tool based technique for analyzing
legacy code to detect design problems. In this scheme problems are specified as queries
on the design model; the author illustrates the formalization of design rules using Prolog.
The catalog of queries are based on established design heuristics and from the authors
own experience. Although this is an important contribution towards automating highly
tedious tasks of software development such as scrutinizing legacy code for hidden design
flaws, consummate formulation of the queries can pose serious challenges, given the diversity
of software design idioms.
O’Keeffe et al. [O’Keeffe and Cinneide, 2003] state that “All but the most trivial
programming decisions can be considered design decisions, and all such decisions are made
with a view to maximizing certain properties in our designs.” They present an approach
towards automatically improving Java design through simulated annealing and results from
using the Dearthoir prototype tool to validate the simulated annealing concept. The tool
takes Java code as input, builds and manipulates parse tree and outputs altered Java code.
The paper points to exciting opportunities of code improvement without human intervention;
34
however the tool as described can only effectuate a small number of refactoring schemes,
which are limited in scope and usefulness.
Daniel Jackson’s group at MIT are working on the Alloy Analyzer tool for analyzing
models written in Alloy, a simple structural modeling language based on first order logic
[Jackson, 2006a], [Jackson, 2006b]. The tool employs “automated reasoning techniques that
treat a software design problem as a giant puzzle to be solved.” The initial results from using
Alloy as reported are promising. But it seems an essential prerequisite for applying Alloy is to
create a very detailed model of the design, precisely clarifying what the author calls “moving
parts and specific behaviors, both desired and undesired, of the system and its components.”
Developers’ bandwidth for this kind of effort early in the software development life cycle can
not always be taken for granted. Also more often than not, changing requirements precludes
the crystallization of the design to the extent all its finer features can be specified upfront.
Automating software development activities have been the focus of attention since the
mid 1970s. That no widely applicable technique has yet emerged speaks volumes regarding
the challenging nature of the task. We discussed some of the initiatives in this direction with
our inputs on their suitability.
2.5 UML 2.0 – Towards Model Driven Development
The Unified Modeling Language – UML for short – has established itself as a de-facto
standard for enterprise software analysis and design. Version 2.0 of UML has been recently
released with a slew of new features. In the following sections we review related literature
for the salient features of UML 2.0 and its thrust towards a new development paradigm -
model driven development.
UML, as a system of modeling constructs finds applications outside software code
artifacts. Eriksson et al. [Eriksson and Penker, 2000] have used UML to model business
processes. They have suggested a set of patterns to describe business architecture that can
be documented and communicated through UML models. This sort of cross disciplinary
relevance highlights the depth and expressive power of the modeling language.
With the progression of UML versions, profiles are getting increased attention. Cabot
et al. [Cabot and Gmez, 2003] present techniques towards overcoming the limitations of
conventional CASE tools for implementing UML profiles.
Brian Selic has been closely involved with the conception and finalization of the UML
35

2.0 specifications and has shared his viewpoints through a number of absorbing papers.
In the article UML 2.0: Exploiting Abstraction and Automation [Selic, 2004] the primary
motive force behind UML 2.0 is pointed out to be model-driven development, where
developer attention shifts more towards models rather than code and to automatically keep
the two synchronized. In the paper On the Semantic Foundations of Standard UML 2.0
[Selic, 2005b], Selic explores the “meaning” behind the models, and concludes that even as
there can be no single concrete formalization of UML 2.0 semantics – as it is meant to be
applied across diverse domains – insinuations such as “UML has no semantics” is unjustified.
Selic continues his advocacy of model-driven development using UML 2.0 [Selic, 2005c] and
highlights UML 2.0’s functionalities as:
• A significantly increased degree of precision in the definition of the language.
• An improved language organization.
• Significant improvements in the ability to model large-scale software systems.
• Improved support for domain-specific specialization.
• Overall consolidation, rationalization, and clarifications of various modeling concepts.
Selic illustrates how the context of UML modeling can be extended beyond design, by defining
a precise conceptual model of a software platform and the relationship that exist between
platforms and software applications that use them [Selic, 2005a]. This approach helps the
consideration of critical platform factors in the software design process.
Liu et al. [Liu et al., 2004] have made an interesting study of abstracting the modeling
techniques of UML and applying them to describe requirement and design activities. They
also provide an unified semantics for these two activities using the UML models.
Harel et al. takes up the delicate, and at times, thorny issue of syntax-semantics interfac-
ing in his article Meaningful Modeling: Whats the Semantics of Semantics? [Harel and Rumpe, 2004].
He contends there is much confusion involved in the proper definitions of complex modeling
languages such as UML. The paper seeks to demystify the term “semantics” and highlights
its concrete role in successful understanding and use of UML.
Mak et al. [Mak et al., 2004] demonstrate how design patterns can be precisely specified
using UML. They suggest a list of essential properties for pattern leitmotifs; meta-modeling
techniques of UML are then leveraged to model the pattern leitmotifs.
36

Bhatti [Bhatti, 2005] explains how the ISO 9126 software quality metrics are supported
by the UML suite. The author feels UML supported software quality metrics can be helpful
in enhancing the general reliability of industrial software systems.
The advanced features of UML 2.0 naturally call for a deeper understanding to be fully
utilized. Unhelkar [Unhelkar, 2005] has studied the quality of UML 2.0 models in depth.
He analyzes the strength, weakness, objectives, and traps of modeling with UML 2.0 and
comes up with verification and validation strategies to ensure the models add value to the
development process.
It is important to note that UML does not hold unchallenged sway among academics
and practitioners. There are several dissonant voices, who either deprecate the over-
enthusiasm surrounding UML and model-driven development or more fundamentally, the
basic tenets of the modeling paradigm. Thomas [Thomas, 2004] warns “used in moderation
and where appropriate, UML and MDA code generators are useful tools, although not the
panaceas that some would have us believe.” Bell goes a step further. In an article ominously
titled Death by UML Fever [Bell, 2004], the author begins by saying “A potentially deadly
illness, clinically referred to as UML (Unified Modeling Language) fever, is plaguing many
software-engineering efforts today.” He extends his analysis by identifying “metafevers” and
“delusional fevers” and gives subclassifications of each. Bell quotes from Confucius to Oscar
Wilde and gives a chilling commentary on the stages of the affliction, from contamination to
prognosis (expectedly dark !). Those who have been in enterprise software projects caught
in the quagmires of models and diagrams, and lived to fight another day, can sympathize
with the author. But the cause seems to be a bit overdone, when the piece ends with
the unqualified statement, “The battle against UML fever can be won, but not until it
is recognized as a genuine malady, and those who are afflicted with it get on the road to
recovery.”
Returning to the ken of believers, Terry Quatrani of the IBM Software Group, who bears
the epiphanous title UML Evangelist gives a very thorough introduction to UML 2.0 in her
introductory presentation [Quatrani, 2005]. She summarizes the salient points of UML 2.0
vis-a-vis the earlier versions as:
• Evolutionary rather than revolutionary.
• Improved precision of the infrastructure.
37

• Small number of new features.
• New feature selection criteria.
• Backward compatibility with version 1.x.
But any investigation of UML should end with the Three Amigos. Grady Booch, James
Rumbaugh, and Ivar Jacobson, collectively, have been canonized as the Three Amigos, in
commemoration of the pioneering work they first did individually, and then together, towards
the furtherance of the object oriented paradigm. As original proponents of the UML, the
triumvirate has brought out The Unified Modeling Language User Guide, Second Edition
[Booch et al., 2005] and The Unified Modeling Language User Reference, Second Edition
[Rumbaugh et al., 2005] as a comprehensive descriptions of UML 2.0. The former, true to his
name, offers guidance to the users on the context and usability of using UML 2.0 constructs,
whereas the latter serves as a repository of all the features of UML 2.0. A common allegation
against the whole UML world-view is that the language has been “designed by committee”
in the first place, and hence reflects consensus, rather than consequence. These books dispel
any such misconception. The cohesion of the material is remarkable, and the authors build
up strong motivations for transitioning to UML 2.0 from the earlier versions.
In this section, we discussed UML 2.0 and its promise for enabling new and better ways
of software development. We also tuned ourselves to some dissonant notes, authors who have
no qualms about calling UML enthusiasm a “fever.” In spite of the criticisms – some justified
– UML remains a powerful framework for the expression and documentation of design ideas,
and UML 2.0 has added to its range and scope.
2.6 Summary
Over the last few sections we have reviewed a variety of research publications in the domains
of software metrics, management of changing requirements, efforts at automating software
development activities, and the features of the recently enhanced version of Unified Modeling
Language, UML 2.0.
The survey of literature in the previous sections lead to the following observations:
• Metrics serve as useful heuristics in the understanding, monitoring, and management
of software development activities.
38

• Changing requirements pose major challenges in the development of enterprise soft-
ware.
• Automated approaches can help address the complexity of enterprise software.
• The constructs of UML 2.0 facilitate model driven development, which is an expedient
strategy in the design and implementation of enterprise software.
This chapter presented a brief exploration of the general state-of-the-art in the area of
my research. In the next chapter I discuss more the scope, preliminaries, definitions, and
assumptions of my research.
39

CHAPTER 3
PRELIMINARIES, DEFINITIONS, AND
ASSUMPTIONS
3.1 Overview
In this chapter I outline the preliminary concepts underlying my dissertation research. I
discuss the scope of the my research, some of the general assumptions, as well as a model
of the software development space I have developed to serve as a foundation for most of the
metrics and techniques proposed in the succeeding chapters. Towards the end of this chapter
I also present some characteristics of software design, that serve as the context for the broad
direction of my research.
3.2 Scope of Research
Before going into particular concepts and formulations, it is important to clarify the scope
of research by providing a set of common definitions and assumptions.
3.2.1 Types of Software Systems
In the remainder of this document, the phrase software systems will mean systems which have
a Web-based front end, a database back-end, and a middle tier for processing business logic,
unless specifically mentioned otherwise (for example, as in Chapter 11). Currently a large
majority of software systems being developed or maintained can be included in this category.
The techniques developed in the research are specially suited to this type of software systems,
although they may be useful in other types of systems also.
40

3.2.2 Requirements and Requirements Changes
A requirement is described as ”... a design feature, property, or behavior of a system” by
Booch, Rumbaugh, and Jacobson [Booch et al., 2005]. The authors call the statement of a
system’s requirements as the assertion of a contract on what the system is expected to do.
By far the most widely used (though may not be most precise) way of capturing requirements
is natural language prose description that customers and developers both understand and
can agree to.
In the context of changing requirements, it is important to clarify the kinds of change this
research addresses. While every software system is subject to changing requirements in its
development life cycle, the drivers of change are not always the same. Many of the changes
in requirements originating from the customer or user may be functional in nature – the
system is expected to behave differently than before in a particular aspect; or they may be
non-functional, relating to the so-called “ilities” of a system, where the system is sought to
be made more usable, reliable, have better performance, or be more supportable. Changes
in the non-functional requirement are usually addressed by bringing about a change in the
infrastructure which hosts the software system, such as moving to a new operating system
or database, or undertaking refactoring [Fowler, 2006] of code. The changes in requirements
investigated in this research are confined to changes in functional requirements only.
Changes in functional requirements can have wide ranging effects on a system’s design.
To understand this issue in more depth, I introduce the concept of fundamental tenets of a
software system.
In the analysis and early design phases of a software development life cycle, the
development team studies the domain model of the system being built. A major objective
of such study is to extract certain principles or facts about the problem domain which can
be expected to remain unchanged throughout the life time of the system, and upon which
fundamental design assumptions can be based. I will call these the “fundamental tenets.” As
an example, for a financial software system in the United States of America, a fundamental
tenet can be the one-to-one correspondence between a Social Security Number (SSN) and
an individual. A particular banking application may have a fundamental tenet that one
individual is allowed to hold only one savings account with a particular branch of the bank
at one point of time. Certain changes in requirements may end up violating such fundamental
41

tenets; the bank may acquire another bank which allows customers to hold more than one
savings account per branch, or the financial software system may be required to work in
another country where there is no analogous unique identifier for individuals such as the
SSN. When change in requirements affect fundamental tenets, it often becomes unfeasible
to try and modify the existing system to fit the latest needs – designing and developing the
system afresh with a new set of fundamental tenets provides an easier solution. A design
assumption based on a fundamental tenet is defined as an assumption which if violated, will
render a majority of the system’s components unusable in the changed scenario. The changes
in requirements (or introduction of new requirements) this research addresses are assumed
not to violate any fundamental tenet.
Sometimes requirement changes are moderated by the development team to suit their
technological, business, or political interests. Such changes in requirements are out of the
scope of this research.
So, going forward, when phrases such as “changing requirements” or “requirements
changes” are used, they should be taken to mean user or customer driven changes in a
software system’s functional requirements that do not violate any fundamental tenet of the
system.
3.2.3 Components
A component carries out specific responsibilities and interacts with other components through
its interfaces to collectively deliver the system’s functionality (of course, within acceptable
non-functional parameters). A collaboration is described in the Unified Modeling Language
Reference Manual, Second Edition as a “... society of cooperating objects assembled to carry
out some purpose” [Rumbaugh et al., 2005]. In my research, the collaboration of components
will be referred to as interaction.
Given this understanding of a component and its collaborations, I develop techniques in
my research that specify the impact of changing requirements on components or guide the
delegations of responsibilities to components.
3.2.4 Iterations and Increments
Many of the metrics and techniques developed in this research are suited to software systems
that are developed through an iterative and incremental methodology. From an intuitive
42

understanding, an iterative and incremental approach prescribes the system be built over
a repetitive sequence of steps – iterations, and be grown through releases of parts of the
functionality for testing and feedback from the users – increments. An iteration may be
necessitated by any of the following situations:
• Introduction of new requirements, or change in existing requirements leading to
reorganization of components and their interactions.
• Reorganization of existing components (without being necessitated by new or modified
requirements) with a view to improving the underlying design (referred to as refactoring
[Fowler, 2006]), or catering to some non-functional requirements.
Out of these two, I only consider iterations due to the former (introduction of new
requirements, or change in existing requirements) in our research and any reference to
“iteration” in the remainder of this document should be taken in this light.
3.2.5 Some General Assumptions
In addition to the scope and definitions outlined earlier, there are some general assumptions
that underlie my research.
• It is assumed that the usual sequence of life cycle activities is followed: given a set of
requirements, they are analyzed, and then design proceeds from higher to lower levels
of granularity.
• The phrases “high-level design” and “low-level design” are often used to distinguish
the extents of design granularity. It is assumed design can be abstracted as the
collaboration amongst components to fulfill a given functionality; so the granularity is
at the component level. It is assumed that higher level concerns such as architectural
decisions, choice of application servers etc. have been addressed at the time component
level design starts.
• As the above points indicate, it is considered that inter-component interaction rather
than intra-component issues (such as method implementation or algorithm selection)
are of greater importance to this research. Thus components are entrusted with
delivering their responsibilities while remaining true to their interfaces.
43

• It is assumed that the interaction of components is linear in nature; thus the
characteristics of a set of components can be aggregated from the characteristics of
individual components.
• It is assumed that from design artifacts of a software system, it can be clearly
ascertained which components are needed for the fulfillment of a particular requirement
and vice-versa.
3.3 A Model for the Software Development Space
Based on the research scope and assumptions discussed in the preceding sections, I now
present a model of the software development space. This model serves as the backbone for
many of the results presented in the following chapters.
3.3.1 Description of the Model
In order to examine the dynamics of software systems through a set of metrics, a model is
needed to abstract the essential elements of the domain. Figure 3.1 gives an abstraction
of the software development space upon which I base the following discussion. (It should
be noted that the links between the requirements and components are shown in the figure
are arbitrary and for illustrative purposes only.) The development space consists of the set
requirements Req = R1, ..., Rx of the system, which are fulfilled by the set of components
Comp = C1, ..., Cy.I take fulfillment to be the satisfaction of any user defined criteria to judge whether a
requirement has been implemented. Fulfillment involves delivering the functionality repre-
sented by a requirement. A set of mapping exists between requirements and components,
I will call this relationships. At one end of a relationship is a requirement, at the other
ends are all the components needed to fulfill it. Requirements also mesh with one another
– some requirements are linked to other requirements, as all of them belong to the same
system, and collectively specify the overall scope of the system’s functionality. The links
between requirements are referred to as connections. From the designer’s point of view, of
most interest is the interplay of components. To fulfill requirements, components need to
collaborate in some optimal ways, this is referred to as the interaction of components.
44

Thus the design problem may be viewed as: given a set of connected requirements, how
to devise a set of interacting components, such that the requirements and components are
able to forge relationships that deliver the system’s functionality within given constraints.
At one level, this can be taken to mean fulfilling functional requirements to the user’s
satisfaction within acceptable parameters such as performance; while conforming to good
design practices. On another, more subtle plane this can also mean a design that can
absorb changing user needs, with minimal rework. Evidently, as requirements change,
their relationships with components also change; and the components themselves and
their interaction must also change, to fulfill the changed requirements. This dissertation
investigates ways to organize the components so that they are most resilient to changing
requirements.
3.3.2 Static and Dynamic Aspects of the Model
It is important to point out certain subtleties about the model depicted in Figure 3.1.
A software system is a dynamic entity – new requirements come up, old ones and modified
or retired, and components have to change the way they behave and collaborate to be
able to deliver in the changed circumstances. So inter-component interactions change,
inter-requirement connections mutate, and the relationships between requirements and
components alter. So, Figure 3.1 is essentially a snapshot for some iteration Iz of the
development life cycle. The proposed model has a time element attached to it – each
instantiation of the model is valid for a particular iteration of software development. In the
iterative and incremental methodology, an iteration is the atomic element of development:
a set of requirements is identified and components designed for its fulfillment within the
iteration’s scope. So the associations between requirements and components do not change
during one iteration. (If indeed such change takes place in a particular case, it is a sure
symptom that the methodology is not being followed in its spirit, and development is
degenerating into what Jacobson et al. have called “random hacking” or ”playpen for
developers” [Jacobson et al., 1999]). Given the nature of the iterative and incremental
methodology, I attempt to make reasonable assumptions about the scope of an iteration
as outlined earlier.
45

R1
R2 R3
Rx
C1
Cy-1 Cy-2
Cy
Requirements Components
RelationshipInteractionConnection
R1
R2 R3
Rx
C1
Cy-1 Cy-2
Cy
Requirements Components
RelationshipInteractionConnection
Figure 3.1: A Model of the Software Development Space
3.3.3 Understanding the Model
In the following subsections, scenarios expressed by the model are described to explain the
meaning and expressiveness of the model.
The Trivial Cases
The following cases may be ignored as they do not occur in practical situations.
• x = 0 =⇒ There are no requirements to be fulfilled in Iz.
• y = 0 =⇒ There are no components which fulfill requirements in Iz.
46

As will be apparent in the definitions later, the above cases lead to trivial metrics values.
I next discuss some of the more interesting scenarios. In the figures referred to below,
inter-requirement connections and inter-component interactions of Figure 3.1 have been
deliberately elided to focus wholly on requirement-component relationships.
The One-to-One Scenario
As depicted in Figure 3.2, every requirement Rk is fulfilled by one dedicated component Ck.
This is a possible, though highly unlikely scenario as every component does everything
by itself, thereby leading to duplication of functionality and concomitant maintenance
difficulties. As discussed in the section Meaning of the Metrics Values, the metrics values for
this scenario will lie at the boundary conditions and usually outside the purview of realistic
systems.
The One-to-Many Scenario
As depicted in Figure 3.3, there is one requirement in the system (x = 1) which is being
fulfilled by many (that is, more than one, in this case all) of the y components. This is
possible for a very small system with only one requirement, and may be feasible if only
few components can fulfill the requirement. However, in the long run if the number of
components grow, it will certainly be advisable to break down the single requirement into
several more fine grained ones, with specific groups of components fulfilling each requirement.
As discussed later, metrics values for this scenario will only reflect a special case of a system
of very limited scope.
The Many-to-One Scenario
As depicted in Figure 3.4, there are many requirements being fulfilled by one single
component. This is an example of a monolithic system – one component doing everything
that needs to be done. Such a scenario is possible if a procedural language is being used
for development; but it runs contrary to the basic tenets of the object oriented paradigm.
As discussed later, the metrics values for this scenario will indicate no reorganization of
components is possible, as there is only one component in the first place.
47

R1
R2
R3
Rx
C1
Cy-1
Cy-2
Cy
Requirements Components
Relationship
R1
R2
R3
Rx
C1
Cy-1
Cy-2
Cy
Requirements Components
Relationship
Figure 3.2: The One-to-One Scenario
The Many-to-Many Scenario
Figure 3.1 depicts the most practical scenario – a group of requirements being fulfilled by a
group of components. The relationship between particular requirements and components as
well as inter-component interactions is defined by the characteristics of a specific design. As I
shall illustrate later, the techniques REQ-CHANGE and COMP-REF guides the variation of
such relationships towards the objectives defined in the research hypothesis. As discussed in a
later section, the range of metrics values for this scenario reflect on the various opportunities
for design trade-offs that a realistic software system presents, and some ways to leverage
such opportunities.
48

R1
C1
Cy-1
Cy-2
Cy
Requirements Components
Relationship
R1
C1
Cy-1
Cy-2
Cy
Requirements Components
Relationship
Figure 3.3: The One-to-Many Scenario
Other Scenarios
In addition to the scenarios discussed above, hypothetically there can be orphan requirements
and components, those which do not share any association with other requirements or
components. Practically, such entities will be outside the scope of the current iteration
and thus need not be considered.
3.4 Characteristics of Software Design
An underlying theme of my dissertation research is to investigate ways towards the design
of better software; “better” in the sense of being more responsive to user needs, and more
resilient to the inevitable changes to those needs. From that perspective, I give below some
49

R1
R2
R3
Rx
C1
Requirements Components
Relationship
R1
R2
R3
Rx
C1
Requirements Components
Relationship
Figure 3.4: The Many-to-One Scenario
common characteristics of software design that has oriented my research.
The notion of design – both in the general sense and the specific context of software
development – is easy to discuss but difficult to define. Alexander, in his The Timeless Way
of Building reflects on what he calls it the “the quality without a name” [Alexander, 1979].
(That the software world has warmed to this idea is proved by the coinage of a handy
acronym – QWAN). Alexander considers and casts aside several words which may capture
this quality – alive, whole, comfortable, free, exact, egoless, eternal – but do not do so
precisely. Alexander adds a philosophical spin: “There is a central quality which is the root
criterion of life and spirit in a man, a town a building, or a wilderness. This quality is
objective and precise, but it cannot be named. The search which we make for this quality,
50

in our own lives, is the central search of a person, and the crux of any individual person’s
story. It is the search for those moments and situations when we are most alive.”
To a certain extent differentiating good software design from bad presents a similar
confusion. Everyone readily appreciates the symptoms of bad design – broken code, painful
maintenance, inability to adapt to change; and as corollaries, burnt budgets, and missed
deadlines. But pointing to design characteristics that may lead to such difficulties, or those
that will not, is far from easy. Very often, inadequacies of design are explained away as
manifestations of a design “style.”
While remaining fully cognizant that design is by far the most reflective activity of the
software development process, drawing freely as it does on experience, intuition, and nameless
other instincts, I identify some essential features of effective software design.. In the context
of this document, I will call them the software design postulates.
• Postulate 1 – In a given set of requirements, there will always be some requirements
more volatile than others in terms of the extent of change they undergo over iterations.
It is best to isolate the functionality of these requirements in a limited number of
components.
• Postulate 2 – For a set of components fulfilling a given set of requirements, it is
best to minimize the interaction of the components fulfilling the volatile requirements,
amongst themselves and with other components. Deciding on a particular component’s
responsibilities and its interactions plays an important role in achieving this end.
Discussion of the following chapters will draw upon these postulates, and examine their
validity across a variety of software development scenarios.
3.5 Summary
This chapter clarified the scope of my research, highlighted the general assumptions, and
presented a model of the software development space. I also reflect on some essential
characteristics of software design that will sets up the context of my investigations in the
later chapters.
51

CHAPTER 4
REQ-CHANGE: A TECHNIQUE TO ANALYZE THE
DYNAMICS OF CHANGING REQUIREMENTS
4.1 Overview
Managing the effects of changing requirements remains one of the greatest challenges of
enterprise software development. The iterative and incremental model provides an expedient
framework for addressing such concerns. This chapter presents a set of metrics – Mutation
Index, Component Set, Dependency Index – and the REQ-CHANGE technique to measure
the effects of requirement changes from one iteration to another. Results from validating the
technique are also discussed.
4.2 Motivation
Although it is common to use the terms measure, measurement and metrics in place
of one another, some authors have underscored subtle distinctions [Pressman, 2000],
[Baker et al., 1990], [Fenton, 1994]. For our discussion, we take metrics to mean “a set of
specific measurements taken on a particular item or process” [Berard, 1995]. Halstead’s
seminal work [Halstead, 1977] introduces metrics for source code. Metrics for analysis
include the closely reviewed function point based approaches [Albrecht, 1979] and the Bang
metric [DeMarco, 1982]. Card and Glass [Card and Glass, 1990] have proposed software
design complexity in terms of structural complexity, data complexity and system com-
plexity. [McCabe, 1976] identifies some important uses of complexity metrics. Fenton
underscores the challenges of trying to formulate general software complexity measures
[Fenton, 1994]. Measurements of Coupling and Cohesion have been the focus of sev-
eral studies [Bieman and Ott, 1994], [Dhama, 1995]. Chidamber and Kemerer present a
52

widely referenced set of object oriented software metrics in [Chidamber and Kemerer, 1991],
[Chidamber and Kemerer, 1994]. Harrison, Counsell and Nithi have evaluated a group of
metrics for calibrating object-oriented design [Harrison et al., 1998].
Karlsson et al. [Karlsson and Ryan, 1997] use the Analytical Hierarchy Process to model
a cost value approach for prioritizing requirements. An event based traceability approach is
used by Cleland-Huang et al. [Cleland-Huang et al., 2003] to manage evolutionary change of
development artifacts. Lam and Loomes [Lam and Loomes, 1998] have suggested an EVE
(EVolution Engineering) framework for dealing with requirement evolution. Robinson et
al. [Robinson et al., 2003] propose a set of activities codified as Requirements Interaction
Management (RIM), directed toward the discovery, management, and disposition of critical
relationships among sets of requirements.
While these studies illuminate important aspects of software engineering in general and
understanding requirements in particular, it is necessary to connect the effects of changing
requirements with the analysis artifacts in a clear, quantified strategy. The measurement
scheme derived in the following sections aims at capturing the effects of requirements changes
in terms of the essential continuity of a development process. Our mechanism also provides
a framework for automating the tracking of requirement changes and their consequences.
4.3 Assumptions
During the analysis workflow, each requirement is scrutinized to ascertain the broad layers
of the software system that will be required for its fulfillment. (Fulfillment is intuitively
understood to be satisfying any user defined criteria to judge whether a requirement has been
implemented to her satisfaction.) At this level the software system may be segregated into
the layers of Display, Processing and Storage. Analysis reveals how these three categories
can combine in a feasible design to relate to a particular requirement.
We make the following assumptions:
• The context of our discussion is functional requirements. We recognize non-functional
requirements may warrant a different approach [Datta, 2005].
• By reviewing a particular requirement, an experienced analyst is able to recognize
whether it concerns the Display, Processing or Storage aspects of the system.
Display subsumes all features of the user interface and interaction facilities between
53

the user and the system. Processing is any non-trivial modification of information
performed by the system. Storage includes all activities associated with persisting
information and accessing such information.
• When a requirement changes, the change can affect Display(D), Processing(P ) or
Storage(S); singly or collectively. Thus, between iterations, each changing require-
ment, Rn is attributed a Mutation V alue MV (n) of D, P or S; or any of their
combination.
• The Display, Processing and Storage aspects may be associated with the three basic
stereotypes of analysis classes; Boundary, Control and Entity in object oriented analysis
[Jacobson et al., 1999]. The following derivation is based on this mapping; for non
object oriented systems, corresponding components/modules may be substituted. The
derived metrics are independent of Object Oriented Analysis and Design (OOAD)
principles.
• The metrics address requirement changes between iterations; the identification of
current, previous and next iterations is implicit in the discussion.
• System refers to the software under development along with its interfaces. Component
refers to logical/physical entities whose interaction is necessary for the working of the
system.
4.4 Defining the Metrics
The following discussion sees the software system from the requirements viewpoint and
devises a set of metrics that capture the effects of changing requirements on the system’s
components.
Mutation Index
As we have highlighted before, changing requirements is a fact of life for all non-trivial
software systems. Let us take the term mutation to mean any change in a particular
requirement that would require a modification in one or more components fulfilling the either
one or a combination of the display, processing, or storage demands of the requirement. In
keeping with the principle of separation of concerns, it is usually taken to be good design
54

practice to assign specific components to deliver each of the display, processing, and storage
aspects. Components (or sets of components) delegated to fulfill the display, processing,
and storage aspects of requirement(s) map to the stereotypes of analysis classes: boundary,
control, and entity in object oriented analysis [Jacobson et al., 1999]. Intuitively, the metric
Mutation Index measures the extent to which a requirement has changed from one iteration
to another, in terms of its display, processing, and storage aspects.
For a system, let Req = R1, R2, ..., Rm..., Rx denote the set of requirements. Between
iterations Iz−1 and Iz each requirement is annotated with its Mutation V alue; a combination
of the symbols D, P and S. The symbols stand for:
D ≡ Display(1)
P ≡ Processing(3)
S ≡ Storage(2)
(4.1)
The parenthesized numbers denote the Weights attached to each symbol. The combina-
tion of more than one symbol signifies the addition of their respective Weights, thus:
PD ≡ DP ≡ 1 + 3 = 4 (4.2)
SD ≡ DS ≡ 1 + 2 = 3 (4.3)
SP ≡ PS ≡ 3 + 2 = 5 (4.4)
SPD ≡ ... ≡ DPS ≡ 1 + 3 + 2 = 6 (4.5)
The Weight assigned to each category of components – Display, Processing and Storage
– is a relative measure of their complexities. (Complexity here refers to how intense
the design, implementation, and maintenance of a component are in terms of developer
effort.) Processing components usually embody application logic and are most design
and implementation intensive. Storage components encapsulate the access and updating of
application data stores; their level of complexity is usually lower than that of the Processing
components but higher than Display ones. Accordingly, Display, Processing and Storage
55

have been assigned the Weights 1, 3 and 2 respectively. Exact values of Weights may
be varied from one project to another; the essential idea is to introduce a quantitative
differentiation between the types of components.
We recognize the assignment of weights has an element of subjectivity. With the
application of these metrics to large number of projects, it is expected common strategies
will emerge for giving a particular weight to a component. However, the following derivation
of the metrics is independent of the actual values of the weights. We have chosen the 1-3
scale based on complexity, any other scale will serve just as well if it is consistently followed
for a particular system.
Definition 1 The Mutation Index MI(m) for a requirement Rm is a relative measure of the
extent to which the requirement has changed from one iteration to another in terms of the
components needed to fulfill it.
Expressed as a ratio, the MI(m) for requirement Rm :
MI(n) =The Mutation V alue for Rm
The maximum Mutation V alue(4.6)
Thus, if at iteration Iz, Requirement Rm has been assigned a Mutation V alue MV (m)
= DS with reference to iteration Iz−1, MI(m) is calculated as :
MI(m) =DS
DPS
MI(m) =3
6
MI(m) = 0.5
Intuitively, if change in Rm can only affect the Display aspects of the system, the
corresponding MI(m) = D/DPS = 1/6 = 0.17, which is less significant than the changes
affecting only Processing, i.e. MI(m) = P/DPS = 3/6 = 0.5 or only Storage, i.e. MI(m)
= S/DPS = 2/6 = 0.33.
At the boundary conditions, if a requirement has not changed from one iteration to
another, the Mutation V alue is 0 and MI(m) = 0/6 = 0. And, if all of Display, Processing
and Storage aspects will be affected by changes in the requirement, the MI(m) = 6/6 = 1.
MI(m) for a requirement Rm can vary between these extreme values.
56

Component Set
The Component Set for a requirement is the collection of collection needed to fulfill the
requirement. Given a particular requirement, the set specifies the components it shares
relationships with.
Definition 2 The Component Set CS(m) for a requirement Rm is the set of components
required to fulfill the requirement.
During analysis, only the software components at the highest level are identified; they
typically undergo several cycles of refinement over subsequent workflows. The Component
Set is determined for components at their level of granularity at the analysis stage. Let the
following mutually exclusive components combine to fulfill requirement Rm :
CB ≡ Set of Boundary classes (4.7)
CC ≡ Set of Control classes (4.8)
CE ≡ Set of Entity classes (4.9)
CX ≡ Set of helper, utility and other classes (4.10)
Then, the Component Set CS(m) for Rm is defined as,
CS(m) = CB ∪ CC ∪ CE ∪ CX (4.11)
Dependency Index
Related to mutation is the idea of dependency. In fulfilling a system’s requirements,
components depend on one another to deliver the collective functionality. Let us take
“dependency” to mean the interaction between components that is essential to fulfill a
particular requirement. Evidently, the ease with the effects of mutation can be absorbed
depends on the degree of dependency in the set of components that fulfill the requirement.
Why not have dedicated sets of components fulfill each requirement or a single component
fulfill all requirements? These extreme cases might seem to settle the issue of dependency,
but they are infeasible due to factors such as: duplication of code, difficulty of maintenance,
problems with allocating development resources etc. The soundness of a software system’s
57

design comes from how well it is able to distribute the cost of common functionality across
components, and isolate specific functionality in specialized components. Intuitively, the
metric Dependency Index measures the extent to which the fulfillment of a requirement’s
functionality is dependent on the components which participate in the fulfillment of other
requirements of the system.
Definition 3 The Dependency Index DI(m) for a requirement Rm is a relative measure
of the level of dependency between the components fulfilling Rm and those fulfilling other
requirements of the same system.
For the set of requirements Req = R1,R2,...,Rm,...,Rx−1,Rx, let us define,
Y = CS(1) ∪ CS(2) ∪ ... ∪ CS(x− 1) ∪ CS(x)
For a requirement Rm (1 ≤ m ≤ x), let us define,
Z(m) = (CS(1) ∩ CS(m)) ∪ ... ∪ ((CS(m− 1) ∩ CS(m)) ∪((CS(m) ∩ (CS(m + 1)) ∪ ... ∪ ((CS(m) ∩ (CS(x))
Thus Z(m) denotes the set of components that participate in the fulfillment of Rm as well
as some other requirement(s).
Expressed as a ratio, the DI(m) for requirement Rm :
DI(m) =|Z(m)||Y |
(4.12)
where for a set S, |S| is taken to denote the number of elements of S.
4.5 Range of the Metrics Values
Let us review the range of the metrics values and the implications of the boundary conditions.
The Mutation Index value for requirement Rm, MI(m) ∈ [0, 1]. A value of 0 signifies the
particular requirement has not changed at all from the previous iteration, whereas a value
of 1 means the requirement has changed in all the identified aspects.
The Dependency Index value for requirement Rn, DI(n) ∈ [0, 1]. A value of 0 signifies
there are no components fulfilling the particular requirement which also participate in the
fulfillment of other requirements; that is, the fulfillment of the requirement is least dependent
58
on the fulfillment of other requirements. Conversely, a value of 1 indicates all the components
fulfilling the particular requirement also participate in the fulfillment of other requirements;
that is, the fulfillment of the requirement is most dependent on the fulfillment of other
requirements.
The notions of mutation and dependency relate to the circumstances of how requirements
change and what effect such change have on the interaction of components fulfilling the
requirements of the system. But these discussions also raise an important question: can the
organization of components be guided in a way such that the effects of changing requirements
are absorbed with minimal impact? To address this question, we need to investigate some
of the issues that influence the interaction of components in a software system.
A low value of the Mutation Index would point to less change in a requirement; a low
value of the Dependency Index reflects a design that in which a requirement’s change would
cause less of a ripple effect in the system’s components.
4.6 The REQ-CHANGE Technique
REQ-CHANGE is a technique to specify the extent to which changing requirements will
affect the development of a software system. As a requirement changes from one iteration to
another, the Mutation Index gives the level of change, and the Dependency Index indicates
how dependent the components fulfilling the requirement is on other components of the
system, before the change has been implemented. Evidently, if a requirement changes
significantly in one iteration from the previous (high Mutation Index value), and it was
being fulfilled by components closely interacting with other components (high Dependency
Index value) in the previous iteration, the effects of the change will be reverberate more
deeply within the system’s components. So, for requirements prone to have Mutation Index
values, designers need to ensure the Dependency Index values are low, so that the effects of
the change in the requirement is reasonably contained.
The metrics Mutation Index, Component Set, and Dependency Index can be used to
understand how requirements change from one iteration to another, and how such change is
likely to affect the components fulfilling the requirements. We suggest the REQ-CHANGE
technique towards this end.
Given the set of requirements Req = R1, ..., Rx, the set of components Comp =
C1, ..., Cy fulfilling it in iteration Iz:
59
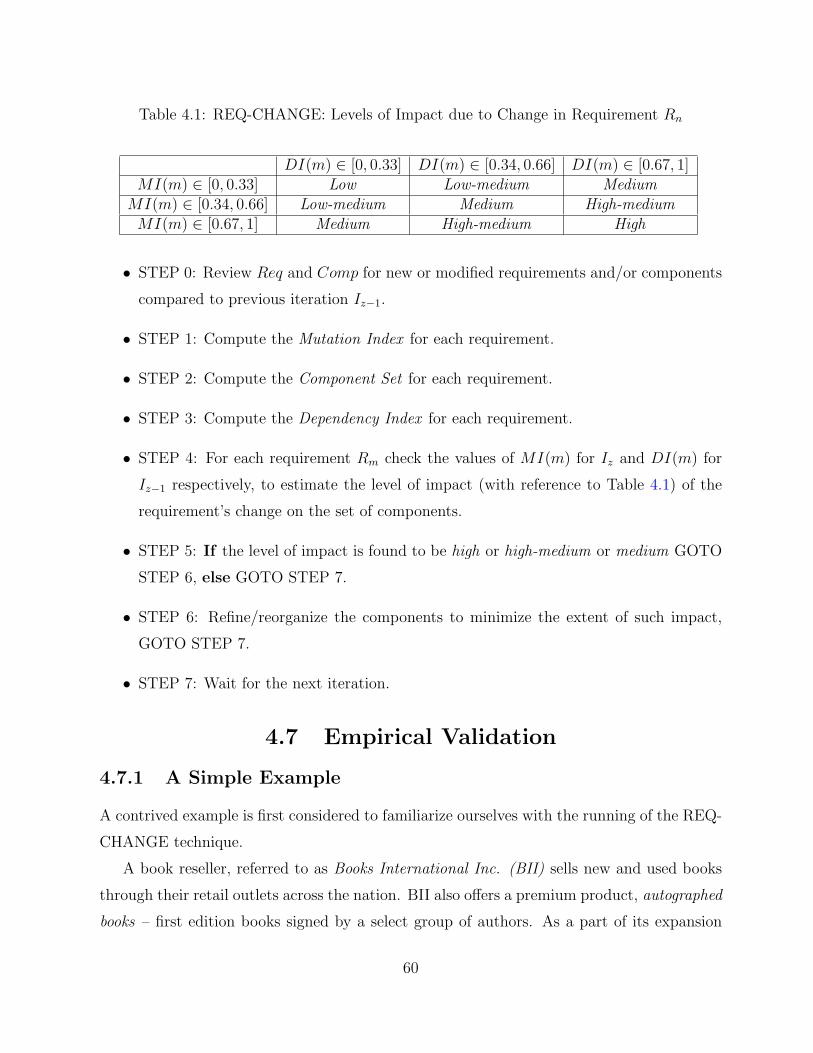
Table 4.1: REQ-CHANGE: Levels of Impact due to Change in Requirement Rn
DI(m) ∈ [0, 0.33] DI(m) ∈ [0.34, 0.66] DI(m) ∈ [0.67, 1]MI(m) ∈ [0, 0.33] Low Low-medium Medium
MI(m) ∈ [0.34, 0.66] Low-medium Medium High-mediumMI(m) ∈ [0.67, 1] Medium High-medium High
• STEP 0: Review Req and Comp for new or modified requirements and/or components
compared to previous iteration Iz−1.
• STEP 1: Compute the Mutation Index for each requirement.
• STEP 2: Compute the Component Set for each requirement.
• STEP 3: Compute the Dependency Index for each requirement.
• STEP 4: For each requirement Rm check the values of MI(m) for Iz and DI(m) for
Iz−1 respectively, to estimate the level of impact (with reference to Table 4.1) of the
requirement’s change on the set of components.
• STEP 5: If the level of impact is found to be high or high-medium or medium GOTO
STEP 6, else GOTO STEP 7.
• STEP 6: Refine/reorganize the components to minimize the extent of such impact,
GOTO STEP 7.
• STEP 7: Wait for the next iteration.
4.7 Empirical Validation
4.7.1 A Simple Example
A contrived example is first considered to familiarize ourselves with the running of the REQ-
CHANGE technique.
A book reseller, referred to as Books International Inc. (BII) sells new and used books
through their retail outlets across the nation. BII also offers a premium product, autographed
books – first edition books signed by a select group of authors. As a part of its expansion
60

plan, BII decided to webify their business, launching an internet store and fulfilling electronic
orders. An online presence for BII is expected to result in increased revenue from its standard
as well as niche market of autographed books. A software development organization, which
we will call Next Gen Tech (NGT) has been contracted to develop the online BII store. NGT
decided to use an iterative and incremental model for developing the system.
Results
We give the requirements for each iteration (In) and calculate the corresponding values for
MI(n), CS(n) and DI(n) as per the relations derived in section 5. Section 7.3 interprets
the results. It is implied that the requirements are being forwarded by the stakeholders from
BII; the analysts and designers from NGT evaluate them using the metrics to gauge their
effects.
Requirements for I1 :
R1 - The system will provide an online home page of BII, including a masthead with BII’s
logo, a static welcome message, and a hyperlink to a catalog page.
R2 - The catalog page will contain alphabetical listing of BII’s books. Initially BII will provide
a list of up to 2000 different titles on its online store. The system will allow a user to select
one/more listing(s) for purchase.
R3- The system will record the Name, Mailing Address, Credit Card Number, Expiration
Date and Credit Card Billing Address of the user wishing to purchase book(s).
R4- The system will verify the credit card information and provide confirmation to the user
along with total cost of the purchase (base price plus shipping and handling charges - BII will
only offer standard shipping).
In the very first iteration the requirements have not had a chance to mutate, hence the
MV (n) = 0 and MI(n) = 0 for all Rn.
A list of components identified at this time with a brief description of their functionality is
given below. These are at a very high level of abstraction, and will likely undergo refinements
in subsequent workflows. The respective component type as defined earlier is noted in
parenthesis beside the component’s name. (Here, we do not seek to justify analysis and
design decisions; focus is on the metrics values.)
List of components for I1 :
61

Table 4.2: Mutation Value, Mutation Index and Dependency Index for I1 of the SimpleExample
Rn MV (n) MI(n) DI(n)R1 0 0 0.143R2 0 0 0.429R3 0 0 0.286R4 0 0 0.429
Page generator(CB) : To generate web pages with dynamic content.
User input verifier(CB) : To validate form inputs from user.
User info recorder(CC) : To process user information before persisting.
Credit card verifier(CC) : To verify credit card details.
Catalog store(CE) : To persist book catalog information.
User info store(CE) : To persist user information.
Total price calculator(CX) : To calculate total price of purchase.
Based on the above, the following is derived :
Component Sets CS(n) for I1 :
CS(1) - Page generatorCS(2) - Page generator,User input verifier,Catalog storeCS(3) - Page generator,User input verifier,User info recorder,
User info storeCS(4) - Page generator,User input verifier,Total price calculator,
Catalog store,Credit card verifierThe DI(n) values in Table 4.2 signifies, at a later stage, changes to R1 will have the least
impact on the overall current design while changing R2 and R4 will affect the system most.
For the next iteration I2, the following versions of the requirements were addressed.
Requirements for I2 :
R1 - In addition to earlier requirement, the home page will present a list of authors whose
autographed editions are currently available through BII. The list will be updated by BII’s
management once a month.
R2 - In addition to earlier requirement, the catalog will provide a facility to search all of BII’s
books by author’s name and/or book title.
62

R3- In addition to earlier requirement, the system will present a disclaimer that none of the
personal information of the user recorded by BII will be shared with any third party other
than credit card agencies.
R4- Remains unchanged
As a marketing drive, all pages will have a list of five new arrivals at the top, under the
heading,“BookWorm Recommends.”
In the light of the changes, Table 2 shows the Mutation V alue assigned to each
requirement and the corresponding Mutation Index. It is worth noting, even as R4 is
declared to remain unchanged, it has a non zero Mutation V alue since all pages now need
to display a list of new books.
It is apparent R2 has changed most and R3 least. The corresponding DI(n) values from
I1 suggests, absorbing the effect of R3’s change will be relatively easier than that of R2’s .
With this insight, the revised set of components required to fulfill the current requirements
are listed below.
List of components for I2 :
Page generator(CB) : To generate web pages with dynamic content.
User input verifier(CB) : To validate form inputs from user.
User info recorder(CC) : To process user information before persisting.
Credit card verifier(CC) : To verify credit card details.
Catalog searcher(CC) : To provide dynamic search facility of the catalog.
New arrival identifier(CC) : To identify new additions to the catalog.
Catalog store(CE) : To persist book catalog information.
User info store(CE) : To persist user information.
Total price calculator(CX) : To calculate total price of purchase.
The italicized components are the ones that have been added to address the requirement
changes.
Guided by each requirement’s Mutation V alue the components were reassigned as:
Component Sets CS(n) for I2 :
CS(1) - Page generator, New arrival identifierCS(2) - Page generator,User input verifier,Catalog searcher, New arrival identifierCS(3) - Page generator, User input verifier, User
information recorder, User information store, New
63

Table 4.3: Mutation Value, Mutation Index and Dependency Index for I2 of the SimpleExample
Rn MV (n) MI(n) DI(n)R1 D,P 0.67 0.22R2 D,P,S 1 0.33R3 D 0.17 0.44R4 D,S 0.5 0.44
arrival identifierCS(4) - Page generator, User input verifier, Total price calculator, Catalog
store, Credit card verifier, New arrival identifier, User information storeThe redesign necessitated by the mutating requirements lead to a situation where R3 and
R4 are now the most dependent followed respectively by R2 and R1. (As indicated by the
Dependency Index values for this iteration in Table 4.3.)
As each iteration lead to an incremental release of the product, BII was satisfied with
the project’s progress. Accordingly, another round of requirements were put forward.
Requirements for I3 :
R1 - Remains unchanged.
R2 - Remains unchanged.
R3- Remains unchanged.
R4- In addition to earlier requirement, BII will also accept checks or BookWorm Coupons
as payment for purchases. BookWorm Coupons are valid only for specific purchases. Items
that can be bought with coupons will be marked in the online listing.
This was put forward as a “minor addition” by BII’s management; after all, R4 is the
only one requirement that changes.
NGT’s analysts were quick to detect, R4’s change also affects R3 and has the potential
to impact the existing design as newer business rules (What qualifies a product for purchase
against coupons ? Can coupon purchases be combined with card/check purchases ? etc.) need
to be addressed and interfaces (What other user information need to be recorded for check
payments ? Which agency would verify such payments ? etc.) built. Table 4.4 quantifies
their qualms.
The MI(n) values, coupled with corresponding DI(n) values from the previous iteration
64

Table 4.4: Mutation Value, Mutation Index for I3 of the Simple Example
Rn MV (n) MI(n)R1 0 0R2 D,S 0.5R3 P,S 0.83R4 D,P,S 1
MI(1) MI(2) MI(3) MI(4)0
0.2
0.4
0.6
0.8
1
1.2
I_1I_2I_3
Figure 4.1: Variation of MI(n) across Iterations for the Simple Example
indicate that far reaching changes have to be introduced to fulfill the latest requirements.
The Technical Lead of NGT’s development team reviewed the situation with her Project
Manager, recommending the customer be notified of these implications.
We take leave of the case study now, when NGT is persuading BII for cost and timeline
revisions before further development can proceed.
Interpreting the Metrics
We highlight some key themes of the approach and summarize the results of the case study.
The metrics are meaningful collectively, they together give a view of the process contin-
uum. Mutation Index is calculated with reference to the previous iteration, Component Set
summarizes the design for the current iteration and Dependency Index reflects the potential
effects in the next iteration.
The metrics are essentially indicators, they are meant to facilitate better understanding
65

DI(1) DI(2) DI(3) DI(4)0
0.1
0.2
0.3
0.4
0.5
I_1I_2
Figure 4.2: Variation of DI(n) across Iterations for the Simple Example
and judgment in the inherently subjective exercises of analysis and design.
Overall, the mechanism presented complements existing canons of software engineering.
For example, calculation of Dependency Index is based upon Component Set, which is
populated by component choices backed by common design considerations of cohesion,
coupling etc.
Ideally, a requirement’s low MI(n) value reflects it has not undergone significant change;
an unusually high value may indicate a need to spawn a new requirement or segregate
the original requirement into two or more parts. Similarly, low DI(n) values suggest low
interdependencies; in the limiting case we may have independent components with zero
interaction, an undesirable situation for interactive systems.
On the other hand, a high MI(n) for a requirement may not necessarily be alarming if
the corresponding DI(n) is moderate. Likewise, a high DI(n) for a requirement with a low
MI(n) does not necessitate involved redesign.
The metrics thus signify general directions in the architecture as a system is iteratively
understood, built and refined.
Figures 4.1 and 4.2 show the MI(n) and DI(n) variations across the iterations of the case
study.
66

4.7.2 FSU UCS: Financial Aid Application Project
Florida State University’s (FSU) University Computing Services (UCS) [FSU, 2009] “works
in conjunction with colleges and departments at FSU to provide services to help meet the
University’s computing and networking goals.” As a development project in 2006, existing
paper based Financial Aid Application (FAA) for students was migrated to an online
system. The project involved understanding requirements of the Financial Aid Application
and implementing them on a Web based infrastructure. The development team took the
previously used paper forms as the initial reference and built a system using database, Java
code components, and JavaServer Pages (JSP) to provide the functionality for students to
apply for financial aid online. (The Appendix section gives images of some of the paper
based forms and their online incarnations.)
The Financial Aid Application project followed an iterative and incremental development
life cycle. The project’s context – shifting an application’s functionality from a manual (paper
based) to an online (Web based) approach - introduces tendencies of repeated requirement
changes. This may happen due to the issues faced by users to readjust to the new medium, as
well as changing business drivers to fully harness the new medium’s potential. Thus at each
iteration of development, designers have to grapple with the problem of how best the existing
design can be modified to absorb the effects of the changing requirements. The reasons this
example is suitable for our motivational and illustrative purposes may be summarized as:
• The project follows the iterative and incremental development methodology.
• In each iteration, requirements undergo changes and the design is expected to absorb
the effect of the changes.
• The project allows us to examine real data regarding requirements and design compo-
nents for the initial iteration(s). This example may be extrapolated later as a synthetic
case study for validating the techniques.
• The project develops a software system whose functionality has an intuitive appeal.
• The project is of manageable scope.
FAA’s charter was to build a system hosted on UCS’s computing infrastructure that would
enable students to apply for financial aid through a Web site. Earlier, students applied for
67

Table 4.5: Requirements for the FAA System: Iteration I1
Req ID Brief DescriptionR1 Display financial aid information to users.R2 Allow users to enter enrollment period and record the information and
record the information after validation.R3 Allow users to enter FSU sessions and record the information after
validation.R4 Allow users to enter expected summer resources and record the informa-
tion after validation.R5 Display summary of the user’s enrollment status.
financial aid by filling out paper forms and submitting them to the appropriate FSU office.
On the face of it, the overall requirement was straightforward, take the paper forms as
reference, build Web page(s) to allow the entry of data that the forms asked for, record the
data in a back end database, and inform the user whether his or her information has been
successfully recorded. But for actual development to proceed, individual requirements had
to be clearly specified.
Before we consider the requirements, it will help to clarify some of the roles in the project
we will encounter. Customer(s) denote one or more individuals who have commissioned the
FAA project; in this case those from FSU’s financial services. User(s) denote one or more
individuals who will work with the system when it is released, in this case, FSU’s students
wishing to apply for financial aid. Developer(s) denote one or more individuals from FSU
UCS’s who are involved in the building of the software system. Designer(s) denote one
or more individuals from the developers who are in charge of designing the system. In
the remainder of this chapter, these words will have the connotations given above, unless
otherwise specified.
Table 4.5 gives the brief description of the requirements for the first iteration. This is the
list the developers came up in consultation with the customer and by reviewing the paper
forms in use so far. The naive approach would be to take the requirements at their face value
and devise a set of interacting components that best deliver the collective functionality. Let
us examine the difficulties with the naive approach.
Evidently, the requirements as given in Table 4.5 hint at a direct mapping between
the existing paper based aid application process and the planned software system that will
68

replace it. However, how far does this direct correspondence hold? For example, every
year new paper forms were generated with that year’s dates for Summer terms sessions A,
B, and C. But if such dates are “hard coded” into the software components, every year
they will need to be changed to display that year’s specific dates. Such change will need
additional development effort with related time and cost. So it can be reasonably expected
that customers will soon come up with a modified version of R3 demanding some form of
“dynamic” functionality that will allow changing of every year’s dates “on the fly.” If the
software system has to serve the users for a significant period of time, it will need to have a
design that is resilient to many such drivers of change. From now on, we will use the word
resilient to mean “tending to recover from or adjust easily to misfortune or change as per
one of the definitions given by the online Merriam-Webster dictionary.
While developing a system like FAA, what are the primary concerns of the designer?
The design has to fulfill the requirements as they have been specified for this particular
iteration. However, that is not the only issue designers have to address. Design is also
about delivering the system’s functionality through a set of interacting components which,
in addition to fulfilling current functionality, also leaves reasonable scope for absorbing future
changes. “Reasonable” is a key word in this context – it points to the various trade-offs that
are inherent in the act of design.
Future changes in a system’s set of requirements are difficult to predict at the outset.
However, over the course of a few iterations, it becomes clear some requirements are “more
equal than others” in the sense they undergo more frequent and deep seated changes than
other requirements. We have referred to these as the “volatile requirements.”
An important aspect of designing a system to make it resilient to the effects of changing
requirements is to organize the components such that those fulfilling the volatile requirements
are relatively less dependent on other components. This will help ensure when those
components are modified in response to the changing requirements, the modifications affect
other components to the least extent possible. Towards this end, some important ideas in
the design space need to be explored.
Iteration 1
In the first iteration of development, the following requirements and components were
considered. Requirements Table 4.5 shows the requirements for the first iteration of the
69
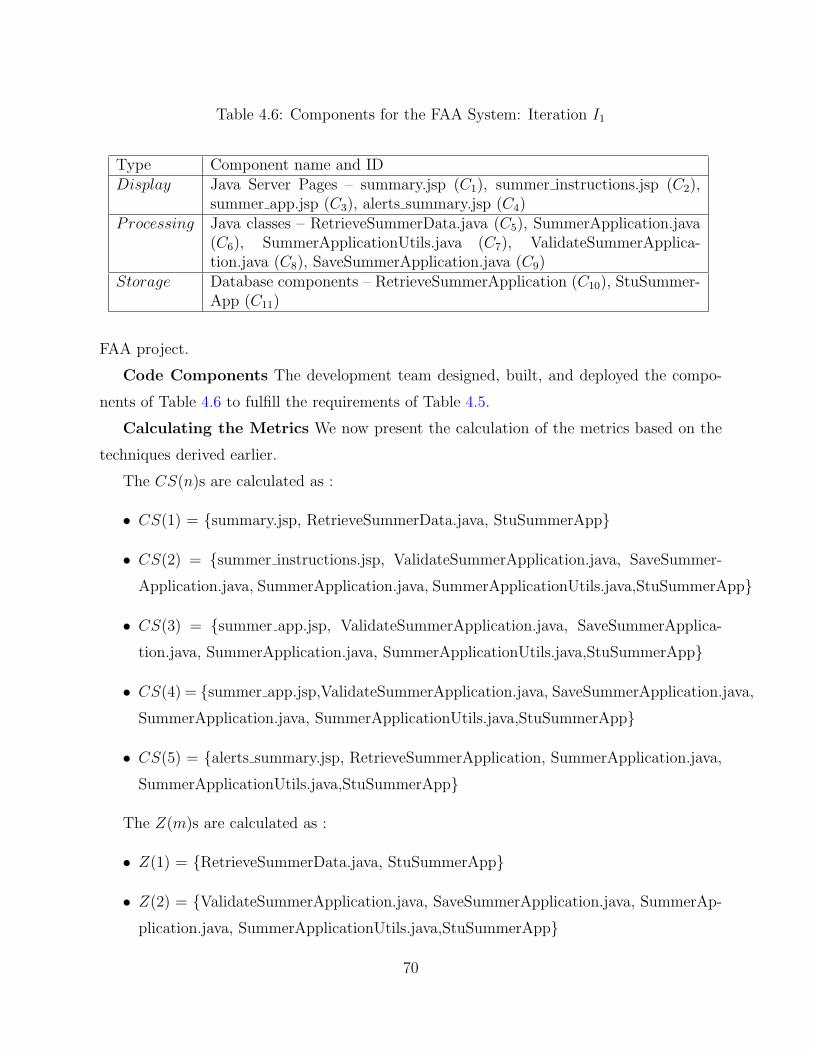
Table 4.6: Components for the FAA System: Iteration I1
Type Component name and IDDisplay Java Server Pages – summary.jsp (C1), summer instructions.jsp (C2),
summer app.jsp (C3), alerts summary.jsp (C4)Processing Java classes – RetrieveSummerData.java (C5), SummerApplication.java
(C6), SummerApplicationUtils.java (C7), ValidateSummerApplica-tion.java (C8), SaveSummerApplication.java (C9)
Storage Database components – RetrieveSummerApplication (C10), StuSummer-App (C11)
FAA project.
Code Components The development team designed, built, and deployed the compo-
nents of Table 4.6 to fulfill the requirements of Table 4.5.
Calculating the Metrics We now present the calculation of the metrics based on the
techniques derived earlier.
The CS(n)s are calculated as :
• CS(1) = summary.jsp, RetrieveSummerData.java, StuSummerApp
• CS(2) = summer instructions.jsp, ValidateSummerApplication.java, SaveSummer-
Application.java, SummerApplication.java, SummerApplicationUtils.java,StuSummerApp
• CS(3) = summer app.jsp, ValidateSummerApplication.java, SaveSummerApplica-
tion.java, SummerApplication.java, SummerApplicationUtils.java,StuSummerApp
• CS(4) = summer app.jsp,ValidateSummerApplication.java, SaveSummerApplication.java,
SummerApplication.java, SummerApplicationUtils.java,StuSummerApp
• CS(5) = alerts summary.jsp, RetrieveSummerApplication, SummerApplication.java,
SummerApplicationUtils.java,StuSummerApp
The Z(m)s are calculated as :
• Z(1) = RetrieveSummerData.java, StuSummerApp
• Z(2) = ValidateSummerApplication.java, SaveSummerApplication.java, SummerAp-
plication.java, SummerApplicationUtils.java,StuSummerApp
70

Table 4.7: Metric Values for the FAA System: Iteration I1
Req MI(m) |Z(m)| DI(m)R1 0 2 0.181R2 0 5 0.455R3 0 6 0.545R4 0 6 0.545R5 0 3 0.273
• Z(3) = summer app.jsp, ValidateSummerApplication.java, SaveSummerApplication.java,
SummerApplication.java, SummerApplicationUtils.java,StuSummerApp
• Z(4) = summer app.jsp, ValidateSummerApplication.java, SaveSummerApplication.java,
SummerApplication.java, SummerApplicationUtils.java,StuSummerApp
• Z(5) = SummerApplication.java, SummerApplicationUtils.java,StuSummerApp
Y is found to be :
• Y = summary.jsp, summer instructions.jsp, summer app.jsp, alerts summary.jsp, Re-
trieveSummerData.java, SummerApplication.java, SummerApplicationUtils.java, Vali-
dateSummerApplication.java, SaveSummerApplication.java, RetrieveSummerApplica-
tion,StuSummerApp Thus |Y | = 11
Table 4.7 summarizes the metrics calculated for iteration 1. We observe R3 and R4 have
the highest Dependency Index values (0.545 each) and R1 has the lowest value of 0.181.
Iteration 2
Changed Requirements The incremental release at the end of iteration 1 provided an
opportunity for the users and customers to work with the new application and give their
feedback. Expectedly, some requirements were changed; Table 4.8 gives the changed version
of requirements.
Recalculating the Mutation Index Based on these changes, we recalculate the
metrics as :
• Changes in R3 involve changes in Display(D) and Storage(S) aspects. Thus, MV (3) =
DS, leading to MI(3) = DS/DPS = 3/6 = 0.5.
71

Table 4.8: Requirements for the FAA System: Iteration I2
Req ID Brief DescriptionR1 Remains unchanged.R2 Remains unchanged.R3 In addition to existing functionality, remove “hard-coding” of Session A,
B, C dates; dates should be dynamically accessed to allow different datesfor different academic years.
R4 n addition to existing functionality, “Receiving a Tuition Waiver?” dropdown list should have more options as supplied by the business partners.
R5 Remains unchanged.
• Changes in R4 involve changes in Display(D) aspects. Thus, MV (4) = D, leading to
MI(4) = D/DPS = 1/6 = 0.17.
Insights and Recommendations In the light of applying the metrics on Iterations 1
and 2 of the UCS project, insights and recommendations are now listed.
• With reference to Table 4.1 and the MI(n) and DI(n) values for R3 and R4 for I2 and
I1 respectively, it can be concluded that the level of impact for R3 is medium and that
for R4 is low-medium.
• At the end of Iteration 1, R3 and R4 had the highest Dependency Index values. This
suggests components fulfilling R3 and R4 had the maximum interaction with other
components of the system.
• In Iteration 2, changes in R3 and R4 cause the Mutation Index values to be
MI(3) = 0.5, MI(4) = 0.17. (Other requirements remained unchanged.)
• Based on the Dependency Index values from Iteration 1 and the Mutation Index
values from Iteration 2, for R3 and R4 its is apparent changes in R3 has the maximum
impact on existing system design.
• For a frequently changing requirement, it is best to have its Dependency Index value
as low as possible, such that its changes do not affect components fulfilling other
requirements. Thus, if R3 is vulnerable to more future changes, the overall design
should be modified to reduce the DI(3) value, through reassigning responsibilities
among components.
72

• This reorganization of design is best done during Iteration 2, to contain the effects
of changing requirements, from “rippling” across the system’s subsequent stages of
evolution.
4.7.3 Morphbank: A Web-based Bioinformatics Application
Background of Morphbank
Morphbank serves the biological research community as an open web repository of images. “It
is currently being used to document specimens in natural history collections, to voucher DNA
sequence data, and to share research results in disciplines such as taxonomy, morphometrics,
comparative anatomy, and phylogenetics” [Morphbank, 2009a]. The Morphbank system uses
open standards and free software to store images and associated data and is accessible to
any biologist interested in storing and sharing digital information of organisms. Morphbank
was founded in 1998 by a Swedish-Spanish-American consortium of systematic entomologists
and is currently being developed and maintained by an interdisciplinary team at the Florida
State University.
Morphbank’s principal goal lies in developing a web-based system to support the
biological sciences in disciplines such as taxonomy, systematics, evolutionary biology, plant
science and animal science. Morphbank facilitates collaboration amongst biological scientists
by allowing for the sharing of specimen images, annotating existing images, remotely curate
natural history collections, and build phylogenetic character matrices.
Morphbank provides features such as browsing, searching, submitting, editing, annotating
of biological specimen data. Since the Morphbank was taken up by the current development
team, the project has passed through releases 2.0, 2.5, with releases 2.7 and 3.0 being planned.
The key element of Morphbank is supporting a collaborative environment. Thus expect-
edly, the requirements undergo frequent changes as different groups of users communicate
their changing needs. We focus our attention on the changing requirements for the Browse
functionality.
Browse Functionality
Morphbank functional areas can be broadly classified into Browse, Search, Submit, Edit,
Annotate etc. [Morphbank, 2009b]. Out of these we choose the Browse functionality for our
case study. This choice is inspired by the fact that Browse has undergone several requirement
73

Table 4.9: Morphbank Browse Requirements across Iterations
Req.ID Morphbank 2.0 Morphbank 2.5R1 Browse by Location Added search facilitiesR2 Browse by Name Added search facilitiesR3 Browse by Specimen Added search facilitiesR4 Browse by View Added search facilitiesR5 Did not exist Browse by Collection with search facilitiesR6 Did not exist Browse by Image with search facilitiesR7 Did not exist Browse by Taxon with search facilities
changes between Morphbank 2.0 to Morphbank 2.5 and changes are also expected in the
future versions. Browse remains by far the most visible of the functional areas; thus user
needs undergo frequent modifications. The major requirements under the Browse functional
area are listed in Table 4.9 and their changes noted from Morphbank 2.0 to Morphbank 2.5.
we will apply the metrics on these requirements and their changes. The changes can be
summarized as: between Morphbank 2.0 and Morphbank 2.5 three new ways of Browsing,
by Collection, by Image, and by Taxon were introduced, as well as Search facilities were
provided from within the Browse interface. The Search feature of Morphbank allows users
to find a specific record or a set of records based on a specific input criteria.
As an example, Browse by View screen image is given in Figure 4.3.
Code Components
Morphbank uses PHP components and the Morphbank and ITIS (Integrated Taxonomic
Information System) [ITIS, 2009] databases to deliver its functionality. Table 4.10 lists the
components for each of the Browse requirements for Morphbank 2.0 and Morphbank 2.5. In
addition, the following common components were used across the requirements:
Common components for Morphbank 2.0
• config.inc.php,footer.inc.php,head.inc.php,
http build query.php,mail.php,menu.inc.php,nusoap.php,
objOptions.inc.php,pop.inc.php,queryLogFunctions.php,
qlODBC.inc.php,thumbs.inc.php,treeview.inc.php,
tsnFunctions.php,webServices.inc.php,
74

Fig
ure
4.3:
Mor
phban
k:
Bro
wse
by
Vie
wScr
een
Imag
e
75

layersmenunoscript.inc.php,
layersmenuprocess.inc.php,template.inc.php
• layersmenu.inc.php,layersmenu.inc.php.orig,
layersmenunoscript.inc.php,layersmenuprocess.inc.php,
template.inc.php
• annotateMenu.php,datescript.js,layersmenu.js,
layersmenubrowser detection.js,layersmenufooter.ijs,
layersmenuheader.ijs,layersmenulibrary.js,layerstreemenu.ijs,
layerstreemenucookies.js
Common components for Morphbank 2.5
• config.inc.php,footer.inc.php,head.inc.php,
http build query.php,mail.php,menu.inc.php,nusoap.php,
objOptions.inc.php,pop.inc.php,queryLogFunctions.php,
sqlODBC.inc.php,thumbs.inc.php,treeview.inc.php,
tsnFunctions.php,webServices.inc.php,
collectionFunctions.inc.php,copyCollection.php,
editExtLinks.php,editjavascript.php,editjavascripts.php,
ExtLinks.php,imageFunctions.php,postItFunctions.inc.php,
showFunctions.inc.php,XML.inc.php,navigation.php
• layersmenu.inc.php,layersmenu.inc.php.orig,
layersmenunoscript.inc.php,layersmenuprocess.inc.php,
template.inc.php
• annotateMenu.php,datescript.js,layersmenu.js,
layersmenubrowser detection.js,layersmenufooter.ijs,
layersmenuheader.ijs,layersmenulibrary.js,
layerstreemenu.ijs,layerstreemenucookies.js,
date.js,determinationJS.inc.php,extLinks.js,general.js,
76

Table 4.10: Morphbank Browse Code Components across Iterations
Req.ID Morphbank 2.0 Morphbank 2.5R1 index.php, mainBrowseByLoca-
tion.phpindex.php, mainBrowseBy-Location.php, resultCon-trols.class.php
R2 index.php, mainBrowseBy-Name.php
index.php, mainBrowseBy-Name.php
R3 index.php, mainBrowseSpeci-men.php
index.php, mainBrows-eSpecimen.php, resultCon-trols.class.php
R4 index.php, mainBrowse-ByView.php
index.php, mainBrowse-ByView.php, resultCon-trols.class.php
R5 Not Applicable index.php, mainBrowseBy-Collection.php, resultCon-trols.class.php
R6 Not Applicable index.php, copyToCollec-tion.php, copyToNewCollec-tion.php,listImageThumbs.inc.php, main-BrowseByImage.php,resultControls.class.php
R7 Not Applicable index.php, mainBrowseByTaxon-Tree.php
gotoRecord.js,localityEdit.js,popupdate.js,
specimenEdit.js,viewEdit.js
• collectionFilter.class.php,filter.class.php,
filters.class.php,keywordFilter.class.php,
localityFilter.class.php,resultControls.class.php,
sort.class.php,specimenFilter.class.php,
tsnFilter.class.php,viewFilter.class.php
There were minor database related changes between Morphbank 2.0 to Morphbank 2.5
but these did not directly affect the Browse functionality. The introduction of the search
mechanism within Browse was handled by the code components.
77

Table 4.11: Metrics for I1 of Morphbank Browse Functionality
Req MI(n) Y |Z(n)| DI(n)R1 0 40 32 0.8R2 0 40 32 0.8R3 0 40 32 0.8R4 0 40 32 0.8R5 - - - -R5 - - - -R5 - - - -
Table 4.12: Metrics for I2 of Morphbank Browse Functionality
Req MI(n) Y |Z(n)| DI(n)R1 0.67 82 61 0.74R2 0.67 82 61 0.74R3 0.67 82 61 0.74R4 0.67 82 61 0.74R5 0 82 61 0.74R6 0 82 61 0.74R7 0 82 61 0.74
Calculating the Metrics
Morphbank 2.0 and Morphbank 2.5 represent incremental releases in the system’s evolution.
We take iteration 1 (I1) and iteration 2 (I2) to be the collection of activities which lead to
these two releases respectively.
Based on the discussion in the earlier sections we calculate the Mutation V alue,
Mutation Index and Dependency Index for I1 and I2 in Table 4.11 and Table 4.12. (As
explained earlier the Component Set is used in an intermediate step in the calculation of
the Dependency Index.) We note the changes to the existing requirements of Morphbank
2.0 to Morphbank 2.5 relate to the Display, and Storage aspects; as search functionality
was added to all of the Browse categories. There was no change in Processing as such, only
modifications to database access logic and presentation. It may be also underlined each PHP
component combines all of Display, Processing, and Storage. Thus change in any one of
these aspects necessitates modification of the component.
78

Interpretation
The MI(n) values for all the requirements in I1 is 0, which is expected, as in the very first
iteration, there is no previous iteration to measure a requirement change against. We find
the DI(n) values for the requirements R1,...,R4 are all 0.8. This is due the fact that as
per the design, different Browse requirements are implemented by independent groups of
components. The only shared components across requirements are the so called common
components listed in an earlier section.
So the dependencies across the components are evenly distributed, although the level
of dependency is significantly high with uniform DI(n) values of 0.8. The changes in
Browse requirements between Morphbank 2.0 and Morphbank 2.5 manifested as additional
functionality for R1,...,R4 and introduction of the new requirements R5, R6, and R7. As
stated above, for all the requirements, the changes were in the Display and Storage aspects,
resulting in the same MV (n) values of DS ≡ 1 + 3 = 4, and hence, MI(n) = 4/6 = 0.67.
Given these MI(n) values for I2 and the high DI(n) values for I1, corresponding to each
requirement, it is expected a significant amount of change in implementation will be needed to
accommodate the modified functionality. Let us examine the extent of code change between
Morphbank 2.0 to Morphbank 2.5.
Validation of Metrics Based Insight
Between I1 and I2, the number of Morphbank Browse components increased by more
than 102% (40 components in Morphbank 2.0 vis-a-vis 81 components in Morphbank 2.5).
Additionally, 45% of the components from I1 were modified in I2 (18 of the 40 components
of Morphbank 2.0 were changed and deployed in Morphbank 2.5). Figure 4.4 shows the
new, changed and unchanged components between Morphbank 2.0 and Morphbank 2.5. To
detect modification of a component, a textual comparison of the corresponding file for I1 and
I2 was done by the Examdiff visual file comparison tool [PrestoSoft, 2009]. The number of
differences between two versions of a component ranged from minimum of 1 to maximum of
41. This empirical data validates the metric based insight of high Dependency Index values
indicating need for significant rework even for changes in requirements related to Display
and Storage (as given by the Mutation Index values).
We observe the DI(n) values for I2 are somewhat lower at 0.74 compared to 0.8 for I1.
79

So the extent of rework for similar mutation of requirements in a subsequent iteration is
expected to be lower than that necessitated in I2. However, as we discuss in the following
section, the trend of requirement changes for the Browse functional area may be better served
in the long run by a different direction of the design.
0102030405060708090
MB2 (Iter 1) MB2.5 (Iter 2)
Iterations
Num
ber o
f Com
pone
nts
New Changed Unchanged
Figure 4.4: Variation of the Number of Code Components for Browse across Iterations forMorphbank 2.0 and 2.5
Observations and Learning
• The metrics in [Datta and van Engelen, 2006] assume a clear separation of concerns in
the system design: separate components implement Display, Processing, and Storage
aspects of a functionality. But the PHP components in Morphbank 2.0 and Morphbank
2.5 combine the implementation of all of these aspects. Although the original approach
is based on the standard n-tier architecture of enterprise software systems, the metrics
are equally applicable in the Morphbank scenario. This was established in the preceding
sections by the close correlation of the prediction from the metrics and the empirical
data on the extent of code change between Morphbank 2.0 and Morphbank 2.5.
• The existing Morphbank architecture makes the implementation of each requirement
as concentrated as possible amongst a small number of components. This uniformity
is reflected by the same DI(n) values for all the requirements in both in first and the
second iteration. A high degree of component independence is expected to insulate the
components to a large extent from the effects of changing requirements. However
indications from elevated DI(n) values as well as empirical evidence cited above
80

suggest significant changes in the code between I1 and I2. How do we reconcile this
contradiction?
• It is important to note there is a large body of common components across all of
Browse requirements. This group contributes heavily in increasing the dependencies
between the requirements and pushing up the respective DI(n) values. These common
components occur in more than 61% (11 out of 18) of the changes to existing
components and more than 70% (29 out of 41) of the new components introduced,
between I1 and I2. This in effect destroys much of the modularity of the underlying
design, where small sets of independent components service each requirement.
• One of the vital insights we have gained into the workings of systems with changing
requirements may be expressed as (paraphrasing the enduring motto of George Orwell’s
Animal Farm): some requirements are more equal than others. This boils down to the
fact that every system will have requirements which are more used by users and subject
to greater changes, compared to other more stable ones. The DI(n) values for these
“more equal” requirements have to be as low as possible, such that no matter how high
their MI(n) values are for a particular iteration, the changes can be absorbed with
minimal impact. So every requirement with same DI(n) value indicates an uniformity
of design that affects the system’s ability to respond to changing requirements without
much rework. It is expedient to implement requirements that change most in a
way their components are the most loosely coupled in the system, with other less
volatile requirements being serviced by more closely meshed components. These design
tradeoffs are guided by the metrics. An optimal distribution of responsibility across
the components will facilitate maximum responsiveness to changing requirements with
minimal overall impact.
Recommendations
In view of the above discussion, the following recommendations are given:
• Given that Browse functionality is likely to undergo frequent changes in the future (for
instance, there is likely to be a requirement to provide a different taxonomic structure
to search which is not provided through ITIS), we suggest the Morphbank design
81

be modified to reflect clearer separation of concerns across components. Display,
Processing, and Storage aspects of a requirement’s fulfillment should be implemented
by separate, interacting components instead of ones doing all of these by themselves.
This will ensure when a changing requirement affects one aspect, there is higher
localization of corresponding code changes: if only the user interface changes there
will be no need to modify components which also have database access logic in them,
and so on.
• As Morphbank’s services are preeminently web based, a Web-Service based architecture
may offer better scalability. This will entail more intense development effort in the short
run, which will be offset by the long term benefits in enhancement and maintenance.
• In the Browse functionality of Morphbank 2.0 and Morphbank 2.5 there is very little
of what is called “business logic.” However as the scope of the system is expanded in
the future it is not unlikely there will be a need for more processing between the access
and display of information. So introducing to a Model-View-Controller (MVC) pattern
of architecture will be helpful.
4.8 Summary
In this chapter, we introduced the REQ-CHANGE technique. In the context of the chapter’s
hypothesis, it may be noted that REQ-CHANGE provides a quantitative indication of the
level of impact of changing requirements on software components. The predicted impact
was also correlated with actual observations. Examination of the hypothesis leads us to a
number of open issues and scope of future work; these are discussed in detail in Chapter 13.
It is helpful to have a quantitative understanding of the impact of changing requirements.
But how can the interaction of components be guided to mitigate such impact? This question
is addressed in the next chapter.
82

CHAPTER 5
COM-REF: A TECHNIQUE TO GUIDE THE
DELEGATION OF RESPONSIBILITIES TO
COMPONENTS IN SOFTWARE SYSTEMS
5.1 Overview
In software systems, components collaborate to collectively fulfill requirements. A key
concern of software design is the delegation of responsibilities to components such that user
needs are most expediently met. This chapter presents the COMP-REF technique based
on a set of metrics and Linear Programming (LP) to guide the allocation of responsibilities
of a system’s components. The metrics Aptitude Index, Requirement Set, and Concordance
Index are defined to extract some design characteristics and these metrics are used in our
optimization algorithm. Results from experimental validation of the COMP-REF technique
across a range of software systems are reported. I also discuss future directions of work in
extending the scope of technique.
5.2 Motivation
Larman has called the ability to assign responsibilities as a “desert-island skill” [Larman, 1997],
highlighting its criticality in the software development process. Indeed, deciding which
component does what remains an important challenge for the software designer. Ideally,
each component should perform a specialized task and cooperate with other components to
deliver the system’s overall functionality. But very often responsibilities are delegated to
components in an ad-hoc manner, resulting in components that try to do almost everything
by themselves or those that depend extensively on other components for carrying out their
primary tasks. During initial design, it is not unusual to spawn a new component for every
83

new bit of functionality that comes to light. As design matures, many of these components
are best combined to form a compact set of components, whose each member is strongly
focused on its task and interacts closely with other components to deliver the overall system
functionality. The intrinsically iterative nature of software design offers opportunities for
such re-organization of components.
However, this kind of design refinement usually depends on intuition, experience, and
nameless “gut-feelings” of designers. In this chapter we introduce the COMP-REF technique
to guide such refinement of components using a set of metrics and a Linear Programming
based optimization algorithm. Upon its application, the technique recommends merging
of certain components, whose current roles in the system warrant their responsibilities be
delegated to other components, and they be de-scoped. Recognizing the deeply reflective
nature of software design, COMP-REF seeks to complement a designer’s judgment by
abstracting some basic objectives of component interaction and elucidating some of the
design choices.
Before going into the details of our approach it will be helpful to clarify the meaning of
certain terms in the context of this chapter.
• A requirement is described as “... a design feature, property, or behavior of a system”
by Booch, Rumbaugh, and Jacobson [Booch et al., 2005]. These authors call the
statement of a system’s requirements the assertion of a contract on what the system
is expected to do. How the system does that is essentially the designer’s call.
• A component carries out specific responsibilities and interacts with other components
through its interfaces to collectively deliver the system’s functionality (of course, within
acceptable non-functional parameters).
• A collaboration is described in the Unified Modeling Language Reference Manual,
Second Edition as a “... society of cooperating objects assembled to carry out some
purpose” [Rumbaugh et al., 2005]. Components collaborate via messages to fulfill their
tasks.
• “Merging” of a particular component will be taken to mean distributing its responsi-
bilities to other components in the system and removing the component from the set of
84

components fulfilling a given set of requirements. So after merging, a set of components
will be reduced in number, but will be fulfilling the same set of requirements as before.
• In this chapter “compact” in the context of a set of components will be taken to mean
designed to be small in size.
We also assume COMP-REF technique is applicable in an iterative development scenario.
This is a reasonable assumption, since even if the iterative and incremental model is not
officially being followed, it is widely accepted that software design is an iterative activity.
In the next sections, we present a model for the software development space as a basis for
the COMP-REF technique, introduce the ideas of aptitude and concordance, formally define
our set of metrics, discuss the background and intuition behind the COMP-REF technique
and present its steps. We then report results of experimental validation of the technique,
highlight some related work and conclude with a discussion of open issues and directions of
future work.
5.3 A Model for the Software Development Space
In order to examine the dynamics of software systems through a set of metrics, a model
is needed to abstract the essential elements of interest. With reference to Figure 3.1, it is
noted: The development space consists of the set requirements Req = R1, ..., Rx of the
system, which are fulfilled by the set of components Comp = C1, ..., Cy.We take fulfillment to be the satisfaction of any user defined criteria to judge whether
a requirement has been implemented. Fulfillment involves delivering the functionality rep-
resented by a requirement. A set of mapping exists between requirements and components,
we will call this relationships. At one end of a relationship is a requirement, at the other
ends are all the components needed to fulfill it. Requirements also mesh with one another
– some requirements are linked to other requirements, as all of them belong to the same
system, and collectively specify the overall scope of the system’s functionality. The links
between requirements are referred to as connections. From the designer’s point of view, of
most interest is the interplay of components. To fulfill requirements, components need to
collaborate in some optimal ways, this is referred to as the interaction of components.
Thus one aspect of the design problem may be viewed as: given a set of connected
requirements, how to devise a set of interacting components, such that the requirements and
85

components are able to forge relationships that deliver the system’s functionality within given
constraints?
Based on this model, the COMP-REF technique uses metrics to examine the interaction
of components and suggest how responsibilities can be re-aligned. Before the metrics are
formally defined, we introduce the notions of aptitude and concordance in the next section.
5.4 The Concepts of Aptitude and Concordance
Every software component exists to perform specific tasks, which may be called its responsi-
bilities. The canons of good software design recommend that each component be entrusted
with one primary responsibility. In practicality, components may end up being given more
than one task, but it is important to try and ensure they have one primary responsibility.
Whether components have one or more responsibilities, they can not perform their tasks
entirely by themselves, without any interaction with other components. This is specially true
for the so-called business objects – components containing the business logic of an application.
The extent to which a component has to interact with other components to fulfill its core
functionality is an important consideration. If a component’s responsibilities are strongly
focused on a particular line of functionality, its interactions with other components can be
expected to be less disparate. Let us take aptitude to denote the quality of a component that
reflects how coherent its responsibilities are. Intuitively, the Aptitude Index measures the
extent to which a component (one among a set fulfilling a system’s requirements) is coherent
in terms of the various tasks it is expected to perform.
As reflected upon earlier, the essence of software design lies in the collaboration of
components to collectively deliver a system’s functionality within given constraints. While
it is important to consider the responsibility of individual components, it is also imperative
that inter-component interaction be clearly understood. Software components need to work
together in a spirit of harmony if they have to fulfill requirements through the best utilization
of resources. Let us take concordance to denote such cooperation amongst components. How
do we recognize such cooperation? It is manifested in the ways components share the different
tasks associated with fulfilling a requirement. Some of the symptoms of less than desirable
cooperation are replication of functionality – different components doing the same task for
different contexts, components not honoring their interfaces (with other components) in
the tasks they perform, one component trying to do everything by itself etc. The idea of
86

concordance is an antithesis to all such undesirable characteristics – it is the quality which
delegates the functionality of a system across its set of components in a way such that it
is evenly distributed, and each task goes to the component most well positioned to carry it
out. Intuitively, the metric Concordance Index measures the extent to which a component
is concordant in relation to its peer components in the system.
How do these ideas relate to cohesion and coupling? Cohesion is variously defined as
“... software property that binds together the various statements and other smaller modules
comprising the module” [Dhama, 1995] and “... attribute of a software unit or module
that refers to the relatedness of module components” [Bieman and Ott, 1994]. (In the
latter quote, “component” has been used in the sense of part of a whole, rather than a
unit of software as is its usual meaning in this chapter.) Thus cohesion is predominantly
an intra-component idea – pointing to some feature of a module that closely relates its
constituents to one another. But as discussed above, concordance carries the notion of
concord or harmony, signifying the spirit of successful collaboration amongst components
towards collective fulfillment of a system’s requirements. Concordance is an inter-component
idea; the concordance of a component can only be seen in the light of its interaction with
other components.
Coupling has been defined as “... a measure of the interdependence between two
software modules. It is an intermodule property” [Dhama, 1995]. Thus coupling does
not take into account the reasons for the so called “interdependence” – that modules
(or components) need to cooperate with one another as they must together fulfill a set
of connected requirements. In the same vein as concordance, aptitude is also an intra-
component idea, which reflects on a component’s need to rely on other components to fulfill
its primary responsibility/responsibilities.
Cohesion and coupling are legacy ideas from the time when software systems were
predominantly monolithic. In the age of distributed systems, successful software is built
by carefully regulating the interaction of components, each of which are entrusted with
clearly defined responsibilities. The perspectives of aptitude, and concordance – explored
intuitively in this section, with metrics based on them formally defined in the next section
– complement cohesion and coupling in helping recognize, isolate, and guide design choices
that will lead to the development of usable, reliable, and evolvable software systems.
87

5.5 Defining the Metrics
Considering a set of requirements Req = R1, ..., Rx and a set of components Comp =
C1, ..., Cy fulfilling it, we define the metrics in the following sub-sections:
5.5.1 Aptitude Index
The Aptitude Index seeks to measure how coherent a component is in terms of its responsi-
bilities.
To each component Cm of Comp, we attach the following properties [Datta, 2006a]. A
property is a set of zero, one or more components.
• Core - α(m)
• Non-core - β(m)
• Adjunct - γ(m)
α(m) represents the set of component(s) required to fulfill the primary responsibility of
the component Cm. As already noted, sound design principles suggest the component itself
should be in charge of its main function. Thus, most often α(m) = Cm.β(m) represents the set of component(s) required to fulfill the secondary responsibilities
of the component Cm. Such tasks may include utilities for accessing a database, date or
currency calculations, logging, exception handling etc.
γ(m) represents the component(s) that guide any conditional behavior of the component
Cm. For example, for a component which calculates interest rates for bank customers with
the proviso that rates may vary according to a customer type (“gold”, “silver” etc.), an
Adjunct would be the set of components that help determine a customer’s type.
Definition 4 The Aptitude Index AI(m) for a component Cm is a relative measure of
how much Cm depends on the interaction with other components for delivering its core
functionality. It is the ratio of the number of components in α(m) to the sum of the number
of components in α(m), β(m), and γ(m)
AI(m) =|α(m)|
|α(m)|+ |β(m)|+ |γ(m)|(5.1)
88

5.5.2 Requirement Set
Definition 5 The Requirement Set RS(m) for a component Cm is the set of requirements
that need Cm for their fulfillment.
RS(m) = Rp, Rq, ... (5.2)
where Cm participates in the fulfillment of Rp, Rq etc.
Evidently, for all Cm, RS(m) ⊆ Req.
5.5.3 Concordance Index
Definition 6 The Concordance Index CI(m) for a component Cm is a relative measure of
the level of concordance between the requirements being fulfilled by Cm and those being fulfilled
by other components of the same system.
For a set of components Comp = C1,C2,...,Cn,...,Cy−1,Cy let,
W = RS(1) ∪RS(2) ∪ ... ∪RS(y − 1) ∪RS(y)
For a component Cm (1 ≤ m ≤ y), let us define,
X(m) = (RS(1) ∩RS(m)) ∪ ... ∪ ((RS(m− 1) ∩RS(m)) ∪((RS(m) ∩ (RS(m + 1)) ∪ ... ∪ ((RS(m) ∩ (RS(y))
Thus X(m) denotes the set of requirements that are not only being fulfilled by Cm but
also by some other component(s).
Expressed as a ratio, the Concordance Index CI(m) for component Cm is:
CI(m) =|X(m)||W |
(5.3)
5.6 COMP-REF: A Technique to Refine theOrganization of Components
COMP-REF is a technique to guide design decisions towards allocating responsibilities to
a system’s components. As in human enterprises, for a successful collaboration, software
components are expected to carry out their tasks in a spirit of cooperation such that each
component has clearly defined and specialized responsibilities, which it can deliver with
89

reasonably limited amount of support from other components. Aptitude Index measures
how self sufficient a component is in carrying out its responsibilities, and Concordance Index
is a measure of the degree of its cooperation with other components in the fulfillment of the
system’s requirements. Evidently, it is desired that cooperation across components would
be as high as possible, within the constraint that each requirement will be fulfilled by a
limited number of components. This observation is used to formulate an objective function
and a set of linear constraints whose solution gives a measure of how much each component
is contributing to maximizing the concordance across the entire set of components. If a
component is found to have low contribution (low value of the an variable corresponding
to the component in the LP solution as explained below), and it is not significantly self-
sufficient in carrying out its primary responsibility (low Aptitude Index value) the component
is a candidate for being de-scoped and its tasks (which it was hardly executing on its own)
distributed to other components. This results in a more compact set of components fulfilling
the given requirements.
The goal of the COMP-REF technique is identified as maximizing the Concordance
Index across all components, for a given set of requirements, in a particular iteration of
development, within the constraints of not increasing the number of components currently
participating in the fulfillment of each requirement.
A new variable an (an ∈ [0, 1]) is introduced corresponding to each component Cn,
1 ≤ n ≤ N , where N = the total number of components in the system. The values of an
are arrived at from the LP solution. Intuitively, an for a component Cn can be taken to
indicate the extent to which Cn contributes to maximizing the Concordance Index across all
components. As we shall see later, the an values will help us decide which components to
merge.
The LP formulation can be represented as:
Maximize
y∑n=1
CI(n)an
Subject to: ∀Rm ∈ Req,
y∑n=1
an ≤ pm/N , an such that Cn ∈ CS(m). pm = |CS(m)|. (As
defined in [Datta and van Engelen, 2006], the Component Set CS(m) for a requirement Rm
is the set of components required to fulfill Rm.)
So, for a system with x requirements and y components, the objective function will have
90

y terms and there will be x linear constraints.
The COMP-REF technique is summarized as: Given a set of requirements Req =
R1, ..., Rx and a set of components Comp = C1, ..., Cy fulfilling it in iteration Iz of
development,
• STEP 0: Review Req and Comp for new or modified requirements and/or components
compared to previous iteration.
• STEP 1: Calculate the Aptitude Index for each component.
• STEP 2: Calculate the Requirement Set for each component.
• STEP 3: Calculate the Concordance Index for each component.
• STEP 4: Formulate the objective function and the set of linear constraints.
• STEP 5: Solve the LP formulation for the values of an
• STEP 6: For each component Cn, check:
– Condition 6.1: an has a low value compared to that of other components? (If yes,
implies Cn is not contributing significantly to maximizing the concordance across
the components.)
– Condition 6.2: AI(n) has a low value compared to that of other components? (If
yes, implies Cn has to rely heavily on other components for delivering its core
functionality.)
• STEP 7: If both conditions 6.1 and 6.2 hold TRUE, GOTO STEP 8, else GOTO
STEP 10
• STEP 8: For Cn, check:
– Condition 8.1: Upon merging Cn with other components, in the resulting set
Comp of q components (say), CI(q) 6= 0 for all q? (If yes, implies resulting set of
q components has more than one component).
• STEP 9: If condition 8.1 is TRUE, Cn is a candidate for being merged; after merging
components Cn GOTO STEP 0, starting with Req and Comp, else GOTO STEP 10.
91

• STEP 10: Wait for the next iteration.
Figure 5.1 outlines the COMP-REF technique.
5.7 Experimental Validation
In this section we present results from our experimental validation of the COMP-REF
technique.
5.7.1 Validation Strategy
We have applied the COMP-REF technique on the following variety of scenarios to better
understand its utility and limitations.
• A “text-book” example – The Osbert Oglesby Case Study is presented in Schach’s
software engineering textbook [Schach, 2005] as a software development project across
life cycle phases and workflows. Using the Java and database components given as
part of the design, we use the COMP-REF technique to suggest a reorganization of
components and examine its implication on the design thinking outlined in the study.
• The Financial Aid Application (FAA) project – Florida State University’s
University Computing Services [FSU, 2009] is in charge of meeting the university’s
computing and networking goals. As a development project in 2006, existing paper
based Financial Aid Application (FAA) was migrated to an online system. The
development team took the previously used paper forms as the initial reference and
built a system using JavaServer Pages (JSP), Java classes, and a back-end database to
allow students to apply for financial aid over the Web. The COMP-REF technique is
applied to suggest the merging of some of the components and its effect discussed on
the overall design.
• Morphbank: A Web-based Bioinformatics Application – Morphbank serves
the biological research community as an open web repository of images. “It is
currently being used to document specimens in natural history collections, to voucher
DNA sequence data, and to share research results in disciplines such as taxonomy,
morphometrics, comparative anatomy, and phylogenetics” [Morphbank, 2009a]. The
92

A. W
ait f
orne
w it
erat
ion
AI(
n) i
s rel
ativ
ely
low
?
a n is
rela
tivel
y lo
w?
B. C
alcu
late
m
etri
csC
. For
mul
ate
LP
D. S
olve
LP
Yes Y
es
For
each
Cn
E. W
ill m
ergi
ng C
nle
ad to
a m
onol
ithic
sy
stem
?
No
F. C
nis
a ca
ndid
ate
for
mer
ging
!
Go
to A
.
NoN
o
Yes
A. W
ait f
orne
w it
erat
ion
AI(
n) i
s rel
ativ
ely
low
?
a n is
rela
tivel
y lo
w?
B. C
alcu
late
m
etri
csC
. For
mul
ate
LP
D. S
olve
LP
Yes Y
es
For
each
Cn
E. W
ill m
ergi
ng C
nle
ad to
a m
onol
ithic
sy
stem
?
No
F. C
nis
a ca
ndid
ate
for
mer
ging
!
Go
to A
.
NoN
o
Yes
Fig
ure
5.1:
CO
MP
-RE
F:O
utlin
eof
the
Tec
hniq
ue
93

Morphbank system uses open standards and free software to store images and asso-
ciated data and is accessible to any biologist interested in storing and sharing digital
information of organisms. The COMP-REF technique investigates whether the overall
design can be streamlined by a re-allocation of responsibilities across components and
retiring some of them.
• FileZilla: An open source project – “FileZilla is a fast FTP and SFTP client
for Windows with a lot of features. FileZilla Server is a reliable FTP server”
[FileZilla, 2009]. We use COMP-REF to examine FileZilla’s allocation of component
responsibilities.
• The SCIT Workshop – Symbiosis Center for Information Technology (SCIT)
[SCIT, 2009] is a leading academic institution in India, imparting technology and
management education at the graduate level. Twenty five first-year students of the
two year Master of Business Administration – Software Development and Management
(MBA-SDM) graduate program participated in an workshop conducted by us. All
the students had undergraduate degrees in science or engineering, and about half of
them had prior industrial experience in software development. The students were
divided into two groups with an even distribution of experience and exposure to
software development ideas. Each group was in turn divided into two teams, customer
and developer. The objective of the workshop was to explore how differently the
same software system will be designed, with and without the use of the COMP-REF
technique. Accordingly, each group was given the high level requirements of a contrived
software project of building a Web application for a bank, where its customers can
access different banking services. Within each group, the developer team interacted
with the customer team to come up with a design in terms of interacting components
that best met the requirements. The COMP-REF technique was applied in guiding
the design choices of one group, which we will call Group A, while the other group,
Group B, had no such facility. The workshop provided valuable insights into how
COMP-REF can complement (and at times constrain) the intuition behind software
design. We wish to thank Ms.Shaila Kagal, Director, SCIT for her help and support
in conducting the study.
94

Table 5.1: COMP-REF: Experimental Validation Results
System Scope and Technology Parameters FindingsOsbertOglesbyCaseStudy
A detailed case study acrosssoftware development lifecycle workflows and phasespresented in [Schach, 2005],using Java and databasecomponents.
Three require-ments, eighteencomponents.
COMP-REFsuggested 27% ofthe components canbe merged with othercomponents.
FAAproject
Migration of paper basedstudent aid application sys-tem to a Web based system,using Java and databasecomponents.
Five require-ments, elevencomponents.
COMP-REFsuggested 18% ofthe components canbe merged withother components.Detailed calculationand interpretationgiven in Section 6.2 ofthis paper.
Morphbank A Web-based collaborativebiological research tool us-ing PHP and database com-ponents. We studied theBrowse functional area.
Seven require-ments, eighty-one components.
The results of apply-ing COMP-REF wereinconclusive. Almostall the components ex-ecuting common tasksacross functional areas(around 75% of the to-tal number of compo-nents) are suggestedto be potential candi-dates for merging.
5.7.2 Presentation and Interpretation of the Results
We illustrate the application of COMP-REF in the FAA project in detail. The summary of
all the validation scenarios are presented in Tables 5.1 and 5.2 .
Table 4.5 gives brief description of the requirements for the first iteration of the FAA
project.
The RS(m) column of Table 5.2 shows the Requirement Set for each component.
Evidently, W = R1, R2, R3, R4, R5 and |W | = 5. The AI(m) and CI(m) columns
95

Table 5.2: COMP-REF: Experimental Validation Results contd.
System Scope and Technology Parameters FindingsFileZilla A fast and reliable cross-
platform FTP, FTPS andSFTP client using C/C++.
As this isa softwareproduct vis-a-vis a project,there are nouser definedrequirements;three major linesof functionalityand aroundone thirty eightcomponents(ignoring headerfiles).
While applyingCOMP-REF,difficulties werefaced in correlatingrequirementswith components.Assuming very coarse-grained requirements,COM-REF did notfind valid justificationfor merging anotable percent ofcomponents.
SCITworkshop
Two separate groups de-signed a contrived softwaresystem of a Web basedbanking application usingJava and database compo-nents. One group (GroupA) was allowed the useof the COMP-REF tech-nique, while the other group(Group B) was not. GroupA and Group B were obliv-ious of one another’s designchoices.
Three require-ments; GroupA had eightcomponents,Group B hadtwelve.
Group A’s compo-nents 33% fewer thanGroup B’s, they alsohad cleaner interfacesand smaller numberof inter-componentmethod calls. Itappears COMP-REFhelped Group Adeliver the samefunctionality througha more compact set ofcomponent by beingable to use COMP-REF in intermediatestages of design.
96

Tab
le5.
3:M
etri
csVal
ues
and
LP
solu
tion
for
iter
atio
nI 1
ofth
eFA
ASyst
em
Cm
Com
pon
ent
nam
eR
S(n
)α(n
)β(n
)γ(n
)A
I(n
)|X
(n)|
CI(n
)a
n
C1
sum
mar
y.js
pR
1C
1C
5,C
11
-0.
331
0.2
0.25
C2
sum
mer
inst
ruct
ions.
jsp
R2
C2
C8,C
9,C
6,C
11
C7
0.17
10.
20.
4C
3su
mm
erap
p.jsp
R3,R
4C
3C
8,C
9,C
6,C
11
C7
0.17
20.
40.
4C
4al
erts
sum
mar
y.js
pR
5C
4C
10,C
6,C
11
C7
0.2
10.
20.
3C
5R
etriev
eSum
mer
Dat
a.ja
vaR
1C
5C
8,C
11
-0.
331
0.2
0C
6Sum
mer
Applica
tion
.jav
aR
2,R
3,R
4,R
5C
6C
8,C
9C
30.
254
0.8
0.13
C7
Sum
mer
Applica
tion
Uti
ls.jav
aR2,R
3,R
4,R
5C
7-
-1
40.
80
C8
Val
idat
eSum
mer
Applica
tion
.jav
aR2,R
3,R
4C
8-
-1
20.
40
C9
Sav
eSum
mer
Applica
tion
.jav
aR
2,R
3,R
4C
9C
10,C
11
C3
0.25
20.
40
C10
Ret
riev
eSum
mer
Applica
tion
R5
C10
-C
70.
51
0.2
0C
11
Stu
Sum
mer
App
R1,R
2,R
3,R
4,R
5C
11
--
15
10.
02
97

of Table 5.2 give the Aptitude Index and the Concordance Index values respectively for each
component.
From the design artifacts, we noted that R1 needs components C1, C5, C11 (p1 = 3),
R2 needs C2, C6, C7, C8, C9, C11 (p2 = 6), R3 needs C3, C6, C7, C8, C9, C11 (p3 = 6), R4 needs
C3, C6, C7, C8, C9, C11 (p4 = 6), and R5 needs C4, C6, C7, C10, C11 (p5 = 5) for their respective
fulfillment. Evidently, in this case N = 11.
Based on the above, the objective function and the set of linear constraints was formulated
as:
Maximize
0.2a1 + 0.2a2 + 0.4a3 + 0.2a4 + 0.2a5 + 0.8a6 + 0.8a7 + 0.4a8 + 0.4a9 + 0.2a10 + a11
Subject to
a1 + a5 + a11 ≤ 0.27
a2 + a6 + a7 + a8 + a9 + a11 ≤ 0.55
a3 + a6 + a7 + a8 + a9 + a11 ≤ 0.55
a3 + a6 + a7 + a8 + a9 + a11 ≤ 0.55
a4 + a6 + a7 + a10 + a11 ≤ 0.45
Using the automated solver, GIPALS (General Interior-Point Linear Algorithm Solver)
[Optimalon, 2009], the above LP formulation was solved (values in the an column of
Table 5.2).
Let us examine how the COMP-REF technique can guide design decisions. Based on the
an values in Table 5.2, evidently components C5, C7, C8, C9, C10 have the least contribution
to maximizing the objective function. So the tasks performed by these components may be
delegated to other components. However, as mandated by COMP-REF, another factor needs
be taken into account before deciding on the candidates for merging. How self-sufficient
are the components that are sought to be merged? We next turn to AI(n) values for
the components in Table 5.2. We notice, AI(5) = 0.33, AI(7) = 1, AI(8) = 1, AI(9) =
0.25, and AI(10) = 0.5. Thus C7, C8 and C10 have the highest Aptitude Index values.
These are components delivering functionalities of general utility, user input validation and
database access logic respectively – facilities used across the application. Thus it is expedient
to keep them localized. But C5 and C9, as their relatively low values of AI(n) suggest,
need to interact significantly with other components to carry out their task. And given
98

C_1 C_2 C_3 C_4 C_5 C_6 C_7 C_8 C_9 C_10 C_110
0.1
0.2
0.3
0.4
0.5
0.6
0.7
0.8
0.9
1
C5 and C
9
may be reorganized
0
0 .0 5
0 .1
0 .15
0 .2
0 .2 5
0 .3
0 .3 5
0 .4
0 .4 5
a _ 1 a _ 2 a _ 3 a _ 4 a _ 5 a _ 6 a _ 7 a _ 8 a _ 9 a _ 10 a _ 11
Figure 5.2: an values from LP solution(top) and AI(n) vs. Cn (bottom)
their negligible contribution to maximizing concordance; a helpful design choice would be
to merge them with other components. A smaller set of high concordance components is
preferred over a larger set of low concordance ones, as the former has lesser inter-component
interaction, thereby leading to better resilience to modification of particular components due
to requirement changes. Figure 5.2 summarizes these discussions, suggesting reorganization
of the two components through merging.
Thus one cycle of application of the COMP-REF technique suggests the reduction of the
number of components from eleven to nine (18%) in fulfilling the set of requirements for the
first iteration of the FAA project.
99

5.8 Related Work
Although it is common to use the terms measure, measurement and metrics in place
of one another, some authors have underscored subtle distinctions [Pressman, 2000],
[Baker et al., 1990], [Fenton, 1994]. For our discussion, we have taken metrics to mean “a set
of specific measurements taken on a particular item or process” [Berard, 1995]. Metrics for
analysis include the closely reviewed function point based approaches [Albrecht, 1979] and
the Bang metric [DeMarco, 1982]. Card and Glass [Card and Glass, 1990] have proposed
software design complexity in terms of structural complexity, data complexity and system
complexity. [McCabe, 1976] identifies some important uses of complexity metrics. Fenton
underscores the challenges of trying to formulate general software complexity measures
[Fenton, 1994]. Chidamber and Kemerer present a widely referenced set of object oriented
software metrics in [Chidamber and Kemerer, 1991], [Chidamber and Kemerer, 1994]. Har-
rison, Counsell and Nithi have evaluated a group of metrics for calibrating object-oriented
design [Harrison et al., 1998].
Freeman’s paper, Automating Software Design, is one of the earliest expositions of
the ideas and issues relating to design automation [Freeman, 1973]. Karimi et al.
[Karimi and Konsynski, 1988] report their experiences with the implementation of an au-
tomated software design assistant tool. Ciupke presents a tool based technique for analyzing
legacy code to detect design problems [Ciupke, 1999]. O’Keeffe et al. present an approach
towards automatically improving Java design [O’Keeffe and Cinneide, 2003]. Jackson’s
group are working on the Alloy Analyzer tool employs “automated reasoning techniques
that treat a software design problem as a giant puzzle to be solved” [Jackson, 2006b].
This current chapter extends our ongoing research in understanding the effects of
changing requirements on software systems, the role of metrics as design heuristics, and
how the development life cycle can tune itself to the challenges of enterprise software
development [Datta and van Engelen, 2006],[Datta, 2006b], [Datta, 2006a], [Datta, 2005],
[Datta et al., 2007]. Particularly, [Datta and van Engelen, 2006] explores the relationship
between requirements and components from another perspective.
100

5.9 Discussion
From the summary of the experimental results in Tables 5.1 and 5.2, it is apparent COMP-
REF is able to give conclusive recommendations in some of the validation scenarios. Let
us reflect on the scenarios its suggestions are inconclusive. In the case of Morphbank, the
system does not follow a clear separation of functionality in delegating responsibilities to its
components. For FileZilla, it is difficult to extract clearly defined requirements and correlate
them with corresponding components. This is not unusual for a software product, vis-a-vis
a software development project, where a system is built to fulfill user given requirements.
From the validation results so far, COMP-REF appears to work best for systems that have a
clear set of requirements, follows the n-tier architecture paradigm and use object orientation
to ensure a clear separation of concerns. We expect to scrutinize this conclusion further
through ongoing case studies. The scalability of the technique also needs to be tested on
very large scale systems and across many iterations of development.
COMP-REF suggests the merging of components. The in-built safeguards within the
technique (STEP 8) ensures it will not lead to a single component monolithic system. The
underlying assumption behind COMP-REF is that fewer components delivering the same
functionality is better than a larger number of components, on grounds of more streamlined
inter-component interaction, reduced communication overheads between members of the
team developing the software, and better localization of the effects of inevitable changes
in requirements [Datta and van Engelen, 2006]. In some cases there may be a need to split
components instead of merging them. We plan to extend the technique to cover this aspect in
future work. We are also working on developing an automated tool using the Eclipse platform
[Eclipse, 2009] that will parse design artifacts (such as Unified Modeling Language diagrams),
apply COMP-REF and present a set of recommendations. This tool integrates COMP-REF
with our earlier work on a mechanism to track the effects of changing requirements on
software systems [Datta and van Engelen, 2006]. Initial results from applying the tool are
very promising.
5.10 Summary
In this chapter I presented COMP-REF as a promising technique to guide the organization
of components in software systems through merging. COMP-REF is meant to complement,
101

and certainly not replace, the intuitive and subjective aspects of software design. Results
from applying the technique on a variety of systems were presented, which helped validate the
hypothesis. Experimental data suggests COMP-REF works best for object-oriented systems
using n-tiered architecture that fulfill user requirements.
As evident from the discussion of this chapter, COMP-REF can only recommend
reorganization through merging. In some situations, can there be a need to split a component
to facilitate a better organization of responsibilities? In the next chapter, I explore the
implications of this question further.
102

CHAPTER 6
RESP-DIST: A REFINEMENT OF THE COMP-REF
TECHNIQUE TO ADDRESS REORGANIZATION
OF COMPONENT RESPONSIBILITIES THROUGH
MERGING AND SPLITTING
6.1 Motivation
In the Chapter 5 we derived and validated the COMP-REF technique, which selectively
recommended the merging of components towards a better delegation of responsibilities.
In this chapter we will extend COMP-REF into the RESP-DIST technique which uses the
metrics Aptitude Index, Component Set, Concordance Index (derived in Chapter 5) and
Mutation Index (derived in Chapter 4, and a linear programming based different algorithm
to recommend merging or splitting of components, based on a system’s dynamics. The utility
of RESP-DIST is investigated on a set of real life systems
6.2 The RESP-DIST Technique
Software design is about striking a balance (often a very delicate one!) between diverse
factors that influence the functioning of a system. The ideas of aptitude, concordance, and
mutation as outlined earlier are such factors we will consider now. The RESP-DIST technique
builds on a LP formulation to maximize the Concordance Index across all components, for a
given set of requirements, in a particular iteration of development, within the constraints of
not increasing the number of components currently participating in the fulfillment of each
requirement. Results from the LP solution are then examined in the light of the metric values
and suggestions for merging or splitting components arrived at. (RESP-DIST is the enhanced
version of the COMP-REF technique we proposed in [Datta and van Engelen, 2008a] – the
103

latter only guided merging of components without addressing situations where components
may require to be split.)
A new variable an (an ∈ [0, 1]) is introduced corresponding to each component Cn,
1 ≤ n ≤ N , where N = the total number of components in the system. The values of an
are arrived at from the LP solution. Intuitively, an for a component Cn can be taken to
indicate the extent to which Cn contributes to maximizing the Concordance Index across all
components. As we shall see later, the an values will help us decide which components to
merge.
The LP formulation can be represented as:
Maximize
y∑n=1
CI(n)an
Subject to: ∀Rm ∈ Req,
y∑n=1
an ≤ pm/N , an such that Cn ∈ CS(m). pm = |CS(m)|. (As
defined in [Datta and van Engelen, 2006], the Component Set CS(m) for a requirement Rm
is the set of components required to fulfill Rm.)
So, for a system with x requirements and y components, the objective function will have
y terms and there will be x linear constraints.
The RESP-DIST technique is summarized as: Given a set of requirements Req =
R1, ..., Rx and a set of components Comp = C1, ..., Cy fulfilling it in iteration Iz of
development,
• STEP 0: Review Req and Comp for new or modified requirements and/or components
compared to previous iteration.
• STEP 1: Calculate the Aptitude Index for each component.
• STEP 2: Calculate the Requirement Set for each component.
• STEP 3: Calculate the Concordance Index for each component.
• STEP 4: Formulate the objective function and the set of linear constraints.
• STEP 5: Solve the LP formulation for the values of an.
• STEP 6: For each component Cn, check:
104

– Condition 6.1: an has a low value compared to that of other components? (If yes,
implies Cn is not contributing significantly to maximizing the concordance across
the components.)
– Condition 6.2: AI(n) has a low value compared to that of other components? (If
yes, implies Cn has to rely heavily on other components for delivering its core
functionality.)
• STEP 7: If both conditions 6.1 and 6.2 hold TRUE, proceed to next step, else GO
TO STEP 10
• STEP 8: For Cn, check:
– Condition 8.1: Upon merging Cn with other components, in the resulting set
Comp of q components (say), CI(q) 6= 0 for all q? (If yes, implies resulting set of
q components has more than one component).
• STEP 9: If condition 8.1 is TRUE, Cn is a candidate for being merged.
• STEP 10: Let Comp′ denote the resulting set of components after above steps have
been performed. For each component Cn′ in Comp′:
– 10.1 Calculate the average MI(m) across all requirements in RS(n′). Let us call
this MI(m).
– 10.2 Identify the requirement Rm with the highest MI(m) in RS(n′). Let us call
this MI(m)highest.
• STEP 11: For each component Cn′ , check:
– Condition 11.1: AI(n′) has a high value compared to that of other components?
(If yes, implies component relies relatively less on other components for carrying
out its primary responsibilities.)
– Condition 11.2: CI(n′) has a low value compared to that of other components?
(If yes, implies component collaborates relatively less with other components for
collectively delivering the system’s functionality.)
105

• STEP 12: If both conditions 11.1 and 11.2 hold TRUE for component Cn′ , it is
tending to be monolithic, doing all its activities by itself and collaborating less with
other components. Thus the Cn′ is a candidate for being split; proceed to next step,
else GO TO STEP 14.
• STEP 13: Repeat STEPs 10 to 12 for all components of Comp′. For the component for
which conditions 11.1 and 11.2 hold TRUE, choose the ones with the highest MI(m)
and split each into two components, one with the requirement corresponding to the
respective MI(m)highest and the other with remaining requirements (if any) of the
respective Requirement Set. If the component was fulfilling only one requirement, the
responsibility for fulfilling the requirement’s functionality may now be delegated to two
components.
• STEP 14: Wait for the next iteration of development.
Extending from Figure 5.1, Figure 6.1 illustrates how the RESP-DIST technique extends
COMP-REF (Figure 5.1).
6.3 Experimental Validation
6.3.1 Validation Strategy
To explore whether or how dispersed development affects the distribution of responsibilities
amongst software components, we have studied a number of software projects, which vary
significantly in their degrees of dispersion. The projects range from a single developer team,
to an open source system being developed through a team whose members are located
in different continents, a software system built by an in-house team of a large financial
organization, and standalone utility systems built through remote collaboration. We discuss
results from 5 such projects in the following subsections.
6.3.2 Presentation of the Results
The application of RESP-DIST is illustrated in detail for one project. The summary of all
the validation scenarios are presented in Tables 6.3.2 and 6.3.2.
Table 6.3 gives metrics values and the LP solution for an iteration of Project A. Note:
The project had 8 requirements: R1, R2, R3, R4, R6, R7, R8, R9 with requirement R5 having
106

G. C
alcul
ate a
vg_M
I(m) f
or ea
ch
com
pone
nt in
Com
p_pr
ime a
nd id
entif
y re
quire
men
t with
high
est M
I(m)
CI(n
_prim
e) is
relat
ively
low?
AI(n
_prim
e)is
relat
ively
high
?
Yes Ye
s
For e
ach
C n_prime
H. C
n_pr
imei
s a
cand
idat
e for
split
ting
Go to
A.
NoNoG.
Calc
ulat
e avg
_MI(m
) for
each
co
mpo
nent
in C
omp_
prim
e and
iden
tify
requ
irem
ent w
ith h
ighes
t MI(m
)
CI(n
_prim
e) is
relat
ively
low?
AI(n
_prim
e)is
relat
ively
high
?
Yes Ye
s
For e
ach
C n_prime
H. C
n_pr
imei
s a
cand
idat
e for
split
ting
Go to
A.
NoNo
Fig
ure
6.1:
RE
SP
-DIS
T:O
utl
ine
ofth
eTec
hniq
ue
(exte
nds
from
Fig
ure
5.1)
107
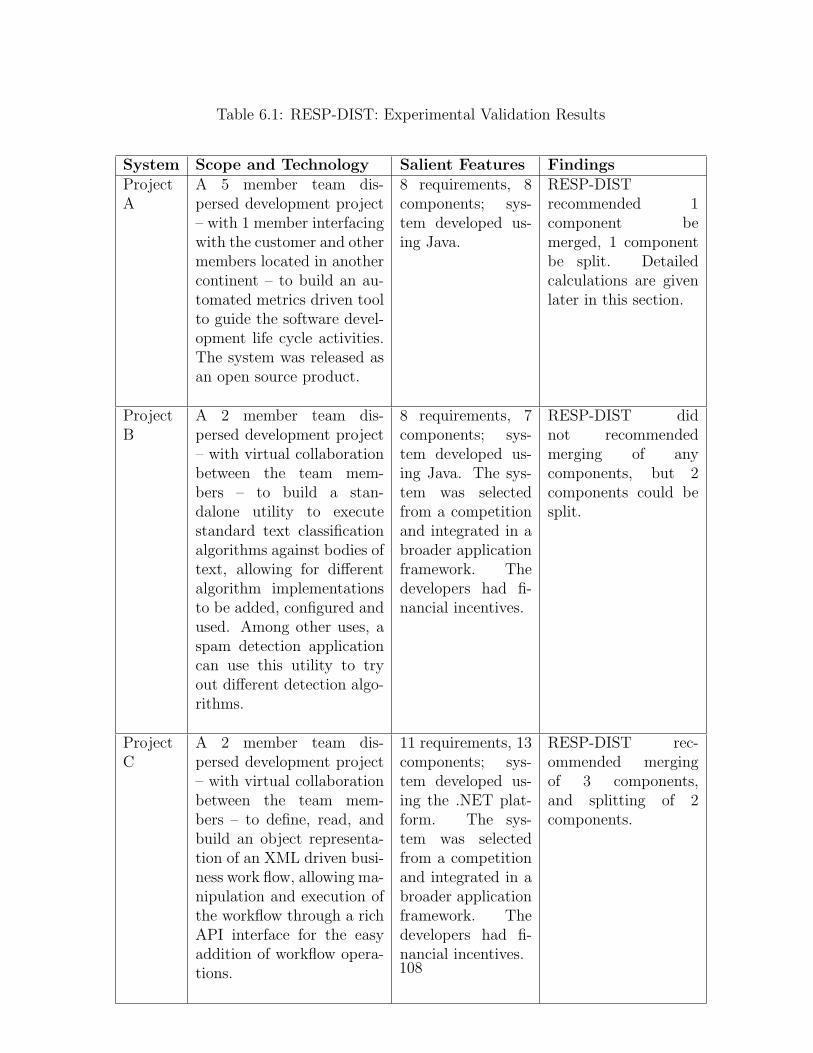
Table 6.1: RESP-DIST: Experimental Validation Results
System Scope and Technology Salient Features FindingsProjectA
A 5 member team dis-persed development project– with 1 member interfacingwith the customer and othermembers located in anothercontinent – to build an au-tomated metrics driven toolto guide the software devel-opment life cycle activities.The system was released asan open source product.
8 requirements, 8components; sys-tem developed us-ing Java.
RESP-DISTrecommended 1component bemerged, 1 componentbe split. Detailedcalculations are givenlater in this section.
ProjectB
A 2 member team dis-persed development project– with virtual collaborationbetween the team mem-bers – to build a stan-dalone utility to executestandard text classificationalgorithms against bodies oftext, allowing for differentalgorithm implementationsto be added, configured andused. Among other uses, aspam detection applicationcan use this utility to tryout different detection algo-rithms.
8 requirements, 7components; sys-tem developed us-ing Java. The sys-tem was selectedfrom a competitionand integrated in abroader applicationframework. Thedevelopers had fi-nancial incentives.
RESP-DIST didnot recommendedmerging of anycomponents, but 2components could besplit.
ProjectC
A 2 member team dis-persed development project– with virtual collaborationbetween the team mem-bers – to define, read, andbuild an object representa-tion of an XML driven busi-ness work flow, allowing ma-nipulation and execution ofthe workflow through a richAPI interface for the easyaddition of workflow opera-tions.
11 requirements, 13components; sys-tem developed us-ing the .NET plat-form. The sys-tem was selectedfrom a competitionand integrated in abroader applicationframework. Thedevelopers had fi-nancial incentives.
RESP-DIST rec-ommended mergingof 3 components,and splitting of 2components.
108

Table 6.2: RESP-DIST: Experimental Validation Results contd.
System Scope and Technology Salient Features FindingsProjectD
A 6 member team dis-persed development project– with the developers andcustomers spread across twocities of the same coun-try – to develop an emailresponse management sys-tem for a very large finan-cial company. The sys-tem allows for emails fromusers across six product seg-ments to be processed andplaced in designated queuesfor customer associates torespond, and deliver the re-sponded back to the userswithin prescribed time lim-its.
5 requirements; 10components; sys-tem developed us-ing Java, NetscapeApplication Server(NAS), and LotusNotes. Develop-ers worked on thesystem as a partof their job re-sponsibilities. Thesystem has beenrunning for severalyears, with around100,000 users.
RESP-DIST rec-ommended mergingof 1 component,and splitting of 4components.
ProjectE
A 1 member team projectto build a Web based bank-ing application which al-lowed users to check theirprofile and account informa-tion, send messages to thebank; and administratorsto manage user accounts,transactions, and messages.
12 requirements,28 components;system developedaccording to theModel-View-Controller (MVC)architecturalpattern with J2EEand a Cloudscapedatabase.
Result from applyingRESP-DIST was in-conclusive.
109

Table 6.3: RESP-DIST: Details for Project A
Cm RS(n) Avg MI(m) Rmh α(n) β(n) γ(n) AI(n) |X(n)| CI(n) an
C1 R3, R6 0 - C1 C3, C5, C7 - 0.25 2 0.25 0.21C2 R4, R7 0 - C2 C3, C7 C6 0.2 2 0.25 0.08C3 R1, R3, R4, R6 0.17 R1 C3 C1, C5, C7 - 0.25 4 0.5 0.17C4 R3 NA NA C4 C3, C5 - 0.33 1 0.13 0C5 R1, R2 0.5 R1 C5 C1 - 0.5 2 0.25 0.12C6 R1, R7 0.34 R1 C6 C2, C7 - 0.33 2 0.25 0.09C7 R2, R8 0.5 R8 C7 - - 1 1 0.13 0.13C8 R9 1 R9 C8 - - 1 0 0 0.105
been de-scoped in an earlier iteration of development. In the table Avg MI(m) denotes
MI(m) and Rmh denotes the requirement Rm with the highest MI(m) in RS(n′). MI(m)
and Rmh values are not applicable (NA) for C4 since RESP-DIST recommends it to be
merged as explained later.
From the design artifacts, we noted that R1 needs components C3, C5, C6 (p1 = 3), R2
needs C5, C7 (p2 = 2), R3 needs C1, C3, C4 (p3 = 3), R4 needs C2, C3 (p4 = 2), R6 needs
C1, C2, C6 (p6 = 3), R7 needs C2, C6 (p7 = 2), R8 needs C7 (p8 = 1), and R9 needs C8 (p9 =
1) for their respective fulfillments. Evidently, in this case |W |= N = 8.
Based on the above, the objective function and the set of linear constraints was formulated
as:
Maximize
0.25 ∗ a1 + 0.25 ∗ a2 + 0.5 ∗ a3 + 0.13 ∗ a4 + 0.25 ∗ a5 + 0.25 ∗ a6 + 0.13 ∗ a7 + 0.a8
Subject to
a3 + a5 + a6 ≤ 0.38
a1 + a3 + a4 ≤ 0.38
a2 + a3 ≤ 0.25
a1 + a2 + a6 ≤ 0.38
a7 ≤ 0.13
a8 ≤ 0.13
The linprog LP solver of MATLAB [MathWorks, 2009] was used to arrive at the values
of an in the Table 6.3.
110
6.3.3 Discussion
Let us examine how RESP-DIST can recommend the merging or splitting of components.
Based on the an values in Table 6.3, evidently components C2, C4, C6 have the least
contribution to maximizing the objective function. So the tasks performed by these
components may be delegated to other components. However, as mandated by RESP-
DIST, another factor needs be taken into account before merging. How self-sufficient are
the components that are sought to be merged? We thus turn to the AI(n) values for the
components in Table 6.3. We notice, AI(2) = 0.2, AI(4) = 0.33, AI(6) = 0.33. Out of
these, C4 is contributing nothing to maximizing concordance (a4 = 0), and its AI(n) value
is not very high either (0.33 on a scale of 1). So a4 can be merged with other components.
Now we check for the highest MI(m), which corresponds to C8. C8 also has a high AI(8)
value of 1 and a low CI(8) value of 0. Thus C8 is trying to do all its task by itself, without
collaborating with other components – this is indeed a candidate for splitting. The Rm with
the highest MI(m) in RS(8) is R9 – in fact R9 is the only requirement in this particular case
fulfilled by C8. So RESP-DIST recommends C8 be split into two components, each fulfilling
a part of R9. Relating the recommendations to the actual components and requirements, we
find that C4 is an utility component in charge of carrying out some numerical calculations;
whose tasks can very well be re-assigned to components which contain the business logic
behind the calculations. On the other hand, R9 is a requirement for extracting data from
design artifacts. This is certainly a requirement of very large sweep and one likely to change
frequently, as the data needs of the users change. Thus it is justifiable to have R9 fulfilled
by more than one component, to be able to better localize the effects of potential changes
in this requirement. Figure 6.2 summarizes these discussions, indicating merging for C4 and
splitting for C8.
The systems which have been studied for validating the RESP-DIST technique also
provide an interesting insight into how offshore and outsourced development affect the
delegation of responsibilities to components. The paradigm of offshore and outsourced
software development involves distribution of life cycle activities and stakeholder interests
across geographical, political, and cultural boundaries. In this chapter we will use the phrase
dispersed development to refer to offshore and outsourced software development. We use the
term “dispersed” in the sense of distribution of software development resources and concerns
111

0
0.2
0.4
0.6
0.8
1
1.2
C_1 C_2
C_3
C_4C_5
C_6
C_7 C_8
0
0.2
0.4
0.6
0.8
1
1.2
C_1 C_2
C_3
C_4C_5
C_6
C_7 C_8
Figure 6.2: Values of an, AI(n), MI(m) and CI(n) corresponding to the componentsC1,...,C8 for Project A. The RESP-DIST technique suggests merging for C4 and splittingfor C8
across different directions and wide area.
The Agile Manifesto lists the principles behind agile software development – methodolo-
gies being increasingly adopted for delivering quality software in large and small projects in
the industry, including those utilizing dispersed development [Kornstadt and Sauer, 2007].
The Manifesto mentions the following among a set of credos: “The most efficient and
effective method of conveying information to and within a development team is face-to-face
conversation”, and “Business people and developers must work together daily throughout
the project” [AgileManifesto, 2009]. Evidently, the very nature of dispersed development
precludes this kind of interaction between those who commission and use a software system
(these two groups may be identical or different, they are often clubbed together as customers)
and those who develop it, that is, the developers.
We identify the key drivers of the effects of dispersed development on software design
as locational asynchrony (LA), and perceptional asynchrony (PA). LA and PA may exist
between customers and developers or within the development team. Locational asynchrony
arises from factors like differences in geography and time zones. An example of LA
would be the difficulty in explaining a simple architectural block diagram over email or
telephone conversation, which can be easily accomplished with a white board and markers
in a room of people (something similar to the consequence of distance highlighted in
[Herbsleb and Grinter, 1999a]). Perceptional asynchrony tends to be more subtle, and
112

is caused by the complex interplay of stakeholder interests that dispersed development
essentially entails. For example, in dispersed development scenarios, developers who have
no direct interaction with the customer often find it hard to visualize the relevance of the
module they are working on in the overall business context of the application – this is a
manifestation of PA. With reference to Tables 6.3.2 and 6.3.2, Project A has high LA but
moderate PA; Projects B and C have moderate LA but high PA; Project D has moderate
LA and low PA, while Project E has low LA and PA.
Apparently, there is no clear trend in the recommendations from RESP-DIST by way
of merging or splitting components in Tables 6.3.2 and 6.3.2 that suggests locational
asynchrony or perceptional asynchrony have noticeable impact on how responsibilities are
delegated. However, Projects B and C have a higher requirement to component ratio
compared to others. This not only influences the way RESP-DIST runs on these projects but
also indicates that moderate to high perceptional asynchrony may lead to a more defensive
analysis of requirements – being relatively unsure of the customers’ intents developers are
more comfortable dealing with finer grained requirements. The inconclusiveness of RESP-
DIST’s recommendation for Project E is also interesting. Project E’s scenario represents
by far the most controlled conditions of development amongst all the projects studied. It
was developed by a single developer – a software engineer with more than 5+ years of
industry experience – who had the mandate to refine the responsibility delegations amongst
components repeatedly until the system delivered as expected. So naturally, RESP-DIST
did not have much scope for suggesting merging or splitting of components. Also, compared
to other projects Project E had a relatively unrelated set of requirements and relatively
high number components with uniformly distributed responsibilities. Thus from the results
related to Project A to D, RESP-DIST is seen to work best on a small set of closely related
requirements and components. For a system with many requirements and components, it
can be applied separately on subsystems that constitute the whole system.
From the interpretation of the case study results, it is apparent the recommendations
of merging or splitting components from applying the RESP-DIST technique are not
significantly influenced by the degree of dispersion in a project’s development scenario in
terms of their location or perceptional asynchronies. However, factors other than locational
or perceptional asynchrony may also stand to affect the delegation of responsibilities in some
dispersed development projects. In future work we plan to develop mechanisms to investigate
113
such situations.
The case studies we presented in this chapter range from 1 member to 6 member
development teams, 5 to 12 requirements, and 7 to 28 components. Evidently, these are
small to medium projects. We expect the execution of the RESP-DIST technique to scale
smoothly to larger systems – more requirements and components will only mean more terms
and linear constraints, which can be handled easily by automated LP solvers.
6.4 Related Work
Freeman’s paper, Automating Software Design, is one of the earliest expositions of
the ideas and issues relating to design automation [Freeman, 1973]. Karimi et al.
[Karimi and Konsynski, 1988] report their experiences with the implementation of an au-
tomated software design assistant tool. Ciupke presents a tool based technique for analyzing
legacy code to detect design problems [Ciupke, 1999]. Jackson’s Alloy Analyzer tool employs
“automated reasoning techniques that treat a software design problem as a giant puzzle to
be solved” [Jackson, 2006b].
[Rodriguez et al., 2007] evaluates collaboration platforms for offshore software develop-
ment. Shami et al. simulate dispersed development scenarios [Shami et al., 2004] and a
research agenda for this new way of software building is presented in [Sengupta et al., 2006].
Herbsleb and Grinter in their papers have taken a more social view of distributed software
development [Herbsleb and Grinter, 1999a], [Herbsleb and Grinter, 1999b]. In terms of Con-
way’s Law – organizations which design systems are constrained to produce designs which are
copies of the communication structures of these organizations [Conway, 1968] – Herbsleb and
Grinter seek to establish the importance of the match between how software components
collaborate and how the members of the teams that develop the software components
collaborate.
6.5 Summary
In this chapter we introduced the RESP-DIST technique as an extension of COMP-REF
and applied it on a set of real life systems to validate the hypothesis presented earlier.
As discussed, RESP-DIST leads to better reorganization of functionality, through its
recommendations of merging or splitting. We also examined whether the recommendations
114

of RESP-DIST are affected by the varying degrees of offshore and outsourced development.
In the next chapter we examine how the decision to model a piece of functionality as a class
or an aspect can be guided by the use of a metric.
115

CHAPTER 7
CROSSCUTTING SCORE: AN INDICATOR
METRIC FOR ASPECT ORIENTATION
7.1 Motivation
Aspect Oriented Programming (AOP) provides powerful techniques for modeling and im-
plementing enterprise software systems. To leverage its full potential, AOP needs to be
perceived in the context of existing methodologies such as Object Oriented Programming
(OOP). This chapter addresses an important question for AOP practitioners – how to decide
whether a component is best modeled as a class or an aspect? Towards that end, we
present an indicator metric, the Crosscutting Score and a method for its calculation and
interpretation. We will illustrate our approach through a sample calculation.
Aspect Oriented Programming (AOP) has had several descriptions; from the prosaic
– another programming technique – to the poetic – a whole new paradigm of software
development. In the fall of 2003, Gregor Kiczales described the then current state of AOP
as “moving from the invention phase to the innovation phase” [Kiczales, 2003]. Two years
prior, in an article evocatively titled Through the looking glass, Grady Booch had identified
AOP as one of the most exciting emergent areas, reflecting, “AOP, in a manner similar to
classic patterns and Krutchen’s architectural views, recognizes that there are abstractions
on a plane different than object-oriented abstractions, which in turn are on a plane different
than our executable systems” [Booch, 2001] .
AOP stands poised at an interesting juncture today. Its power and grace are proven, best
minds of the discipline are delving into it, it is often hailed as the greatest thing to happen
to software engineering since object orientation.
It is often easy to appreciate the elan of a new approach in the abstract; still practitioners
need and seek guidelines to get them started in the concrete. Under project pressures, the
116

leeway to bridge the cognitive gap in understanding a technology and placing it in context is
usually absent. Initial explorations of AOP are often marked by recurrent confusions about
when to opt for an AOP solution vis-a-vis an OOP one.
The basic question often asked is: when to use an aspect rather than a class ?
This inspires the search for a metric to quantify the parameters on which such decision
can be based. In this chapter we propose a rule of thumb centering around the Crosscutting
Score to help best decide what needs to be aspectualized, i.e. what is to be or not to be an
aspect.
In the next sections we discuss the context of AOP in its connections to existing themes
and recent research, followed by a reflection on the different coordinates of aspect technology.
Next, the motivations for a thumb rule are introduced. We then derive the Crosscutting Score
metric and illustrate its use. The Conclusion summarizes ideas presented in this chapter and
their relevance to software development.
7.2 The context of AOP
AOP gives a novel insight into the eternal issues of analyzing, designing, building and
maintaining software systems. Like all successful innovation, AOP seeks solutions to
problems that have been known to exist, only brought into recent focus as software
engineering grapples with deeper complexity. 1
Many of the problems for which AOP promises better solutions were and are being worked
around by existent methods. Designers and developers are often faced with the conundrum
– when would the AOP-OOP combination offer better returns than conventional OOP; is a
functionality best modeled through a class or an aspect ?
This is a fundamental question all users of AOP face; and there are no ready answers.
AOP focuses on situations that have been in limelight ever since programming graduated
to software engineering. Separation of concerns (and the criteria thereof) has been of
primary interest from the time understanding various facets of the problem domain became
a nontrivial task. In a paper older than thirty years, (that has aged with amazing grace)
Parnas [Parnas, 1972] “discusses modularization as a mechanism for improving the flexibility
and comprehensibility of a system while allowing the shortening of its development time.”
1As Grady Booch says so feelingly, “This stuff is fundamentally, wickedly hard – and it’s not going to getany better in my lifetime, and I plan on having a long life” [Booch, 2005].
117

He goes on to clarify “ ‘module’ is considered to be a responsibility assignment... .” (Italics
ours.) Every software engineering methodology has arrived with covenants of making systems
simpler to understand, easier to extend and faster to construct. Responsibility assignment
remains a key factor for achieving these goals, to the extent it has been called a “desert-
island skill” [Larman, 1997] – the one critical ability that successful software development
must harness.
To be able to decide which component does what, the foremost step is understanding the
gamut of activities (services, in recent terminology) expected from the system. The word
concern is often taken to connote the different behaviors of components that collaboratively
deliver the system’s functionality.
7.3 Recurrent motifs and Related Work
Modularization of crosscutting concerns is often a theme first introduced to AOP beginners
[Lesiecki, 2002]. This is indeed a central motif of AOP, and it underscores the links of
AOP to some long-circulating ideas in software engineering. At a high level of abstraction,
crosscutting concerns can be viewed as behavior such as logging, exception handling, security,
instrumentation etc. that stretch across conventional distributions of responsibility. In
standard (i.e. non-AOP) OO implementations, such behavior is achieved by specialized
classes, whose methods are invoked as required. If at ten different locations in a body of
code logging is needed, there will be ten statements where some log method of a Logger
class is called. AOP provides a mechanism to encapsulate such dispersed functionality into
modules. Logging et al. are not the only supposedly peripheral concerns AOP handles.
Aspects can be used to enforce a Design by Contract style of programming, a number of OO
design patterns also have crosscutting structure and can be implemented in a modular and
reusable way using aspects [Kiczales, 2003], [Garcia et al., 2005]. In addition, there is scope
for utilizing aspects to deal with the business rules – often the most capricious and complex
parameters of a system.
Lopes highlights this positioning of aspects vis-a-vis objects as “Aspects are software
concerns that affect what happens in the Objects but that are more concise, intelligible and
manageable when written as separate chapters of the imaginary book that describes the
application” [Lopes, 2002].
Several recent studies have explored the feasibility of AOP solutions in different locales
118

and levels of software development. Zhang and Jacobsen present middleware refactoring
techniques using aspects [Zhang and Jacobsen, 2003]. Use of aspects in specific appli-
cation areas are highlighted in [Putrycz and Bernard, 2002], [Kersten and Murphy, 1999].
Design Structure Matrix (DSM) and Net Options Value (NOV) approaches are used in
[Lopes and Bajracharya, 2005] to analyze the modularity of aspect oriented designs.
Although these papers provide valuable insight into the applicability of AOP, we believe a
basic confusion continues to assail practitioners, when and why a departure from conventional
OOP to AOP will be beneficial. The following sections introduce a mechanism to clarify
such concerns.
7.4 Aspect Orientation – Different Coordinates
As an evolving technology, we may perceive Aspects in the following lights.
Aspects : Ideation – As an idea aspects are precisely what the word “aspect” means,
a way of looking at things or how something appears when observed. In software contexts
that translates to looking at the functionality of a system for common behavior that can be
isolated. A method or a function of programming languages is one way of aspectualizing, it
embodies behavior that is encapsulated and can be invoked by a method call ; thus localizing
the code that implements the behavior.
Aspects : Incarnation – Formalizing ways of discovering, understanding and using
aspects as a software development artifact, incarnates aspects into AOP. The acronym
AOSD (Aspect Oriented Software Development) is somewhat misleading; there seems a
hint aspect orientation is a whole new methodology of software development, to be preferred
over existing techniques. AOP serves to complement other models of software development
– since OOP is the dominant paradigm of the day, most AOP tool extensions are OO tools
[Kiczales, 2003], [Booch, 2001]. An aspect needs not necessarily be associated with code,
aspectual requirements [Rashid et al., 2003] or crosscutting requirements [Nuseibeh, 2004]
represent approaches for identifying concerns from the requirement gathering phase. Jacob-
son presents interesting ideas on how use cases and aspects can “seamlessly” work together
[Jacobson, 2003].
Aspects : Implementation – Aspects are implemented through tools and frameworks
which provide the hooks by which aspect technology is attached to application code, and
ensures the combination works as a cohesive unit. AspectJ has been the oldest of such
119

Figure 7.1: Different Views of Aspects
tools, which recently joined hand with another implementation, AspectWerkz to align their
features [Sosnoski, 2005].
The procedure presented in this chapter aids the incarnation and implementation of
aspects. Figure 7.1 shows how our thumb rule positions amongst these perspectives.
7.5 A Thumb Rule - Immediate Motivations
One of the earliest lessons one learns from AOP is that it is best to identify aspects early. The
weaving facilities offered in aspect implementations sometimes give an impression – mostly
to starters – that AOP is a mechanism for adding functionality that was not envisaged a
priori, or to accommodate later needs, such as trace logging or performance monitoring.
AOP offers rich set of features for affecting program flow: “Pointcuts and advice let you
affect the dynamic execution of a program; introduction allows aspects to modify the static
structure of a program” [Lesiecki, 2002]. However, arbitrary use of these abilities has the
danger of making software, in Brooksean terms, more invisible and unvisualizable.
Rashid [Rashid et al., 2003] advocates an approach for separating the specification of
aspectual vs. non-aspectual requirements. [Nuseibeh, 2004] argues the problem world “is
often the most appropriate source for early identification of concerns but not necessarily
120

of aspects.” [Jacobson, 2003] suggests strong correlation between use case extensions and
aspects, seeing an equivalence between extension points and join points. These outlooks
underscore thinking in aspect terms early in the development life cycle.
As noted earlier, responsibility assignment is of central importance in software design.
One established canon of OOAD is to have each class fulfill one primary responsibility. Sound
design, object oriented or classical, draws on some basic principles. Cohesion and Coupling
– the yin and yang of software engineering – are some such; each class doing one principal
task promotes a design where components function in relative independence, yet generating
enough synergy to deliver the user’s requirements.
In our discussion, we use component to mean an unit of code that is in charge of a chief
activity; other ancillary tasks expected from it are deemed secondary. We seek to have a
structured way of deciding what best models a component, a class or an aspect, based on
the theme of responsibility delegation.
During analysis, techniques such as noun-analysis, CRC cards help identify components
that will be given specific responsibilities. These are yet at a very high level, sometimes
referred to as coarse-grained, to be refined as development proceeds. But identifying these
components is a vital exercise, marking the interface between analysis and design.
7.6 Crosscutting Score
Let Θ(n) = (C1, C2, C3, ..., Cm, ..., Cn) represent the set of n components for a system. To
each component Cm, (1 ≤ m ≤ n), we attach the following properties. A property is a set of
zero, one or more components.
• Core - α(m)
• Non-core - β(m)
• Adjunct - γ(m)
α(m) represents the set of component(s) required to fulfill the primary responsibility of
the component Cm. As already noted, sound design suggest the component itself should be
in charge of its main function. Thus, α(m) = Cm.β(m) represents the set of component(s) required to fulfill the secondary responsibilities
of the component Cm. Such tasks may include utilities for accessing a database, date or
currency calculations, logging, exception handling etc.
121

γ(m) represents the component(s) that guide any conditional behavior of the component
Cm. For a component which calculates interest rates for bank customers with the proviso
that rates may vary according to a customer type, an Adjunct would be the set of components
that determine a customer’s type.
We define,
Ω(m) = β(m) ∪ γ(m)
cs(m) = Crosscutting Score of Cm.
Given Θ(n), cs(m) is computed as follows,
cs(m) =n∑
k=1
i(m, k)
where,
i(m, k) =
1 if α(m) ∩ (β(k) ∪ γ(k)) 6= 00 otherwise
The value of cs(m) for a component, relative to those of other components,
indicates whether it is a candidate for an aspect.
We now examine the implications of this statement in an example scenario.
7.7 Motivating Example
We consider an internet banking application. Our system allows customers to view their
transaction details online, transfer funds between accounts, and print statements in either
spreadsheet or text format. Customers are classified into two types, silver and gold
depending on business rules which the bank’s management revises from time to time. Some
of the application’s features are exclusive to gold customers; the user interface needs to vary
accordingly.
Table 7.1 shows the components identified with their primary responsibilities.
It may be noted the core functionality of a component can be among the non-core ones
of another component. This is most apparent in cases such as Logging and Exception
handling. But more obscure interaction occurs between User Interface/Transaction Handling
with Customer Type Identification; either of the former has conditional behavior based on
the functionality of the latter .
Table 7.2 calculates α(m), β(m), γ(m), Ω(m) and cs(m). (Φ denotes a set with
zero elements.) As an example, for C3, α(3) = C3, β(3) = C5, C6, C7, C12, C13, since
122

Table 7.1: Components and their Primary Responsibilities
Component Primary Responsibility
C1 User interfaceC2 Transaction handlingC3 Currency calculationC4 Data storageC5 LoggingC6 InstrumentationC7 Exception handlingC8 User input verificationC9 Print formattingC10 Customer type identificationC11 Data accessC12 Logging level determinationC13 Performance report generation
Table 7.2: Calculation of Crosscutting Score
Cm α(m) β(m) γ(m) Ω(m) cs(m)
C1 C1 C5, C6, C7, C8, C9, C10, C12, C13 C10 C5, C6, C7, C8, C9, C10, C12, C13 0C2 C2 C5, C6, C7, C10, C11, C12, C13 C10 C5, C6, C7, C10, C11, C12, C13 0C3 C3 C5, C6, C7, C12, C13 Φ C5, C6, C7, C12, C13 0C4 C4 C7, C11 Φ C7, C11 0C5 C5 C7 C12 C7, C12 7C6 C6 C7 C13 C7, C13 6C7 C7 C5, C12 Φ C5, C12 12C8 C8 C5, C6, C7, C12, C13 Φ C5, C6, C7, C12, C13 1C9 C9 C7 C10 C7, C10 1C10 C10 C4, C5, C6, C7, C11, C12 Φ C4, C5, C6, C7, C11, C12 3C11 C11 C5, C6, C7, C12, C13 Φ C5, C6, C7, C12, C13 3C12 C12 C7 Φ C7 8C13 C13 C7 Φ C7 6
123

Currency calculation requires Logging, Instrumentation, Exception handling, Logging level
determination (it is useful to control the granularity of detail that must be logged; i.e. a
mechanism is needed to turn “on” or “off” respective logging levels), Performance report
generation (while tuning the system at the time of delivery, performance reports based
on specific criteria helps discover bottlenecks faster). γ(3) = Φ, as Currency Calculation
has no conditional behavior based on customer type. Hence Ω(3) = β(m) ∪ γ(m) =
C5, C6, C7, C12, C13. Applying the algorithm given earlier, cs(3) = 0. (Intuitively, currency
calculation has a localized concern, having no interaction with other components.)
Similarly, for C6, α(6) = C3, β(6) = C7, γ(6) = C13, since instrumentation is guided by
the criteria of performance report generation, conditionally measuring some parameters over
others. Ω(6) = C7, C13 and cs(6) = 6. Crosscutting Score of 6 for the component indicates its
core functionality is being used across some other components – intuitively, instrumentation
is needed for all components with nontrivial processing. This value of cs(m) makes it a
suitable to be modeled as an aspect rather than a class.
We plot Cm vs. cs(m) in Figure 7.2. This graph serves as the basis for deciding
Figure 7.2: Components vs. Crosscutting Score
whether a component may be a class or an aspect. The components with higher cs(m)
values have primary behavior that is crosscutting – AOP offers great benefits if they are
124

aspectualized. The ones with lower values deliver relatively isolated functionality, classes
suffice their implementation.
But a key question remains, what is the threshold between high and low values of cs(m)?
7.8 Discussion
Software design is subjective – we draw upon experience and intuition to reach decisions.
Calculation and survey of the cs(m) values streamline the process to a certain extent, helping
designers select one option over another. In our case, C7, C12, C5 , C6 and C13 are clearly
aspectual. Between C10 and C11, the former encapsulates business logic while the latter, data
access mechanisms. Business logic is usually prone to change and future enhancements may
need wider application of business rules; activities for accessing databases (opening/closing
connections, connection pooling etc.) are relatively less volatile. It is reasonable to model
C10 as an aspect and C11 as a class, even though they have the same Crosscutting Score
value. C1, C2, C3, C4, C8, C9, definitely on the lower side of cs(m) range, are clearly classes.
Thus, there is no “cutoff” cs(m) value to segregate components into classes and aspects.
While some components will be clear aspirants one way or the other, for the borderline ones,
the designer’s judgment comes into play.
A few subtleties are worth pointing out. Components implementing logging, exception
handling, database access are easy to pick as potential aspects – their functionality stretches
across the application – the cs(m) values calculated above also support such observations.
However it is less obvious Customer type identification may also be aspectualized. The
component decides whether a customer is silver or gold (or even some other metal of
commensurate nobility, should there be more categories later). Calculating the cs(m) helps
in discovering such covert aspects.
As emphasized earlier, our algorithm is a judgment aid for designers. The ranking of the
components based on respective cs(m) is of lesser importance than recognizing the relative
distribution of the Crosscutting Scores. The cs(m) is one pointer in reaching an overall
expedient design involving classes and aspects.
The thumb rule is summarized as,
• Identify components based on their primary (core) functionality.
• Calculate Crosscutting Score cs(m) for each component.
125

• Relatively higher cs(m) value signifies crosscutting functionality – the corresponding
component is a strong aspirant for an aspect.
• Based on cs(m) value and other design desiderata, model each component as an aspect
or a class.
The choice of the phrase thumb rule has been deliberate; this is a heuristic rather than
a formula. The software engineering community continues its quest for sure-shot recipes of
design nirvana.
7.9 Summary
AOP is not a revolutionary doctrine. It is one more step in the evolutionary quest for simple
and elegant foundations to build complex software. Effective use of AOP happens when it
is successfully integrated, gelled as it is sometimes colorfully called, into extant tools and
techniques. This chapter introduces an approach for deciding whether a piece of functionality
is best abstracted in an aspect or a class. The thumb rule centering around the Crosscutting
Score assists the design of solutions best suited to AOP’s reach and context.
126

CHAPTER 8
FIDELITY REGISTER: A METRIC TO
INTEGRATE THE FURPS+ MODEL WITH USE
CASES
8.1 Motivation
As software engineering encounters deepening complexity, the value of integrating functional
and non-functional requirements into one cohesive view is well understood. Such perspective
facilitates traceability, reliability, ease of automation and other enduring quests of enterprise
solutions. We present an approach for calibrating Use Cases based on the FURPS+ model of
organizing user needs. The metric Fidelity Register introduced in this chapter abstracts the
influences of the FURPS+ dimensions on system analysis and design. Directions of future
work based on this idea are also mentioned.
The FURPS+ model [Grady, 1992] is a widely used benchmark for understanding
and prioritizing user needs vis-a-vis requirements in the Software Development Life Cycle
(SDLC). FURPS is a mnemonic for the categories Functionality, U sability, Reliability,
Performance and Supportability. (In this chapter they are referred to as the dimensions
of the FURPS+ model.) The “+” was later added to emphasize and accommodate
various specific attributes a project’s requirements might need to have. Each dimension is
further granulized into components such as Feature Set, Capabilities etc. for Functionality;
Consistency, Documentation etc. for Usability; Recoverability, Accuracy etc. for Reliability;
Response Time, Resource Consumption etc. for Performance; Testability, Extensibility,
Maintainability etc. for Supportability. (The exhaustive list may be found in [Grady, 1992].)
The Functionality dimension addresses users’ expectations from the system in terms
of what they can do with it, usually captured in a document titled Software Requirement
Specifications (SRS). The remaining dimensions, usually branded non-functional, find their
127

place in the Supplementary Specifications. Whereas the SRS is analyzed closely and design
elements gleaned from it, the Supplementary Specifications often gets minimal attention, on
the notion its concerns will somehow fall into place once the “core” functionality is addressed.
But the so called non-functional requirements contain parameters that can affect the
user experience to a large extent; they can even render otherwise impeccable design and
implementation of the functional requirements futile. What if it takes ten minutes to
authenticate users before they can access reports that are generated in less than two seconds?
Or, if users enter special characters in a field where alphanumeric data is expected; would
the system react gracefully? There are many such considerations, seemingly ancillary, that
govern the contexts of user interaction with a system – “A system that fails to meet an
implied reliability or performance requirement fails just as badly as a system that fails to
meet an explicit functional need” [Krutchen, 2004].
We believe it is only by consciously integrating all dimensions of the FURPS+ model
in the understanding and capturing of requirements can one expect to deliver a design that
matches user expectations in entirety. We present a metric, the Fidelity Register which
reflects the influence of the FURPS+ dimensions on Use Cases. The Fidelity Register gives
a quantitative appreciation of the dependency of a Use Case’s functionality on the non-
functional dimensions.
8.2 Background
Use Cases – defined as, descriptions of a set of sequences of actions, including variants, that
a system performs to yield an observable result of value to an actor [Booch et al., 2005] –
serve as a vital link between the user wish list of requirements and the system architecture
conceived and concretized iteratively through analysis and design.
A key idea in the above definition is that a Use Case must deliver an observable result of
value to an actor. This ensuring of value to an actor comes from a synthesis of the FURPS+
dimensions of the requirements model. While Functionality directly maps to the sequence
of user actions and allied system responses documented in a Use Case description; we derive
an approach for combining the residual URPS+ dimensions with the related Use Case.
Let each dimension map to a statement of influence in a Use Case’s context; the statement
denotes how that dimension affects the overall value the Use Case delivers in terms of its
Functionality. The statements can have a combination of the different components for each
128

dimension. Some example statements could be : Usability – The users will be able to reach
the “Account Statement” page within two mouse-clicks from the “Login” page; Reliability –
99 out of every 100 transactions initiated by the users will be successful; the users will be
automatically logged out of the system after 5 minutes of inactivity ; Performance – Every
report will be displayed within 2 seconds of the users’ request ; Supportability – The application
will be supported by web browsers, say “Wanderer” and “Voyager;” the application will
seamlessly aid the introduction of additional “user types” in the future.
Evidently, the tone and texture of the statements will vary from one system to other as
they are agreed upon by all stakeholders.
8.3 Fidelity Register
Let each statement for the dimensions, Usability(U), Reliability(R), Performance(P), Scala-
bility(S) and + for a Use Case be rated on a scale of 1-5.
A value of 1 in the rating (r) signifies the statement has minimal impact on the fulfillment
of the Use Case’s intent and a rating of 5 implies inadequacy on this count will result in the
user deriving no value from the Use Case’s realization.
We denote ri = Rating of the i’th dimension for the n’th Use Case,(i=U/R/P/S/+). Let∑n = Sum of the ratings for all dimensions of the n’th Use Case.
Dimension Ratio(D) for the i’th dimension is defined as,
Di =ri∑
n
(8.1)
We now define the Fidelity Register(F) for the n’th Use Case as an ordered quintuple of
the Dimension Ratios , i.e.
Fn = (DU , DR, DP , DS, D+) (8.2)
A sample calculation for a hypothetical Login Use Case is shown in Table 8.1.
Table 8.1: Calculating Fidelity Register: An Example
U/C U R P S +∑
n Fn
‘Login’ 3 2 1 4 2 12 (0.25,0.17,0.08,0.33,0.17)
129

8.4 The Approach in Perspective
Use Cases are the foundation upon which enterprise software systems are designed, built and
tested. They are the foremost step in translating the static requirements into an interactive
flow of user action and system responses. Indeed, Use Case is highlighted as one of the
primary drivers of today’s de-facto software development methodology standard, the Unified
Process [Jacobson et al., 1999].
The Fidelity Register as derived above, serves as a ready reference for understanding
how closely the non-functional (URPS+) requirements impact the functionality embodied
in a Use Case. In Table 8.1, the Fidelity Register for the ‘Login’ Use Case is calculated
as (0.25,0.17,0.08,0.33,0.17). On a relative scale, Supportability (DS = 0.33) is revealed
to be most influential, and Performance (DP = 0.08) the least. Thus to realize the Login
Use Case, the design must accommodate Supportability considerations to the maximum;
whereas Performance issues warrant lesser attention. These pointers add valuable insight to
the decision making process at times of grappling with the typical trade-offs of an expedient
design.
We may emphasize the Fidelity Register is essentially a heuristic; it is a placeholder
for the discernments System Analysts continually absorb while interacting with users and
understanding their perception of the system’s usefulness to them [Davis, 1998]. Leveraging
such intuition is essential in building a system that, in summary, meets the users’ needs.
With the exclusively functional attitude towards Use Cases currently in vogue; it is
common to find major issues with performance etc. “popping out” near delivery deadlines.
Almost always, they originate from design and implementation that proceeded without
appreciating the close meshing of the FURPS+ aspects with usage scenarios. By strongly
aligning the dimensions of the FURPS+ model with the Use Cases, our approach encourages
software architecture that fulfills functional requirements within acceptable non-functional
parameters.
8.5 Discussion
It is worth pointing out the FURPS+ model is sometimes complemented by other perceptions
of classifying requirements [Filman et al., 2002]; the Fidelity Register is open to being
modified accordingly. In addition to the requirements aspect, Use Cases are also used for
130

estimating reusability and extensibility of software systems.
8.6 Summary
This chapter has underscored the need for a holistic view of functional and non-functional
requirements as more complex software systems are designed and built. We introduced a new
metric, the Fidelity Register, that reflects the influence of the dimensions of the FURPS+
model on the Use Cases of a system. Our plans for developing these ideas further have also
been outlined.
131

CHAPTER 9
AGILITY MEASUREMENT INDEX: A METRIC
FOR THE CROSSROADS OF SOFTWARE
DEVELOPMENT METHODOLOGIES
9.1 Motivation
Software engineering’s journey to maturity has been marked by the advent of different
development methodologies. While each paradigm has its context and cognoscenti, project
teams are often faced with the choice of one approach over another in the grind of delivering
software on time and within budget. In this chapter, we briefly review the three major
techniques of addressing enterprise software development, namely the Waterfall, Unified
and Extreme styles. The metric Agility Measurement Index is then proposed, which helps
organizations choose the methodology that best suites a particular project.
In the beginning there was the waterfall” [Beck, 1999]. This technique prescribed
software be built in a succession of clearly defined and demarcated sets of activities covering
requirement specification, analysis, design, implementation and testing [Tilley et al., 2003].
The implicit assumption was everyone knew every relevant detail a priori ; customers knew
what system they wanted and what the system wanted from them, analysts knew what
they heard from the customers was what the customers wanted to tell them, designers knew
they could get the design right the first time, implementers knew all they had to do was to
translate the design into code, and testers knew what to test. In the Waterfall model projects
progressed in a linear unidirectional path, like the eternal truth of water flowing downhill.
In spite of all the inadequacy ascribed to the Waterfall model later - often justifiably – its
value lies in the first semblance of order it sought to introduce in the hitherto free-form and
instinct driven pursuit of software development.
The Unified Software Development Process (aka Unified Process or UP) took the best
132

idea of the Waterfall model and made it even better. Software Development Life Cycle
(SDLC) was now a two dimensional [Schach, 2005] matrix of phases Inception, Construction,
Elaboration, Transition and workflows Requirements, Analysis, Design, Implementation,
Test. The Unified Process is use-case driven, architecture-centric, iterative, and incremental
[Jacobson et al., 1999]. In essence, UP places great emphasis on understanding the scenarios
of user interaction with the system, culturing an architectural framework that supports
reusability and extensibility, and building software iteratively and incrementally. It rec-
ognizes that getting it right the first time is an absurd chimera for anything other than
trivial systems, and seeks to absorb effects of changing user needs through awareness and
coordination.
Extreme Programming (XP), almost eponymously, takes one more radical step in the
building of enterprise software. It is one perhaps the most promising among a gamut of
agile methods, that ...attempt to offer once again an answer to the eager business community
asking for lighter weight along with faster and nimbler software development processes
[Abrahamsson et al., 2003]. It repositions the conventional software process sideways.
Rather than planning, analyzing, and designing for the far-flung future, XP programmers do
all of these activities a little at a time throughout development [Beck, 1999]. The XP major
practices, called the circle of life [Newkirk, 2002] such as Planning game, Small releases,
Metaphor, Simple design, Tests, Refactoring, Pair programming, Continuous integration,
Collective ownership, On-site customer, 40-hour weeks, Open workspace, Just rules etc. are
unconventional and exciting perceptions of new ways of building software in-the-large, as
hinted by their maverick names.
All of the above methodologies embody key insights of software engineering that have
been learned through collective experience, often at the cost of individual heroics, or
martyrdom. It is vacuous to dwell upon the superiority of one method over another; every
approach has a specific scope and facility. A common problem of building software for
customers is to decide which methodology to adopt for a particular project. This decision,
necessitated by schedule and budget constraints has to be taken very early in the SDLC, and
once taken, has to be adhered to. Thus the choice is of major consequence to the project’s
final outcome.
In this chapter, we propose a metric, the Agility Measurement Index (AMI), which can
serve as a heuristic to decide which methodology is the best fit for a given project. The next
133

section highlights the theme of agility in the desiderata of different software development
strategies. We then present the idea of the metric and follow up with its derivation. The
usage scenarios of the metric are outlined subsequently. We conclude with a summary and
directions of future work.
9.2 The Methodology Fray
The evolution of software development processes points to a natural progression as one
methodology begets another. A key theme in the genesis of every new model is the need to
better understand, evaluate and manage change even as software is designed and built. It
is a fact of life that requirements the principal driver of a software system will undergo
change [Fowler, 2005]; customers will change their mind, their perception of the role of the
software will change, the environment in which the software operates will change and so will
the technology with which the software is built.
The most important aspect of a successful software process is its ability to coordinate
and control the effects of such changes. The word agility, though applied only recently in
the context of software development, reflects a lasting holy-grail of software development
methodologies the capacity of adapting to and delivering in spite of, change.
Waterfall, UP and XP all have their own ways of embedding agility into the process;
each with concomitant advantages and drawbacks. Even the latest agile methods, designed
to deliver from the quagmires of earlier approaches, raises concerns about their supposed
dependence on premium people (perhaps evoking wraiths of Nietzche’s supermen or Huxley’s
Alphas !) [DeMarco and Boehm, 2002]. There is abounding consensus on an elusive
synthesis between methods [Boehm, 2002], [Beck and Boehm, 2003] without concrete ways
to realize it.
9.3 And the Need for a Way
As a development organization engages with customers to deliver a software project under
predetermined cost and time constraints, it faces the dilemma of which methodology to
follow. There are no ready answers, as the decision needs to take into account a wide swath
of factors and their combinations; and even situations which can not be envisioned upfront.
We now derive the Agility Measurement Index (AMI), which seeks to streamline the
decision process.
134

Intuitively, let us describe Agility Measurement Index (AMI) as an indicator metric for
determining whether a software development project is best suited to the Waterfall, UP or
XP development methodologies. At the end of this section we will reach a formal definition
of AMI.
Let us define the following as the dimensions of a software development project:
• Duration (D) From project inception, how far ahead in time is the delivery deadline?
• Risk (R) What is the impact of the project deliverable in its usage scenario ? Is it
mission critical, like a hospital patient monitoring system, moon rocket controller; or
is it meant for relatively less razor-edge use?
• Novelty (N) Does the project involve a domain where the users have never used a
software before or the developers are looking to use new and untested technology?
• Effort (E) How much effort, in person-hours, is the customer willing to support and
the development organization prepared to spend over the project duration?
• Interaction (I) What is the level of regular interaction between the development
team and the customer? Daily meetings? Weekly? Monthly? Or is the customer only
interested in seeing the finished product?
Each dimension is given an Actual score(A), on a scale between a Min score(N) and a
Max score (X). Choice of the range between N and X is based on the degree of granularity
needed for a particular dimension.
The Agility Measurement Index (AMI) is formally defined as,
AMI =Sumoftheactualscoresforeachdimension
SumofthemaximumscoresforeachdimensionWe define the Specific Dimension(SD) for each dimension as the ratio of Actual score
and Max score.
Calculations for a hypothetical project is shown in Table 9.1
Thus AMI = (1.5 + 2.5 + 1 + 5 + 7) / (3 + 5 + 4 + 6 + 10) = 17 / 28 = = 0.61
9.4 Discussion
As stated earlier, the AMI is an indicator metric. A low value of AMI signifies the project is
of short duration, low risk, low novelty, limited effort and with minimal customer interaction.
135

Table 9.1: Sample Calculation of Agility Measurement Index (AMI) and Specific Dimen-sion(SD)
Dimension N X A SD = A/XDuration (D) 1 3 1.5 0.5
Risk (R) 1 5 2.5 0.5Novelty (N) 1 4 1 0.25Effort (E) 1 6 5 0.83
Interaction (I) 1 10 7 0.7
Readily, the Waterfall model suggests itself as a suitable approach. However, for higher values
of the AMI, the choices between UP and XP are not that apparent. In such cases, we take
recourse to the Specific Dimension (SD) as calculated in Table 9.1. Projects with high AMI
and high SD for the dimensions Duration(D) and Risk(R) are likely candidates for an UP
approach, whereas those with similar AMI and high SD for Novelty(N) and Interaction(I)
are best tackled through XP. As stated earlier, the AMI is an indicator metric. A low value
of AMI signifies the project is of short duration, low risk, low novelty, limited effort and
with minimal customer interaction. Readily, the Waterfall model suggests itself as a suitable
approach. However, for higher values of the AMI, the choices between UP and XP are not
that apparent. In such cases, we take recourse to the Specific Dimension (SD) as calculated
in Table 9.1. Projects with high AMI and high SD for the dimensions Duration(D) and
Risk(R) are likely candidates for an UP approach, whereas those with similar AMI and high
SD for Novelty(N) and Interaction(I) are best tackled through XP.
Certain paradoxical situations may arise due to arbitrary choices of the Max score (X).
For example, it is possible to have some very high values in some fields, but still a low value
of AMI. The only guarantee against such cases is to appreciate that assignment of the scores
in the AMI calculation is best done by experienced analysts and designers with a clear vision
of the project’s context the Max score (X) needs to be decided on the required granularity
for the dimension. It must be underscored, AMI is not merely a number to blindly commit
a project to a methodology. The metric needs to be interpreted in the light of a project’s
background and future direction. An element of subjectivity is fundamental to calculating
and analyzing AMI results and talent at this task is honed through experience.
136

9.5 Summary
In this chapter, we reflected on the crossroads of different methodologies every software
development enterprise finds itself in. To alleviate the situation, we have proposed the metric
Agility Measurement Index (AMI) to gauge the level of adaptability to change required for
a project’s success, and help decide on a suitable process thereon. A sample calculation
of the Agility Measurement Index (AMI) along with broad suggestions on interpreting the
metric have also been given. For further development of this idea, we look to incorporate
the Agility Measurement Index (AMI) within analysis and design artifacts. We believe the
Agility Measurement Index (AMI) can be applied to notable effect in enterprise software
development.
137

CHAPTER 10
PROJECT-ENTROPY: A METRIC TO
UNDERSTAND RESOURCE ALLOCATION
DYNAMICS ACROSS SOFTWARE PROJECTS
10.1 Overview
Reliability of a software system, or the lack of it, is often reflected in user satisfaction.
Software development organizations frequently need to reallocate resources amongst projects
to help satisfy user needs better. In this chapter, we introduce the project-entropy metric
to understand the dynamics of such resource allocation across projects. Calculation of the
metric is illustrated through an example scenario; and we hypothesize on the existence of an
entropic limit for an organization.
10.2 Introduction and Motivation
In a typical software development organization, many projects run concurrently. Resources
from a common resource-pool are deployed to the projects, and redeployment of resources
from one project to another happens frequently. Often, resources are diverted to a project
with low user satisfaction from a project that is at a relatively higher satisfaction level.
For several reasons, we can not ignore such situations as mere symptoms of the ignorance
of Brooks’ Law [Brooks, 1995], which mandates adding people to an already late project
will only make it later. The troubled project may be fetching customer dissatisfaction for
issues unrelated to schedule. The diverted resources may not just be people; for example,
more servers running larger suits of automated regression tests can help fix issues that were
earlier being discovered only during user acceptance tests. Besides, underlying assumptions
as well as the veracity of Brooks’ Law have been questioned for many common scenarios
138

[Raymond, 2001], [Mcconnell, 1999]. In terms of its ubiquity and utility, reallocation of
resources from one project to another within an organization towards ensuring higher user
satisfaction is an interesting phenomenon. In this chapter we present the project-entropy
metric to better understand the dynamics of such resource flow and consider whether there
is a limit beyond which reallocation does not lead to enhanced user satisfaction.
Though it is difficult to find an universally accepted definition of “software entropy,”
the idea of entropy has been invoked to understand the degradation of software with use
[Bianchi et al., 2001], its inherent complexity [Harrison, 1992] etc. While we recognize the
value of these studies, this chapter takes a more organizational view of entropy in the software
development context.
The notion of project-entropy is inspired by the thermodynamic idea of entropy. Entropy
is taken to represent disorder and chaos; an antithesis to efforts that can lead to any organized
and favorable outcome. When projects start, plans look perfect on paper. But with the
progression of their life cycles, disarray manifests, fuelled by unexpected risks, oscillating
requirements and a slew of other unforeseen realities. Project-entropy helps us analyze the
actions taken at an organizational level to address the effects of this inevitable decay of
order across a set of projects. In the following sections, we explain project-entropy further,
illustrate its application through an example and conjecture about the effects of its increase
in an organization.
10.3 Project-entropy
In the context of a project, we define satisfaction (F ) as the percentage of user acceptance
tests succeeding per release, and endeavor (E) as the resource-hours deployed per release.
(Resources are most frequently personnel, but they can also be anything else needed for
fulfilling project tasks, such computing equipment etc.) We assume the project follows the
iterative and incremental development methodology. A release is thus an incremental launch
of a subset of the project’s functionality after an iteration of development; for users to test,
use and give their feedback. A user acceptance test succeeds when it confirms that the
aspect of the software system being tested by users is functioning as per their expectations.
Evidently, the goal of the development organization is to distribute endeavor such that
satisfaction in each project is maximal.
We take our universe as the software development organization. Each individual project
139

Tim
e
A BC
Incr
easi
ng
pro
ject
-en
trop
y
Entropic
limit?
T1
T2
A B C
Satisfaction
Flo
w o
f en
deavo
r
Flo
w o
f en
deavo
r
Project iterations
Project iterations
Fig
ure
10.1
:Flo
wof
Endea
vor
acro
ssP
roje
cts
and
the
Entr
opic
Lim
it
140

Table 10.1: Satisfaction Levels for Projects A, B, C at times T2 > T1
Project A Project B Project Ct = T1 56 27 73t = T2 85 66 54
running within the organization is a system of interest. When endeavor flows from one
project to another, and ∆E is the amount of endeavor transferred into or out of a project
which is at satisfaction level F, ∆P is the change in project-entropy (P ), which is given by,
∆P =∆E
F(10.1)
10.4 An Example Scenario
Let us consider an example scenario with reference to Figure 10.1. A software development
organization has three projects running, A, B, and C. Table 10.1 shows the units of
satisfaction of the three projects at times T1, and T2. At T1, 21 units of endeavor are moved
from C (at F = 73) to B (at F = 27). Thus for the whole organization, the project-entropy
increases by 21/27− 21/73 = 0.49 units. Similarly, at T2, if 35 units of endeavor are moved
from A (at F = 85) to C (at F = 54), the project-entropy increases by 35/54−35/85 = 0.24
units. So the net increase in project-entropy for the organization is 0.49 + 0.24 = 0.73 units.
As endeavor is diverted from a project at higher satisfaction to one at lower satisfaction,
project-entropy invariably increases for the organization. What does this increase in project-
entropy mean at the organizational level?
Endeavor is moved from a project at a higher satisfaction level to one at a lower level
with the expectation that satisfaction will increase in the latter. This is likely to work well
during the earlier iterations; but as projects go deeper into their life cycles, reallocation
of endeavor slowly loses its capacity to increase satisfaction. This can depend on many
factors: circumstances of a long running project may present a steeper adjustment curve
to redeployed resources, low satisfactions for two long may already have prejudiced users
so that no amount of positive results appeal to them any more, frequent realignment of
resources may have adversely affected team synergy etc. But these factors may just as well
be mitigated up to a limit by organizational capability and maturity, adherence to processes
and best practices, experienced and talented personnel etc. Based on the discussions so
141

far, and general observation of the ways of software organizations that have several projects
running simultaneously, we put forward the following hypothesis: For given set of projects
in an organization, there exists a level of project-entropy – an entropic limit – beyond
which reallocation of endeavor amongst the projects will not result in significant increase
in satisfaction. Recognizing the entropic limit will help organizations plan their resource
allocations with more purpose and effect.
10.5 Discussion
The hypothesis proposed above needs to be validated in the light of empirical data across
a range of projects and organizations. The underlying assumption of diverting endeavor to
a troubled project is that it will enhance satisfaction. From our experience, this correlation
seems to hold (till the entropic limit, as we hypothesize). But is satisfaction linked linearly
to endeavor, or is there a more complex relationship? Also, we have worked with the formula
for the change in project-entropy. It would be helpful to be able to measure the entropy
of a project, irrespective of endeavor being added or taken away from it. Will a definition
of project entropy along the lines of P = klog(W ) – again, inspired by thermodynamics –
where k is an project constant and W relates to the combinations of situations in a project
that influences project-entropy, withstand empirical validation? Another question of interest
is whether project-entropy is correlated in any way to a reliability measure such as Mean-
Time-To-Failure (MTTF) of the software system developed by the project.
10.6 Summary
This chapter introduces and illustrates the use of the project-entropy metric to understand
the dynamics of allocating resources across software projects. We also forwarded a hypothesis
regarding the limit to which resource reallocation enhances user satisfaction and outlined
plans for further empirical validation of our ideas.
142

CHAPTER 11
PREDICTUX – A FRAMEWORK FOR
PREDICTING LINUX KERNEL RELEASE TIMES
11.1 Motivation
Reliable software systems typically have a version release mechanism that is well organized
and documented. This can be drawn upon to predict release timelines, which is helpful in
gauging the quality of the software development and maintenance activity. In this chapter
we present initial results from developing and applying Predictux – a decision-tree-based
framework to predict release times of Linux kernel versions. We compare predictions from
the framework with actual data and discuss our future plans for refining Predictux further.
Reliability of a software system depends to a large extent on the development time
invested in a particular release. Development time is influenced by a number of factors,
not the least of which is the initial estimate committed to key stakeholders. Although
sophisticated software estimation techniques exist, their use is often too involved for quick
and reasonably accurate “ballpark” predictions of how long a particular release is likely to
take. We use release to mean a subset of a software system’s functionality that is released
to users for testing, use, and feedback. In this chapter, we present Predictux, a decision-
tree-based framework for predicting how many days the next Linux kernel version will take
to be released, based on analyzing some parameters of its past releases. Linux was chosen
to apply and test the framework since information regarding its releases are easily available
in the public domain [LinuxHQ, 2008], and its releases are organized through log files and
well-defined naming conventions etc.
Breiman et al.’s book Classification and Regression Trees [Breiman et al., 1984] gave wide
visibility to the use of tree-like structures in the process of knowledge discovery [Groth, 1999].
The decision-tree approach described in [Breiman et al., 1984] is commonly referred to as the
143

CART algorithm. “A Decision Tree is a tree-structured plan of a set of attributes to test in
order to predict the output” [Moore, 2007]. Knab et al.’s paper presents a decision-tree-based
mechanism for predicting defect density using evolution data extracted from the Mozilla open
source web browser project [Knab et al., 2006]. Izurieta and Bieman’s paper examines the
evolution of FreeBSD and Linux at the system and sub-system levels, by studying the growth
rate measures and plotting them against release numbers, release calendar dates, and by code
branches [Izurieta and Bieman, 2006]. We draw upon some of these ideas to explore whether
a decision-tree-based framework can help us predict Linux kernel release times. The use of
decision-trees was inspired by the ease of understanding and interpreting them. In the next
few sections we describe Predictux, discuss its experimental validation as well as open issues
and future work.
11.2 The Predictux Framework
Predictux is built around the hypothesis: Incremental release times of Linux kernel version
releases can be predicted through a decision-tree model based on certain parameters of past
releases. The parameters of past releases considered are number of files added, number of
files changed, number of files deleted, number of lines added, number of lines changed, number
of lines deleted – the predictor variables – and incremental time in days between successive
kernel versions of Linux, which we will call incremental time – the target variable.
While designing and applying Predictux, we consider the following strategy: Extract
values of the predictor variables out of the release logs, build a data set from it, use the
data set for building, pruning and learning of a decision-tree, predict the values of the
target variable using the decision-tree, and evaluate the accuracy of the predicted versus
actual data. Based on this, the major functional areas of the framework (Figure 11.1)
are identified as a pre-processor, which will parse release logs (a sample log may be found
at http://www.linuxhq.com/kernel/v2.5/index.html), extract relevant information, and
the build data set; a decision-tree analyzer, which will build the decision-tree, and make
predictions using the tree. A set of Java components were developed to serve as the pre-
processor (Figure 11.2). The data set was fed to the DTREG [DTREG, 2008] software for
building the decision-tree, its subsequent pruning and learning and for predicting the values
of the target variable. The data set consisted of 586 rows of data from Linux kernel release
1.0.0 to 2.5.75, containing the predictor variables mentioned earlier. (Figure 11.3 shows a
144

portion of the dataset.) The whole decision-tree generated from the data set consisted of
135 nodes, which was pruned to the one in Figure 11.4 to predict the incremental times for
the 20 releases from versions 2.6.20 to 2.6.1. The method used by DTREG to determine
the optimal tree size is V-fold cross validation. We recognize the fact that Linux versions
we used to build the data set are very different kernels. We make the assumption that even
when a piece of software goes through generations of changes, the amount of work involved
(which influences the incremental release times) to evolve the software can still be predicted
using our set of parameters.
11.3 Experimental Validation
The predicted and actual incremental times for the 20 releases are shown in Figure 11.5.
Figure 11.6 shows the percent deviation – calculated as, (Predicted incremental time - Actual
incremental time)/ Predicted incremental time * 100% – 16 out of 20 (80%) of the predictions
that lie within ±45%. These have a mean deviation of 30%. 14 out of these 16 (70% of the
total) predicted incremental times are within ±40% of deviation with 27% mean deviation.
11.4 Discussion
The Predictux framework in its current form has a number of limitations. We use a data set
with only 586 rows to build and train the decision-tree, which can be enhanced to include
more release data. Moreover, we take parameters such as the number of files changed etc.
as predictor variables without considering the actual functionality introduced or modified
by the changes in the files. We are also not considering patches in the analysis even as
sometimes major bug-fixing takes place through them, which affect the timing of subsequent
releases. To address some of these concerns, we are in the process of developing an efficient
and reliable natural language processing tool which will automatically read change logs,
understand the scope and context of the specific changes that lead to a new release, and
refine the predictor variables based on such understanding. We are also examining how our
approach compares to other prediction techniques; whether Predictux can be extended to
become a general purpose prediction framework by applying it on other software systems;
and whether we need to consider additional predictor variables which reflect issues such
as developer skill, organizational maturity, problem domain etc. which may influence the
145

http
://pt
cpar
tner
s.co
m/im
ages
/dec
isio
ntre
e.jp
g
Lear
n!
Extra
ct k
ey w
ords
Bui
ld d
ecis
ion
tree
Pred
ictA
naly
ze S
peci
ficat
ions
http
://pt
cpar
tner
s.co
m/im
ages
/dec
isio
ntre
e.jp
g
Lear
n!
Extra
ct k
ey w
ords
Bui
ld d
ecis
ion
tree
Pred
ictA
naly
ze S
peci
ficat
ions
Fig
ure
11.1
:P
redic
tux:
Outl
ine
ofth
eA
ppro
ach
146

Figure 11.2: Predictux: Interaction of the Pre-processor Components
Release No.
Date Files Added
Lines Added
Files Changed
Lines Changed
Files Deleted
Lines Deleted
Incremental Time
2.4.33 11-Aug-06 3 6345 149 3817 0 2734 2682.4.32 16-Nov-05 0 2464 122 1481 3 1152 1682.4.31 1-Jun-05 0 1294 50 941 0 459 582.4.30 4-Apr-05 3 4826 218 3294 1 2394 752.4.29 19-Jan-05 52 33838 769 30440 8 10768 632.4.28 17-Nov-04 36 31351 676 27130 2 15026 1022.4.27 7-Aug-04 86 75173 767 80884 45 35110 1152.4.26 14-Apr-04 45 52087 672 48365 10 38026 562.4.25 18-Feb-04 325 223743 1774 208927 40 54469 442.4.24 5-Jan-04 0 35 18 36 0 16 382.4.23 28-Nov-03 202 171914 1551 194971 13 110551 952.4.22 25-Aug-03 852 487094 3895 649230 430 322019 732.4.21 13-Jun-03 391 366643 2962 364954 105 147759 1972.4.20 28-Nov-02 777 406403 3462 409371 222 152014 1172.4.19 3-Aug-02 971 549895 3745 553238 181 162806 1592.4.18 25-Feb-02 98 75299 1013 65848 5 18349 662.4.17 21-Dec-01 26 22106 784 19070 6 10670 252.4.16 26-Nov-01 0 100 20 90 0 71 212.4.14 5-Nov-01 89 46381 854 45971 24 21243 122.4.13 24-Oct-01 61 41167 895 51014 26 27049 132.4.12 11-Oct-01 0 1747 78 627 0 1434 22.4.11 9-Oct-01 38 47933 1291 32113 2 30869 16
Figure 11.3: Predictux: Part of the Data Set used for Decision-tree Learning
147

Figure 11.4: Predictux: The Pruned Decision-tree
148

110100
1000
12
34
56
78
910
1112
1314
1516
1718
1920
Rel
ease
s
Incremental time (days)A
ctua
l P
redi
cted
Fig
ure
11.5
:In
crem
enta
lT
imes
ofLin
ux
Ker
nel
Rel
ease
s2.
6.20
to2.
6.1:
Act
ual
and
Pre
dic
ted
149

-50%
-25%0%25
%
50%
01
23
45
67
89
1011
1213
1415
1617
1819
20
Rele
ases
Percent deviation
Fig
ure
11.6
:Per
cent
dev
iation
bet
wee
npre
dic
ted
and
actu
alin
crem
enta
lti
mes
150

timing of a system’s releases. Another question of interest is whether reliability data of past
releases – such as Mean-Time-Between-Failures – can serve as effective predictor variables
for future release times.
11.5 Summary
In this chapter, we have presented the decision-tree based Predictux framework for predicting
the incremental release times of the Linux kernel version releases. 70% of the total 20
predictions for Linux kernel releases from 2.6.20 to 2.6.1 are within ±40% of the actual
incremental release times, with a mean deviation of 27%.
151

CHAPTER 12
TOOL SUPPORT FOR RESEARCH
12.1 Overview
In the last few chapters, I have discussed the formulations and results from my dissertation
research. As outlined, application of the metrics and techniques were demonstrated on
example software systems. During the various case studies that were conducted, the need
for tool support became evident. In this chapter I describe AMDEST – A Metrics Driven
Enterprise Software Tool – which was developed to implement some of the techniques of my
dissertation research.
12.2 Motivation
Activities of my dissertation research can be categorized broadly into:
1. Developing metrics and techniques.
2. Applying the above on software systems for the purposes of illustration and validation.
The first activity mainly involved self study, thinking, calculations, and discussion; the
results have been described in detail in the preceding chapters. While engaging in the second
activity I faced two major challenges. On one hand, calculating the metrics and running the
techniques manually were time consuming and prone to errors. On the other hand, whenever
I proposed a case study, project stakeholders were asking if I had any kind of automation
in support of my techniques before they were willing to commit for my study. Out of these
experiences emerged the idea and development of AMDEST, which are elaborate in the
following sections.
152

12.3 AMDEST – A Metrics Driven EnterpriseSoftware Tool
The development of AMDEST focused on the following major lines of functionality:
• To accept inputs in a variety of formats ranging from user supplied information as well
as automatic parsing of code and design artifacts.
• To automatically calculate the metric values and apply numerical methods (such as
Linear Programming for the COMP-REF and RESP-DIST techniques).
• Based on the metric values and the results of applying the numerical methods, to
apply techniques such as REQ-CHANGE, COMP-REF, and RESP-DIST and provide
recommendations to users.
Let us consider a typical scenario where AMDEST may be used, to highlight the tool’s
utility. A software system is being developed over several iterations. At the end of each
iteration, the users come with a list of new or changed requirements. In such a situation,
AMDEST promises take input from the developers, or automatically read the most readily
available development artifact (code or design diagrams), extract the relevant information,
calculate the metrics, execute the techniques and make recommendations to the development
team. AMDEST seeks to act as an automated design and development assistant that helps
human software developers leverage the power of techniques such as REQ-CHANGE and
RESP-DIST, with the minimal expenditure of manual effort. AMDEST will not make design
or development choices for the human developer, it will only facilitate the making of such
choices. An added attraction for using AMDEST is that, it does not involve any material
cost in procurement or licensing. AMDEST is open source and freely available.
With reference to Figure 12.1, at a very high-level AMDEST consists of a set of
logical subsystems. Each subsystem maps to a broad functional area – Accept, Verify,
Calculate, Run, Recommend. The functioning of AMDEST depends on the interaction of
the subsystems (although may not necessarily be in the sequential order shown in Figure 12.1)
The subsystems together make up the logical steps in how the system will be executed: inputs
are accepted from the users (via a graphical user interface, in a specific file format, as source
code, or Unified Modeling Language diagrams), they are verified against a set of predefined
153
constraints. Next the system calculates metrics based on certain formulas. The metric values
are used to run techniques specified by the processes. Results from running the techniques
are analyzed by a set of rules and recommendation presented to the user (displayed on the
screen and/or persisted in a file or database. AMDEST facilitates the implementation of the
perceptive, predictive, and prescriptive aspects of the dissertation outlined in Chapter 1.
12.3.1 Design Objectives
AMDEST is built around the vision of making it easier for designers and developers of large
scale software systems to understand the impact of changing requirements and decide how
best responsibilities can be delegated to software components to best address such impact.
Based on this vision, two basic design objectives were adopted for AMDEST:
• To make the overheads of applying and interpreting the results of techniques such as
REQ-CHANGE and RESP-DIST minimal for the software developer.
• To exclusively use non-proprietary and open source technologies for development and
implementation.
12.3.2 Development Details
AMDEST was developed in collaboration with a group of students of the Symbiosis Center
for Information Technology, Pune, India (www.scit.edu). Barring few face to face meetings
in July-August 2007 and August-October 2008 I had with the students at Pune, the entire
development was through remote collaboration. We extensively used online collaborative
tools such as Google Docs (http://documents.google.com/) and Skype (http://www.
skype.com/) for our interaction. For activities such as change management and bug-tracking,
the open source project hosting platform JavaForge http://www.javaforge.com) was used.
We followed the iterative and incremental development methodology for AMDEST. In
each time-boxed iteration of three to five weeks, a small set of features was selected, analyzed,
designed, implemented, tested, and released. So far two major versions of AMDEST have
been developed, AMDEST 1.0 – which among other features offers the end to end REQ-
CHANGE technique, calculation of the metrics for the COMP-REF technique, and is able
to automatically read Java code to detect dependencies amongst components. AMDEST 2.0
154

Accept
Verify
Calculate
Run
Recom
mend
•Code
•UML
•GUI
•File
•Display
•Store
Constraints
Formulas
Techniques
Rules
A Metrics
Driven
Enterprise
Software
Tool
Perceive
Prescribe
Predict
Accept
Verify
Calculate
Run
Recom
mend
•Code
•UML
•GUI
•File
•Display
•Store
Constraints
Constraints
Formulas
Formulas
Techniques
Techniques
Rules
Rules
A Metrics
Driven
Enterprise
Software
Tool
A Metrics
Driven
Enterprise
Software
Tool
Perceive
Prescribe
Predict
Fig
ure
12.1
:A
MD
EST
:Log
ical
Com
pon
ents
155
introduces the end to end RESP-DIST technique (the enhanced version of COMP-REF) as
well as the facility for automatically reading UML sequence diagrams.
12.3.3 Design Artifacts
The AMDEST design artifacts are archived across the JavaForge project page, as well as
the development website, http://sites.google.com/site/amdestproject/. Some of the
artifacts such as class diagrams, sequence diagrams, and screen images are given in the
Appendix sections of this document.
12.4 Summary
In this chapter I have outlined the background and development of tool support for my
dissertation. AMDEST - A Metrics Driven Enterprise Software Tool – was described in
detail. Additional tool support, as and when developed, have been described in their specific
contexts, such as in Chapter 11.
156

CHAPTER 13
CONCLUSIONS
This dissertation formulated, implemented, and validated a set of metrics, techniques, and
frameworks to guide software development. These aim to provide perceptive, predictive, and
prescriptive support to software designers and developers. The REQ-CHANGE technique
helps judge the level of impact of changing requirements. Delegation of responsibilities to
components is guided by the COMP-REF and RESP-DIST techniques. The Crosscutting
Score metric helps designers decide whether a piece of functionality is best modeled as an
aspect or a class. Using the Fidelity Register metric, the FURPS+ model of non-functional
requirements can be integrated with the use case view. The Agility Measurement Index
helps development teams decide which methodology is best suitable for a project. The
Project-entropy metric helps understand the dynamics of resource allocations across project.
Predictux is a framework to predict the release times of Linux kernel versions based on few
simple parameters. Data from more than 10 real life software systems have been used to
validate the results of my dissertation research. I have also led the collaborative development
of AMDEST – A Metrics Driven Enterprise Software Tool – which is an open source software
implementing the techniques developed in my dissertation research.
157

APPENDIX A
DESIGN ARTIFACTS OF AMDEST
Following are some of the design artifacts of AMDEST.
158

Fig
ure
A.1
:Seq
uen
ceD
iagr
amfo
rth
eim
ple
men
tati
onof
the
RE
Q-C
HA
NG
Ete
chniq
ue
159

Fig
ure
A.2
:Seq
uen
ceD
iagr
amfo
rth
eim
ple
men
tati
onof
the
CO
MP
-RE
Fte
chniq
ue
160

Figure A.3: Class Diagrams 1
161

Figure A.4: Class Diagrams 2
162

Figure A.5: Class Diagrams 3
163

Figure A.6: Class Diagrams 4
164

Figure A.7: Class Diagrams 5
165

Figure A.8: Class Diagrams 6
166

Figure A.9: Class Diagrams 7
167

Figure A.10: Class Diagrams 8
168

APPENDIX B
SCREEN IMAGES OF AMDEST
Following are some of the screen images of AMDEST.
169

Fig
ure
B.1
:A
MD
EST
:M
ain
Scr
een
170

Fig
ure
B.2
:A
MD
EST
:A
dd
Iter
atio
nD
etai
ls
171

Fig
ure
B.3
:A
MD
EST
:R
evie
w/M
odify
Iter
atio
nD
etai
ls
172

Fig
ure
B.4
:A
MD
EST
:M
etri
cV
alues
and
Lev
els
ofIm
pac
tfo
rR
EQ
-CH
AN
GE
173

REFERENCES
[Abrahamsson et al., 2003] Abrahamsson, P., Warsta, J., Siponen, M. T., and Ronkainen, J.(2003). New directions on agile methods: a comparative analysis. In ICSE ’03: Proceedingsof the 25th International Conference on Software Engineering, pages 244–254, Washington,DC, USA. IEEE Computer Society. 9.1
[Abreu, 1995] Abreu, F. B. (1995). The MOOD Metrics Set. Proc. ECOOP’95 Workshopon Metrics, 1995. 2.2.3
[AgileManifesto, 2009] AgileManifesto (2009). Principles behind the agile manifesto. http://agilemanifesto.org/principles.html. 6.3.3
[Albrecht, 1979] Albrecht, A. (1979). Measuring Application Development Productivity.Proc. Joint SHARE/GUIDE/IBM Application Development Symposium (October, 1979),83-92. 2.2.1, 4.2, 5.8
[Alexander, 1979] Alexander, C. (1979). The Timeless Way of Building. Oxford UniversityPress. 3.4
[Armour, 2004] Armour, P. G. (2004). Beware of counting loc. Commun. ACM, 47(3):21–24.2.2.1
[Baker et al., 1990] Baker, A. L., Bieman, J. M., Fenton, N., Gustafson, D. A., Melton,A., and Whitty, R. (1990). A philosophy for software measurement. J. Syst. Softw.,12(3):277–281. 2.2.3, 4.2, 5.8
[Baniassad et al., 2002] Baniassad, E. L. A., Murphy, G. C., Schwanninger, C., and Kircher,M. (2002). Managing crosscutting concerns during software evolution tasks: an inquisitivestudy. In AOSD ’02: Proceedings of the 1st international conference on Aspect-orientedsoftware development, pages 120–126, New York, NY, USA. ACM Press. 2.3
[Basili et al., 1994] Basili, V. R., Caldiera, G., and Rombach, H. D. (1994). The GoalQuestion Metric Approach: Encyclopedia of Software Engineering. Wiley and Sons, Inc.2.2.3
[Beck, 1999] Beck, K. (1999). Embracing change with extreme programming. Computer,32(10):70–77. 9.1
[Beck and Boehm, 2003] Beck, K. and Boehm, B. (2003). Agility through discipline: Adebate. Computer, 36(6):44–46. 9.2
174

[Belady and Lehman, 1976] Belady, L. A. and Lehman, M. M. (1976). A model of largeprogram development. IBM. IBM Systems Journal, Volume 15, Number 3, Page 225. 2.1,2.2.1
[Belady and Lehman, 1979] Belady, L. A. and Lehman, M. M. (1979). The characteristics oflarge systems. In Research Directions in Software Technology, Page 106-138, MIT Press.2.1, 2.2.1
[Bell, 2004] Bell, A. E. (2004). Death by uml fever. Queue, 2(1):72–80. 2.5
[Berard, 1995] Berard, E. V. (1995). Metrics for object-oriented software engineering.http://www.ipipan.gda.pl/~marek/objects/TOA/moose.html. 2.2.3, 4.2, 5.8
[Berkling et al., 2008] Berkling, K., Kiragiannis, G., Zundel, A., and Datta, S. (2008).Timeline prediction framework for iterative software engineering projects with changes.Presented at the Second International Conference on Software Engineering Approaches forOffshore and Outsourced Development (SEAFOOD) at ETH Zurich, Switzerland, July 3-4, 2008. Proceedings to be published in the Springer LNBIP (Lecture Notes in BusinessInformation Processing) series. 1.2
[Bernstein and Yuhas, 2005] Bernstein, L. and Yuhas, C. M. (2005). Trustworthy Systemsthrough Quantitative Software Engineering. Wiley-Interscience. 2.2.4
[Bhatti, 2005] Bhatti, S. N. (2005). Why quality?: Iso 9126 software quality metrics(functionality) support by uml suite. SIGSOFT Softw. Eng. Notes, 30(2):1–5. 2.5
[Bianchi et al., 2001] Bianchi, A., Caivano, D., Lanubile, F., and Visaggio, G. (2001).Evaluating software degradation through entropy. In METRICS ’01: Proceedings of the7th International Symposium on Software Metrics, page 210, Washington, DC, USA. IEEEComputer Society. 2.3, 10.2
[Bieman and Ott, 1994] Bieman, J. M. and Ott, L. M. (1994). Measuring functionalcohesion. IEEE Trans. Softw. Eng., 20(8):644–657. 2.2.3, 4.2, 5.4
[Binder, 1994] Binder, R. V. (1994). Object-oriented software testing. Commun. ACM,37(9):28–29. 2.2.3
[Boehm, 2002] Boehm, B. (2002). Get ready for agile methods, with care. Computer,35(1):64–69. 9.2
[Boehm, 1981] Boehm, B. W. (1981). Software Engineering Economics. Prentice Hall PTR.2.2.4
[Booch, 2001] Booch, G. (2001). Through the looking glass. www.sdmagazine.com, July2001. 7.1, 7.4
[Booch, 2005] Booch, G. (2005). The complexity of programming models. AOSD ’05,Chicago, USA, March 2005. 1
175

[Booch, 2008] Booch, G. (2008). Tribal memory. IEEE Software, 25(2):16–17. 1.1
[Booch et al., 2005] Booch, G., Rumbaugh, J., and Jacobson, I. (2005). The UnifiedModeling Language User Guide, Second Edition. Addison-Wesley. 2.5, 3.2.2, 5.2, 8.2
[Breiman et al., 1984] Breiman, L., Friedman, J., Stone, C. J., and Olshen, R. (1984).Classification and Regression Trees. Chapman and Hall/CRC, new ed edition. 11.1
[Brooks, 1995] Brooks, F. P. (1995). The Mythical Man-Month: Essays on SoftwareEngineering, 20th Anniversary Edition. Addison-Wesley. 2.2.4, 10.2
[Buglione and Abran, 2001] Buglione, L. and Abran, A. (2001). Creativity and innovation inspi: an exploratory paper on their measurement? In IWSM’01: International Workshopon Software Measurement, pages 85–92, Montreal, Quebec, Canada. 2.2.4
[Cabot and Gmez, 2003] Cabot, J. and Gmez, C. (2003). A simple yet useful approach toimplementing uml profiles in case tools (extended version. 2.5
[Card and Glass, 1990] Card, D. N. and Glass, R. L. (1990). Measuring Software DesignQuality. Prentice-Hall. 2.2.3, 4.2, 5.8
[Cavano and McCall, 1978] Cavano, J. P. and McCall, J. A. (1978). A framework for themeasurement of software quality. SIGSOFT Softw. Eng. Notes, 3(5):133–139. 2.2.1
[Chidamber and Kemerer, 1991] Chidamber, S. R. and Kemerer, C. F. (1991). Towards ametrics suite for object oriented design. In OOPSLA ’91: Conference proceedings onObject-oriented programming systems, languages, and applications, pages 197–211, NewYork, NY, USA. ACM Press. 2.1, 2.2.3, 4.2, 5.8
[Chidamber and Kemerer, 1994] Chidamber, S. R. and Kemerer, C. F. (1994). A metricssuite for object oriented design. IEEE Trans. Softw. Eng., 20(6):476–493. 2.1, 2.2.3, 4.2,5.8
[Churcher and Shepperd, 1995] Churcher, N. I. and Shepperd, M. J. (1995). Towards aconceptual framework for object oriented software metrics. SIGSOFT Softw. Eng. Notes,20(2):69–75. 2.2.3
[Ciupke, 1999] Ciupke, O. (1999). Automatic detection of design problems in object-orientedreengineering. In TOOLS ’99: Proceedings of the Technology of Object-Oriented Languagesand Systems, page 18, Washington, DC, USA. IEEE Computer Society. 2.4, 5.8, 6.4
[Clark, 2002] Clark, B. (2002). Manager: Eight secrets of software measurement. IEEESoftw., 19(5):12–14. 2.2.4
[Cleland-Huang et al., 2003] Cleland-Huang, J., Chang, C. K., and Christensen, M. (2003).Event-based traceability for managing evolutionary change. IEEE Trans. Softw. Eng.,29(9):796–810. 2.3, 4.2
[Conte et al., 1986] Conte, S., Dunsmore, H., and Shen, V. (1986). Software EngineeringMetrics and Models. Benjamin/Cummins. 2.1, 2.2.2
176

[Conway, 1968] Conway, M. (1968). How do committees invent? Datamation Journal, pages28–31. 6.4
[CSE, 2002] CSE (2002). Cocomo. http://sunset.usc.edu/research/COCOMOII/. 2.2,2.2.4
[Daskalantonakis, 1992] Daskalantonakis, M. K. (1992). A practical view of softwaremeasurement and implementation experiences within motorola. IEEE Trans. Softw. Eng.,18(11):998–1010. 2.2.3
[Datta, 2005] Datta, S. (2005). Integrating the furps+ model with use cases - a metrics drivenapproach. In ISSRE 2005: Supplementary Proceedings of the 16th IEEE InternationalSymposium on Software Reliability Engineering, pages 4.51–4.52. IEEE Computer Society.1.2, 2.2.2, 4.3, 5.8
[Datta, 2006a] Datta, S. (2006a). Agility measurement index: a metric for the crossroadsof software development methodologies. In ACM-SE 44: Proceedings of the 44th annualsoutheast regional conference, pages 271–273, New York, NY, USA. ACM Press. 1.2, 5.5.1,5.8
[Datta, 2006b] Datta, S. (2006b). Crosscutting score: an indicator metric for aspectorientation. In ACM-SE 44: Proceedings of the 44th annual southeast regional conference,pages 204–208, New York, NY, USA. ACM Press. 1.2, 2.3, 5.8
[Datta and van Engelen, 2006] Datta, S. and van Engelen, R. (2006). Effects of changingrequirements: a tracking mechanism for the analysis workflow. In SAC ’06: Proceedings ofthe 2006 ACM symposium on Applied computing, pages 1739–1744, New York, NY, USA.ACM Press. 1.2, 2.3, 4.7.3, 5.6, 5.8, 5.9, 6.2
[Datta and van Engelen, 2008a] Datta, S. and van Engelen, R. (2008a). Comp-ref: Atechnique to guide the delegation of responsibilities to components in software systems. InFundamental Approaches to Software Engineering, volume 4961 of LNCS, pages 332–346.Springer. 1.2, 6.2
[Datta and van Engelen, 2008b] Datta, S. and van Engelen, R. (2008b). An examination ofthe effects of offshore and outsourced development on the delegation of responsibilitiesto software components. Presented at the Second International Conference on SoftwareEngineering Approaches for Offshore and Outsourced Development (SEAFOOD) at ETHZurich, Switzerland, July 3-4, 2008. Proceedings to be published in the Springer LNBIP(Lecture Notes in Business Information Processing) series. 1.2
[Datta and van Engelen, 2009] Datta, S. and van Engelen, R. (2009). Project-entropy: Ametric to understand resource allocation dynamics across software projects. Technicalreport, TR-090121, Department of Computer Science, Florida State University, Tallahasee,Florida. 1.2
177

[Datta et al., 2007] Datta, S., van Engelen, R., Gaitros, D., and Jammigumpula, N. (2007).Experiences with tracking the effects of changing requirements on morphbank: a web-based bioinformatics application. In ACM-SE 45: Proceedings of the 45th annual southeastregional conference, pages 413–418, New York, NY, USA. ACM Press. 1.2, 5.8
[Datta et al., 2009] Datta, S., van Engelen, R., and Wang, A. (2009). Predictux: Aframework for predicting linux kernel incremental release times. Technical report, TR-090120, Department of Computer Science, Florida State University, Tallahasee, Florida.1.2
[Davis et al., 1993] Davis, A., Overmyer, S., Jordan, K., Caruso, J., Dandashi, F., Dinh,A., Kincaid, G., Ledeboer, G., Reynolds, P., Sitaram, P., Ta, A., and Theofanos, M.(1993). Identifying and Measuring Quality in a Software Requirements Specification. InProceedings of the 1st International Software Metrics Symposium. 2.2.3
[Davis, 1998] Davis, A. M. (1998). The harmony in rechoirments. IEEE Softw., 15(2):6–8.8.4
[Davis, 2004] Davis, A. M. (2004). Great Software Debates. IEEE/Wiley-Interscience. 2.3
[DeMarco, 1982] DeMarco, T. (1982). Controlling Software Projects. Yourdon Press. 2.2.2,4.2, 5.8
[DeMarco and Boehm, 2002] DeMarco, T. and Boehm, B. (2002). The agile methods fray.Computer, 35(6):90–92. 9.2
[DeMarco and Lister, 1987] DeMarco, T. and Lister, T. (1987). Peopleware: ProductiveProjects and Teams. Dorset House Pub. Co. 2.1, 2.2.2
[Demeyer et al., 2000] Demeyer, S., Ducasse, S., and Nierstrasz, O. (2000). Finding refac-torings via change metrics. SIGPLAN Not., 35(10):166–177. 2.2.4
[Demeyer et al., 2001] Demeyer, S., Mens, T., and Wermelinger, M. (2001). Towards asoftware evolution benchmark. In IWPSE ’01: Proceedings of the 4th InternationalWorkshop on Principles of Software Evolution, pages 174–177, New York, NY, USA.ACM Press. 2.3
[Denne and Cleland-Huang, 2004] Denne, M. and Cleland-Huang, J. (2004). Software byNumbers: Low-risk, High-return Development. Prentice Hall PTR. 2.2.4
[Dhama, 1995] Dhama, H. (1995). Quantitative models of cohesion and coupling in software.In Selected papers of the sixth annual Oregon workshop on Software metrics, pages 65–74,New York, NY, USA. Elsevier Science Inc. 2.2.3, 4.2, 5.4
[DTREG, 2008] DTREG (2008). Dtreg: Software for predictive modeling and forecasting.http://www.dtreg.com/. 11.2
[Eclipse, 2009] Eclipse (2009). Eclipse project. http://www.eclipse.org/. 5.9
178

[Eickelmann, 2004] Eickelmann, N. (2004). Measuring maturity goes beyond process. IEEESoftw., 21(4):12–13. 2.2.4
[Eriksson and Penker, 2000] Eriksson, H.-E. and Penker, M. (2000). Business Modeling withUML: Business Patterns at Work. John Wiley and Sons. 2.5
[Fenton, 1994] Fenton, N. (1994). Software measurement: A necessary scientific basis. IEEETrans. Softw. Eng., 20(3):199–206. 2.2.3, 4.2, 5.8
[Fenton et al., 2002] Fenton, N., Krause, P., and Neil, M. (2002). Software measurement:Uncertainty and causal modeling. IEEE Softw., 19(4):116–122. 2.2.4
[FileZilla, 2009] FileZilla (2009). Filezilla – the free ftp solution. http://
filezilla-project.org/. 5.7.1
[Filman et al., 2002] Filman, R. E., Barrett, S., Lee, D. D., and Linden, T. (2002). Insertingilities by controlling communications. Commun. ACM, 45(1):116–122. 8.5
[Fowler, 2005] Fowler, M. (2005). The new methodology. http://www.martinfowler.com/articles/newMethodology.html. 9.2
[Fowler, 2006] Fowler, M. (2006). Refactoring home page. http://www.refactoring.com/.3.2.2, 3.2.4
[Freeman, 1973] Freeman, P. (1973). Automating software design. In DAC ’73: Proceedingsof the 10th workshop on Design automation, pages 62–67, Piscataway, NJ, USA. IEEEPress. 2.4, 5.8, 6.4
[FSU, 2009] FSU (2009). University computing services. http://www.ucs.fsu.edu/
aboutUCS/index.html. 4.7.2, 5.7.1
[Garcia et al., 2005] Garcia, A., Sant’Anna, C., Figueiredo, E., Kulesza, U., Lucena, C., andvon Staa, A. (2005). Modularizing design patterns with aspects: a quantitative study. InAOSD ’05: Proceedings of the 4th international conference on Aspect-oriented softwaredevelopment, pages 3–14, New York, NY, USA. ACM Press. 7.3
[Garmus and Herron, 1996] Garmus, D. and Herron, D. (1996). Managing the SoftwareProcess: A Practical Guide to Functional Measure. Prentice Hall. 2.2.3
[Gilb, 1977] Gilb, T. (1977). Software Metrics. Winthrop Publishers, Inc. 2.2.1
[Gonzales, 2005] Gonzales, R. (2005). Developing the requirements discipline: Software vs.systems. IEEE Softw., 22(2):59–61. 2.3
[Grady, 1992] Grady, R. B. (1992). Practical Software Metrics for Project Management andProcess Improvement. Prentice Hall. 2.2.3, 8.1
[Grady, 1994] Grady, R. B. (1994). Successfully applying software metrics. Computer,27(9):18–25. 2.2.3
179

[Grady and Caswell, 1987] Grady, R. B. and Caswell, D. L. (1987). Software metrics :establishing a company-wide program. Prentice Hall. 2.1, 2.2.2
[Groth, 1999] Groth, R. (1999). Data Mining: Building Competitive Advantage. PrenticeHall PTR. 11.1
[Halstead, 1977] Halstead, M. H. (1977). Elements of Software Science. Elsevier North-Holland, Inc. 2.1, 2.2.1, 4.2
[Harel and Rumpe, 2004] Harel, D. and Rumpe, B. (2004). Meaningful modeling: What’sthe semantics of ”semantics”? Computer, 37(10):64–72. 2.5
[Harrison et al., 1998] Harrison, R., Counsell, S. J., and Nithi, R. V. (1998). An evaluationof the mood set of object-oriented software metrics. IEEE Trans. Softw. Eng., 24(6):491–496. 2.2.3, 4.2, 5.8
[Harrison, 1992] Harrison, W. (1992). An entropy-based measure of software complexity.IEEE Trans. Softw. Eng., 18(11):1025–1029. 10.2
[Henderson-Sellers, 1999] Henderson-Sellers, B. (1999). Oo software process improvementwith metrics. In METRICS ’99: Proceedings of the 6th International Symposium onSoftware Metrics, page 2, Washington, DC, USA. IEEE Computer Society. 2.2.3
[Herbsleb and Grinter, 1999a] Herbsleb, J. D. and Grinter, R. E. (1999a). Architectures,coordination, and distance: Conway’s law and beyond. IEEE Softw., 16(5):63–70. 6.3.3,6.4
[Herbsleb and Grinter, 1999b] Herbsleb, J. D. and Grinter, R. E. (1999b). Splitting theorganization and integrating the code: Conway’s law revisited. In ICSE ’99: Proceedingsof the 21st international conference on Software engineering, pages 85–95, Los Alamitos,CA, USA. IEEE Computer Society Press. 6.4
[Humphrey, 1996] Humphrey, W. S. (1996). Using a defined and measured personal softwareprocess. IEEE Softw., 13(3):77–88. 2.2.3
[Humphrey, 2005] Humphrey, W. S. (2005). PSP: A Self-Improvement Process for SoftwareEngineers. Addison-Wesley. 2.2.1, 2.2.3
[Humphrey, 2006] Humphrey, W. S. (2006). TSP: Leading a Development Team. Addison-Wesley. 2.2.3
[IEEE, 1994] IEEE (1994). Software Engineering Standards, 1994 edition. IEEE. 2.2.3
[ITIS, 2009] ITIS (2009). Integrated taxonomic information system. http://www.itis.
gov/. 4.7.3
[Izurieta and Bieman, 2006] Izurieta, C. and Bieman, J. (2006). The evolution of freebsdand linux. In ISESE ’06: Proceedings of the 2006 ACM/IEEE International Symposiumon Empirical Software Engineering, pages 204–211, New York, NY, USA. ACM Press.11.1
180

[Jackson, 2006a] Jackson, D. (2006a). Dependable software by design.http://www.sciam.com/article.cfm?chanID=sa006&colID=1&articleID=
00020D04-CFD8-146C-8D8D83414B7F0000. The Scientific American, June 2006.2.4
[Jackson, 2006b] Jackson, D. (2006b). Software Abstractions: Logic, Language and Analysis.MIT Press. 2.4, 5.8, 6.4
[Jacobson, 2003] Jacobson, I. (2003). Use cases and aspects working seamlessly together.Journal of Object Technology, vol. 2, no. 4, July-August 2003. 7.4, 7.5
[Jacobson et al., 1999] Jacobson, I., Booch, G., and Rumbaugh, J. (1999). The UnifiedSoftware Development Process. Addison-Wesley. 3.3.2, 4.3, 4.4, 8.4, 9.1
[Jones, 1991] Jones, C. (1991). Applied Software Measurements. McGraw-Hill. 2.2.1
[Kabaili et al., 2001] Kabaili, H., Keller, R. K., and Lustman, F. (2001). Cohesion aschangeability indicator in object-oriented systems. In CSMR ’01: Proceedings of the FifthEuropean Conference on Software Maintenance and Reengineering, page 39, Washington,DC, USA. IEEE Computer Society. 2.2.4
[Karimi and Konsynski, 1988] Karimi, J. and Konsynski, B. R. (1988). An automatedsoftware design assistant. IEEE Trans. Softw. Eng., 14(2):194–210. 2.4, 5.8, 6.4
[Karlsson and Ryan, 1997] Karlsson, J. and Ryan, K. (1997). A cost-value approach forprioritizing requirements. IEEE Softw., 14(5):67–74. 2.3, 4.2
[Kemerer and Slaughter, 1999] Kemerer, C. F. and Slaughter, S. (1999). An empiricalapproach to studying software evolution. IEEE Trans. Softw. Eng., 25(4):493–509. 2.3
[Kersten and Murphy, 1999] Kersten, M. A. and Murphy, G. C. (1999). Atlas: A casestudy in building a web-based learning environment using aspect-oriented programming.Technical report, University of British Columbia, Vancouver, BC, Canada. 7.3
[Kiczales, 2003] Kiczales, G. (2003). Interview with gregor kiczales. topic: Aspect orientedprogramming (aop). www.theserverside.com, July 2003. 7.1, 7.3, 7.4
[Knab et al., 2006] Knab, P., Pinzger, M., and Bernstein, A. (2006). Predicting defectdensities in source code files with decision tree learners. In MSR ’06: Proceedings ofthe 2006 International Workshop on Mining Software Repositories, pages 119–125, NewYork, NY, USA. ACM Press. 11.1
[Kornstadt and Sauer, 2007] Kornstadt, A. and Sauer, J. (2007). Mastering dual-shoredevelopment - the tools and materials approach adapted to agile offshoring. In Meyer, B.and Joseph, M., editors, SEAFOOD, volume 4716 of Lecture Notes in Computer Science,pages 83–95. Springer. 6.3.3
[Krutchen, 2004] Krutchen, P. (2004). The Rational Unified Process: An Introduction, ThirdEdition. Addison-Wesley. 2.2.4, 8.1
181

[Lam and Loomes, 1998] Lam, W. and Loomes, M. (1998). Requirements evolution in themidst of environmental change: A managed approach. In CSMR ’98: Proceedings ofthe 2nd Euromicro Conference on Software Maintenance and Reengineering ( CSMR’98),page 121, Washington, DC, USA. IEEE Computer Society. 2.3, 4.2
[Lanza, 2001] Lanza, M. (2001). The evolution matrix: recovering software evolution usingsoftware visualization techniques. In IWPSE ’01: Proceedings of the 4th InternationalWorkshop on Principles of Software Evolution, pages 37–42, New York, NY, USA. ACMPress. 2.2, 2.2.4
[Larman, 1997] Larman, C. (1997). Applying UML and Patterns. Prentice Hall. 5.2, 7.2
[Leffingwell and Widrig, 2000] Leffingwell, D. and Widrig, D. (2000). Managing SoftwareRequirements: A Unified Approach. Addison-Wesley. 2.3
[Lehman et al., 1997] Lehman, M., Ramil, J., Wernick, P., and Perry, D. (1997). Metricsand laws of software evolution: The nineties view. http://citeseer.ist.psu.edu/
lehman97metrics.html. 2.2.1
[Lesiecki, 2002] Lesiecki, N. (2002). Improve modularity with aspect-oriented program-ming. IBM developerWorks http://www.ibm.com/developerworks/java/library/
j-aspectj/, January 2002. 7.3, 7.5
[LinuxHQ, 2008] LinuxHQ (2008). Linuxhq: The linux information headquarters. http:
//www.linuxhq.com/. 11.1
[Liu et al., 2004] Liu, J., Liu, Z., He, J., and Li, X. (2004). Linking uml models of design andrequirement. In ASWEC ’04: Proceedings of the 2004 Australian Software EngineeringConference (ASWEC’04), page 329, Washington, DC, USA. IEEE Computer Society. 2.5
[Lopes, 2002] Lopes, C. (2002). Aspect-oriented programming: An historical perspective.7.3
[Lopes and Bajracharya, 2005] Lopes, C. V. and Bajracharya, S. K. (2005). An analysis ofmodularity in aspect oriented design. In AOSD ’05: Proceedings of the 4th internationalconference on Aspect-oriented software development, pages 15–26, New York, NY, USA.ACM Press. 7.3
[Lorenz and Kidd, 1994] Lorenz, M. and Kidd, J. (1994). Object-oriented Software Metrics:A Practical Guide. PTR Prentice Hall. 2.1, 2.2.3
[Mak et al., 2004] Mak, J. K. H., Choy, C. S. T., and Lun, D. P. K. (2004). Precise modelingof design patterns in uml. In ICSE ’04: Proceedings of the 26th International Conferenceon Software Engineering, pages 252–261, Washington, DC, USA. IEEE Computer Society.2.5
[MathWorks, 2009] MathWorks (2009). The mathworks. http://www.mathworks.com/.6.3.2
182

[McCabe, 1976] McCabe, T. (1976). A software complexity measure. In IEEE Trans.Software Engineering, vol. SE-2, December 1976, pages 308–320. 2.1, 2.2.1, 4.2, 5.8
[McCabe and Watson, 1994] McCabe, T. and Watson, A. (1994). Software complexity. InCrosstalk, vol. 7, no. 12, December 1994, pages 5–9. 2.2.1
[Mcconnell, 1999] Mcconnell, S. (1999). Brooks’ law repealed. IEEE Softw., 16(6):6–8. 10.2
[Mens and Demeyer, 2001] Mens, T. and Demeyer, S. (2001). Future trends in softwareevolution metrics. In IWPSE ’01: Proceedings of the 4th International Workshop onPrinciples of Software Evolution, pages 83–86, New York, NY, USA. ACM Press. 2.2.4
[Moore, 2007] Moore, A. (2007). Decision trees: A tutorial. http://www.autonlab.org/
tutorials/dtree.html. 11.1
[Morphbank, 2009a] Morphbank (2009a). Morphbank. http://www.morphbank.net/. 4.7.3,5.7.1
[Morphbank, 2009b] Morphbank (2009b). Morphbank 2.5 user manual. http://morphbank.net/docs/mbUserManual.pdf. 4.7.3
[Napier and McDaniel, 2006] Napier, R. and McDaniel, R. (2006). Measuring What Matters:Simplified Tools for Aligning Teams and their Stakeholders. Davies-Black Pub. 2.2.4
[Newkirk, 2002] Newkirk, J. (2002). Introduction to agile processes and extreme pro-gramming. In ICSE ’02: Proceedings of the 24th International Conference on SoftwareEngineering, pages 695–696, New York, NY, USA. ACM Press. 9.1
[Nuseibeh, 2004] Nuseibeh, B. (2004). Crosscutting requirements. In AOSD ’04: Proceedingsof the 3rd international conference on Aspect-oriented software development, pages 3–4,New York, NY, USA. ACM. 7.4, 7.5
[O’Connell, 2001] O’Connell, F. (2001). How to Run Successful Projects III: The SilverBullet. Addison-Wesley. 2.2.4
[O’Keeffe and Cinneide, 2003] O’Keeffe, M. and Cinneide, M. M. O. (2003). A stochasticapproach to automated design improvement. In PPPJ ’03: Proceedings of the 2ndinternational conference on Principles and practice of programming in Java, pages 59–62, New York, NY, USA. Computer Science Press, Inc. 2.4, 5.8
[Optimalon, 2009] Optimalon (2009). Optimalon software. http://www.optimalon.com/.5.7.2
[Parnas, 1972] Parnas, D. L. (1972). On the criteria to be used in decomposing systems intomodules. Commun. ACM, 15(12):1053–1058. 7.2
[Paulish and Carleton, 1994] Paulish, D. J. and Carleton, A. D. (1994). Case studies ofsoftware-process-improvement measurement. Computer, 27(9):50–57. 2.2.3
183

[Pitt, 2005] Pitt, W. D. (2005). Measuring java reuse, productivity, and roi. . Dr.Dobb’sJournal, July 2005. 2.2.4
[Pressman, 2000] Pressman, R. S. (2000). Software Engineering: A Practitioners Approach.McGraw Hill. 2.2.4, 4.2, 5.8
[PrestoSoft, 2009] PrestoSoft (2009). Prestosoft. http://www.prestosoft.com/ps_home.
asp. 4.7.3
[Putrycz and Bernard, 2002] Putrycz, E. and Bernard, G. (2002). Using aspect orientedprogramming to build a portable load balancing service. In ICDCSW ’02: Proceedingsof the 22nd International Conference on Distributed Computing Systems, pages 473–480,Washington, DC, USA. IEEE Computer Society. 7.3
[Quatrani, 2005] Quatrani, T. (2005). Introduction to uml 2.0. http://www.omg.org/news/meetings/workshops/MDA-SOA-WS_Manual/00-T4_Matthews.pdf. IBM Software Group,2005. 2.5
[Ramil and Lehman, 2001] Ramil, J. F. and Lehman, M. M. (2001). Defining and applyingmetrics in the context of continuing software evolution. In METRICS ’01: Proceedings ofthe 7th International Symposium on Software Metrics, page 199, Washington, DC, USA.IEEE Computer Society. 2.2.4
[Rashid et al., 2003] Rashid, A., Moreira, A., and Araujo, J. (2003). Modularization andcomposition of aspectual requirements. AOSD ’03, Boston, USA, 2003. 7.4, 7.5
[Raymond, 2001] Raymond, E. S. (2001). The Cathedral and the Bazaar: Musings on Linuxand Open Source by an Accidental Revolutionary. O’Reilly. 10.2
[Rico, 2004] Rico, D. F. (2004). ROI of Software Process Improvement: Metrics for ProjectManagers and Software Engineers. J. Ross Pub. 2.2.4
[Rifkin, 2001] Rifkin, S. (2001). What makes measuring software so hard ? IEEE Softw.,18(3):41–45. 2.2.4
[Robinson et al., 2003] Robinson, W. N., Pawlowski, S. D., and Volkov, V. (2003). Require-ments interaction management. ACM Comput. Surv., 35(2):132–190. 2.3, 4.2
[Rodriguez et al., 2007] Rodriguez, F., Geisser, M., Berkling, K., and Hildenbrand, T.(2007). Evaluating collaboration platforms for offshore software development scenarios. InMeyer, B. and Joseph, M., editors, SEAFOOD, volume 4716 of Lecture Notes in ComputerScience, pages 96–108. Springer. 6.4
[Rumbaugh et al., 2005] Rumbaugh, J., Jacobson, I., and Booch, G. (2005). The UnifiedModeling Language Reference Manual, Second Edition. Addison-Wesley. 2.5, 3.2.3, 5.2
[Sagheb-Tehrani and Ghazarian, 2002] Sagheb-Tehrani, M. and Ghazarian, A. (2002). Soft-ware development process: strategies for handling business rules and requirements. SIG-SOFT Softw. Eng. Notes, 27(2):58–62. 2.3
184

[Schach, 2005] Schach, S. (2005). Object-oriented and Classical Software Development, SixthEdition. McGraw-Hill International Edition. 5.7.1, 5.1, 9.1
[SCIT, 2009] SCIT (2009). Symbiosis center for information technology. http://www.scit.edu/. 5.7.1
[Sears, 1993] Sears, A. (1993). Layout appropriateness: A metric for evaluating user interfacewidget layout. IEEE Trans. Softw. Eng., 19(7):707–719. 2.2.3
[Selic, 2005a] Selic, B. (2005a). On software platforms, their modeling with uml 2, andplatform-independent design. In ISORC ’05: Proceedings of the Eighth IEEE InternationalSymposium on Object-Oriented Real-Time Distributed Computing (ISORC’05), pages 15–21, Washington, DC, USA. IEEE Computer Society. 2.5
[Selic, 2004] Selic, B. V. (2004). Uml 2.0 : Exploiting abstraction and automation.http://www.sdtimes.com/opinions/guestview_098.htm. 2.5
[Selic, 2005b] Selic, B. V. (2005b). On the semantic foundations of standarduml 2.0. http://www-128.ibm.com/developerworks/rational/library/05/317_
semantic/semantic_foundations_uml_2_0.pdf. 2.5
[Selic, 2005c] Selic, B. V. (2005c). Unified modeling language version 2.0 : In supportof model-driven development. http://www-128.ibm.com/developerworks/rational/
library/05/321_uml/. 2.5
[Sengupta et al., 2006] Sengupta, B., Chandra, S., and Sinha, V. (2006). A research agendafor distributed software development. In ICSE ’06: Proceeding of the 28th internationalconference on Software engineering, pages 731–740, New York, NY, USA. ACM. 6.4
[Shami et al., 2004] Shami, N. S., Bos, N., Wright, Z., Hoch, S., Kuan, K. Y., Olson, J.,and Olson, G. (2004). An experimental simulation of multi-site software development. InCASCON ’04: Proceedings of the 2004 conference of the Centre for Advanced Studies onCollaborative research, pages 255–266. IBM Press. 6.4
[Sosnoski, 2005] Sosnoski, D. (2005). Classworking toolkit: Putting aspects towerk. IBM developerWorks http://www.ibm.com/developerworks/java/library/
j-cwt03085/index.html, March 2005. 7.4
[Sotirovski, 2001] Sotirovski, D. (2001). Heuristics for iterative software development. IEEESoftware, 18(3):66–73. 2.2.4
[Stiemerling et al., 1997] Stiemerling, O., Kahler, H., and Wulf, V. (1997). How to makesoftware softer - designing tailorable applications. In Symposium on Designing InteractiveSystems, pages 365–376. 2.3
[Stroustrup, 2007] Stroustrup, B. (2007). The problem with programming. http://www.
technologyreview.com/InfoTech/17987/?a=f. 1.1
185

[Thomas, 2004] Thomas, D. (2004). Mda: Revenge of the modelers or uml utopia? IEEESoftware, 21(3):15–17. 2.5
[Tilley et al., 2003] Tilley, T., Cole, R., Becker, P., and Eklund, P. (2003). A survey offormal concept analysis support for software engineering activities. In Stumme, G.,editor, Proceedings of the First International Conference on Formal Concept Analysis- ICFCA’03. Springer-Verlag. 9.1
[Unhelkar, 2005] Unhelkar, B. (2005). Verification and Validation for Quality of UML 2.0Models. John Wiley. 2.5
[van Solingen, 2004] van Solingen, R. (2004). Measuring the roi of software process improve-ment. IEEE Softw., 21(4):32–34. 2.2, 2.2.4
[Weller, 1994] Weller, E. F. (1994). Using metrics to manage software projects. Computer,27(9):27–33. 2.2.3
[Whitmire, 1997] Whitmire, S. A. (1997). Object-Oriented Design Measurement. WileyComputer Pub. 2.1, 2.2.3
[Wiegers, 1999] Wiegers, K. E. (1999). A software metrics primer. http://www.
processimpact.com/articles/metrics_primer.html. 2.2.3
[Wilde et al., 1993] Wilde, N., Matthews, P., and Huitt, R. (1993). Maintaining object-oriented software. IEEE Softw., 10(1):75–80. 2.2.3
[Zhang and Jacobsen, 2003] Zhang, C. and Jacobsen, H.-A. (2003). Refactoring middlewarewith aspects. IEEE Transactions on Parallel and Distributed Systems, 14(11):1058–1073.7.3
186

BIOGRAPHICAL SKETCH
Subhajit Datta
Subhajit Datta joined graduate studies at the Department of Computer Science (CS), Florida
State University (FSU) in Spring 2005 and received a Master of Science in Computer Science
in Summer 2006.
He earlier worked as a software engineer with IBM Global Services in roles of release
manager, technical lead, business systems analyst, and application programmer. One of
Subhajit’s papers was published as an intellectual capital in IBM’s IT Process Model
knowledge network and recommended for patent filing evaluation. Subhajit has a Bachelor
of Electrical Engineering degree from Jadavpur University, Calcutta (Kolkata), India. He is
a IBM Certified Specialist for Rational Unified Process, and has additional certification in
object-oriented analysis and design with Unified Modeling Language.
Subhajit’s research interests include requirements/specifications, design tools and tech-
niques, metrics, and software architecture. He has several research publications.
Reading, writing, and travel are among Subhajit’s interests.
187
Related Documents


![Refactoring Smelly Spreadsheet Models - HASLab...ware development techniques [23,19,5,3,21], software refactoring and evolution techniques [20,10,22,14,6], and software metrics and](https://static.cupdf.com/doc/110x72/5f052bd07e708231d411a087/refactoring-smelly-spreadsheet-models-haslab-ware-development-techniques-23195321.jpg)