08 Steven A. Kandarian Executive Vice President & Chief Investment Officer

metlife Investor Day 2008 Investments
Jul 27, 2015
Welcome message from author
This document is posted to help you gain knowledge. Please leave a comment to let me know what you think about it! Share it to your friends and learn new things together.
Transcript

08
Steven A. Kandarian
Executive Vice President &Chief Investment Officer
2
Defensively Positioned for Current Environment
• Identified weaknesses in certain asset sectors early and took action
• Repositioned portfolio for recession beginning in 2007
• Reduced balance sheet leverage and increased liquidity

08
Market Overview

4
2009 Market View and Themes
Fundamentals deteriorateCreditCredit
Fundamentals deteriorateReal EstateReal Estate
Rates remain lowFedFed
Contained, talk of deflationInflationInflation
Global recessionEconomyEconomy
Well ahead of fundamentalsSpreadsSpreads
5
0
100
200
300
400
500
600
700
800
1920 1931 1942 1953 1964 1975 1986 1997 2008
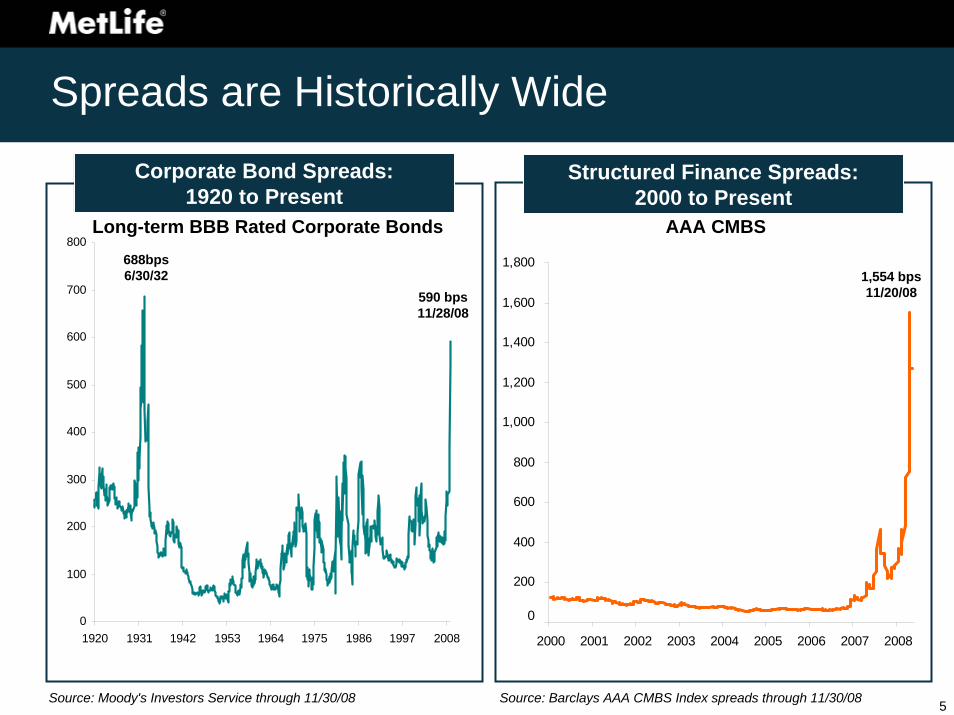
Source: Moody's Investors Service through 11/30/08
AAA CMBS
590 bps11/28/08
688bps6/30/32 1,554 bps
11/20/08
Spreads are Historically Wide
Corporate Bond Spreads:1920 to Present
Structured Finance Spreads:2000 to Present
Long-term BBB Rated Corporate Bonds
-
200
400
600
800
1,000
1,200
1,400
1,600
1,800
2000 2001 2002 2003 2004 2005 2006 2007 2008
0
Source: Barclays AAA CMBS Index spreads through 11/30/08

6
High Yield Spreads and Default Rates Delinked
0%
2%
4%
6%
8%
10%
12%
14%
16%
18%
1987 1990 1993 1996 1999 2002 2005 20080
250
500
750
1000
1250
1500
1750
2000
Moody's U.S. Speculative Grade Default Rates
Barclays U.S. Corporate High Yield
Spread over Treasuries(bps)
Spreads through 11/30/08; Default Rate through 10/31/08
Trai
ling
12-m
onth
Def
ault
Rat
e (%
)
The Credit Cycle

08
Portfolio Income

8
$0
$300
$600
$900
$1,200
$1,500
$1,800
$2,100
2003 2004 2005 2006 2007 2008E*2009P
• Alternative Investments– Corporate Joint Ventures– Hedge Funds
• Real Estate Development Joint Ventures and Funds
• Prepayments– Corporate Bond
Prepayments– Commercial Mortgage
Prepayments
• Securities Lending
2009 Plan Variable Income $150 Million per Quarter / $600 Million for Year
Annual Variable Net Investment Income ($ Millions)
*Mid-point of 2008E range between $700 - $810 million
9
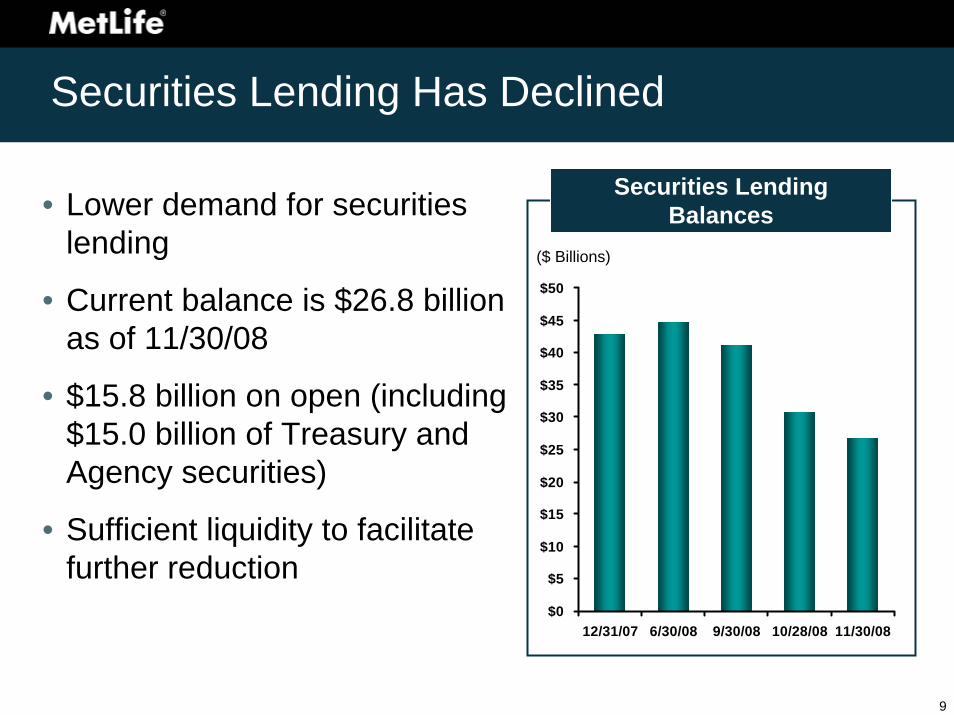
Securities Lending Has Declined
• Lower demand for securities lending
• Current balance is $26.8 billion as of 11/30/08
• $15.8 billion on open (including $15.0 billion of Treasury and Agency securities)
• Sufficient liquidity to facilitate further reduction
$0
$5
$10
$15
$20
$25
$30
$35
$40
$45
$50
12/31/07 6/30/08 9/30/08 10/28/08 11/30/08
Securities LendingBalances
($ Billions)
10
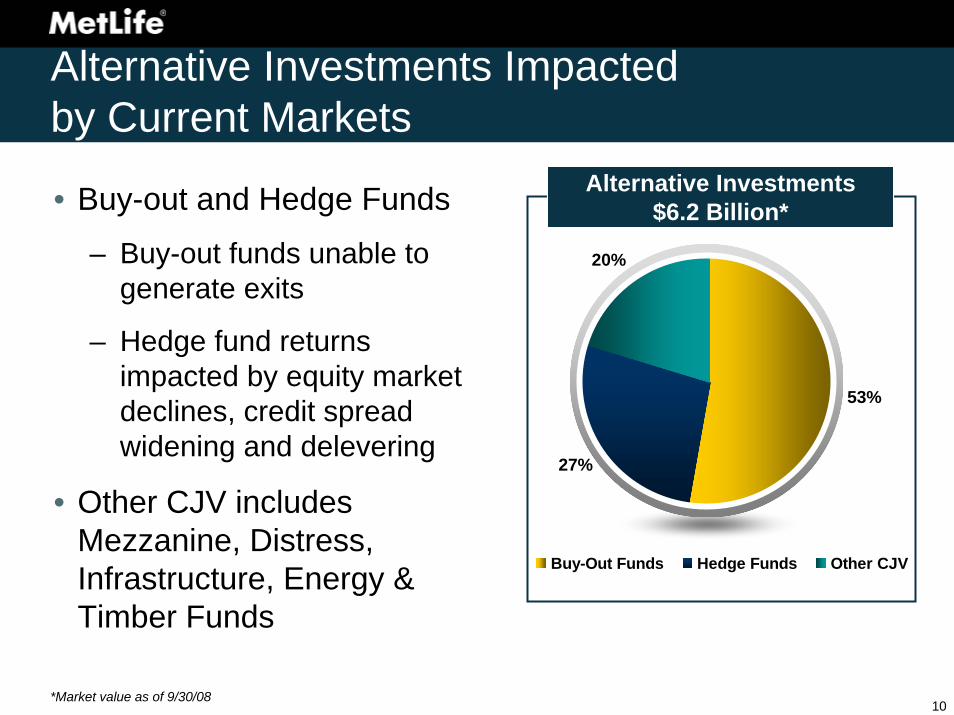
Alternative Investments Impactedby Current Markets
• Buy-out and Hedge Funds
– Buy-out funds unable to generate exits
– Hedge fund returns impacted by equity market declines, credit spread widening and delevering
• Other CJV includes Mezzanine, Distress, Infrastructure, Energy & Timber Funds
53%
27%
20%
Buy-Out Funds Hedge Funds Other CJV
Alternative Investments $6.2 Billion*
*Market value as of 9/30/08

08
Portfolio Overview

12
• Total Portfolio:ᅳ Diversified portfolio across
many sectors
• Liability Driven:ᅳ Asset-liability management
• Team Investment Approach:ᅳ 600+ investment and support
professionals
• Risk Management:ᅳ Part of our culture
MetLife Investments
34.9%
24.8%
16.0%
5.4%
3.2%
3.6%
4.6%
7.5%
*Market value as of 9/30/08
$305.2 Billion of Managed Assets*
Investment Grade Corporate BondsStructured FinanceCommercial and Agricultural MortgagesCash and Short-Term
US Treasury/AgencyBelow Investment Grade CreditReal Estate EquityCorporate Equity

13
Proactively Repositioned Portfolio
U.S. Treasury/Agency 6.9% 5.4%Structured Finance
Residential MBS (RMBS) 18.2% 15.4%Commercial MBS (CMBS) 6.1% 5.2%Asset Backed Securities (ABS) 3.6% 4.2%Total Structured Finance 27.9% 24.8%
Credit'A' or Better Corporates 20.9% 21.2%'BBB' Corporates 15.0% 13.6%Below Invest. Grade Credit 5.7% 4.6%Total Credit 41.6% 39.4%
Real EstateCommercial Mortgages 10.6% 12.0%Agricultural Mortgages 3.2% 4.1%Real Estate Equity 3.2% 3.6%Total Real Estate 17.0% 19.7%
Corporate Equity 3.6% 3.2%Cash & Short-Term 3.0% 7.5%
Total Managed Assets 100.0% 100.0%Market Value of Managed Assets ($ Billions) $318.8 $305.2
MetLife Portfolio Allocation Trend September 30, 2007 September 30, 2008

14
High Quality Structured Finance Portfolio
• $75.7 billion*
• Collateral characteristics and tranche selection is critical
• Less than $200 million of below investment grade structured finance
*Market value as of 9/30/08
09/30/07 09/30/08
RMBS CMBS ABS
Structured Financeas a % of Managed Assets
$88.8B $75.7B
3.6%6.1%
18.2% 15.4%
5.2%4.2%
24.8%27.9%
15
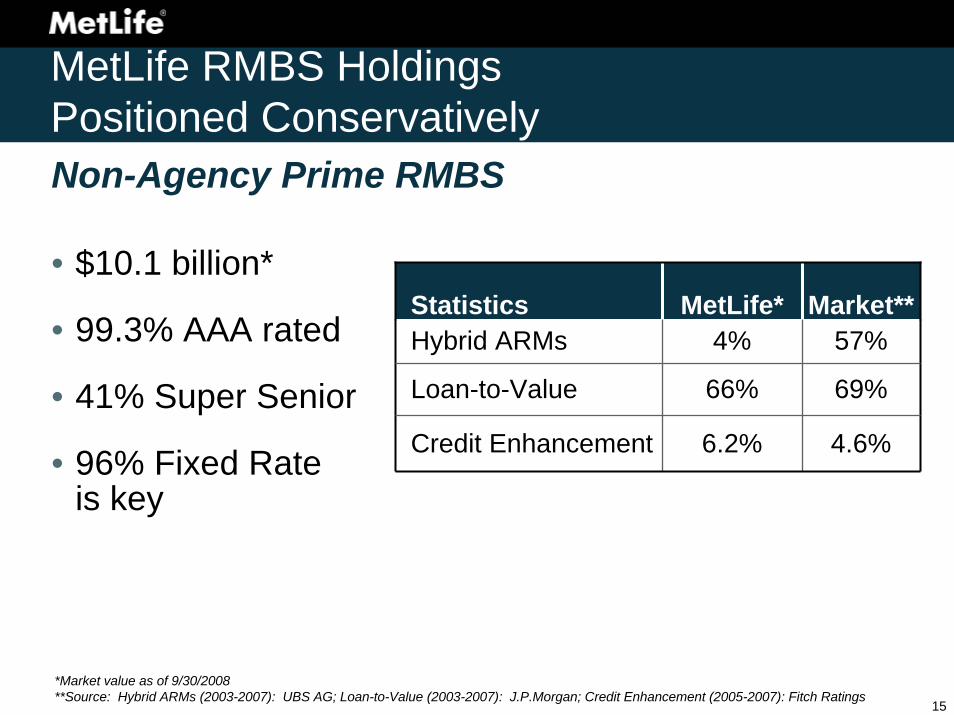
MetLife RMBS HoldingsPositioned Conservatively
• $10.1 billion*
• 99.3% AAA rated
• 41% Super Senior
• 96% Fixed Rate is key
*Market value as of 9/30/2008**Source: Hybrid ARMs (2003-2007): UBS AG; Loan-to-Value (2003-2007): J.P.Morgan; Credit Enhancement (2005-2007): Fitch Ratings
Statistics MetLife* Market**Hybrid ARMs 4% 57%
Loan-to-Value 66% 69%
Credit Enhancement 6.2% 4.6%
Non-Agency Prime RMBS

16
0%
1%
2%
3%
4%
5%
6%
7%
1 3 5 7 9 11 13 15 17 19 21 23 25 27 29
Non-Agency Prime RMBSMetLife versus MarketBetter collateral results in better performance
Market C/E*
Market 60+ DQ60+D
Q o
r C/E
Lev
el
Loan Age in Months*Credit Enhancement as of 9/30/08Source: Intex; Data as of 9/30/08; Delinquencies weighted by Loan Age, 05-07
Credit Enhancement & Delinquencies

17
0%
1%
2%
3%
4%
5%
6%
7%
1 3 5 7 9 11 13 15 17 19 21 23 25 27 29
MET 60+ DQ
Better collateral results in better performance
MET C/E*
Market C/E*
Market 60+ DQ60+D
Q o
r C/E
Lev
el
Loan Age in Months*Credit Enhancement as of 9/30/08Source: Intex; Data as of 9/30/08; Delinquencies weighted by Loan Age, 05-07
Non-Agency Prime RMBSMetLife versus Market
Credit Enhancement & Delinquencies
18
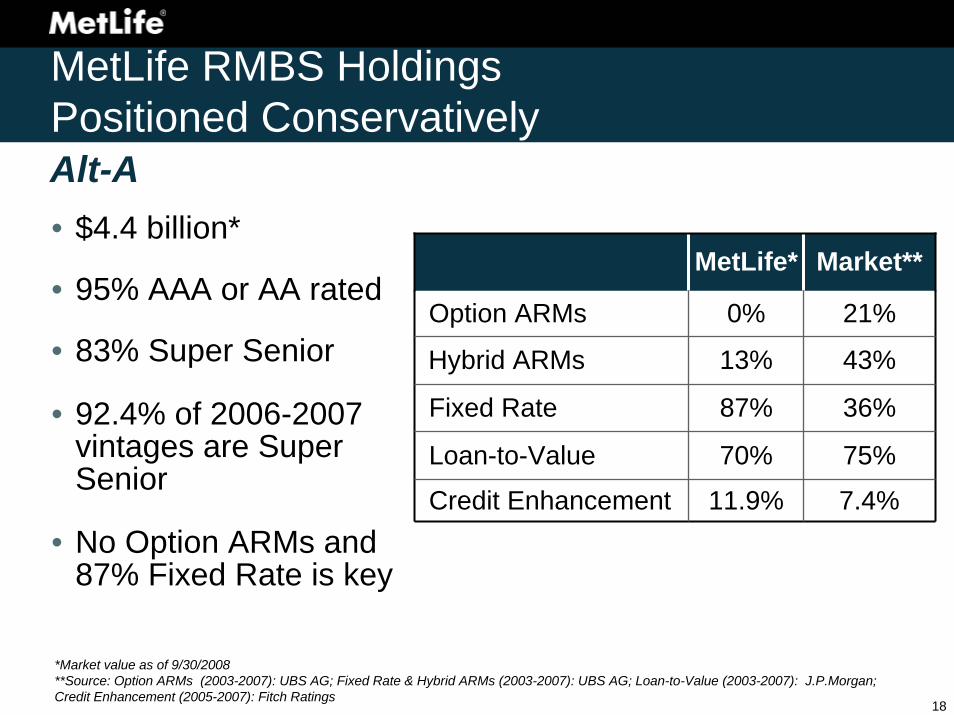
MetLife RMBS HoldingsPositioned Conservatively
• $4.4 billion*
• 95% AAA or AA rated
• 83% Super Senior
• 92.4% of 2006-2007 vintages are Super Senior
• No Option ARMs and 87% Fixed Rate is key
MetLife* Market**
Option ARMs 0% 21%
Hybrid ARMs 13% 43%
Fixed Rate 87% 36%
Loan-to-Value 70% 75%
Credit Enhancement 11.9% 7.4%
Alt-A
*Market value as of 9/30/2008**Source: Option ARMs (2003-2007): UBS AG; Fixed Rate & Hybrid ARMs (2003-2007): UBS AG; Loan-to-Value (2003-2007): J.P.Morgan;Credit Enhancement (2005-2007): Fitch Ratings

19
Alt-A RMBSMetLife versus Market Better collateral results in better performance
Market C/E*
Market 60+ DQ
0%
2%
4%
6%
8%
10%
12%
14%
1 3 5 7 9 11 13 15 17 19 21 23 25 27 29
60+D
Q o
r C/E
Lev
el
Loan Age in Months*Credit Enhancement as of 9/30/08Source: Intex; Data as of 9/30/08; Delinquencies weighted by Loan Age, 05-07
Credit Enhancement & Delinquencies

20
Alt-A RMBSMetLife versus Market Better collateral results in better performance
MET C/E*
Market C/E*
Market 60+ DQ
MET 60+ DQ60+D
Q o
r C/E
Lev
el
0%
2%
4%
6%
8%
10%
12%
14%
1 3 5 7 9 11 13 15 17 19 21 23 25 27 29Loan Age in Months
*Credit Enhancement as of 9/30/08Source: Intex; Data as of 9/30/08; Delinquencies weighted by Loan Age, 05-07
Credit Enhancement & Delinquencies
21
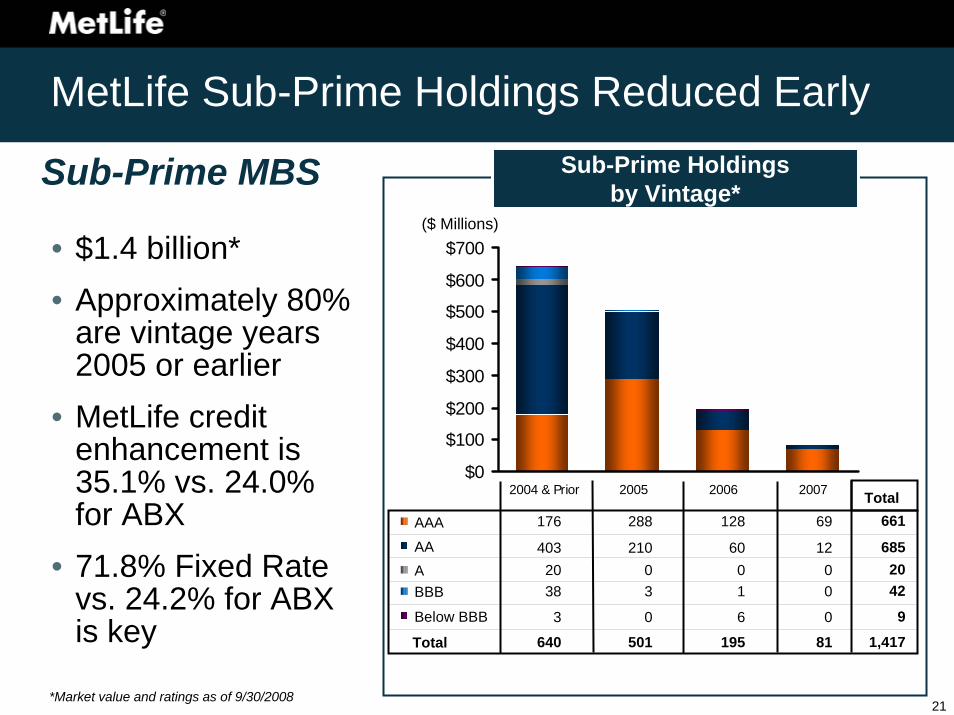
MetLife Sub-Prime Holdings Reduced Early
• $1.4 billion* • Approximately 80%
are vintage years 2005 or earlier
• MetLife credit enhancement is 35.1% vs. 24.0% for ABX
• 71.8% Fixed Rate vs. 24.2% for ABX is key
Sub-Prime MBS
*Market value and ratings as of 9/30/2008
Below BBB 3 0 6 0
BBB 38 3 1 0A 20 0 0 0AA 403 210 60 12
AAA 176 288 128 69
9
4220
685
661Total
Total 640 501 195 81 1,417
$0
$100
$200
$300
$400
$500
$600
$700
2004 & Prior 2005 2006 2007
Sub-Prime Holdingsby Vintage*
($ Millions)
22
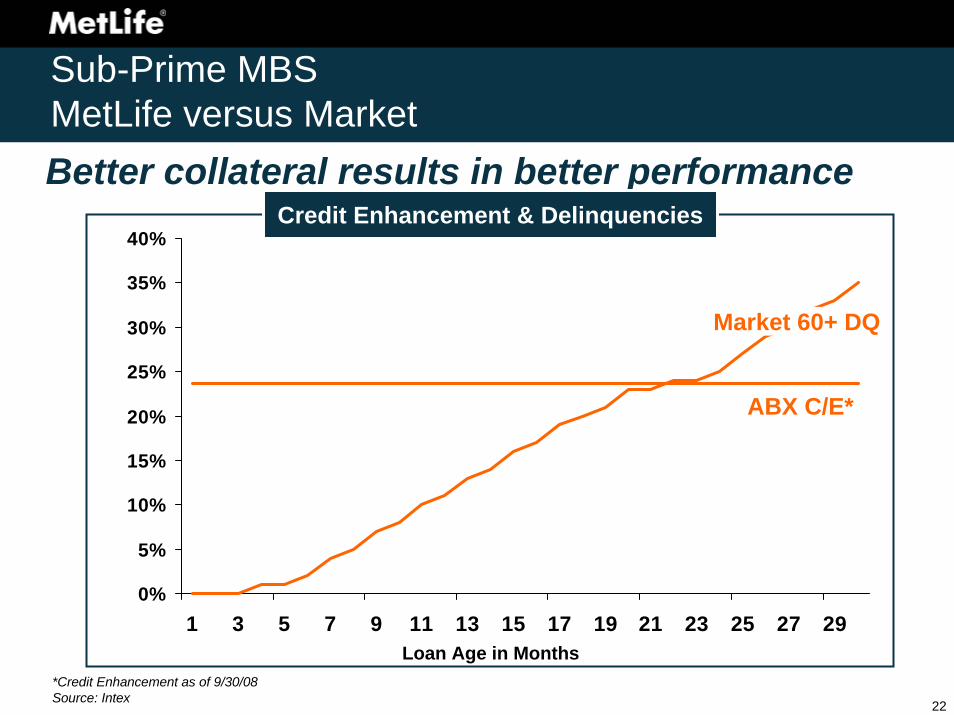
Sub-Prime MBSMetLife versus Market
*Credit Enhancement as of 9/30/08Source: Intex
Better collateral results in better performance
0%
5%
10%
15%
20%
25%
30%
35%
40%
1 3 5 7 9 11 13 15 17 19 21 23 25 27 29Loan Age in Months
ABX C/E*
Market 60+ DQ
Credit Enhancement & Delinquencies

23
Sub-Prime MBSMetLife versus MarketBetter collateral results in better performance
0%
5%
10%
15%
20%
25%
30%
35%
40%
1 3 5 7 9 11 13 15 17 19 21 23 25 27 29Loan Age in Months
MET C/E*
MET 60+ DQ
*Credit Enhancement as of 9/30/08Source: Intex
Credit Enhancement & Delinquencies
ABX C/E*
Market 60+ DQ

24
MetLife’s CMBS Positioned for Downturn
• $15.9 billion*• 24% average credit
enhancement for conduits• Can withstand 3 times
historical maximum loss• No exposure to CMBX • Only $139 million in CRE
CDOs
92%
1% 1% 6%
ConduitSingle Asset/Large LoanCRE CDOOther
CMBS Holdings by Type
*Market value as of 9/30/08

25
Seasoned, High Quality CMBS Holdings
• 78% from 2005 and prior vintages vs. 50% of the market
• 90% of 2006-2007 vintages are Super Senior and Senior AAA
CMBS Holdingsby Vintage*
Below BBB 99 24 7 0
BBB 61 3 84 9A 326 29 29 32AA 619 137 85 45
AAA 7,856 3,260 2,101 1,098
*Market value as of 9/30/08
130
157416886
14,316Total
Total 8,961 3,453 2,306 1,184 15,9050
000
1
1
0
1,000
2,000
3,000
4,000
5,000
6,000
7,000
8,000
9,000
10,000
2004 andPrior
2005 2006 2007 2008
($ Millions)

26
CMBS Price Does Not Convey Full Story
• Fundamental analysis of bond characteristics is key
• Focus on the details
MetLife Bond*
Market Bond*
Price $66 $67
Rating Senior AAA
Senior AAA
Interest Only Loans 39.2% 80.4%Loans on Servicer Watch List 6.4% 49.9%
Vintage 2007 2007
MetLife’s Projections:
Expected Coverage 4.8x 1.7x
*As of 10/31/08

27
Reduced Risk in Credit Portfolio
• $120.3 billion*
• Decreased ‘BBB’ and Below Investment Grade exposure
• Approximately 29% private placements 20.9% 21.2%
15.0% 13.6%
5.7% 4.6%
9/30/2007 9/30/2008
AAA/AA/A BBBBelow Inv Grade
Corporate Creditas a % of Managed Assets
41.6% 39.4%
$132.6B $120.3B
*Market value as of 9/30/08

28
Positioned for Recession
• Began to reposition portfolio for potential recession in 2007
• Actively identified, then sold vulnerable securities, loans and mortgages
• Since October 2007, sold$7.2 billion of assets we believed were vulnerablein a recession
SectorBook Value ($ Millions)
Investment Grade $4,093
Below Investment Grade $2,620
Commercial Mortgages $524
Total $7,237
Vulnerable Assets Sold
29
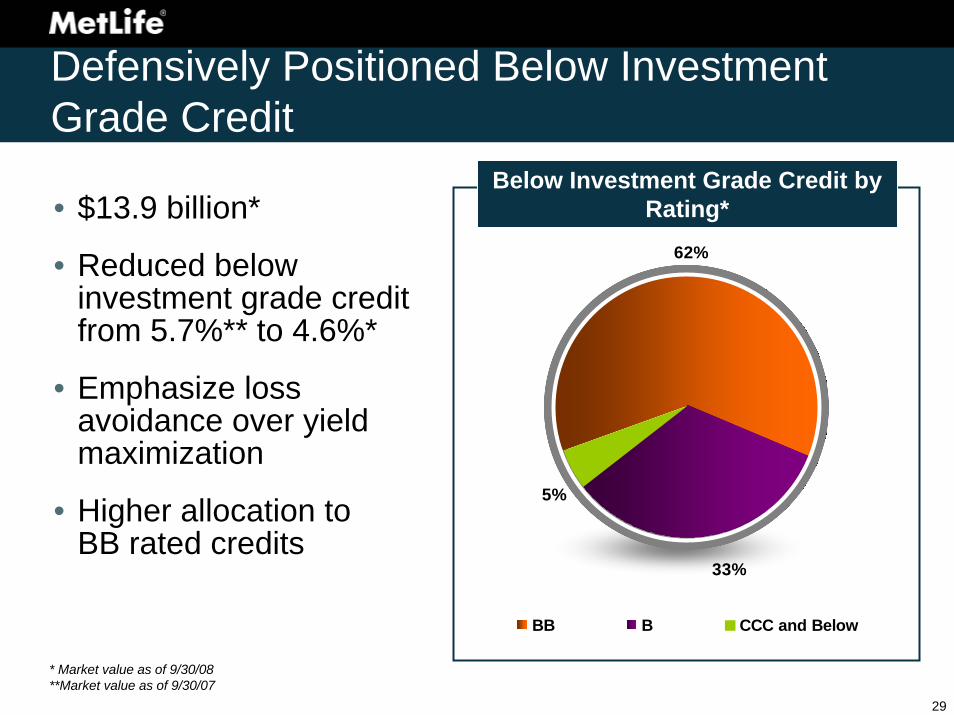
Defensively Positioned Below Investment Grade Credit
• $13.9 billion*
• Reduced below investment grade credit from 5.7%** to 4.6%*
• Emphasize loss avoidance over yield maximization
• Higher allocation to BB rated credits
62%
5%
33%
BB B CCC and Below
Below Investment Grade Credit by Rating*
* Market value as of 9/30/08**Market value as of 9/30/07

30
High Quality Real Estate andAgricultural Investments
9/30/2007 9/30/2008
Real Estate EquityAgricultural MortgagesCommercial Mortgages
Real Estate & Agricultural Investments
as a % of Managed Assets*
$54.1B $59.8B
3.2%3.2%
10.6% 12.0%
4.1%
3.6%19.7%
17.0%
• Focus primarily on Class ‘A’ properties in primary markets
• Loan to Value (LTV)– 57% Commercial Mortgage
Average LTV
– 48% Agricultural Mortgage Average LTV
• Diversified Real Estate equity portfolio
*Market value as of 9/30/08
31
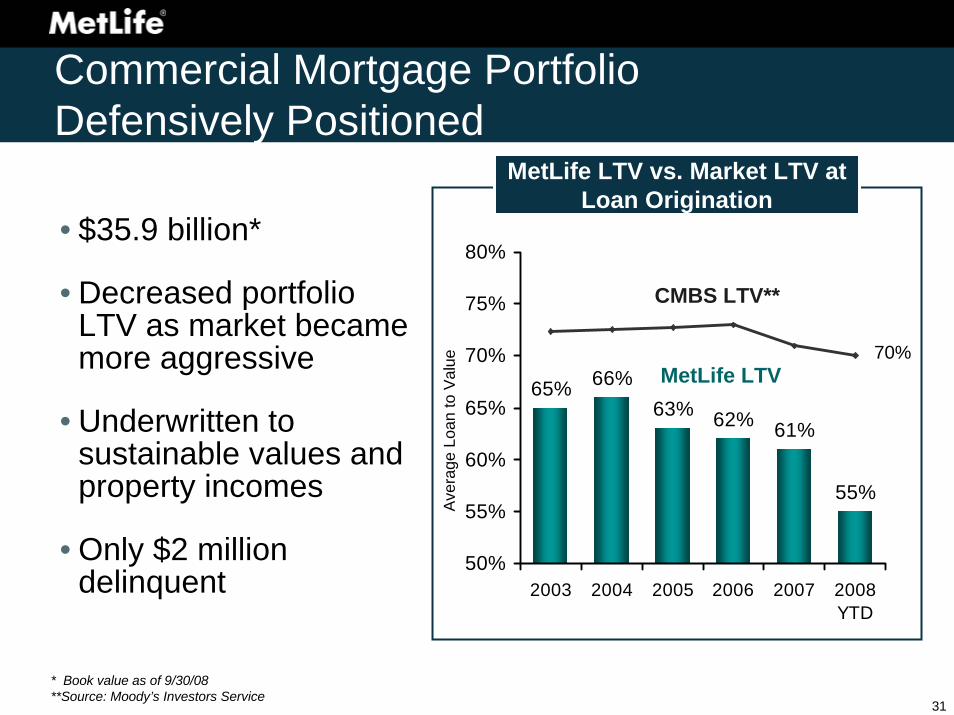
65% 66%63% 62% 61%
55%
50%
55%
60%
65%
70%
75%
80%
2003 2004 2005 2006 2007 2008YTD
70%
CMBS LTV**
Ave
rage
Loa
n to
Val
ue
Commercial Mortgage Portfolio Defensively Positioned
• $35.9 billion*
• Decreased portfolio LTV as market became more aggressive
• Underwritten to sustainable values and property incomes
• Only $2 million delinquent
* Book value as of 9/30/08**Source: Moody’s Investors Service
MetLife LTV
MetLife LTV vs. Market LTV at Loan Origination

32
Positioned to Withstand Value Declines
2%
66%
26%
6%
Below 65% LTV 65% to 75% LTV
75-80% LTV Above 80% LTV
• Significantly different fundamentals vs. early 1990s
• On-going pruning of higher risk loans
• Positioned to withstand 40% property value declines
• Less than 2% of portfolio has LTV greater than 80%
Commercial Mortgage Portfolio LTV
As of 9/30/08

08
Unrealized Loss

34
Unrealized Losses Increased Due to Spread Widening
• $12.2 billion fixed maturity net unrealized loss as of 9/30/08
– $16.7 billion gross unrealized loss
– $4.5 billion gross unrealized gain
• Approximately 88% fixed maturity gross unrealized losses rated Investment Grade 1%
19%
6%5%
69%
AAA/AA/A BBB BB B CCC and Lower
$16.7 Billion Fixed Maturity Unrealized Losses by Rating

35
Spreads over Treasuries
*Source: Custom index based on actual 9/30/08 fixed maturity allocations using option adjusted spreads from Barclays US Agency, Barclays US Treasury, Barclays US MBS, Barclays US CMBS, Barclays US ABS, Barclays US Credit, Barclays US High Yield indices
• Spreads on risk sectors have increased since 9/30/08
• Barclays Aggregate increased 36%
• Barclays BBB Credit increased 75%
• Barclays CMBS increased 170%
Spreads Have Increased Dramatically
Custom index spread*
09/30/08 10/15/08 10/31/08 11/14/08 11/30/080
100
200
300
400
500
600
700
Market Spreads

36
Net Unrealized Loss Has Also Increased
*Source: Custom index based on actual 9/30/08 fixed maturity allocations using option adjusted spreads from Barclays US Agency, Barclays US Treasury, Barclays US MBS, Barclays US CMBS, Barclays US ABS, Barclays US Credit, Barclays US High Yield indices
Market Spreads andMetLife’s Net Unrealized Loss**
Spreads over Treasuries
• Net unrealized loss increased
– $12.2 billion at 9/30/08
– Approximately $26.9 billion at 11/30/08
• 63% less than 3 months
• 84% Investment Grade• $2.8 billion greater than
20% and 6 months 0
5,000
10,000
15,000
20,000
25,000
30,000
09/30/08 10/15/08 10/31/08 11/14/08 11/30/080
100
200
300
400
500
600
700
Net
Unr
ealiz
ed L
oss
Net unrealized losses
** MetLife net unrealized loss based on November month-end pricing and management estimates
Custom index spread*

37
Loss Recognition
• Asset Liability Matching– We buy assets to match our liabilities
– Hold the vast majority to maturity
• Robust process to identify credit impairments– Creditworthiness of these securities has not
fundamentally changed since 9/30/08
– $200 - $300 million estimated Q408 after-tax impairments
38
Summary
• Diversified portfolio across fixed income, real estate, agricultural and equity sectors
• Focus on risk management, underwriting and proactive portfolio management
• Defensively positioned for current environment

39
Related Documents