RESEARCH Open Access Methods to measure potential spatial access to delivery care in low- and middle-income countries: a case study in rural Ghana Robin C Nesbitt 1* , Sabine Gabrysch 1 , Alexandra Laub 2 , Seyi Soremekun 3 , Alexander Manu 3,4 , Betty R Kirkwood 3 , Seeba Amenga-Etego 4 , Kenneth Wiru 4 , Bernhard Höfle 5 and Chris Grundy 6 Abstract Background: Access to skilled attendance at childbirth is crucial to reduce maternal and newborn mortality. Several different measures of geographic access are used concurrently in public health research, with the assumption that sophisticated methods are generally better. Most of the evidence for this assumption comes from methodological comparisons in high-income countries. We compare different measures of travel impedance in a case study in Ghana’s Brong Ahafo region to determine if straight-line distance can be an adequate proxy for access to delivery care in certain low- and middle-income country (LMIC) settings. Methods: We created a geospatial database, mapping population location in both compounds and village centroids, service locations for all health facilities offering delivery care, land-cover and a detailed road network. Six different measures were used to calculate travel impedance to health facilities (straight-line distance, network distance, network travel time and raster travel time, the latter two both mechanized and non-mechanized). The measures were compared using Spearman rank correlation coefficients, absolute differences, and the percentage of the same facilities identified as closest. We used logistic regression with robust standard errors to model the association of the different measures with health facility use for delivery in 9,306 births. Results: Non-mechanized measures were highly correlated with each other, and identified the same facilities as closest for approximately 80% of villages. Measures calculated from compounds identified the same closest facility as measures from village centroids for over 85% of births. For 90% of births, the aggregation error from using village centroids instead of compound locations was less than 35 minutes and less than 1.12 km. All non-mechanized measures showed an inverse association with facility use of similar magnitude, an approximately 67% reduction in odds of facility delivery per standard deviation increase in each measure (OR = 0.33). Conclusion: Different data models and population locations produced comparable results in our case study, thus demonstrating that straight-line distance can be reasonably used as a proxy for potential spatial access in certain LMIC settings. The cost of obtaining individually geocoded population location and sophisticated measures of travel impedance should be weighed against the gain in accuracy. * Correspondence: [email protected] 1 Epidemiology and Biostatistics Unit, Institute of Public Health, Heidelberg University, Heidelberg, Germany Full list of author information is available at the end of the article INTERNATIONAL JOURNAL OF HEALTH GEOGRAPHICS © 2014 Nesbitt et al.; licensee BioMed Central Ltd. This is an Open Access article distributed under the terms of the Creative Commons Attribution License (http://creativecommons.org/licenses/by/4.0), which permits unrestricted use, distribution, and reproduction in any medium, provided the original work is properly credited. The Creative Commons Public Domain Dedication waiver (http://creativecommons.org/publicdomain/zero/1.0/) applies to the data made available in this article, unless otherwise stated. Nesbitt et al. International Journal of Health Geographics 2014, 13:25 http://www.ij-healthgeographics.com/content/13/1/25

Welcome message from author
This document is posted to help you gain knowledge. Please leave a comment to let me know what you think about it! Share it to your friends and learn new things together.
Transcript
INTERNATIONAL JOURNAL OF HEALTH GEOGRAPHICS
Nesbitt et al. International Journal of Health Geographics 2014, 13:25http://www.ij-healthgeographics.com/content/13/1/25
RESEARCH Open Access
Methods to measure potential spatial accessto delivery care in low- and middle-incomecountries: a case study in rural GhanaRobin C Nesbitt1*, Sabine Gabrysch1, Alexandra Laub2, Seyi Soremekun3, Alexander Manu3,4, Betty R Kirkwood3,Seeba Amenga-Etego4, Kenneth Wiru4, Bernhard Höfle5 and Chris Grundy6
Abstract
Background: Access to skilled attendance at childbirth is crucial to reduce maternal and newborn mortality. Severaldifferent measures of geographic access are used concurrently in public health research, with the assumption thatsophisticated methods are generally better. Most of the evidence for this assumption comes from methodologicalcomparisons in high-income countries. We compare different measures of travel impedance in a case study inGhana’s Brong Ahafo region to determine if straight-line distance can be an adequate proxy for access to deliverycare in certain low- and middle-income country (LMIC) settings.
Methods: We created a geospatial database, mapping population location in both compounds and villagecentroids, service locations for all health facilities offering delivery care, land-cover and a detailed road network. Sixdifferent measures were used to calculate travel impedance to health facilities (straight-line distance, networkdistance, network travel time and raster travel time, the latter two both mechanized and non-mechanized). Themeasures were compared using Spearman rank correlation coefficients, absolute differences, and the percentageof the same facilities identified as closest. We used logistic regression with robust standard errors to model theassociation of the different measures with health facility use for delivery in 9,306 births.
Results: Non-mechanized measures were highly correlated with each other, and identified the same facilities asclosest for approximately 80% of villages. Measures calculated from compounds identified the same closest facilityas measures from village centroids for over 85% of births. For 90% of births, the aggregation error from usingvillage centroids instead of compound locations was less than 35 minutes and less than 1.12 km. All non-mechanizedmeasures showed an inverse association with facility use of similar magnitude, an approximately 67% reduction in oddsof facility delivery per standard deviation increase in each measure (OR = 0.33).
Conclusion: Different data models and population locations produced comparable results in our case study, thusdemonstrating that straight-line distance can be reasonably used as a proxy for potential spatial access in certainLMIC settings. The cost of obtaining individually geocoded population location and sophisticated measures of travelimpedance should be weighed against the gain in accuracy.
* Correspondence: [email protected] and Biostatistics Unit, Institute of Public Health, HeidelbergUniversity, Heidelberg, GermanyFull list of author information is available at the end of the article
© 2014 Nesbitt et al.; licensee BioMed Central Ltd. This is an Open Access article distributed under the terms of the CreativeCommons Attribution License (http://creativecommons.org/licenses/by/4.0), which permits unrestricted use, distribution, andreproduction in any medium, provided the original work is properly credited. The Creative Commons Public DomainDedication waiver (http://creativecommons.org/publicdomain/zero/1.0/) applies to the data made available in this article,unless otherwise stated.
Nesbitt et al. International Journal of Health Geographics 2014, 13:25 Page 2 of 13http://www.ij-healthgeographics.com/content/13/1/25
IntroductionSkilled attendance at birth is recommended to reduce theover 270,000 maternal and three million neonatal deathsthat occur annually, most in low-income countries [1].Many factors influence the use of skilled delivery care, in-cluding characteristics of the mother and of the serviceenvironment [2]. In many rural high-mortality settings,geographic access to skilled delivery care is poor. Whileoften neglected, the impact of geographic access to skilledcare on choice of delivery place is of similar magnitude asthat of education or wealth [3].
Defining accessAccess to health care has been conceptualized and oper-ationalized in many ways. Potential and realized accessdistinguish between stages in the use of care [4]: poten-tial access refers to the availability of services in a geo-graphic area, realized access to the actual use of servicesafter barriers have been overcome. The term “spatial ac-cess” encompasses two of the formative five dimensionsof access described by Penchansky and Thomas: accessi-bility, referring to the spatial relationship between loca-tion of supply and demand; and availability, referring tothe adequacy of provider supply in relation to demand[5,6]. Accessibility and availability are often combinedinto a single index to measure geographic coverage ofcare, ranging in complexity from a simple ratio of pro-vider supply to patient demand, to more complex indi-ces such as the two-step floating catchment area method[7,8]. This paper addresses the first dimension, calculat-ing accessibility as in travel impedance, which can bethought of as a measure of the “friction of distance” orthe “cost of travel” between locations and expressed indistance or time [9].
Measures of accessibility in public health researchDistance or travel time between place of residence and ahealth service location are common measures of travel im-pedance used in public health research. The simplest ap-proximation is straight-line or Euclidean distance betweentwo points. Geographic information systems (GIS) can beused to model more realistic estimates of travel imped-ance, such as road network distance or travel time.In principle, there are two types of data models that
can be used to model the cost of travel in GIS separatelyor in combination: vector data models and raster datamodels [9]. Vector data models represent traversablepaths between points along lines (termed edges) in anetwork, with anything not on the network being non-traversable ‘empty space’, whereas raster data modelsrepresent travel through a pixel (cell) grid, where allspace in a defined area is included in the grid. The costof travel in both model scenarios is determined byan impedance value assigned to each edge in vector
models, or each cell, in raster models. Both models canincorporate travel along roads, and raster models usu-ally include topographic features such as land-coverand void areas that cannot be traversed (e.g. lakes, le-gally restricted areas). Time or season may modifythese impedance values, and space-time models can in-corporate changes in topography and land-cover as wellas population over time.In practice, the appropriate impedance measure is
largely determined by several issues: data availability,geographic context (topography i.e. water bodies andmountains) and cultural context (i.e. common modes oftravel). Information on road networks and land-cover ispublicly and commercially available in many high-income countries, making more sophisticated estimatesof distance and travel time possible (e.g. United StatesCensus Bureau, TIGER/Lines, ESRI). Freely availablegeographic information mapped by crowdsourcing, suchas the OpenStreetMap, can also be used for routing inareas with high quality data [10]. Network models are ap-propriate in high-income settings like the United Statesbecause most travel occurs on roads, whereas in coun-tries with limited infrastructure, travel does not alwaysoccur in vehicles or on roads. Additionally, road andland-cover data are not systematically available on a glo-bal level, and particularly scarce in low-income countries[11]. Sourcing input data is an important and sometimesdifficult task, the quality of the estimates depends on theresolution, accuracy, currency and completeness of thedata [12]. Data often come from multiple sources, and itis important to ensure that the different layers of infor-mation are temporally coherent, i.e. refer to the sametime period. Researchers working in low-income coun-tries often have to spend considerable time and effort tolocate data, usually from multiple sources, or digitizeroad network maps themselves [13].
Previous studiesPrevious comparisons of different measures of geo-graphic accessibility have suggested that the use of Eu-clidean distance is a poor proxy of access, however, mostcomparisons have been in high-income countries, andmany did not assess the methods against an outcome(Table 1). Two studies conducted in predominantly ruralareas in LMICs concluded against Euclidean distance;one in favor of actual travelled distance measured withtrackers [14], and one for raster travel time [15]. How-ever, both studies were conducted in more mountainousregions of East Africa, and their findings might not holdtrue in other flatter settings.
Study aim and objectivesBy comparing different measures of travel impedance,we aim to determine if Euclidean distance can be used
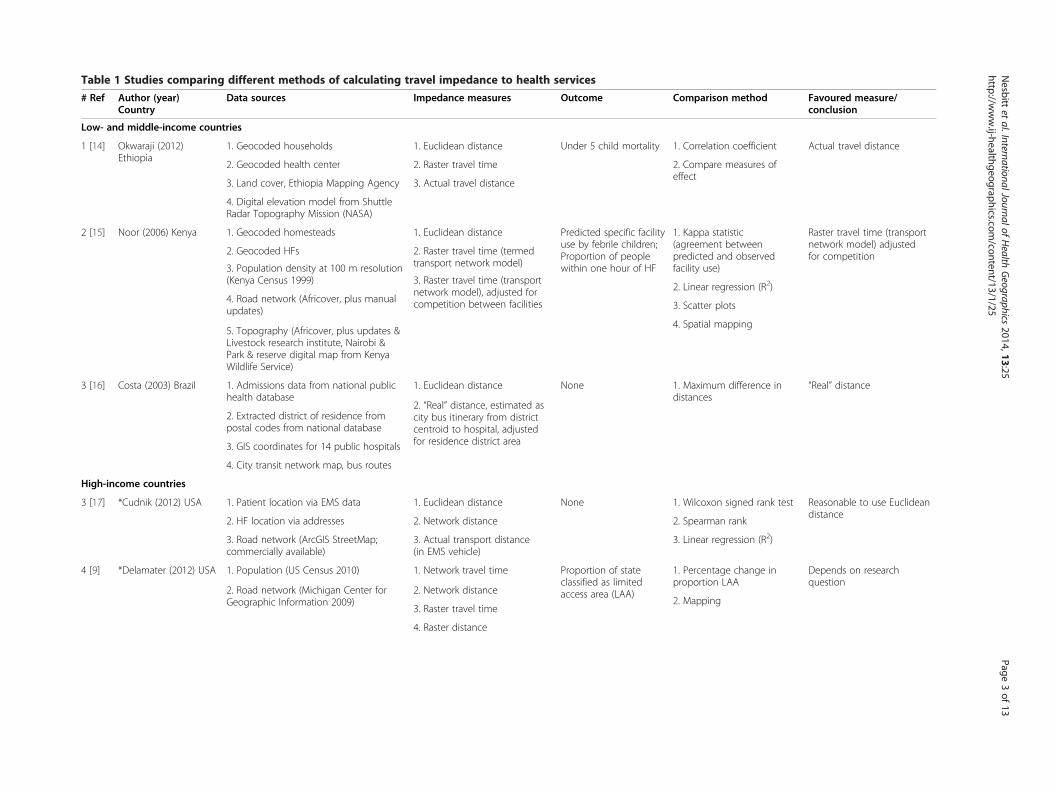
Table 1 Studies comparing different methods of calculating travel impedance to health services
# Ref Author (year)Country
Data sources Impedance measures Outcome Comparison method Favoured measure/conclusion
Low- and middle-income countries
1 [14] Okwaraji (2012)Ethiopia
1. Geocoded households 1. Euclidean distance Under 5 child mortality 1. Corre n coefficient Actual travel distance
2. Geocoded health center 2. Raster travel time 2. Comp measures ofeffect
3. Land cover, Ethiopia Mapping Agency 3. Actual travel distance
4. Digital elevation model from ShuttleRadar Topography Mission (NASA)
2 [15] Noor (2006) Kenya 1. Geocoded homesteads 1. Euclidean distance Predicted specific facilityuse by febrile children;Proportion of peoplewithin one hour of HF
1. Kappa tistic(agreem betweenpredicte nd observedfacility u
Raster travel time (transportnetwork model) adjustedfor competition2. Geocoded HFs 2. Raster travel time (termed
transport network model)
2. Linea gression (R2)
3. Population density at 100 m resolution(Kenya Census 1999) 3. Raster travel time (transport
network model), adjusted forcompetition between facilities 3. Scatte lots
4. Road network (Africover, plus manualupdates)
4. Spatia apping5. Topography (Africover, plus updates &Livestock research institute, Nairobi &Park & reserve digital map from KenyaWildlife Service)
3 [16] Costa (2003) Brazil 1. Admissions data from national publichealth database
1. Euclidean distance None 1. Maxim difference indistance
“Real” distance
2. Extracted district of residence frompostal codes from national database
2. “Real” distance, estimated ascity bus itinerary from districtcentroid to hospital, adjustedfor residence district area3. GIS coordinates for 14 public hospitals
4. City transit network map, bus routes
High-income countries
3 [17] *Cudnik (2012) USA 1. Patient location via EMS data 1. Euclidean distance None 1. Wilco signed rank test Reasonable to use Euclideandistance
2. HF location via addresses 2. Network distance 2. Spear n rank
3. Road network (ArcGIS StreetMap;commercially available)
3. Actual transport distance(in EMS vehicle)
3. Linea gression (R2)
4 [9] *Delamater (2012) USA 1. Population (US Census 2010) 1. Network travel time Proportion of stateclassified as limitedaccess area (LAA)
1. Perce ge change inproport LAA
Depends on researchquestion
2. Road network (Michigan Center forGeographic Information 2009)
2. Network distance2. Mapp
3. Raster travel time
4. Raster distance
Nesbitt
etal.InternationalJournalof
Health
Geographics
2014,13:25Page
3of
13http://w
ww.ij-healthgeographics.com
/content/13/1/25
latio
are
staentd ase)
r re
r p
l m
ums
xon
ma
r re
ntaion
ing
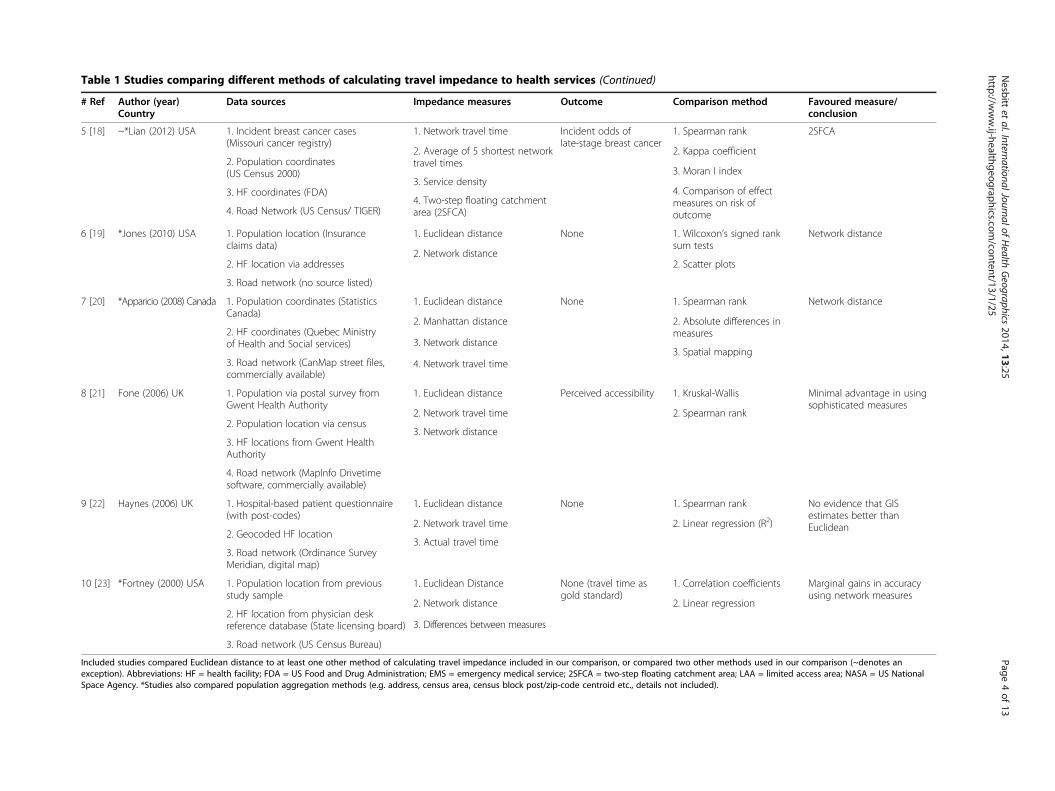
Table 1 Studies comparing different methods of calculating travel impedance to health services (Continued)
# Ref Author (year)Country
Data sources Impedance measures Outcome Comparison method Favoured measure/conclusion
5 [18] ~*Lian (2012) USA 1. Incident breast cancer cases(Missouri cancer registry)
1. Network travel time Incident odds oflate-stage breast cancer
1. Spearman rank 2SFCA
2. Population coordinates(US Census 2000)
2. Average of 5 shortest networktravel times
2. Kappa coefficient
3. HF coordinates (FDA)3. Service density
3. Moran I index
4. Road Network (US Census/ TIGER)4. Two-step floating catchmentarea (2SFCA)
4. Comparison of effectmeasures on risk ofoutcome
6 [19] *Jones (2010) USA 1. Population location (Insuranceclaims data)
1. Euclidean distance None 1. Wilcoxon’s signed ranksum tests
Network distance
2. HF location via addresses2. Network distance
2. Scatter plots
3. Road network (no source listed)
7 [20] *Apparicio (2008) Canada 1. Population coordinates (StatisticsCanada)
1. Euclidean distance None 1. Spearman rank Network distance
2. HF coordinates (Quebec Ministryof Health and Social services)
2. Manhattan distance 2. Absolute differences inmeasures
3. Road network (CanMap street files,commercially available)
3. Network distance3. Spatial mapping
4. Network travel time
8 [21] Fone (2006) UK 1. Population via postal survey fromGwent Health Authority
1. Euclidean distance Perceived accessibility 1. Kruskal-Wallis Minimal advantage in usingsophisticated measures
2. Population location via census2. Network travel time 2. Spearman rank
3. HF locations from Gwent HealthAuthority
3. Network distance
4. Road network (MapInfo Drivetimesoftware, commercially available)
9 [22] Haynes (2006) UK 1. Hospital-based patient questionnaire(with post-codes)
1. Euclidean distance None 1. Spearman rank No evidence that GISestimates better thanEuclidean
2. Geocoded HF location2. Network travel time 2. Linear regression (R2)
3. Road network (Ordinance SurveyMeridian, digital map)
3. Actual travel time
10 [23] *Fortney (2000) USA 1. Population location from previousstudy sample
1. Euclidean Distance None (travel time asgold standard)
1. Correlation coefficients Marginal gains in accuracyusing network measures
2. HF location from physician deskreference database (State licensing board)
2. Network distance 2. Linear regression
3. Road network (US Census Bureau)
3. Differences between measures
Included studies compared Euclidean distance to at least one other method of calculating travel impedance included in our comparison, or compared two other methods used in our comparison (~denotes anexception). Abbreviations: HF = health facility; FDA = US Food and Drug Administration; EMS = emergency medical service; 2SFCA = two-step floating catchment area; LAA = limited access area; NASA = US NationalSpace Agency. *Studies also compared population aggregation methods (e.g. address, census area, census block post/zip-code centroid etc., details not included).
Nesbitt
etal.InternationalJournalof
Health
Geographics
2014,13:25Page
4of
13http://w
ww.ij-healthgeographics.com
/content/13/1/25
Nesbitt et al. International Journal of Health Geographics 2014, 13:25 Page 5 of 13http://www.ij-healthgeographics.com/content/13/1/25
as a reasonable proxy for potential spatial access inLMIC settings, using Brong Ahafo region of Ghana as acase study.This study has three objectives:
1) to investigate the effect of using different geospatialalgorithms and data models (vector, raster) onmeasures of travel impedance (Euclidean distance,network distance, network travel time, raster traveltime; Table 2) between population and delivery care,
2) to assess the potential spatial aggregation errorassociated with using average population location(village centroid) compared with individuallygeocoded location (compound of residence) onmeasures of travel impedance,
3) to compare the association that different proxies forspatial access to care show with facility delivery, i.e.whether or not women use a facility for delivery as abinary outcome variable, using surveillance data overa one-year period from the study area.
MethodsOverview & data sourcesGhana is a West African country with a high maternalmortality ratio estimated at 328 per 100,000 in 2011 [26].The study area consists of 7 contiguous districts with apopulation of more than 100,000 women of reproductiveage (14-45 yrs), where demographic surveillance wasestablished for several field trials [27-29]. Travel occurs onroads, and mainly on foot to the closest health facility, asreported by approximately 58% of households in a 2003national survey [30].
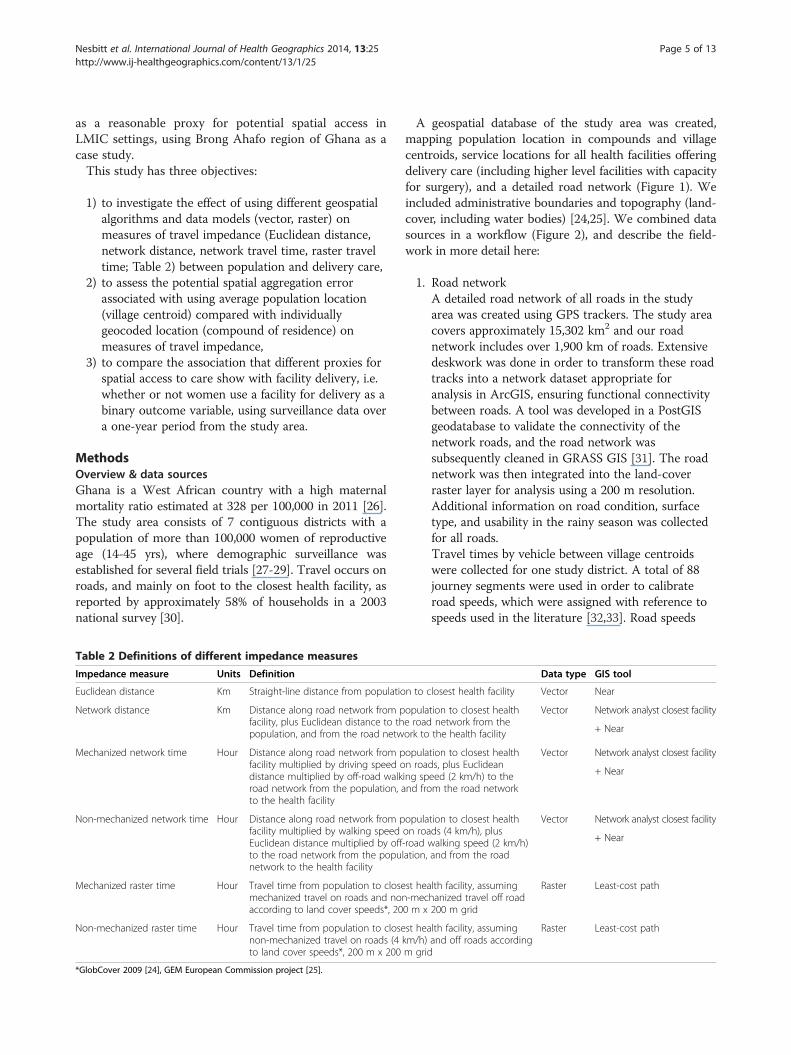
Table 2 Definitions of different impedance measures
Impedance measure Units Definition
Euclidean distance Km Straight-line distance from populatio
Network distance Km Distance along road network from pfacility, plus Euclidean distance to thpopulation, and from the road netw
Mechanized network time Hour Distance along road network from pfacility multiplied by driving speed odistance multiplied by off-road walkroad network from the population, ato the health facility
Non-mechanized network time Hour Distance along road network from pfacility multiplied by walking speedEuclidean distance multiplied by offto the road network from the popunetwork to the health facility
Mechanized raster time Hour Travel time from population to closemechanized travel on roads and nonaccording to land cover speeds*, 20
Non-mechanized raster time Hour Travel time from population to closenon-mechanized travel on roads (4to land cover speeds*, 200 m x 200
*GlobCover 2009 [24], GEM European Commission project [25].
A geospatial database of the study area was created,mapping population location in compounds and villagecentroids, service locations for all health facilities offeringdelivery care (including higher level facilities with capacityfor surgery), and a detailed road network (Figure 1). Weincluded administrative boundaries and topography (land-cover, including water bodies) [24,25]. We combined datasources in a workflow (Figure 2), and describe the field-work in more detail here:
1. Road network
n to c
opulae roadork to
opulan roading spnd fro
opulaon roa-road wlation,
st hea-mec0 m x
st heakm/h)m grid
A detailed road network of all roads in the studyarea was created using GPS trackers. The study areacovers approximately 15,302 km2 and our roadnetwork includes over 1,900 km of roads. Extensivedeskwork was done in order to transform these roadtracks into a network dataset appropriate foranalysis in ArcGIS, ensuring functional connectivitybetween roads. A tool was developed in a PostGISgeodatabase to validate the connectivity of thenetwork roads, and the road network wassubsequently cleaned in GRASS GIS [31]. The roadnetwork was then integrated into the land-coverraster layer for analysis using a 200 m resolution.Additional information on road condition, surfacetype, and usability in the rainy season was collectedfor all roads.Travel times by vehicle between village centroidswere collected for one study district. A total of 88journey segments were used in order to calibrateroad speeds, which were assigned with reference tospeeds used in the literature [32,33]. Road speeds
Data type GIS tool
losest health facility Vector Near
tion to closest healthnetwork from thethe health facility
Vector Network analyst closest facility
+ Near
tion to closest healths, plus Euclideaneed (2 km/h) to them the road network
Vector Network analyst closest facility
+ Near
tion to closest healthds (4 km/h), plusalking speed (2 km/h)and from the road
Vector Network analyst closest facility
+ Near
lth facility, assuminghanized travel off road200 m grid
Raster Least-cost path
lth facility, assumingand off roads according
Raster Least-cost path
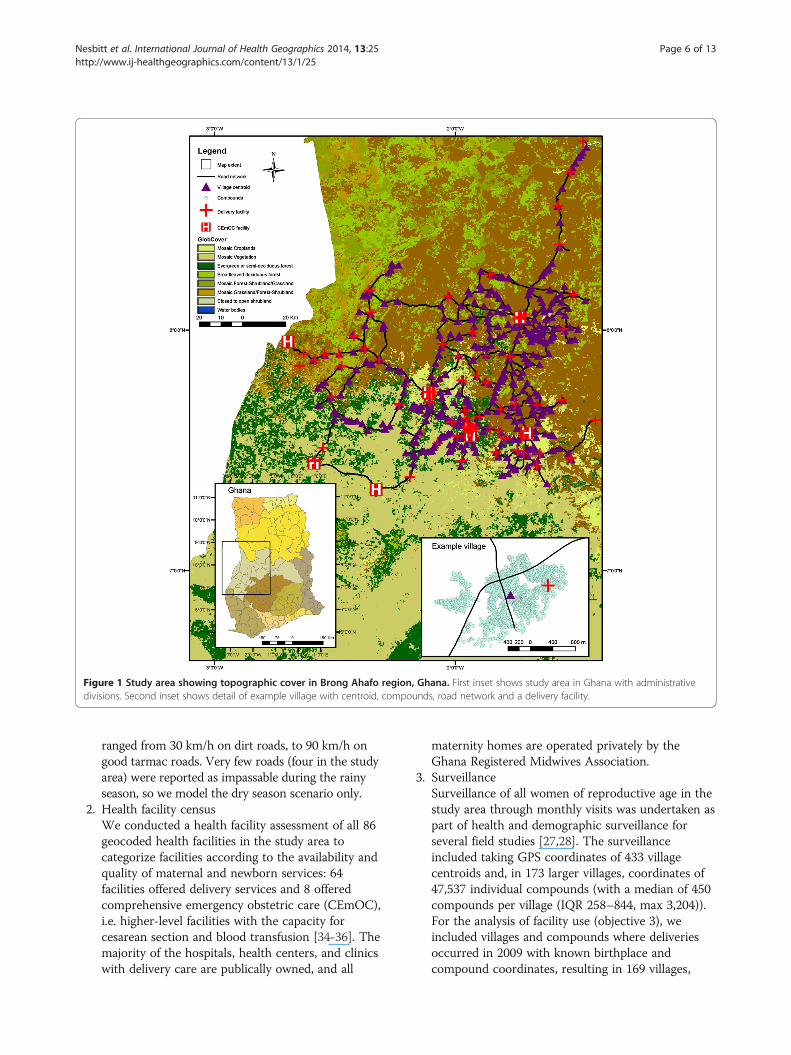
Figure 1 Study area showing topographic cover in Brong Ahafo region, Ghana. First inset shows study area in Ghana with administrativedivisions. Second inset shows detail of example village with centroid, compounds, road network and a delivery facility.
Nesbitt et al. International Journal of Health Geographics 2014, 13:25 Page 6 of 13http://www.ij-healthgeographics.com/content/13/1/25
ranged from 30 km/h on dirt roads, to 90 km/h ongood tarmac roads. Very few roads (four in the studyarea) were reported as impassable during the rainyseason, so we model the dry season scenario only.
2. Health facility censusWe conducted a health facility assessment of all 86geocoded health facilities in the study area tocategorize facilities according to the availability andquality of maternal and newborn services: 64facilities offered delivery services and 8 offeredcomprehensive emergency obstetric care (CEmOC),i.e. higher-level facilities with the capacity forcesarean section and blood transfusion [34-36]. Themajority of the hospitals, health centers, and clinicswith delivery care are publically owned, and all
maternity homes are operated privately by theGhana Registered Midwives Association.
3. SurveillanceSurveillance of all women of reproductive age in thestudy area through monthly visits was undertaken aspart of health and demographic surveillance forseveral field studies [27,28]. The surveillanceincluded taking GPS coordinates of 433 villagecentroids and, in 173 larger villages, coordinates of47,537 individual compounds (with a median of 450compounds per village (IQR 258–844, max 3,204)).For the analysis of facility use (objective 3), weincluded villages and compounds where deliveriesoccurred in 2009 with known birthplace andcompound coordinates, resulting in 169 villages,
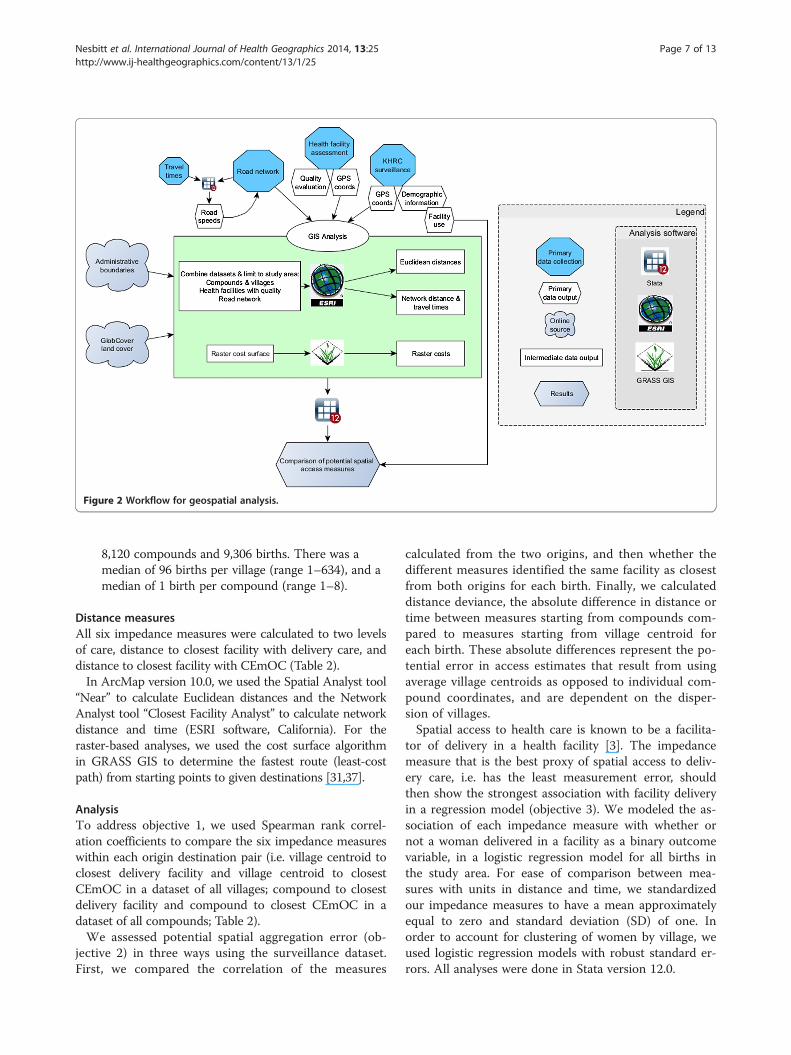
Figure 2 Workflow for geospatial analysis.
Nesbitt et al. International Journal of Health Geographics 2014, 13:25 Page 7 of 13http://www.ij-healthgeographics.com/content/13/1/25
8,120 compounds and 9,306 births. There was amedian of 96 births per village (range 1–634), and amedian of 1 birth per compound (range 1–8).
Distance measuresAll six impedance measures were calculated to two levelsof care, distance to closest facility with delivery care, anddistance to closest facility with CEmOC (Table 2).In ArcMap version 10.0, we used the Spatial Analyst tool
“Near” to calculate Euclidean distances and the NetworkAnalyst tool “Closest Facility Analyst” to calculate networkdistance and time (ESRI software, California). For theraster-based analyses, we used the cost surface algorithmin GRASS GIS to determine the fastest route (least-costpath) from starting points to given destinations [31,37].
AnalysisTo address objective 1, we used Spearman rank correl-ation coefficients to compare the six impedance measureswithin each origin destination pair (i.e. village centroid toclosest delivery facility and village centroid to closestCEmOC in a dataset of all villages; compound to closestdelivery facility and compound to closest CEmOC in adataset of all compounds; Table 2).We assessed potential spatial aggregation error (ob-
jective 2) in three ways using the surveillance dataset.First, we compared the correlation of the measures
calculated from the two origins, and then whether thedifferent measures identified the same facility as closestfrom both origins for each birth. Finally, we calculateddistance deviance, the absolute difference in distance ortime between measures starting from compounds com-pared to measures starting from village centroid foreach birth. These absolute differences represent the po-tential error in access estimates that result from usingaverage village centroids as opposed to individual com-pound coordinates, and are dependent on the disper-sion of villages.Spatial access to health care is known to be a facilita-
tor of delivery in a health facility [3]. The impedancemeasure that is the best proxy of spatial access to deliv-ery care, i.e. has the least measurement error, shouldthen show the strongest association with facility deliveryin a regression model (objective 3). We modeled the as-sociation of each impedance measure with whether ornot a woman delivered in a facility as a binary outcomevariable, in a logistic regression model for all births inthe study area. For ease of comparison between mea-sures with units in distance and time, we standardizedour impedance measures to have a mean approximatelyequal to zero and standard deviation (SD) of one. Inorder to account for clustering of women by village, weused logistic regression models with robust standard er-rors. All analyses were done in Stata version 12.0.
Nesbitt et al. International Journal of Health Geographics 2014, 13:25 Page 8 of 13http://www.ij-healthgeographics.com/content/13/1/25
Ethical considerationsThis study uses data collected for the Newhints trial,which was approved by the ethics committees of theGhana Health Service, Kintampo Health ResearchCenter and the London School of Hygiene and TropicalMedicine (LSHTM) [28]. The additional analyses wereapproved in an amendment by the LSHTM ethicscommittee.
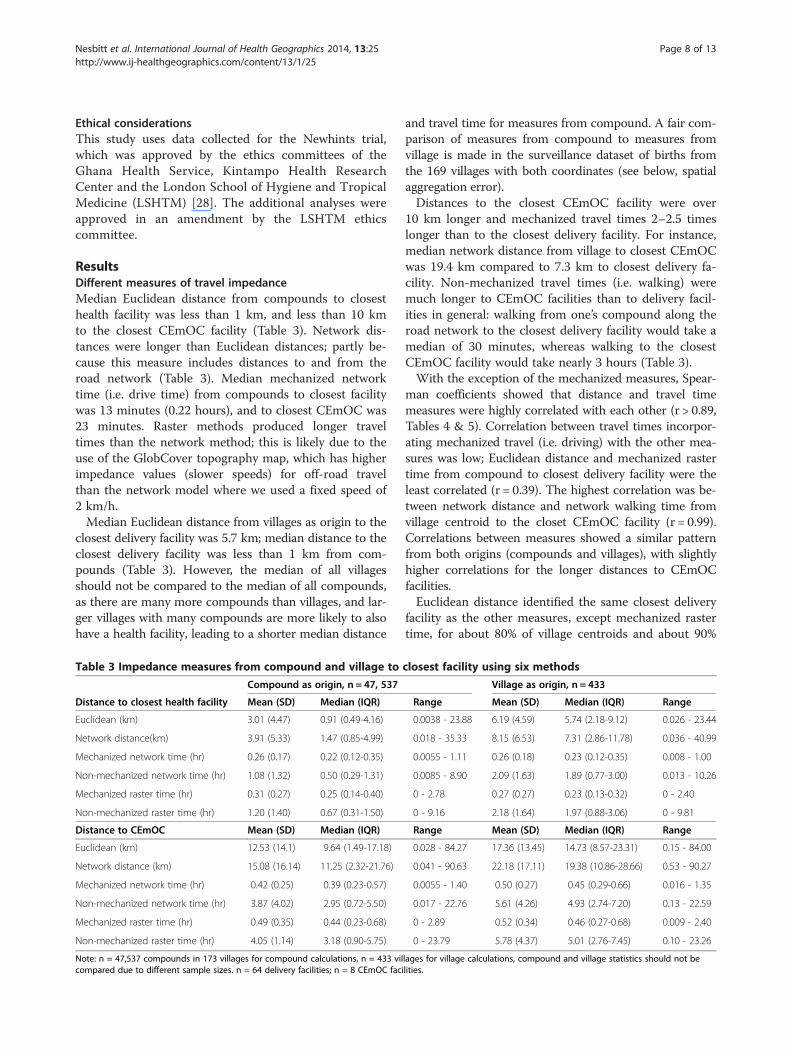
ResultsDifferent measures of travel impedanceMedian Euclidean distance from compounds to closesthealth facility was less than 1 km, and less than 10 kmto the closest CEmOC facility (Table 3). Network dis-tances were longer than Euclidean distances; partly be-cause this measure includes distances to and from theroad network (Table 3). Median mechanized networktime (i.e. drive time) from compounds to closest facilitywas 13 minutes (0.22 hours), and to closest CEmOC was23 minutes. Raster methods produced longer traveltimes than the network method; this is likely due to theuse of the GlobCover topography map, which has higherimpedance values (slower speeds) for off-road travelthan the network model where we used a fixed speed of2 km/h.Median Euclidean distance from villages as origin to the
closest delivery facility was 5.7 km; median distance to theclosest delivery facility was less than 1 km from com-pounds (Table 3). However, the median of all villagesshould not be compared to the median of all compounds,as there are many more compounds than villages, and lar-ger villages with many compounds are more likely to alsohave a health facility, leading to a shorter median distance
Table 3 Impedance measures from compound and village to
Compound as origin, n = 47, 537
Distance to closest health facility Mean (SD) Median (IQR)
Euclidean (km) 3.01 (4.47) 0.91 (0.49-4.16)
Network distance(km) 3.91 (5.33) 1.47 (0.85-4.99)
Mechanized network time (hr) 0.26 (0.17) 0.22 (0.12-0.35)
Non-mechanized network time (hr) 1.08 (1.32) 0.50 (0.29-1.31)
Mechanized raster time (hr) 0.31 (0.27) 0.25 (0.14-0.40)
Non-mechanized raster time (hr) 1.20 (1.40) 0.67 (0.31-1.50)
Distance to CEmOC Mean (SD) Median (IQR)
Euclidean (km) 12.53 (14.1) 9.64 (1.49-17.18)
Network distance (km) 15.08 (16.14) 11.25 (2.32-21.76)
Mechanized network time (hr) 0.42 (0.25) 0.39 (0.23-0.57)
Non-mechanized network time (hr) 3.87 (4.02) 2.95 (0.72-5.50)
Mechanized raster time (hr) 0.49 (0.35) 0.44 (0.23-0.68)
Non-mechanized raster time (hr) 4.05 (1.14) 3.18 (0.90-5.75)
Note: n = 47,537 compounds in 173 villages for compound calculations, n = 433 vilcompared due to different sample sizes. n = 64 delivery facilities; n = 8 CEmOC faci
and travel time for measures from compound. A fair com-parison of measures from compound to measures fromvillage is made in the surveillance dataset of births fromthe 169 villages with both coordinates (see below, spatialaggregation error).Distances to the closest CEmOC facility were over
10 km longer and mechanized travel times 2–2.5 timeslonger than to the closest delivery facility. For instance,median network distance from village to closest CEmOCwas 19.4 km compared to 7.3 km to closest delivery fa-cility. Non-mechanized travel times (i.e. walking) weremuch longer to CEmOC facilities than to delivery facil-ities in general: walking from one’s compound along theroad network to the closest delivery facility would take amedian of 30 minutes, whereas walking to the closestCEmOC facility would take nearly 3 hours (Table 3).With the exception of the mechanized measures, Spear-
man coefficients showed that distance and travel timemeasures were highly correlated with each other (r > 0.89,Tables 4 & 5). Correlation between travel times incorpor-ating mechanized travel (i.e. driving) with the other mea-sures was low; Euclidean distance and mechanized rastertime from compound to closest delivery facility were theleast correlated (r = 0.39). The highest correlation was be-tween network distance and network walking time fromvillage centroid to the closet CEmOC facility (r = 0.99).Correlations between measures showed a similar patternfrom both origins (compounds and villages), with slightlyhigher correlations for the longer distances to CEmOCfacilities.Euclidean distance identified the same closest delivery
facility as the other measures, except mechanized rastertime, for about 80% of village centroids and about 90%
closest facility using six methods
Village as origin, n = 433
Range Mean (SD) Median (IQR) Range
0.0038 - 23.88 6.19 (4.59) 5.74 (2.18-9.12) 0.026 - 23.44
0.018 - 35.33 8.15 (6.53) 7.31 (2.86-11.78) 0.036 - 40.99
0.0055 - 1.11 0.26 (0.18) 0.23 (0.12-0.35) 0.008 - 1.00
0.0085 - 8.90 2.09 (1.63) 1.89 (0.77-3.00) 0.013 - 10.26
0 - 2.78 0.27 (0.27) 0.23 (0.13-0.32) 0 - 2.40
0 - 9.16 2.18 (1.64) 1.97 (0.88-3.06) 0 - 9.81
Range Mean (SD) Median (IQR) Range
0.028 - 84.27 17.36 (13.45) 14.73 (8.57-23.31) 0.15 - 84.00
0.041 - 90.63 22.18 (17.11) 19.38 (10.86-28.66) 0.53 - 90.27
0.0055 - 1.40 0.50 (0.27) 0.45 (0.29-0.66) 0.016 - 1.35
0.017 - 22.76 5.61 (4.26) 4.93 (2.74-7.20) 0.13 - 22.59
0 - 2.89 0.52 (0.34) 0.46 (0.27-0.68) 0.009 - 2.40
0 - 23.79 5.78 (4.37) 5.01 (2.76-7.45) 0.10 - 23.26
lages for village calculations, compound and village statistics should not belities.
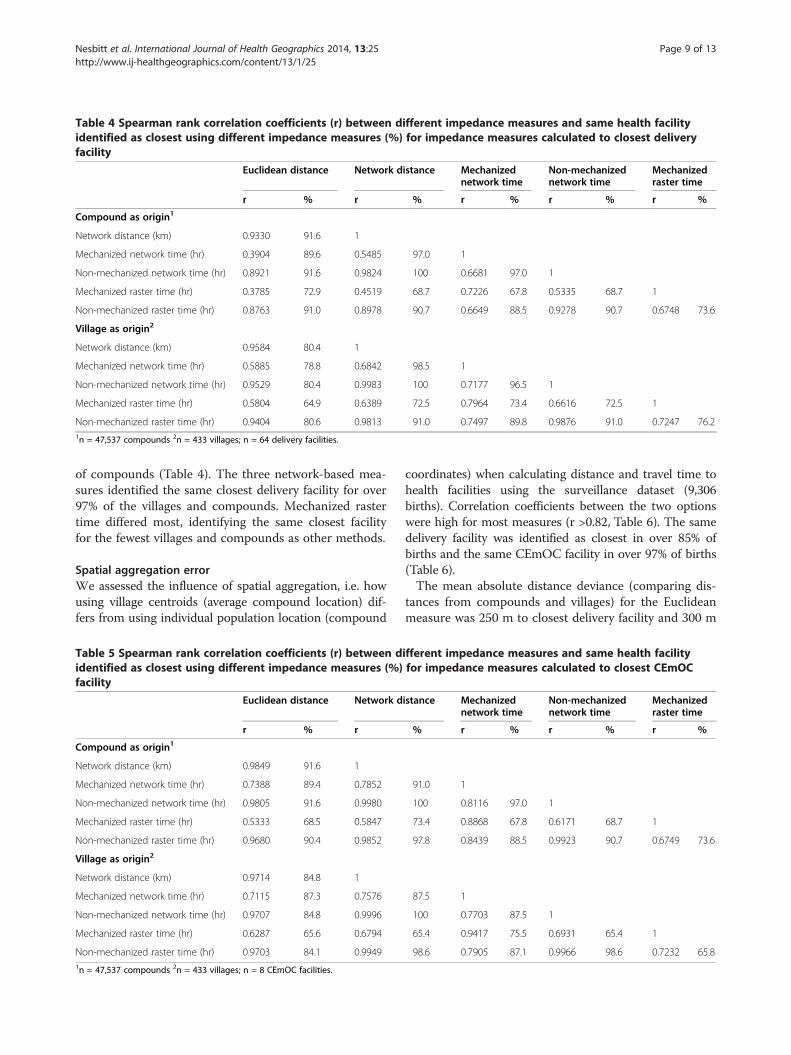
Table 4 Spearman rank correlation coefficients (r) between different impedance measures and same health facilityidentified as closest using different impedance measures (%) for impedance measures calculated to closest deliveryfacility
Euclidean distance Network distance Mechanizednetwork time
Non-mechanizednetwork time
Mechanizedraster time
r % r % r % r % r %
Compound as origin1
Network distance (km) 0.9330 91.6 1
Mechanized network time (hr) 0.3904 89.6 0.5485 97.0 1
Non-mechanized network time (hr) 0.8921 91.6 0.9824 100 0.6681 97.0 1
Mechanized raster time (hr) 0.3785 72.9 0.4519 68.7 0.7226 67.8 0.5335 68.7 1
Non-mechanized raster time (hr) 0.8763 91.0 0.8978 90.7 0.6649 88.5 0.9278 90.7 0.6748 73.6
Village as origin2
Network distance (km) 0.9584 80.4 1
Mechanized network time (hr) 0.5885 78.8 0.6842 98.5 1
Non-mechanized network time (hr) 0.9529 80.4 0.9983 100 0.7177 96.5 1
Mechanized raster time (hr) 0.5804 64.9 0.6389 72.5 0.7964 73.4 0.6616 72.5 1
Non-mechanized raster time (hr) 0.9404 80.6 0.9813 91.0 0.7497 89.8 0.9876 91.0 0.7247 76.21n = 47,537 compounds 2n = 433 villages; n = 64 delivery facilities.
Nesbitt et al. International Journal of Health Geographics 2014, 13:25 Page 9 of 13http://www.ij-healthgeographics.com/content/13/1/25
of compounds (Table 4). The three network-based mea-sures identified the same closest delivery facility for over97% of the villages and compounds. Mechanized rastertime differed most, identifying the same closest facilityfor the fewest villages and compounds as other methods.
Spatial aggregation errorWe assessed the influence of spatial aggregation, i.e. howusing village centroids (average compound location) dif-fers from using individual population location (compound
Table 5 Spearman rank correlation coefficients (r) between didentified as closest using different impedance measures (%)facility
Euclidean distance Network d
r % r
Compound as origin1
Network distance (km) 0.9849 91.6 1
Mechanized network time (hr) 0.7388 89.4 0.7852
Non-mechanized network time (hr) 0.9805 91.6 0.9980
Mechanized raster time (hr) 0.5333 68.5 0.5847
Non-mechanized raster time (hr) 0.9680 90.4 0.9852
Village as origin2
Network distance (km) 0.9714 84.8 1
Mechanized network time (hr) 0.7115 87.3 0.7576
Non-mechanized network time (hr) 0.9707 84.8 0.9996
Mechanized raster time (hr) 0.6287 65.6 0.6794
Non-mechanized raster time (hr) 0.9703 84.1 0.99491n = 47,537 compounds 2n = 433 villages; n = 8 CEmOC facilities.
coordinates) when calculating distance and travel time tohealth facilities using the surveillance dataset (9,306births). Correlation coefficients between the two optionswere high for most measures (r >0.82, Table 6). The samedelivery facility was identified as closest in over 85% ofbirths and the same CEmOC facility in over 97% of births(Table 6).The mean absolute distance deviance (comparing dis-
tances from compounds and villages) for the Euclideanmeasure was 250 m to closest delivery facility and 300 m
ifferent impedance measures and same health facilityfor impedance measures calculated to closest CEmOC
istance Mechanizednetwork time
Non-mechanizednetwork time
Mechanizedraster time
% r % r % r %
91.0 1
100 0.8116 97.0 1
73.4 0.8868 67.8 0.6171 68.7 1
97.8 0.8439 88.5 0.9923 90.7 0.6749 73.6
87.5 1
100 0.7703 87.5 1
65.4 0.9417 75.5 0.6931 65.4 1
98.6 0.7905 87.1 0.9966 98.6 0.7232 65.8
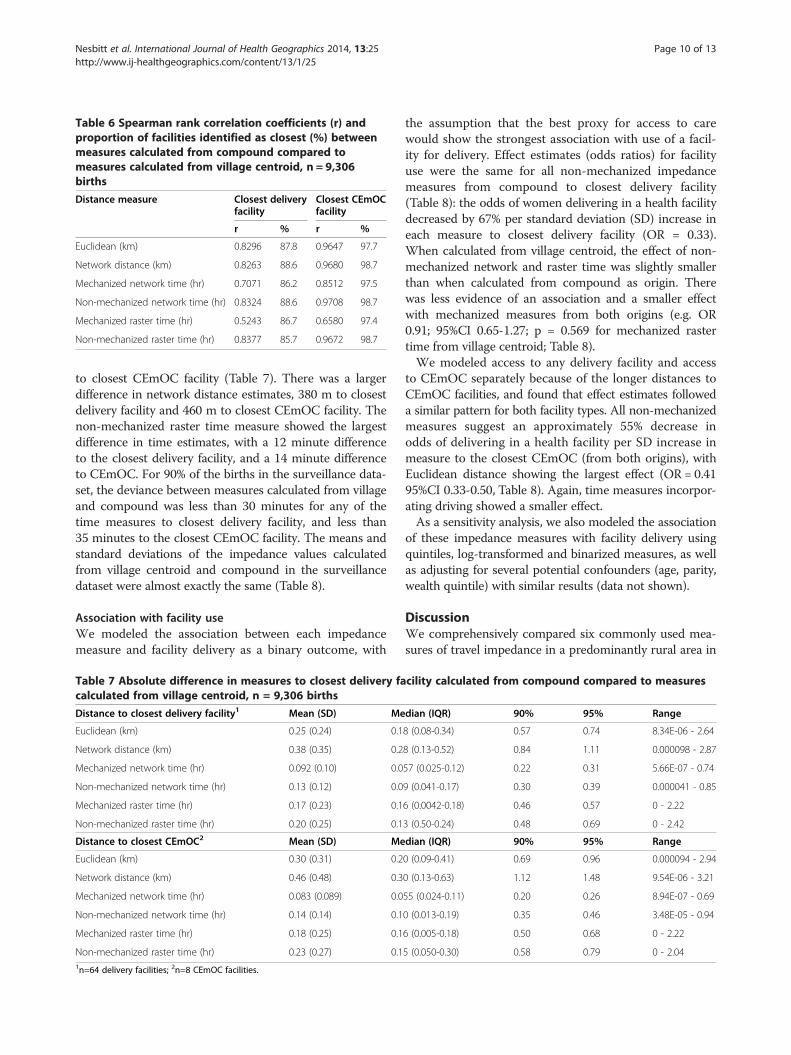
Table 6 Spearman rank correlation coefficients (r) andproportion of facilities identified as closest (%) betweenmeasures calculated from compound compared tomeasures calculated from village centroid, n = 9,306births
Distance measure Closest deliveryfacility
Closest CEmOCfacility
r % r %
Euclidean (km) 0.8296 87.8 0.9647 97.7
Network distance (km) 0.8263 88.6 0.9680 98.7
Mechanized network time (hr) 0.7071 86.2 0.8512 97.5
Non-mechanized network time (hr) 0.8324 88.6 0.9708 98.7
Mechanized raster time (hr) 0.5243 86.7 0.6580 97.4
Non-mechanized raster time (hr) 0.8377 85.7 0.9672 98.7
Nesbitt et al. International Journal of Health Geographics 2014, 13:25 Page 10 of 13http://www.ij-healthgeographics.com/content/13/1/25
to closest CEmOC facility (Table 7). There was a largerdifference in network distance estimates, 380 m to closestdelivery facility and 460 m to closest CEmOC facility. Thenon-mechanized raster time measure showed the largestdifference in time estimates, with a 12 minute differenceto the closest delivery facility, and a 14 minute differenceto CEmOC. For 90% of the births in the surveillance data-set, the deviance between measures calculated from villageand compound was less than 30 minutes for any of thetime measures to closest delivery facility, and less than35 minutes to the closest CEmOC facility. The means andstandard deviations of the impedance values calculatedfrom village centroid and compound in the surveillancedataset were almost exactly the same (Table 8).
Association with facility useWe modeled the association between each impedancemeasure and facility delivery as a binary outcome, with
Table 7 Absolute difference in measures to closest delivery facalculated from village centroid, n = 9,306 births
Distance to closest delivery facility1 Mean (SD) Me
Euclidean (km) 0.25 (0.24) 0.1
Network distance (km) 0.38 (0.35) 0.2
Mechanized network time (hr) 0.092 (0.10) 0.0
Non-mechanized network time (hr) 0.13 (0.12) 0.0
Mechanized raster time (hr) 0.17 (0.23) 0.1
Non-mechanized raster time (hr) 0.20 (0.25) 0.1
Distance to closest CEmOC2 Mean (SD) Me
Euclidean (km) 0.30 (0.31) 0.2
Network distance (km) 0.46 (0.48) 0.3
Mechanized network time (hr) 0.083 (0.089) 0.0
Non-mechanized network time (hr) 0.14 (0.14) 0.1
Mechanized raster time (hr) 0.18 (0.25) 0.1
Non-mechanized raster time (hr) 0.23 (0.27) 0.11n=64 delivery facilities; 2n=8 CEmOC facilities.
the assumption that the best proxy for access to carewould show the strongest association with use of a facil-ity for delivery. Effect estimates (odds ratios) for facilityuse were the same for all non-mechanized impedancemeasures from compound to closest delivery facility(Table 8): the odds of women delivering in a health facilitydecreased by 67% per standard deviation (SD) increase ineach measure to closest delivery facility (OR = 0.33).When calculated from village centroid, the effect of non-mechanized network and raster time was slightly smallerthan when calculated from compound as origin. Therewas less evidence of an association and a smaller effectwith mechanized measures from both origins (e.g. OR0.91; 95%CI 0.65-1.27; p = 0.569 for mechanized rastertime from village centroid; Table 8).We modeled access to any delivery facility and access
to CEmOC separately because of the longer distances toCEmOC facilities, and found that effect estimates followeda similar pattern for both facility types. All non-mechanizedmeasures suggest an approximately 55% decrease inodds of delivering in a health facility per SD increase inmeasure to the closest CEmOC (from both origins), withEuclidean distance showing the largest effect (OR = 0.4195%CI 0.33-0.50, Table 8). Again, time measures incorpor-ating driving showed a smaller effect.As a sensitivity analysis, we also modeled the association
of these impedance measures with facility delivery usingquintiles, log-transformed and binarized measures, as wellas adjusting for several potential confounders (age, parity,wealth quintile) with similar results (data not shown).
DiscussionWe comprehensively compared six commonly used mea-sures of travel impedance in a predominantly rural area in
cility calculated from compound compared to measures
dian (IQR) 90% 95% Range
8 (0.08-0.34) 0.57 0.74 8.34E-06 - 2.64
8 (0.13-0.52) 0.84 1.11 0.000098 - 2.87
57 (0.025-0.12) 0.22 0.31 5.66E-07 - 0.74
9 (0.041-0.17) 0.30 0.39 0.000041 - 0.85
6 (0.0042-0.18) 0.46 0.57 0 - 2.22
3 (0.50-0.24) 0.48 0.69 0 - 2.42
dian (IQR) 90% 95% Range
0 (0.09-0.41) 0.69 0.96 0.000094 - 2.94
0 (0.13-0.63) 1.12 1.48 9.54E-06 - 3.21
55 (0.024-0.11) 0.20 0.26 8.94E-07 - 0.69
0 (0.013-0.19) 0.35 0.46 3.48E-05 - 0.94
6 (0.005-0.18) 0.50 0.68 0 - 2.22
5 (0.050-0.30) 0.58 0.79 0 - 2.04
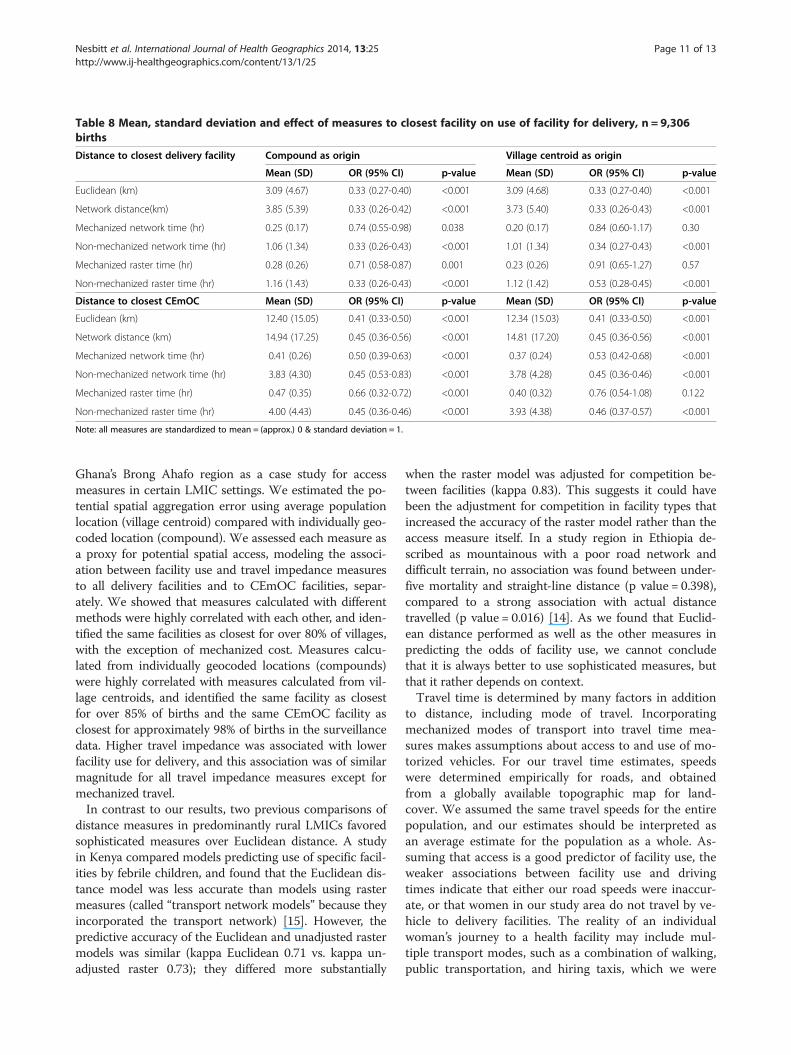
Table 8 Mean, standard deviation and effect of measures to closest facility on use of facility for delivery, n = 9,306births
Distance to closest delivery facility Compound as origin Village centroid as origin
Mean (SD) OR (95% CI) p-value Mean (SD) OR (95% CI) p-value
Euclidean (km) 3.09 (4.67) 0.33 (0.27-0.40) <0.001 3.09 (4.68) 0.33 (0.27-0.40) <0.001
Network distance(km) 3.85 (5.39) 0.33 (0.26-0.42) <0.001 3.73 (5.40) 0.33 (0.26-0.43) <0.001
Mechanized network time (hr) 0.25 (0.17) 0.74 (0.55-0.98) 0.038 0.20 (0.17) 0.84 (0.60-1.17) 0.30
Non-mechanized network time (hr) 1.06 (1.34) 0.33 (0.26-0.43) <0.001 1.01 (1.34) 0.34 (0.27-0.43) <0.001
Mechanized raster time (hr) 0.28 (0.26) 0.71 (0.58-0.87) 0.001 0.23 (0.26) 0.91 (0.65-1.27) 0.57
Non-mechanized raster time (hr) 1.16 (1.43) 0.33 (0.26-0.43) <0.001 1.12 (1.42) 0.53 (0.28-0.45) <0.001
Distance to closest CEmOC Mean (SD) OR (95% CI) p-value Mean (SD) OR (95% CI) p-value
Euclidean (km) 12.40 (15.05) 0.41 (0.33-0.50) <0.001 12.34 (15.03) 0.41 (0.33-0.50) <0.001
Network distance (km) 14.94 (17.25) 0.45 (0.36-0.56) <0.001 14.81 (17.20) 0.45 (0.36-0.56) <0.001
Mechanized network time (hr) 0.41 (0.26) 0.50 (0.39-0.63) <0.001 0.37 (0.24) 0.53 (0.42-0.68) <0.001
Non-mechanized network time (hr) 3.83 (4.30) 0.45 (0.53-0.83) <0.001 3.78 (4.28) 0.45 (0.36-0.46) <0.001
Mechanized raster time (hr) 0.47 (0.35) 0.66 (0.32-0.72) <0.001 0.40 (0.32) 0.76 (0.54-1.08) 0.122
Non-mechanized raster time (hr) 4.00 (4.43) 0.45 (0.36-0.46) <0.001 3.93 (4.38) 0.46 (0.37-0.57) <0.001
Note: all measures are standardized to mean = (approx.) 0 & standard deviation = 1.
Nesbitt et al. International Journal of Health Geographics 2014, 13:25 Page 11 of 13http://www.ij-healthgeographics.com/content/13/1/25
Ghana’s Brong Ahafo region as a case study for accessmeasures in certain LMIC settings. We estimated the po-tential spatial aggregation error using average populationlocation (village centroid) compared with individually geo-coded location (compound). We assessed each measure asa proxy for potential spatial access, modeling the associ-ation between facility use and travel impedance measuresto all delivery facilities and to CEmOC facilities, separ-ately. We showed that measures calculated with differentmethods were highly correlated with each other, and iden-tified the same facilities as closest for over 80% of villages,with the exception of mechanized cost. Measures calcu-lated from individually geocoded locations (compounds)were highly correlated with measures calculated from vil-lage centroids, and identified the same facility as closestfor over 85% of births and the same CEmOC facility asclosest for approximately 98% of births in the surveillancedata. Higher travel impedance was associated with lowerfacility use for delivery, and this association was of similarmagnitude for all travel impedance measures except formechanized travel.In contrast to our results, two previous comparisons of
distance measures in predominantly rural LMICs favoredsophisticated measures over Euclidean distance. A studyin Kenya compared models predicting use of specific facil-ities by febrile children, and found that the Euclidean dis-tance model was less accurate than models using rastermeasures (called “transport network models” because theyincorporated the transport network) [15]. However, thepredictive accuracy of the Euclidean and unadjusted rastermodels was similar (kappa Euclidean 0.71 vs. kappa un-adjusted raster 0.73); they differed more substantially
when the raster model was adjusted for competition be-tween facilities (kappa 0.83). This suggests it could havebeen the adjustment for competition in facility types thatincreased the accuracy of the raster model rather than theaccess measure itself. In a study region in Ethiopia de-scribed as mountainous with a poor road network anddifficult terrain, no association was found between under-five mortality and straight-line distance (p value = 0.398),compared to a strong association with actual distancetravelled (p value = 0.016) [14]. As we found that Euclid-ean distance performed as well as the other measures inpredicting the odds of facility use, we cannot concludethat it is always better to use sophisticated measures, butthat it rather depends on context.Travel time is determined by many factors in addition
to distance, including mode of travel. Incorporatingmechanized modes of transport into travel time mea-sures makes assumptions about access to and use of mo-torized vehicles. For our travel time estimates, speedswere determined empirically for roads, and obtainedfrom a globally available topographic map for land-cover. We assumed the same travel speeds for the entirepopulation, and our estimates should be interpreted asan average estimate for the population as a whole. As-suming that access is a good predictor of facility use, theweaker associations between facility use and drivingtimes indicate that either our road speeds were inaccur-ate, or that women in our study area do not travel by ve-hicle to delivery facilities. The reality of an individualwoman’s journey to a health facility may include mul-tiple transport modes, such as a combination of walking,public transportation, and hiring taxis, which we were
Nesbitt et al. International Journal of Health Geographics 2014, 13:25 Page 12 of 13http://www.ij-healthgeographics.com/content/13/1/25
unable to fully take into account due to lack of informa-tion on individual’s travel modes.Obtaining individually geocoded population locations is
difficult due to issues of privacy and anonymity and inhigh-income countries accessibility is usually measuredfrom aggregate locations, such as census tracts or zipcodes. Aggregation error arises from the distribution of in-dividuals in a spatial unit, and could affect associationswith health outcomes measured on an individual level[20,38]. Results and interpretations vary widely in studiesevaluating aggregation errors, and there does not seem tobe a generally agreed upon cutoff for this error [38]. Au-thors of a study in the US comparing individual addressesto zip-code centroids conclude that a deviance <12 miles(19 km) for 95% of the population is not appreciably large[19], while a study in Canada found a deviance <1.5 km for95% of the population, and considered the >1.5 km devi-ance for the remaining 5% a significant error [39]. Likeother studies in Africa [13], we were able to collect indi-vidually geocoded locations and compared these to an ag-gregate measure, village centroid. While there were someextreme deviances (up to 3.2 km and 2.4 hours), the mag-nitude of the median deviance (e.g. 180 m Euclidean) wasmuch smaller than the median value of the measuresthemselves (e.g. 910 m Euclidean). However, a different fa-cility was identified as the closest using different origins forapproximately 13% of the births in our surveillance dataset,which may have implications for access if these facilitiesoffer different levels or types of care. The magnitude of thiserror obviously depends on the size of villages and the dis-persion of compounds within villages, which varies withcontext. Deciding whether village centroids are a sufficientproxy for population location should be made based onthe study area context as well as the research question.As we do not have a gold standard with which to com-
pare the various travel impedance measures to identify the“best” impedance measure, deciding which to use in ananalysis is a matter of appropriateness and accuracy whichcan differ depending on the purpose of the analysis [39].As all of the non-mechanized measures we includedshowed almost exactly the same association with facilityuse from both origins, we conclude that in similarly flatLMIC contexts, simple methods to calculate travel imped-ance can be reasonably used as proxies for potential spatialaccess. Euclidean distance is an accurate measure of thedistance between two points and does not necessitate mak-ing any assumptions regarding mode of travel. For the pur-pose of comparing relative access to care as opposed todescribing detailed journey paths, obtaining accurate esti-mates may be more important than aspiring to realism.
ConclusionApprehension towards using Euclidean distance as aproxy for access, and the high cost (in time and money) of
investing in sophisticated GIS techniques should not be adeterrent to research on access to care in rural low-income settings. Where poor access to care is a major bar-rier to health, this missing evidence may have real conse-quences for policy and populations. Using a case study inrural Ghana, we have shown that Euclidean distancesfrom village centroids can be used as a reasonable proxyfor individual potential spatial access, which can be gener-alized to other similar topographic and cultural contexts(i.e. non-mountainous regions, without major water bod-ies). The accuracy of sophisticated impedance measuresdepends on the quality of the input data and validity of as-sumptions regarding travel mode, and the possibility forerror in these assumptions may decrease their usefulness.We suggest that for researchers faced with scarce and dis-parate data sources in relatively flat low-income countries,the use of Euclidean distance from an aggregate measureof population location is an acceptable proxy for access.Furthermore, we suggest that the extra time and effort re-quired for sophisticated and individually geo-referencedmethods are justifiable only when a high level of accuracyand completeness of the input data can be assured.
Competing interestsThe authors declare that they have no competing interests.
Authors’ contributionsRN processed and prepared the geospatial database for analyses, calculatedthe Euclidean and network based impedance measures, designed andcarried out the statistical analyses and drafted the manuscript. SG developedthe research question, supervised the statistical analyses and contributed towriting the manuscript. AL and BH calculated the raster based impedancemeasures, contributed to the design of the statistical analyses and contributedto the writing of the manuscript. CG supervised and coordinated the GIS datacollection and developed the research question. SAE supervised andcoordinated the GIS data collection. KW implemented the GIS data collectionand supported the preparation of the geospatial database. SS, AM and BRK(with others) designed and conducted the Newhints study. All authors criticallyreviewed the manuscript, and approved the final manuscript as submitted.
AcknowledgementsWe thank the staff and researchers at the Kintampo Health Research Centerinvolved in data collection; all of the women who participated in thedemographic surveillance; and the health workers who participated in thehealth facility survey.During this work, RN was employed as a doctoral student by SG atHeidelberg University, funded by the Baden-Württemberg Foundation andthe Heidelberg University Graduate Academy. SG was funded through aMargarete von Wrangell Fellowship supported by the European Social Fundand by the Ministry of Science, Research and the Arts Baden-Württemberg.She was also supported by postdoctoral fellowships of the Daimler and BenzFoundation and the Baden-Württemberg Foundation, the latter funded partof the fieldwork. SS, AM, BRK and SAE were funded under the Newhintsstudy and NeoVitA project. These projects were funded by the Bill andMelinda Gates Foundation through the World Health Organization and theLondon School of Hygiene and Tropical Medicine. KW is supported by theGhana Health Service through the Ghana Ministry of Health. The healthfacility assessment was partly funded by WHO, and Save the Children’sSaving Newborn Lives program from the Bill and Melinda Gates Foundation,and the UK Department of International Development. The funders had norole in study design, data collection and analysis, decision to publish, orpreparation of the manuscript. Finally, we acknowledge the financial supportof the Deutsche Forschungsgemeinschaft and Heidelberg University withinthe Open Access Publishing program.
Nesbitt et al. International Journal of Health Geographics 2014, 13:25 Page 13 of 13http://www.ij-healthgeographics.com/content/13/1/25
Author details1Epidemiology and Biostatistics Unit, Institute of Public Health, HeidelbergUniversity, Heidelberg, Germany. 2Institute of Geography, HeidelbergUniversity, Heidelberg, Germany. 3Maternal & Child Health InterventionResearch Group, Faculty of Epidemiology and Population Health, LondonSchool of Hygiene and Tropical Medicine, London, UK. 4Kintampo HealthResearch Center, Ghana Health Service, Kintampo, Ghana. 5GIScience,Institute of Geography, Heidelberg University, Heidelberg, Germany.6Department of Social and Environmental Health Research, London Schoolof Hygiene and Tropical Medicine, London, UK.
Received: 14 April 2014 Accepted: 12 June 2014Published: 26 June 2014
References1. Bhutta ZA, Black RE: Global maternal, newborn, and child health–so near
and yet so far. N Engl J Med 2013, 369(23):2226–2235.2. Gabrysch S, Campbell OM: Still too far to walk: literature review of the
determinants of delivery service use. BMC Pregnancy Childbirth 2009, 9:34.3. Gabrysch S, Cousens S, Cox J, Campbell OM: The influence of distance and
level of care on delivery place in rural Zambia: a study of linked nationaldata in a geographic information system. PLoS Med 2011, 8(1):e1000394.
4. Guagliardo MF: Spatial accessibility of primary care: concepts, methodsand challenges. Int J Health Geogr 2004, 3(1):3.
5. Khan AA: An integrated approach to measuring potential spatial accessto health care services. Socioecon Plann Sci 1992, 26(4):275–287.
6. Penchansky R, Thomas JW: The concept of access: definition andrelationship to consumer satisfaction. Med Care 1981, 19(2):127–140.
7. Wang F, Luo W: Assessing spatial and nonspatial factors for healthcareaccess: towards an integrated approach to defining health professionalshortage areas. Health Place 2005, 11(2):131–146.
8. Ray N, Ebener S: AccessMod 3.0: computing geographic coverage andaccessibility to health care services using anisotropic movement ofpatients. Int J Health Geogr 2008, 7:63.
9. Delamater PL, Messina JP, Shortridge AM, Grady SC: Measuring geographicaccess to health care: raster and network-based methods. Int J HealthGeogr 2012, 11(1):15.
10. Neis P, Zielstra D, Zipf A: Comparison of volunteered geographicinformation data contributions and community development forselected world regions. Future Internet 2013, 5(2):282–300.
11. Tanser FC, Le Sueur D: The application of geographical information systemsto important public health problems in Africa. Int J Health Geogr 2002, 1(1):4.
12. Frizzelle BG, Evenson KR, Rodriguez DA, Laraia BA: The importance ofaccurate road data for spatial applications in public health: customizinga road network. Int J Health Geogr 2009, 8:24.
13. Tanser F, Gijsbertsen B, Herbst K: Modelling and understanding primaryhealth care accessibility and utilization in rural South Africa: anexploration using a geographical information system. Soc Sci Med 2006,63(3):691–705.
14. Okwaraji YB, Cousens S, Berhane Y, Mulholland K, Edmond K: Effect ofgeographical access to health facilities on child mortality in rural Ethiopia: acommunity based cross sectional study. PLoS One 2012, 7(3):e33564.
15. Noor AM, Amin AA, Gething PW, Atkinson PM, Hay SI, Snow RW: Modellingdistances travelled to government health services in Kenya. Trop Med IntHealth 2006, 11(2):188–196.
16. Costa LS, Nassi CD, Pinheiro RS, Almeida RMVR: Accessibility of selectedhospitals and medical procedures by means of aerial and transitnetwork-based measures. Health Serv Manage Res 2003, 16(2):136–140.
17. Cudnik MT, Yao J, Zive D, Newgard C, Murray AT: Surrogate markers oftransport distance for out-of-hospital cardiac arrest patients. PrehospEmerg Care 2012, 16(2):266–272.
18. Lian M, Struthers J, Schootman M: Comparing GIS-based measures inaccess to mammography and their validity in predicting neighborhoodrisk of late-stage breast cancer. PLoS One 2012, 7(8):e43000.
19. Jones SG, Ashby AJ, Momin SR, Naidoo A: Spatial implications associatedwith using Euclidean distance measurements and geographic centroidimputation in health care research. Health Serv Res 2010, 45(1):316–327.
20. Apparicio P, Abdelmajid M, Riva M, Shearmur R: Comparing alternativeapproaches to measuring the geographical accessibility of urban healthservices: distance types and aggregation-error issues. Int J Health Geogr 2008, 7:7.
21. Fone DL, Christie S, Lester N: Comparison of perceived and modelledgeographical access to accident and emergency departments:a cross-sectional analysis from the Caerphilly Health and Social NeedsStudy. Int J Health Geogr 2006, 5:16.
22. Haynes R, Jones AP, Sauerzapf V, Zhao H: Validation of travel times tohospital estimated by GIS. Int J Health Geogr 2006, 5:40.
23. Fortney PD, Rost J, Warren J: Comparing alternative methods ofmeasuring geographic access to health services. Health Serv OutcomesRes Methodol 2000, 1(2):173–184.
24. European Space Agency: GlobCover. [http://due.esrin.esa.int/globcover/]Last Accessed: March 5, 2014.
25. Global Environment Monitoring Unit - Joint Research Centre of theEuropean Commission: Travel time to major cities: A global map ofAccessibility. [http://bioval.jrc.ec.europa.eu/products/gam/sources.htm]Last Accessed: March 10, 2014.
26. Lozano R, Wang H, Foreman KJ, Rajaratnam JK, Naghavi M, Marcus JR,Dwyer-Lindgren L, Lofgren KT, Phillips D, Atkinson C, Lopez AD, Murray CJ: Progresstowards Millennium Development Goals 4 and 5 on maternal and childmortality: an updated systematic analysis. Lancet 2011, 378(9797):1139–1165.
27. Edmond K, Hurt L, Fenty J, Amenga-Etego S, Zandoh C, Hurt C, Danso S, TawiahC, Hill Z, Ten Asbroek AH, Owusu-Agyei S, Campbell O, Kirkwood BR: Effect ofvitamin A supplementation in women of reproductive age on cause-specificearly and late infant mortality in rural Ghana: ObaapaVitA double-blind,cluster-randomised, placebo-controlled trial. BMJ Open 2012, 2(1):e000658.
28. Kirkwood BR, Manu A, ten Asbroek AH, Soremekun S, Weobong B, Gyan T,Danso S, Amenga-Etego S, Tawiah-Agyemang C, Owusu-Agyei S, Hill Z:Effect of the Newhints home-visits intervention on neonatal mortalityrate and care practices in Ghana: a cluster randomised controlled trial.Lancet 2013, 381(9884):2184–2192.
29. Kirkwood BR, Manu A, Tawiah-Agyemang C, ten Asbroek G, Gyan T,Weobong B, Lewandowski RE, Soremekun S, Danso S, Pitt C: NEWHINTScluster randomised trial to evaluate the impact on neonatal mortality inrural Ghana of routine home visits to provide a package of essentialnewborn care interventions in the third trimester of pregnancy and thefirst week of life: trial protocol. Trials 2010, 11:58.
30. Ghana Statistical Service: Ghana 2003 Core Welfare Indicators Questionnaire(CWIQ II) Survey Report: Statistical Abstract In. Ghana Statistical Service: Accra; 2003.
31. Neteler M, Bowman MH, Landa M, Metz M: GRASS GIS: a multi-purposeopen source GIS. Environ Model Softw 2012, 31:124–130.
32. Bailey PE, Keyes EB, Parker C, Abdullah M, Kebede H, Freedman L: Using aGIS to model interventions to strengthen the emergency referral systemfor maternal and newborn health in Ethiopia. Int J Gynaecol Obstetr 2011,115(3):300–309.
33. Gething PW, Johnson FA, Frempong-Ainguah F, Nyarko P, Baschieri A, AboagyeP, Falkingham J, Matthews Z, Atkinson PM: Geographical access to care at birthin Ghana: a barrier to safe motherhood. BMC Public Health 2012, 12:991.
34. World Health Organization (WHO): Monitoring Emergency Obstetric Care. AHandbook. 2009.
35. Vesel L, Manu A, Lohela TJ, Gabrysch S, Okyere E, Ten Asbroek AH, Hill Z,Agyemang CT, Owusu-Agyei S, Kirkwood BR: Quality of newborn care:a health facility assessment in rural Ghana using survey, vignette andsurveillance data. BMJ Open 2013, 3(5):e002326.
36. Nesbitt RC, Lohela TJ, Manu A, Vesel L, Okyere E, Edmond K, Owusu-Agyei S,Kirkwood BR, Gabrysch S:Quality along the continuum: a health facility assessmentof intrapartum and postnatal care in Ghana. PLoS One 2013, 8(11):e81089.
37. Metz M, Mitasova H, Harmon RS: Efficient extraction of drainage networksfrom massive, radar-based elevation models with least cost path search.Hydrol Earth Syst Sc 2011, 15(2):667–678.
38. Luo L, McLafferty S, Wang F: Analyzing spatial aggregation error instatistical models of late-stage cancer risk: a Monte Carlo simulationapproach. Int J Health Geogr 2010, 9:51.
39. Apparicio P, Shearmur R, Brochu M, Dussault G: The measure of distance ina social science policy context: advantages and costs of using networkdistances in eight Canadian metropolitan areas. J Geogr Inf Decis Anal2003, 7(2):105–131.
doi:10.1186/1476-072X-13-25Cite this article as: Nesbitt et al.: Methods to measure potential spatialaccess to delivery care in low- and middle-income countries: a casestudy in rural Ghana. International Journal of Health Geographics2014 13:25.
Related Documents