Cien. Inv. Agr. 40(2):419-428. 2013 www.rcia.uc.cl SOIL MANAGEMENT Introduction Land cover change is an important aspect of the global changes that affect ecological systems (Foody, 2002). The rapid, accurate detection of the changes and characteristics of the Earth’s surface is a necessity for the better understanding of the relationships and interactions between natural and human phenomena, which will provide a foundation for the management use of natural resources (Lu et al., 2004). Satellite sensor data offer a valuable tool for studies of land surface use and occupation (Brian et al., 2011). Remote sensing surveys and the interpretation RESEARCH NOTE Methods of performance evaluation for the supervised classification of satellite imagery in determining land cover classes Carlos H. Wachholz de Souza, Erivelto Mercante, Victor H. R. Prudente, and Diego D.D. Justina Postgraduate Program in Agricultural Engineering, Western Paraná State University. 2069 Universitária St, Cascavel, Paraná, Brazil. Abstract C.H.W. Souza, E. Mercante, V.H.R. Prudente and D.D.D. Justina. 2013. Methods of performance evaluation for the supervised classification of satellite imagery in determining land cover classes. Cien. Inv. Agr. 40(2): 419-428. Satellite imagery, in combination with remote sensing techniques, provides a new opportunity for monitoring and assessing crops with lower cost and greater objectivity than traditional surveys. The present research employed Landsat 5/TM satellite imagery to identify the land cover classes in Cafelândia (Paraná, Brasil), a predominantly agricultural town. Five supervised classification methods (parallelepiped (PL), minimum distance (MND), Mahalanobis distance (MHD), maximum likelihood classifier (MLC) and spectral angle mapper (SAM)) were tested in this work. To assess the efficiency of the classifications, accuracy indices and error metrics obtained through total confusion matrices were used. The results indicated that the Mahalanobis and SAM methods generated the smallest errors for the four studied land use classes (soybean, corn, forest, and bare soil), with overall accuracy values of 88% and 86%, respectively, and kappa index values 0.83 and 0.80, respectively. The values of these methods for the applied metrics were 0.88 and 0.86 for the sensitivity index, 0.96 and 0.95 for the total specificity index and 0.84 and 0.81 for Matthews correlation coefficient, respectively. The different classification methods clearly exhibited large variations in their performance for land cover mapping. The use of measures obtained from the error matrix is a suitable method for comparisons of thematic maps. Key words: Accuracy indices, agricultural landscape, classifiers, remote sensing. Received October 1, 2012. Accepted July 3, 2013. Corresponding author: [email protected]

Welcome message from author
This document is posted to help you gain knowledge. Please leave a comment to let me know what you think about it! Share it to your friends and learn new things together.
Transcript

Cien. Inv. Agr. 40(2):419-428. 2013www.rcia.uc.cl
soil management
Introduction
Land cover change is an important aspect of the global changes that affect ecological systems (Foody, 2002). The rapid, accurate detection of the changes and characteristics of the Earth’s surface
is a necessity for the better understanding of the relationships and interactions between natural and human phenomena, which will provide a foundation for the management use of natural resources (Lu et al., 2004).
Satellite sensor data offer a valuable tool for studies of land surface use and occupation (Brian et al., 2011). Remote sensing surveys and the interpretation
research note
Methods of performance evaluation for the supervised classification of satellite imagery in determining land cover classes
Carlos H. Wachholz de Souza, Erivelto Mercante, Victor H. R. Prudente, and Diego D.D. Justina
Postgraduate Program in Agricultural Engineering, Western Paraná State University. 2069 Universitária St, Cascavel, Paraná, Brazil.
Abstract
C.H.W. Souza, E. Mercante, V.H.R. Prudente and D.D.D. Justina. 2013. Methods of performance evaluation for the supervised classification of satellite imagery in determining land cover classes. Cien. Inv. Agr. 40(2): 419-428. Satellite imagery, in combination with remote sensing techniques, provides a new opportunity for monitoring and assessing crops with lower cost and greater objectivity than traditional surveys. The present research employed Landsat 5/TM satellite imagery to identify the land cover classes in Cafelândia (Paraná, Brasil), a predominantly agricultural town. Five supervised classification methods (parallelepiped (PL), minimum distance (MND), Mahalanobis distance (MHD), maximum likelihood classifier (MLC) and spectral angle mapper (SAM)) were tested in this work. To assess the efficiency of the classifications, accuracy indices and error metrics obtained through total confusion matrices were used. The results indicated that the Mahalanobis and SAM methods generated the smallest errors for the four studied land use classes (soybean, corn, forest, and bare soil), with overall accuracy values of 88% and 86%, respectively, and kappa index values 0.83 and 0.80, respectively. The values of these methods for the applied metrics were 0.88 and 0.86 for the sensitivity index, 0.96 and 0.95 for the total specificity index and 0.84 and 0.81 for Matthews correlation coefficient, respectively. The different classification methods clearly exhibited large variations in their performance for land cover mapping. The use of measures obtained from the error matrix is a suitable method for comparisons of thematic maps.
Key words: Accuracy indices, agricultural landscape, classifiers, remote sensing.
Received October 1, 2012. Accepted July 3, 2013.Corresponding author: [email protected]

ciencia e investigación agraria420
of aerial photographs or satellite imagery can be used to estimate the area of each land cover class in a given region (Luiz et al., 2002). These surveys allow for the rapid acquisition of information, provide a synoptic view of the study areas, and generate more objective and accurate information at a relatively lower cost (Pal and Mather, 2004).
Several types of imagery may be used to examine the terrestrial environment depending on the purpose of a given study. Landsat satellite imag-ery, for example, is widely used for mapping the Earth’s surface (Williams et al., 2006).
According to Janssen and Van der Wel (1994), the classification or interpretation of images can be performed in either visually or digitally. Visual interpretation has largely the same characteristics as traditional photo interpretation (aerial photo-graphs), while digital classification involves the use of classifier algorithms, statistical equations implemented in specific programs designed to minimize interpretation errors (Cruz, 2008).
Supervised classification is a procedure used to identify spectrally similar areas (training samples) within an image. The user identifies several known regions of interest in the land area, and the chosen algorithm extrapolates these spectral characteristics to classify the other portions of the image (Castillejo-González et al., 2009).
Classification methods are divided into three main categories based on decision rule: distance, prob-ability or angular spectrum. Classifier algorithms based on distance, such as the minimum distance (MND), parallelepiped (PL), and Mahalanobis distance (MHD) methods, primarily employ mean spectral values for different classes, ignoring variance values. Classifiers such as the maximum likelihood method (MLC) incorporate both the mean and the variance of the data set. Finally, classifiers based on the angular spectrum, such as the spectral angle mapper (SAM), use the spectral angles formed between a reference spectrum and a classified pixel (South et al., 2004).
The error matrix technique and the overall ac-curacy and kappa index metrics have been used to determine the accuracy of digital classification algorithms (Cohen, 1960). As described by Rich-ards and Jia (1999), the error matrix allows for the assessment of the classification performance through the analysis of errors of inclusion and omission, particularly when a small number of land use classes are of interest, as in estimates of crop areas. Another method of comparing the-matic maps is the creation of a confusion matrix (Fielding & Bell, 1997), which can be obtained from the elements of the error matrix.
Ma and Redmond (1995) proposed the tau index (T) as a measure of the accuracy of classification methods, in which the classification accuracy is estimated relative to the random adjustment of pixels for the classes.
Several studies have been conducted using digital classification methods with satellite imagery to identify land use and cover classes (Hubert-Moy et al., 2001; South et al., 2004; Bakr et al., 2010; Yang et al., 2011). However, as Castillejo-González et al. (2009) explain, there is no ideal classification method; the most suitable method for each study is determined by its requirements.
The present study compared the accuracy of five supervised classification methods using concor-dance coefficients and those metrics derived from the confusion matrix for the comparison of thematic maps, which were obtained through panel sampling from multispectral images taken by the Landsat 5 TM sensor.
Materials and methods
Study area and imagery acquisition
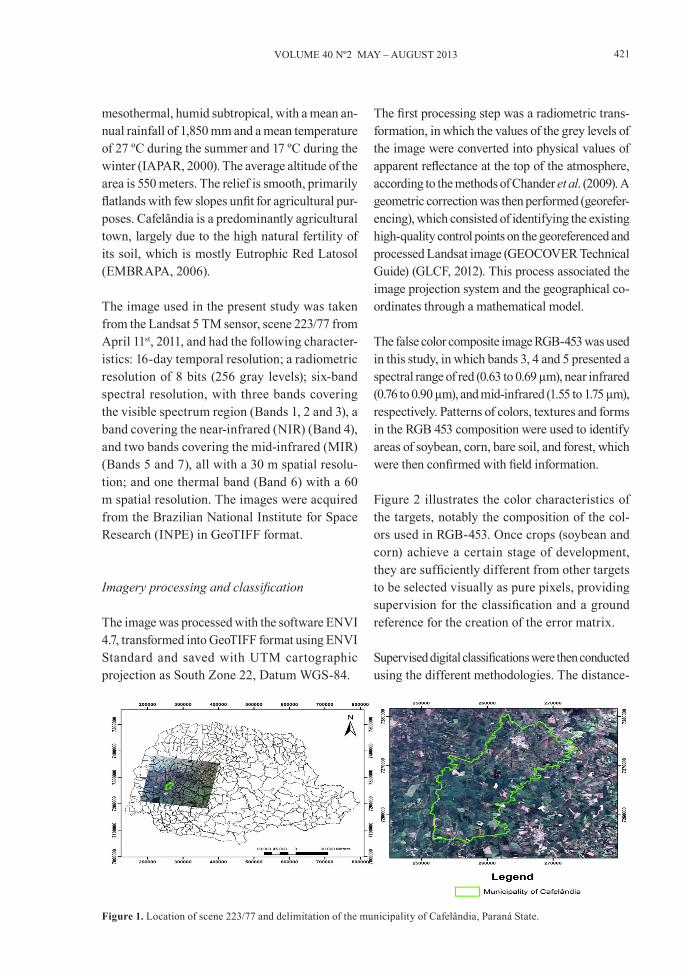
The study area covers 272 km² of the municipality of Cafelândia (Paraná, Brasil), Western Paraná State, at latitude 24° 37’ S and longitude 53° 20’ W (Figure 1). The region’s climate is classified as
421VOLUME 40 Nº2 MAY – AUGUST 2013
mesothermal, humid subtropical, with a mean an-nual rainfall of 1,850 mm and a mean temperature of 27 ºC during the summer and 17 ºC during the winter (IAPAR, 2000). The average altitude of the area is 550 meters. The relief is smooth, primarily flatlands with few slopes unfit for agricultural pur-poses. Cafelândia is a predominantly agricultural town, largely due to the high natural fertility of its soil, which is mostly Eutrophic Red Latosol (EMBRAPA, 2006).
The image used in the present study was taken from the Landsat 5 TM sensor, scene 223/77 from April 11st, 2011, and had the following character-istics: 16-day temporal resolution; a radiometric resolution of 8 bits (256 gray levels); six-band spectral resolution, with three bands covering the visible spectrum region (Bands 1, 2 and 3), a band covering the near-infrared (NIR) (Band 4), and two bands covering the mid-infrared (MIR) (Bands 5 and 7), all with a 30 m spatial resolu-tion; and one thermal band (Band 6) with a 60 m spatial resolution. The images were acquired from the Brazilian National Institute for Space Research (INPE) in GeoTIFF format.
Imagery processing and classification
The image was processed with the software ENVI 4.7, transformed into GeoTIFF format using ENVI Standard and saved with UTM cartographic projection as South Zone 22, Datum WGS-84.
The first processing step was a radiometric trans-formation, in which the values of the grey levels of the image were converted into physical values of apparent reflectance at the top of the atmosphere, according to the methods of Chander et al. (2009). A geometric correction was then performed (georefer-encing), which consisted of identifying the existing high-quality control points on the georeferenced and processed Landsat image (GEOCOVER Technical Guide) (GLCF, 2012). This process associated the image projection system and the geographical co-ordinates through a mathematical model.
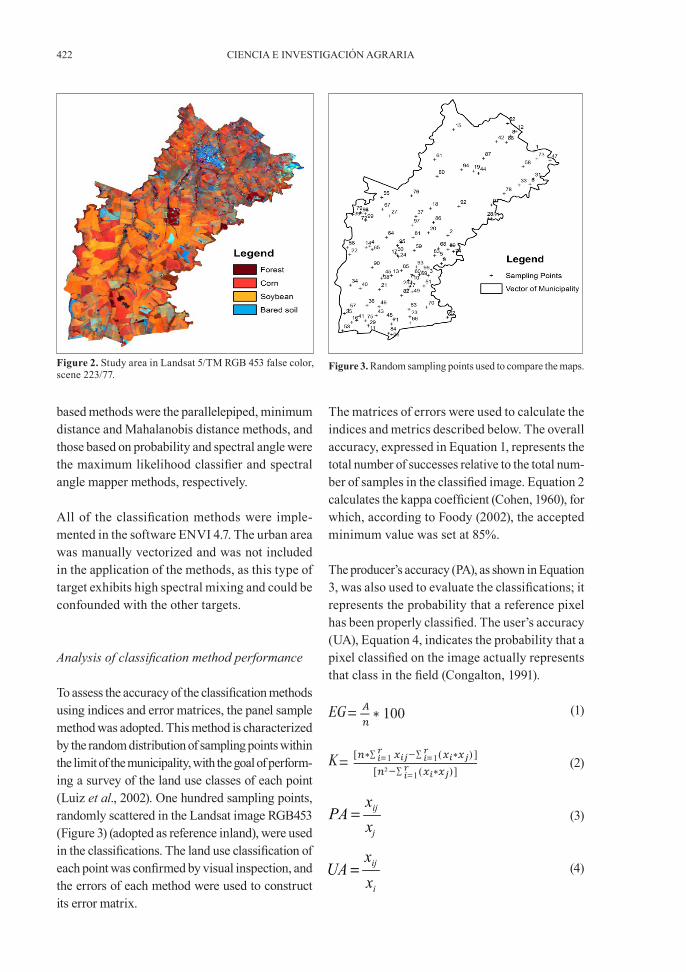
The false color composite image RGB-453 was used in this study, in which bands 3, 4 and 5 presented a spectral range of red (0.63 to 0.69 µm), near infrared (0.76 to 0.90 µm), and mid-infrared (1.55 to 1.75 µm), respectively. Patterns of colors, textures and forms in the RGB 453 composition were used to identify areas of soybean, corn, bare soil, and forest, which were then confirmed with field information.
Figure 2 illustrates the color characteristics of the targets, notably the composition of the col-ors used in RGB-453. Once crops (soybean and corn) achieve a certain stage of development, they are sufficiently different from other targets to be selected visually as pure pixels, providing supervision for the classification and a ground reference for the creation of the error matrix.
Supervised digital classifications were then conducted using the different methodologies. The distance-
Figure 1. Location of scene 223/77 and delimitation of the municipality of Cafelândia, Paraná State.
ciencia e investigación agraria422
based methods were the parallelepiped, minimum distance and Mahalanobis distance methods, and those based on probability and spectral angle were the maximum likelihood classifier and spectral angle mapper methods, respectively.
All of the classification methods were imple-mented in the software ENVI 4.7. The urban area was manually vectorized and was not included in the application of the methods, as this type of target exhibits high spectral mixing and could be confounded with the other targets.
Analysis of classification method performance
To assess the accuracy of the classification methods using indices and error matrices, the panel sample method was adopted. This method is characterized by the random distribution of sampling points within the limit of the municipality, with the goal of perform-ing a survey of the land use classes of each point (Luiz et al., 2002). One hundred sampling points, randomly scattered in the Landsat image RGB453 (Figure 3) (adopted as reference inland), were used in the classifications. The land use classification of each point was confirmed by visual inspection, and the errors of each method were used to construct its error matrix.
The matrices of errors were used to calculate the indices and metrics described below. The overall accuracy, expressed in Equation 1, represents the total number of successes relative to the total num-ber of samples in the classified image. Equation 2 calculates the kappa coefficient (Cohen, 1960), for which, according to Foody (2002), the accepted minimum value was set at 85%.
The producer’s accuracy (PA), as shown in Equation 3, was also used to evaluate the classifications; it represents the probability that a reference pixel has been properly classified. The user’s accuracy (UA), Equation 4, indicates the probability that a pixel classified on the image actually represents that class in the field (Congalton, 1991).
(1)
(2)
(3)
(4)
Figure 2. Study area in Landsat 5/TM RGB 453 false color, scene 223/77.
Figure 3. Random sampling points used to compare the maps.

423VOLUME 40 Nº2 MAY – AUGUST 2013
Results and discussion
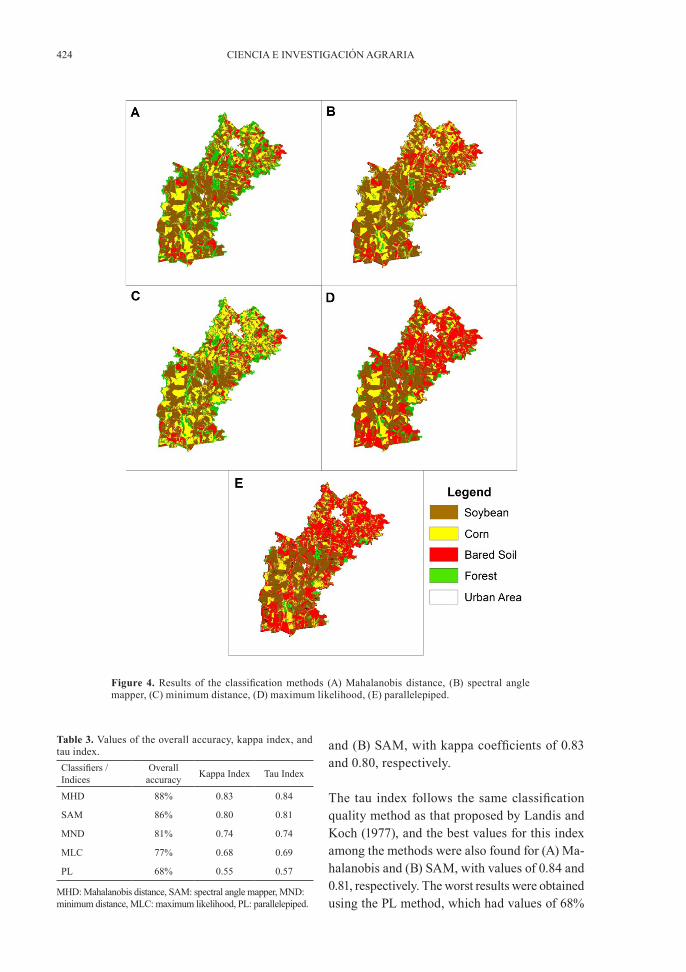
Figure 4 illustrates the thematic maps obtained from the five supervised classification methods: MHD (A), SAM (B), MND (C), MLC (D) and PL (E). Four distinct classes were identified in the maps: soybeans, corn, bare soil and forest.
Table 3 lists the overall accuracy and kappa and tau coefficients of the five classification meth-ods. Two methods achieved an overall accuracy index above 85%: (A) Mahalanobis and (B) SAM, with values of 88% and 86%, respectively. Landis and Koch (1977) suggested that kappa coefficient values higher than 0.8 indicate that a given classification is of high quality, i.e., it approximates the reference image. The methods that reached this value were (A) Mahalanobis
where EG = overall accuracy; A = sampling points with success; n = number of sampling points. K = kappa coefficient of agreement; r = number of rows of the error matrix; xij =
observation in row i column j; xi = marginal total of row i; xj = marginal total of column j.
The accuracy was also assessed using the tau index (Ma and Redmond, 1995), which provides a relatively precise and intuitive quantitative measure of classification accuracy. The tau index, calculated according to Equation 5, is similar to the kappa index, and Pk indicates the a priori probabilities for each class.
(5)
when the a priori probabilities for each class are equal, i.e., pi=1/k, where k is the number of classes of the error matrix.
For the global comparison of maps, Jenness and Wynne (2005) have proposed the total confusion matrix displayed in Table 1, which was obtained from the error matrix.
Table 2 presents a number of metrics derived from the total confusion matrix used to compare the thematic maps.
The sensitivity index (S) indicates the probabil-ity that a pixel in the model map is classified as belonging to class k if it actually belongs to the class k; this measure is equivalent to the producer’s accuracy (Fielding and Bell, 1997). The specific-ity index (E) indicates the probability that a pixel which does not belonging to class k of the actual map is classified as not belonging to class k in the model map (Lurz et al. 2001). The Matthews cor-relation coefficient (CCM) is a discrete version of the Pearson coefficient correlation, and its values fall within the range [-1;1], with 1 representing a perfect prediction, 0 a random prediction, and -1 an inverse prediction (Dalposso et al., 2012).
Table 1. Total confusion matrix.
Reference map
True (T) False (F)
Mod
el M
ap
True (T)
False (F)
Where a = amount of correctly classified pixels, b = amount of pixels in the model map incorrectly classified as belonging to the classes of the real map, c = amount of pixels belonging to the classes of the real map that belong to different classes in the model map, d = amount of pixels in the model map correctly classified as not belonging to the classes of the real map.
Table 2. Metrics derived from the total confusion matrix.
Metrics Equation
S a/(a+c)
E d/(b+d)
CCM ((a·d)-(b·c))/((a+b)·(a+c)·(d+b)·(d+c))(1/2)
S: sensitivity index, E: total specificity index, CCM: Matthews correlation coefficient.
ciencia e investigación agraria424
and (B) SAM, with kappa coefficients of 0.83 and 0.80, respectively.
The tau index follows the same classification quality method as that proposed by Landis and Koch (1977), and the best values for this index among the methods were also found for (A) Ma-halanobis and (B) SAM, with values of 0.84 and 0.81, respectively. The worst results were obtained using the PL method, which had values of 68%
Figure 4. Results of the classification methods (A) Mahalanobis distance, (B) spectral angle mapper, (C) minimum distance, (D) maximum likelihood, (E) parallelepiped.
Table 3. Values of the overall accuracy, kappa index, and tau index. Classifiers / Indices
Overall accuracy Kappa Index Tau Index
MHD 88% 0.83 0.84
SAM 86% 0.80 0.81
MND 81% 0.74 0.74
MLC 77% 0.68 0.69
PL 68% 0.55 0.57
MHD: Mahalanobis distance, SAM: spectral angle mapper, MND: minimum distance, MLC: maximum likelihood, PL: parallelepiped.
425VOLUME 40 Nº2 MAY – AUGUST 2013
for overall accuracy, 0.55 for the kappa index and 0.57 for the tau index.
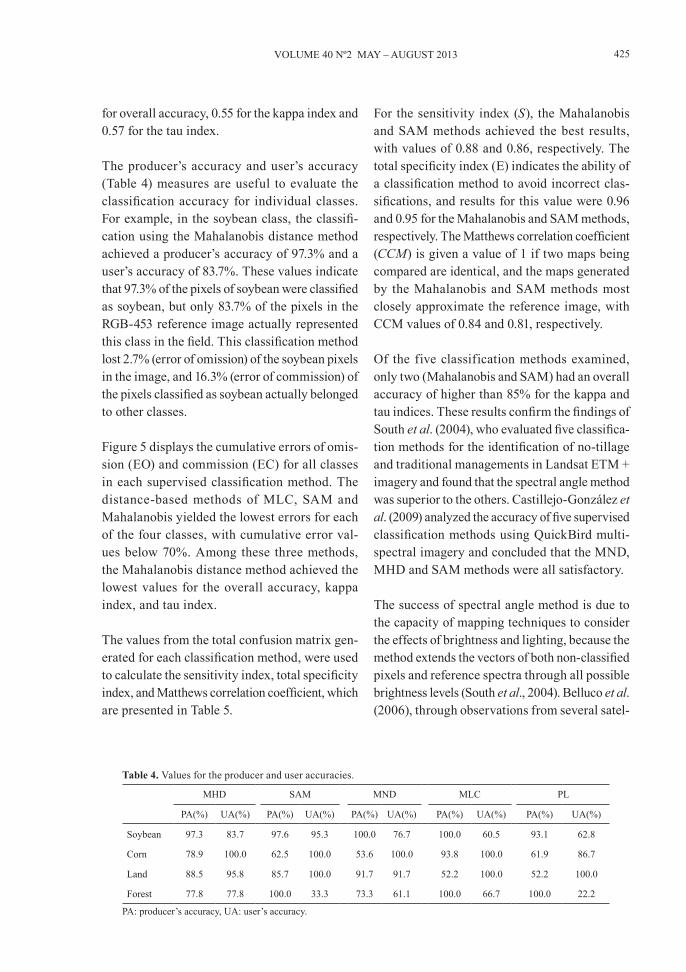
The producer’s accuracy and user’s accuracy (Table 4) measures are useful to evaluate the classification accuracy for individual classes. For example, in the soybean class, the classifi-cation using the Mahalanobis distance method achieved a producer’s accuracy of 97.3% and a user’s accuracy of 83.7%. These values indicate that 97.3% of the pixels of soybean were classified as soybean, but only 83.7% of the pixels in the RGB-453 reference image actually represented this class in the field. This classification method lost 2.7% (error of omission) of the soybean pixels in the image, and 16.3% (error of commission) of the pixels classified as soybean actually belonged to other classes.
Figure 5 displays the cumulative errors of omis-sion (EO) and commission (EC) for all classes in each supervised classification method. The distance-based methods of MLC, SAM and Mahalanobis yielded the lowest errors for each of the four classes, with cumulative error val-ues below 70%. Among these three methods, the Mahalanobis distance method achieved the lowest values for the overall accuracy, kappa index, and tau index.
The values from the total confusion matrix gen-erated for each classification method, were used to calculate the sensitivity index, total specificity index, and Matthews correlation coefficient, which are presented in Table 5.
For the sensitivity index (S), the Mahalanobis and SAM methods achieved the best results, with values of 0.88 and 0.86, respectively. The total specificity index (E) indicates the ability of a classification method to avoid incorrect clas-sifications, and results for this value were 0.96 and 0.95 for the Mahalanobis and SAM methods, respectively. The Matthews correlation coefficient (CCM) is given a value of 1 if two maps being compared are identical, and the maps generated by the Mahalanobis and SAM methods most closely approximate the reference image, with CCM values of 0.84 and 0.81, respectively.
Of the five classification methods examined, only two (Mahalanobis and SAM) had an overall accuracy of higher than 85% for the kappa and tau indices. These results confirm the findings of South et al. (2004), who evaluated five classifica-tion methods for the identification of no-tillage and traditional managements in Landsat ETM + imagery and found that the spectral angle method was superior to the others. Castillejo-González et al. (2009) analyzed the accuracy of five supervised classification methods using QuickBird multi-spectral imagery and concluded that the MND, MHD and SAM methods were all satisfactory.
The success of spectral angle method is due to the capacity of mapping techniques to consider the effects of brightness and lighting, because the method extends the vectors of both non-classified pixels and reference spectra through all possible brightness levels (South et al., 2004). Belluco et al. (2006), through observations from several satel-
Table 4. Values for the producer and user accuracies.
MHD SAM MND MLC PL
PA(%) UA(%) PA(%) UA(%) PA(%) UA(%) PA(%) UA(%) PA(%) UA(%)
Soybean 97.3 83.7 97.6 95.3 100.0 76.7 100.0 60.5 93.1 62.8
Corn 78.9 100.0 62.5 100.0 53.6 100.0 93.8 100.0 61.9 86.7
Land 88.5 95.8 85.7 100.0 91.7 91.7 52.2 100.0 52.2 100.0
Forest 77.8 77.8 100.0 33.3 73.3 61.1 100.0 66.7 100.0 22.2
PA: producer’s accuracy, UA: user’s accuracy.

CIENCIA E INVESTIGACIóN AGRARIA426
lite and airborne platforms for the classifi cation of intertidal vegetation, determined that when reference samples are not numerous, the use of SAM provides the most robust and reliable clas-sifi cation results due to its the ability to explore all available spectral information.
Among the supervised classifi cation methods tested in the present study, the Mahalanobis distance and spectral angle mapper (SAM) demonstrated the best performance.
The results demonstrated that different classifi ca-tion methods vary signifi cantly in performance for the mapping of land use and occupation. The study of the accuracy of these methods is therefore necessary, especially if the results of thematic maps are to be used to manage farming practices. The measures derived from the error matrix are appropriate for the comparison of thematic maps, as they provide global values while still allowing comparisons by class and between methods.
Acknowledgements
The authors would like to thank the CNPQ and Fundação Araucária for their grants of scholar-ships and fi nancial support.
Figure 5. Cumulative errors of commission (EC) and errors of omission (EO) for each classifi cation method.
Resumen
C.H.W. Souza, E. Mercante, V.H.R. Prudente y D.D.D. Justina. 2013. Métodos de evaluación de desempeño para la clasifi cación supervisada de imágenes satelitales en la determinación de las clases de cobertura terrestre. Cien. Inv. Agr. 40(2): 419-428. Imágenes satelitales junto con técnicas de sensoriamiento remoto ofrecen nuevas oportunidades para el monitoreo y evaluación de cultivos, con menores costos y una mayor objetividad en relación a
Table 5. Metrics obtained from the total confusion matrices.
Metric MHD SAM MND MLC PL
S 0.88 0.86 0.81 0.77 0.68
E 0.96 0.95 0.94 0.92 0.89
CCM 0.84 0.81 0.75 0.69 0.57
S: sensitivity index, E: total specifi city index, CCM: Matthews correlation coeffi cient.
427VOLUME 40 Nº2 MAY – AUGUST 2013
References
Bakr, N., D.C. Weindorf, M.H. Bahnassy, S.M. Ma-rei, and M.M. El-Badawi. 2010. Monitoring land cover changes in a newly reclaimed area of Egypt using multi-temporal Landsat data. Ap-plied Geography 30:592-605.
Belluco, E., M. Camuffo, S. Ferrari, L. Modenese, S. Silvestri, A. Marani, and M. Marani. 2006. Map-ping salt-marsh vegetation by multispectral and hyperspectral remote sensing. Remote Sensing of Environment 105: 54-67.
Brian, W.S., Qi Chen, and B. Michael. 2011. A comparison of classification techniques to sup-port land cover and land use analysis in tropical coastal zones. Applied Geography 31:525-532.
Castillejo-González, I.L., F. López-Granados, A. Gar-cía-Ferrer, J.M. Peña-Barragán, M. Jurado-Ex-pósito, M.S. Orden, and M. González-Audicana. 2009. Object - and pixel-based analysis for map-ping crops and their agro-environmental associat-ed measures using QuickBird imagery. Computers and Electronics in Agriculture 68: 207-215.
Chander, G., B.L. Markham, and D.L. Helder. 2009. Summary of current radiometric calibration Co-efficients for Landsat MSS, TM, ETM+, and EO-1 ALI sensors. Remote Sensing of Environ-ment 113: 893-903.
Cohen, J.A. 1960. Coefficient of agreement for nom-inal scales. Educational and Psychological Mea-surement 20:37-46.
Congalton, R.G. 1991. A review of assessing the ac-curacy of classifications of remotely sensed data. Remote Sensing of Environment 37:35−46.
Cruz, E.S. 2008. Comparação de classificadores de imagens digitais na determinação da cobertura do solo. Engenharia Agrícola 28: 237-244.
Dalposso, G.H., M.A. Uribe-Opazo, E. Mercante, J.A. Johann, and J.A. Borssoi. 2012. Compari-son measures of maps generated by geostatistical methods. Engenharia Agrícola 32: 174-183.
EMBRAPA. 2006. Sistema brasileiro de classifi-cação de solo. Empresa Brasileira de Pesquisa Agropecuária (EMBRAPA). 2 edição. Rio de Janeiro, Brasil. 306 pp.
Fielding, A.H., and J.F. Bell. 1997. A review of methods for the assessment of prediction errors in conservation presence/absence models. Envi-ronmental Conservation 24:38-49.
Foody, G.M. 2002. Status of land cover classification accuracy assessment. Remote Sensing of Envi-ronment 80:185–201.
GLCF. 2012. Global Land Cover Facility. Depart-ment of Geography. University of Maryland. Available online at: http://glcf.umd.edu/data/. (Web accessed: January, 2012).
los métodos tradicionales. La presente investigación utilizó imágenes de satélite Landsat 5/TM para identificar las clases de cobertura del suelo en Cafelândia (Paraná, Brasil), un municipio predominantemente agrícola. Cinco métodos de clasificación supervisada: Paralelepipedo (PL), Distancia mínima (MND), Distancia de Mahalanobis (MHD), Máximo probabilidad (MLC) y Mapeador de Ángulo Espectral (SAM) fueron probados en este trabajo. Con el fin de evaluar la eficiencia de las clasificaciones, se utilizaron índices y métricas de precisión obtenidos a través de matrices de errores y confusión total. Los resultados indicaron que los clasificadores de distancia de Mahalanobis y SAM superaron a los demás, consiguiendo los mejores resultados y proporcionando los menores errores para las cuatro clases estudiadas (soja, maíz, bosque, suelo desnudo), con valores de precisión global de 88 y 86%, respectivamente, y valores de índice de Kappa de 0,83 y 0,80, respectivamente. Para las métricas aplicadas, los valores fueron 0,88 y 0,86 para el índice de sensibilidad, 0,96 y 0,95 para el índice de especificidad y de 0,84 y 0,81 para el coeficiente de correlación de Matthews, respectivamente. La elección de los diferentes tipos de clasificadores claramente resultó en grandes variaciones en el desempeño del mapeamiento de la cobertura y uso de la tierra. El uso de las medidas obtenidas a partir de la matriz de errores es un método adecuado para hacer comparaciones entre mapas temáticos.
Palabras clave: Clasificadores, índices de precisión, paisaje agrícola, sensoriamento remoto.
CIENCIA E INVESTIGACIóN AGRARIA428
Hubert-Moy, L., A. Cotonnec, L. Le Du, A. Chardin, and P. Perez. 2001. A Comparison of Parametric Classification Procedures of Remotely Sensed Data Applied on Different Landscape Units. Re-mote Sensing of Environment 75:174-187.
IAPAR. 2000. Cartas climáticas básicas do Estado do Paraná. Instituto Agronômico do Paraná (IAPAR). Londrina, Brasil. Available online at: www.iapar.br (Website accessed: January 2012).
Janssen, L. L. F., and J. M. Van Der Wel. 1994. Ac-curacy asse ssment of satellite derived land-cover data: a review. Photogrammetric Engineering and Remote Sensing 60:419-426.
Jenness, J., and J. J. Wynne. 2005. Cohen’s Kappa and classification table metrics 2.0: na ArcView 3x extension for accuracy assessment of spatially ex-plicit models. U. S. Geological Survey, Southwest Biological Science Center, Flagstaff, AZ. 86 pp.
Landis, J.R., and G.G. Koch. 1977. The measure-ment of observer agreement for categorical data. Biometrics 33:159-174.
Lu, D., P. Mausel, E. Brondízio, and E. Moran. 2004. Change detection techniques. International Jour-nal of Remote Sensing 25:2365-2407.
Luiz, A.J.B., J.C. Oliveira, J.C.N. Epiphanio, and A.R. Formaggio. 2002. Auxílio das imagens de satélite aos levantamentos por amostragem em agricultura. Agricultura em São Paulo 49:41-54.
Lurz, P.W.W., S.P. Rushton, L.A. Wauters, S. Ber-tolino, I. Currado, P. Mazzoglio, and M.D.F. Shirley. 2001. Predicting grey squirrel expansion in North Italy: a spatially explicit modeling ap-proach. Landscape Ecology 16:407-420.
Ma, Z., and R.L. Redmond. 1995. Tau coefficients for accuracy assessment of classification of re-mote sensing data. Photogrametric Engineering and Remote Sensing 61:435-439.
Pal, M., and P.M. Mather. 2004. Assessment of the effectiveness of support vector machines for hy-perspectral data. Future Generation Computer Systems 20:1215-1225.
Richards, J.A., and X. Jia. 1999. Remote sensing digital image analysis: an introduction. 3 Edição. New York: Springer Verlag. 363pp.
South, S., J. Qi, and D.P. Lusch. 2004. Optimal clas-sification methods for mapping agricultural till-age practices. Remote Sensing of Environment 91:90-97.
Williams, D.L., S. Goward, and T. Arvidson. 2006. Landsat: yesterday, today, and tomorrow. Pho-togrammetric Engineering and Remote Sensing 72:1171–1178.
Yang, C., J.H. Everitt, and D. Murden. 2011. Evalu-ating high resolution SPOT 5 satellite imagery for crop identification. Computers and Electron-ics in Agriculture 75:347-354.
Related Documents