Technical Sciences, 2016, 19(1), 59–70 METHODS OF IDENTIFICATION AND DELIMITATION OF CONCAVE TERRAIN FEATURES BASED ON ISOK-NMT DATA Tomasz Oberski Department of Civil and Environmental Engineering, Division of Geoinformatics Koszalin’s University of Technology Received 29 October 2015; accepted 17 January 2016; available online 18 January 2016. K e y w o r d s: DTM, ISOK, terrain, concave features, GIS. Abstract Airborne Laser Scanning (ALS) products are now often used to study the terrain due to their numerous advantages such as relatively low cost and ease of data collection. The ISOK project (pl: Informatyczny System Osłony Kraju – national hazard protection information system) developed elevation data for about 65% of the Polish territory. Parallel to the airborne laser scanning point cloud collection, additional products, such as orthophotomaps, digital terrain models (DTM), and digital surface models (DSM) were created. This resource is not only a reference material for the project, but also a valuable source of the analysis used in various fields of economy and science. Important features of the ISOK-data are the availability and their standardized format based on uniform technical conditions. The article presents the results of an experiment in which an attempt was made to use the digital elevation model with a resolution of 1 m based on airborne laser scanning data to determine concave terrain features using GIS tools. The ISOK-DTM has a height accuracy of 0.15 m for the outdoor areas, which makes it a better representation of small terrain forms than previous products. The research area is located at an undeveloped open ground with comparatively little variation of its shape for a long period. Several methods were tested to classify the terrain shape based of topographic attributes. Those methods led to similar locations of the concave features and further on coincide with results of the pre-analysis. Also, attention was drawn to the selection of the analysis parameters and their influence on the result. The results show the usefulness of ISOK’s DTM for locating field concave terrain shapes. Correspondence: Tomasz Oberski, Katedra Geoinformatyki, Wydział Inżynierii Lądowej, Środowiska i Geodezji, Politechnika Koszalińska, ul. Śniadeckich 2, 75-453 Koszalin, phone: +48 94 348 67 20, e-mail: [email protected]

Welcome message from author
This document is posted to help you gain knowledge. Please leave a comment to let me know what you think about it! Share it to your friends and learn new things together.
Transcript

Technical Sciences, 2016, 19(1), 59–70
METHODS OF IDENTIFICATION AND DELIMITATIONOF CONCAVE TERRAIN FEATURES BASED
ON ISOK-NMT DATA
Tomasz OberskiDepartment of Civil and Environmental Engineering, Division of Geoinformatics
Koszalin’s University of Technology
Received 29 October 2015; accepted 17 January 2016; available online 18 January 2016.
K e y w o r d s: DTM, ISOK, terrain, concave features, GIS.
A b s t r a c t
Airborne Laser Scanning (ALS) products are now often used to study the terrain due to theirnumerous advantages such as relatively low cost and ease of data collection. The ISOK project (pl:Informatyczny System Osłony Kraju – national hazard protection information system) developedelevation data for about 65% of the Polish territory. Parallel to the airborne laser scanning pointcloud collection, additional products, such as orthophotomaps, digital terrain models (DTM), anddigital surface models (DSM) were created. This resource is not only a reference material for theproject, but also a valuable source of the analysis used in various fields of economy and science.Important features of the ISOK-data are the availability and their standardized format based onuniform technical conditions. The article presents the results of an experiment in which an attemptwas made to use the digital elevation model with a resolution of 1 m based on airborne laser scanningdata to determine concave terrain features using GIS tools. The ISOK-DTM has a height accuracy of0.15 m for the outdoor areas, which makes it a better representation of small terrain forms thanprevious products. The research area is located at an undeveloped open ground with comparativelylittle variation of its shape for a long period. Several methods were tested to classify the terrain shapebased of topographic attributes. Those methods led to similar locations of the concave features andfurther on coincide with results of the pre-analysis. Also, attention was drawn to the selection of theanalysis parameters and their influence on the result. The results show the usefulness of ISOK’sDTM for locating field concave terrain shapes.
Correspondence: Tomasz Oberski, Katedra Geoinformatyki, Wydział Inżynierii Lądowej, Środowiskai Geodezji, Politechnika Koszalińska, ul. Śniadeckich 2, 75-453 Koszalin, phone: +48 94 348 67 20,e-mail: [email protected]

Introduction
The shape of the terrain has a significant impact on the phenomena on itssurface. The characteristics of the topographic surface and the presence ofcertain land forms determine the development and the usage of the area.Identification of particular landforms based on measured elevation datafacilitates land use planning and the better understanding of land cover andphenomena occurring on it. Concave terrain forms, i.e. sinks, are one of thevery important ones as they may be suitable as water catchments. Regardlessof the terrain’s inclination forms such as local depressions, sinks, wells orother synclinal forms interferes with the surface water runoff (Fig. 1). Thismay cause permanent or periodic wetness accumulation.
Fig. 1. Sample of concave features
Under some conditions the presence of concave forms can be a reason ofaccumulating material transported with the runoff of surface water. Aftera long period the accumulated material can change the surface characteristicfor example by filling up the concave sites. This happens in areas covered withloose materials and high runoff intensity. Another case occurring in ruralareas is filling sinks with organic matter derived from the decomposition ofplants, and sometimes chemicals such as residuals of fertilizers and herbicides.Concave areas promote the accumulation of the water and due to the increasedhumidity may give an unfavourable environment for the growth of crops. Asa result of excessive moisture at these sites anaerobic conditions may tempor-arily or permanently support decomposition processes. They are usuallyformed at local, mild synclinal forms, e.g. concave parts of the slopes. A densemeasurement of the topographic surface is required to identify such features.Airborne Laser Scanning technology due to its ability to pass through openings
Tomasz Oberski60
Technical Sciences 19(1)2016

in the canopy and to detect the underlying surface of the Earth can providefairly dense data in forested or inaccessible areas. Measured points of theground in areas usually obscured by vegetation support analytical methods ofwetland delineation (UDWIG 2015) or channel networks mapping (KLADZYK
2015). This kind of measurement has been made recently by airborne laserscanning (ALS) in Poland in the frame of the ISOK (pl: Informatyczny SystemOsłony Kraju, national hazard protection information system) project. Air-borne laser scanning (ALS) is now a widely used method of spatial datacollection. With a combination of techniques for determining the position andthe inclination of the measuring instrument (GPS, INS) and a system formeasuring the flight time of a laser beam from its point of generation to thepoint of reflection and back it is possible to generate a point cloud representingthe shape of the scanned surface. The scan frequency, and thus the density ofthe point cloud obtained is selected according to the needs and costs. Thehigher the frequency the more points are saved and thus the scanned object ismapped in a more detailed way. However, this increases the cost of dataacquisition and generates larger files, and requires more resources during postprocessing. Laser scanning technology has been used already in Poland fora few years. Several domestic companies offer services in laser scanning. So far,studies were made locally and globally. Local studies include commercial tasks,e.g. the modernization of the rail network, or research and development forscientific institutions. The global studies include the ISOK-project as a part ofan efficient system of the country protection against extreme hazards. Thescanning was performed in years 2011–2013 during spring and autumn. Inorder to adapt to different terrain types scanning was done with two differentsetups. The first setup was defined for urban areas with a high point density of12 points/m2 while the second setup with a density of 4–6 points/m2 wasdefined for the remaining area (KURCZYŃSKI, BAKUŁA 2012). After qualitycontrol the ISOK datasets have been made available as a part of NationalGeodetic and Cartographic Resource. Data such as point clouds in LAS format,orthophotos, digital terrain models and digital surface models are available formany applications. Now, high accuracy photogrammetric data are coveringabout 65% of the Polish territory. It is a good reference for comparative studiesin different regions of the country because of its standardized data capture andprocessing, as well as the high up-to-dateness. The whole data was collected inrelatively short time period so topographic situation shows same land use level.A digital terrain model (DTM) is one of the ISOK products. It was interpolatedas a square grid based on the LIDaR point cloud. The best available resolutionof the resulting gridded DTM is 1.0 m × 1.0 m. It is prepared on the basis of thepoint clouds obtained by the specification of the first and the second setup.According to the standard rules the DTM accuracy defined as the mean height
Methods of Identification and Delimitation... 61
Technical Sciences 19(1)2016

error is assumed as 0.15 m for well defined uncovered area, and 0.25 m – 0.30 mfor forested areas. The error of steep, hilly and forested slopes may be larger.The DTM has been saved as a text file containing the x, y, z coordinates. It isnot associated with any specific software. Thus, it is possible to load the datainto any GIS/CAD environment.
Methods
The topic of identifying and delineating concave forms was repeatedlyaddressed in scientific research. It is a very important issue regarding crisismanagement, natural disasters like floods, and other. The automatic methodsof the localization of such sites by using a DTM could be applicable in manyareas. The automatic methods are very helpful for some types of simulationsbased on the terrain shape, e.g. to determine the extent of the floods, toestimate probable losses and to plan preventive actions. A similar situation canhappen in areas not covered by permanent flood monitoring, i.e. where nohazard maps are developed. There, problems of water management mayhappen due to the shape of the topographic surface. In such situations anoverview of the DTM in conjunction with other available hydrographic surveymaterials helps to understand these phenomena and develop possible solu-tions, for example insulation or drainage (OBERSKI, SZCZEPANIAK 2013). UsingGIS tools with DTM data on land use planning helps to find those areas whichperiodically collect water due to depressions. Such places inconvenient forseveral usages should be excluded from becoming construction sites (BIELSKA,OBERSKI 2014). Research carried out by the author showed the usefulness ofGIS analysis using DTM data in locating natural bodies of water for undevel-oped areas as methods to support landscaping (OBERSKI, ZARNOWSKI 2013).
An experiment was conducted in an area of an undeveloped agriculturalregion with comparatively little variation in the terrain shape over a long time.Due to the land use type (agricultural crops) it is possible to observe phenom-ena on the surface characteristic for different seasons, under different stages ofplant growth, and „bare” earth. The location of the test area is shown onFigure 2.
It is located in the municipality of Stawiguda, district Olsztyn in Warmia--Mazury. The area has an undulated terrain. Glacier erosion as well as runoff,snowmelt and river water activities has formed the relief. The area is mostlyplateau originating from the accumulation of moraines reaching up to a heightof 120 m – 140 m above sea level. This upland has an early glacial terrain relief.The terrain’s shape is undulating with convex forms (eskers, moraine hills)and concave forms as parts of river valleys and glacial. A characteristic feature
Tomasz Oberski62
Technical Sciences 19(1)2016

Fig. 2. Location of test area
of this area is the presence of numerous septic sinks and wells. Moraines havethe form of individual, irregularly spaced hills (GLIŃSKA-LEWCZUK 2012). Thedetection of significant concave forms in the rural area can be done in-situ quiteeasily. However, this depends on periodically occurring factors such as time ofyear, hydrological conditions and vegetation cover. In the case of an impossiblesite’s inspection archived photogrammetric materials can be used. The best andmost independent data source is a DTM. The quality of the points of interestbased on a DTM depends on its density and the height accuracy. If the DMT’sgrid is not dense, it is still possible to identify concave forms in regions of clearlydistinguishable landforms such as saddles, sinks, and depression. However, dueto a lack of visual comparison with surrounding points the boundaries of theconcave areas are more difficult to determine in that way.
Of course, this method is not perfect and not suited for minor concaveforms, especially those which define the characteristics of the terrain. Smalldiscrete concave forms are not always found at the lowest parts of the studyarea. Due to irregularities of the terrain undulations they are often included inother landforms which do not exactly correspond to depressions. They may belocated in a slightly concave parts of slopes or on hill tops. The examination ofneighbouring cross sections is one of the primary method to determinerecessed areas. This leads to the identification of barriers blocking superficialwater runoff according to its average slope (OBERSKI, ZARNOWSKI 2012).Automatic or semi-automatic comparison of cross-sectional shapes allows theidentification of concave forms. However, due to the two-dimensional nature ofthe analysis the delineation of those areas is only approximate.
Methods of Identification and Delimitation... 63
Technical Sciences 19(1)2016
The identification and the delineation of concave field forms is also possiblewith GIS tools. Software environments such as SAGA-GIS or ArcMap offermany opportunities to solve that task. Especially the Spatial Analyst Tools arevery useful. By using several terrain analyst tools it is possible to find regionswhere surrounding points are higher and the slope is always directed to theinside. This phenomenon can occur anywhere on topographical surface, re-gardless of the height above sea level and its occurrence may not be related tothe general direction of terrain slope. By applying a combination of ArcMap’sSpatial Analyst functions Focal Flow, Flow Direction, Sink, Watershed, andZonal Fill it is possible to recondition the DTM in order to create a „hydrologi-cally correct” elevation model. A hydrologically correct elevation model is onein which every pixel in the surface slopes continually down gradient and outthe edges of the elevation model boundaries. In this way concave terrain formsare filled in and equalized. Once they are filled, it is easy to locate differencesbetween the original DTM and the corrected one. There are also several waysto find concave terrain features based on a DTM grid. The TopographicPosition Index (TPI) is useful for landform classification which includesconcave features. TPI is the difference between the cell elevation value and theaverage elevation of the neighbourhood (KOZIOŁ 2009).
TPI(D)i = hi –Σhj (1)n
where:hi – height level in analysed cell,hj – height of cells that surrounds analysed cell,n – number of surrounding cells.
The neighbourhood defines the extent of the area around the centre cell bydefining a number of elevation points. Commonly used neighbourhood shapesare circle, rectangle or ring (circle with a circular hole). Usually, the type of theneighbourhood is selected empirically. Some researchers have used othershapes to distinguish specific forms. However, for this project a circularneighbourhood was used. Positive values of the TPI indicate a cell higher thanits surroundings. Negative values indicate lower cells. TPI values around zerocould either mean a flat area or a regularly sloped area.
The landforms classification needs more input data to give satisfactoryresults. Especially when TPI values are near zero it is necessary to check theterrain slope. Combination of slope and TPI values helps to distinguishbetween flat and constantly sloped areas. The size of the neighbourhood whichdetermines the number of cells for computing the average elevation is crucial
Tomasz Oberski64
Technical Sciences 19(1)2016

for the TPI values. It depends on the size of the neighbourhood, i.e. the radiusof the circular area, the size of the rectangle, or the ring’s radii. Therefore, TPIvalues depend on the scale factor describing the neighbourhood’s size. The TPIis very scale dependent. In practice it is necessary to use several scale factors tochoose the most convenient for a specific area. It is important because the TPIbased landform classification may find a flat plain, convex forms or concaveforms in the same location (JENNESS 2006). An example is shown in Figure 3.
Fig. 3. TPI values for one location at three different scales (cases: A – small scale makes no differencebetween elevation of cell and neighbourhood, so TPI value is approximately 0; B – analyzed cell isdistinctly higher then neighbourhood so TPI value is greater than 0; C – the neighbourhood includesthe hills on either side of the valley, therefore, the analysed cell is lower than its neighbours and thus
the TPI value is negativeSource: http://www.jennessent.com/downloads/TPI–Documentation–online.pdf, 2015.08.25.
The correct understanding of the scale as one of the main factors influenc-ing the TPI values allows a precise analyses of the results. In general the TPIfor the small scale enables the delineation of local hills and pits while the largescale helps to locate larger forms like valleys and mountains. Finally, thecombination of two different scale factors (small and large) combined withslopes lead to the identification of 10 types of landform classification (WEISS
2001, JENESS 2006).The Topographic Wetness Index (TWI) is another helpful analyst which is
one of the quantitative measures describing the effect of topography onhydrological processes. The TWI indicates the relationship between the size ofthe area involved in surface water collection, and the value of its slopeaccording to equation:
TWI = ln ( α ) (2)tanβ
where:α – catchment area,β – slope measured in local cell.
Methods of Identification and Delimitation... 65
Technical Sciences 19(1)2016

The TWI shows the spatial distribution of moisture in the soil. Also, itshows the level of water saturation in soil based on topographic conditions(SØERSEN at al. 2006). The greatest values of the TWI are reached in areas oflarge surface water catchment and small slope. Topographically such placesare usually very wet, so it could indicate the existence of concave forms(URBAŃSKI 2012).
Results and Discussion
The GIS software (ArcMap, SAGA-GIS) was used for the identification anddelineation of concave forms in the test area. The ISOK DTM was the sourcedata. This DTM is derived from ALS data. The scan density was in range of 6 to12 points/m2. The final DTM resolution is 1 metre. Declared by the manufac-turer the height accuracy of the DTM is 15 cm. So this value has been adoptedas the threshold below which all found locations are treated as concave terrainforms. The map with delineated concave forms was developed using tools forthe surface terrain analysis (Fig. 4).
Fig. 4. Found concave forms (with orthophotomap in background)
At first, the TPI index was calculated. The circular shape was used todetermine the neighbourhood’s average terrain elevation of each DTM cell.Several sizes of radii (scale factor) of the neighbourhood were tested. The largescale (large radius) gave a few large concave features while using a small scalegenerated a lot of various small forms. An example of different scaled TPImaps is shown in Figure 5.
Tomasz Oberski66
Technical Sciences 19(1)2016

Fig. 5. Low values of TPI index at 4 different scales: a – 25 m, b – 50 m, c – 100 m, d – 300 m
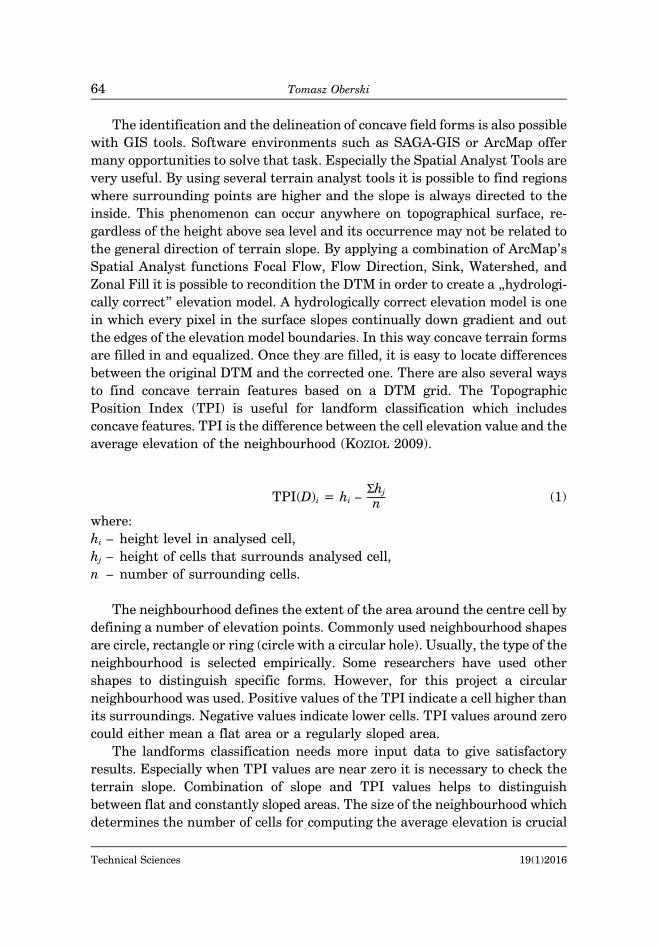
Two most appropriate scales (radii) were selected (radius 25 m and 100 m).Using such TPI maps allows to combine small and large forms. In a second stepthe classification of the land forms were done. The combination of small andlarge scales gives 10 different types of the landform (WEISS 2001). The maintopic of the experiment was finding concave forms. Thus, only such forms wereanalysed. The previous classification was reduced to forms which are naturallylower than their surroundings. Finally 5 different landforms were qualified asrepresentative. There were: canyons, deeply incised streams, drainages mid-slope, shallow valleys and u-shaped valley. Figure 6 presents chosen landformscombined with previously delineated concave forms.
In additional the TWI index map for the test area was created. Large TWIvalues could indicate wetness in specific regions which is usually positively
Methods of Identification and Delimitation... 67
Technical Sciences 19(1)2016
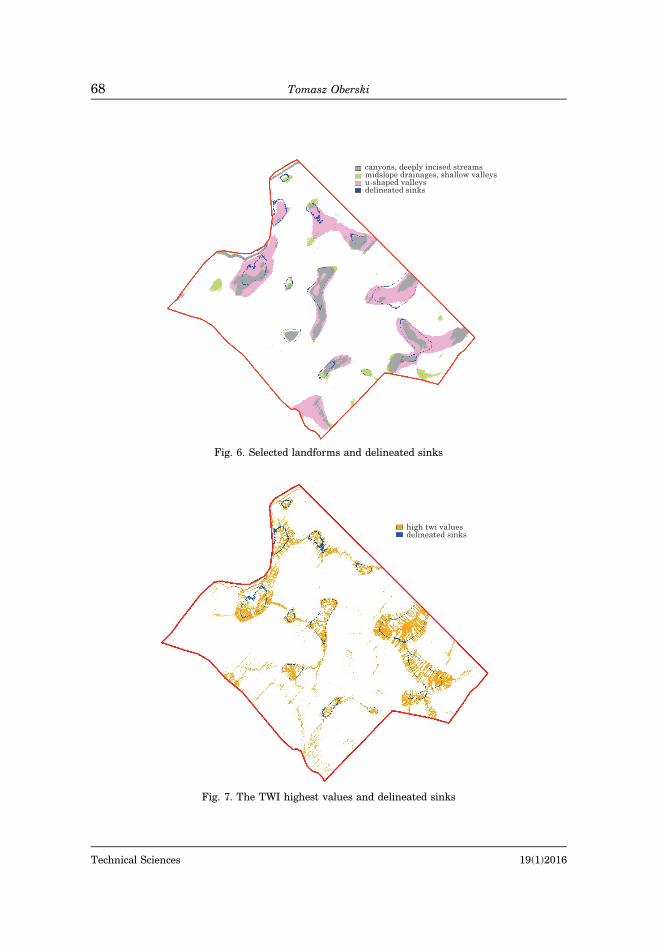
Fig. 6. Selected landforms and delineated sinks
Fig. 7. The TWI highest values and delineated sinks
Tomasz Oberski68
Technical Sciences 19(1)2016

correlated to the shape of the analysed terrain, a concave form and its higherneighbourhood. The slope around such a depression is always directed inside.In the vast majority of cases such locations are concave forms. If they havea longish shape it often coincides with the direction of the water flow. In thisexperiment the highest values of the TWI have a similar location as thepreviously delineated concave objects and concave forms found using the TPIclassification. The results are shown in Figure 7.
Conclusion
The precise delineation of concave forms is not an easy task, both in-situand in the laboratory based on an DTM. We should remember that thecorrectness of the findings based on a DTM not only depends on its heightprecision but also on its resolution. The ISOK’s DTM is interpolated froma point cloud captured by ALS. Obviously, filtering and classification of theALS points led to a lower point density as declared by the data distributor. Infact, the density of 4–6 points/m2 is probably not guaranteed everywhere. Thegrid is the result of an interpolation. It always approximates the shape of thetopographic surface. Accordingly, small landforms could be smoothed. Conse-quently, they are impossible to be identified on the basis of this data. Theresults of the experiment show that the DTM of the ISOK project allowsfinding the boundaries of the concave forms in the tested area. Generally, inmost cases the found concave forms have the correct location. However, theirborders differ from those found by the TPI landform classifier. Attentionshould paid to the fact that TPI and TWI classified some regions as concavewhile the ArcGIS functions did not give any indications. This may mean thatthe forms are shallower (less than 0.15 m below the surrounding) and thusomitted due to the threshold of the height accuracy of the DTM. The method ofsearching concave forms based on the DTM can be very useful for every kind ofterrain, especially difficult and non-accessible regions. The method has somelimitations, among others a not fully reliable border detection. However, itshowed that the analysis of the DTM data regarding small and larger landforms can be performed successfully. The ISOK DTM is currently the mostreliable and quite accurate data source on the topographic surface of themajority of the Polish territory. It is a good foundation for various analyses. Wecan expect that through the development of new measurement techniques,hardware and software the DTM will in the future be even more precise whichcertainly will lead to even better analytical results.
Methods of Identification and Delimitation... 69
Technical Sciences 19(1)2016
References
BIELSKA A., OBERSKI T. 2014. Wyłączenie spod zabudowy gruntów nadmiernie uwilgotnionychklasyfikowanych za pomocą narzędzi GIS. Infrastruktura i Ekologia Terenów Wiejskich, II(2):411–421.
GLIŃSKA-LEWCZUK K. 2011. Mapa hydrograficzna w skali 1:50000, arkusz N-34-77-D Olsztyn. Komen-tarz do mapy hydrograficznej w skali 1:50000, arkusz N-34-77-D Olsztyn. Główny Urząd Geodezjii Kartografii, Warszawa.
JENNESS J. 2006. Topographic Position Index (TPI) v. 1.2. http://www.jennessent.com/down-loads/TPI–Documentation–online.pdf (access: 25.08.2015).
KLADZYK A.G. 2013. GIS feature extraction tools in diverse landscapes. Department of Environmentaland Water Resources Engineering, University of Texas at Austin.http://www.caee.utexas.edu/prof/maidment/giswr2013/Reports/Kladzyk.pdf (access: 30.12.2015).
KOZIOŁ K. 2009. Numeryczny model terenu dla wielorozdzielczej/wieloprezentacyjnej bazy danychprzestrzennych. Geomatics and Environmental Engineering, 3(1/1): 69–80.
KURCZYŃSKI Z., BAKUŁA K. 2012. Generation of countrywide reference digital terrain model fromairborne laser scannig in isok project. Archiwum Fotogrametrii, Kartografii i Teledetekcji,Warszawa, p. 59–68.
OBERSKI T., SZCZEPANIAK-KOŁTUN Z. 2013. Określania obszarów lokalnych podtopień na podstawie nmti bazy hydro. Roczniki Geomatyki, 11[2(59)]: 79–85.
OBERSKI T., ZARNOWSKI A. 2013. Analiza wpływu rzeźby terenu na kształtowanie krajobrazu przyrodnic-zego i jego zagospodarowanie. Inżynieria Ekologiczna, 33: 86–95.
OBERSKI T., ZARNOWSKI A. 2012. Pozyskiwanie naturalnych zbiorników wodnych na podstawienumerycznego modelu rzeźby terenu i narzędzi GIS. Infrastruktura i Ekologia Terenów Wiejskich,1(3): 151–164.
SØRENSEN R., ZINKO U., SEIBERT J. 2006. On the calculation of the topographic wetness index: evaluationof different methods based on field observations. Hydrology Earth Systems Science, 10: 101–112.
UDVIG T. 2015. Use of a Lidar Based Model for Remote Sensing of Ephemeral Wetlands in AnokaCounty, Minnesota USA. Papers in Resource Analysis, 17: 12.
URBAŃSKI J. 2012. GIS w badaniach przyrodniczych. http://ocean.ug.edu.pl/~oceju/CentrumGIS/dane/GIS–w–badaniach–przyrodniczych–12–2.pdf (access: 31.08.2015).
WEISS A. 2001. Topographic position and landforms analysis. Poster Presentation, ESRI UserConference, San Diego, CA.
Tomasz Oberski70
Technical Sciences 19(1)2016
Related Documents


