IOURNAL OF VOCATIONAL BEHAVIOR 40, 239-259 (1992) RESEARCH METHODOLOGY Methods for Evaluating Vocational Interest Structural Hypotheses JAMES ROUNDS, TERENCE J. TRACEY, AND LAWRENCE HUBERT University of Illinois at Urbana-Champaign We critically review Holland’s structural hypotheses to provide a framework for discussing the task of evaluating vocational interest models. Two forms of Holland’s RIASEC model are proposed and the predictions from these models are specified. Holland’s circular order model and circumplex structure are then evaluated to demonstrate Hubert and Arabie’s randomization test of hypothesized order relations and confirmatory factor analysis. These models and methods are illustrated with two RIASEC correlation matrices based on the Unisex edition of the ACT Interest Inventory. Finally, we briefly discussissuesof model comparison and methods to integrate the empirical literature on interest structure. o 1992 Academic Press, Inc. In 1930, E. K. Strong, Jr. gave L. L. Thurstone a list of correlations of 18 SVIB occupational scale scores from adult males. Thurstone (1931) applied multiple factor analysis to Strong’s data, beginning a 60-year history of structure-of-interest analyses. Surprisingly, recent history in- dicates that factor analysis or other methods of spatial representation (e.g., multidimensional scaling) are still being used in an exploratory or unconstrained manner to verify Holland’s (1973, 1985) and Roe’s (1956; Roe & Klos, 1969) precisely specified structural hypotheses. Typically, authors obtain scores from a Holland- or Roe-type measure, correlate the scores, apply an unconstrained analysis to the correlation matrix, plot the variables (e.g., Holland’s six types), and visually compare the resulting configuration to Holland’s or Roe’s model with the goal of accepting or rejecting the theory. Some authors (e.g., Hansen & Campbell, 1985, p. 29; Harrington & O’Shea, 1982, p. 5; Holland, 1987, p. 20) simply skip Address correspondence and reprint requests to James Rounds, Department of Educa- tional Psychology, 210 Education, University of Illinois at Urbana-Champaign, 1310 South Sixth Street, Champaign, IL 61820. A copy of RANDORD can be obtained by sending a 3.5 or 5.25-in. MS-DOS formatted disk and a self-addressed, stamped envelope to Terence Tracey at the above address. 239 OOOl-8791/92 $3.00 Copyright Q 1992 by Academic Press, Inc. All rights of reproduction in any form reserved.

Welcome message from author
This document is posted to help you gain knowledge. Please leave a comment to let me know what you think about it! Share it to your friends and learn new things together.
Transcript
IOURNAL OF VOCATIONAL BEHAVIOR 40, 239-259 (1992)
RESEARCH METHODOLOGY
Methods for Evaluating Vocational Interest Structural Hypotheses
JAMES ROUNDS, TERENCE J. TRACEY, AND LAWRENCE HUBERT
University of Illinois at Urbana-Champaign
We critically review Holland’s structural hypotheses to provide a framework for discussing the task of evaluating vocational interest models. Two forms of Holland’s RIASEC model are proposed and the predictions from these models are specified. Holland’s circular order model and circumplex structure are then evaluated to demonstrate Hubert and Arabie’s randomization test of hypothesized order relations and confirmatory factor analysis. These models and methods are illustrated with two RIASEC correlation matrices based on the Unisex edition of the ACT Interest Inventory. Finally, we briefly discuss issues of model comparison and methods to integrate the empirical literature on interest structure. o 1992 Academic Press, Inc.
In 1930, E. K. Strong, Jr. gave L. L. Thurstone a list of correlations of 18 SVIB occupational scale scores from adult males. Thurstone (1931) applied multiple factor analysis to Strong’s data, beginning a 60-year history of structure-of-interest analyses. Surprisingly, recent history in- dicates that factor analysis or other methods of spatial representation (e.g., multidimensional scaling) are still being used in an exploratory or unconstrained manner to verify Holland’s (1973, 1985) and Roe’s (1956; Roe & Klos, 1969) precisely specified structural hypotheses. Typically, authors obtain scores from a Holland- or Roe-type measure, correlate the scores, apply an unconstrained analysis to the correlation matrix, plot the variables (e.g., Holland’s six types), and visually compare the resulting configuration to Holland’s or Roe’s model with the goal of accepting or rejecting the theory. Some authors (e.g., Hansen & Campbell, 1985, p. 29; Harrington & O’Shea, 1982, p. 5; Holland, 1987, p. 20) simply skip
Address correspondence and reprint requests to James Rounds, Department of Educa- tional Psychology, 210 Education, University of Illinois at Urbana-Champaign, 1310 South Sixth Street, Champaign, IL 61820. A copy of RANDORD can be obtained by sending a 3.5 or 5.25-in. MS-DOS formatted disk and a self-addressed, stamped envelope to Terence Tracey at the above address.
239
OOOl-8791/92 $3.00 Copyright Q 1992 by Academic Press, Inc.
All rights of reproduction in any form reserved.
240 ROUNDS, TRACEY, AND HUBERT
the analysis and visually inspect the correlation matrix for whatever pat- terns should be in the data to verify a structural model.
When more precise tests have been conducted to evaluate structure- of-interest models, Wakefield and Doughtie’s (1973) and Gati’s (1979, 1982) hypothesis-testing strategies have usually been adopted (e.g., Bo- bele, Alston, Wakefield, & Doughtie, 1976; Bobele, Alston, Wakefield, & Schnitzen, 1975; Gati, 1984, 1991; Gati & Winer, 1987; Rounds, Dav- ison, & Dawis, 1979; Tuck & Keeling, 1980). The Wakefield-Doughtie and Gati procedures are basically identical approaches using statistical methods based on the binomial distribution (e.g., sign test) to evaluate structural hypotheses derived from Holland’s, Roe’s, and Gati’s (1979) structure-of-interest models. Simply put, this procedure is applied to a correlation matrix of Holland’s RIASEC types or Roe’s interest scales to test pairs of correlations that have expected order relations derived from theory. Hubert and Arabie (1987), however, have recently criticized the Wakefield-Doughtie and Gati procedures showing that their statistical tests are based on an inappropriate assumption that the order relations are independent. This demonstration that the Wakefield and Doughtie (1973) and Gati (1979, 1982) procedures are incorrect and without sta- tistical legitimacy suggests that prior research using this procedure must be reevaluated and reopens the question about the structural validity of Holland’s, Roe’s, and Gati’s vocational interest models.
In the present article, we begin by critically reviewing Holland’s struc- tural hypothesis to provide a framework for discussing the task of eval- uating vocational interest models. Holland’s (1973, 1985) theory is based on six personality types-realistic (R), investigative (I), artistic (A), social (S), enterprising (E), d an conventional (C). From Holland’s writings, we can discern two forms of his RIASEC model, requiring different statistical procedures. Next we introduce and discuss two procedures that allow direct structural tests of interest models: a randomization test of hypoth- esized order relationships and confirmatory factor analysis. These tests of structural hypotheses are illustrated with covariance matrices. Although Holland’s model is used as an illustration throughout this article, these statistical procedures also have applicability to similar types of precisely defined structures (e.g., Roe’s circular structure-of-interest model and Gati’s three-group partition model). We end by briefly discussing several yet unresolved issues that have implications for evaluating structural hy- potheses.
DEFINING HOLLAND’S STRUCTURAL HYPOTHESES
Holland’s Circular Order and Circumplex Hypotheses
Before we propose methods for evaluating Holland’s model, it is im- portant to discuss the various representations of the RIASEC model in
HYPOTHESIS TESTING 241
the vocational interest literature. Because various terms have been used to describe Holland’s RIASEC structure (e.g., hexagon, circular structure- of-interest model, calculus assumption, misshapen polygon), it is often confusing whether such terms refer to the same model or different forms of Holland’s model. More importantly, the representation or form of Holland’s model suggests what statistical test is most appropriate and how to apply the test.
Rounds (in press) has described three forms of Holland’s RIASEC model that ‘have been discussed in the vocational literature: the simple circular arrangement hypothesis, the calculus hypothesis, and the hex- agonal hypothesis. The simple circular arrangement hypothesis is an ar- tifact of the typical methodology-visual inspection of spatial represen- tations-used to evaluate whether a circular order of R-I-A-S-E-C is present. The calculus hypothesis, drawn from Holland’s theory, states that six personality types are arranged in a circular order and that the interpoint distances for the types are “inversely proportional to the theoretical re- lationships between them” (Holland, 1973, 1985, p. 5). For purposes of precise model testing, however, there is no discernable difference between the simple circular arrangement hypothesis and the calculus hypothesis, since a statistical test of the RIASEC circular arrangement assumes the calculus hypothesis. In other words, an exact test of whether the six types are ordered in a circular fashion (R-I-A-S-E-C) assumes that the dis- tances between the adjacent types are smaller than the distances between alternate types, the distances between alternate types are smaller than the distances between opposite types, and so on. Since in both cases the author is testing an order hypothesis, we will use the term circular order hypothesis to refer to the exact testing of both the simple circular ar- rangement hypothesis and the calculus hypothesis.
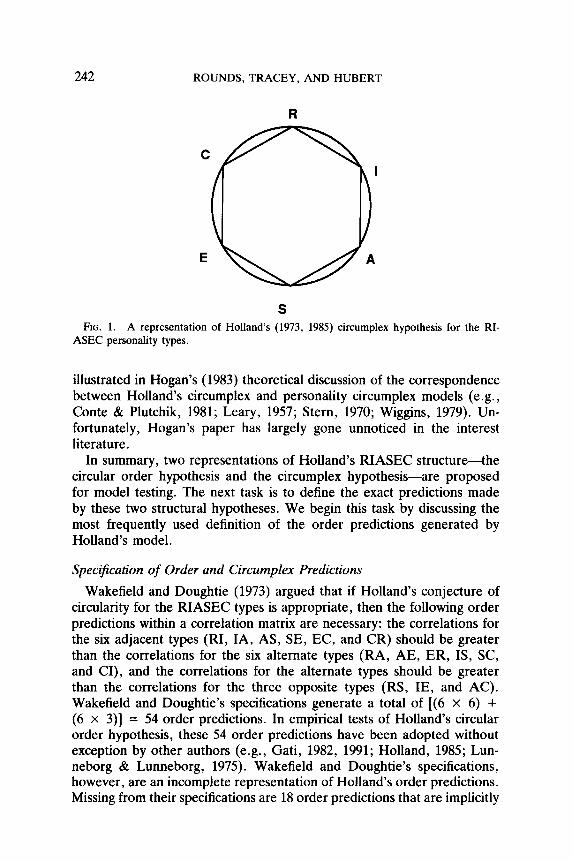
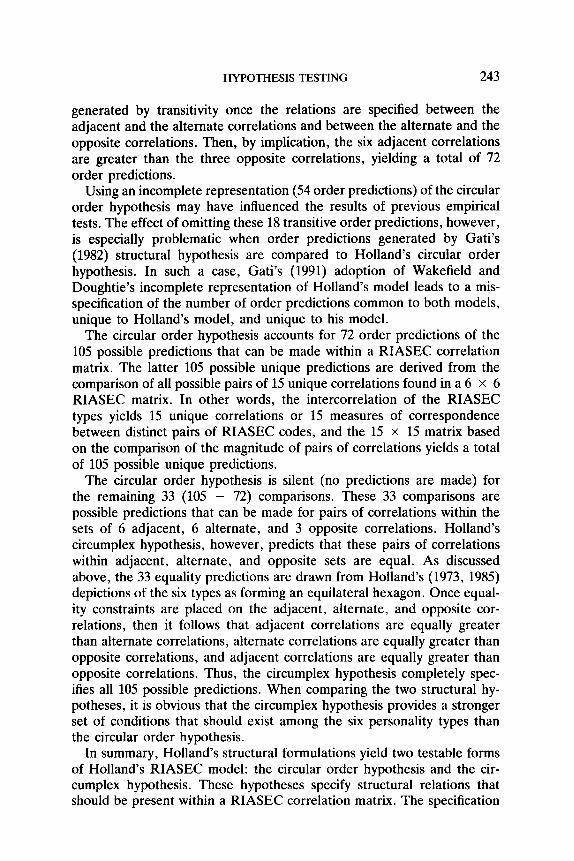
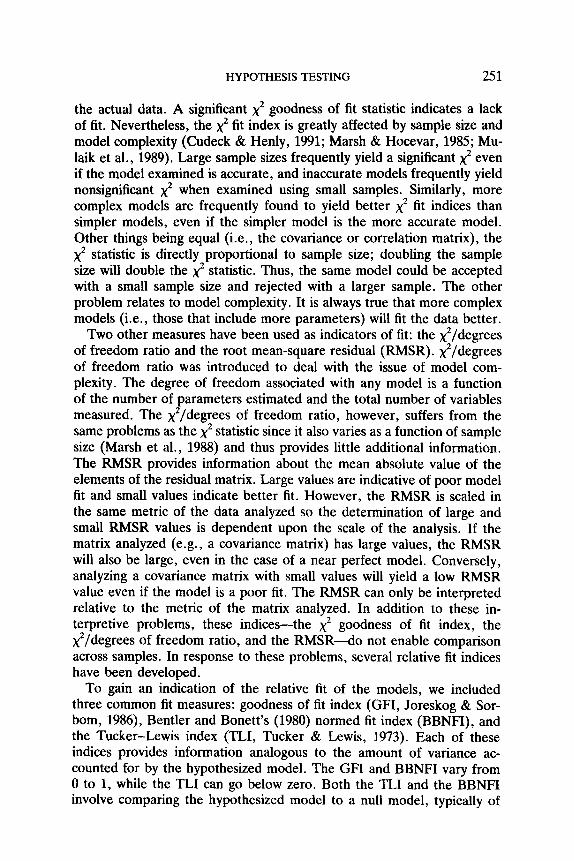
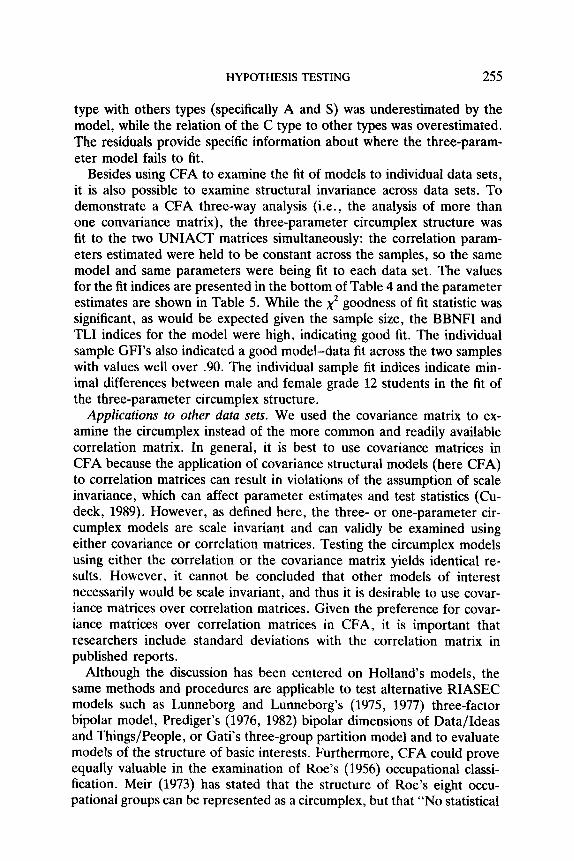
The hexagonal hypothesis was derived from Holland’s (1973, 1985) depictions of the six types as forming an equilateral hexagon. As shown in Fig. 1, the hexagonal structure (or a circle with equidistant points around the circumference) adds additional constraints on Holland’s cir- cular order hypothesis: the interpoint distances are equal for types within adjacent categories, alternate categories, and opposite categories. The latter equality constraints meet the requirements for an equally spaced circumplex (Guttman, 1954): a circular order of variables such that ad- jacent variables around the circle are equally correlated, alternate vari- ables are equally correlated, and opposite variables are equally correlated. Furthermore, correlations between adjacent variables are greater than the correlations between alternate variables and correlations between alter- nate variables are greater than the correlations between opposite variables. The fact that Holland’s hexagon is a circumplex has not gone entirely unnoticed (Fouad, Cudeck, & Hansen, 1984; Hogan, 1983; Trapnell, 1989). The importance of viewing the hexagon as a circumplex is best
242 ROUNDS, TRACEY, AND HUBERT
S FIG. 1. A representation of Holland’s (1973, 1985) circumplex hypothesis for the RI-
ASEC personality types.
illustrated in Hogan’s (1983) theoretical discussion of the correspondence between Holland’s circumplex and personality circumplex models (e.g., Conte & Plutchik, 1981; Leary, 1957; Stern, 1970; Wiggins, 1979). Un- fortunately, Hogan’s paper has largely gone unnoticed in the interest literature.
In summary, two representations of Holland’s RIASEC structure-the circular order hypothesis and the circumplex hypothesis-are proposed for model testing. The next task is to define the exact predictions made by these two structural hypotheses. We begin this task by discussing the most frequently used definition of the order predictions generated by Holland’s model.
Specification of Order and Circumplex Predictions
Wakefield and Doughtie (1973) argued that if Holland’s conjecture of circularity for the RIASEC types is appropriate, then the following order predictions within a correlation matrix are necessary: the correlations for the six adjacent types (RI, IA, AS, SE, EC, and CR) should be greater than the correlations for the six alternate types (RA, AE, ER, IS, SC, and CI), and the correlations for the alternate types should be greater than the correlations for the three opposite types (RS, IE, and AC). Wakefield and Doughtie’s specifications generate a total of [(6 x 6) + (6 x 3)] = 54 order predictions. In empirical tests of Holland’s circular order hypothesis, these 54 order predictions have been adopted without exception by other authors (e.g., Gati, 1982, 1991; Holland, 1985; Lun- neborg & Lunneborg, 1975). Wakefield and Doughtie’s specifications, however, are an incomplete representation of Holland’s order predictions. Missing from their specifications are 18 order predictions that are implicitly
HYPOTHESIS TESTING 243
generated by transitivity once the relations are specified between the adjacent and the alternate correlations and between the alternate and the opposite correlations. Then, by implication, the six adjacent correlations are greater than the three opposite correlations, yielding a total of 72 order predictions.
Using an incomplete representation (54 order predictions) of the circular order hypothesis may have influenced the results of previous empirical tests. The effect of omitting these 18 transitive order predictions, however, is especially problematic when order predictions generated by Gati’s (1982) structural hypothesis are compared to Holland’s circular order hypothesis. In such a case, Gati’s (1991) adoption of Wakefield and Doughtie’s incomplete representation of Holland’s model leads to a mis- specification of the number of order predictions common to both models, unique to Holland’s model, and unique to his model.
The circular order hypothesis accounts for 72 order predictions of the 105 possible predictions that can be made within a RIASEC correlation matrix. The latter 105 possible unique predictions are derived from the comparison of all possible pairs of 15 unique correlations found in a 6 x 6 RIASEC matrix. In other words, the intercorrelation of the RIASEC types yields 15 unique correlations or 15 measures of correspondence between distinct pairs of RIASEC codes, and the 15 x 15 matrix based on the comparison of the magnitude of pairs of correlations yields a total of 105 possible unique predictions.
The circular order hypothesis is silent (no predictions are made) for the remaining 33 (105 - 72) comparisons. These 33 comparisons are possible predictions that can be made for pairs of correlations within the sets of 6 adjacent, 6 alternate, and 3 opposite correlations. Holland’s circumplex hypothesis, however, predicts that these pairs of correlations within adjacent, alternate, and opposite sets are equal. As discussed above, the 33 equality predictions are drawn from Holland’s (1973, 1985) depictions of the six types as forming an equilateral hexagon. Once equal- ity constraints are placed on the adjacent, alternate, and opposite cor- relations, then it follows that adjacent correlations are equally greater than alternate correlations, alternate correlations are equally greater than opposite correlations, and adjacent correlations are equally greater than opposite correlations. Thus, the circumplex hypothesis completely spec- ifies all 105 possible predictions. When comparing the two structural hy- potheses, it is obvious that the circumplex hypothesis provides a stronger set of conditions that should exist among the six personality types than the circular order hypothesis.
In summary, Holland’s structural formulations yield two testable forms of Holland’s RIASEC model: the circular order hypothesis and the cir- cumplex hypothesis. These hypotheses specify structural relations that should be present within a RIASEC correlation matrix. The specification
244 ROUNDS, TRACEY, AND HUBERT
of the 54 order relations given by Wakefield and Doughtie is an incomplete representation of the RIASEC model. The appropriate specification of the relations generated by the two structural hypotheses requires 72 pre- dictions for the circular order model and 105 predictions for the circumplex model. The next task is to assess the magnitude of the violations of the two structural hypotheses. Therefore, we describe and illustrate two hy- pothesis-testing strategies: the randomization test to evaluate the less restrictive circular order hypothesis and confirmatory factor analysis to evaluate the more restrictive circumplex hypothesis. Since the most com- mon method to test the circular order hypothesis is a binomial test, we begin by discussing why the randomization test should replace the use of the binomial test.
HYPOTHESIS TESTING
Evaluating the Circular Order Hypothesis: Randomization Test of Hypothesized Order Relationships
Binomial test. The binomial test was proposed (Wakefield & Doughtie, 1973) to examine the extent to which a set of hypothesized order rela- tionships for pairs of correlations match the observed order relationships within a correlation matrix. The problem with the binomial test, or other statistical methods based on the binomial distribution, is its application to test ordered relations. The binomial test assumes that each comparison of a hypothesized order relation against the actual order is independent of the other comparisons, and all patterns of success and of failure satisfied by the set of hypothesized order relations are equally likely. This is an unreasonable assumption as a null conjecture, leading to an inappropriate inference procedure.
As an example, suppose that three correlations RI, RA, and RS are drawn from a RIASEC correlation matrix to test Holland’s order pre- dictions that the correlation of R and I is greater than the RA and RS correlations. There are six possible orderings of the three correlations:
(RI > RA> RS) (RI > RS > RA) (RA > RI > RS)
(RA > RS > RI) (RS > RI > RA) (RS > RA > RI)
If as a null conjecture, it is assumed that all six possible fixed orderings of the correlations are equally likely, and if it is known that RI > RA, then what would be the odds or probability that RI > RS? Under the binomial model the expected probability is .5. In the present case, the odds are 2 of 3 (p = .67) since there are only three sets of the six order relations where RI > RA and for two of these sets, RI > RS. With prior knowledge about one ordered comparison of pairs of correlations, the probability changes (to less or more likely) for the comparison of other pairs of correlations. Interestingly, the probability problem posed in the
HYPOTHESIS TESTING 245
present example is similar to the Monty Hall paradox, a probability prob- lem that has lead to a spirited public debate (Tierney, 1991). The correct answer to both problems is based on understanding how probability changes with partial information.
Hubert and Arabie (1987) proposed a randomization test to replace the use of the binomial test in evaluating hypotheses within a correlation matrix. (It should be noted that Hubert and Arabie’s inference strategy based on randomization is applicable to any proximity matrix.) Of the two interest models discussed above, the randomization method has direct applicability to testing the circular order hypothesis.
Randomization test. The randomization test uses a random relabeling strategy as a null conjecture to produce the exact probabilities that a certain number of the hypothesized order relations can be obtained by chance given a specific RIASEC correlation matrix. Explicitly, the ran- domization method begins by generating a distribution of the number of confirmed predictions based on the particular RIASEC correlation matrix being studied. The distribution is generated through a procedure called relabeling, which involves rearranging the rows and columns of the cor- relation matrix. After each unique rearrangement, the number of con- firmed predictions (or conversely the number of violations of the hy- pothesized order relations) is tabulated. The relabeling continues until all unique permutations of rows and columns are enumerated. Then, the exact probabilities are calculated under the null conjecture that all rela- belings are equally likely, that is, the probabilities that each possible number of confirmed conjectures could be obtained within the RIASEC correlation matrix. The p value is the proportion of times that the observed number of hypothesized predictions is met or exceeded in the set of all possible rearranged data matrices.
A detailed illustration of the randomization method using order pre- dictions from Holland’s model follows.
ZZlusfrutive RZASEC matrices. We selected two correlation matrices (see Table 1) based on the Unisex edition of the ACT Interest Inventory (UNIACT; American College Testing Program, 1988) to illustrate the randomization test of hypothesized order relationships (as well as confir- matory factor analysis discussed below). In the field of interest measure- ment, representative samples are rare; the American College Testing program samples, however, are an exception. The UNIACT Interest In- ventory provides six 15item scales corresponding to Holland’s six interest types (scale names with corresponding Holland types in parentheses fol- low): Technical (realistic), Science (investigative), Arts (artistic), Social Service (social), Business Contact (enterprising), Business Operations (conventional). The ACT matrices are based on grade 12 students (375 females and 358 males) randomly selected from the 1983 national norm group: a probability sample that closely approximates the 1980 U.S. Cen-
246 ROUNDS, TRACEY, AND HUBERT
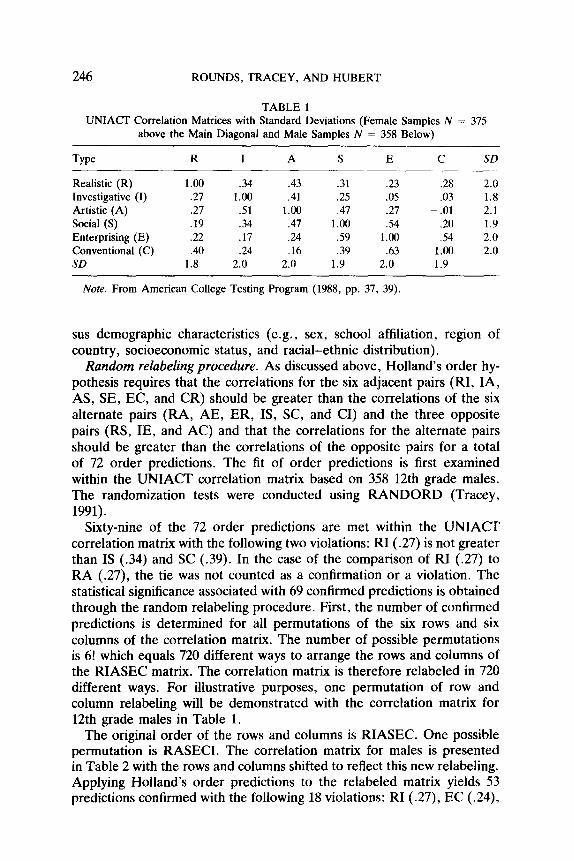
TABLE 1 UNIACT Correlation Matrices with Standard Deviations (Female Samples N = 375
above the Main Diagonal and Male Samples N = 358 Below)
Type R I A S E C SD
Realistic (R) 1.00 .34 .43 .31 .23 .28 2.0 Investigative (I) .27 1.00 .41 .25 .05 .03 1.8 Artistic (A) .27 .51 1.00 .47 .27 - .Ol 2.1 Social (S) .19 .34 .47 1.00 .54 .20 1.9 Enterprising (E) .22 .17 .24 .59 1.00 .54 2.0 Conventional (C) .40 .24 .16 .39 .63 1.00 2.0 SD 1.8 2.0 2.0 1.9 2.0 1.9
Note. From American College Testing Program (1988, pp. 37, 39).
sus demographic characteristics (e.g., sex, school affiliation, region of country, socioeconomic status, and racial-ethnic distribution).
Random relabeling procedure. As discussed above, Holland’s order hy- pothesis requires that the correlations for the six adjacent pairs (RI, IA, AS, SE, EC, and CR) should be greater than the correlations of the six alternate pairs (RA, AE, ER, IS, SC, and CI) and the three opposite pairs (RS, IE, and AC) and that the correlations for the alternate pairs should be greater than the correlations of the opposite pairs for a total of 72 order predictions. The fit of order predictions is first examined within the UNIACT correlation matrix based on 358 12th grade males. The randomization tests were conducted using RANDORD (Tracey, 1991).
Sixty-nine of the 72 order predictions are met within the UNIACT correlation matrix with the following two violations: RI (.27) is not greater than IS (.34) and SC (.39). In the case of the comparison of RI (.27) to RA (.27), the tie was not counted as a confirmation or a violation. The statistical significance associated with 69 confirmed predictions is obtained through the random relabeling procedure. First, the number of confirmed predictions is determined for all permutations of the six rows and six columns of the correlation matrix. The number of possible permutations is 6! which equals 720 different ways to arrange the rows and columns of the RIASEC matrix. The correlation matrix is therefore relabeled in 720 different ways. For illustrative purposes, one permutation of row and column relabeling will be demonstrated with the correlation matrix for 12th grade males in Table 1.
The original order of the rows and columns is RIASEC. One possible permutation is RASECI. The correlation matrix for males is presented in Table 2 with the rows and columns shifted to reflect this new relabeling. Applying Holland’s order predictions to the relabeled matrix yields 53 predictions confirmed with the following 18 violations: RI (.27), EC (.24),
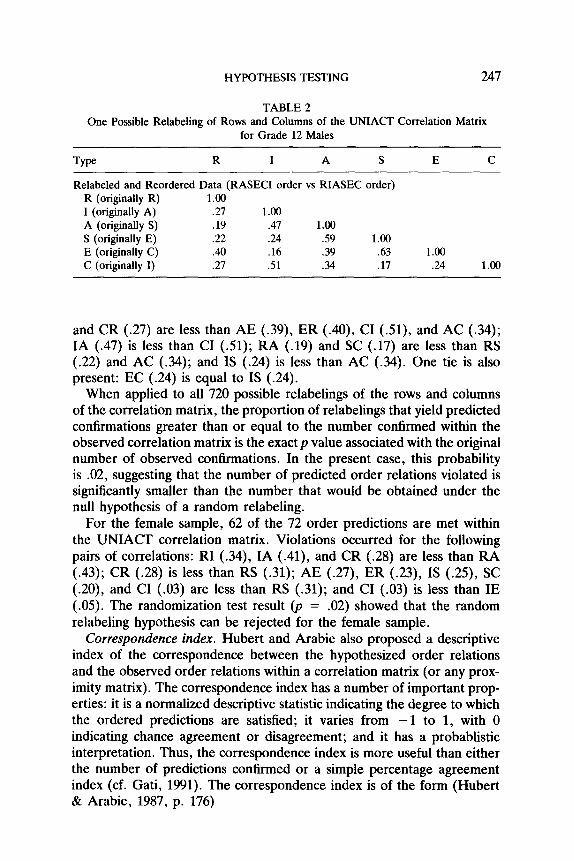
HYPOTHESIS TESTING 247
TABLE 2 One Possible Relabeling of Rows and Columns of the UNIACT Correlation Matrix
for Grade 12 Males
Type R I A S E C
Relabeled and Reordered Data (RASECI order vs RIASEC order) R (originally R) 1.00 I (originally A) .21 1.00 A (originally S) .19 A7 1.00 S (originally E) .22 .24 .59 1.00 E (originally C) .40 .16 .39 .63 1.00 C (originally I) .27 .51 .34 .17 .24 1.00
and CR (.27) are less than AE (.39), ER (.40), CI (Sl), and AC (.34); IA (.47) is less than CI (.51); RA (.19) and SC (.17) are less than RS (.22) and AC (.34); and IS (.24) is less than AC (.34). One tie is also present: EC (.24) is equal to IS (.24).
When applied to all 720 possible relabelings of the rows and columns of the correlation matrix, the proportion of relabelings that yield predicted confirmations greater than or equal to the number confirmed within the observed correlation matrix is the exact p value associated with the original number of observed confirmations. In the present case, this probability is .02, suggesting that the number of predicted order relations violated is significantly smaller than the number that would be obtained under the null hypothesis of a random relabeling.
For the female sample, 62 of the 72 order predictions are met within the UNIACT correlation matrix. Violations occurred for the following pairs of correlations: RI (.34), IA (.41), and CR (.28) are less than RA (.43); CR (.28) is less than RS (.31); AE (.27), ER (.23), IS (.25), SC (.20), and CI (.03) are less than RS (.31); and CI (.03) is less than IE (.05). The randomization test result @ = .02) showed that the random relabeling hypothesis can be rejected for the female sample.
Correspondence index. Hubert and Arabie also proposed a descriptive index of the correspondence between the hypothesized order relations and the observed order relations within a correlation matrix (or any prox- imity matrix). The correspondence index has a number of important prop- erties: it is a normalized descriptive statistic indicating the degree to which the ordered predictions are satisfied; it varies from - 1 to 1, with 0 indicating chance agreement or disagreement; and it has a probablistic interpretation. Thus, the correspondence index is more useful than either the number of predictions confirmed or a simple percentage agreement index (cf. Gati, 1991). The correspondence index is of the form (Hubert & Arabie, 1987, p. 176)
248 ROUNDS, TRACEY, AND HUBERT
A-D A+D+T’
where A is the number of order predictions met (agreements), D is the number of violations of the order predictions (disagreements), and T is the number of ties (the denominator, therefore, is the total number of order predictions). The correspondence index can be interpreted as the difference between two conditional probabilities with A/(A + D + T) being the probability that the order prediction is met and D/(A + D + T) being the probability that the order prediction is not met.
For the UNIACT matrices, the proportion of agreements was (69 - 2)/(69 + 2 + 1) = .93 for the male sample and (62 - 10)/(62 + 10 + 0) = .72 for the female sample, indicating that the males com- pared to the females accounted for more order relations among the RI- ASEC types. For both samples, substantial differences exist in the con- ditional probabilities for satisfying and not satisfying Holland’s order hypothesis. Males showed a .96 probability of obtaining an agreement versus a .03 probability of obtaining a disagreement with Holland’s order hypothesis. Similar values were found for the females with a .86 probability of agreement versus a .14 probability of disagreement.
Hubert and Arabie’s correspondence index is a sound measure for comparing order hypotheses across studies (matrices). In fact, the cor- respondence index is the only measure available that provides accurate information on the degree that an order hypothesis within a correlation (proximity) matrix was satisfied. The properties of this index allow direct comparison of competitive conjectures, comparison between matrices, and application of analytical techniques such as correlation or analysis of vari- ance to correspondence values. Descriptive differences, for example, could exist in the probabilities of obtaining an agreement versus a disagreement with an order hypothesis for males and females or for different RIASEC measures (e.g., Vocational Preference Inventory and Strong Interest In- ventory General Occupational Themes). For example, with more UN- IACT matrices than the present two, a statistical test could be conducted on the correspondence values to examine mean sex differences in satisfying Holland’s order hypothesis. An important application of the correspond- ence index and the randomization test will be to resolve claims of com- petitive interest models. For example, three order models have been put forth to account for the structure of Roe’s eight occupational groups: Roe’s (1956; Roe & Klos, 1969) circular ordering of occupations, Meir’s (1973) revision of Roe’s order hypothesis, and Gati’s (1982) three-group partition model. Using the correspondence index, appropriate and direct comparisons can be made between these order models across matrices based on Roe’s interest fields.
HYPOTHESIS TESTING 249
TABLE 3 Parameters Assumed within a RIASEC Correlation Matrix for a Three-Parameter (Above
Main Diagonal) and One-Parameter (Below Main Diagonal) Circumplex Structure
Type R I A S E C
Realistic (R) Investigative (I) Artistic (A) Social (S) Enterprising (E) Conventional (C)
-
3r4 2r4
2: 3r4
rl rz
3r, 2 2r4 3r4 r4 2r4
2r4 r4
r3 r2 rl r2 r3 h rl 5 r3
rz 3r, -? rl 2r4 3r4 -
Note. r, > r, > r,.
Evaluating the Circumplex Hypothesis: Conjirmatory Factor Analysis
The randomization test provides confirmatory information on order relations within a RIASEC correlation matrix. Holland (1973,1985), how- ever, has proposed a second form of the RIASEC model, called a hexagon, where equality constraints are placed on all adjacent, all alternate, and all opposite relations. Holland’s hexagonal hypothesis, more formally called a circumplex, requires the application of parametric methods that can test the value of these equality relations. As outlined by Joreskog (1974), confirmatory factor analysis (CFA) can be used to evaluate whether a pattern of covariation exists within a matrix that supports a given structural model, specifically, a circumplex. In addition, CFA allows direct examination and statistical testing of the extent that a configural structure varies across different samples defined by characteristics such as sex, age, and culture. In a review of the literature, Rounds (in press) found one published instance of the use of CFA to test a vocational interest structural hypothesis. Fouad et al. (1984) tested eight models of the relations among RIASEC types, finding that the circumplex pattern of relations appeared to be the most reasonable model.
Model specification. CFA involves specifying a hypothesized model, estimating parameters of the hypothesized model, and then assessing fit relative to the observed data. As presented by Guttman (1954) and Jo- reskog (1974), the circumplex can be operationalized using only three parameters to account for the relations within the RIASEC correlation matrix. This three-parameter model of the circumplex is presented in Table 3, above the main diagonal. One parameter represents the corre- lations between adjacent types (RI, IA, AS, SE, EC, and CR) and is labeled rl in Table 3; a second parameter represents the correlations between alternate types (RA, AE, ER, IS, SC, and CI) and is labeled r2; and a third parameter represents the correlations between opposite types (RS, IE, and AC) and is labeled r,. The correlations between each
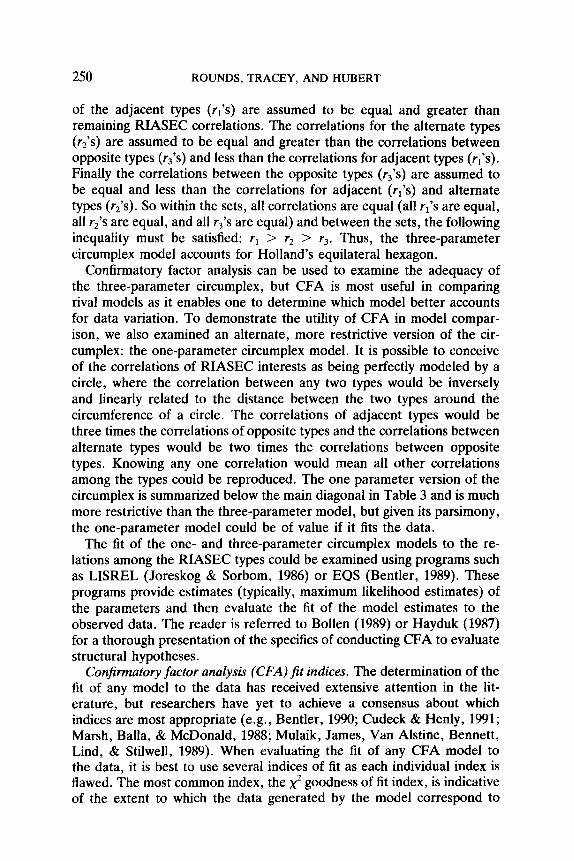
250 ROUNDS, TRACEY, AND HUBERT
of the adjacent types (rr’s) are assumed to be equal and greater than remaining RIASEC correlations. The correlations for the alternate types (r2’s) are assumed to be equal and greater than the correlations between opposite types (r3’s) and less than the correlations for adjacent types (T,‘s). Finally the correlations between the opposite types (r3’s) are assumed to be equal and less than the correlations for adjacent (r,‘s) and alternate types (r*‘s). So within the sets, all correlations are equal (all rr’s are equal, all r,‘s are equal, and all r3’s are equal) and between the sets, the following inequality must be satisfied: rl > r, > r,. Thus, the three-parameter circumplex model accounts for Holland’s equilateral hexagon.
Confirmatory factor analysis can be used to examine the adequacy of the three-parameter circumplex, but CFA is most useful in comparing rival models as it enables one to determine which model better accounts for data variation. To demonstrate the utility of CFA in model compar- ison, we also examined an alternate, more restrictive version of the cir- cumplex: the one-parameter circumplex model. It is possible to conceive of the correlations of RIASEC interests as being perfectly modeled by a circle, where the correlation between any two types would be inversely and linearly related to the distance between the two types around the circumference of a circle. The correlations of adjacent types would be three times the correlations of opposite types and the correlations between alternate types would be two times the correlations between opposite types. Knowing any one correlation would mean all other correlations among the types could be reproduced. The one parameter version of the circumplex is summarized below the main diagonal in Table 3 and is much more restrictive than the three-parameter model, but given its parsimony, the one-parameter model could be of value if it fits the data.
The fit of the one- and three-parameter circumplex models to the re- lations among the RIASEC types could be examined using programs such as LISREL (Joreskog & Sorbom, 1986) or EQS (Bentler, 1989). These programs provide estimates (typically, maximum likelihood estimates) of the parameters and then evaluate the fit of the model estimates to the observed data. The reader is referred to Bollen (1989) or Hayduk (1987) for a thorough presentation of the specifics of conducting CFA to evaluate structural hypotheses.
Confirmatory factor analysis (CFA) fit indices. The determination of the fit of any model to the data has received extensive attention in the lit- erature, but researchers have yet to achieve a consensus about which indices are most appropriate (e.g., Bentler, 1990; Cudeck & Henly, 1991; Marsh, Balla, & McDonald, 1988; Mulaik, James, Van Alstine, Bennett, Lind, & Stilwell, 1989). When evaluating the fit of any CFA model to the data, it is best to use several indices of fit as each individual index is flawed. The most common index, the x2 goodness of fit index, is indicative of the extent to which the data generated by the model correspond to
HYPOTHESIS TESTING 251
the actual data. A significant x2 goodness of fit statistic indicates a lack of fit. Nevertheless, the x2 fit index is greatly affected by sample size and model complexity (Cudeck & Henly, 1991; Marsh & Hocevar, 1985; Mu- laik et al., 1989). Large sample sizes frequently yield a significant x2 even if the model examined is accurate, and inaccurate models frequently yield nonsignificant x2 when examined using small samples. Similarly, more complex models are frequently found to yield better x2 fit indices than simpler models, even if the simpler model is the more accurate model. Other things being equal (i.e., the covariance or correlation matrix), the x2 statistic is directly proportional to sample size; doubling the sample size will double the x2 statistic. Thus, the same model could be accepted with a small sample size and rejected with a larger sample. The other problem relates to model complexity. It is always true that more complex models (i.e., those that include more parameters) will fit the data better.
Two other measures have been used as indicators of fit: the x2/degrees of freedom ratio and the root mean-square residual (RMSR). x2/degrees of freedom ratio was introduced to deal with the issue of model com- plexity. The degree of freedom associated with any model is a function of the number of parameters estimated and the total number of variables measured. The x*/degrees of freedom ratio, however, suffers from the same problems as the x2 statistic since it also varies as a function of sample size (Marsh et al., 1988) and thus provides little additional information. The RMSR provides information about the mean absolute value of the elements of the residual matrix. Large values are indicative of poor model fit and small values indicate better fit. However, the RMSR is scaled in the same metric of the data analyzed so the determination of large and small RMSR values is dependent upon the scale of the analysis. If the matrix analyzed (e.g., a covariance matrix) has large values, the RMSR will also be large, even in the case of a near perfect model. Conversely, analyzing a covariance matrix with small values will yield a low RMSR value even if the model is a poor fit. The RMSR can only be interpreted relative to the metric of the matrix analyzed. In addition to these in- terpretive problems, these indices-the x2 goodness of fit index, the x’/degrees of freedom ratio, and the RMSR-do not enable comparison across samples. In response to these problems, several relative fit indices have been developed.
To gain an indication of the relative fit of the models, we included three common fit measures: goodness of fit index (GFI, Joreskog & Sor- born, 1986), Bentler and Bonett’s (1980) normed fit index (BBNFI), and the Tucker-Lewis index (TLI, Tucker & Lewis, 1973). Each of these indices provides information analogous to the amount of variance ac- counted for by the hypothesized model. The GFI and BBNFI vary from 0 to 1, while the TLI can go below zero. Both the TLI and the BBNFI involve comparing the hypothesized model to a null model, typically of
252 ROUNDS, TRACEY, AND HUBERT
no relations among the variables. The TLI also takes account of the complexity of the model and thus incorporates parsimony as part of its computation. The TLI has been demonstrated to be the least susceptible to the effects of sample size (Marsh et al., 1988). These indices enable comparison of model fit to be made across different models and samples. Besides yielding information of relative fit of one model versus another, Bentler and Bonett (1980) suggest using a BBNFI value of .90 as a cutoff in determining whether a model fits the data. However, Marsh et al. (1988) demonstrated that the BBNFI and the GFI (along with over 20 other similar indices) are greatly affected by sample size, which makes cutoff recommendations of BBNFI values of .90 somewhat questionable.
The fit of any model to the data is a function of many things including, but not limited to: strength of and specificity of the theory underlying the model, adequacy of the measures, quality of the sampling, sample size, and model complexity. There are no absolute criteria for good and poor fit. All the information must be weighed in the determination of adequacy.
Application to UNIACT matrices. The UNIACT covariance matrices generated from the information (correlations and standard deviations) in Table 1 were each examined with respect to model fit using LISREL (Joreskog & Sorbom, 1986) and the maximum likelihood method of es- timation. For each model, the parameter restrictions depicted in Table 3 were fit to the correlations among the RIASEC factors. Although Table 3 specifies that rl > r, > r3, it is not possible to implement inequality constraints in LISREL, so only the equality constraints were imposed. If the parameter estimates do not meet the theoretically specified inequal- ities, the circumplex model would be discarded or the model would be reestimated with the terms that do not satisfy the theoretical inequalities constrained to be equal. The parameter estimates yielded in the present study satisfied the theoretically derived inequality constraints. If there is a possibility that the inequality constraints may be violated when left unconstrained, EQS (Bentler, 1989) could be used instead of LISREL. EQS enables the imposition of inequality constraints, although technically it cannot estimate greater than and less than, but must estimate greater than or equal to and less than or equal to.
The fit indices for the three- and one-parameter circumplex models by sample are reported in Table 4 and the values of the parameter estimates are presented in Table 5. The parameter estimates listed in Table 5 should be interpreted as correlations among the RIASEC factors. Each model yielded significant x2 goodness of fit indices in each sample, but this finding is not surprising given the sample sizes and the restrictive nature of the models. Examination of the other fit indices demonstrates that: (a) the three-parameter circumplex fit the data slightly better than the one-pa- rameter circumplex for both males and females, and (b) both circumplex models fit the male sample better than the female sample.
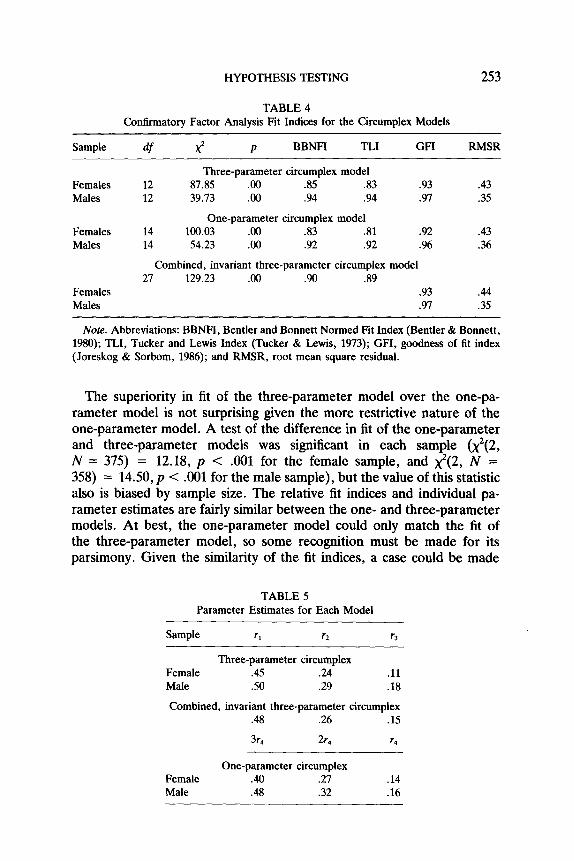
HYPOTHESIS TESTING 253
TABLE 4 Confirmatory Factor Analysis Fit Indices for the Ciicumplex Models
Sample df X2 P BBNFI TLI GFI RMSR
Females Males
Females Males
Females Males
Three-parameter circumplex model 12 87.85 .oo .85 .83 .93 12 39.13 .oo .94 .94 .97
One-parameter circumplex model 14 100.03 .oo .83 .81 .92 14 54.23 .oo .92 .92 .%
Combined, invariant three-parameter circumplex model 27 129.23 .oo .90 .89
.93
.97
.43
.35
.43
.36
A4 .35
Note. Abbreviations: BBNFI, Bentler and Bonnett Normed Fit Index (Bentler & Bonnett, 1980); TLI, Tucker and Lewis Index (Tucker & Lewis, 1973); GFI, goodness of fit index (Joreskog & Sorbom, 1986); and RMSR, root mean square residual.
The superiority in fit of the three-parameter model over the one-pa- rameter model is not surprising given the more restrictive nature of the one-parameter model. A test of the difference in fit of the one-parameter and three-parameter models was significant in each sample (x2(2, N = 375) = 12.18, p < JO1 for the female sample, and x2(2, N = 358) = 14.50, p < .OOl for the male sample), but the value of this statistic also is biased by sample size. The relative fit indices and individual pa- rameter estimates are fairly similar between the one- and three-parameter models. At best, the one-parameter model could only match the fit of the three-parameter model, so some recognition must be made for its parsimony. Given the similarity of the fit indices, a case could be made
TABLE 5 Parameter Estimates for Each Model
Sample rl
Three-parameter circumplex Female .45 .24 .ll Male .50 .29 .18
Combined, invariant three-parameter circumplex .48 .26 .15
3r, 2r4 7.4
Female Male
One-parameter circumplex .40 .27 .48 .32
.14
.16
254 ROUNDS, TRACEY, AND HUBERT
TABLE 6 Normalized Residuals from the Three-Parameter Circumplex Model
T-e R
Realistic (R) -1.57 Investigative (I) -1.71 Artistic (A) 3.49 Social (S) 3.62 Enterprising (E) -.I3 Conventional (C) -2.78
I A S E C
Female sample
-1.65 -.64 .53
.24 .41 .45 - 1.23 .68 1.76 2.26 - 3.63 -2.38 - .70 1.72 -.28
Realistic (R) Investigative (I) Artistic (A) Social (S) Enterprising (E) Conventional (C)
Male sample - 1.52 -3.45 - 1.21 - .32 .14 -.33
.21 .90 - .54 .74 -1.21 - .15 -.94 1.60 1.80 -1.63 -.89 -.34 1.95 2.24 1.17
for accepting either circumplex model because, although the three-pa- rameter model fits slightly better, the one-parameter model is more par- simonious. Given the greater familiarity with the three-parameter model, we will focus on this model instead of the one-parameter model, although the one-parameter model appears promising.
Both circumplex models fit the male data better than the female data. The fit indices for the three-parameter model when applied to the male sample were all high. The same fit values for the three-parameter model from the female sample were less uniformly high: the GFI and TLI were fairly high (i.e., GFI greater than 90 and TLI greater than SO), but the BBNFI was below Bentler and Bonett’s (1980) cutoff value of .90. Relative to the male sample, the three-parameter model for the females presents a poorer fit to the RIASEC relations.
An inspection of the normalized residual matrices for the three-param- eter model for each sample, presented in Table 6, sheds light on the male- female differences in model-data fit. Those residuals greater in absolute value than the typical cutoff of 2.0 indicate the correlations that were not well accounted for by the model. For the male sample, two of the residuals exceeded the 2.0 cutoff. The two large normalized residuals for the male sample were RI (the correlation of which was overestimated in the model) and EC (which was underestimated). The other residuals were below the cutoff indicating adequate model fit. Six residuals for the female sample had an absolute value greater than 2.0: RA, RS, CR, CI, AC, and EE. The three-parameter circumplex was not as adequately representing the relations of the R and C types with other types. The relation of the R
HYPOTHESIS TESTING 255
type with others types (specifically A and S) was underestimated by the model, while the relation of the C type to other types was overestimated. The residuals provide specific information about where the three-param- eter model fails to fit.
Besides using CFA to examine the fit of models to individual data sets, it is also possible to examine structural invariance across data sets. To demonstrate a CFA three-way analysis (i.e., the analysis of more than one convariance matrix), the three-parameter circumplex structure was fit to the two UNIACT matrices simultaneously: the correlation param- eters estimated were held to be constant across the samples, so the same model and same parameters were being fit to each data set. The values for the fit indices are presented in the bottom of Table 4 and the parameter estimates are shown in Table 5. While the x2 goodness of fit statistic was significant, as would be expected given the sample size, the BBNFI and TLI indices for the model were high, indicating good fit. The individual sample GFT’s also indicated a good model-data fit across the two samples with values well over .90. The individual sample fit indices indicate min- imal differences between male and female grade 12 students in the fit of the three-parameter circumplex structure.
Applications to other data sets. We used the covariance matrix to ex- amine the circumplex instead of the more common and readily available correlation matrix. In general, it is best to use covariance matrices in CFA because the application of covariance structural models (here CFA) to correlation matrices can result in violations of the assumption of scale invariance, which can affect parameter estimates and test statistics (Cu- deck, 1989). However, as defined here, the three- or one-parameter cir- cumplex models are scale invariant and can validly be examined using either covariance or correlation matrices. Testing the circumplex models using either the correlation or the covariance matrix yields identical re- sults. However, it cannot be concluded that other models of interest necessarily would be scale invariant, and thus it is desirable to use covar- iance matrices over correlation matrices. Given the preference for covar- iance matrices over correlation matrices in CFA, it is important that researchers include standard deviations with the correlation matrix in published reports.
Although the discussion has been centered on Holland’s models, the same methods and procedures are applicable to test alternative RIASEC models such as Lunneborg and Lunneborg’s (1975, 1977) three-factor bipolar model, Prediger’s (1976, 1982) bipolar dimensions of Data/Ideas and Things/People, or Gati’s three-group partition model and to evaluate models of the structure of basic interests. Furthermore, CFA could prove equally valuable in the examination of Roe’s (1956) occupational classi- fication. Meir (1973) has stated that the structure of Roe’s eight occu- pational groups can be represented as a circumplex, but that “No statistical
256 ROUNDS, TRACEY, AND HUBERT
test has yet been devised for verifying the significance of deviations from a given structure of correlations. . .” (p. 24). The development of CFA
now enables this direct examination of the fit of the circumplex to Roe’s occupational groups.
CONCLUDING COMMENTS
It is disconcerting to realize after 20 years of study that basic questions remain about the structure of Holland’s RIASEC types and Roe’s interest fields. By the mid-1980s, over 40 studies had been published evaluating one or more structure-of-interest models, but depending on who you read and what they had read, opinions varied on how well the Holland, Roe, or Gati models fit the data (see Gati, 1991; Holland, 1985; Rounds, in press; Rounds & Zevon, 1983; and Spokane, 1985, for reviews). We have suggested one important remedy: the development of clear model spec- ifications and the use of appropriate and direct statistical tests of structural hypotheses.
Nevertheless, given these conflicting opinions about interest models, we see two additional problems that, if resolved, would further the un- derstanding of structure-of-interest models. One problem concerns the comparison of vocational interest models and circumstances under which one model would be adopted over another model (e.g., Holland’s circular order hypothesis versus Gati’s model). The statistical methods and pro- cedures discussed in the present article can be used to compare alternative models, but more thought is needed about how to distinguish which model is better or should be adopted when the models under consideration lead to a different number of predictions. For example, Holland’s circular order hypothesis generates 72 order predictions, but Gati’s (1982) three-group partition model generates only 36 predictions about the relations among RIASEC types. It is apparent that there is no straightforward statistical procedure to distinguish which model is better or which model should be adopted. The issue of model comparison certainly needs more discussion.
Another problem is how to integrate the existing studies of structural relations to arrive at more precise conclusions. It is not surprising to find a variety of conclusions since, typically, reviews of structural hypotheses relied on a few selected studies and used narrative approaches to arrive at conclusions. It seems that a different strategy from the traditional narrative review is needed, a strategy like meta-analysis that can more precisely and systematically evaluate correlation or covariance matrices across a variety of measures and samples.
Existing statistical methods are available that can handle three-way data (i.e., more than one covariance or correlation matrix). Confirmatory factor analysis is one of several standard multivariate methods that has been extended to three-way data (see the combined invariant analysis above); multidimensional scaling and cluster analysis also can be used to analyze
HYPOTHESIS TESTING 257
three-way data (see Arabie, Carroll, & DeSarbo, 1987; Rounds, in press). These three-way methods yield a group solution (i.e., an analysis of the total set of correlation matrices) and various indices that represent the model-data fit for each of the individual correlation matrices. Thus, three- way approaches to synthesizing the correlational results from existing studies may lead to more precise conclusions about how well different vocational interest models fit the data.
REFERENCES American College Testing Program. (1988). Interim psychometric handbook for the 3rd
edition, ACT career planning program. Iowa City, IA: Author. Arabie, P., Carroll, J. D., & DeSarbo, W. S. (1987). Three-way scaling and clustering.
Beverly Hills, CA: Sage. Bender, P. M. (1989). EQS: Structural equations program manual. Los Angeles: BMDP. Bentler, P. M. (1990). Comparative fit indices in structural models. Psychological Bulletin,
107, 238-246. Bentler, P. M., & Bonett, D. G. (1980). Significance tests and goodness of fit in the analysis
of covariance structures. Psychological Bulletin, 88, 588-606. Bobeie, R. M., Alston, H. L., Wakefield, J. A., & Doughtie, E. B. (1976). A comparison
of Holland’s model using constructs measured by two different methods. Journal of Vocational Behavior, 9, 245-250.
Bobele, R. M., Alston, H. L., Wakefield, J. A., & Schnitzen, J. P. (1975). Relationship among Holland’s personality types measured by an adjective checklist. Journal of Vo- cational Behavior, 7, 201-206.
Bollen, K. A. (1989). Structural equations with latent variables. New York: Wiley. Conte, H. R., & Plutchik, R. A. (1981). A circumplex model for interpersonal personality
traits. Journal of Personality and Social Psychology, 49, 701-714. Cudeck, R. (1989). Analysis of correlation matrices using covariance structure models.
Psychological Bulletin, 105, 317-327. Cudeck, R., & Henly, S. J. (1991). Model selection in covariance structures analysis and
the “problem” of sample size: A clarification. Psychological Bulletin, 109, 512-519. Fouad, N. A., Cudeck, R., & Hansen, J. C. (1984). Convergent validity of the Spanish
and English forms of the Strong-Campbell Interest Inventory for bilingual Hispanic high school students. Journal of Counseling Psychology, 31, 339-348.
Gati, I. (1979). A hierarchical model for the structure of vocational interests. Journal of Vocational Behavior, 15, 90-106.
Gati, I. (1982). Testing models for the structure of vocational interests. Journal of Vocational Behavior, 21, 164-182.
Gati, I. (1984). On the perceived structure of occupations. Journal of Vocational Behavior, 25, l-29.
Gati, I. (1991). The structure of vocational interests. Psychological Bulletin, 109, 309-324. Gati, I., & Winer, D. (1987). Using career grid data to compare models of the structure
of occupations. Career Development Quarterly, 36, 126-139. Guttman, L. R. (1954). A new approach to factor analysis: The radex. In P. F. Lazarsfeld
(Ed.), Mathematical thinking in the social sciences (pp. 258-348). New York: Columbia University Press.
Hansen, J. C., & Campbell, D. P. (1985). Manual for the SVIB-SCII Strong-Campbell Interest Inventory (4th ed.). Palo Alto, CA: Consulting Psychologist Press.
Harrington, T. F., & O’Shea, A. T. (1982). The Harrington-O’Shea Career Decision-Making System manuul. Circle Pines, MN: American Guidance Service.
258 ROUNDS, TRACEY, AND HUBERT
Hayduk, L. A. (1987). Structural equation modeling with LISREL. Baltimore: Johns-Hop- kins.
Hogan, R. (1983). A socioanalytic theory of personality. In M. M. Page (Ed.), Nebraska symposium on motivation 1982. Personality: Current theory and research (pp. 55-89). Lincoln, NE: Univ. of Nebraska Press.
Holland, J. L. (1973). Making vocational choices: A theory of careers. Englewood Cliffs, NJ: Prentice-Hall.
Holland, J. L. (1985). Making vocational choices: A theory of vocational personalities and work environments (2nd ed.). Englewood Cliffs, NJ: Prentice-Hall.
Holland, J. L. (1987). 1987 manual supplement for the Self-Directed Search. Odessa, FL: Psychological Assessment Resources.
Hubert, L., & Arabie, P. (1987). Evaluating order hypotheses within proximity matrices. Psychological Bulletin, 102, 172-178.
Joreskog, K. G. (1974). Analyzing psychological data by structural analysis of covariance matrices. In R. C. Atkinson, D. H. Krantz, R. D. Lute, & P. Suppes (Eds.), Con- temporary developments in mathematical psychology (Vol. 2, pp. l-56). San Francisco: Freeman.
Joreskog, K. G., & Sorbom, D. (1986). LISREL: Analysis of linear structural relationships by the method of maximum likelihood. Mooresville, IN: Scientific Software.
Leary, T. (1957). Interpersonal diagnosis of personality. New York: Ronald Press. Lunneborg, C. E., Kt Lunneborg, P. W. (1975). Factor structure of the vocational interest
models of Roe and Holland. Journal of Vocational Behavior, 7, 313-326. Lunneborg, C. E., & Lunneborg, P. W. (1977). Is there room for a third dimension in
vocational differentiation? Journal of Vocational Behavior, 11, 120-127. Marsh, H. W., Balla, J. R., & McDonald, R. P. (1988). Goodness of fit indexes in con-
firmatory factor analysis: The effects of sample size. Psychological Bulletin, 103, 391- 410.
Marsh, H. W., & Hocevar, D. (1985). Application of confirmatory factor analysis to the study of self-concept: First and higher-order factor models and their invariance across groups. Psychological Bulletin, 97, 562-582.
Meir, E. I. (1973). The structure of occupations by interests--A smallest space analysis. Journal of Vocational Behavior, 3, 21-31.
Mulaik, S. A., James, L. R., Van Alstine, J., Bennett, N., Lind, S., & Stilwell, C. D. (1989). Evaluation of goodness-of-fit indices for structural equation models. Psycho- logical Bulletin, 105, 430-445.
Prediger, D. J. (1976). A world-of-work map for career exploration. Vocational Guidance Quarterly, 24, 198-208.
Prediger, D. J. (1982). Dimensions underlying Holland’s hexagon: Missing link between interests and occupations? Journal of Vocational Behavior, 21, 259-287.
Roe, A. (1956). The psychology of occupations. New York: Wiley. Roe, A., & Klos, D. (1969). Occupation classification. Counseling Psychologist, 1, 84-89. Rounds, J. B. (in press). Vocational interests: Evaluating structural hypotheses. In R. V.
Dawis & D. Lubinski (Eds.), Assessing individual differences in human behavior: New concepts, methods, and findings. Minneapolis, MN: Univ. of Minnesota Press.
Rounds, J. B., Davison, M. L., & Dawis, R. V. (1979). The fit between Strong-Campbell Interest Inventory General Occupational Themes and Holland’s hexagonal model. Jour- nal of Vocational Behavior, 15, 303-315.
Rounds, J. B., & Zevon, M. A. (1983). Multidimensional scaling research in vocational psychology. Applied Psychological Measurement, 7, 491-510.
Spokane, A. R. (1985). A review of research on person-environment congruence in Hol- land’s theory of careers. Journal of Vocational Behavior, 26, 306-343.
HYPOTHESIS TESTING 259
Stern, G. G. (1970). People in context: Measuring person-environment congruence in ed- ucation and industry. New York: Wiley.
Thurstone, L. L. (1931). A multiple factor study of vocational interests. Personnel Journal, 10, 198-205.
Tiemey, .I. (1991, July 21). Behind Monty Hall’s doors: Puzzle, debate and answer? The New York Times, pp. 1, 20.
Tracey, T. J. (1991). RANDORD: A program for evaluating Holland’s and Gati’s order hypotheses using the randomization test of hypothesized order relationships (Computer program). Champaign, IL: Department of Educational Psychology, Univ. of Illinois at Urbana-Champaign.
Trapnell, P. D. (1989). Structural validity in the measurement of Holland’s vocational ty- pology: A measure of Holland’s types scaled to an explicit circumplex model. Unpublished master’s thesis. University of British Columbia, Vancouver, Canada.
Tuck, B. F., & Keeling, B. (1980). Sex and cultural differences in factorial structure of the Self-Directed Search. Journal of Vocational Behavior, 16, 105-114.
Tucker, L. R., & Lewis, C. (1973). The reliability coefficient for maximum likelihood factor analysis. Psychometrika, 38, l-10.
Wakefield, J. A., & Doughtie, E. B. (1973). The.geometric relationship between Holland’s personality typology and the Vocational Preference Inventory. Journal of Counseling Psychology, 20, 513-518.
Wiggins, J. S. (1979). A psychological taxonomy of trait-descriptive terms: The interpersonal domain. Journal of Personality and Social Psychology, 37, 395-412.
Received: August 9, 1991
Related Documents