Methods for Assessing Racial/Ethnic Disproportionality in Special Education A Technical Assistance Guide (Revised) May 2014 Julie M. Bollmer James W. Bethel Tom E. Munk Amy R. Bitterman www.ideadata.org

Welcome message from author
This document is posted to help you gain knowledge. Please leave a comment to let me know what you think about it! Share it to your friends and learn new things together.
Transcript
Methods for Assessing Racial/Ethnic Disproportionality in Special Education
A Technical Assistance Guide (Revised)
May 2014
Julie M. Bollmer
James W. Bethel
Tom E. Munk
Amy R. Bitterman
www.ideadata.org

The IDEA Data Center (IDC) produced this document under U.S. Department of Education, Office of Special Education Programs Grant No. H373Y130002. Richelle Davis and Meredith Miceli serve as the project officers. This is a revision of the document originally published by the Data Accountability Center (DAC) under U.S. Department of Education, Office of Special Education Programs Grant No. H373Y070002.
The views expressed herein do not necessarily represent the positions or policies of the Department of Education. No official endorsement by the U.S. Department of Education of any product, commodity, service or enterprise mentioned in this publication is intended or should be inferred. This product is public domain. Authorization to reproduce it in whole or in part is granted.
Westat is the lead organization for IDC. For more information about the center’s work and its partners, see www.ideadata.org.
Suggested Citation:
IDEA Data Center (May, 2014). Methods for Assessing Racial/Ethnic Disproportionality in Special Education: A Technical Assistance Guide (Revised), Westat, Rockville, MD, Julie Bollmer, Jim Bethel, Tom Munk, and Amy Bitterman.

Methods for Assessing Racial/Ethnic Disproportionality in Special Education A Technical Assistance Guide (Revised)
www.ideadata.org I
Table of Contents
Chapter 1 Introduction . . . . . . . . . . . . . . . . . . . . . . . . . . . . . . . . . . . . . . . . . . . . . . . . . . . . . . . . . . . . . . . . . . . . . . . . . . . . . . . . . . . 1
Overview. . . . . . . . . . . . . . . . . . . . . . . . . . . . . . . . . . . . . . . . . . . . . . . . . . . . . . . . . . . . . . . . . . . . . . . . . . . . . . . . . . . . . . . . . . . . . . . . . . . . . . . . . . . . . . . 1
Purpose of Technical Assistance Guide and Intended Audience. . . . . . . . . . . . . . . . . . . . . . . . . . . . . . . . . . . . . . . . . . . . . . . . . . . . . . . . . . . 1
New Racial/Ethnic Reporting Categories. . . . . . . . . . . . . . . . . . . . . . . . . . . . . . . . . . . . . . . . . . . . . . . . . . . . . . . . . . . . . . . . . . . . . . . . . . . . . . . . . 2
Minimum Cell Sizes . . . . . . . . . . . . . . . . . . . . . . . . . . . . . . . . . . . . . . . . . . . . . . . . . . . . . . . . . . . . . . . . . . . . . . . . . . . . . . . . . . . . . . . . . . . . . . . . . . . . . 3
Thresholds . . . . . . . . . . . . . . . . . . . . . . . . . . . . . . . . . . . . . . . . . . . . . . . . . . . . . . . . . . . . . . . . . . . . . . . . . . . . . . . . . . . . . . . . . . . . . . . . . . . . . . . . . . . . . 3
Chapter 2 Data Analysis Categories and Data Exhibits . . . . . . . . . . . . . . . . . . . . . . . . . . . . . . . . . . . . . . 4
Data Analysis Categories. . . . . . . . . . . . . . . . . . . . . . . . . . . . . . . . . . . . . . . . . . . . . . . . . . . . . . . . . . . . . . . . . . . . . . . . . . . . . . . . . . . . . . . . . . . . . . . . 4
Identification . . . . . . . . . . . . . . . . . . . . . . . . . . . . . . . . . . . . . . . . . . . . . . . . . . . . . . . . . . . . . . . . . . . . . . . . . . . . . . . . . . . . . . . . . . . . . . . . . . . . . . . . . . . 4
Placement. . . . . . . . . . . . . . . . . . . . . . . . . . . . . . . . . . . . . . . . . . . . . . . . . . . . . . . . . . . . . . . . . . . . . . . . . . . . . . . . . . . . . . . . . . . . . . . . . . . . . . . . . . . . . . 4
Discipline . . . . . . . . . . . . . . . . . . . . . . . . . . . . . . . . . . . . . . . . . . . . . . . . . . . . . . . . . . . . . . . . . . . . . . . . . . . . . . . . . . . . . . . . . . . . . . . . . . . . . . . . . . . . . . 4
Rounding . . . . . . . . . . . . . . . . . . . . . . . . . . . . . . . . . . . . . . . . . . . . . . . . . . . . . . . . . . . . . . . . . . . . . . . . . . . . . . . . . . . . . . . . . . . . . . . . . . . . . . . . . . . . . . 5
Comparison Groups . . . . . . . . . . . . . . . . . . . . . . . . . . . . . . . . . . . . . . . . . . . . . . . . . . . . . . . . . . . . . . . . . . . . . . . . . . . . . . . . . . . . . . . . . . . . . . . . . . . . 5
District-Level Data vs. State-Level Data . . . . . . . . . . . . . . . . . . . . . . . . . . . . . . . . . . . . . . . . . . . . . . . . . . . . . . . . . . . . . . . . . . . . . . . . . . . . . . . . . . 5
Total Enrollment Data vs. Child Count Data . . . . . . . . . . . . . . . . . . . . . . . . . . . . . . . . . . . . . . . . . . . . . . . . . . . . . . . . . . . . . . . . . . . . . . . . . . . . . . 5
All Other Children vs. All Children . . . . . . . . . . . . . . . . . . . . . . . . . . . . . . . . . . . . . . . . . . . . . . . . . . . . . . . . . . . . . . . . . . . . . . . . . . . . . . . . . . . . . . . 5
Data Anomalies . . . . . . . . . . . . . . . . . . . . . . . . . . . . . . . . . . . . . . . . . . . . . . . . . . . . . . . . . . . . . . . . . . . . . . . . . . . . . . . . . . . . . . . . . . . . . . . . . . . . . . . . 5
Data Exhibits . . . . . . . . . . . . . . . . . . . . . . . . . . . . . . . . . . . . . . . . . . . . . . . . . . . . . . . . . . . . . . . . . . . . . . . . . . . . . . . . . . . . . . . . . . . . . . . . . . . . . . . . . . . 6
Exhibit 1 Child Count and Total Child Enrollment Data for State A by Race/Ethnicity . . . . . . . . . . . . . . . . . . . . . . . . . . . . . . . . . . . . . 7
Exhibit 2 Educational Environment and Total Child Count Data for State A by Race/Ethnicity . . . . . . . . . . . . . . . . . . . . . . . . . . . . . 8
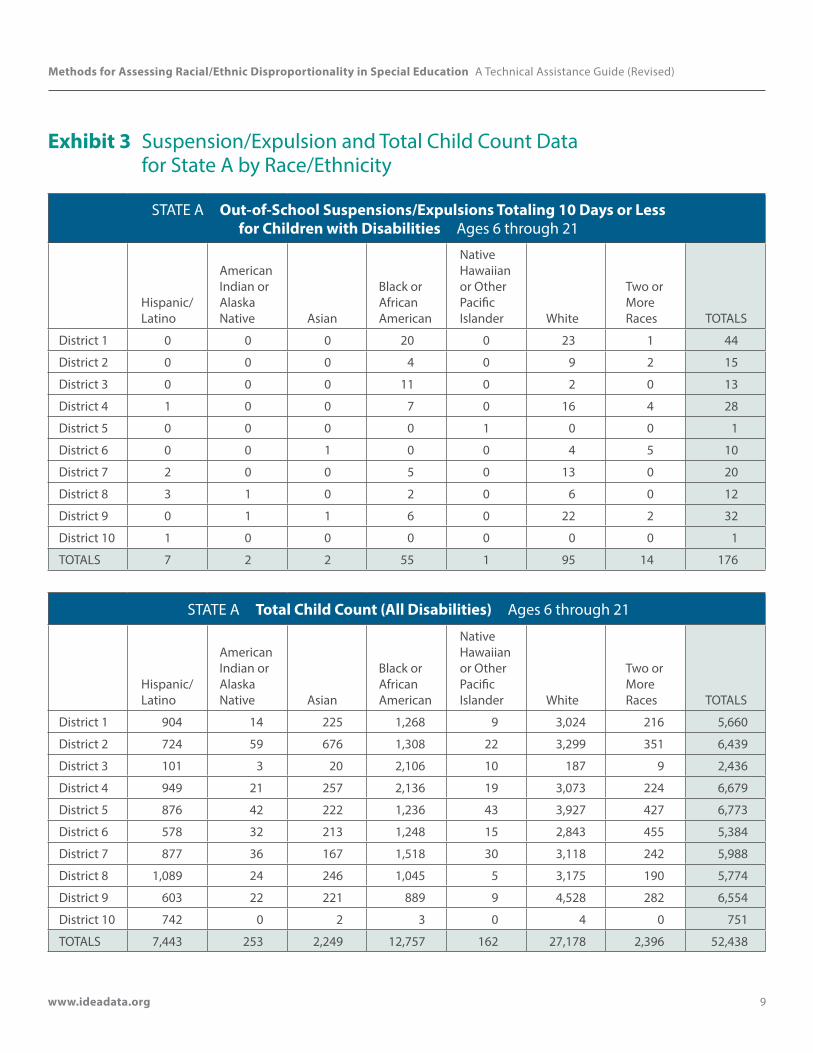
Exhibit 3 Suspension/Expulsion and Total Child Count Data for State A by Race/Ethnicity . . . . . . . . . . . . . . . . . . . . . . . . . . . . . . . . 9
Exhibit 4 Total Disciplinary Removals and Total Child Count Data for State A by Race/Ethnicity . . . . . . . . . . . . . . . . . . . . . . . . . . 10
Chapter 3 Calculating Risk and Total Removals Per Child . . . . . . . . . . . . . . . . . . . . . . . . . . . . . . . . . 11
Introduction. . . . . . . . . . . . . . . . . . . . . . . . . . . . . . . . . . . . . . . . . . . . . . . . . . . . . . . . . . . . . . . . . . . . . . . . . . . . . . . . . . . . . . . . . . . . . . . . . . . . . . . . . . . 11
Example 3.1 Identification. . . . . . . . . . . . . . . . . . . . . . . . . . . . . . . . . . . . . . . . . . . . . . . . . . . . . . . . . . . . . . . . . . . . . . . . . . . . . . . . . . . . . . . . . . . . . 11
Example 3.2 Placement . . . . . . . . . . . . . . . . . . . . . . . . . . . . . . . . . . . . . . . . . . . . . . . . . . . . . . . . . . . . . . . . . . . . . . . . . . . . . . . . . . . . . . . . . . . . . . . 12
Example 3.3 Suspension/Expulsion . . . . . . . . . . . . . . . . . . . . . . . . . . . . . . . . . . . . . . . . . . . . . . . . . . . . . . . . . . . . . . . . . . . . . . . . . . . . . . . . . . . . 13
Example 3.4 Total Disciplinary Removals . . . . . . . . . . . . . . . . . . . . . . . . . . . . . . . . . . . . . . . . . . . . . . . . . . . . . . . . . . . . . . . . . . . . . . . . . . . . . . . 13
Interpretation . . . . . . . . . . . . . . . . . . . . . . . . . . . . . . . . . . . . . . . . . . . . . . . . . . . . . . . . . . . . . . . . . . . . . . . . . . . . . . . . . . . . . . . . . . . . . . . . . . . . . . . . . 14
Considerations . . . . . . . . . . . . . . . . . . . . . . . . . . . . . . . . . . . . . . . . . . . . . . . . . . . . . . . . . . . . . . . . . . . . . . . . . . . . . . . . . . . . . . . . . . . . . . . . . . . . . . . . 15
Methods for Assessing Racial/Ethnic Disproportionality in Special Education A Technical Assistance Guide (Revised)
www.ideadata.org II
Chapter 4 Calculating Risk Ratios and Total Removals per Child Ratios . . . . . . . . . . . . . . . . . . . . . . . . . . . . . . . . . . . . . . . . . . . . . . . . . . . . . . 16
Introduction. . . . . . . . . . . . . . . . . . . . . . . . . . . . . . . . . . . . . . . . . . . . . . . . . . . . . . . . . . . . . . . . . . . . . . . . . . . . . . . . . . . . . . . . . . . . . . . . . . . . . . . . . . . 16
Example 4.1 Identification. . . . . . . . . . . . . . . . . . . . . . . . . . . . . . . . . . . . . . . . . . . . . . . . . . . . . . . . . . . . . . . . . . . . . . . . . . . . . . . . . . . . . . . . . . . . . 16
Example 4.2 Placement . . . . . . . . . . . . . . . . . . . . . . . . . . . . . . . . . . . . . . . . . . . . . . . . . . . . . . . . . . . . . . . . . . . . . . . . . . . . . . . . . . . . . . . . . . . . . . . 18
Example 4.3 Suspension/Expulsion . . . . . . . . . . . . . . . . . . . . . . . . . . . . . . . . . . . . . . . . . . . . . . . . . . . . . . . . . . . . . . . . . . . . . . . . . . . . . . . . . . . . 19
Example 4.4 Total Disciplinary Removals . . . . . . . . . . . . . . . . . . . . . . . . . . . . . . . . . . . . . . . . . . . . . . . . . . . . . . . . . . . . . . . . . . . . . . . . . . . . . . . 21
Interpretation . . . . . . . . . . . . . . . . . . . . . . . . . . . . . . . . . . . . . . . . . . . . . . . . . . . . . . . . . . . . . . . . . . . . . . . . . . . . . . . . . . . . . . . . . . . . . . . . . . . . . . . . . 22
Considerations . . . . . . . . . . . . . . . . . . . . . . . . . . . . . . . . . . . . . . . . . . . . . . . . . . . . . . . . . . . . . . . . . . . . . . . . . . . . . . . . . . . . . . . . . . . . . . . . . . . . . . . . 22
Chapter 5 Calculating Alternate Risk Ratios and Alternate Total Removals Per Child Ratios . . . . . . . . . . . . . . . . . . . . . . . . . . . . . . . . . 23
Introduction. . . . . . . . . . . . . . . . . . . . . . . . . . . . . . . . . . . . . . . . . . . . . . . . . . . . . . . . . . . . . . . . . . . . . . . . . . . . . . . . . . . . . . . . . . . . . . . . . . . . . . . . . . . 23
Example 5.1 Identification. . . . . . . . . . . . . . . . . . . . . . . . . . . . . . . . . . . . . . . . . . . . . . . . . . . . . . . . . . . . . . . . . . . . . . . . . . . . . . . . . . . . . . . . . . . . . 24
Example 5.2 Placement . . . . . . . . . . . . . . . . . . . . . . . . . . . . . . . . . . . . . . . . . . . . . . . . . . . . . . . . . . . . . . . . . . . . . . . . . . . . . . . . . . . . . . . . . . . . . . . 25
Example 5.3 Suspension/Expulsion . . . . . . . . . . . . . . . . . . . . . . . . . . . . . . . . . . . . . . . . . . . . . . . . . . . . . . . . . . . . . . . . . . . . . . . . . . . . . . . . . . . . 27
Example 5.4 Total Disciplinary Removals . . . . . . . . . . . . . . . . . . . . . . . . . . . . . . . . . . . . . . . . . . . . . . . . . . . . . . . . . . . . . . . . . . . . . . . . . . . . . . 29
Interpretation . . . . . . . . . . . . . . . . . . . . . . . . . . . . . . . . . . . . . . . . . . . . . . . . . . . . . . . . . . . . . . . . . . . . . . . . . . . . . . . . . . . . . . . . . . . . . . . . . . . . . . . . . 31
Considerations . . . . . . . . . . . . . . . . . . . . . . . . . . . . . . . . . . . . . . . . . . . . . . . . . . . . . . . . . . . . . . . . . . . . . . . . . . . . . . . . . . . . . . . . . . . . . . . . . . . . . . . . 31
Chapter 6 Calculating Weighted Risk Ratios and Weighted Total Removals Per Child Ratios. . . . . . . . . . . . . . . . . . . . . . . . . . . . . . . . . 32
Introduction. . . . . . . . . . . . . . . . . . . . . . . . . . . . . . . . . . . . . . . . . . . . . . . . . . . . . . . . . . . . . . . . . . . . . . . . . . . . . . . . . . . . . . . . . . . . . . . . . . . . . . . . . . . 32
Example 6.1 Identification. . . . . . . . . . . . . . . . . . . . . . . . . . . . . . . . . . . . . . . . . . . . . . . . . . . . . . . . . . . . . . . . . . . . . . . . . . . . . . . . . . . . . . . . . . . . . 33
Example 6.2 Placement . . . . . . . . . . . . . . . . . . . . . . . . . . . . . . . . . . . . . . . . . . . . . . . . . . . . . . . . . . . . . . . . . . . . . . . . . . . . . . . . . . . . . . . . . . . . . . . 36
Example 6.3 Suspension/Expulsion . . . . . . . . . . . . . . . . . . . . . . . . . . . . . . . . . . . . . . . . . . . . . . . . . . . . . . . . . . . . . . . . . . . . . . . . . . . . . . . . . . . . 40
Example 6.4 Total Disciplinary Removals . . . . . . . . . . . . . . . . . . . . . . . . . . . . . . . . . . . . . . . . . . . . . . . . . . . . . . . . . . . . . . . . . . . . . . . . . . . . . . . 43
Interpretation . . . . . . . . . . . . . . . . . . . . . . . . . . . . . . . . . . . . . . . . . . . . . . . . . . . . . . . . . . . . . . . . . . . . . . . . . . . . . . . . . . . . . . . . . . . . . . . . . . . . . . . . . 47
Considerations . . . . . . . . . . . . . . . . . . . . . . . . . . . . . . . . . . . . . . . . . . . . . . . . . . . . . . . . . . . . . . . . . . . . . . . . . . . . . . . . . . . . . . . . . . . . . . . . . . . . . . . . 47
Methods for Assessing Racial/Ethnic Disproportionality in Special Education A Technical Assistance Guide (Revised)
www.ideadata.org III
Chapter 7 Calculating Risk Differences and Total Removals Per Child Differences . . . . . . . . . . . . . . . . . . . . . . . . . . . . . . . . . . . . . . . . 48
Introduction. . . . . . . . . . . . . . . . . . . . . . . . . . . . . . . . . . . . . . . . . . . . . . . . . . . . . . . . . . . . . . . . . . . . . . . . . . . . . . . . . . . . . . . . . . . . . . . . . . . . . . . . . . . 48
Example 7.1 Identification. . . . . . . . . . . . . . . . . . . . . . . . . . . . . . . . . . . . . . . . . . . . . . . . . . . . . . . . . . . . . . . . . . . . . . . . . . . . . . . . . . . . . . . . . . . . . 48
Example 7.2 Placement . . . . . . . . . . . . . . . . . . . . . . . . . . . . . . . . . . . . . . . . . . . . . . . . . . . . . . . . . . . . . . . . . . . . . . . . . . . . . . . . . . . . . . . . . . . . . . . 49
Example 7.3 Suspension/Expulsion . . . . . . . . . . . . . . . . . . . . . . . . . . . . . . . . . . . . . . . . . . . . . . . . . . . . . . . . . . . . . . . . . . . . . . . . . . . . . . . . . . . . 50
Example 7.4 Total Disciplinary Removals . . . . . . . . . . . . . . . . . . . . . . . . . . . . . . . . . . . . . . . . . . . . . . . . . . . . . . . . . . . . . . . . . . . . . . . . . . . . . . . 51
Interpretation . . . . . . . . . . . . . . . . . . . . . . . . . . . . . . . . . . . . . . . . . . . . . . . . . . . . . . . . . . . . . . . . . . . . . . . . . . . . . . . . . . . . . . . . . . . . . . . . . . . . . . . . . 52
Considerations . . . . . . . . . . . . . . . . . . . . . . . . . . . . . . . . . . . . . . . . . . . . . . . . . . . . . . . . . . . . . . . . . . . . . . . . . . . . . . . . . . . . . . . . . . . . . . . . . . . . . . . . 52
Chapter 8 Calculating Composition, Difference in Compositon, and Relative Difference in Composition. . . . . . . . . . . . . . . . . . . . . . . . . . . . . . . . . . . . . . . . . . . 53
Introduction. . . . . . . . . . . . . . . . . . . . . . . . . . . . . . . . . . . . . . . . . . . . . . . . . . . . . . . . . . . . . . . . . . . . . . . . . . . . . . . . . . . . . . . . . . . . . . . . . . . . . . . . . . . 53
Example 8.1 Identification. . . . . . . . . . . . . . . . . . . . . . . . . . . . . . . . . . . . . . . . . . . . . . . . . . . . . . . . . . . . . . . . . . . . . . . . . . . . . . . . . . . . . . . . . . . . . 54
Part 1 Calculating Composition. . . . . . . . . . . . . . . . . . . . . . . . . . . . . . . . . . . . . . . . . . . . . . . . . . . . . . . . . . . . . . . . . . . . . . . . . . . . . . . . . . . . . . . . 54
Part 2 Calculating Difference in Composition . . . . . . . . . . . . . . . . . . . . . . . . . . . . . . . . . . . . . . . . . . . . . . . . . . . . . . . . . . . . . . . . . . . . . . . . . . 54
Part 3 Calculating Relative Difference in Composition . . . . . . . . . . . . . . . . . . . . . . . . . . . . . . . . . . . . . . . . . . . . . . . . . . . . . . . . . . . . . . . . . . 55
Example 8.2 Placement . . . . . . . . . . . . . . . . . . . . . . . . . . . . . . . . . . . . . . . . . . . . . . . . . . . . . . . . . . . . . . . . . . . . . . . . . . . . . . . . . . . . . . . . . . . . . . . 56
Part 1 Calculating Composition. . . . . . . . . . . . . . . . . . . . . . . . . . . . . . . . . . . . . . . . . . . . . . . . . . . . . . . . . . . . . . . . . . . . . . . . . . . . . . . . . . . . . . . . 56
Part 2 Calculating Difference in Composition . . . . . . . . . . . . . . . . . . . . . . . . . . . . . . . . . . . . . . . . . . . . . . . . . . . . . . . . . . . . . . . . . . . . . . . . . . 56
Part 3 Calculating Relative Difference in Composition . . . . . . . . . . . . . . . . . . . . . . . . . . . . . . . . . . . . . . . . . . . . . . . . . . . . . . . . . . . . . . . . . . 57
Example 8.3 Suspension/Expulsion . . . . . . . . . . . . . . . . . . . . . . . . . . . . . . . . . . . . . . . . . . . . . . . . . . . . . . . . . . . . . . . . . . . . . . . . . . . . . . . . . . . . 58
Part 1 Calculating Composition. . . . . . . . . . . . . . . . . . . . . . . . . . . . . . . . . . . . . . . . . . . . . . . . . . . . . . . . . . . . . . . . . . . . . . . . . . . . . . . . . . . . . . . . 58
Part 2 Calculating Difference in Composition . . . . . . . . . . . . . . . . . . . . . . . . . . . . . . . . . . . . . . . . . . . . . . . . . . . . . . . . . . . . . . . . . . . . . . . . . . 59
Part 3 Calculating Relative Difference in Composition . . . . . . . . . . . . . . . . . . . . . . . . . . . . . . . . . . . . . . . . . . . . . . . . . . . . . . . . . . . . . . . . . . 60
Example 8.4 Total Disciplinary Removals . . . . . . . . . . . . . . . . . . . . . . . . . . . . . . . . . . . . . . . . . . . . . . . . . . . . . . . . . . . . . . . . . . . . . . . . . . . . . . . 60
Part 1 Calculating Composition. . . . . . . . . . . . . . . . . . . . . . . . . . . . . . . . . . . . . . . . . . . . . . . . . . . . . . . . . . . . . . . . . . . . . . . . . . . . . . . . . . . . . . . . 60
Part 2 Calculating Difference in Composition . . . . . . . . . . . . . . . . . . . . . . . . . . . . . . . . . . . . . . . . . . . . . . . . . . . . . . . . . . . . . . . . . . . . . . . . . . 61
Part 3 Calculating Relative Difference in Composition . . . . . . . . . . . . . . . . . . . . . . . . . . . . . . . . . . . . . . . . . . . . . . . . . . . . . . . . . . . . . . . . . . 62
Interpretation . . . . . . . . . . . . . . . . . . . . . . . . . . . . . . . . . . . . . . . . . . . . . . . . . . . . . . . . . . . . . . . . . . . . . . . . . . . . . . . . . . . . . . . . . . . . . . . . . . . . . . . . . 62
Considerations . . . . . . . . . . . . . . . . . . . . . . . . . . . . . . . . . . . . . . . . . . . . . . . . . . . . . . . . . . . . . . . . . . . . . . . . . . . . . . . . . . . . . . . . . . . . . . . . . . . . . . . . 63

Methods for Assessing Racial/Ethnic Disproportionality in Special Education A Technical Assistance Guide (Revised)
www.ideadata.org IV
Chapter 9 Calculating the E-Formula . . . . . . . . . . . . . . . . . . . . . . . . . . . . . . . . . . . . . . . . . . . . . . . . . . . . . . . . . . . . . . 64
Introduction. . . . . . . . . . . . . . . . . . . . . . . . . . . . . . . . . . . . . . . . . . . . . . . . . . . . . . . . . . . . . . . . . . . . . . . . . . . . . . . . . . . . . . . . . . . . . . . . . . . . . . . . . . . 64
Example 9.1 Identification. . . . . . . . . . . . . . . . . . . . . . . . . . . . . . . . . . . . . . . . . . . . . . . . . . . . . . . . . . . . . . . . . . . . . . . . . . . . . . . . . . . . . . . . . . . . . 64
Example 9.2 Placement . . . . . . . . . . . . . . . . . . . . . . . . . . . . . . . . . . . . . . . . . . . . . . . . . . . . . . . . . . . . . . . . . . . . . . . . . . . . . . . . . . . . . . . . . . . . . . . 65
Example 9.3 Suspension/Expulsion . . . . . . . . . . . . . . . . . . . . . . . . . . . . . . . . . . . . . . . . . . . . . . . . . . . . . . . . . . . . . . . . . . . . . . . . . . . . . . . . . . . . 67
Example 9.4 Total Disciplinary Removals . . . . . . . . . . . . . . . . . . . . . . . . . . . . . . . . . . . . . . . . . . . . . . . . . . . . . . . . . . . . . . . . . . . . . . . . . . . . . . . 68
Interpretation . . . . . . . . . . . . . . . . . . . . . . . . . . . . . . . . . . . . . . . . . . . . . . . . . . . . . . . . . . . . . . . . . . . . . . . . . . . . . . . . . . . . . . . . . . . . . . . . . . . . . . . . . 69
Considerations . . . . . . . . . . . . . . . . . . . . . . . . . . . . . . . . . . . . . . . . . . . . . . . . . . . . . . . . . . . . . . . . . . . . . . . . . . . . . . . . . . . . . . . . . . . . . . . . . . . . . . . . 70
Chapter 10 Small Cell Sizes. . . . . . . . . . . . . . . . . . . . . . . . . . . . . . . . . . . . . . . . . . . . . . . . . . . . . . . . . . . . . . . . . . . . . . . . . . . . . 71
Introduction. . . . . . . . . . . . . . . . . . . . . . . . . . . . . . . . . . . . . . . . . . . . . . . . . . . . . . . . . . . . . . . . . . . . . . . . . . . . . . . . . . . . . . . . . . . . . . . . . . . . . . . . . . . 71
Choosing and Implementing Minimum Cell Sizes. . . . . . . . . . . . . . . . . . . . . . . . . . . . . . . . . . . . . . . . . . . . . . . . . . . . . . . . . . . . . . . . . . . . . . . 71
Types of Minimum Cell Sizes . . . . . . . . . . . . . . . . . . . . . . . . . . . . . . . . . . . . . . . . . . . . . . . . . . . . . . . . . . . . . . . . . . . . . . . . . . . . . . . . . . . . . . . . . . . 71
Risk Ratios and Minimum Cell Sizes . . . . . . . . . . . . . . . . . . . . . . . . . . . . . . . . . . . . . . . . . . . . . . . . . . . . . . . . . . . . . . . . . . . . . . . . . . . . . . . . . . . . 72
Other Methods and Minimum Cell Sizes . . . . . . . . . . . . . . . . . . . . . . . . . . . . . . . . . . . . . . . . . . . . . . . . . . . . . . . . . . . . . . . . . . . . . . . . . . . . . . . . 73
When Racial/Ethnic Groups Within Districts Are Eliminated From the Analyses . . . . . . . . . . . . . . . . . . . . . . . . . . . . . . . . . . . . . . . . . . . 74
Reporting Minimum Cell Sizes . . . . . . . . . . . . . . . . . . . . . . . . . . . . . . . . . . . . . . . . . . . . . . . . . . . . . . . . . . . . . . . . . . . . . . . . . . . . . . . . . . . . . . . . . 74
Calculating the Percentage of Districts with Disproportionate Representation Due to Inappropriate Identification . . . . . . . . 74
Using Multiple Years of Data . . . . . . . . . . . . . . . . . . . . . . . . . . . . . . . . . . . . . . . . . . . . . . . . . . . . . . . . . . . . . . . . . . . . . . . . . . . . . . . . . . . . . . . . . . . 75
Chapter 11 References and Recommended Reading . . . . . . . . . . . . . . . . . . . . . . . . . . . . . . . . . . . . . . . 76
References . . . . . . . . . . . . . . . . . . . . . . . . . . . . . . . . . . . . . . . . . . . . . . . . . . . . . . . . . . . . . . . . . . . . . . . . . . . . . . . . . . . . . . . . . . . . . . . . . . . . . . . . . . . . 76
Recommended Reading . . . . . . . . . . . . . . . . . . . . . . . . . . . . . . . . . . . . . . . . . . . . . . . . . . . . . . . . . . . . . . . . . . . . . . . . . . . . . . . . . . . . . . . . . . . . . . . 77
Appendix Summary of Disproportionality Methods . . . . . . . . . . . . . . . . . . . . . . . . . . . . . . . . . . . . . . . A-1
Methods for Assessing Racial/Ethnic Disproportionality in Special Education A Technical Assistance Guide (Revised)
www.ideadata.org 1
Chapter 1 Introduction
OverviewAccording to a review in Exceptional Children, “The disproportionate representation of minority children is among the most critical and enduring problems in the field of special education” (Skiba et al., 2008, p. 264). IDEA 2004 includes a number of provisions to address the issue, expanding on requirements from the 1997 reauthorization. These provisions include two distinct requirements for states related to disproportionality:
1. State Performance Plan/Annual Performance Report (SPP/APR) Indicators B9 and B10:1 Using a two-step process, states must first examine their data to identify which districts have disproportionate representation in identification for special education and related services, including specific disability categories. Second, states must conduct a review of these districts’ policies, practices, and procedures to determine whether any of the identified districts have disproportionate representation that is the result of inappropriate identification.
• B9: Disproportionate representation. For B9, states must report the percentage of districts with disproportionate representation of racial and ethnic groups in special education and related services that is the result of inappropriate identification.
• B10: Disproportionate representation in specific disability categories. For B10, states must report the percentage of districts with disproportionate representation of racial and ethnic groups in specific disability categories that is the result of inappropriate identification.
2. Significant disproportionality. States must collect and examine data for each of their districts annually to determine if significant disproportionality based on race or ethnicity is occurring with respect to:
• the identification of children as children with disabilities, including identification of children with particular disabilities;
• the placement of children in particular educational environments; and
• the incidence, duration, and type of disciplinary actions, including suspensions/expulsions.
If significant disproportionality is identified, states must: (1) provide for the review (and, if appropriate) revision of policies, procedures, and practices; (2) require the district to reserve the maximum amount of funds (15%) to be used for coordinated early intervening services (CEIS); and (3) require the district to publicly report on the revision of policies, procedures, and practices.
Purpose of Technical Assistance Guide and Intended AudienceThe intended audience of this TA guide is state agency staff who must make decisions regarding their state’s disproportionality2 analyses and those who analyze disproportionality data or interpret the results of those analyses. While this TA guide is intended to be as user-friendly as possible, some of the methodologies and calculations discussed in this TA guide assume users have a certain level of technical knowledge or expertise with regard to analyzing and interpreting special education data. This TA guide is not intended for general audiences who do not have that level of technical knowledge or expertise.
1 The 2004 re-authorization of IDEA requires each state to develop an SPP to evaluate the state’s efforts in implementing IDEA over 6 years. For Part B, the SPP includes baseline data, measurable and rigorous targets, and improvement activities for 20 indicators, including two disproportionality indicators (B9 and B10). Each state must report annually on its progress toward meeting its targets for each indicator in its APR.
2 The term “disproportionality” is used throughout this TA guide to refer to both “disproportionate representation” and “significant disproportionality.”
Methods for Assessing Racial/Ethnic Disproportionality in Special Education A Technical Assistance Guide (Revised)
www.ideadata.org 2
Many methods for calculating disproportionality exist. Each of these methods represents a different way of reporting the same or similar data, and each answers a somewhat different question about racial/ ethnic disproportionality in special education. In this TA guide, we describe some of the more common methods for calculating disproportionality. These methods include:
• Risk (and total removals per child);3
• Risk ratios (and total removals per child ratios);
– Alternate risk ratios (and alternate total removals per child ratios);
– Weighted risk ratios (and weighted total removals per child ratios);
• Risk difference (and total removals per child difference);
• Composition; and
• E-formula.
For each method, the TA guide summarizes the question it answers and provides several step-by-step examples of how it is calculated. We also include brief discussions of how to interpret the method and some considerations. The appendix included at the end of this TA guide presents a brief summary of the various methods.
When calculating either disproportionate representation or significant disproportionality, OSEP does not require states to use a specific methodology. Instead, each state makes these decisions. When making decisions about calculation methodologies, states should be aware that each method has its strengths and limitations. Because of these strengths and limitations, states may want to consider using multiple methods for calculating disproportionate representation and significant disproportionality.
It should be noted that the methods discussed in this TA guide are not the only ones that states could use to calculate disproportionate representation and significant disproportionality; other methods for calculating disproportionality exist that are not discussed in this TA guide (e.g., odds ratios, expected numbers calculations, likelihood measures). IDC is available to consult with states regarding their calculations methods, including those methods discussed in the TA guide as well as other methods that states might be using.
New Racial/Ethnic Reporting CategoriesWhen reporting IDEA 618 data for reference/school year 2010-11 and beyond, states are required to use seven racial/ethnic categories as per the 2007 guidance issued by the Department of Education: 4
1. Hispanic/Latino,
2. American Indian or Alaska Native,
3. Asian,
4. Black or African American,
5. Native Hawaiian or Other Pacific Islander,
6. White, and
7. Two or more races.
Previously, states were required to report using five racial/ethnic categories: American Indian or Alaska Native; Asian or Other Pacific Islander; Black (not Hispanic); Hispanic; and White (not Hispanic).
3 This TA guide introduces a new measure for analyzing total disciplinary removals called total removals per child (TRPC), which provides the average number of disciplinary removals per child for a specific racial/ethnic group. This measure is discussed in more detail in the chapters that follow.
4 In October 2007, the Department of Education published its Final Guidance on Maintaining, Collecting and Reporting Racial and Ethnic Data to the U.S. Department of Education in the Federal Register (Vol. 72, No. 202, available at http://www.gpoaccess.gov/nara/index.html).

Methods for Assessing Racial/Ethnic Disproportionality in Special Education A Technical Assistance Guide (Revised)
www.ideadata.org 3
Minimum Cell SizesUnreliable analyses caused by small cell sizes may result in districts being inappropriately identified with disproportionality. The most common method states use to address this problem is to identify a minimum number of children to be included in the analysis, called the minimum n-size or the minimum cell size. If, however, the minimum cell size is too large, many districts may be eliminated from the analysis altogether. States need to try to balance the risks of inappropriately identifying districts because of small cell sizes against the risk of not identifying districts because of large minimum cell sizes that eliminate large numbers of districts from the analysis completely. We present a more detailed discussion of minimum cell sizes in Chapter 10.
ThresholdsIn order to use any of the methods described in this document, a state must choose a threshold that defines when a district is identified as having disproportionate representation or significant disproportionality. The thresholds that states use for indicators B9 and B10 vary considerably. States are not required to report their methods for determining significant disproportionality, but we can assume that these thresholds also vary widely. The choice of threshold has a dramatic impact on the number of districts identified within a state. When choosing a threshold, states should consider the implications that their decisions will have, both in terms of their data analyses and from a legal and policy standpoint. For example, the Department of Education considers the use of different thresholds for different racial or ethnic groups to be a legally questionable practice.
Methods for Assessing Racial/Ethnic Disproportionality in Special Education A Technical Assistance Guide (Revised)
www.ideadata.org 4
Chapter 2 Data Analysis Categories and Data Exhibits
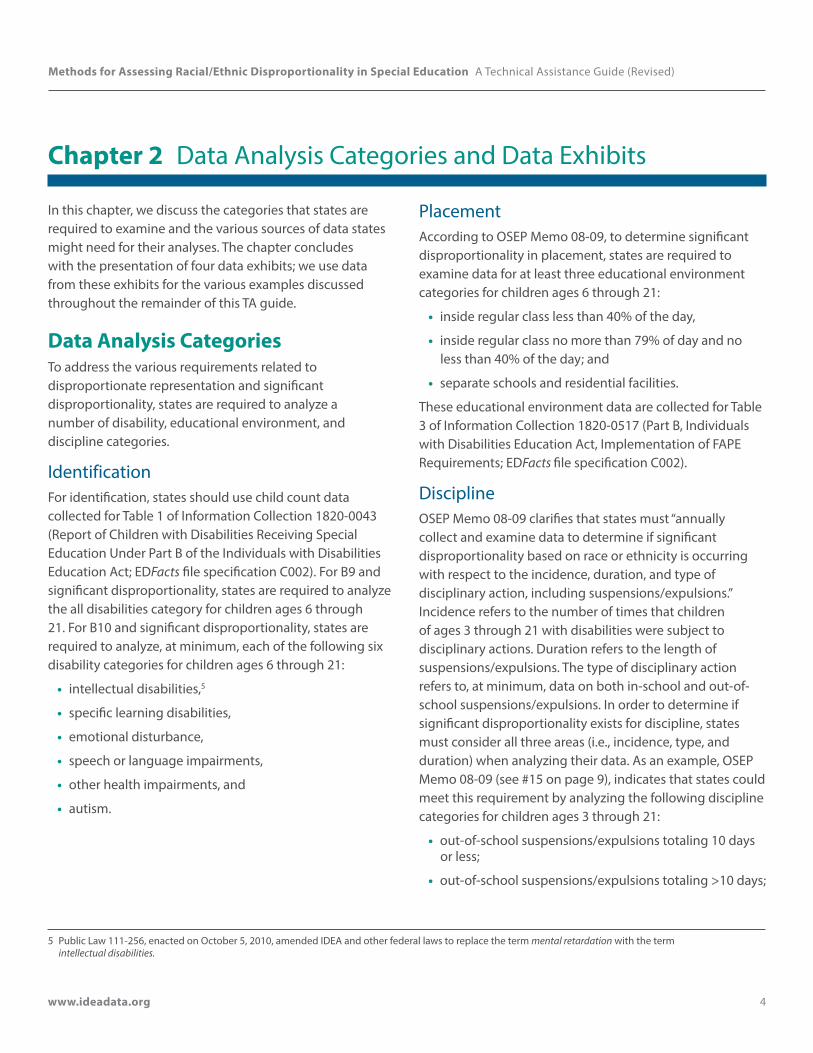
In this chapter, we discuss the categories that states are required to examine and the various sources of data states might need for their analyses. The chapter concludes with the presentation of four data exhibits; we use data from these exhibits for the various examples discussed throughout the remainder of this TA guide.
Data Analysis CategoriesTo address the various requirements related to disproportionate representation and significant disproportionality, states are required to analyze a number of disability, educational environment, and discipline categories.
IdentificationFor identification, states should use child count data collected for Table 1 of Information Collection 1820-0043 (Report of Children with Disabilities Receiving Special Education Under Part B of the Individuals with Disabilities Education Act; EDFacts file specification C002). For B9 and significant disproportionality, states are required to analyze the all disabilities category for children ages 6 through 21. For B10 and significant disproportionality, states are required to analyze, at minimum, each of the following six disability categories for children ages 6 through 21:
• intellectual disabilities,5
• specific learning disabilities,
• emotional disturbance,
• speech or language impairments,
• other health impairments, and
• autism.
PlacementAccording to OSEP Memo 08-09, to determine significant disproportionality in placement, states are required to examine data for at least three educational environment categories for children ages 6 through 21:
• inside regular class less than 40% of the day,
• inside regular class no more than 79% of day and no less than 40% of the day; and
• separate schools and residential facilities.
These educational environment data are collected for Table 3 of Information Collection 1820-0517 (Part B, Individuals with Disabilities Education Act, Implementation of FAPE Requirements; EDFacts file specification C002).
DisciplineOSEP Memo 08-09 clarifies that states must “annually collect and examine data to determine if significant disproportionality based on race or ethnicity is occurring with respect to the incidence, duration, and type of disciplinary action, including suspensions/expulsions.” Incidence refers to the number of times that children of ages 3 through 21 with disabilities were subject to disciplinary actions. Duration refers to the length of suspensions/expulsions. The type of disciplinary action refers to, at minimum, data on both in-school and out-of-school suspensions/expulsions. In order to determine if significant disproportionality exists for discipline, states must consider all three areas (i.e., incidence, type, and duration) when analyzing their data. As an example, OSEP Memo 08-09 (see #15 on page 9), indicates that states could meet this requirement by analyzing the following discipline categories for children ages 3 through 21:
• out-of-school suspensions/expulsions totaling 10 days or less;
• out-of-school suspensions/expulsions totaling >10 days;
5 Public Law 111-256, enacted on October 5, 2010, amended IDEA and other federal laws to replace the term mental retardation with the term intellectual disabilities.
Methods for Assessing Racial/Ethnic Disproportionality in Special Education A Technical Assistance Guide (Revised)
www.ideadata.org 5
• in-school suspensions totaling 10 days or less;
• in-school suspensions totaling >10 days; and
• total number of disciplinary removals.
These discipline data are collected for Table 5 of Information Collection 1820-0621 (Report of Children with Disabilities Subject to Disciplinary Removal; EDFacts file specifications N/X006 and N/X143).
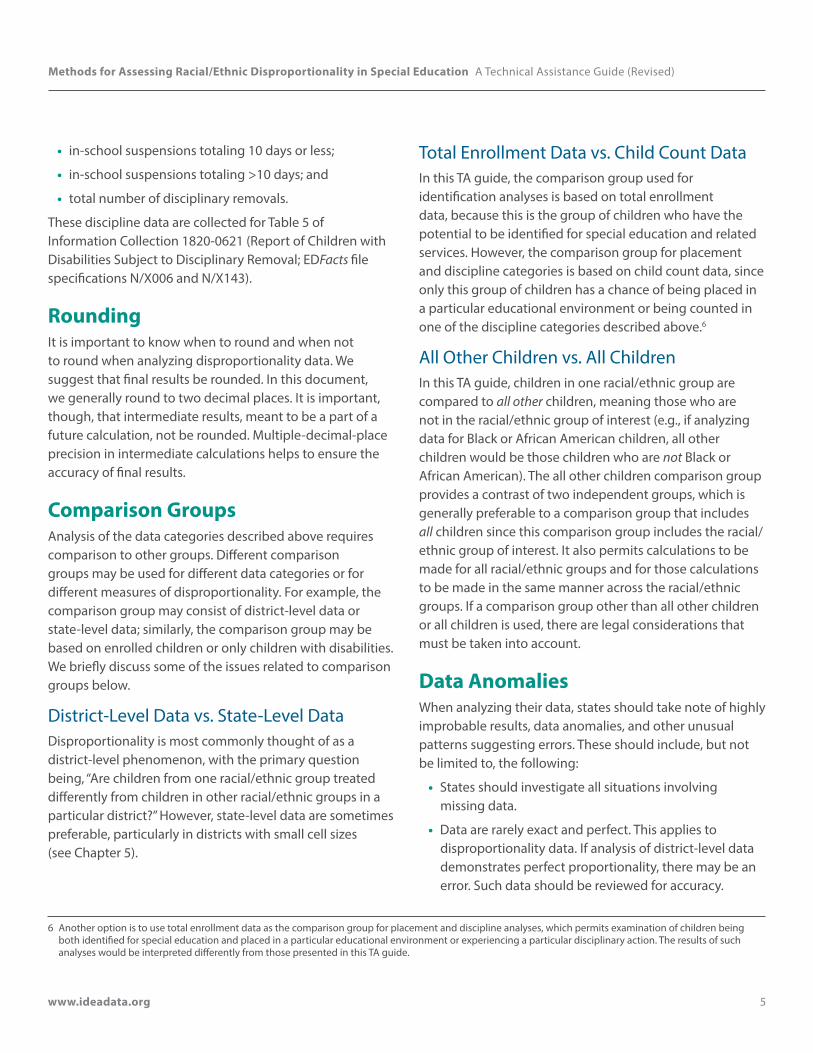
RoundingIt is important to know when to round and when not to round when analyzing disproportionality data. We suggest that final results be rounded. In this document, we generally round to two decimal places. It is important, though, that intermediate results, meant to be a part of a future calculation, not be rounded. Multiple-decimal-place precision in intermediate calculations helps to ensure the accuracy of final results.
Comparison Groups Analysis of the data categories described above requires comparison to other groups. Different comparison groups may be used for different data categories or for different measures of disproportionality. For example, the comparison group may consist of district-level data or state-level data; similarly, the comparison group may be based on enrolled children or only children with disabilities. We briefly discuss some of the issues related to comparison groups below.
District-Level Data vs. State-Level DataDisproportionality is most commonly thought of as a district-level phenomenon, with the primary question being, “Are children from one racial/ethnic group treated differently from children in other racial/ethnic groups in a particular district?” However, state-level data are sometimes preferable, particularly in districts with small cell sizes (see Chapter 5).
Total Enrollment Data vs. Child Count DataIn this TA guide, the comparison group used for identification analyses is based on total enrollment data, because this is the group of children who have the potential to be identified for special education and related services. However, the comparison group for placement and discipline categories is based on child count data, since only this group of children has a chance of being placed in a particular educational environment or being counted in one of the discipline categories described above.6
All Other Children vs. All ChildrenIn this TA guide, children in one racial/ethnic group are compared to all other children, meaning those who are not in the racial/ethnic group of interest (e.g., if analyzing data for Black or African American children, all other children would be those children who are not Black or African American). The all other children comparison group provides a contrast of two independent groups, which is generally preferable to a comparison group that includes all children since this comparison group includes the racial/ethnic group of interest. It also permits calculations to be made for all racial/ethnic groups and for those calculations to be made in the same manner across the racial/ethnic groups. If a comparison group other than all other children or all children is used, there are legal considerations that must be taken into account.
Data AnomaliesWhen analyzing their data, states should take note of highly improbable results, data anomalies, and other unusual patterns suggesting errors. These should include, but not be limited to, the following:
• States should investigate all situations involving missing data.
• Data are rarely exact and perfect. This applies to disproportionality data. If analysis of district-level data demonstrates perfect proportionality, there may be an error. Such data should be reviewed for accuracy.
6 Another option is to use total enrollment data as the comparison group for placement and discipline analyses, which permits examination of children being both identified for special education and placed in a particular educational environment or experiencing a particular disciplinary action. The results of such analyses would be interpreted differently from those presented in this TA guide.

Methods for Assessing Racial/Ethnic Disproportionality in Special Education A Technical Assistance Guide (Revised)
www.ideadata.org 6
• States should review all cases of dramatic changes in baseline enrollment numbers. Such changes may be the result of student assignment changes or dramatic demographic changes such as those caused in many communities by natural disasters.
• States should review the accuracy of district-level data whenever dramatic reductions or increases in disproportionality take place within a year.
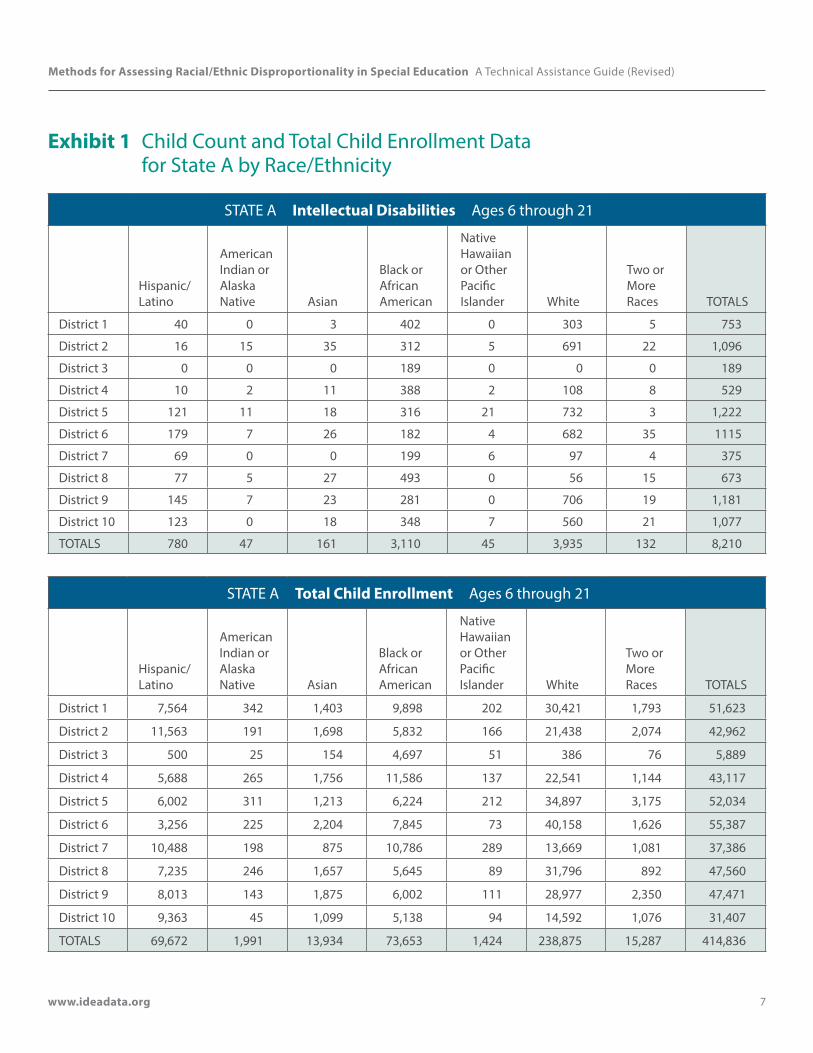
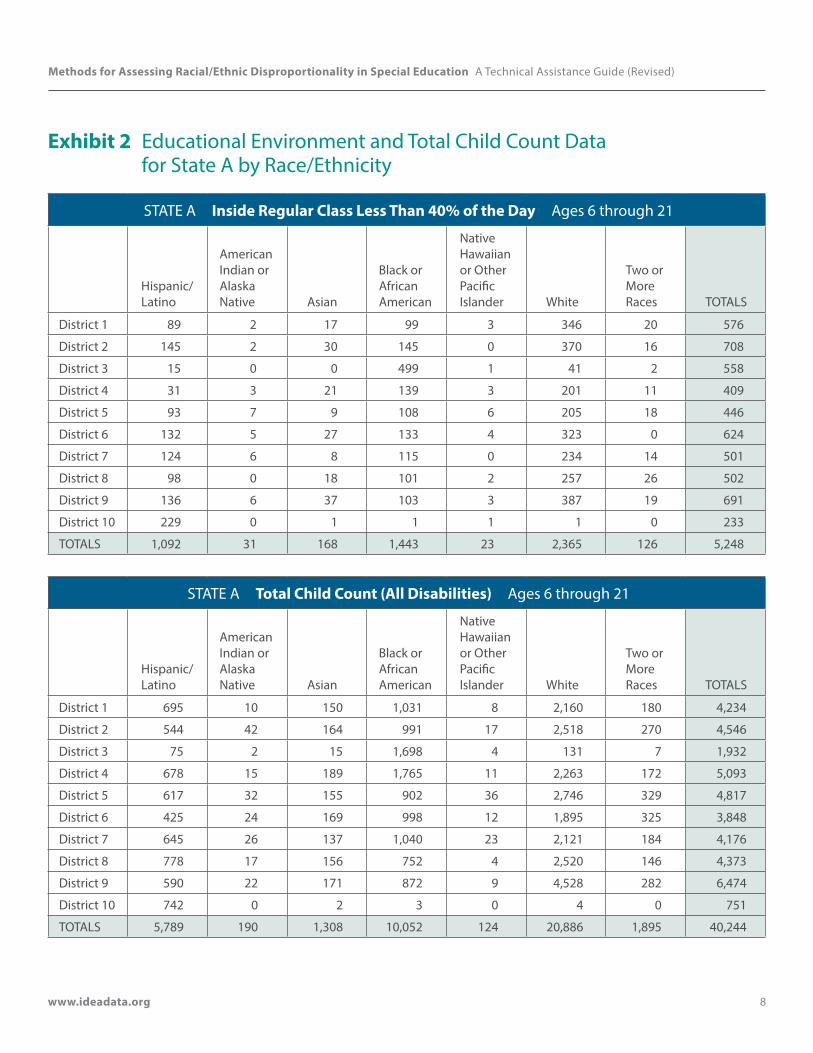
Data ExhibitsExhibits 1, 2, 3, and 4 present data for a fictitious State A that has 10 districts. The examples in the remainder of this TA guide use the data in these exhibits. The exhibits include IDEA data and total enrollment data by race/ethnicity. It should be noted that we present data for and analyze only one disability category, one educational environment category, and two discipline categories. We hope that the examples based on these four categories can be easily extended to other categories, because as discussed in earlier in this chapter, states will need to analyze more than just these four categories in order to meet the requirements for B9 and B10 and significant disproportionality. We also hope that the examples can assist states when working with individual districts and schools.
Methods for Assessing Racial/Ethnic Disproportionality in Special Education A Technical Assistance Guide (Revised)
www.ideadata.org 7
Exhibit 1 Child Count and Total Child Enrollment Data for State A by Race/Ethnicity
STATE A Intellectual Disabilities Ages 6 through 21
Hispanic/ Latino
American Indian or Alaska Native Asian
Black or African American
Native Hawaiian or Other Pacific Islander White
Two or More Races TOTALS
District 1 40 0 3 402 0 303 5 753
District 2 16 15 35 312 5 691 22 1,096
District 3 0 0 0 189 0 0 0 189
District 4 10 2 11 388 2 108 8 529
District 5 121 11 18 316 21 732 3 1,222
District 6 179 7 26 182 4 682 35 1115
District 7 69 0 0 199 6 97 4 375
District 8 77 5 27 493 0 56 15 673
District 9 145 7 23 281 0 706 19 1,181
District 10 123 0 18 348 7 560 21 1,077
TOTALS 780 47 161 3,110 45 3,935 132 8,210
STATE A Total Child Enrollment Ages 6 through 21
Hispanic/Latino
American Indian or Alaska Native Asian
Black or African American
Native Hawaiian or Other Pacific Islander White
Two or More Races TOTALS
District 1 7,564 342 1,403 9,898 202 30,421 1,793 51,623
District 2 11,563 191 1,698 5,832 166 21,438 2,074 42,962
District 3 500 25 154 4,697 51 386 76 5,889
District 4 5,688 265 1,756 11,586 137 22,541 1,144 43,117
District 5 6,002 311 1,213 6,224 212 34,897 3,175 52,034
District 6 3,256 225 2,204 7,845 73 40,158 1,626 55,387
District 7 10,488 198 875 10,786 289 13,669 1,081 37,386
District 8 7,235 246 1,657 5,645 89 31,796 892 47,560
District 9 8,013 143 1,875 6,002 111 28,977 2,350 47,471
District 10 9,363 45 1,099 5,138 94 14,592 1,076 31,407
TOTALS 69,672 1,991 13,934 73,653 1,424 238,875 15,287 414,836
Methods for Assessing Racial/Ethnic Disproportionality in Special Education A Technical Assistance Guide (Revised)
www.ideadata.org 8
Exhibit 2 Educational Environment and Total Child Count Data for State A by Race/Ethnicity
STATE A Inside Regular Class Less Than 40% of the Day Ages 6 through 21
Hispanic/ Latino
American Indian or Alaska Native Asian
Black or African American
Native Hawaiian or Other Pacific Islander White
Two or More Races TOTALS
District 1 89 2 17 99 3 346 20 576
District 2 145 2 30 145 0 370 16 708
District 3 15 0 0 499 1 41 2 558
District 4 31 3 21 139 3 201 11 409
District 5 93 7 9 108 6 205 18 446
District 6 132 5 27 133 4 323 0 624
District 7 124 6 8 115 0 234 14 501
District 8 98 0 18 101 2 257 26 502
District 9 136 6 37 103 3 387 19 691
District 10 229 0 1 1 1 1 0 233
TOTALS 1,092 31 168 1,443 23 2,365 126 5,248
STATE A Total Child Count (All Disabilities) Ages 6 through 21
Hispanic/Latino
American Indian or Alaska Native Asian
Black or African American
Native Hawaiian or Other Pacific Islander White
Two or More Races TOTALS
District 1 695 10 150 1,031 8 2,160 180 4,234
District 2 544 42 164 991 17 2,518 270 4,546
District 3 75 2 15 1,698 4 131 7 1,932
District 4 678 15 189 1,765 11 2,263 172 5,093
District 5 617 32 155 902 36 2,746 329 4,817
District 6 425 24 169 998 12 1,895 325 3,848
District 7 645 26 137 1,040 23 2,121 184 4,176
District 8 778 17 156 752 4 2,520 146 4,373
District 9 590 22 171 872 9 4,528 282 6,474
District 10 742 0 2 3 0 4 0 751
TOTALS 5,789 190 1,308 10,052 124 20,886 1,895 40,244
Methods for Assessing Racial/Ethnic Disproportionality in Special Education A Technical Assistance Guide (Revised)
www.ideadata.org 9
Exhibit 3 Suspension/Expulsion and Total Child Count Data for State A by Race/Ethnicity
STATE A Out-of-School Suspensions/Expulsions Totaling 10 Days or Less for Children with Disabilities Ages 6 through 21
Hispanic/ Latino
American Indian or Alaska Native Asian
Black or African American
Native Hawaiian or Other Pacific Islander White
Two or More Races TOTALS
District 1 0 0 0 20 0 23 1 44
District 2 0 0 0 4 0 9 2 15
District 3 0 0 0 11 0 2 0 13
District 4 1 0 0 7 0 16 4 28
District 5 0 0 0 0 1 0 0 1
District 6 0 0 1 0 0 4 5 10
District 7 2 0 0 5 0 13 0 20
District 8 3 1 0 2 0 6 0 12
District 9 0 1 1 6 0 22 2 32
District 10 1 0 0 0 0 0 0 1
TOTALS 7 2 2 55 1 95 14 176
STATE A Total Child Count (All Disabilities) Ages 6 through 21
Hispanic/Latino
American Indian or Alaska Native Asian
Black or African American
Native Hawaiian or Other Pacific Islander White
Two or More Races TOTALS
District 1 904 14 225 1,268 9 3,024 216 5,660
District 2 724 59 676 1,308 22 3,299 351 6,439
District 3 101 3 20 2,106 10 187 9 2,436
District 4 949 21 257 2,136 19 3,073 224 6,679
District 5 876 42 222 1,236 43 3,927 427 6,773
District 6 578 32 213 1,248 15 2,843 455 5,384
District 7 877 36 167 1,518 30 3,118 242 5,988
District 8 1,089 24 246 1,045 5 3,175 190 5,774
District 9 603 22 221 889 9 4,528 282 6,554
District 10 742 0 2 3 0 4 0 751
TOTALS 7,443 253 2,249 12,757 162 27,178 2,396 52,438

Methods for Assessing Racial/Ethnic Disproportionality in Special Education A Technical Assistance Guide (Revised)
www.ideadata.org 10
Exhibit 4 Total Disciplinary Removals and Total Child Count Data for State A by Race/Ethnicity
STATE A Total Disciplinary Removals for Children with Disabilities Ages 6 through 21
Hispanic/ Latino
American Indian or Alaska Native Asian
Black or African American
Native Hawaiian or Other Pacific Islander White
Two or More Races TOTALS
District 1 4 0 3 42 1 65 1 116
District 2 11 2 5 9 2 22 6 57
District 3 3 0 2 24 0 6 0 35
District 4 2 0 3 17 1 38 9 70
District 5 0 0 0 0 6 0 0 6
District 6 6 1 3 12 0 10 11 43
District 7 5 2 4 14 1 27 2 55
District 8 7 1 2 5 0 13 0 28
District 9 3 2 3 12 0 47 4 71
District 10 4 0 0 0 0 0 0 4
TOTALS 45 8 25 135 11 228 33 485
STATE A Total Child Count (All Disabilities) Ages 6 through 21
Hispanic/Latino
American Indian or Alaska Native Asian
Black or African American
Native Hawaiian or Other Pacific Islander White
Two or More Races TOTALS
District 1 904 14 225 1,268 9 3,024 216 5,660
District 2 724 59 676 1,308 22 3,299 351 6,439
District 3 101 3 20 2,106 10 187 9 2,436
District 4 949 21 257 2,136 19 3,073 224 6,679
District 5 876 42 222 1,236 43 3,927 427 6,773
District 6 578 32 213 1,248 15 2,843 455 5,384
District 7 877 36 167 1,518 30 3,118 242 5,988
District 8 1,089 24 246 1,045 5 3,175 190 5,774
District 9 603 22 221 889 9 4,528 282 6,554
District 10 742 0 2 3 0 4 0 751
TOTALS 7,443 253 2,249 12,757 162 27,178 2,396 52,438
Methods for Assessing Racial/Ethnic Disproportionality in Special Education A Technical Assistance Guide (Revised)
www.ideadata.org 11
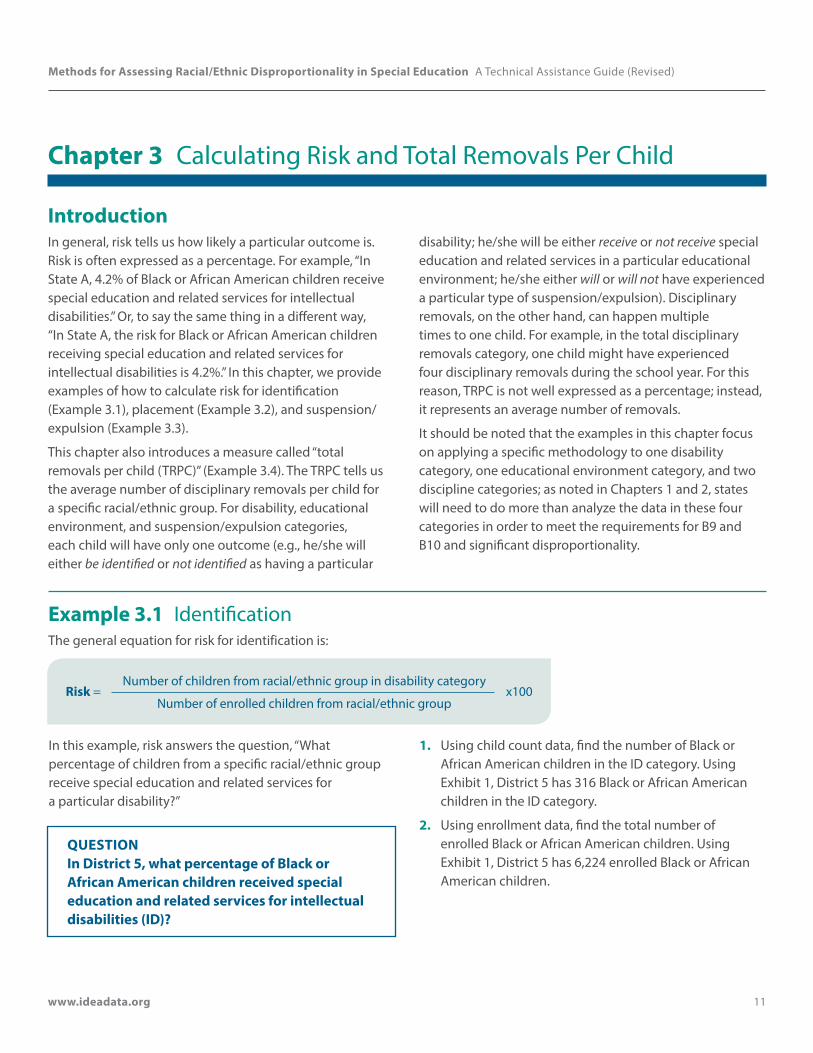
Chapter 3 Calculating Risk and Total Removals Per Child
IntroductionIn general, risk tells us how likely a particular outcome is. Risk is often expressed as a percentage. For example, “In State A, 4.2% of Black or African American children receive special education and related services for intellectual disabilities.” Or, to say the same thing in a different way, “In State A, the risk for Black or African American children receiving special education and related services for intellectual disabilities is 4.2%.” In this chapter, we provide examples of how to calculate risk for identification (Example 3.1), placement (Example 3.2), and suspension/expulsion (Example 3.3).
This chapter also introduces a measure called “total removals per child (TRPC)” (Example 3.4). The TRPC tells us the average number of disciplinary removals per child for a specific racial/ethnic group. For disability, educational environment, and suspension/expulsion categories, each child will have only one outcome (e.g., he/she will either be identified or not identified as having a particular
disability; he/she will be either receive or not receive special education and related services in a particular educational environment; he/she either will or will not have experienced a particular type of suspension/expulsion). Disciplinary removals, on the other hand, can happen multiple times to one child. For example, in the total disciplinary removals category, one child might have experienced four disciplinary removals during the school year. For this reason, TRPC is not well expressed as a percentage; instead, it represents an average number of removals.
It should be noted that the examples in this chapter focus on applying a specific methodology to one disability category, one educational environment category, and two discipline categories; as noted in Chapters 1 and 2, states will need to do more than analyze the data in these four categories in order to meet the requirements for B9 and B10 and significant disproportionality.
Example 3.1 IdentificationThe general equation for risk for identification is:
Risk = Number of children from racial/ethnic group in disability category
Number of enrolled children from racial/ethnic groupx100
In this example, risk answers the question, “What percentage of children from a specific racial/ethnic group receive special education and related services for a particular disability?”
QUESTION In District 5, what percentage of Black or African American children received special education and related services for intellectual disabilities (ID)?
1. Using child count data, find the number of Black or African American children in the ID category. Using Exhibit 1, District 5 has 316 Black or African American children in the ID category.
2. Using enrollment data, find the total number of enrolled Black or African American children. Using Exhibit 1, District 5 has 6,224 enrolled Black or African American children.
Methods for Assessing Racial/Ethnic Disproportionality in Special Education A Technical Assistance Guide (Revised)
www.ideadata.org 12
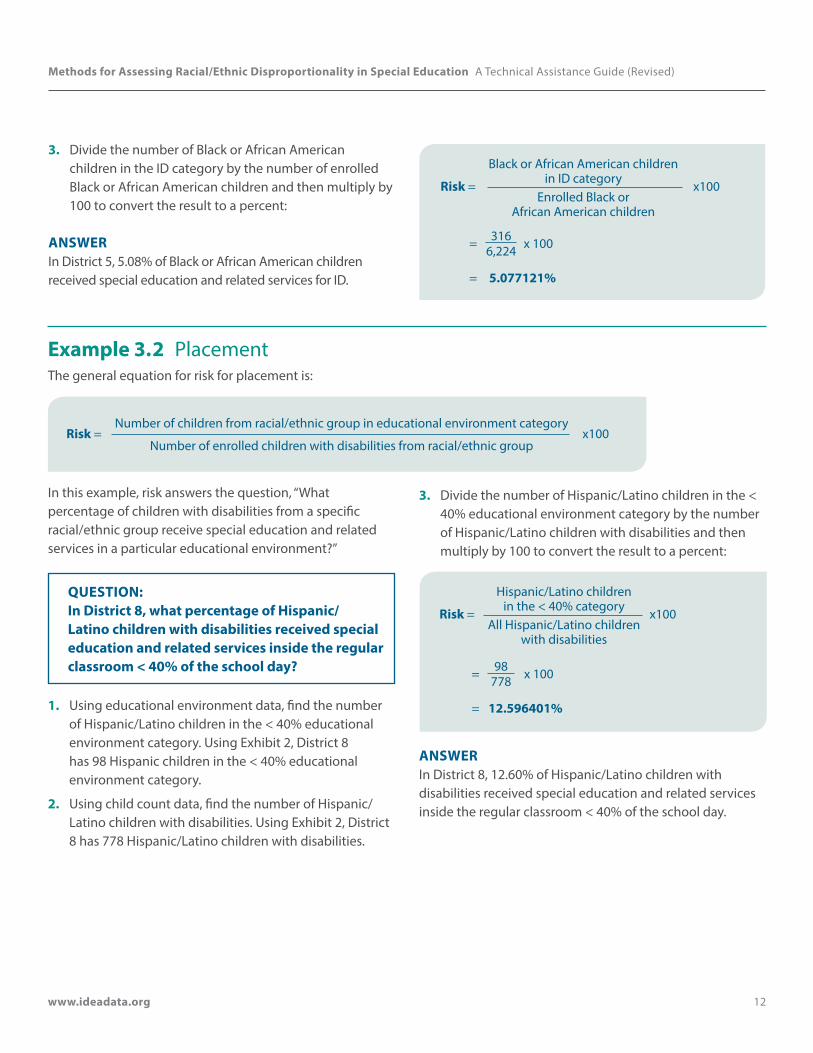
3. Divide the number of Black or African American children in the ID category by the number of enrolled Black or African American children and then multiply by 100 to convert the result to a percent:
Risk =
Black or African American children in ID category
Enrolled Black or African American children
x100
= 316 x 1006,224
= 5.077121%
ANSWER In District 5, 5.08% of Black or African American children received special education and related services for ID.
Example 3.2 Placement The general equation for risk for placement is:
Risk = Number of children from racial/ethnic group in educational environment category
Number of enrolled children with disabilities from racial/ethnic groupx100
In this example, risk answers the question, “What percentage of children with disabilities from a specific racial/ethnic group receive special education and related services in a particular educational environment?”
QUESTION: In District 8, what percentage of Hispanic/Latino children with disabilities received special education and related services inside the regular classroom < 40% of the school day?
1. Using educational environment data, find the number of Hispanic/Latino children in the < 40% educational environment category. Using Exhibit 2, District 8 has 98 Hispanic children in the < 40% educational environment category.
2. Using child count data, find the number of Hispanic/Latino children with disabilities. Using Exhibit 2, District 8 has 778 Hispanic/Latino children with disabilities.
3. Divide the number of Hispanic/Latino children in the < 40% educational environment category by the number of Hispanic/Latino children with disabilities and then multiply by 100 to convert the result to a percent:
Risk =
Hispanic/Latino children in the < 40% category
All Hispanic/Latino children with disabilities
x100
= 98 x 100778
= 12.596401%
ANSWER In District 8, 12.60% of Hispanic/Latino children with disabilities received special education and related services inside the regular classroom < 40% of the school day.
Methods for Assessing Racial/Ethnic Disproportionality in Special Education A Technical Assistance Guide (Revised)
www.ideadata.org 13
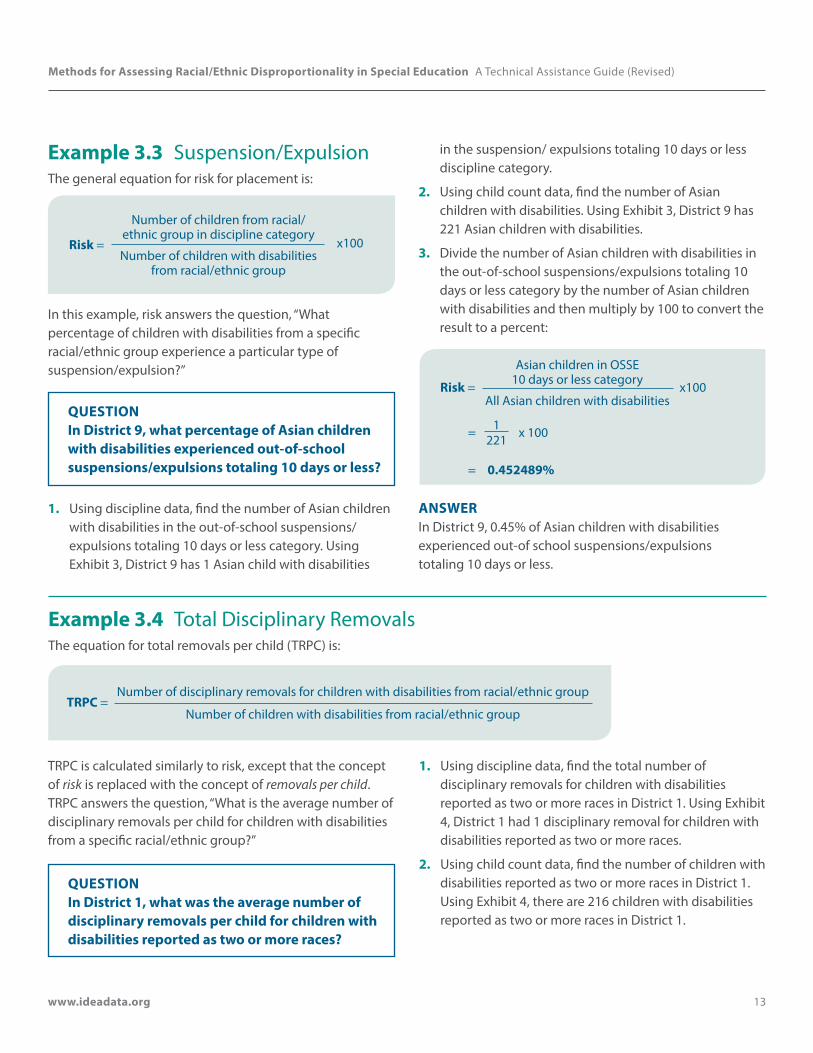
Example 3.3 Suspension/ExpulsionThe general equation for risk for placement is:
Risk =
Number of children from racial/ ethnic group in discipline category
Number of children with disabilities from racial/ethnic group
x100
In this example, risk answers the question, “What percentage of children with disabilities from a specific racial/ethnic group experience a particular type of suspension/expulsion?”
QUESTION In District 9, what percentage of Asian children with disabilities experienced out-of-school suspensions/expulsions totaling 10 days or less?
1. Using discipline data, find the number of Asian children with disabilities in the out-of-school suspensions/expulsions totaling 10 days or less category. Using Exhibit 3, District 9 has 1 Asian child with disabilities
in the suspension/ expulsions totaling 10 days or less discipline category.
2. Using child count data, find the number of Asian children with disabilities. Using Exhibit 3, District 9 has 221 Asian children with disabilities.
3. Divide the number of Asian children with disabilities in the out-of-school suspensions/expulsions totaling 10 days or less category by the number of Asian children with disabilities and then multiply by 100 to convert the result to a percent:
Risk =
Asian children in OSSE 10 days or less category
All Asian children with disabilitiesx100
= 1 x 100221
= 0.452489%
ANSWER In District 9, 0.45% of Asian children with disabilities experienced out-of school suspensions/expulsions totaling 10 days or less.
Example 3.4 Total Disciplinary RemovalsThe equation for total removals per child (TRPC) is:
TRPC = Number of disciplinary removals for children with disabilities from racial/ethnic group
Number of children with disabilities from racial/ethnic group
TRPC is calculated similarly to risk, except that the concept of risk is replaced with the concept of removals per child. TRPC answers the question, “What is the average number of disciplinary removals per child for children with disabilities from a specific racial/ethnic group?”
QUESTION In District 1, what was the average number of disciplinary removals per child for children with disabilities reported as two or more races?
1. Using discipline data, find the total number of disciplinary removals for children with disabilities reported as two or more races in District 1. Using Exhibit 4, District 1 had 1 disciplinary removal for children with disabilities reported as two or more races.
2. Using child count data, find the number of children with disabilities reported as two or more races in District 1. Using Exhibit 4, there are 216 children with disabilities reported as two or more races in District 1.
Methods for Assessing Racial/Ethnic Disproportionality in Special Education A Technical Assistance Guide (Revised)
www.ideadata.org 14
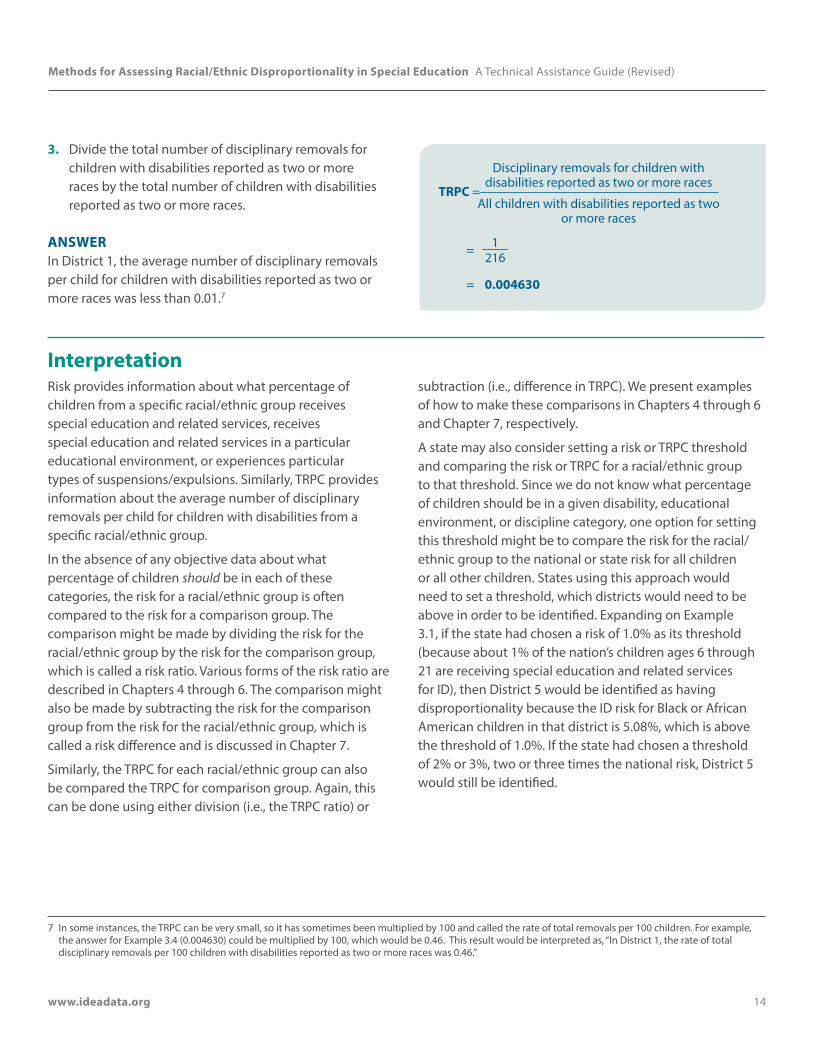
3. Divide the total number of disciplinary removals for children with disabilities reported as two or more races by the total number of children with disabilities reported as two or more races.
TRPC =
Disciplinary removals for children with disabilities reported as two or more races
All children with disabilities reported as two or more races
= 1216
= 0.004630
ANSWER In District 1, the average number of disciplinary removals per child for children with disabilities reported as two or more races was less than 0.01.7
InterpretationRisk provides information about what percentage of children from a specific racial/ethnic group receives special education and related services, receives special education and related services in a particular educational environment, or experiences particular types of suspensions/expulsions. Similarly, TRPC provides information about the average number of disciplinary removals per child for children with disabilities from a specific racial/ethnic group.
In the absence of any objective data about what percentage of children should be in each of these categories, the risk for a racial/ethnic group is often compared to the risk for a comparison group. The comparison might be made by dividing the risk for the racial/ethnic group by the risk for the comparison group, which is called a risk ratio. Various forms of the risk ratio are described in Chapters 4 through 6. The comparison might also be made by subtracting the risk for the comparison group from the risk for the racial/ethnic group, which is called a risk difference and is discussed in Chapter 7.
Similarly, the TRPC for each racial/ethnic group can also be compared the TRPC for comparison group. Again, this can be done using either division (i.e., the TRPC ratio) or
subtraction (i.e., difference in TRPC). We present examples of how to make these comparisons in Chapters 4 through 6 and Chapter 7, respectively.
A state may also consider setting a risk or TRPC threshold and comparing the risk or TRPC for a racial/ethnic group to that threshold. Since we do not know what percentage of children should be in a given disability, educational environment, or discipline category, one option for setting this threshold might be to compare the risk for the racial/ethnic group to the national or state risk for all children or all other children. States using this approach would need to set a threshold, which districts would need to be above in order to be identified. Expanding on Example 3.1, if the state had chosen a risk of 1.0% as its threshold (because about 1% of the nation’s children ages 6 through 21 are receiving special education and related services for ID), then District 5 would be identified as having disproportionality because the ID risk for Black or African American children in that district is 5.08%, which is above the threshold of 1.0%. If the state had chosen a threshold of 2% or 3%, two or three times the national risk, District 5 would still be identified.
7 In some instances, the TRPC can be very small, so it has sometimes been multiplied by 100 and called the rate of total removals per 100 children. For example, the answer for Example 3.4 (0.004630) could be multiplied by 100, which would be 0.46. This result would be interpreted as, “In District 1, the rate of total disciplinary removals per 100 children with disabilities reported as two or more races was 0.46.”

Methods for Assessing Racial/Ethnic Disproportionality in Special Education A Technical Assistance Guide (Revised)
www.ideadata.org 15
ConsiderationsThe risk for each racial/ethnic group is directly related to overall special education identification rates (Westat, 2003). In other words, the size of a racial/ethnic group’s risk for receiving special education and related services either for a particular disability or in a particular educational environment is directly related to the size of the overall risk for special education in the state or district.8 Higher special education identification rates at the state or district level will typically produce larger risks for all racial/ethnic groups, whereas lower special education identification rates will produce smaller risks. For example, a state or district with a high ID identification rate is likely to have larger ID risks for all of the racial/ethnic groups than a state or district with a relatively low ID identification rate. Likewise, a state or district with high special education identification rates is likely to have larger identification risks for all of the racial/ethnic groups than a state or district with low special education identification rates. Therefore, as described in the interpretation section above, states should consider these factors when selecting a comparison group and identifying thresholds.
8 It should be noted that these analyses examined only disability categories and educational environment categories; they did not examine discipline categories.
Methods for Assessing Racial/Ethnic Disproportionality in Special Education A Technical Assistance Guide (Revised)
www.ideadata.org 16
Chapter 4 Calculating Risk Ratios and Total Removals per Child Ratios
IntroductionWhile risk tells us, for example, what percentage of children from a specific racial/ethnic group receive special education and related services for a particular disability, the risk ratio tells us how the risk for one racial/ethnic group compares to the risk for a comparison group. For example, “In District 5, the risk for Black or African American children for receiving special education and related services for intellectual disabilities was 2.57 times the risk for all other children.” Or, to say the same thing in a different way, “In District 5, Black or African American children were 2.57 times as likely to receive special education and related services for intellectual disabilities than all other children.” In this chapter, we provide examples of how to calculate the risk ratio for identification (Example 4.1) using all other children as the comparison group. We also provide examples of how to calculate the risk ratio for placement (Example 4.2) and suspension/expulsion (Example 4.3) using all other children with disabilities as the comparison group.
The TRPC ratio is similar to the risk ratio. The TRPC ratio compares the average number of removals per child for children with disabilities from a specific racial/ethnic group to that of a comparison group. We provide an example of how to calculate the TRPC ratio, using all other children with disabilities as the comparison group (Example 4.4).
It should be noted that the examples in this chapter focus on applying a specific methodology to one disability category, one educational environment category, and two discipline categories; as noted in Chapters 1 and 2, states will need to do more than analyze the data in these four categories in order to meet the requirements for B9 and B10 and significant disproportionality.
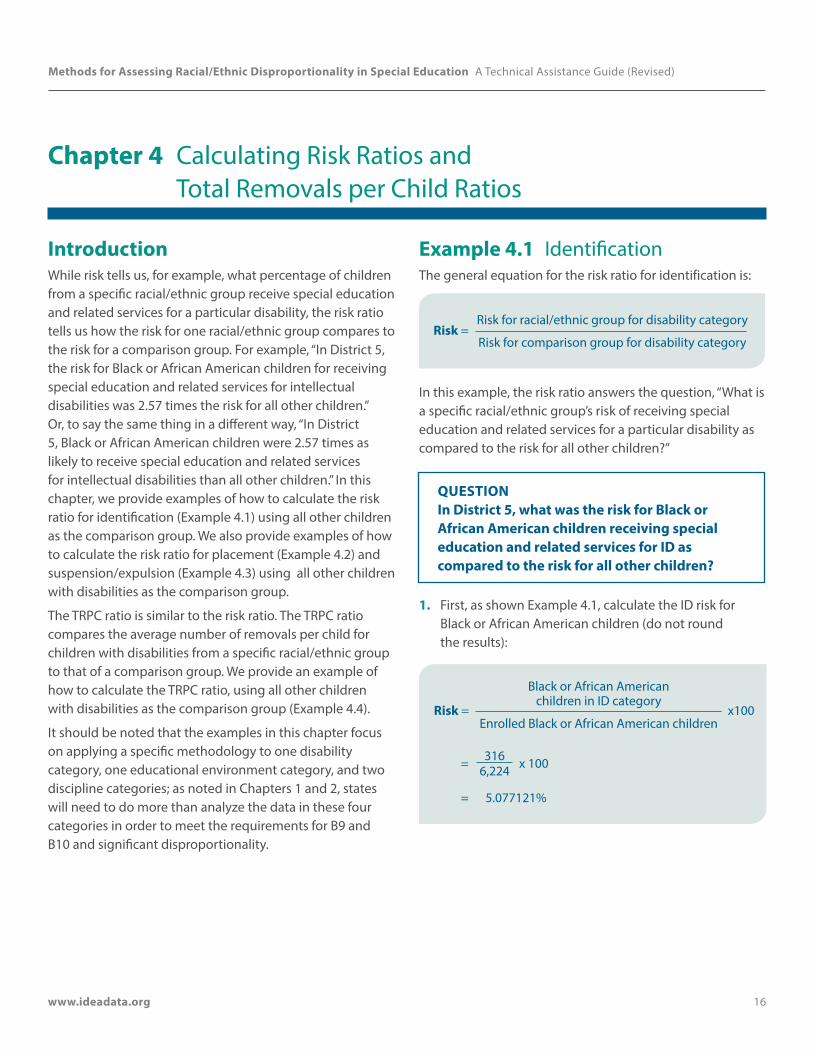
Example 4.1 IdentificationThe general equation for the risk ratio for identification is:
Risk = Risk for racial/ethnic group for disability category
Risk for comparison group for disability category
In this example, the risk ratio answers the question, “What is a specific racial/ethnic group’s risk of receiving special education and related services for a particular disability as compared to the risk for all other children?”
QUESTION In District 5, what was the risk for Black or African American children receiving special education and related services for ID as compared to the risk for all other children?
1. First, as shown Example 4.1, calculate the ID risk for Black or African American children (do not round the results):
Risk =
Black or African American children in ID category
Enrolled Black or African American childrenx100
= 316 x 1006,224
= 5.077121%
Methods for Assessing Racial/Ethnic Disproportionality in Special Education A Technical Assistance Guide (Revised)
www.ideadata.org 17
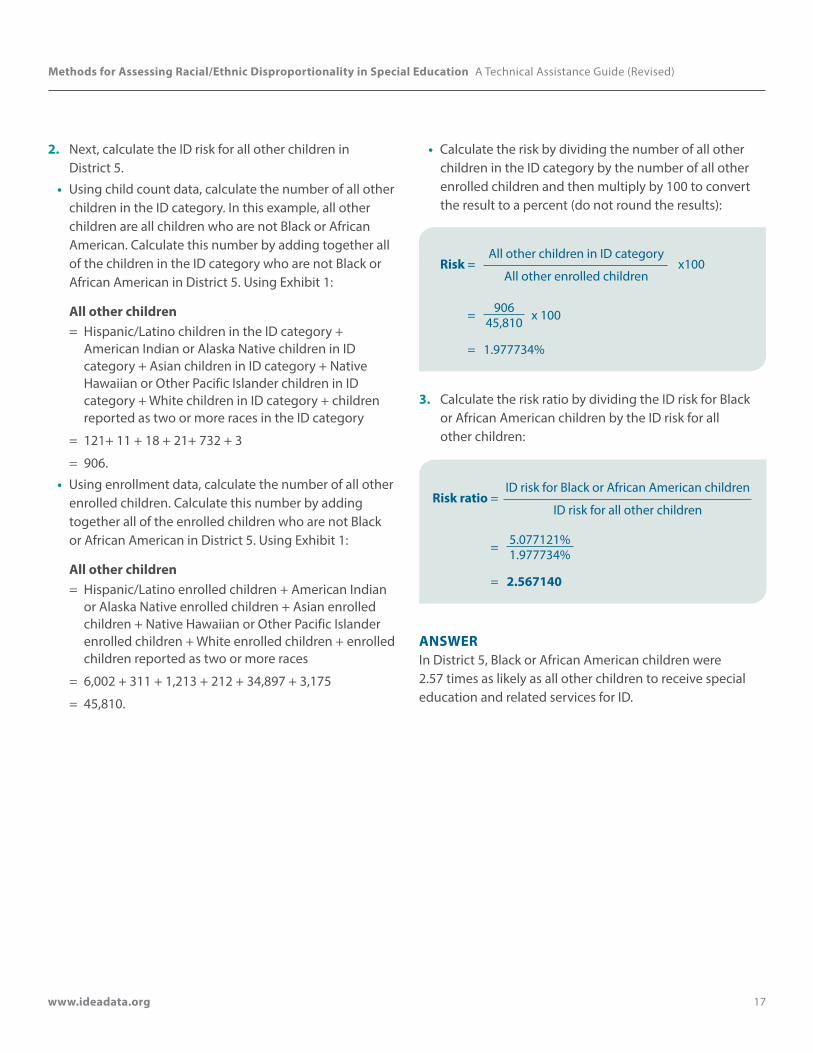
2. Next, calculate the ID risk for all other children in District 5.
• Using child count data, calculate the number of all other children in the ID category. In this example, all other children are all children who are not Black or African American. Calculate this number by adding together all of the children in the ID category who are not Black or African American in District 5. Using Exhibit 1:
All other children= Hispanic/Latino children in the ID category +
American Indian or Alaska Native children in ID category + Asian children in ID category + Native Hawaiian or Other Pacific Islander children in ID category + White children in ID category + children reported as two or more races in the ID category
= 121+ 11 + 18 + 21+ 732 + 3
= 906.
• Using enrollment data, calculate the number of all other enrolled children. Calculate this number by adding together all of the enrolled children who are not Black or African American in District 5. Using Exhibit 1:
All other children= Hispanic/Latino enrolled children + American Indian
or Alaska Native enrolled children + Asian enrolled children + Native Hawaiian or Other Pacific Islander enrolled children + White enrolled children + enrolled children reported as two or more races
= 6,002 + 311 + 1,213 + 212 + 34,897 + 3,175
= 45,810.
• Calculate the risk by dividing the number of all other children in the ID category by the number of all other enrolled children and then multiply by 100 to convert the result to a percent (do not round the results):
Risk = All other children in ID category
All other enrolled childrenx100
= 906 x 10045,810
= 1.977734%
3. Calculate the risk ratio by dividing the ID risk for Black or African American children by the ID risk for all other children:
Risk ratio = ID risk for Black or African American children
ID risk for all other children
= 5.077121%1.977734%
= 2.567140
ANSWER In District 5, Black or African American children were 2.57 times as likely as all other children to receive special education and related services for ID.

Methods for Assessing Racial/Ethnic Disproportionality in Special Education A Technical Assistance Guide (Revised)
www.ideadata.org 18
Example 4.2 Placement The general equation for the risk ratio for placement is:
Risk ratio = Risk for racial/ethnic group for educational environment category
Risk for comparison group for educational environment category
In this example, the risk ratio answers the question, “What is a specific racial/ethnic group’s risk for receiving special education and related services in a particular educational environment as compared to the risk for all other children with disabilities?”
QUESTION In District 8, what was the risk for Hispanic/Latino children with disabilities receiving special education and related services inside the regular classroom < 40% of the school day as compared to the risk for all other children with disabilities?
1. First, as shown in Example 4.2, calculate the < 40% educational environment risk for Hispanic/Latino children with disabilities in District 8 (do not round the results):
Risk
=Hispanic/Latino children in the < 40% category
x100All Hispanic/Latino children with disabilities
= 98 x 100778
= 12.596401%
2. Next, calculate the < 40% educational environment risk for all other children with disabilities in District 8:
• Using educational environment data, calculate the number of all other children in the < 40% educational environment category. In this example, all other children are children who are not Hispanic/Latino. Calculate this number by adding together all of the children in the < 40% educational environment category who are not Hispanic/Latino in District 8. Using Exhibit 2:
All other children= American Indian or Alaska Native children in < 40%
category + Asian children in < 40% category + Black or African American children in < 40% category + Native Hawaiian or Other Pacific Islander children in < 40% category + White children in < 40% category + children reported as two or more races in < 40% category
= 0 + 18 + 101 + 2 + 257 + 26
= 404.
• Using child count data, calculate the number of all other children with disabilities. Calculate this number by adding together all of the children with disabilities who are not Hispanic/Latino in District 8. Using Exhibit 2:
All other children= American Indian or Alaska Native children with
disabilities + Asian children with disabilities + Black or African American children with disabilities + Native Hawaiian or Other Pacific Islander children with disabilities + White children with disabilities + children with disabilities reported as two or more races
= 17 + 156 + 752 + 4 + 2,520 + 146
= 3,595.
Methods for Assessing Racial/Ethnic Disproportionality in Special Education A Technical Assistance Guide (Revised)
www.ideadata.org 19
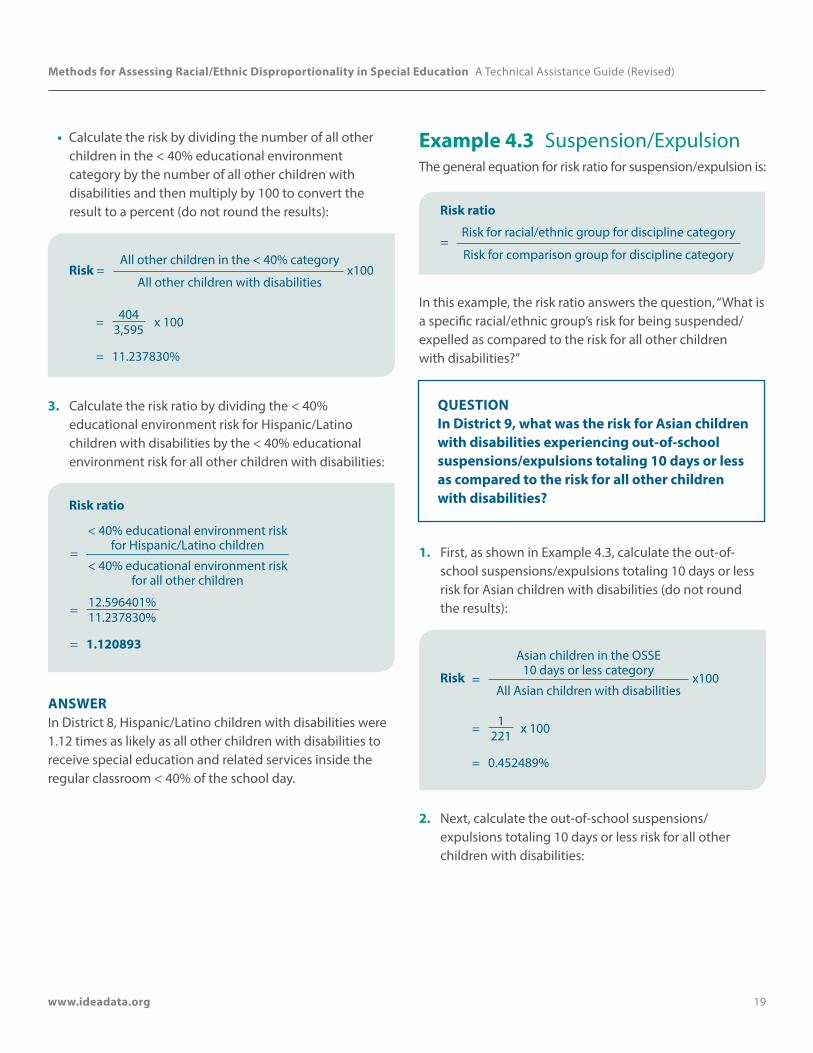
• Calculate the risk by dividing the number of all other children in the < 40% educational environment category by the number of all other children with disabilities and then multiply by 100 to convert the result to a percent (do not round the results):
Risk = All other children in the < 40% category
All other children with disabilitiesx100
= 404 x 1003,595
= 11.237830%
3. Calculate the risk ratio by dividing the < 40% educational environment risk for Hispanic/Latino children with disabilities by the < 40% educational environment risk for all other children with disabilities:
Risk ratio
=
< 40% educational environment risk for Hispanic/Latino children
< 40% educational environment risk for all other children
= 12.596401%11.237830%
= 1.120893
ANSWER In District 8, Hispanic/Latino children with disabilities were 1.12 times as likely as all other children with disabilities to receive special education and related services inside the regular classroom < 40% of the school day.
Example 4.3 Suspension/ExpulsionThe general equation for risk ratio for suspension/expulsion is:
Risk ratio
=Risk for racial/ethnic group for discipline category
Risk for comparison group for discipline category
In this example, the risk ratio answers the question, “What is a specific racial/ethnic group’s risk for being suspended/expelled as compared to the risk for all other children with disabilities?”
QUESTION In District 9, what was the risk for Asian children with disabilities experiencing out-of-school suspensions/expulsions totaling 10 days or less as compared to the risk for all other children with disabilities?
1. First, as shown in Example 4.3, calculate the out-of-school suspensions/expulsions totaling 10 days or less risk for Asian children with disabilities (do not round the results):
Risk =
Asian children in the OSSE 10 days or less category
x100All Asian children with disabilities
= 1 x 100221
= 0.452489%
2. Next, calculate the out-of-school suspensions/expulsions totaling 10 days or less risk for all other children with disabilities:
Methods for Assessing Racial/Ethnic Disproportionality in Special Education A Technical Assistance Guide (Revised)
www.ideadata.org 20
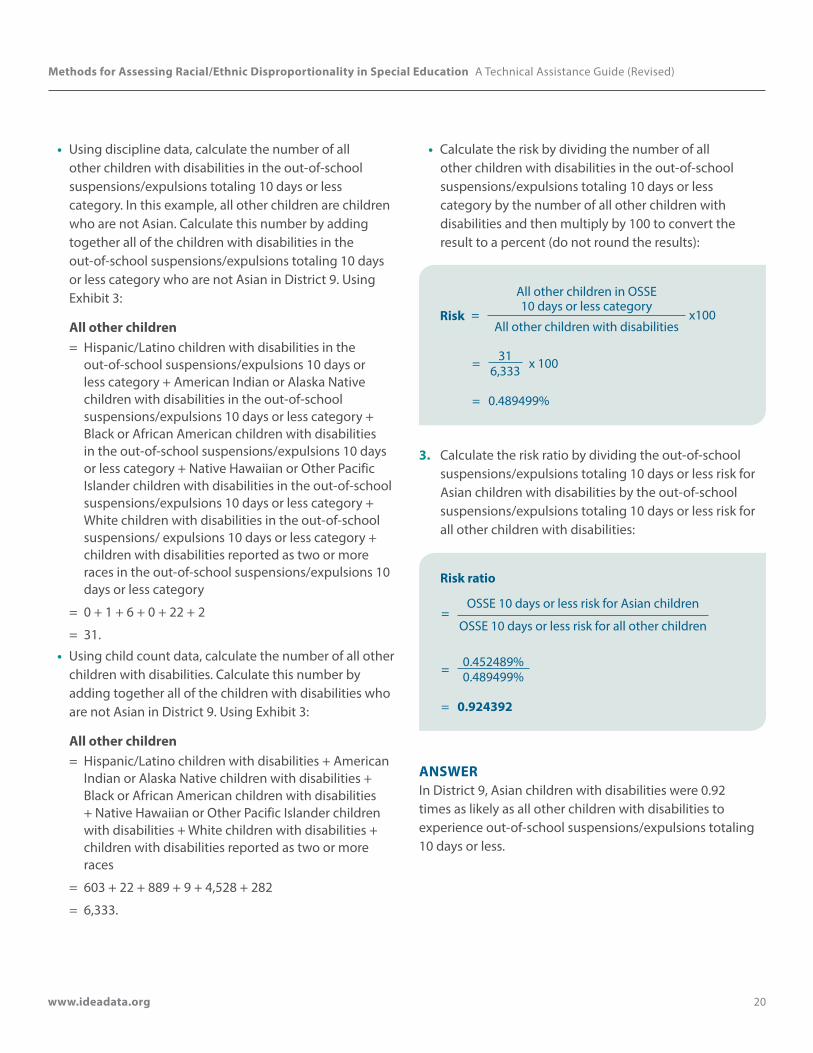
• Using discipline data, calculate the number of all other children with disabilities in the out-of-school suspensions/expulsions totaling 10 days or less category. In this example, all other children are children who are not Asian. Calculate this number by adding together all of the children with disabilities in the out-of-school suspensions/expulsions totaling 10 days or less category who are not Asian in District 9. Using Exhibit 3:
All other children= Hispanic/Latino children with disabilities in the
out-of-school suspensions/expulsions 10 days or less category + American Indian or Alaska Native children with disabilities in the out-of-school suspensions/expulsions 10 days or less category + Black or African American children with disabilities in the out-of-school suspensions/expulsions 10 days or less category + Native Hawaiian or Other Pacific Islander children with disabilities in the out-of-school suspensions/expulsions 10 days or less category + White children with disabilities in the out-of-school suspensions/ expulsions 10 days or less category + children with disabilities reported as two or more races in the out-of-school suspensions/expulsions 10 days or less category
= 0 + 1 + 6 + 0 + 22 + 2
= 31.
• Using child count data, calculate the number of all other children with disabilities. Calculate this number by adding together all of the children with disabilities who are not Asian in District 9. Using Exhibit 3:
All other children= Hispanic/Latino children with disabilities + American
Indian or Alaska Native children with disabilities + Black or African American children with disabilities + Native Hawaiian or Other Pacific Islander children with disabilities + White children with disabilities + children with disabilities reported as two or more races
= 603 + 22 + 889 + 9 + 4,528 + 282
= 6,333.
• Calculate the risk by dividing the number of all other children with disabilities in the out-of-school suspensions/expulsions totaling 10 days or less category by the number of all other children with disabilities and then multiply by 100 to convert the result to a percent (do not round the results):
=
All other children in OSSE 10 days or less category
x100All other children with disabilities
Risk
= 31 x 1006,333
= 0.489499%
3. Calculate the risk ratio by dividing the out-of-school suspensions/expulsions totaling 10 days or less risk for Asian children with disabilities by the out-of-school suspensions/expulsions totaling 10 days or less risk for all other children with disabilities:
Risk ratio
=OSSE 10 days or less risk for Asian children
OSSE 10 days or less risk for all other children
= 0.452489%0.489499%
= 0.924392
ANSWER In District 9, Asian children with disabilities were 0.92 times as likely as all other children with disabilities to experience out-of-school suspensions/expulsions totaling 10 days or less.

Methods for Assessing Racial/Ethnic Disproportionality in Special Education A Technical Assistance Guide (Revised)
www.ideadata.org 21
Example 4.4 Total Disciplinary RemovalsThe equation for the TRPC ratio is:
Risk = TRPC for racial/ethnic group
TRPC for comparison group
In this example, the TRPC ratio answers the question, “What is the average number of removals per child for children with disabilities from a specific racial/ethnic group as compared to that for all other children with disabilities?”
QUESTION In District 1, what was the average number of disciplinary removals per child for children with disabilities reported as two or more races as compared to that for all other children with disabilities?
1. First, as shown in Example 4.4, calculate the TRPC for children with disabilities reported as two or more races (do not round the results):
2. Next, calculate the TRPC for all other children with disabilities:
TRPC
=
Disciplinary removals for children with disabilities reported as two or more races
All children with disabilities reported as two or more races
= 1216
= 0.004630
• Using discipline data, calculate the total number of disciplinary removals for all other children with disabilities. In this example, all other children are children who are not reported as two or more races. Calculate this number by adding together all of the
disciplinary removals for all children with disabilities who are not reported as two or more races in District 1. Using Exhibit 4:
All other children= Total removals for Hispanic/Latino children with
disabilities + total removals for American Indian or Alaska Native children with disabilities + total removals for Asian children with disabilities + total removals for Black or African American children with disabilities + total removals for Native Hawaiian or Other Pacific Islander children with disabilities + total removals for White children with disabilities
= 4 + 0 + 3 + 42 + 1 + 65
= 115.
• Using child count data, calculate the number of all other children with disabilities. Calculate this number by adding together all of the children with disabilities who are not reported as two or more races in District 1. Using Exhibit 4:
All other children= Hispanic/Latino children with disabilities + American
Indian or Alaska Native children with disabilities + Asian children with disabilities + Black or African American children with disabilities + Native Hawaiian or Other Pacific Islander children with disabilities + White children with disabilities
= 904 + 14 + 225 + 1,268 + 9 + 3,024
= 5,444.
• Calculate the TRPC by dividing the total number of disciplinary removals for all other children with disabilities by the number of all other children with disabilities (do not round the results):
TRPC
=Disciplinary removals for all other children with disabilities
All other children with disabilities
= 1155,444
= 0.021124
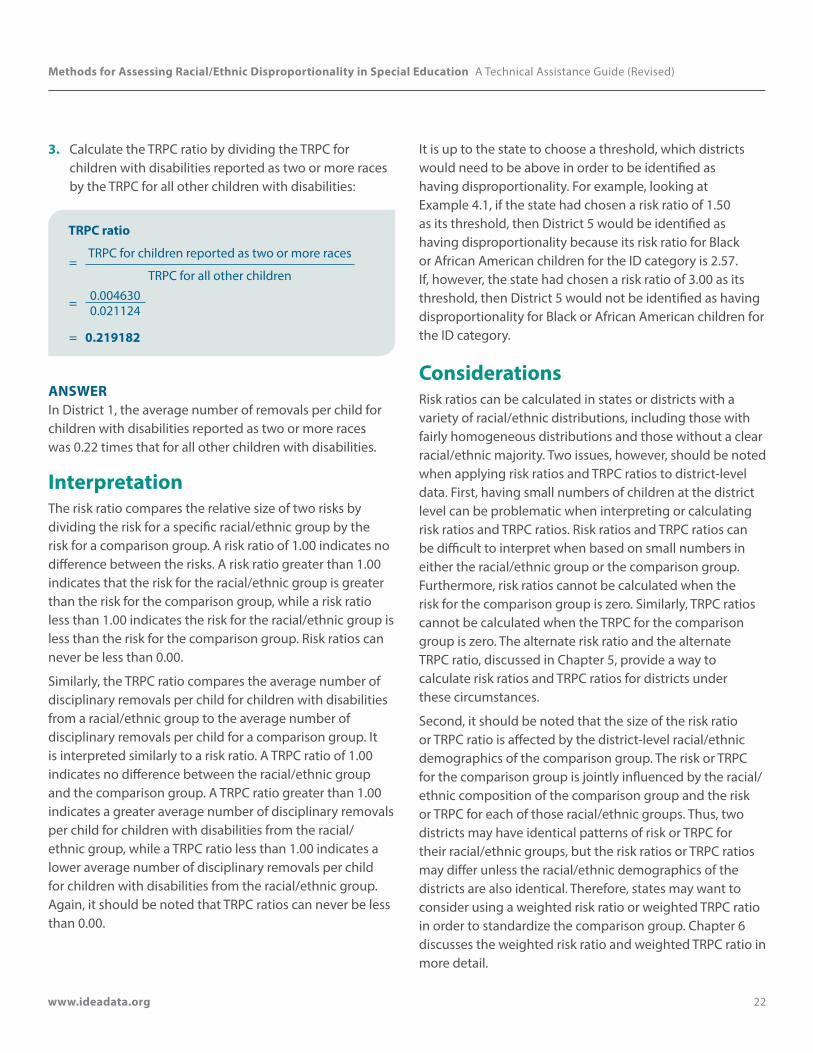
Methods for Assessing Racial/Ethnic Disproportionality in Special Education A Technical Assistance Guide (Revised)
www.ideadata.org 22
3. Calculate the TRPC ratio by dividing the TRPC for children with disabilities reported as two or more races by the TRPC for all other children with disabilities:
TRPC ratio
=TRPC for children reported as two or more races
TRPC for all other children
= 0.0046300.021124
= 0.219182
ANSWER In District 1, the average number of removals per child for children with disabilities reported as two or more races was 0.22 times that for all other children with disabilities.
InterpretationThe risk ratio compares the relative size of two risks by dividing the risk for a specific racial/ethnic group by the risk for a comparison group. A risk ratio of 1.00 indicates no difference between the risks. A risk ratio greater than 1.00 indicates that the risk for the racial/ethnic group is greater than the risk for the comparison group, while a risk ratio less than 1.00 indicates the risk for the racial/ethnic group is less than the risk for the comparison group. Risk ratios can never be less than 0.00.
Similarly, the TRPC ratio compares the average number of disciplinary removals per child for children with disabilities from a racial/ethnic group to the average number of disciplinary removals per child for a comparison group. It is interpreted similarly to a risk ratio. A TRPC ratio of 1.00 indicates no difference between the racial/ethnic group and the comparison group. A TRPC ratio greater than 1.00 indicates a greater average number of disciplinary removals per child for children with disabilities from the racial/ethnic group, while a TRPC ratio less than 1.00 indicates a lower average number of disciplinary removals per child for children with disabilities from the racial/ethnic group. Again, it should be noted that TRPC ratios can never be less than 0.00.
It is up to the state to choose a threshold, which districts would need to be above in order to be identified as having disproportionality. For example, looking at Example 4.1, if the state had chosen a risk ratio of 1.50 as its threshold, then District 5 would be identified as having disproportionality because its risk ratio for Black or African American children for the ID category is 2.57. If, however, the state had chosen a risk ratio of 3.00 as its threshold, then District 5 would not be identified as having disproportionality for Black or African American children for the ID category.
ConsiderationsRisk ratios can be calculated in states or districts with a variety of racial/ethnic distributions, including those with fairly homogeneous distributions and those without a clear racial/ethnic majority. Two issues, however, should be noted when applying risk ratios and TRPC ratios to district-level data. First, having small numbers of children at the district level can be problematic when interpreting or calculating risk ratios and TRPC ratios. Risk ratios and TRPC ratios can be difficult to interpret when based on small numbers in either the racial/ethnic group or the comparison group. Furthermore, risk ratios cannot be calculated when the risk for the comparison group is zero. Similarly, TRPC ratios cannot be calculated when the TRPC for the comparison group is zero. The alternate risk ratio and the alternate TRPC ratio, discussed in Chapter 5, provide a way to calculate risk ratios and TRPC ratios for districts under these circumstances.
Second, it should be noted that the size of the risk ratio or TRPC ratio is affected by the district-level racial/ethnic demographics of the comparison group. The risk or TRPC for the comparison group is jointly influenced by the racial/ethnic composition of the comparison group and the risk or TRPC for each of those racial/ethnic groups. Thus, two districts may have identical patterns of risk or TRPC for their racial/ethnic groups, but the risk ratios or TRPC ratios may differ unless the racial/ethnic demographics of the districts are also identical. Therefore, states may want to consider using a weighted risk ratio or weighted TRPC ratio in order to standardize the comparison group. Chapter 6 discusses the weighted risk ratio and weighted TRPC ratio in more detail.

Methods for Assessing Racial/Ethnic Disproportionality in Special Education A Technical Assistance Guide (Revised)
www.ideadata.org 23
Chapter 5 Calculating Alternate Risk Ratios and Alternate Total Removals Per Child Ratios
IntroductionCalculating risk ratios and TRPC ratios can sometimes be difficult at the district level. States, particularly those with smaller districts, may run into several issues:
• In some districts, there may be small numbers of children. When risk ratios and TRPC ratios are based on small numbers, minor variations in the number of children in either the racial/ethnic group or the comparison group can produce dramatic changes in the size of the risk ratio or the TRPC ratio. States may want to use a minimum cell size requirement and not calculate a risk ratio or TRPC for these districts (see Chapter 10 for a more detailed discussion of small cell sizes and minimum cell size requirements).
• There may instances where there are large enough numbers of children to calculate the risk or TRPC for the racial/ethnic group, but the numbers are too small to reliably calculate the risk or TRPC for the comparison group. In some instances, there may be no children in the comparison group so the risk or the TRPC for the comparison group cannot be calculated.
• There may also be instances where the risk or the TRPC for the comparison group is zero. In these instances, the risk ratio or TRPC ratio cannot be calculated.
States, therefore, may want to consider calculating an alternate risk ratio or an alternate TRPC ratio. The alternate risk ratio uses the district-level risk for the racial/ethnic group in the numerator and the state-level risk for the comparison group in the denominator. For example, “The risk for Black or African American children for receiving special education and related services for intellectual
disabilities in District 3 is 2.69 times the risk for all other children in State A.” Or, to say the same thing in a different way, “Black or African American children in District 3 are 2.69 times as likely to receive special education and related services for intellectual disabilities as all other children in State A.” In this chapter, we provide examples of how to calculate the alternate risk ratio for identification (Example 5.1) using all other children as the comparison group. We also provide examples of how to calculate the alternate risk ratio for placement (Example 5.2) and suspension/expulsion (Example 5.3) using all other children with disabilities as the comparison group.
Similarly, the alternate TRPC ratio uses the district-level TRPC for the racial/ethnic group in the numerator and the state-level TRPC for the comparison group in the denominator. We provide an example of the alternate TRPC (Example 5.4) using all other children with disabilities as the comparison group.
It should be noted that the examples in this chapter focus on applying a specific methodology to one disability category, one educational environment category, and two discipline categories; as noted in Chapters 1 and 2, states will need to do more than analyze the data in these four categories in order to meet the requirements for B9 and B10 and significant disproportionality.
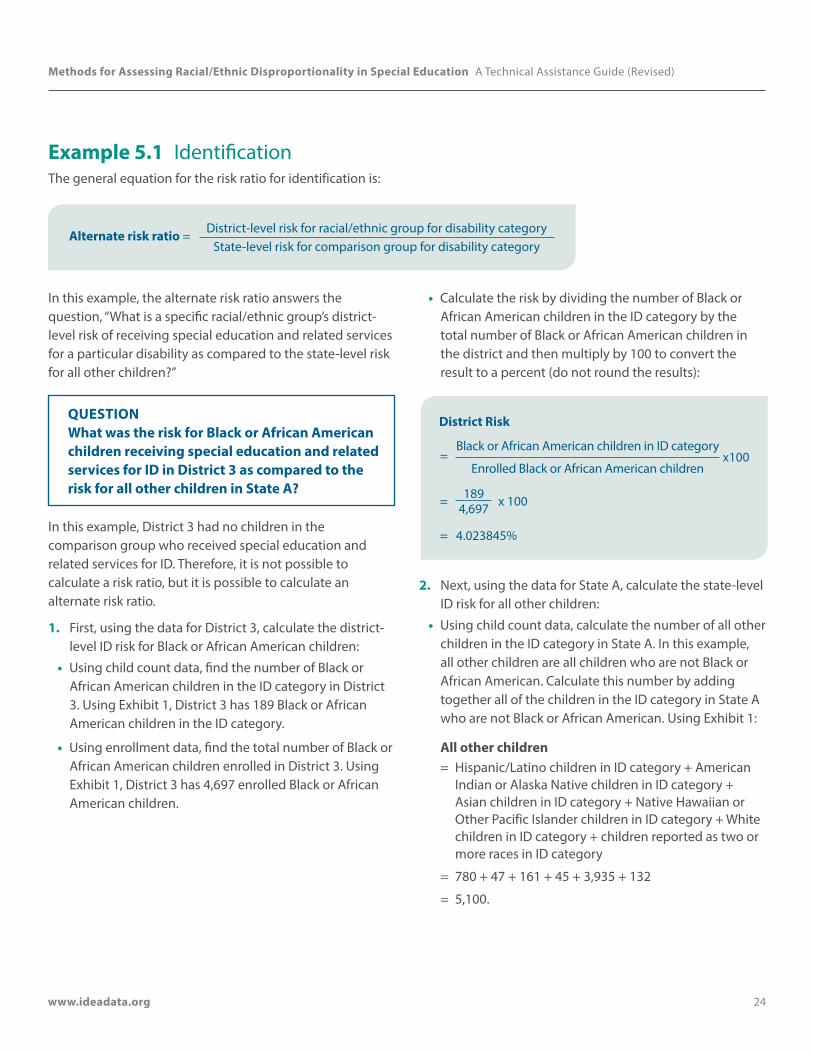
Methods for Assessing Racial/Ethnic Disproportionality in Special Education A Technical Assistance Guide (Revised)
www.ideadata.org 24
Example 5.1 IdentificationThe general equation for the risk ratio for identification is:
Alternate risk ratio = District-level risk for racial/ethnic group for disability category State-level risk for comparison group for disability category
In this example, the alternate risk ratio answers the question, “What is a specific racial/ethnic group’s district-level risk of receiving special education and related services for a particular disability as compared to the state-level risk for all other children?”
QUESTION What was the risk for Black or African American children receiving special education and related services for ID in District 3 as compared to the risk for all other children in State A?
In this example, District 3 had no children in the comparison group who received special education and related services for ID. Therefore, it is not possible to calculate a risk ratio, but it is possible to calculate an alternate risk ratio.
1. First, using the data for District 3, calculate the district-level ID risk for Black or African American children:
• Using child count data, find the number of Black or African American children in the ID category in District 3. Using Exhibit 1, District 3 has 189 Black or African American children in the ID category.
• Using enrollment data, find the total number of Black or African American children enrolled in District 3. Using Exhibit 1, District 3 has 4,697 enrolled Black or African American children.
• Calculate the risk by dividing the number of Black or African American children in the ID category by the total number of Black or African American children in the district and then multiply by 100 to convert the result to a percent (do not round the results):
District Risk
=Black or African American children in ID category
x100Enrolled Black or African American children
= 189 x 1004,697
= 4.023845%
2. Next, using the data for State A, calculate the state-level ID risk for all other children:
• Using child count data, calculate the number of all other children in the ID category in State A. In this example, all other children are all children who are not Black or African American. Calculate this number by adding together all of the children in the ID category in State A who are not Black or African American. Using Exhibit 1:
All other children= Hispanic/Latino children in ID category + American
Indian or Alaska Native children in ID category + Asian children in ID category + Native Hawaiian or Other Pacific Islander children in ID category + White children in ID category + children reported as two or more races in ID category
= 780 + 47 + 161 + 45 + 3,935 + 132
= 5,100.
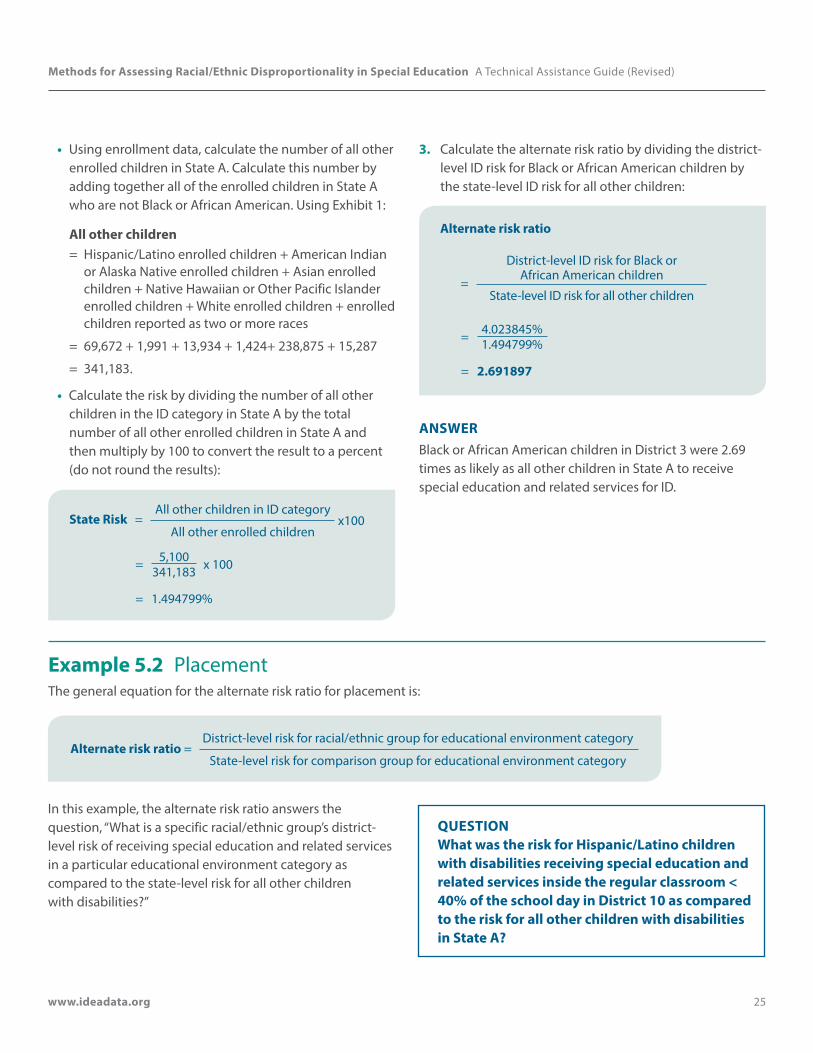
Methods for Assessing Racial/Ethnic Disproportionality in Special Education A Technical Assistance Guide (Revised)
www.ideadata.org 25
• Using enrollment data, calculate the number of all other enrolled children in State A. Calculate this number by adding together all of the enrolled children in State A who are not Black or African American. Using Exhibit 1:
All other children = Hispanic/Latino enrolled children + American Indian
or Alaska Native enrolled children + Asian enrolled children + Native Hawaiian or Other Pacific Islander enrolled children + White enrolled children + enrolled children reported as two or more races
= 69,672 + 1,991 + 13,934 + 1,424+ 238,875 + 15,287
= 341,183.
• Calculate the risk by dividing the number of all other children in the ID category in State A by the total number of all other enrolled children in State A and then multiply by 100 to convert the result to a percent (do not round the results):
State Risk =All other children in ID category
x100All other enrolled children
= 5,100 x 100341,183
= 1.494799%
3. Calculate the alternate risk ratio by dividing the district-level ID risk for Black or African American children by the state-level ID risk for all other children:
Alternate risk ratio
=
District-level ID risk for Black or African American children
State-level ID risk for all other children
= 4.023845%1.494799%
= 2.691897
ANSWERBlack or African American children in District 3 were 2.69 times as likely as all other children in State A to receive special education and related services for ID.
Example 5.2 PlacementThe general equation for the alternate risk ratio for placement is:
Alternate risk ratio = District-level risk for racial/ethnic group for educational environment category
State-level risk for comparison group for educational environment category
In this example, the alternate risk ratio answers the question, “What is a specific racial/ethnic group’s district-level risk of receiving special education and related services in a particular educational environment category as compared to the state-level risk for all other children with disabilities?”
QUESTION What was the risk for Hispanic/Latino children with disabilities receiving special education and related services inside the regular classroom < 40% of the school day in District 10 as compared to the risk for all other children with disabilities in State A?
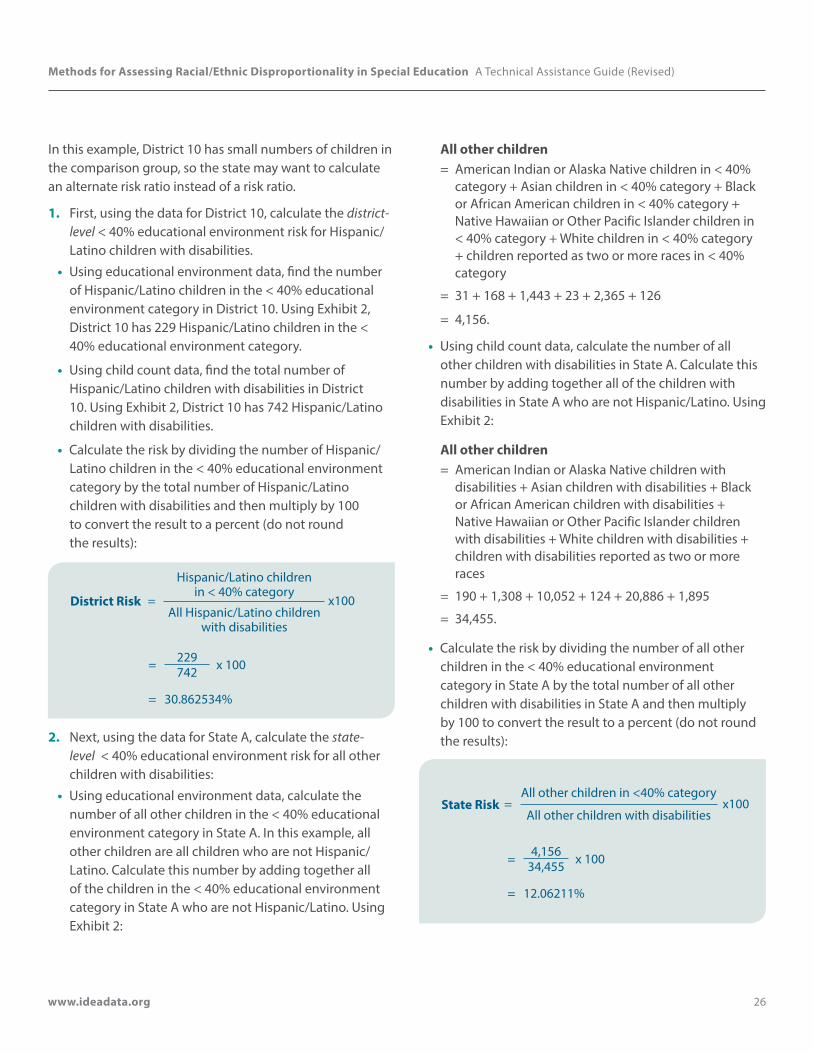
Methods for Assessing Racial/Ethnic Disproportionality in Special Education A Technical Assistance Guide (Revised)
www.ideadata.org 26
In this example, District 10 has small numbers of children in the comparison group, so the state may want to calculate an alternate risk ratio instead of a risk ratio.
1. First, using the data for District 10, calculate the district-level < 40% educational environment risk for Hispanic/Latino children with disabilities.
• Using educational environment data, find the number of Hispanic/Latino children in the < 40% educational environment category in District 10. Using Exhibit 2, District 10 has 229 Hispanic/Latino children in the < 40% educational environment category.
• Using child count data, find the total number of Hispanic/Latino children with disabilities in District 10. Using Exhibit 2, District 10 has 742 Hispanic/Latino children with disabilities.
• Calculate the risk by dividing the number of Hispanic/Latino children in the < 40% educational environment category by the total number of Hispanic/Latino children with disabilities and then multiply by 100 to convert the result to a percent (do not round the results):
District Risk =
Hispanic/Latino children in < 40% category
x100All Hispanic/Latino children
with disabilities
= 229 x 100742
= 30.862534%
2. Next, using the data for State A, calculate the state-level < 40% educational environment risk for all other children with disabilities:
• Using educational environment data, calculate the number of all other children in the < 40% educational environment category in State A. In this example, all other children are all children who are not Hispanic/Latino. Calculate this number by adding together all of the children in the < 40% educational environment category in State A who are not Hispanic/Latino. Using Exhibit 2:
All other children = American Indian or Alaska Native children in < 40%
category + Asian children in < 40% category + Black or African American children in < 40% category + Native Hawaiian or Other Pacific Islander children in < 40% category + White children in < 40% category + children reported as two or more races in < 40% category
= 31 + 168 + 1,443 + 23 + 2,365 + 126
= 4,156.
• Using child count data, calculate the number of all other children with disabilities in State A. Calculate this number by adding together all of the children with disabilities in State A who are not Hispanic/Latino. Using Exhibit 2:
All other children= American Indian or Alaska Native children with
disabilities + Asian children with disabilities + Black or African American children with disabilities + Native Hawaiian or Other Pacific Islander children with disabilities + White children with disabilities + children with disabilities reported as two or more races
= 190 + 1,308 + 10,052 + 124 + 20,886 + 1,895
= 34,455.
• Calculate the risk by dividing the number of all other children in the < 40% educational environment category in State A by the total number of all other children with disabilities in State A and then multiply by 100 to convert the result to a percent (do not round the results):
State Risk =All other children in <40% category
x100All other children with disabilities
= 4,156 x 10034,455
= 12.06211%

Methods for Assessing Racial/Ethnic Disproportionality in Special Education A Technical Assistance Guide (Revised)
www.ideadata.org 27
3. Calculate the alternate risk ratio by dividing the district-level < 40% educational environment risk for Hispanic/Latino children with disabilities by the state-level < 40% educational environment risk for all other children with disabilities:
Alternate risk ratio
=
District-level < 40% educational environment risk for Hispanic/Latino children
State-level < 40% educational environment risk for all other children
= 30.862534%12.06211%
= 2.558635
ANSWERHispanic/Latino children with disabilities in District 10 were 2.56 times as likely as all other children with disabilities in State A to receive special education and related services inside the regular classroom < 40% of the school day.
Example 5.3 Suspension/ExpulsionThe general equation for the alternate risk ratio for placement is:
Alternate risk ratio = District-level risk for racial/ethnic group for educational environment category
State-level risk for comparison group for educational environment category
In this example, the alternate risk ratio answers the question, “What is a specific racial/ethnic group’s district-level risk of being suspended/expelled as compared to the state-level risk for all other children with disabilities?”
QUESTION What was the risk for Native Hawaiian or Other Pacific Islander children with disabilities experiencing out-of-school suspensions/expulsions totaling 10 days or less in District 5 as compared to the risk for all other children with disabilities in State A?
In this example, District 5 had no children in the comparison group in the out-of-school suspensions/ expulsions totaling 10 days or less category. Therefore, it is not possible to calculate a risk ratio, but it is possible to calculate an alternate risk ratio.
1. First, calculate the district-level out-of-school suspensions/expulsions totaling 10 days or less risk for Native Hawaiian or Other Pacific Islander children with disabilities:
• Using discipline data, find the number of Native Hawaiian or Other Pacific Islander children with disabilities in the out-of-school suspensions/expulsions totaling 10 days or less category in District 5. Using Exhibit 3, District 5 has 1 Native Hawaiian or Other Pacific Islander child with disabilities in the out-of-school suspensions/expulsions totaling 10 days or less category.
• Using child count data, find the total number of Native Hawaiian or Other Pacific Islander children with disabilities in District 5. Using Exhibit 3, District 5 has 43 Native Hawaiian or Other Pacific Islander children with disabilities.
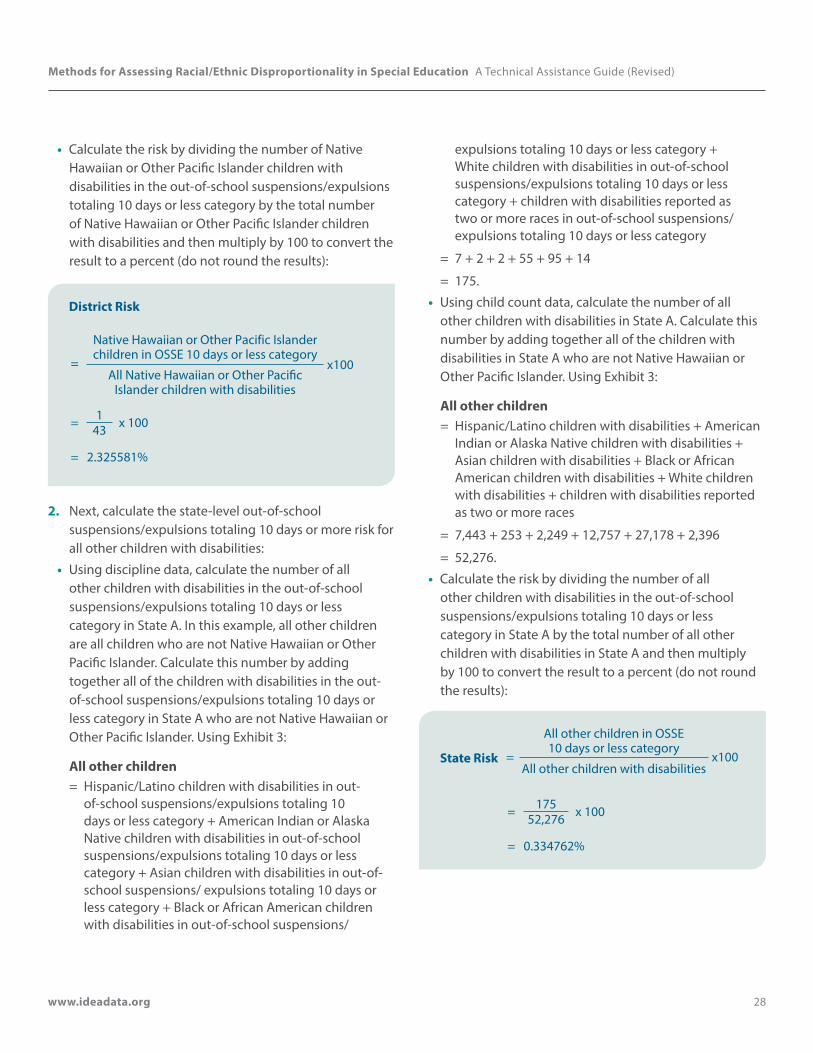
Methods for Assessing Racial/Ethnic Disproportionality in Special Education A Technical Assistance Guide (Revised)
www.ideadata.org 28
• Calculate the risk by dividing the number of NativeHawaiian or Other Pacific Islander children withdisabilities in the out-of-school suspensions/expulsionstotaling 10 days or less category by the total numberof Native Hawaiian or Other Pacific Islander childrenwith disabilities and then multiply by 100 to convert theresult to a percent (do not round the results):
District Risk
=
Native Hawaiian or Other Pacific Islander children in OSSE 10 days or less category
x100All Native Hawaiian or Other Pacific
Islander children with disabilities
= 1 x 10043
= 2.325581%
2. Next, calculate the state-level out-of-schoolsuspensions/expulsions totaling 10 days or more risk forall other children with disabilities:
• Using discipline data, calculate the number of allother children with disabilities in the out-of-schoolsuspensions/expulsions totaling 10 days or lesscategory in State A. In this example, all other childrenare all children who are not Native Hawaiian or OtherPacific Islander. Calculate this number by addingtogether all of the children with disabilities in the out-of-school suspensions/expulsions totaling 10 days orless category in State A who are not Native Hawaiian orOther Pacific Islander. Using Exhibit 3:
All other children= Hispanic/Latino children with disabilities in out-
of-school suspensions/expulsions totaling 10 days or less category + American Indian or Alaska Native children with disabilities in out-of-school suspensions/expulsions totaling 10 days or less category + Asian children with disabilities in out-of-school suspensions/ expulsions totaling 10 days or less category + Black or African American children with disabilities in out-of-school suspensions/
expulsions totaling 10 days or less category + White children with disabilities in out-of-school suspensions/expulsions totaling 10 days or less category + children with disabilities reported as two or more races in out-of-school suspensions/expulsions totaling 10 days or less category
= 7 + 2 + 2 + 55 + 95 + 14
= 175.
• Using child count data, calculate the number of allother children with disabilities in State A. Calculate thisnumber by adding together all of the children withdisabilities in State A who are not Native Hawaiian orOther Pacific Islander. Using Exhibit 3:
All other children = Hispanic/Latino children with disabilities + American
Indian or Alaska Native children with disabilities + Asian children with disabilities + Black or African American children with disabilities + White children with disabilities + children with disabilities reported as two or more races
= 7,443 + 253 + 2,249 + 12,757 + 27,178 + 2,396
= 52,276.
• Calculate the risk by dividing the number of allother children with disabilities in the out-of-schoolsuspensions/expulsions totaling 10 days or lesscategory in State A by the total number of all otherchildren with disabilities in State A and then multiplyby 100 to convert the result to a percent (do not roundthe results):
State Risk =
All other children in OSSE 10 days or less category
x100All other children with disabilities
= 175 x 10052,276
= 0.334762%
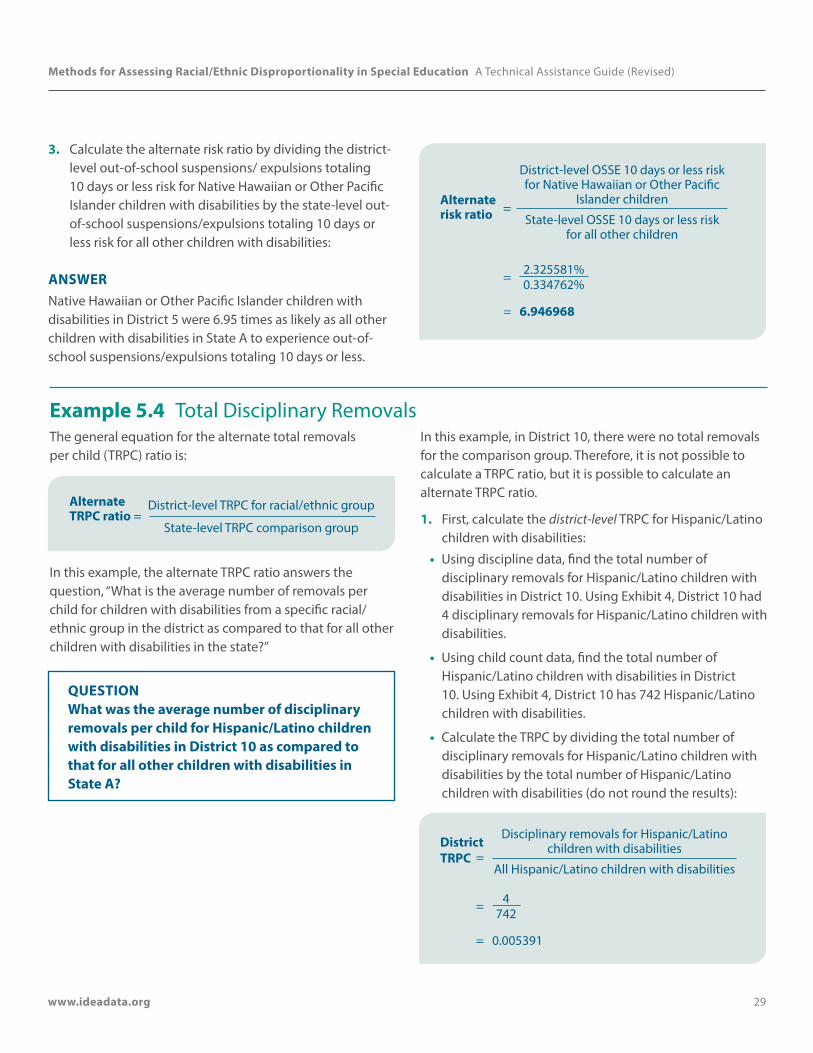
Methods for Assessing Racial/Ethnic Disproportionality in Special Education A Technical Assistance Guide (Revised)
www.ideadata.org 29
3. Calculate the alternate risk ratio by dividing the district-level out-of-school suspensions/ expulsions totaling 10 days or less risk for Native Hawaiian or Other Pacific Islander children with disabilities by the state-level out-of-school suspensions/expulsions totaling 10 days or less risk for all other children with disabilities:
Alternate risk ratio =
District-level OSSE 10 days or less risk for Native Hawaiian or Other Pacific
Islander children
State-level OSSE 10 days or less risk for all other children
= 2.325581%0.334762%
= 6.946968
ANSWERNative Hawaiian or Other Pacific Islander children with disabilities in District 5 were 6.95 times as likely as all other children with disabilities in State A to experience out-of-school suspensions/expulsions totaling 10 days or less.
Example 5.4 Total Disciplinary Removals The general equation for the alternate total removals per child (TRPC) ratio is:
Alternate TRPC ratio =
District-level TRPC for racial/ethnic group
State-level TRPC comparison group
In this example, the alternate TRPC ratio answers the question, “What is the average number of removals per child for children with disabilities from a specific racial/ethnic group in the district as compared to that for all other children with disabilities in the state?”
QUESTION What was the average number of disciplinary removals per child for Hispanic/Latino children with disabilities in District 10 as compared to that for all other children with disabilities in State A?
In this example, in District 10, there were no total removals for the comparison group. Therefore, it is not possible to calculate a TRPC ratio, but it is possible to calculate an alternate TRPC ratio.
1. First, calculate the district-level TRPC for Hispanic/Latino children with disabilities:
• Using discipline data, find the total number of disciplinary removals for Hispanic/Latino children with disabilities in District 10. Using Exhibit 4, District 10 had 4 disciplinary removals for Hispanic/Latino children with disabilities.
• Using child count data, find the total number of Hispanic/Latino children with disabilities in District 10. Using Exhibit 4, District 10 has 742 Hispanic/Latino children with disabilities.
• Calculate the TRPC by dividing the total number of disciplinary removals for Hispanic/Latino children with disabilities by the total number of Hispanic/Latino children with disabilities (do not round the results):
District TRPC =
Disciplinary removals for Hispanic/Latino children with disabilities
All Hispanic/Latino children with disabilities
= 4742
= 0.005391

Methods for Assessing Racial/Ethnic Disproportionality in Special Education A Technical Assistance Guide (Revised)
www.ideadata.org 30
2. Next, calculate the state-level TRPC for all other children with disabilities:
• Using discipline data, calculate the total disciplinary removals for all other children with disabilities in State A. In this example, all other children are all children who are not Hispanic/Latino. Calculate this number by adding together the total removals for all of the children with disabilities in State A who are not Hispanic/Latino. Using Exhibit 4:
All other children= Total removals for American Indian or Alaska Native
children with disabilities + total removals for Asian children with disabilities + total removals for Black or African American children with disabilities + total removals for Native Hawaiian or Other Pacific Islander children with disabilities + total removal for White children with disabilities + total removals for children with disabilities reported as two or more races
= 8 + 25 + 135 + 11 + 228 + 33
= 440.
• Using child count data, calculate the number of all other children with disabilities in State A. Calculate this number by adding together all of the children with disabilities in State A who are not Hispanic/Latino. Using Exhibit 4:
All other children= American Indian or Alaska Native children with
disabilities + Asian children with disabilities + Black or African American children with disabilities + Native Hawaiian or Other Pacific Islander children with disabilities + White children with disabilities + children with disabilities reported as two or more races
= 253 + 2,249 + 12,757 + 162 + 27,178 + 2,396
= 44,995.
• Calculate the TRPC for all other children with disabilities by dividing the total disciplinary removals for all other children with disabilities in State A by the total number of all other children with disabilities in State A (do not round the results):
State TRPC =
Disciplinary removals for all other children with disabilities
All other children with disabilities
= 44044,995
= 0.009779
3. Calculate the alternate TRPC ratio by dividing the district-level TRPC for Hispanic/Latino children with disabilities by the state-level TRPC for all other children with disabilities:
Alternate TRPC ratio =
District-level TRPC for Hispanic/Latino children
State-level TRPC for all other children
= 0.0053910.009779
= 0.551283
ANSWERThe average number of disciplinary removals per child for Hispanic/Latino children with disabilities in District 10 was 0.55 times that for all other children with disabilities in State A.
Methods for Assessing Racial/Ethnic Disproportionality in Special Education A Technical Assistance Guide (Revised)
www.ideadata.org 31
InterpretationThe alternate risk ratio compares the risk for a specific racial/ethnic group in a particular district to the state-level risk for a comparison group. Just like with a risk ratio, an alternate risk ratio of 1.00 indicates no difference between the risks. An alternate risk ratio greater than 1.00 indicates the district-level risk for the racial/ethnic group is greater than the state-level risk for the comparison group, while an alternate risk ratio less than 1.00 indicates the district-level risk for the racial/ethnic group is less than the state-level risk for the comparison group. Alternate risk ratios can never be less than 0.00.
Similarly, the alternate TRPC ratio compares the average number of disciplinary removals per child for children with disabilities from a racial/ethnic group in a particular district to the state-level average number of disciplinary removals per child for a comparison group. It is interpreted similarly to an alternate risk ratio. An alternate TRPC ratio of 1.00 indicates no difference between the racial/ethnic group and the state-level comparison group. A TRPC ratio greater than 1.00 indicates a greater average number of disciplinary removals per child for children with disabilities from the racial/ethnic group, while an alternate TRPC ratio less than 1.00 indicates a lower average number of disciplinary removals per child for children with disabilities from the racial/ethnic group. Again, it should be noted that alternate TRPC ratios can never be less than 0.00.
It is up to the state to pick a threshold, which districts would need to be above in order to be identified as having disproportionality. For example, looking at Example 5.1, if the state had chosen 1.50 as its threshold, then District 3 would be identified as having disproportionality because its alternate risk ratio for Black or African American children for the ID category is 2.69. If however, the state had chosen 3.00 as its threshold, then District 3 would not be identified as having disproportionality for Black or African American children in the ID category.
ConsiderationsThe alternate risk ratio addresses small cell sizes in the “all other” comparison group at the district level. Some states have a large number of districts with small numbers of children in some racial/ethnic groups. The alternate risk ratio provides a measure that is more reliable than the risk ratio in such circumstances and permits states to evaluate disproportionality in these districts. One potential drawback is that this measure compares children from a racial/ethnic group in one district to children from other racial/ethnic groups in the entire state, not just within the district being evaluated. These considerations apply equally to the alternate TRPC ratio.
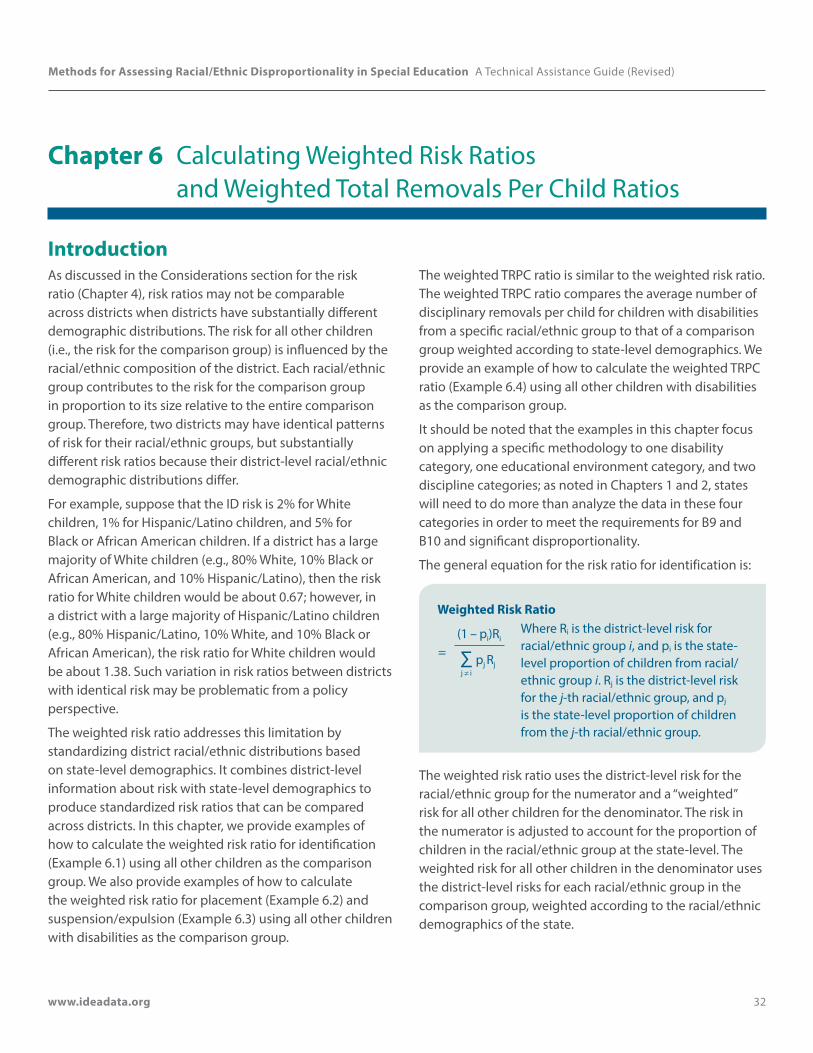
Methods for Assessing Racial/Ethnic Disproportionality in Special Education A Technical Assistance Guide (Revised)
www.ideadata.org 32
Chapter 6 Calculating Weighted Risk Ratios and Weighted Total Removals Per Child Ratios
IntroductionAs discussed in the Considerations section for the risk ratio (Chapter 4), risk ratios may not be comparable across districts when districts have substantially different demographic distributions. The risk for all other children (i.e., the risk for the comparison group) is influenced by the racial/ethnic composition of the district. Each racial/ethnic group contributes to the risk for the comparison group in proportion to its size relative to the entire comparison group. Therefore, two districts may have identical patterns of risk for their racial/ethnic groups, but substantially different risk ratios because their district-level racial/ethnic demographic distributions differ.
For example, suppose that the ID risk is 2% for White children, 1% for Hispanic/Latino children, and 5% for Black or African American children. If a district has a large majority of White children (e.g., 80% White, 10% Black or African American, and 10% Hispanic/Latino), then the risk ratio for White children would be about 0.67; however, in a district with a large majority of Hispanic/Latino children (e.g., 80% Hispanic/Latino, 10% White, and 10% Black or African American), the risk ratio for White children would be about 1.38. Such variation in risk ratios between districts with identical risk may be problematic from a policy perspective.
The weighted risk ratio addresses this limitation by standardizing district racial/ethnic distributions based on state-level demographics. It combines district-level information about risk with state-level demographics to produce standardized risk ratios that can be compared across districts. In this chapter, we provide examples of how to calculate the weighted risk ratio for identification (Example 6.1) using all other children as the comparison group. We also provide examples of how to calculate the weighted risk ratio for placement (Example 6.2) and suspension/expulsion (Example 6.3) using all other children with disabilities as the comparison group.
The weighted TRPC ratio is similar to the weighted risk ratio. The weighted TRPC ratio compares the average number of disciplinary removals per child for children with disabilities from a specific racial/ethnic group to that of a comparison group weighted according to state-level demographics. We provide an example of how to calculate the weighted TRPC ratio (Example 6.4) using all other children with disabilities as the comparison group.
It should be noted that the examples in this chapter focus on applying a specific methodology to one disability category, one educational environment category, and two discipline categories; as noted in Chapters 1 and 2, states will need to do more than analyze the data in these four categories in order to meet the requirements for B9 and B10 and significant disproportionality.
The general equation for the risk ratio for identification is:
Weighted Risk Ratio
=(1 – pi)Ri
∑ pj Rj j ≠ i
Where Ri is the district-level risk for racial/ethnic group i, and pi is the state-level proportion of children from racial/ethnic group i. Rj is the district-level risk for the j-th racial/ethnic group, and pj is the state-level proportion of children from the j-th racial/ethnic group.
The weighted risk ratio uses the district-level risk for the racial/ethnic group for the numerator and a “weighted” risk for all other children for the denominator. The risk in the numerator is adjusted to account for the proportion of children in the racial/ethnic group at the state-level. The weighted risk for all other children in the denominator uses the district-level risks for each racial/ethnic group in the comparison group, weighted according to the racial/ethnic demographics of the state.
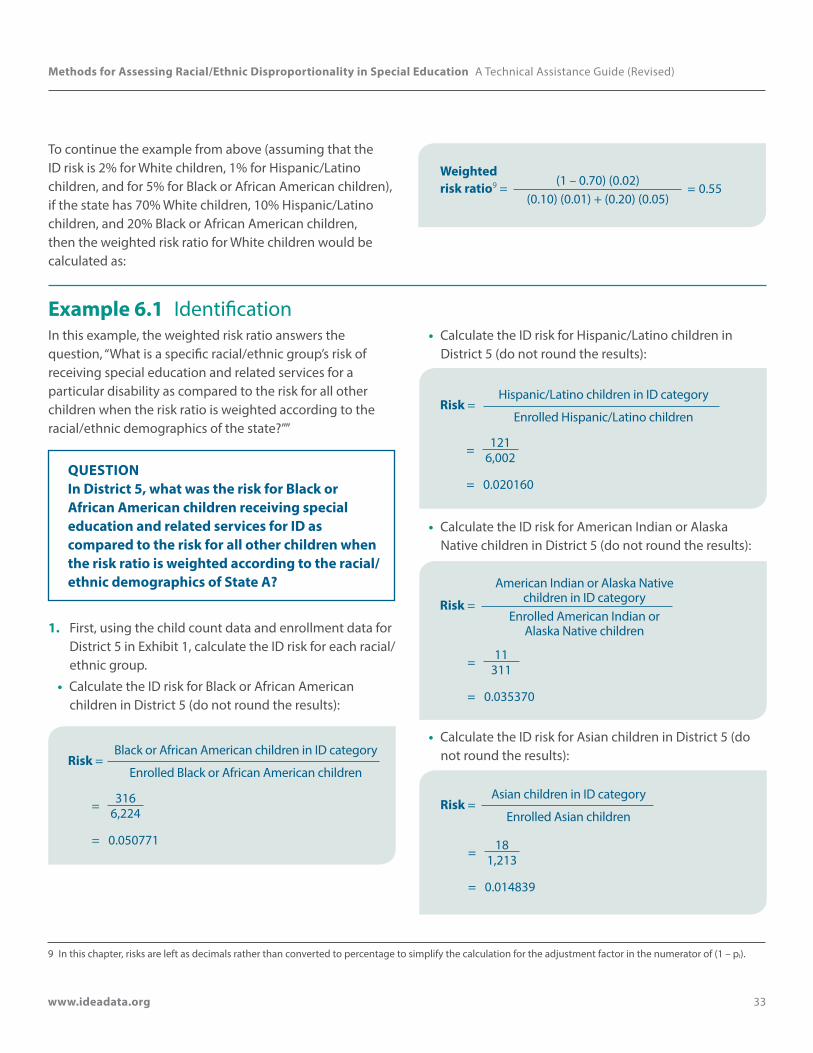
Methods for Assessing Racial/Ethnic Disproportionality in Special Education A Technical Assistance Guide (Revised)
www.ideadata.org 33
To continue the example from above (assuming that the ID risk is 2% for White children, 1% for Hispanic/Latino children, and for 5% for Black or African American children), if the state has 70% White children, 10% Hispanic/Latino children, and 20% Black or African American children, then the weighted risk ratio for White children would be calculated as:
Weighted risk ratio9 = (1 – 0.70) (0.02)
(0.10) (0.01) + (0.20) (0.05)= 0.55
Example 6.1 IdentificationIn this example, the weighted risk ratio answers the question, “What is a specific racial/ethnic group’s risk of receiving special education and related services for a particular disability as compared to the risk for all other children when the risk ratio is weighted according to the racial/ethnic demographics of the state?””
QUESTION In District 5, what was the risk for Black or African American children receiving special education and related services for ID as compared to the risk for all other children when the risk ratio is weighted according to the racial/ethnic demographics of State A?
1. First, using the child count data and enrollment data for District 5 in Exhibit 1, calculate the ID risk for each racial/ethnic group.
• Calculate the ID risk for Black or African American children in District 5 (do not round the results):
Risk = Black or African American children in ID category
Enrolled Black or African American children
= 316 6,224
= 0.050771
• Calculate the ID risk for Hispanic/Latino children in District 5 (do not round the results):
Risk = Hispanic/Latino children in ID category
Enrolled Hispanic/Latino children
= 1216,002
= 0.020160
• Calculate the ID risk for American Indian or Alaska Native children in District 5 (do not round the results):
Risk =
American Indian or Alaska Native children in ID category
Enrolled American Indian or Alaska Native children
= 11 311
= 0.035370
• Calculate the ID risk for Asian children in District 5 (do not round the results):
Risk = Asian children in ID category
Enrolled Asian children
= 18 1,213
= 0.014839
9 In this chapter, risks are left as decimals rather than converted to percentage to simplify the calculation for the adjustment factor in the numerator of (1 – pi).
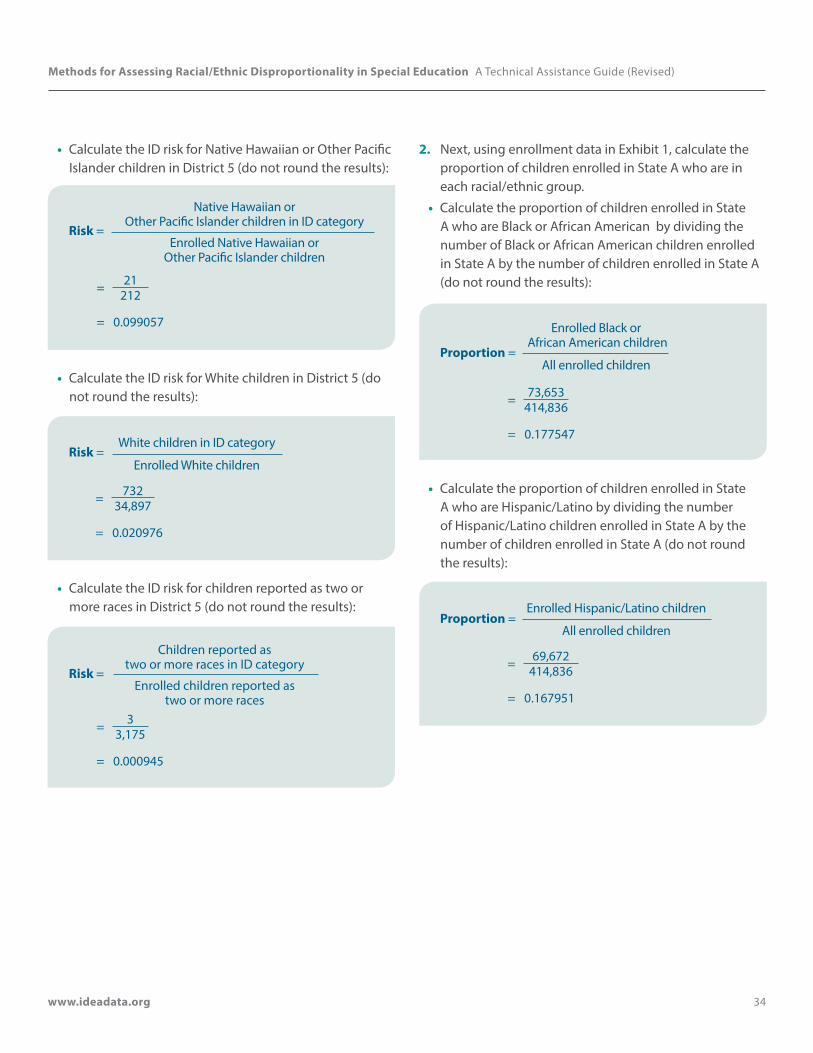
Methods for Assessing Racial/Ethnic Disproportionality in Special Education A Technical Assistance Guide (Revised)
www.ideadata.org 34
• Calculate the ID risk for Native Hawaiian or Other Pacific Islander children in District 5 (do not round the results):
Risk =
Native Hawaiian or Other Pacific Islander children in ID category
Enrolled Native Hawaiian or Other Pacific Islander children
= 21 212
= 0.099057
• Calculate the ID risk for White children in District 5 (do not round the results):
Risk = White children in ID category
Enrolled White children
= 732 34,897
= 0.020976
• Calculate the ID risk for children reported as two or more races in District 5 (do not round the results):
Children reported as two or more races in ID category
Enrolled children reported as two or more races
Risk =
= 3 3,175
= 0.000945
2. Next, using enrollment data in Exhibit 1, calculate the proportion of children enrolled in State A who are in each racial/ethnic group.
• Calculate the proportion of children enrolled in State A who are Black or African American by dividing the number of Black or African American children enrolled in State A by the number of children enrolled in State A (do not round the results):
Proportion =
Enrolled Black or African American children
All enrolled children
= 73,653 414,836
= 0.177547
• Calculate the proportion of children enrolled in State A who are Hispanic/Latino by dividing the number of Hispanic/Latino children enrolled in State A by the number of children enrolled in State A (do not round the results):
Proportion = Enrolled Hispanic/Latino children
All enrolled children
= 69,672 414,836
= 0.167951
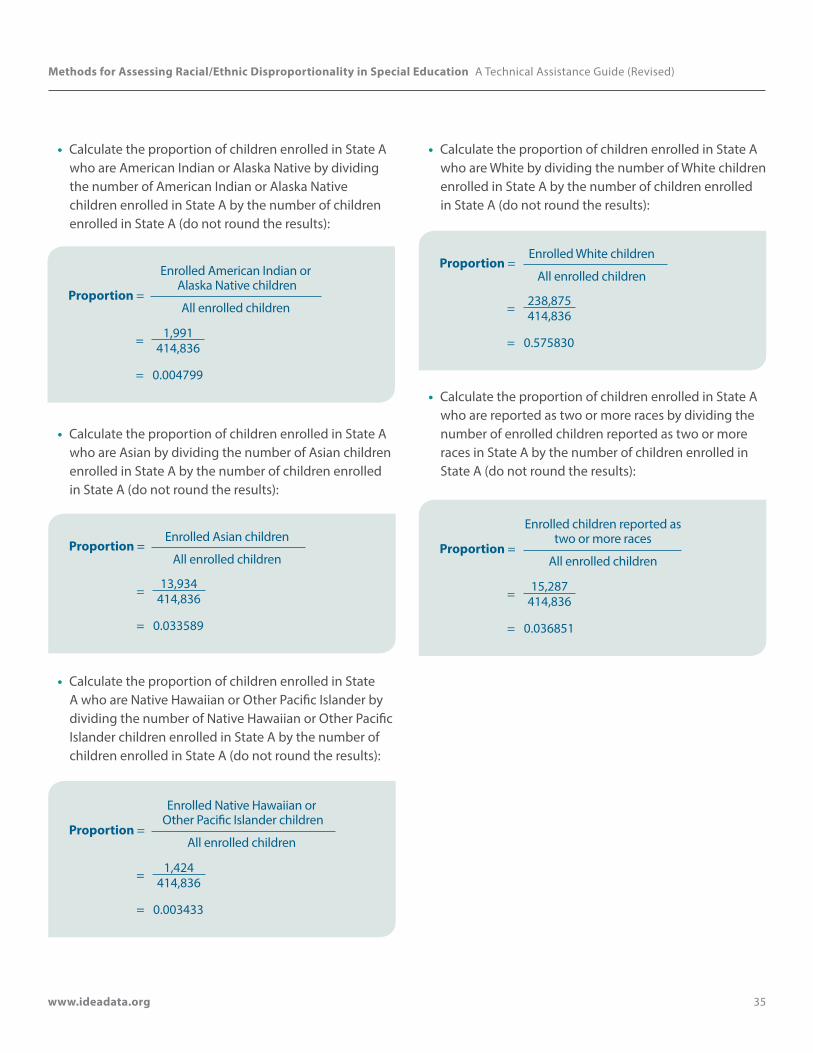
Methods for Assessing Racial/Ethnic Disproportionality in Special Education A Technical Assistance Guide (Revised)
www.ideadata.org 35
• Calculate the proportion of children enrolled in State A who are American Indian or Alaska Native by dividing the number of American Indian or Alaska Native children enrolled in State A by the number of children enrolled in State A (do not round the results):
Proportion =
Enrolled American Indian or Alaska Native children
All enrolled children
= 1,991 414,836
= 0.004799
• Calculate the proportion of children enrolled in State A who are Asian by dividing the number of Asian children enrolled in State A by the number of children enrolled in State A (do not round the results):
Proportion = Enrolled Asian children
All enrolled children
= 13,934 414,836
= 0.033589
• Calculate the proportion of children enrolled in State A who are Native Hawaiian or Other Pacific Islander by dividing the number of Native Hawaiian or Other Pacific Islander children enrolled in State A by the number of children enrolled in State A (do not round the results):
Proportion =
Enrolled Native Hawaiian or Other Pacific Islander children
All enrolled children
= 1,424 414,836
= 0.003433
• Calculate the proportion of children enrolled in State A who are White by dividing the number of White children enrolled in State A by the number of children enrolled in State A (do not round the results):
Proportion = Enrolled White children
All enrolled children
= 238,875 414,836
= 0.575830
• Calculate the proportion of children enrolled in State A who are reported as two or more races by dividing the number of enrolled children reported as two or more races in State A by the number of children enrolled in State A (do not round the results):
Proportion =
Enrolled children reported as two or more races
All enrolled children
= 15,287 414,836
= 0.036851
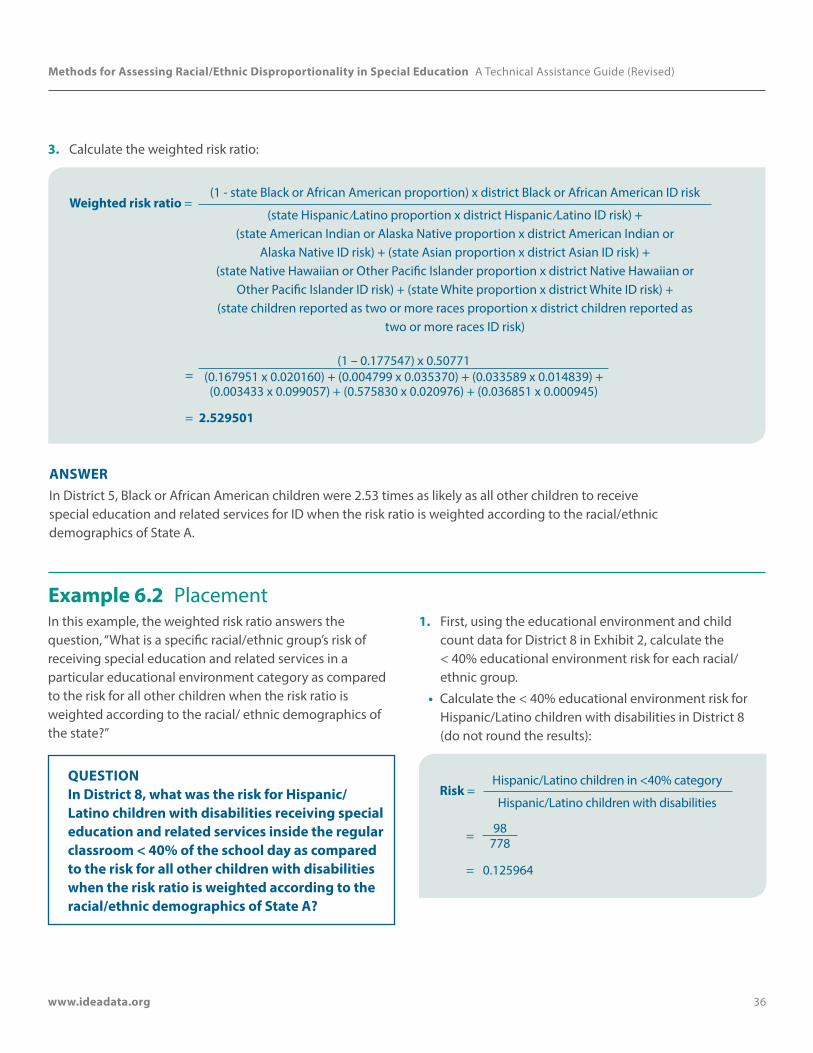
Methods for Assessing Racial/Ethnic Disproportionality in Special Education A Technical Assistance Guide (Revised)
www.ideadata.org 36
3. Calculate the weighted risk ratio:
Weighted risk ratio = (1 - state Black or African American proportion) x district Black or African American ID risk
(state Hispanic ⁄Latino proportion x district Hispanic ⁄Latino ID risk) + (state American Indian or Alaska Native proportion x district American Indian or
Alaska Native ID risk) + (state Asian proportion x district Asian ID risk) + (state Native Hawaiian or Other Pacific Islander proportion x district Native Hawaiian or
Other Pacific Islander ID risk) + (state White proportion x district White ID risk) + (state children reported as two or more races proportion x district children reported as
two or more races ID risk)
=(1 – 0.177547) x 0.50771
(0.167951 x 0.020160) + (0.004799 x 0.035370) + (0.033589 x 0.014839) + (0.003433 x 0.099057) + (0.575830 x 0.020976) + (0.036851 x 0.000945)
= 2.529501
ANSWERIn District 5, Black or African American children were 2.53 times as likely as all other children to receive special education and related services for ID when the risk ratio is weighted according to the racial/ethnic demographics of State A.
Example 6.2 PlacementIn this example, the weighted risk ratio answers the question, “What is a specific racial/ethnic group’s risk of receiving special education and related services in a particular educational environment category as compared to the risk for all other children when the risk ratio is weighted according to the racial/ ethnic demographics of the state?”
QUESTION In District 8, what was the risk for Hispanic/Latino children with disabilities receiving special education and related services inside the regular classroom < 40% of the school day as compared to the risk for all other children with disabilities when the risk ratio is weighted according to the racial/ethnic demographics of State A?
1. First, using the educational environment and child count data for District 8 in Exhibit 2, calculate the < 40% educational environment risk for each racial/ethnic group.
• Calculate the < 40% educational environment risk for Hispanic/Latino children with disabilities in District 8 (do not round the results):
Risk = Hispanic/Latino children in <40% category
Hispanic/Latino children with disabilities
= 98 778
= 0.125964
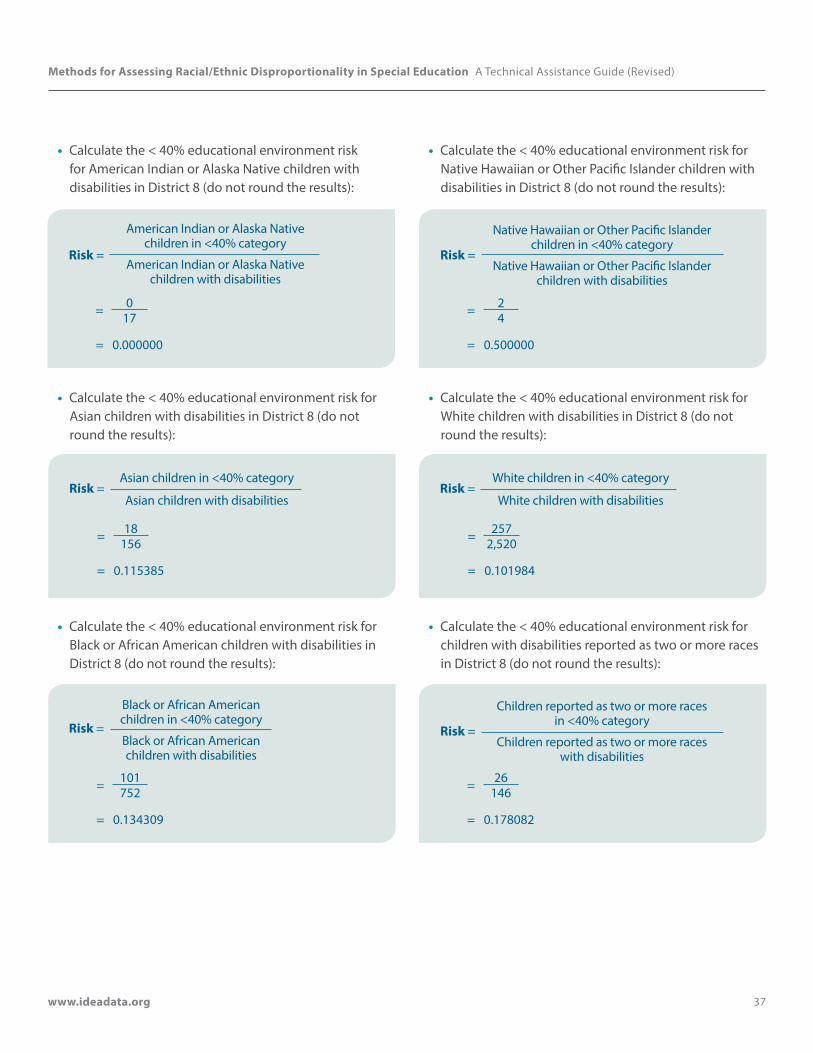
Methods for Assessing Racial/Ethnic Disproportionality in Special Education A Technical Assistance Guide (Revised)
www.ideadata.org 37
• Calculate the < 40% educational environment risk for American Indian or Alaska Native children with disabilities in District 8 (do not round the results):
Risk =
American Indian or Alaska Native children in <40% category
American Indian or Alaska Native children with disabilities
= 0 17
= 0.000000
• Calculate the < 40% educational environment risk for Asian children with disabilities in District 8 (do not round the results):
Risk = Asian children in <40% category
Asian children with disabilities
= 18 156
= 0.115385
• Calculate the < 40% educational environment risk for Black or African American children with disabilities in District 8 (do not round the results):
Risk =
Black or African American children in <40% category
Black or African American children with disabilities
= 101 752
= 0.134309
• Calculate the < 40% educational environment risk for Native Hawaiian or Other Pacific Islander children with disabilities in District 8 (do not round the results):
Risk =
Native Hawaiian or Other Pacific Islander children in <40% category
Native Hawaiian or Other Pacific Islander children with disabilities
= 2 4
= 0.500000
• Calculate the < 40% educational environment risk for White children with disabilities in District 8 (do not round the results):
Risk = White children in <40% category
White children with disabilities
= 257 2,520
= 0.101984
• Calculate the < 40% educational environment risk for children with disabilities reported as two or more races in District 8 (do not round the results):
Risk =
Children reported as two or more races in <40% category
Children reported as two or more races with disabilities
= 26 146
= 0.178082
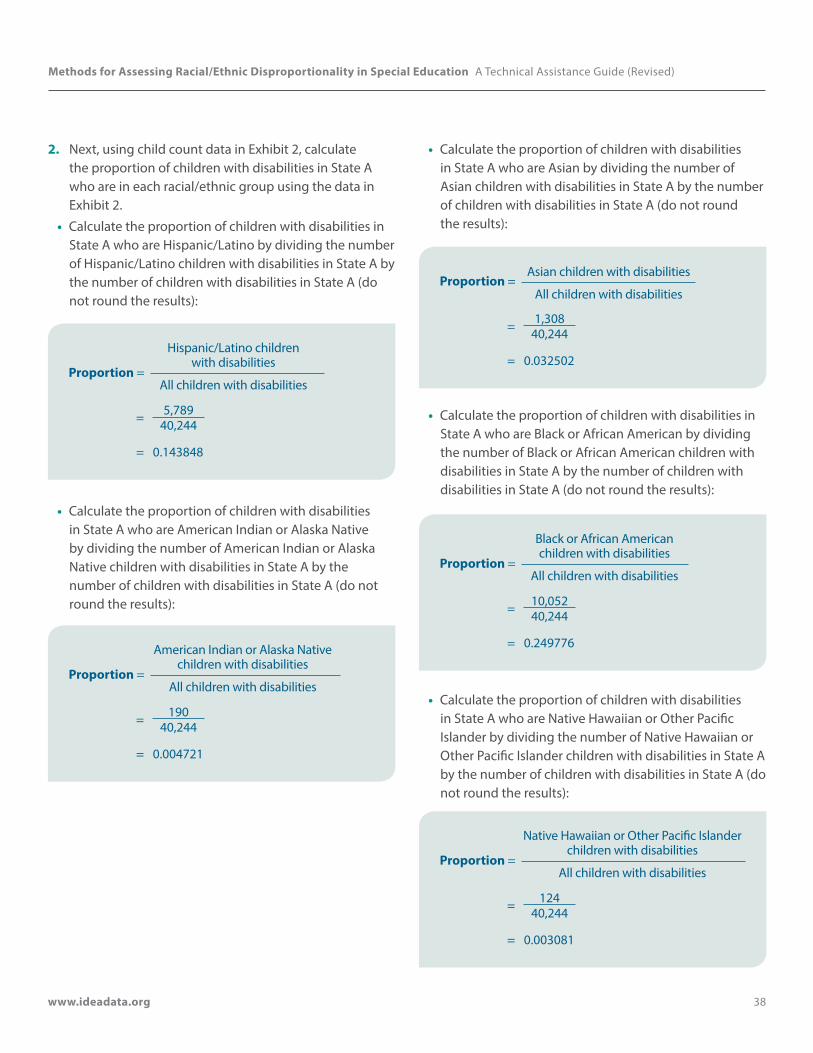
Methods for Assessing Racial/Ethnic Disproportionality in Special Education A Technical Assistance Guide (Revised)
www.ideadata.org 38
2. Next, using child count data in Exhibit 2, calculate the proportion of children with disabilities in State A who are in each racial/ethnic group using the data in Exhibit 2.
• Calculate the proportion of children with disabilities in State A who are Hispanic/Latino by dividing the number of Hispanic/Latino children with disabilities in State A by the number of children with disabilities in State A (do not round the results):
Proportion =
Hispanic/Latino children with disabilities
All children with disabilities
= 5,789 40,244
= 0.143848
• Calculate the proportion of children with disabilities in State A who are American Indian or Alaska Native by dividing the number of American Indian or Alaska Native children with disabilities in State A by the number of children with disabilities in State A (do not round the results):
Proportion =
American Indian or Alaska Native children with disabilities
All children with disabilities
= 190 40,244
= 0.004721
• Calculate the proportion of children with disabilities in State A who are Asian by dividing the number of Asian children with disabilities in State A by the number of children with disabilities in State A (do not round the results):
Proportion = Asian children with disabilities
All children with disabilities
= 1,308 40,244
= 0.032502
• Calculate the proportion of children with disabilities in State A who are Black or African American by dividing the number of Black or African American children with disabilities in State A by the number of children with disabilities in State A (do not round the results):
Proportion =
Black or African American children with disabilities
All children with disabilities
= 10,052 40,244
= 0.249776
• Calculate the proportion of children with disabilities in State A who are Native Hawaiian or Other Pacific Islander by dividing the number of Native Hawaiian or Other Pacific Islander children with disabilities in State A by the number of children with disabilities in State A (do not round the results):
Proportion =
Native Hawaiian or Other Pacific Islander children with disabilities
All children with disabilities
= 124 40,244
= 0.003081
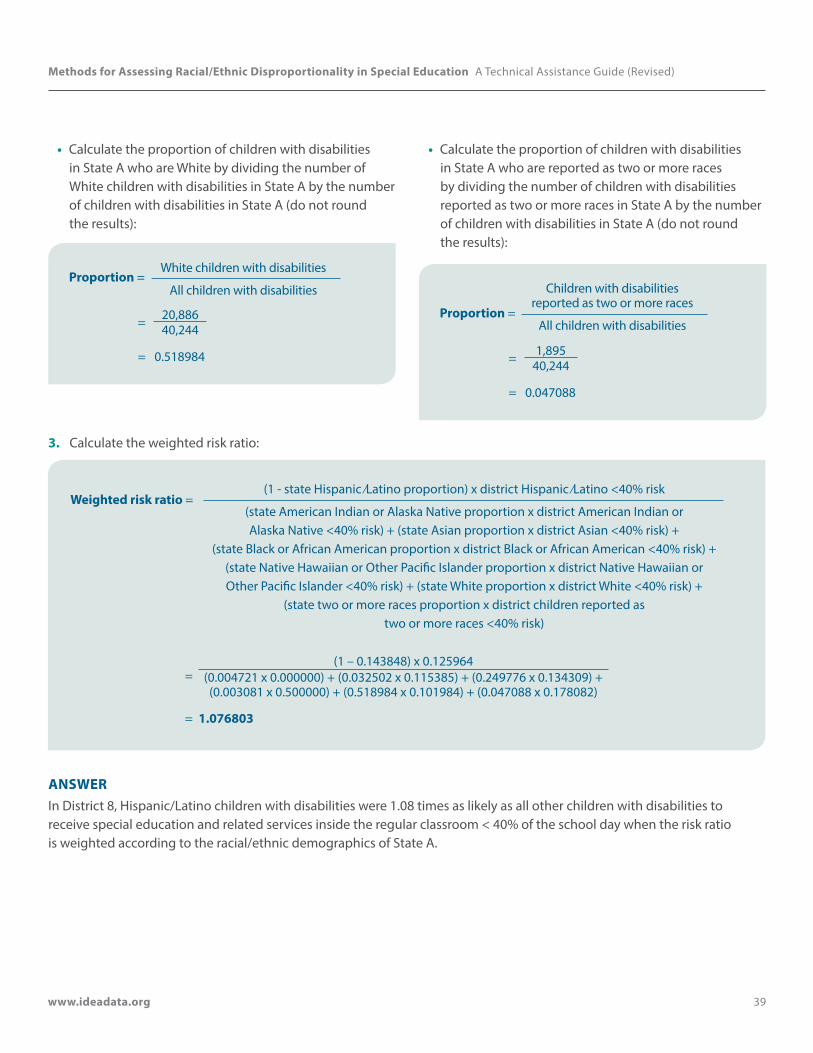
Methods for Assessing Racial/Ethnic Disproportionality in Special Education A Technical Assistance Guide (Revised)
www.ideadata.org 39
• Calculate the proportion of children with disabilities in State A who are White by dividing the number of White children with disabilities in State A by the number of children with disabilities in State A (do not round the results):
Proportion = White children with disabilities
All children with disabilities
= 20,886 40,244
= 0.518984
• Calculate the proportion of children with disabilities in State A who are reported as two or more races by dividing the number of children with disabilities reported as two or more races in State A by the number of children with disabilities in State A (do not round the results):
Proportion =
Children with disabilities reported as two or more races
All children with disabilities
= 1,895 40,244
= 0.047088
3. Calculate the weighted risk ratio:
Weighted risk ratio = (1 - state Hispanic ⁄Latino proportion) x district Hispanic ⁄Latino <40% risk
(state American Indian or Alaska Native proportion x district American Indian or Alaska Native <40% risk) + (state Asian proportion x district Asian <40% risk) +
(state Black or African American proportion x district Black or African American <40% risk) + (state Native Hawaiian or Other Pacific Islander proportion x district Native Hawaiian or Other Pacific Islander <40% risk) + (state White proportion x district White <40% risk) +
(state two or more races proportion x district children reported as two or more races <40% risk)
=(1 – 0.143848) x 0.125964
(0.004721 x 0.000000) + (0.032502 x 0.115385) + (0.249776 x 0.134309) + (0.003081 x 0.500000) + (0.518984 x 0.101984) + (0.047088 x 0.178082)
= 1.076803
ANSWERIn District 8, Hispanic/Latino children with disabilities were 1.08 times as likely as all other children with disabilities to receive special education and related services inside the regular classroom < 40% of the school day when the risk ratio is weighted according to the racial/ethnic demographics of State A.
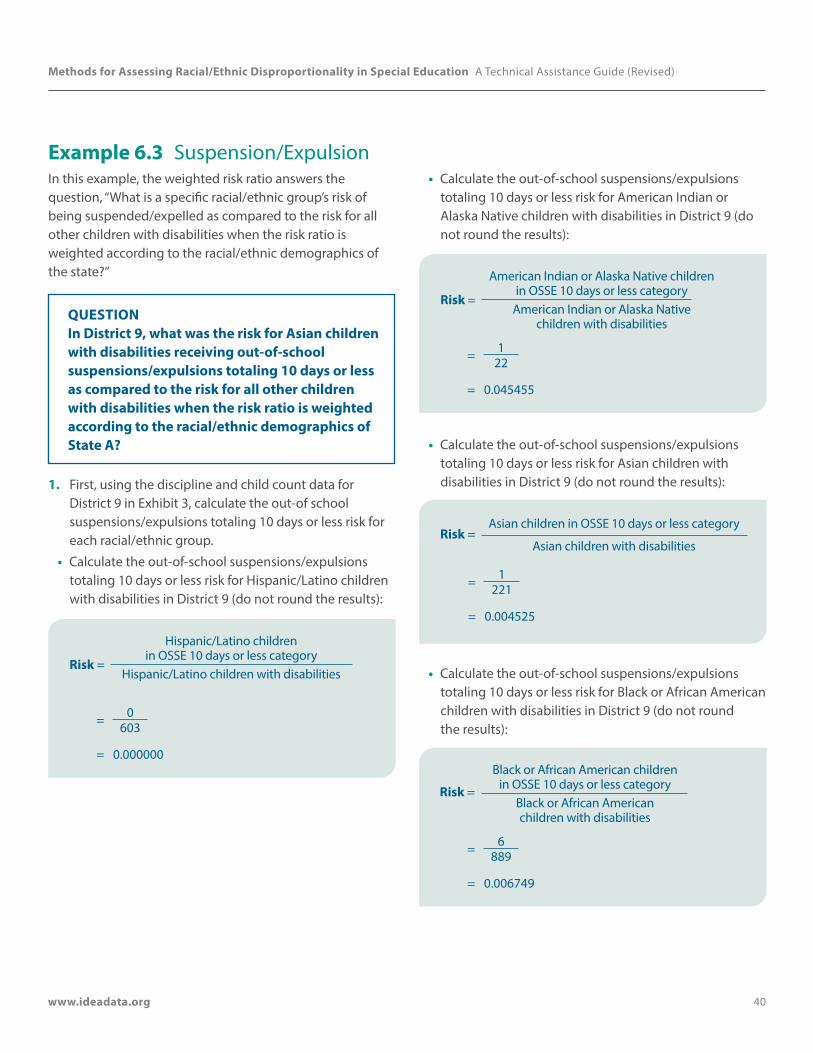
Methods for Assessing Racial/Ethnic Disproportionality in Special Education A Technical Assistance Guide (Revised)
www.ideadata.org 40
Example 6.3 Suspension/ExpulsionIn this example, the weighted risk ratio answers the question, “What is a specific racial/ethnic group’s risk of being suspended/expelled as compared to the risk for all other children with disabilities when the risk ratio is weighted according to the racial/ethnic demographics of the state?”
QUESTION In District 9, what was the risk for Asian children with disabilities receiving out-of-school suspensions/expulsions totaling 10 days or less as compared to the risk for all other children with disabilities when the risk ratio is weighted according to the racial/ethnic demographics of State A?
1. First, using the discipline and child count data for District 9 in Exhibit 3, calculate the out-of school suspensions/expulsions totaling 10 days or less risk for each racial/ethnic group.
• Calculate the out-of-school suspensions/expulsions totaling 10 days or less risk for Hispanic/Latino children with disabilities in District 9 (do not round the results):
Risk =
Hispanic/Latino children in OSSE 10 days or less category
Hispanic/Latino children with disabilities
= 0 603
= 0.000000
• Calculate the out-of-school suspensions/expulsions totaling 10 days or less risk for American Indian or Alaska Native children with disabilities in District 9 (do not round the results):
Risk =
American Indian or Alaska Native children in OSSE 10 days or less category
American Indian or Alaska Native children with disabilities
= 1 22
= 0.045455
• Calculate the out-of-school suspensions/expulsions totaling 10 days or less risk for Asian children with disabilities in District 9 (do not round the results):
Risk = Asian children in OSSE 10 days or less category
Asian children with disabilities
= 1 221
= 0.004525
• Calculate the out-of-school suspensions/expulsions totaling 10 days or less risk for Black or African American children with disabilities in District 9 (do not round the results):
Risk =
Black or African American children in OSSE 10 days or less category
Black or African American children with disabilities
= 6 889
= 0.006749
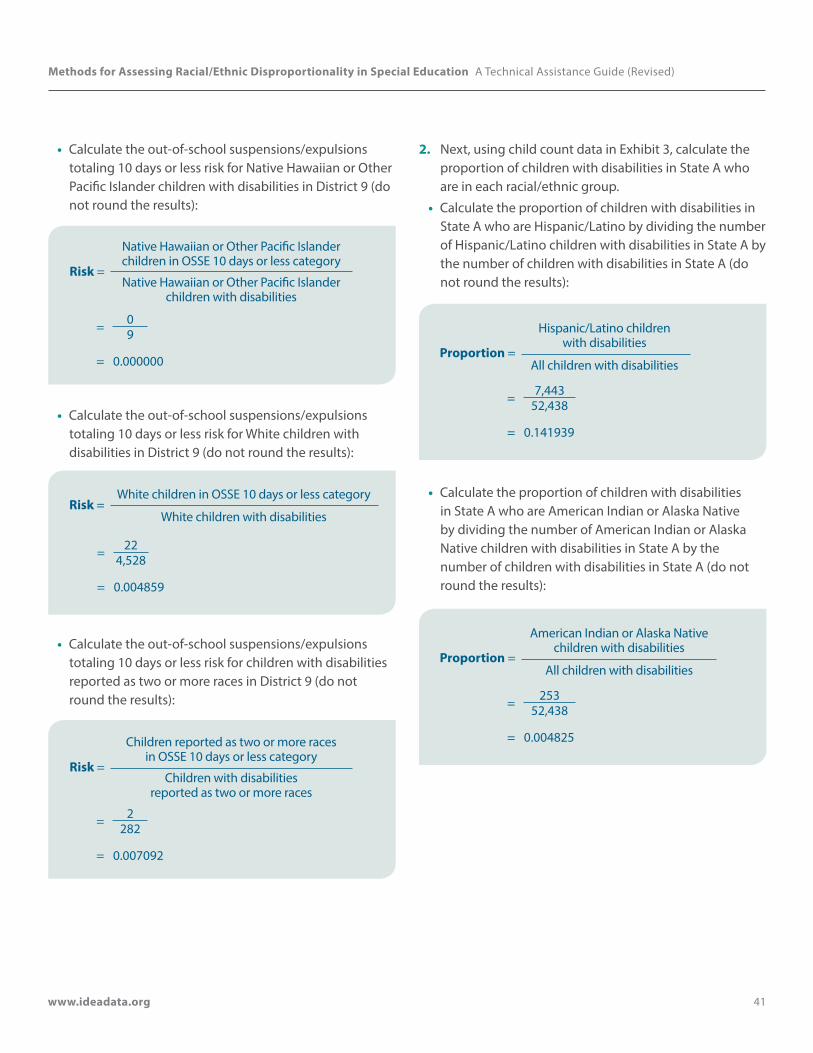
Methods for Assessing Racial/Ethnic Disproportionality in Special Education A Technical Assistance Guide (Revised)
www.ideadata.org 41
• Calculate the out-of-school suspensions/expulsions totaling 10 days or less risk for Native Hawaiian or Other Pacific Islander children with disabilities in District 9 (do not round the results):
Risk =
Native Hawaiian or Other Pacific Islander children in OSSE 10 days or less category
Native Hawaiian or Other Pacific Islander children with disabilities
= 0 9
= 0.000000
• Calculate the out-of-school suspensions/expulsions totaling 10 days or less risk for White children with disabilities in District 9 (do not round the results):
Risk = White children in OSSE 10 days or less category
White children with disabilities
= 22 4,528
= 0.004859
• Calculate the out-of-school suspensions/expulsions totaling 10 days or less risk for children with disabilities reported as two or more races in District 9 (do not round the results):
Risk =
Children reported as two or more races in OSSE 10 days or less category
Children with disabilities reported as two or more races
= 2 282
= 0.007092
2. Next, using child count data in Exhibit 3, calculate the proportion of children with disabilities in State A who are in each racial/ethnic group.
• Calculate the proportion of children with disabilities in State A who are Hispanic/Latino by dividing the number of Hispanic/Latino children with disabilities in State A by the number of children with disabilities in State A (do not round the results):
Proportion =
Hispanic/Latino children with disabilities
All children with disabilities
= 7,443 52,438
= 0.141939
• Calculate the proportion of children with disabilities in State A who are American Indian or Alaska Native by dividing the number of American Indian or Alaska Native children with disabilities in State A by the number of children with disabilities in State A (do not round the results):
Proportion =
American Indian or Alaska Native children with disabilities
All children with disabilities
= 253 52,438
= 0.004825
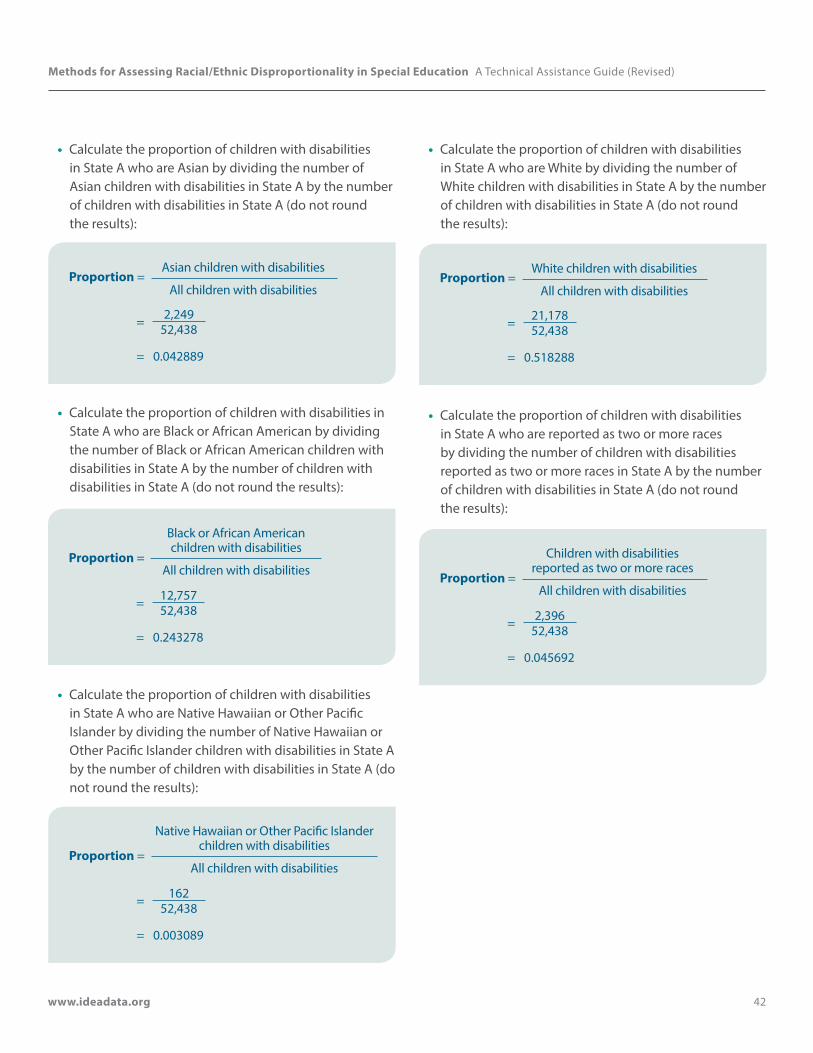
Methods for Assessing Racial/Ethnic Disproportionality in Special Education A Technical Assistance Guide (Revised)
www.ideadata.org 42
• Calculate the proportion of children with disabilities in State A who are Asian by dividing the number of Asian children with disabilities in State A by the number of children with disabilities in State A (do not round the results):
Proportion = Asian children with disabilities
All children with disabilities
= 2,249 52,438
= 0.042889
• Calculate the proportion of children with disabilities in State A who are Black or African American by dividing the number of Black or African American children with disabilities in State A by the number of children with disabilities in State A (do not round the results):
Proportion =
Black or African American children with disabilities
All children with disabilities
= 12,757 52,438
= 0.243278
• Calculate the proportion of children with disabilities in State A who are Native Hawaiian or Other Pacific Islander by dividing the number of Native Hawaiian or Other Pacific Islander children with disabilities in State A by the number of children with disabilities in State A (do not round the results):
Proportion =
Native Hawaiian or Other Pacific Islander children with disabilities
All children with disabilities
= 162 52,438
= 0.003089
• Calculate the proportion of children with disabilities in State A who are White by dividing the number of White children with disabilities in State A by the number of children with disabilities in State A (do not round the results):
Proportion = White children with disabilities
All children with disabilities
= 21,178 52,438
= 0.518288
• Calculate the proportion of children with disabilities in State A who are reported as two or more races by dividing the number of children with disabilities reported as two or more races in State A by the number of children with disabilities in State A (do not round the results):
Proportion =
Children with disabilities reported as two or more races
All children with disabilities
= 2,396 52,438
= 0.045692

Methods for Assessing Racial/Ethnic Disproportionality in Special Education A Technical Assistance Guide (Revised)
www.ideadata.org 43
3. Calculate the weighted risk ratio:
Weighted risk ratio = (1 - state Asian proportion) x district Asian OSSE 10 days or less risk
(state American Indian or Alaska Native proportion x district American Indian or Alaska Native OSSE 10 days or less risk) + (state Hispanic/Latino proportion x district
Hispanic/Latino OSSE 10 days or less risk) + (state Black or African American proportion x district Black or African American OSSE 10 days or less risk) + (state Native Hawaiian or
Other Pacific Islander proportion x district Native Hawaiian or Other Pacific Islander OSSE 10 days or less risk) + (state White proportion x district White OSSE 10 days or less risk) +
(state two or more races proportion x district two or more races OSSE 10 days or less risk)
=(1 – 0.042889) x 0.004525
(0.141939 x 0.000000) + (0.004825 x 0.045455) + (0.243278 x 0.006749) + (0.003089 x 0.000000) + (0.518288 x 0.004859) + (0.045692 x 0.007092)
= 0.920902
ANSWERIn District 9, Asian children with disabilities were 0.92 times as likely as all other children with disabilities to receive out-of-school suspensions/expulsions when the risk ratio is weighted according to the racial/ethnic demographics of State A.
Example 6.4 Total Disciplinary RemovalsThe equation for the weighted TRPC ratio is:
Weighted TRPC Ratio
=(1 – pi)Ei
∑ pj Ej j ≠ i
Where Ei is the district-level TRPC for racial/ethnic group i, and pi is the state-level proportion of children from racial/ethnic group i. Ej is the district-level TRPC for the j-th racial/ethnic group, and pj is the state-level proportion of children from the j-th racial/ethnic group.
In this example, the weighted TRPC ratio answers the question, “How does the average number of removals per child for children with disabilities from a specific racial/ethnic group compare with that of all other children with disabilities when the TRPC ratio is weighted according to the racial/ethnic demographics of the state?”
QUESTION In District 1, how did the average number of total removals per child for children with disabilities reported as two or more races compare with that of all other children with disabilities when the TRPC ratio is weighted according to the racial/ethnic demographics of State A?
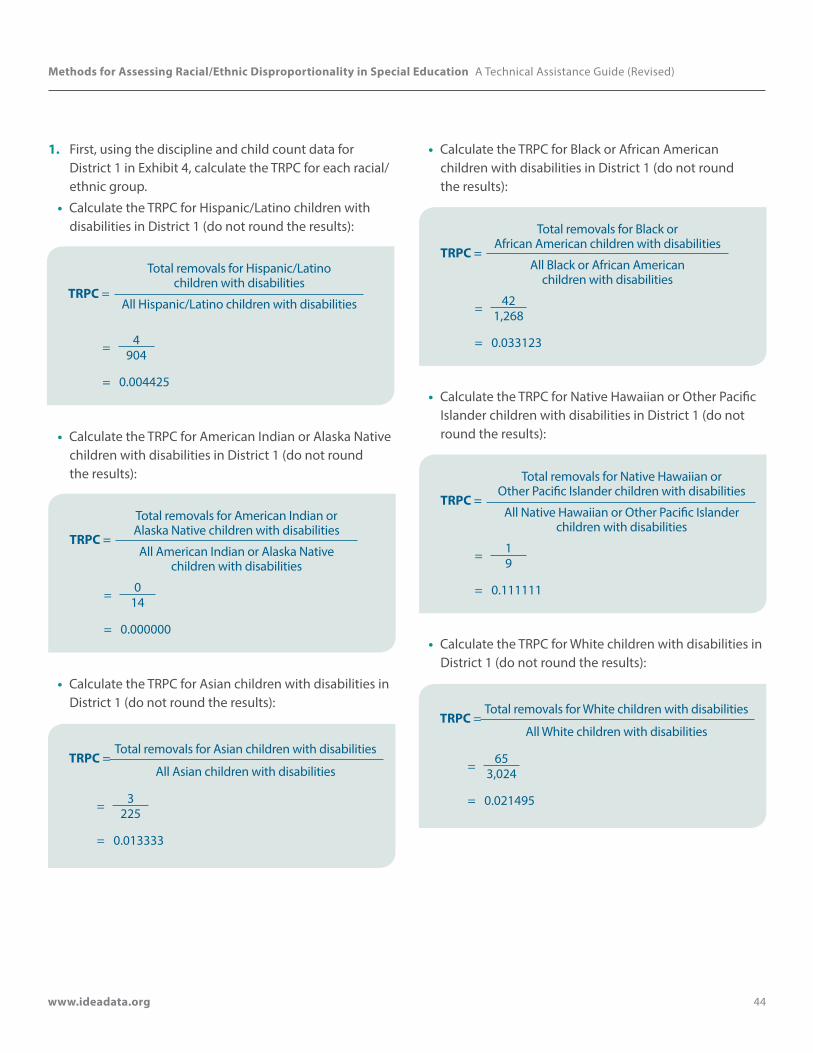
Methods for Assessing Racial/Ethnic Disproportionality in Special Education A Technical Assistance Guide (Revised)
www.ideadata.org 44
1. First, using the discipline and child count data for District 1 in Exhibit 4, calculate the TRPC for each racial/ethnic group.
• Calculate the TRPC for Hispanic/Latino children with disabilities in District 1 (do not round the results):
TRPC =
Total removals for Hispanic/Latino children with disabilities
All Hispanic/Latino children with disabilities
= 4 904
= 0.004425
• Calculate the TRPC for American Indian or Alaska Native children with disabilities in District 1 (do not round the results):
TRPC =
Total removals for American Indian or Alaska Native children with disabilities
All American Indian or Alaska Native children with disabilities
= 0 14
= 0.000000
• Calculate the TRPC for Asian children with disabilities in District 1 (do not round the results):
TRPC = Total removals for Asian children with disabilities
All Asian children with disabilities
= 3 225
= 0.013333
• Calculate the TRPC for Black or African American children with disabilities in District 1 (do not round the results):
TRPC =
Total removals for Black or African American children with disabilities
All Black or African American children with disabilities
= 42 1,268
= 0.033123
• Calculate the TRPC for Native Hawaiian or Other Pacific Islander children with disabilities in District 1 (do not round the results):
TRPC =
Total removals for Native Hawaiian or Other Pacific Islander children with disabilities
All Native Hawaiian or Other Pacific Islander children with disabilities
= 1 9
= 0.111111
• Calculate the TRPC for White children with disabilities in District 1 (do not round the results):
TRPC = Total removals for White children with disabilities
All White children with disabilities
= 65 3,024
= 0.021495
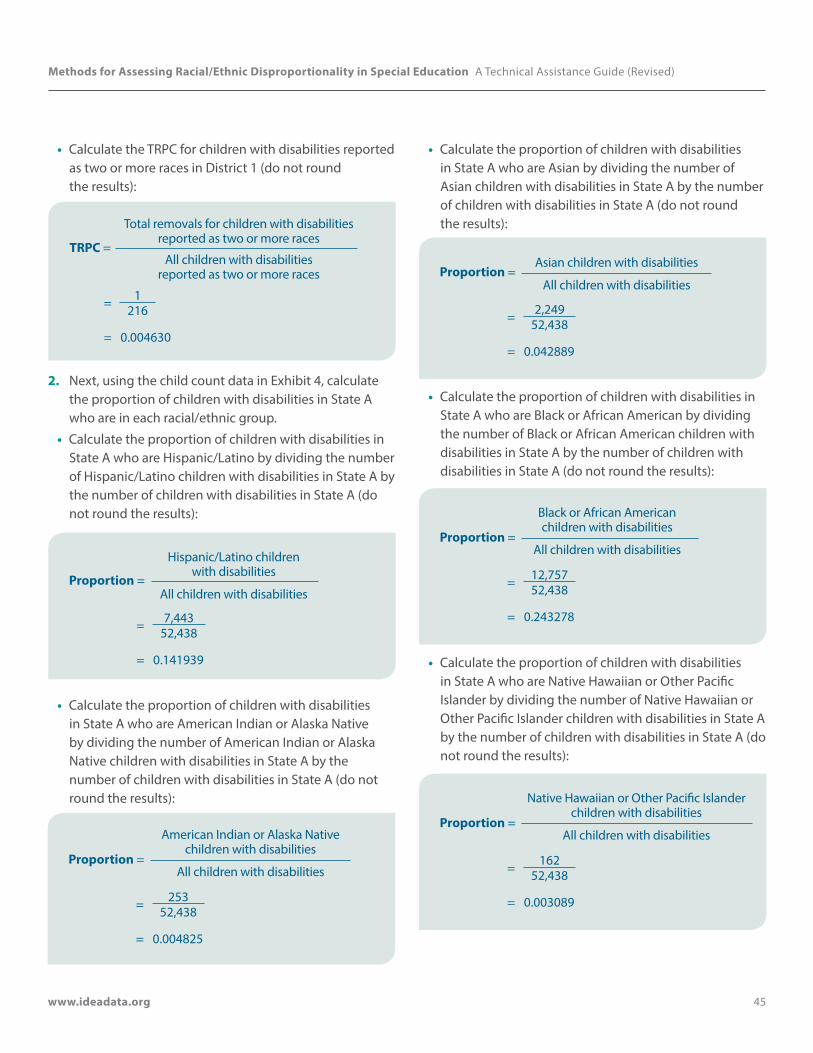
Methods for Assessing Racial/Ethnic Disproportionality in Special Education A Technical Assistance Guide (Revised)
www.ideadata.org 45
• Calculate the TRPC for children with disabilities reported as two or more races in District 1 (do not round the results):
TRPC =
Total removals for children with disabilities reported as two or more races
All children with disabilities reported as two or more races
= 1 216
= 0.004630
2. Next, using the child count data in Exhibit 4, calculate the proportion of children with disabilities in State A who are in each racial/ethnic group.
• Calculate the proportion of children with disabilities in State A who are Hispanic/Latino by dividing the number of Hispanic/Latino children with disabilities in State A by the number of children with disabilities in State A (do not round the results):
Proportion =
Hispanic/Latino children with disabilities
All children with disabilities
= 7,443 52,438
= 0.141939
• Calculate the proportion of children with disabilities in State A who are American Indian or Alaska Native by dividing the number of American Indian or Alaska Native children with disabilities in State A by the number of children with disabilities in State A (do not round the results):
Proportion =
American Indian or Alaska Native children with disabilities
All children with disabilities
= 253 52,438
= 0.004825
• Calculate the proportion of children with disabilities in State A who are Asian by dividing the number of Asian children with disabilities in State A by the number of children with disabilities in State A (do not round the results):
Proportion = Asian children with disabilities
All children with disabilities
= 2,249 52,438
= 0.042889
• Calculate the proportion of children with disabilities in State A who are Black or African American by dividing the number of Black or African American children with disabilities in State A by the number of children with disabilities in State A (do not round the results):
Proportion =
Black or African American children with disabilities
All children with disabilities
= 12,757 52,438
= 0.243278
• Calculate the proportion of children with disabilities in State A who are Native Hawaiian or Other Pacific Islander by dividing the number of Native Hawaiian or Other Pacific Islander children with disabilities in State A by the number of children with disabilities in State A (do not round the results):
Proportion =
Native Hawaiian or Other Pacific Islander children with disabilities
All children with disabilities
= 162 52,438
= 0.003089
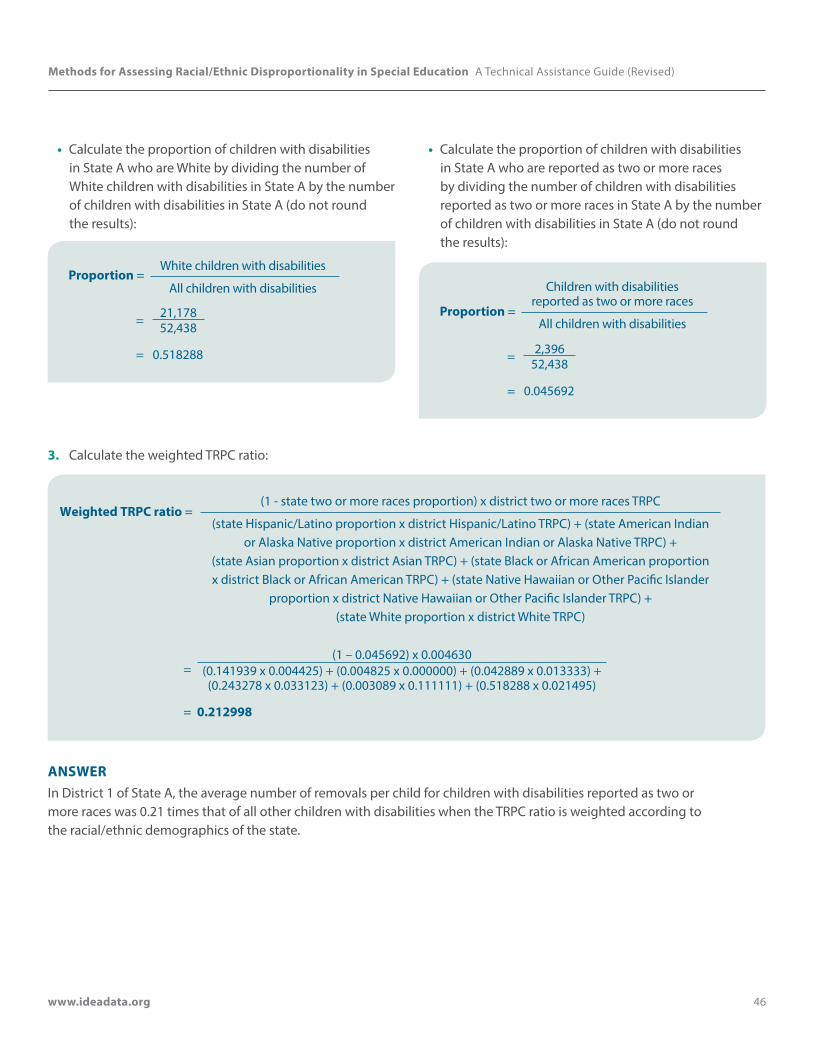
Methods for Assessing Racial/Ethnic Disproportionality in Special Education A Technical Assistance Guide (Revised)
www.ideadata.org 46
• Calculate the proportion of children with disabilities in State A who are White by dividing the number of White children with disabilities in State A by the number of children with disabilities in State A (do not round the results):
Proportion = White children with disabilities
All children with disabilities
= 21,178 52,438
= 0.518288
• Calculate the proportion of children with disabilities in State A who are reported as two or more races by dividing the number of children with disabilities reported as two or more races in State A by the number of children with disabilities in State A (do not round the results):
Proportion =
Children with disabilities reported as two or more races
All children with disabilities
= 2,396 52,438
= 0.045692
3. Calculate the weighted TRPC ratio:
Weighted TRPC ratio = (1 - state two or more races proportion) x district two or more races TRPC
(state Hispanic/Latino proportion x district Hispanic/Latino TRPC) + (state American Indian or Alaska Native proportion x district American Indian or Alaska Native TRPC) +
(state Asian proportion x district Asian TRPC) + (state Black or African American proportion x district Black or African American TRPC) + (state Native Hawaiian or Other Pacific Islander
proportion x district Native Hawaiian or Other Pacific Islander TRPC) + (state White proportion x district White TRPC)
=(1 – 0.045692) x 0.004630
(0.141939 x 0.004425) + (0.004825 x 0.000000) + (0.042889 x 0.013333) + (0.243278 x 0.033123) + (0.003089 x 0.111111) + (0.518288 x 0.021495)
= 0.212998
ANSWERIn District 1 of State A, the average number of removals per child for children with disabilities reported as two or more races was 0.21 times that of all other children with disabilities when the TRPC ratio is weighted according to the racial/ethnic demographics of the state.
Methods for Assessing Racial/Ethnic Disproportionality in Special Education A Technical Assistance Guide (Revised)
www.ideadata.org 47
InterpretationThe weighted risk ratio and weighted TRPC ratio address the issue that variation in risk ratios and TRPC ratios may occur due to varying demographic distributions between districts, without differences in risk or TRPCs in the districts being affected. The weighted risk ratio and weighted TRPC ratio standardize the demographic distribution for the comparison group to the overall demographic distribution at the state level. This standardization is accomplished using weights based on the proportion of children with disabilities for each racial/ethnic group relative to all children with disabilities at the state level.
Like the risk ratio, the weighted risk ratio compares the relative size of two risks. A weighted risk ratio of 1.00 indicates no difference between the risks. A weighted risk ratio greater than 1.00 indicates that the risk for the racial/ethnic group is greater than the risk for the comparison group, while a weighted risk ratio less than 1.00 indicates the risk for the racial/ethnic group is less than the risk for the comparison group. Weighted risk ratios can never be less than 0.00.
Similarly, the weighted TRPC ratio compares the average number of disciplinary removals for children with disabilities from a racial/ethnic group to that of a comparison group, with similar interpretation.
As with other measures, it is up to the state to determine a threshold, which districts would need to be above in order to be identified as having disproportionality. For example, looking at Example 6.1, if the state had chosen 1.50 as its threshold, then District 5 would be identified as having disproportionality because the weighted risk ratio for Black or African American children for the ID category is 2.53. If however, the state had chosen 3.00 as its threshold, then District 5 would not be identified as having disproportionality for Black or African American children in the ID category.
ConsiderationsThe weighting process ensures that two districts with identical patterns of risk across racial/ethnic groups will have identical weighted risk ratios by standardizing the weight given to the risk for each racial/ethnic group across districts using the state-level demographics. The weight for each racial/ethnic group is based on its proportion in the state. The risk ratio, by contrast, uses a formula that bases the weight for each racial/ethnic group on its proportion in the “all other” comparison group in the district.
When using the weighted risk ratio, states should pay particular attention when a racial/ethnic group makes up a large proportion of the state (e.g., 60% Black or African American children) but represents a small number children in a given district (e.g., 100). Since special education identification rates can be quite low (e.g., 2%), there is a substantial probability that a small racial/ethnic group will have no one identified and thus the risk would be zero for such a district (e.g., with 100 students and 2% identification, there would be a greater than 1 in 8 chance of having no one identified). In this situation, the zero risk is then amplified by the weighting process and in turn inflates the risk ratio for other racial/ethnic groups in this district. In such districts, states may see high weighted risk ratios when only one or two children were actually identified. To address this problem, we suggest that states pinpoint districts where major racial/ethnic groups have zero risk and avoid (or use caution when) using the weighted risk ratio in these districts.
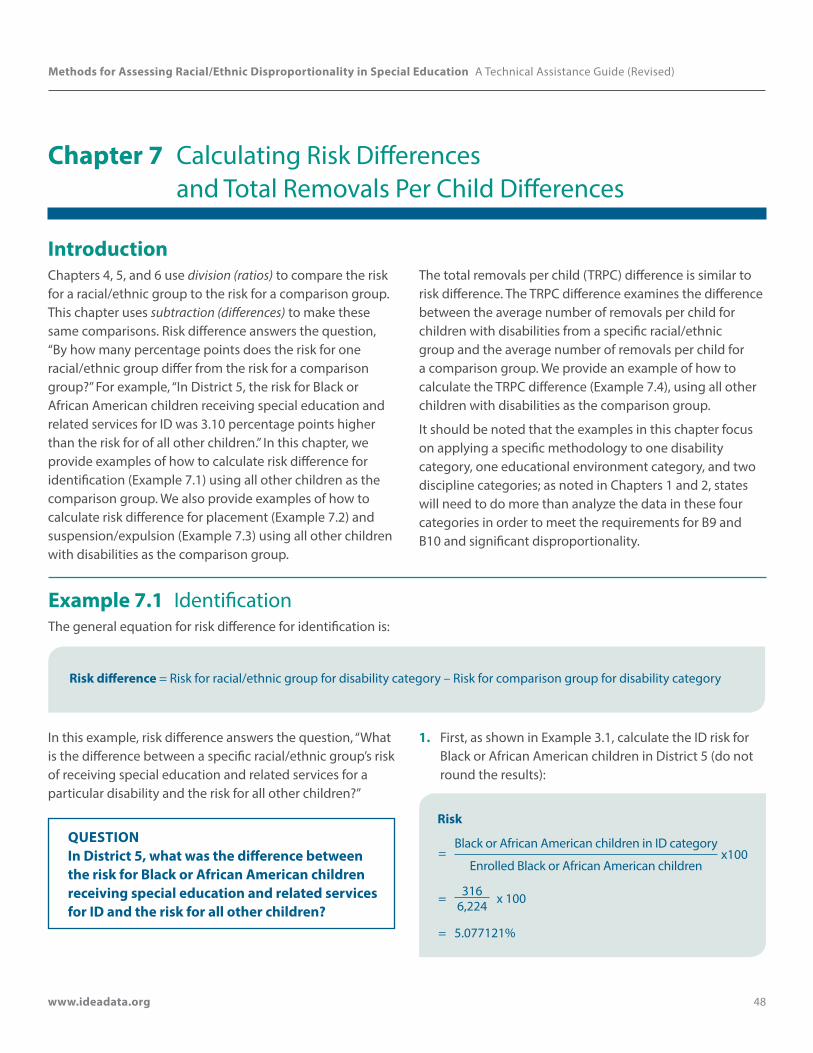
Methods for Assessing Racial/Ethnic Disproportionality in Special Education A Technical Assistance Guide (Revised)
www.ideadata.org 48
Chapter 7 Calculating Risk Differences and Total Removals Per Child Differences
IntroductionChapters 4, 5, and 6 use division (ratios) to compare the risk for a racial/ethnic group to the risk for a comparison group. This chapter uses subtraction (differences) to make these same comparisons. Risk difference answers the question, “By how many percentage points does the risk for one racial/ethnic group differ from the risk for a comparison group?” For example, “In District 5, the risk for Black or African American children receiving special education and related services for ID was 3.10 percentage points higher than the risk for of all other children.” In this chapter, we provide examples of how to calculate risk difference for identification (Example 7.1) using all other children as the comparison group. We also provide examples of how to calculate risk difference for placement (Example 7.2) and suspension/expulsion (Example 7.3) using all other children with disabilities as the comparison group.
The total removals per child (TRPC) difference is similar to risk difference. The TRPC difference examines the difference between the average number of removals per child for children with disabilities from a specific racial/ethnic group and the average number of removals per child for a comparison group. We provide an example of how to calculate the TRPC difference (Example 7.4), using all other children with disabilities as the comparison group.
It should be noted that the examples in this chapter focus on applying a specific methodology to one disability category, one educational environment category, and two discipline categories; as noted in Chapters 1 and 2, states will need to do more than analyze the data in these four categories in order to meet the requirements for B9 and B10 and significant disproportionality.
Example 7.1 IdentificationThe general equation for risk difference for identification is:
Risk difference = Risk for racial/ethnic group for disability category – Risk for comparison group for disability category
In this example, risk difference answers the question, “What is the difference between a specific racial/ethnic group’s risk of receiving special education and related services for a particular disability and the risk for all other children?”
QUESTION In District 5, what was the difference between the risk for Black or African American children receiving special education and related services for ID and the risk for all other children?
1. First, as shown in Example 3.1, calculate the ID risk for Black or African American children in District 5 (do not round the results):
Risk
=Black or African American children in ID category
x100Enrolled Black or African American children
= 316 x 1006,224
= 5.077121%
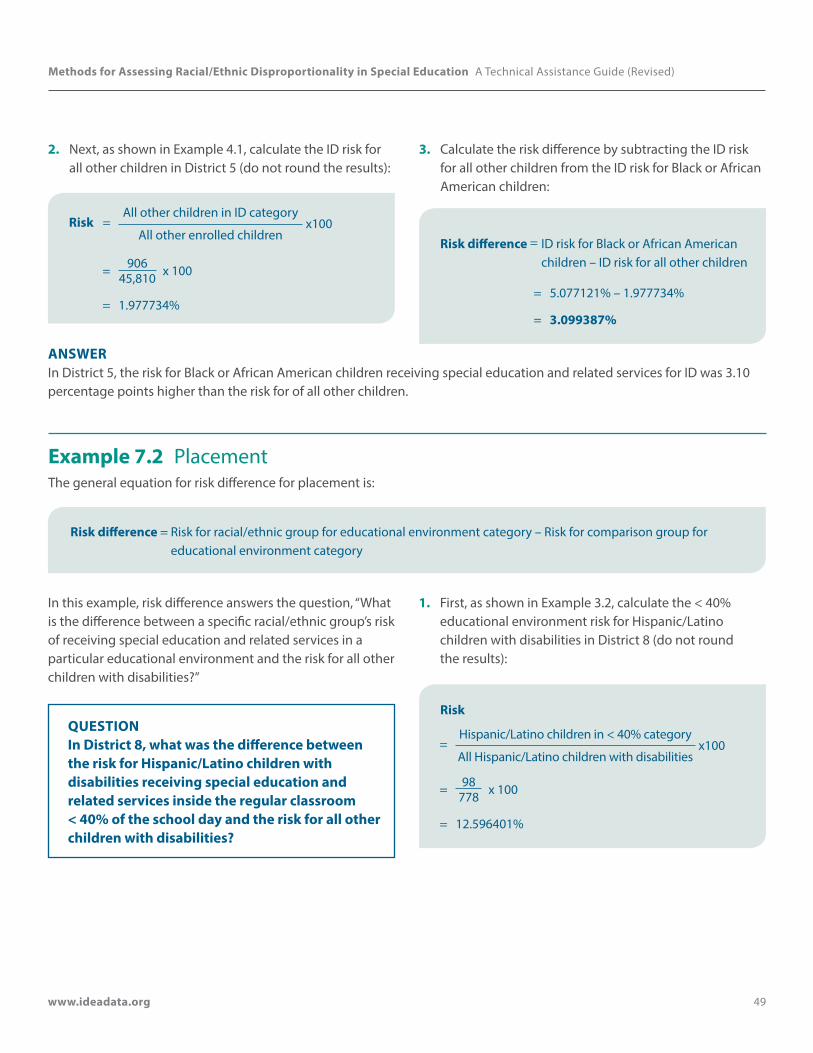
Methods for Assessing Racial/Ethnic Disproportionality in Special Education A Technical Assistance Guide (Revised)
www.ideadata.org 49
2. Next, as shown in Example 4.1, calculate the ID risk for all other children in District 5 (do not round the results):
Risk =All other children in ID category
x100All other enrolled children
= 906 x 10045,810
= 1.977734%
3. Calculate the risk difference by subtracting the ID risk for all other children from the ID risk for Black or African American children:
Risk difference = ID risk for Black or African American children – ID risk for all other children
= 5.077121% – 1.977734%
= 3.099387%
ANSWER In District 5, the risk for Black or African American children receiving special education and related services for ID was 3.10 percentage points higher than the risk for of all other children.
Example 7.2 PlacementThe general equation for risk difference for placement is:
Risk difference = Risk for racial/ethnic group for educational environment category – Risk for comparison group for educational environment category
In this example, risk difference answers the question, “What is the difference between a specific racial/ethnic group’s risk of receiving special education and related services in a particular educational environment and the risk for all other children with disabilities?”
QUESTION In District 8, what was the difference between the risk for Hispanic/Latino children with disabilities receiving special education and related services inside the regular classroom < 40% of the school day and the risk for all other children with disabilities?
1. First, as shown in Example 3.2, calculate the < 40% educational environment risk for Hispanic/Latino children with disabilities in District 8 (do not round the results):
Risk
=Hispanic/Latino children in < 40% category
x100All Hispanic/Latino children with disabilities
= 98 x 100778
= 12.596401%

Methods for Assessing Racial/Ethnic Disproportionality in Special Education A Technical Assistance Guide (Revised)
www.ideadata.org 50
2. Next, as shown in Example 3.2, calculate the < 40% educational environment risk for all other children with disabilities in District 8 (do not round the results):
Risk
=All other children in < 40% category
x100All other children with disabilities
= 404 x 1003,595
= 11.237830%
3. Calculate the risk difference by subtracting the < 40% educational environment risk for all other children with disabilities from the < 40% educational environment risk for Hispanic/Latino children with disabilities:
Risk difference = < 40% educational environment risk for Hispanic/Latino children – < 40% educational environment risk for all other children
= 12.596401% – 11.237830%
= 1.358571%
ANSWER In District 8, the risk for Hispanic/Latino children with disabilities receiving special education and related services inside the regular classroom < 40% of the school day was 1.36 percentage points higher than the risk for all other children with disabilities.
Example 7.3 Suspension/ExpulsionThe general equation for risk difference for suspension/expulsion is:
Risk difference = Risk for racial/ethnic group for discipline category – Risk for comparison group for discipline category
In this example, the risk difference answers the question, “What is the difference between a specific racial/ethnic group risk of being suspended/expelled and the risk for all other children with disabilities?”
QUESTION In District 9, what was the difference between the risk for Asian children with disabilities for experiencing out-of-school suspensions/expulsions totaling 10 days or less and the risk for all other children with disabilities?
1. First, as shown in Example 3.3, calculate the out-of-school suspensions/expulsions totaling 10 days or less risk for Asian children with disabilities in District 9 (do not round the results):
Risk
=Asian children in the OSSE 10 days or less category
x100All Asian children with disabilities
= 1 x 100221
= 0.452489%
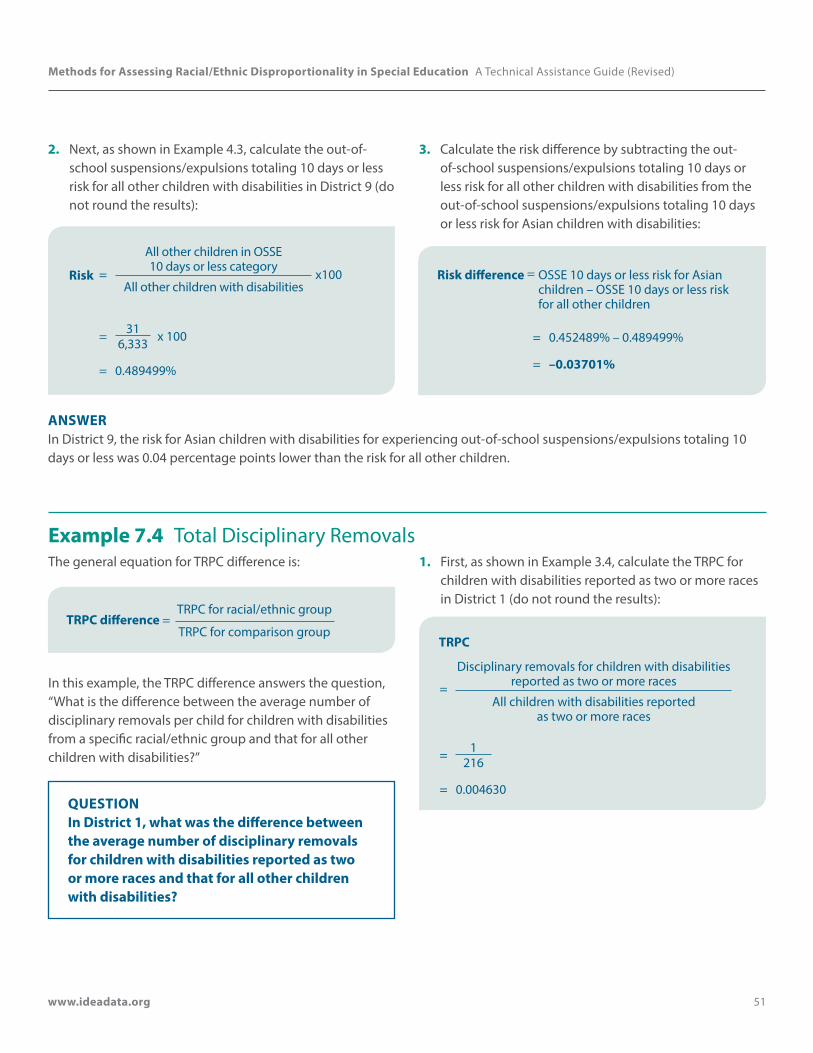
Methods for Assessing Racial/Ethnic Disproportionality in Special Education A Technical Assistance Guide (Revised)
www.ideadata.org 51
2. Next, as shown in Example 4.3, calculate the out-of-school suspensions/expulsions totaling 10 days or less risk for all other children with disabilities in District 9 (do not round the results):
Risk =
All other children in OSSE 10 days or less category
x100All other children with disabilities
= 31 x 1006,333
= 0.489499%
3. Calculate the risk difference by subtracting the out-of-school suspensions/expulsions totaling 10 days or less risk for all other children with disabilities from the out-of-school suspensions/expulsions totaling 10 days or less risk for Asian children with disabilities:
Risk difference = OSSE 10 days or less risk for Asian children – OSSE 10 days or less risk for all other children
= 0.452489% – 0.489499%
= –0.03701%
ANSWER In District 9, the risk for Asian children with disabilities for experiencing out-of-school suspensions/expulsions totaling 10 days or less was 0.04 percentage points lower than the risk for all other children.
Example 7.4 Total Disciplinary RemovalsThe general equation for TRPC difference is:
TRPC difference = TRPC for racial/ethnic group
TRPC for comparison group
In this example, the TRPC difference answers the question, “What is the difference between the average number of disciplinary removals per child for children with disabilities from a specific racial/ethnic group and that for all other children with disabilities?”
QUESTION In District 1, what was the difference between the average number of disciplinary removals for children with disabilities reported as two or more races and that for all other children with disabilities?
1. First, as shown in Example 3.4, calculate the TRPC for children with disabilities reported as two or more races in District 1 (do not round the results):
TRPC
=
Disciplinary removals for children with disabilities reported as two or more races
All children with disabilities reported as two or more races
= 1216
= 0.004630
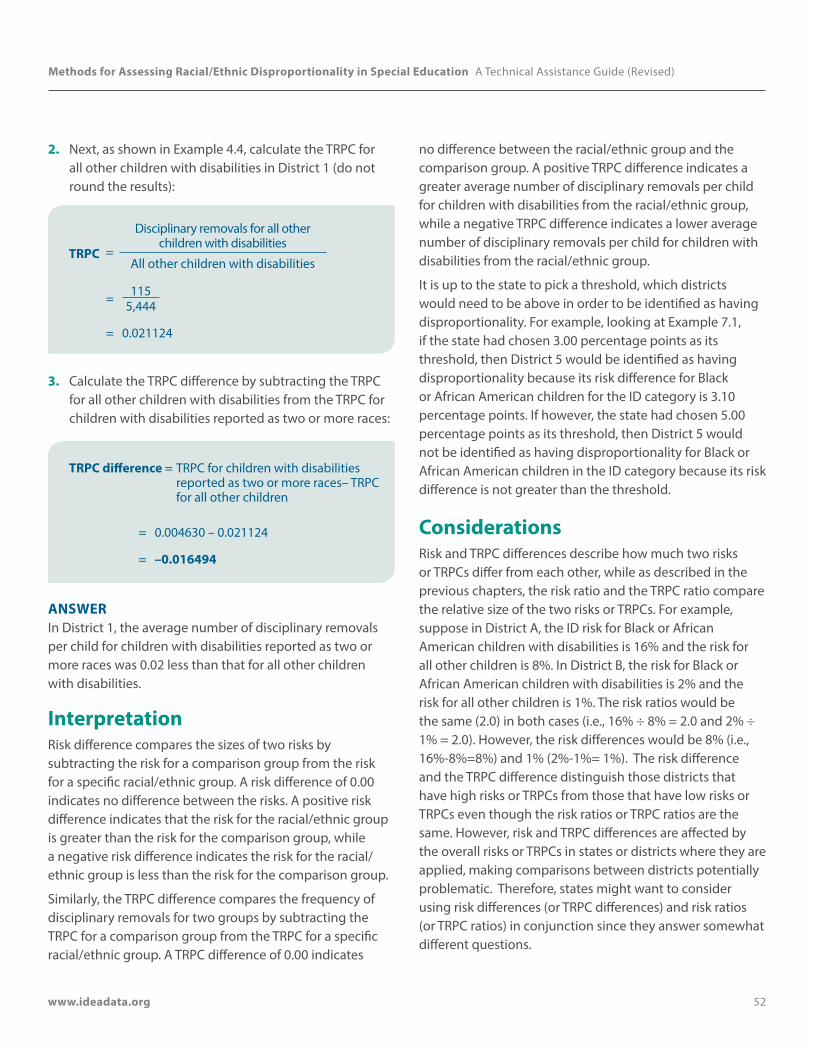
Methods for Assessing Racial/Ethnic Disproportionality in Special Education A Technical Assistance Guide (Revised)
www.ideadata.org 52
2. Next, as shown in Example 4.4, calculate the TRPC for all other children with disabilities in District 1 (do not round the results):
TRPC =
Disciplinary removals for all other children with disabilities
All other children with disabilities
= 1155,444
= 0.021124
3. Calculate the TRPC difference by subtracting the TRPC for all other children with disabilities from the TRPC for children with disabilities reported as two or more races:
TRPC difference = TRPC for children with disabilities reported as two or more races– TRPC for all other children
= 0.004630 – 0.021124
= –0.016494
ANSWER In District 1, the average number of disciplinary removals per child for children with disabilities reported as two or more races was 0.02 less than that for all other children with disabilities.
InterpretationRisk difference compares the sizes of two risks by subtracting the risk for a comparison group from the risk for a specific racial/ethnic group. A risk difference of 0.00 indicates no difference between the risks. A positive risk difference indicates that the risk for the racial/ethnic group is greater than the risk for the comparison group, while a negative risk difference indicates the risk for the racial/ethnic group is less than the risk for the comparison group.
Similarly, the TRPC difference compares the frequency of disciplinary removals for two groups by subtracting the TRPC for a comparison group from the TRPC for a specific racial/ethnic group. A TRPC difference of 0.00 indicates
no difference between the racial/ethnic group and the comparison group. A positive TRPC difference indicates a greater average number of disciplinary removals per child for children with disabilities from the racial/ethnic group, while a negative TRPC difference indicates a lower average number of disciplinary removals per child for children with disabilities from the racial/ethnic group.
It is up to the state to pick a threshold, which districts would need to be above in order to be identified as having disproportionality. For example, looking at Example 7.1, if the state had chosen 3.00 percentage points as its threshold, then District 5 would be identified as having disproportionality because its risk difference for Black or African American children for the ID category is 3.10 percentage points. If however, the state had chosen 5.00 percentage points as its threshold, then District 5 would not be identified as having disproportionality for Black or African American children in the ID category because its risk difference is not greater than the threshold.
ConsiderationsRisk and TRPC differences describe how much two risks or TRPCs differ from each other, while as described in the previous chapters, the risk ratio and the TRPC ratio compare the relative size of the two risks or TRPCs. For example, suppose in District A, the ID risk for Black or African American children with disabilities is 16% and the risk for all other children is 8%. In District B, the risk for Black or African American children with disabilities is 2% and the risk for all other children is 1%. The risk ratios would be the same (2.0) in both cases (i.e., 16% ÷ 8% = 2.0 and 2% ÷ 1% = 2.0). However, the risk differences would be 8% (i.e., 16%-8%=8%) and 1% (2%-1%= 1%). The risk difference and the TRPC difference distinguish those districts that have high risks or TRPCs from those that have low risks or TRPCs even though the risk ratios or TRPC ratios are the same. However, risk and TRPC differences are affected by the overall risks or TRPCs in states or districts where they are applied, making comparisons between districts potentially problematic. Therefore, states might want to consider using risk differences (or TRPC differences) and risk ratios (or TRPC ratios) in conjunction since they answer somewhat different questions.
Methods for Assessing Racial/Ethnic Disproportionality in Special Education A Technical Assistance Guide (Revised)
www.ideadata.org 53
Chapter 8 Calculating Composition, Difference in Compositon, and Relative Difference in Composition
IntroductionComposition tells us the percentage of children in a particular disability, educational environment, or discipline category who are from a specific racial/ethnic group. For example, “In District 5, 25.86% of children receiving special education and related services for ID were Black or African American.” While composition tells us about the racial/ethnic makeup of a category, it does not by itself tell us about disproportionality. To answer questions about disproportionality, the racial/ethnic group’s composition for a disability, educational environment, or discipline category must be compared to the racial/ethnic group’s composition for a comparison category. This chapter discusses two ways to make this comparison: (1) difference in composition and (2) relative difference in composition.
Difference in composition tells us the difference between a racial/ethnic group’s composition for the disability, educational environment, or discipline category and its composition for a comparison category. For example, “In District 5, the percentage of children receiving special education and related services for ID who were Black or African American is 13.90 percentage points higher than the percentage of enrolled children who were Black or African American.”
Relative difference in composition tells us the difference between a racial/ethnic group’s composition for the disability, educational environment, or discipline category and its composition for a comparison category, expressed
as a percentage of the comparison category. For example, “In District 5, the percentage of children receiving special education and related services for ID who were Black or African American is 116.19% larger than the percentage of enrolled children who were Black or African American.”
In this chapter, the examples each answer three questions. The first question is about composition, the second question is about difference in composition, and the third question is about relative difference in composition. We provide an example for identification (Example 8.1) using the enrollment composition as the comparison composition. We provide examples for placement (Example 8.2) and suspension/expulsion (Example 8.3) using the child count composition as the comparison composition.
We also provide an example for how to calculate composition, difference in composition, and relative difference in composition for total disciplinary removals (Example 8.4) using the child count composition as the comparison composition.
It should be noted that the examples in this chapter focus on applying a specific methodology to one disability category, one educational environment category, and two discipline categories; as noted in Chapters 1 and 2, states will need to do more than analyze the data in these four categories in order to meet the requirements for B9 and B10 and significant disproportionality.
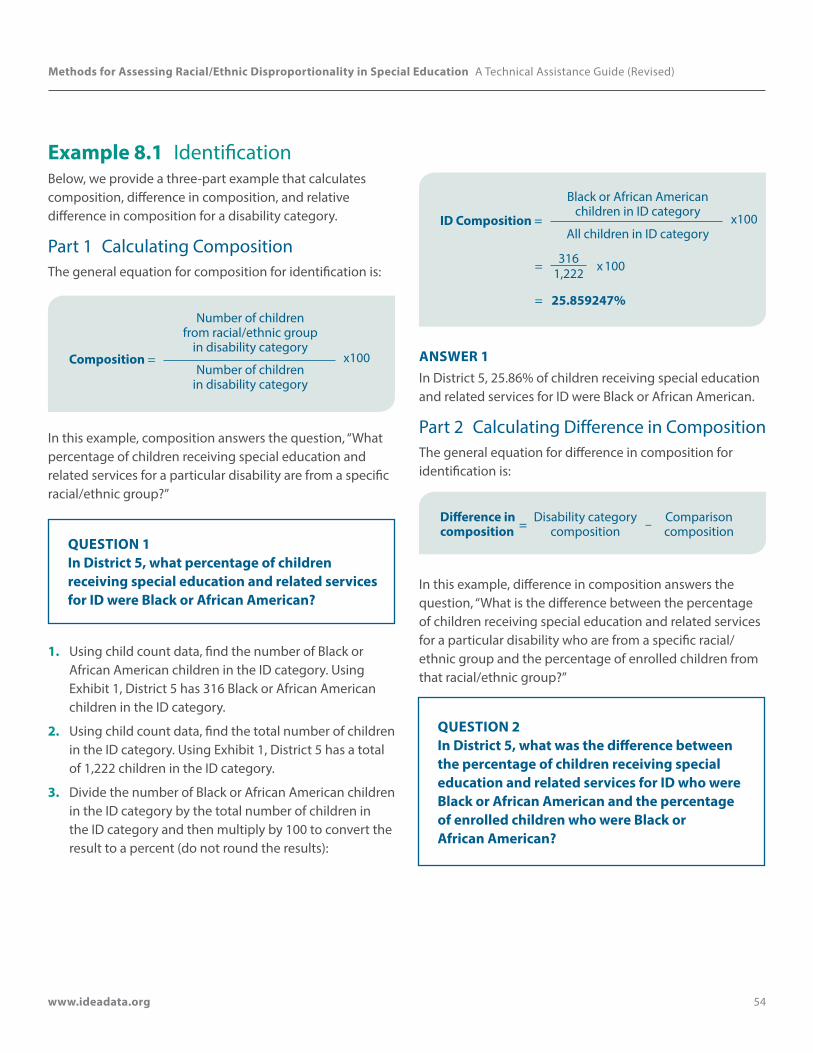
Methods for Assessing Racial/Ethnic Disproportionality in Special Education A Technical Assistance Guide (Revised)
www.ideadata.org 54
Example 8.1 IdentificationBelow, we provide a three-part example that calculates composition, difference in composition, and relative difference in composition for a disability category.
Part 1 Calculating CompositionThe general equation for composition for identification is:
Composition =
Number of children from racial/ethnic group
in disability category
Number of children in disability category
x100
In this example, composition answers the question, “What percentage of children receiving special education and related services for a particular disability are from a specific racial/ethnic group?”
QUESTION 1 In District 5, what percentage of children receiving special education and related services for ID were Black or African American?
1. Using child count data, find the number of Black or African American children in the ID category. Using Exhibit 1, District 5 has 316 Black or African American children in the ID category.
2. Using child count data, find the total number of children in the ID category. Using Exhibit 1, District 5 has a total of 1,222 children in the ID category.
3. Divide the number of Black or African American children in the ID category by the total number of children in the ID category and then multiply by 100 to convert the result to a percent (do not round the results):
ID Composition =
Black or African American children in ID category
All children in ID categoryx100
= 316 x 1001,222
= 25.859247%
ANSWER 1In District 5, 25.86% of children receiving special education and related services for ID were Black or African American.
Part 2 Calculating Difference in CompositionThe general equation for difference in composition for identification is:
Difference in composition =
Disability category composition – Comparison
composition
In this example, difference in composition answers the question, “What is the difference between the percentage of children receiving special education and related services for a particular disability who are from a specific racial/ethnic group and the percentage of enrolled children from that racial/ethnic group?”
QUESTION 2 In District 5, what was the difference between the percentage of children receiving special education and related services for ID who were Black or African American and the percentage of enrolled children who were Black or African American?
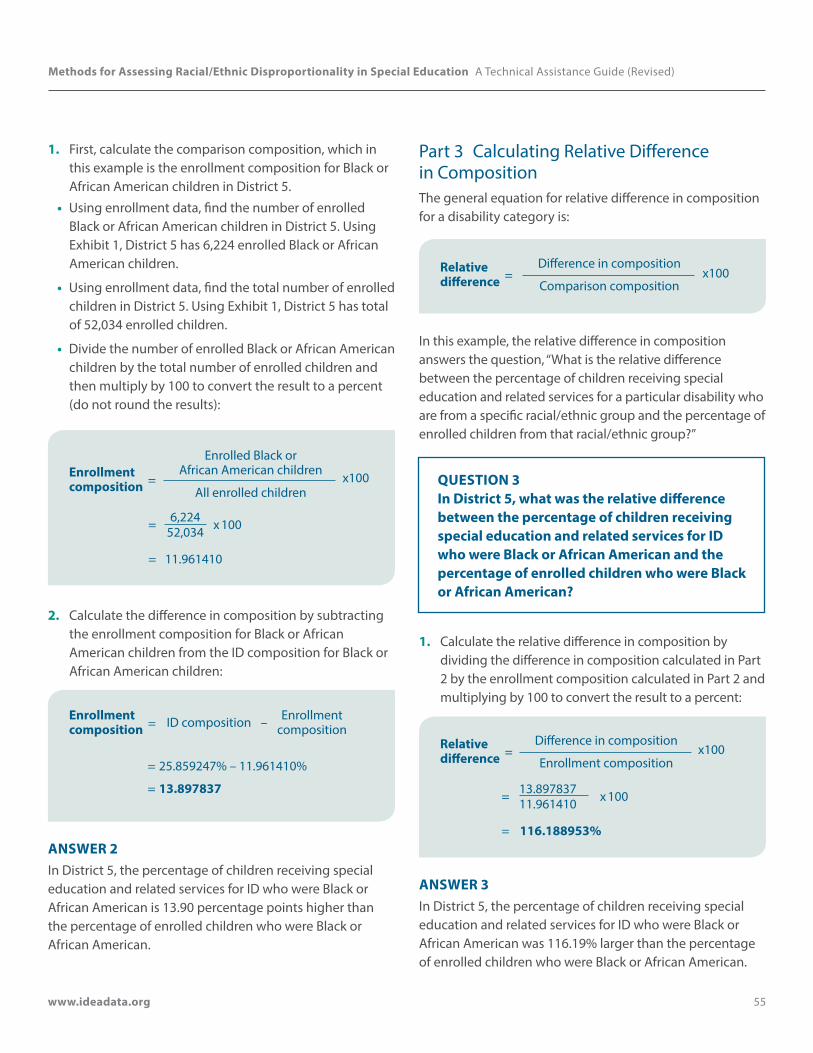
Methods for Assessing Racial/Ethnic Disproportionality in Special Education A Technical Assistance Guide (Revised)
www.ideadata.org 55
1. First, calculate the comparison composition, which in this example is the enrollment composition for Black or African American children in District 5.
• Using enrollment data, find the number of enrolled Black or African American children in District 5. Using Exhibit 1, District 5 has 6,224 enrolled Black or African American children.
• Using enrollment data, find the total number of enrolled children in District 5. Using Exhibit 1, District 5 has total of 52,034 enrolled children.
• Divide the number of enrolled Black or African American children by the total number of enrolled children and then multiply by 100 to convert the result to a percent (do not round the results):
Enrollment composition =
Enrolled Black or African American children
All enrolled childrenx100
= 6,224 x 10052,034
= 11.961410
2. Calculate the difference in composition by subtracting the enrollment composition for Black or African American children from the ID composition for Black or African American children:
Enrollment composition = ID composition – Enrollment
composition
= 25.859247% – 11.961410%
= 13.897837
ANSWER 2In District 5, the percentage of children receiving special education and related services for ID who were Black or African American is 13.90 percentage points higher than the percentage of enrolled children who were Black or African American.
Part 3 Calculating Relative Difference in CompositionThe general equation for relative difference in composition for a disability category is:
Relative difference =
Difference in composition
Comparison compositionx100
In this example, the relative difference in composition answers the question, “What is the relative difference between the percentage of children receiving special education and related services for a particular disability who are from a specific racial/ethnic group and the percentage of enrolled children from that racial/ethnic group?”
QUESTION 3 In District 5, what was the relative difference between the percentage of children receiving special education and related services for ID who were Black or African American and the percentage of enrolled children who were Black or African American?
1. Calculate the relative difference in composition by dividing the difference in composition calculated in Part 2 by the enrollment composition calculated in Part 2 and multiplying by 100 to convert the result to a percent:
Relative difference =
Difference in composition
Enrollment compositionx100
= 13.897837 x 10011.961410
= 116.188953%
ANSWER 3In District 5, the percentage of children receiving special education and related services for ID who were Black or African American was 116.19% larger than the percentage of enrolled children who were Black or African American.
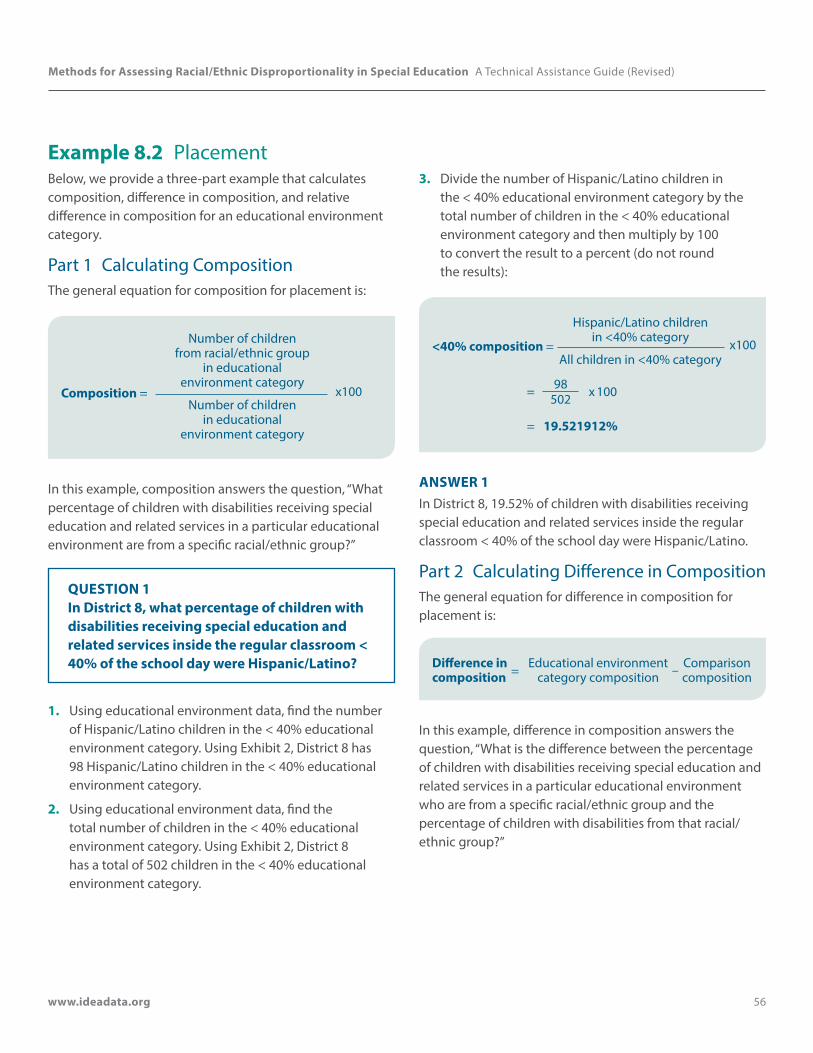
Methods for Assessing Racial/Ethnic Disproportionality in Special Education A Technical Assistance Guide (Revised)
www.ideadata.org 56
Example 8.2 PlacementBelow, we provide a three-part example that calculates composition, difference in composition, and relative difference in composition for an educational environment category.
Part 1 Calculating CompositionThe general equation for composition for placement is:
Composition =
Number of children from racial/ethnic group
in educational environment category
Number of children in educational
environment category
x100
In this example, composition answers the question, “What percentage of children with disabilities receiving special education and related services in a particular educational environment are from a specific racial/ethnic group?”
QUESTION 1 In District 8, what percentage of children with disabilities receiving special education and related services inside the regular classroom < 40% of the school day were Hispanic/Latino?
1. Using educational environment data, find the numberof Hispanic/Latino children in the < 40% educationalenvironment category. Using Exhibit 2, District 8 has98 Hispanic/Latino children in the < 40% educationalenvironment category.
2. Using educational environment data, find thetotal number of children in the < 40% educationalenvironment category. Using Exhibit 2, District 8has a total of 502 children in the < 40% educationalenvironment category.
3. Divide the number of Hispanic/Latino children inthe < 40% educational environment category by thetotal number of children in the < 40% educationalenvironment category and then multiply by 100to convert the result to a percent (do not roundthe results):
<40% composition =
Hispanic/Latino children in <40% category x100
All children in <40% category
= 98 x 100502
= 19.521912%
ANSWER 1In District 8, 19.52% of children with disabilities receiving special education and related services inside the regular classroom < 40% of the school day were Hispanic/Latino.
Part 2 Calculating Difference in CompositionThe general equation for difference in composition for placement is:
Difference in composition =
Educational environment category composition – Comparison
composition
In this example, difference in composition answers the question, “What is the difference between the percentage of children with disabilities receiving special education and related services in a particular educational environment who are from a specific racial/ethnic group and the percentage of children with disabilities from that racial/ethnic group?”
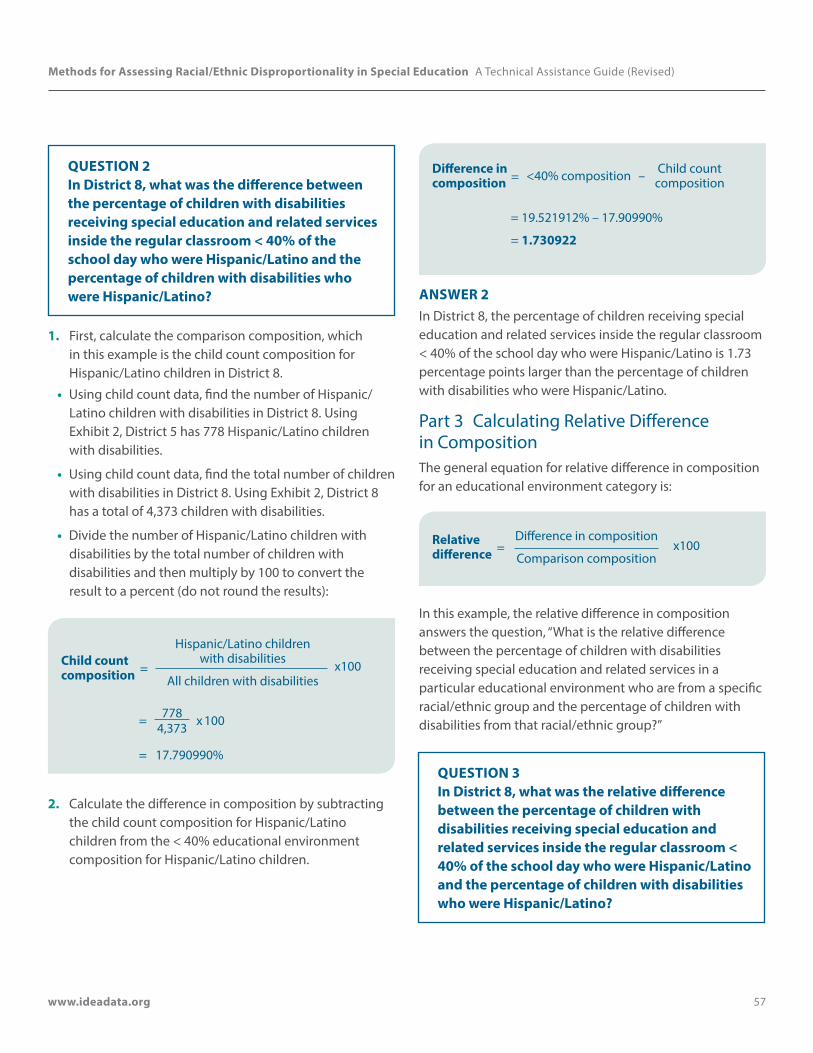
Methods for Assessing Racial/Ethnic Disproportionality in Special Education A Technical Assistance Guide (Revised)
www.ideadata.org 57
QUESTION 2 In District 8, what was the difference between the percentage of children with disabilities receiving special education and related services inside the regular classroom < 40% of the school day who were Hispanic/Latino and the percentage of children with disabilities who were Hispanic/Latino?
1. First, calculate the comparison composition, which in this example is the child count composition for Hispanic/Latino children in District 8.
• Using child count data, find the number of Hispanic/Latino children with disabilities in District 8. Using Exhibit 2, District 5 has 778 Hispanic/Latino children with disabilities.
• Using child count data, find the total number of children with disabilities in District 8. Using Exhibit 2, District 8 has a total of 4,373 children with disabilities.
• Divide the number of Hispanic/Latino children with disabilities by the total number of children with disabilities and then multiply by 100 to convert the result to a percent (do not round the results):
Child count composition =
Hispanic/Latino children with disabilities
All children with disabilitiesx100
= 778 x 1004,373
= 17.790990%
2. Calculate the difference in composition by subtracting the child count composition for Hispanic/Latino children from the < 40% educational environment composition for Hispanic/Latino children.
Difference in composition = <40% composition – Child count
composition
= 19.521912% – 17.90990%
= 1.730922
ANSWER 2In District 8, the percentage of children receiving special education and related services inside the regular classroom < 40% of the school day who were Hispanic/Latino is 1.73 percentage points larger than the percentage of children with disabilities who were Hispanic/Latino.
Part 3 Calculating Relative Difference in CompositionThe general equation for relative difference in composition for an educational environment category is:
Relative difference =
Difference in composition
Comparison compositionx100
In this example, the relative difference in composition answers the question, “What is the relative difference between the percentage of children with disabilities receiving special education and related services in a particular educational environment who are from a specific racial/ethnic group and the percentage of children with disabilities from that racial/ethnic group?”
QUESTION 3 In District 8, what was the relative difference between the percentage of children with disabilities receiving special education and related services inside the regular classroom < 40% of the school day who were Hispanic/Latino and the percentage of children with disabilities who were Hispanic/Latino?

Methods for Assessing Racial/Ethnic Disproportionality in Special Education A Technical Assistance Guide (Revised)
www.ideadata.org 58
1. Calculate the relative difference in composition by dividing the difference in composition calculated in Part 2 by the child count composition calculated in Part 2 and multiplying by 100 to convert the result to a percent.
Relative difference =
Difference in composition
Child count compositionx100
= 1.730922 x 10017.790990
= 9.729206%
ANSWER 3In District 8, the percentage of children with disabilities receiving special education and related services inside the regular classroom < 40% of the day who were Hispanic/Latino is 9.73% larger than the percentage of children with disabilities who were Hispanic/Latino.
Example 8.3 Suspension/ExpulsionBelow, we provide a three-part example that calculates composition, difference in composition, and relative difference in composition for a suspension/expulsion category.
Part 1 Calculating CompositionThe general equation for composition for suspension/expulsion is:
Composition =
Number of children from racial/ethnic group in
suspension/expulsion category
Number of children in suspension/expulsion category
x100
In this example, composition answers the question, “What percentage of children with disabilities who experienced a particular type of suspension/expulsion are from a specific racial/ethnic group?”
QUESTION 1 In District 9, what percentage of children with disabilities who experience out-of-school suspensions/expulsions totaling 10 days or less were Asian?
1. Using discipline data, find the number of Asian children with disabilities in the out-of-school suspension/expulsions totaling 10 days or less category. Using Exhibit 3, District 9 has 1 Asian child with disabilities in the out-of-school suspensions/expulsions totaling 10 days or less category.
2. Using discipline data, find the total number of children with disabilities in the out-of-school suspensions/expulsions totaling 10 days or less category. Using Exhibit 3, District 9 has a total of 32 children with disabilities in the out-of-school suspensions/expulsions totaling 10 days or less category.
3. Divide the number of Asian children with disabilities in the out-of-school suspensions/expulsions totaling 10 days or less category by the total number of children with disabilities in the out-of-school suspensions/ expulsions totaling 10 days or less category and then multiply by 100 to convert the result to a percent (do not round the results):

Methods for Assessing Racial/Ethnic Disproportionality in Special Education A Technical Assistance Guide (Revised)
www.ideadata.org 59
OSSE 10 days or less composition
=
Asian children in OSSE 10 days or less category
All children in OSSE 10 days or less category
x100
= 1 x 10032
= 3.125000%
ANSWER 1In District 9, 3.13% of children with disabilities who experience out-of-school suspensions/expulsions totaling 10 days or less were Asian.
Part 2 Calculating Difference in CompositionThe general equation for difference in composition for suspension/expulsion is:
Difference in composition =
Suspension/expulsion category composition – Comparison
composition
In this example, difference in composition answers the question, “What is the difference between the percentage of children with disabilities experiencing a particular type of suspension/expulsion who were from a specific racial/ethnic group and the percentage of children with disabilities who are from that racial/ethnic group?”
QUESTION 2 In District 9, what was the difference between the percentage of children with disabilities experiencing out-of-school suspensions/expulsions totaling 10 days or less who were Asian and the percentage of children with disabilities who were Asian?
1. First, calculate the comparison composition, which in this example is the child count composition for Asian children in District 9.
• Using child count data, find the number of Asian children with disabilities in District 9. Using Exhibit 3, District 9 has 221 Asian children with disabilities.
• Using child count data, find the total number of children with disabilities in District 9. Using Exhibit 3, District 9 has a total of 6,554 children with disabilities.
• Divide the number of Asian children with disabilities by the total number of children with disabilities and then multiply by 100 to convert the result to a percent (do not round the results):
Child count composition =
Asian children with disabilities
All children with disabilitiesx100
= 221 x 1006,554
= 3.371987%
2. Calculate the difference in composition by subtracting the child count composition for Asian children from the out-of-school suspensions/expulsions totaling 10 days or less composition for Asian children:
Difference in composition =
OSSE 10 days or less composition – Child count
composition
= 3.125000% – 3.371987%
= –0.246987
ANSWER 2In District 9, the percentage of children with disabilities experiencing out-of-school suspensions and expulsions who were Asian was 0.25 percentage points less than the percentage of children with disabilities who were Asian.
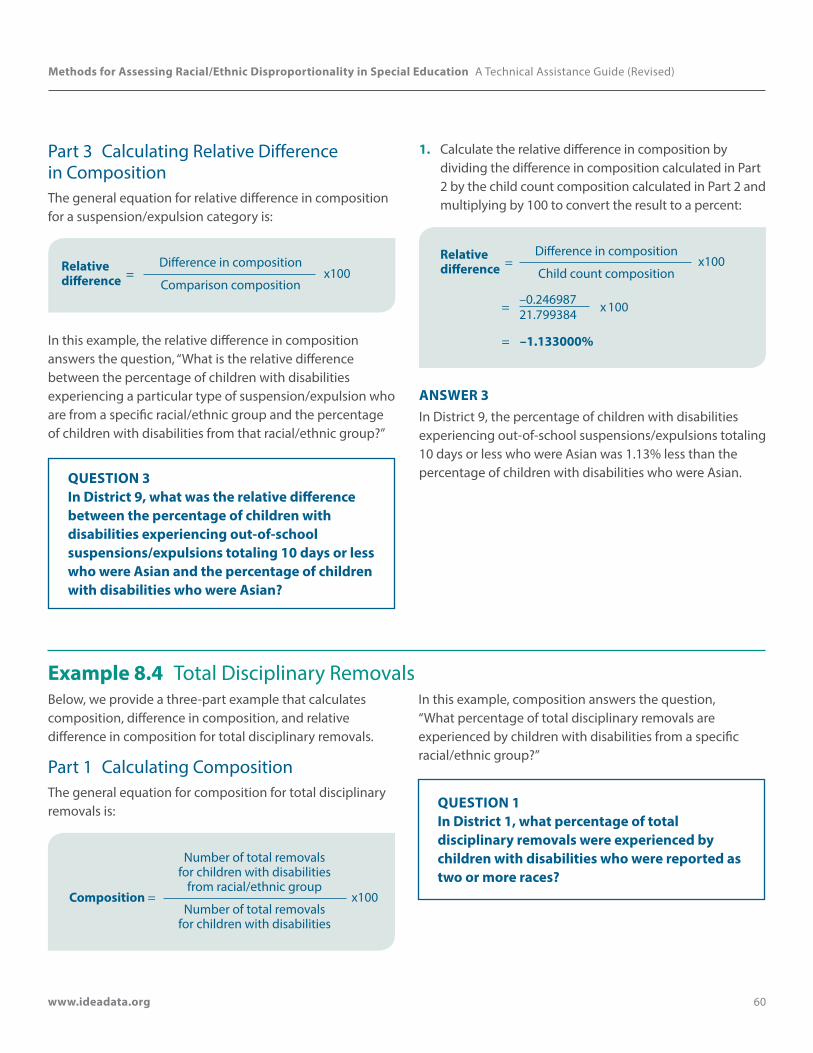
Methods for Assessing Racial/Ethnic Disproportionality in Special Education A Technical Assistance Guide (Revised)
www.ideadata.org 60
Part 3 Calculating Relative Difference in CompositionThe general equation for relative difference in composition for a suspension/expulsion category is:
Relative difference =
Difference in composition
Comparison compositionx100
In this example, the relative difference in composition answers the question, “What is the relative difference between the percentage of children with disabilities experiencing a particular type of suspension/expulsion who are from a specific racial/ethnic group and the percentage of children with disabilities from that racial/ethnic group?”
QUESTION 3 In District 9, what was the relative difference between the percentage of children with disabilities experiencing out-of-school suspensions/expulsions totaling 10 days or less who were Asian and the percentage of children with disabilities who were Asian?
1. Calculate the relative difference in composition by dividing the difference in composition calculated in Part 2 by the child count composition calculated in Part 2 and multiplying by 100 to convert the result to a percent:
Relative difference =
Difference in composition
Child count compositionx100
= –0.246987 x 10021.799384
= –1.133000%
ANSWER 3In District 9, the percentage of children with disabilities experiencing out-of-school suspensions/expulsions totaling 10 days or less who were Asian was 1.13% less than the percentage of children with disabilities who were Asian.
Example 8.4 Total Disciplinary RemovalsBelow, we provide a three-part example that calculates composition, difference in composition, and relative difference in composition for total disciplinary removals.
Part 1 Calculating CompositionThe general equation for composition for total disciplinary removals is:
Composition =
Number of total removals for children with disabilities
from racial/ethnic group
Number of total removals for children with disabilities
x100
In this example, composition answers the question, “What percentage of total disciplinary removals are experienced by children with disabilities from a specific racial/ethnic group?”
QUESTION 1 In District 1, what percentage of total disciplinary removals were experienced by children with disabilities who were reported as two or more races?
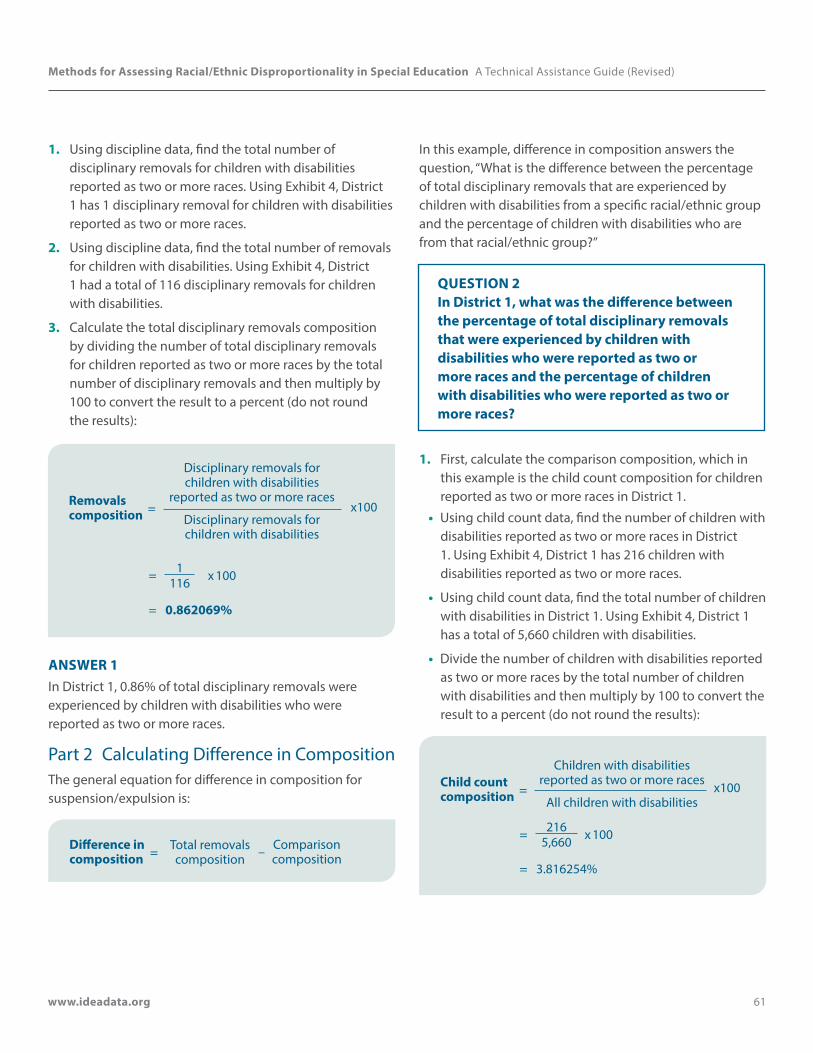
Methods for Assessing Racial/Ethnic Disproportionality in Special Education A Technical Assistance Guide (Revised)
www.ideadata.org 61
1. Using discipline data, find the total number of disciplinary removals for children with disabilities reported as two or more races. Using Exhibit 4, District 1 has 1 disciplinary removal for children with disabilities reported as two or more races.
2. Using discipline data, find the total number of removals for children with disabilities. Using Exhibit 4, District 1 had a total of 116 disciplinary removals for children with disabilities.
3. Calculate the total disciplinary removals composition by dividing the number of total disciplinary removals for children reported as two or more races by the total number of disciplinary removals and then multiply by 100 to convert the result to a percent (do not round the results):
Removals composition =
Disciplinary removals for children with disabilities
reported as two or more races
Disciplinary removals for children with disabilities
x100
= 1 x 100116
= 0.862069%
ANSWER 1In District 1, 0.86% of total disciplinary removals were experienced by children with disabilities who were reported as two or more races.
Part 2 Calculating Difference in CompositionThe general equation for difference in composition for suspension/expulsion is:
Difference in composition =
Total removals composition – Comparison
composition
In this example, difference in composition answers the question, “What is the difference between the percentage of total disciplinary removals that are experienced by children with disabilities from a specific racial/ethnic group and the percentage of children with disabilities who are from that racial/ethnic group?”
QUESTION 2 In District 1, what was the difference between the percentage of total disciplinary removals that were experienced by children with disabilities who were reported as two or more races and the percentage of children with disabilities who were reported as two or more races?
1. First, calculate the comparison composition, which in this example is the child count composition for children reported as two or more races in District 1.
• Using child count data, find the number of children with disabilities reported as two or more races in District 1. Using Exhibit 4, District 1 has 216 children with disabilities reported as two or more races.
• Using child count data, find the total number of children with disabilities in District 1. Using Exhibit 4, District 1 has a total of 5,660 children with disabilities.
• Divide the number of children with disabilities reported as two or more races by the total number of children with disabilities and then multiply by 100 to convert the result to a percent (do not round the results):
Child count composition =
Children with disabilities reported as two or more races
All children with disabilitiesx100
= 216 x 1005,660
= 3.816254%
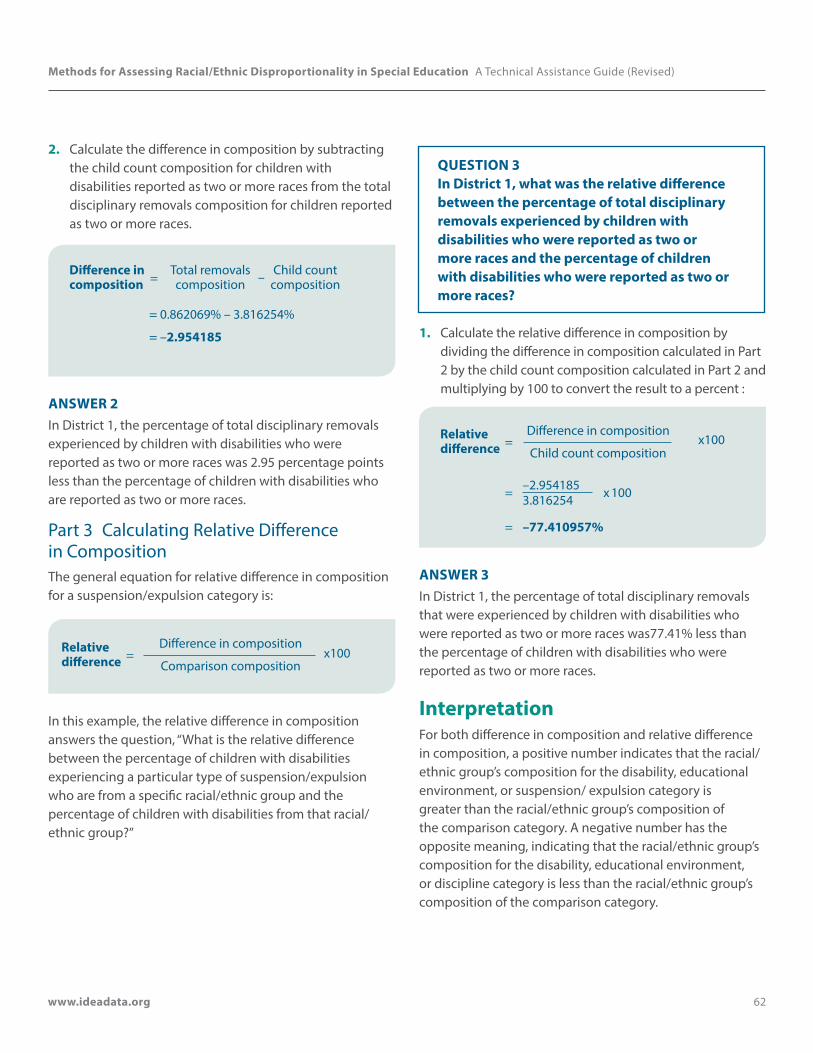
Methods for Assessing Racial/Ethnic Disproportionality in Special Education A Technical Assistance Guide (Revised)
www.ideadata.org 62
2. Calculate the difference in composition by subtracting the child count composition for children with disabilities reported as two or more races from the total disciplinary removals composition for children reported as two or more races.
Difference in composition =
Total removals composition – Child count
composition
= 0.862069% – 3.816254%
= –2.954185
ANSWER 2In District 1, the percentage of total disciplinary removals experienced by children with disabilities who were reported as two or more races was 2.95 percentage points less than the percentage of children with disabilities who are reported as two or more races.
Part 3 Calculating Relative Difference in CompositionThe general equation for relative difference in composition for a suspension/expulsion category is:
Relative difference =
Difference in composition
Comparison compositionx100
In this example, the relative difference in composition answers the question, “What is the relative difference between the percentage of children with disabilities experiencing a particular type of suspension/expulsion who are from a specific racial/ethnic group and the percentage of children with disabilities from that racial/ethnic group?”
QUESTION 3 In District 1, what was the relative difference between the percentage of total disciplinary removals experienced by children with disabilities who were reported as two or more races and the percentage of children with disabilities who were reported as two or more races?
1. Calculate the relative difference in composition by dividing the difference in composition calculated in Part 2 by the child count composition calculated in Part 2 and multiplying by 100 to convert the result to a percent :
Relative difference =
Difference in composition
Child count compositionx100
= –2.954185 x 1003.816254
= –77.410957%
ANSWER 3In District 1, the percentage of total disciplinary removals that were experienced by children with disabilities who were reported as two or more races was77.41% less than the percentage of children with disabilities who were reported as two or more races.
InterpretationFor both difference in composition and relative difference in composition, a positive number indicates that the racial/ethnic group’s composition for the disability, educational environment, or suspension/ expulsion category is greater than the racial/ethnic group’s composition of the comparison category. A negative number has the opposite meaning, indicating that the racial/ethnic group’s composition for the disability, educational environment, or discipline category is less than the racial/ethnic group’s composition of the comparison category.
Methods for Assessing Racial/Ethnic Disproportionality in Special Education A Technical Assistance Guide (Revised)
www.ideadata.org 63
It is up to the state to set a threshold for when this difference indicates disproportionality. For example, looking at Example 8.1, if the state had set a threshold of 10.00 percentage points for difference in composition, then District 5 would be identified as having disproportionality because the difference in composition for Black or African American children for the ID category is 13.90 percentage points. Likewise, if a state set the threshold for relative difference in composition at 100.00%, District 5 would again be identified, as its relative difference in composition for Black or African American children for ID is 116.19%.
ConsiderationsThe size of the racial/ethnic group’s percentage of the disability, educational environment, or discipline category is generally related to the size of that racial/ethnic group’s percentage of the total child enrollment or total child count. When one racial/ethnic group composes a large percentage of a district’s total enrollment, then that racial/ethnic group will usually compose a large percentage of the disability categories. For instance, if a district’s enrollment consists mostly of White children, then White children will typically compose a larger percentage of the disability categories than any other racial/ethnic group. Similarly, in districts with larger Black or African American or Hispanic/Latino enrollments, Black or African American or Hispanic/Latino children will compose a comparatively larger percentage of the disability categories than in districts with smaller Black or African American or Hispanic/Latino enrollments. Thus, the composition of the disability, educational environment, or discipline category is most useful when compared to the racial/ethnic composition of a comparison category, as demonstrated in the examples in this chapter.
The comparison can be done using either the difference in composition or the relative difference in composition. Difference in composition is less sensitive to changes in small percentages than the relative difference in composition. For example, a difference in composition of 1% corresponds to a relative difference in composition of only 5% if the comparison composition is 20%, but the same 1% difference in composition corresponds to a relative difference in composition of 100% if the comparison composition is 1%.
Caution should be used when using composition in states or districts that have homogeneous racial/ethnic distributions. When a state’s or district’s child enrollment or child count is composed almost entirely of one racial/ethnic group, it can become impossible to demonstrate racial/ethnic disproportionality using composition. For example, if any racial/ethnic group composed 83% of enrolled children, it would be impossible to have a positive difference in composition of more than 17% for that racial/ethnic group.
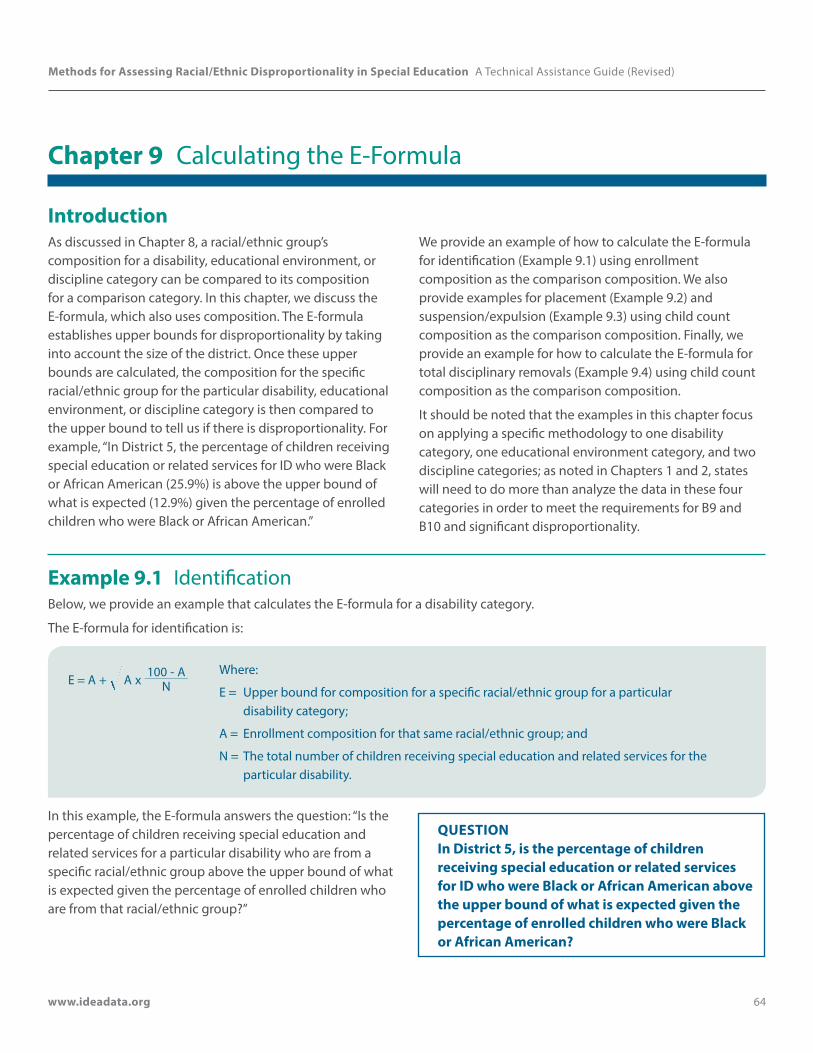
Methods for Assessing Racial/Ethnic Disproportionality in Special Education A Technical Assistance Guide (Revised)
www.ideadata.org 64
Chapter 9 Calculating the E-Formula
IntroductionAs discussed in Chapter 8, a racial/ethnic group’s composition for a disability, educational environment, or discipline category can be compared to its composition for a comparison category. In this chapter, we discuss the E-formula, which also uses composition. The E-formula establishes upper bounds for disproportionality by taking into account the size of the district. Once these upper bounds are calculated, the composition for the specific racial/ethnic group for the particular disability, educational environment, or discipline category is then compared to the upper bound to tell us if there is disproportionality. For example, “In District 5, the percentage of children receiving special education or related services for ID who were Black or African American (25.9%) is above the upper bound of what is expected (12.9%) given the percentage of enrolled children who were Black or African American.”
We provide an example of how to calculate the E-formula for identification (Example 9.1) using enrollment composition as the comparison composition. We also provide examples for placement (Example 9.2) and suspension/expulsion (Example 9.3) using child count composition as the comparison composition. Finally, we provide an example for how to calculate the E-formula for total disciplinary removals (Example 9.4) using child count composition as the comparison composition.
It should be noted that the examples in this chapter focus on applying a specific methodology to one disability category, one educational environment category, and two discipline categories; as noted in Chapters 1 and 2, states will need to do more than analyze the data in these four categories in order to meet the requirements for B9 and B10 and significant disproportionality.
Example 9.1 IdentificationBelow, we provide an example that calculates the E-formula for a disability category.
The E-formula for identification is:
E A A x N100 A
= +- Where:
E = Upper bound for composition for a specific racial/ethnic group for a particular disability category;
A = Enrollment composition for that same racial/ethnic group; and
N = The total number of children receiving special education and related services for the particular disability.
In this example, the E-formula answers the question: “Is the percentage of children receiving special education and related services for a particular disability who are from a specific racial/ethnic group above the upper bound of what is expected given the percentage of enrolled children who are from that racial/ethnic group?”
QUESTION In District 5, is the percentage of children receiving special education or related services for ID who were Black or African American above the upper bound of what is expected given the percentage of enrolled children who were Black or African American?

Methods for Assessing Racial/Ethnic Disproportionality in Special Education A Technical Assistance Guide (Revised)
www.ideadata.org 65
1. As shown in Part 1 of Example 8.1, calculatecomposition for Black or African American children forthe ID category for District 5 (do not round the results).
ID Composition =
Black or African American children in ID category
x100 All children in ID category
= 316 x 100 1,222
= 25.85924%
2. Next, as shown in Part 2 of Example 8.1, calculate “A” of the E-formula equation, which is the enrollmentcomposition for Black or African American children inDistrict 5 (do not round the results).
Enrollment composition (A) =
Enrolled Black or African American children x100
All enrolled children
= 6,224 x 10052,034
= 11.961410%
3. Using child count data, find “N” of the E-formulaequation, which is the total number of children in theID category in District 5. Using Exhibit 1, District 5 has atotal of 1,222 children in the ID category.
4. Calculate the E-formula:
E A A x N100 A
= +-
= 11.961410 11.961410 x 1,100 11.961410
222+-
= 11.961410 + 0.928308
= 12.889718%
5. Determine if the composition for Black or AfricanAmerican children for the ID category is above theupper bound (E).
ANSWER In District 5, the percentage of children receiving special education or related services for ID who were Black or African American (25.9%) is above the upper bound of what is expected (12.9%) given the percentage of enrolled children who were Black or African American.
Example 9.2 PlacementThe E-formula for placement is:
E A A x N100 A
= +- Where:
E = Upper bound for composition for a specific racial/ethnic group for a particular educational environment category;
A = Child count composition for that same racial/ethnic group; and
N = The total number of children receiving special education and related services in the particular educational environment category.
In this example, the E-formula answers the question: “Is the percentage of children with disabilities receiving special education and related services in a particular educational environment who are from a specific racial/ethnic group
above the upper bound of what is expected given the percentage of children with disabilities from that racial/ethnic group?”
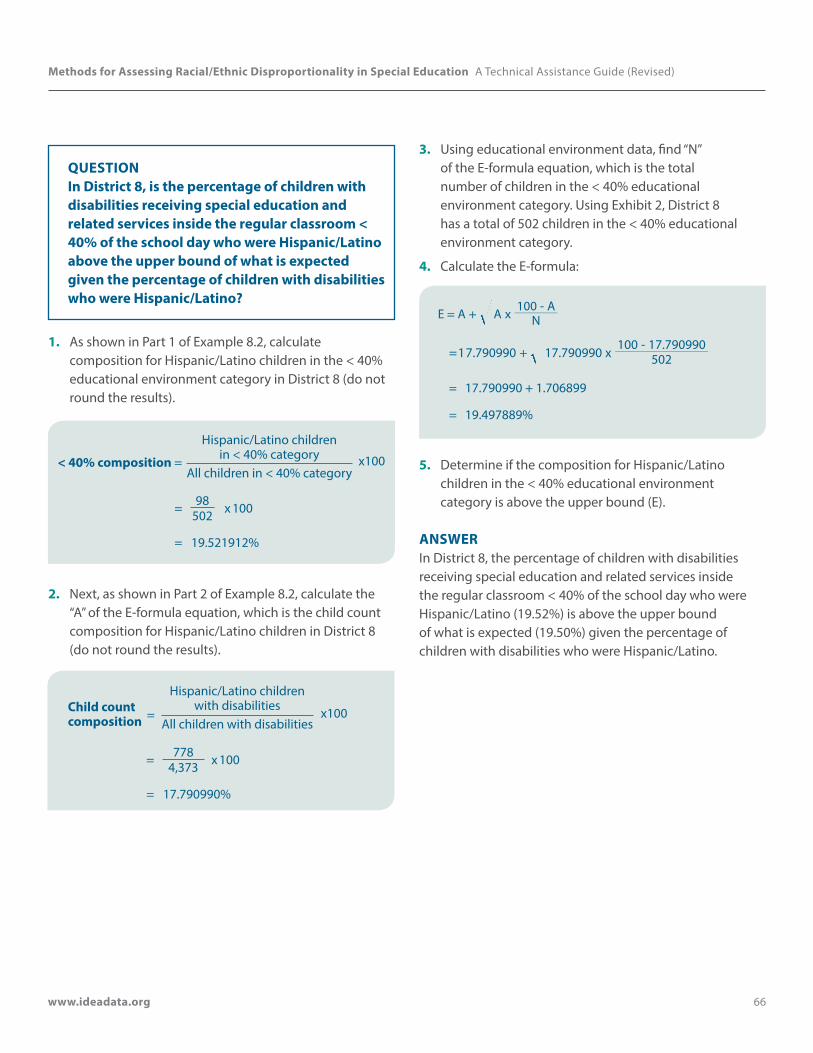
Methods for Assessing Racial/Ethnic Disproportionality in Special Education A Technical Assistance Guide (Revised)
www.ideadata.org 66
QUESTION In District 8, is the percentage of children with disabilities receiving special education and related services inside the regular classroom < 40% of the school day who were Hispanic/Latino above the upper bound of what is expected given the percentage of children with disabilities who were Hispanic/Latino?
1. As shown in Part 1 of Example 8.2, calculatecomposition for Hispanic/Latino children in the < 40%educational environment category in District 8 (do notround the results).
< 40% composition =
Hispanic/Latino children in < 40% category x100
All children in < 40% category
= 98 x 100502
= 19.521912%
2. Next, as shown in Part 2 of Example 8.2, calculate the“A” of the E-formula equation, which is the child countcomposition for Hispanic/Latino children in District 8(do not round the results).
Child count composition =
Hispanic/Latino children with disabilities x100
All children with disabilities
= 778 x 1004,373
= 17.790990%
3. Using educational environment data, find “N” of the E-formula equation, which is the totalnumber of children in the < 40% educationalenvironment category. Using Exhibit 2, District 8has a total of 502 children in the < 40% educationalenvironment category.
4. Calculate the E-formula:
E A= + A x N100 A-
1 . 9 17.790990 x 2100 17.790990
7 7 0990 50= +-
= 17.790990 + 1.706899
= 19.497889%
5. Determine if the composition for Hispanic/Latinochildren in the < 40% educational environmentcategory is above the upper bound (E).
ANSWER In District 8, the percentage of children with disabilities receiving special education and related services inside the regular classroom < 40% of the school day who were Hispanic/Latino (19.52%) is above the upper bound of what is expected (19.50%) given the percentage of children with disabilities who were Hispanic/Latino.
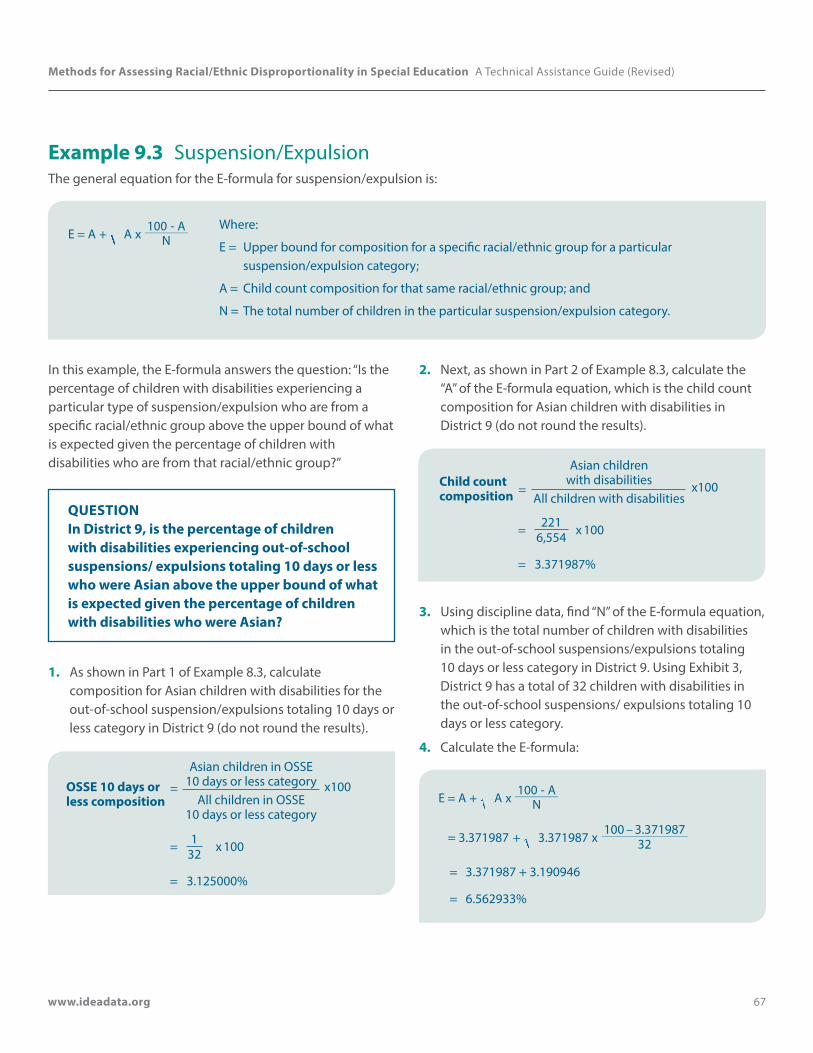
Methods for Assessing Racial/Ethnic Disproportionality in Special Education A Technical Assistance Guide (Revised)
www.ideadata.org 67
Example 9.3 Suspension/ExpulsionThe general equation for the E-formula for suspension/expulsion is:
E A A x N100 A
= +- Where:
E = Upper bound for composition for a specific racial/ethnic group for a particular suspension/expulsion category;
A = Child count composition for that same racial/ethnic group; and
N = The total number of children in the particular suspension/expulsion category.
In this example, the E-formula answers the question: “Is the percentage of children with disabilities experiencing a particular type of suspension/expulsion who are from a specific racial/ethnic group above the upper bound of what is expected given the percentage of children with disabilities who are from that racial/ethnic group?”
QUESTION In District 9, is the percentage of children with disabilities experiencing out-of-school suspensions/ expulsions totaling 10 days or less who were Asian above the upper bound of what is expected given the percentage of children with disabilities who were Asian?
1. As shown in Part 1 of Example 8.3, calculate composition for Asian children with disabilities for the out-of-school suspension/expulsions totaling 10 days or less category in District 9 (do not round the results).
OSSE 10 days or less composition
=
Asian children in OSSE 10 days or less category
All children in OSSE 10 days or less category
x100
= 1 x 10032
= 3.125000%
2. Next, as shown in Part 2 of Example 8.3, calculate the “A” of the E-formula equation, which is the child count composition for Asian children with disabilities in District 9 (do not round the results).
Child count composition =
Asian children with disabilities
All children with disabilitiesx100
= 221 x 1006,554
= 3.371987%
3. Using discipline data, find “N” of the E-formula equation, which is the total number of children with disabilities in the out-of-school suspensions/expulsions totaling 10 days or less category in District 9. Using Exhibit 3, District 9 has a total of 32 children with disabilities in the out-of-school suspensions/ expulsions totaling 10 days or less category.
4. Calculate the E-formula:
E A A x N100 A
= +-
. 3.371987 x 2100 3.371987
3 371987 3=–
+
= 3.371987 + 3.190946
= 6.562933%
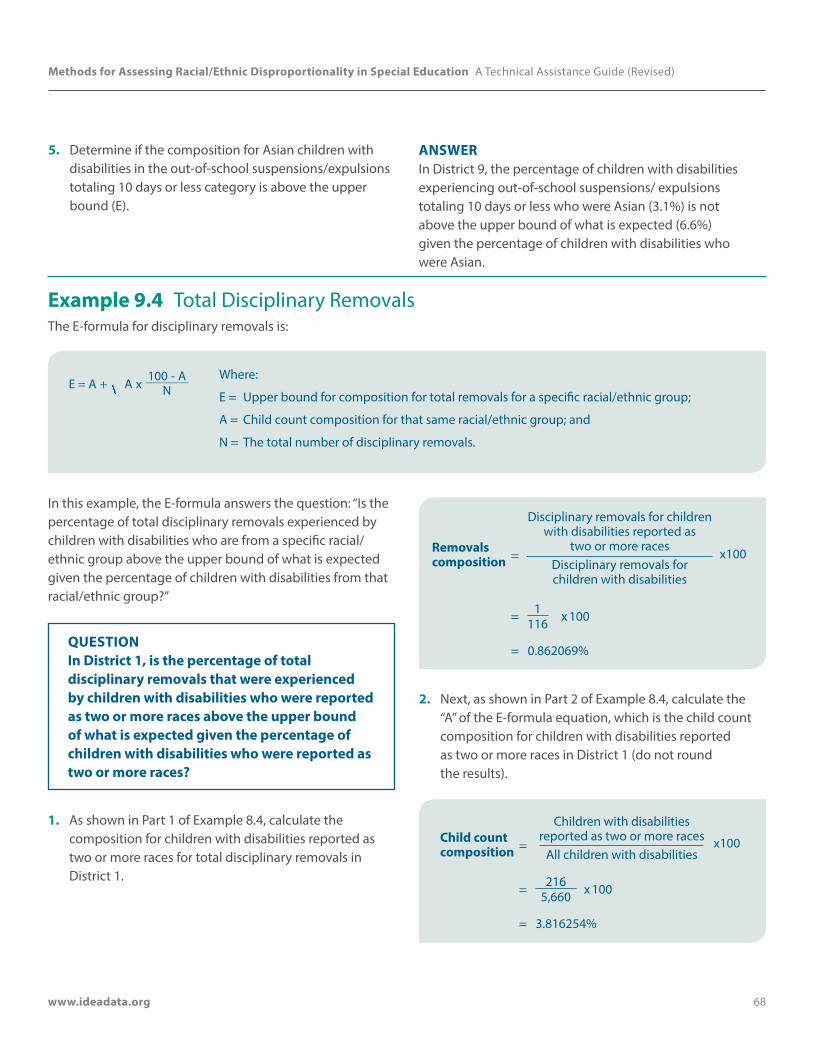
Methods for Assessing Racial/Ethnic Disproportionality in Special Education A Technical Assistance Guide (Revised)
www.ideadata.org 68
5. Determine if the composition for Asian children with disabilities in the out-of-school suspensions/expulsions totaling 10 days or less category is above the upper bound (E).
ANSWER In District 9, the percentage of children with disabilities experiencing out-of-school suspensions/ expulsions totaling 10 days or less who were Asian (3.1%) is not above the upper bound of what is expected (6.6%) given the percentage of children with disabilities who were Asian.
Example 9.4 Total Disciplinary RemovalsThe E-formula for disciplinary removals is:
E A A x N100 A
= +- Where:
E = Upper bound for composition for total removals for a specific racial/ethnic group;
A = Child count composition for that same racial/ethnic group; and
N = The total number of disciplinary removals.
In this example, the E-formula answers the question: “Is the percentage of total disciplinary removals experienced by children with disabilities who are from a specific racial/ethnic group above the upper bound of what is expected given the percentage of children with disabilities from that racial/ethnic group?”
QUESTION In District 1, is the percentage of total disciplinary removals that were experienced by children with disabilities who were reported as two or more races above the upper bound of what is expected given the percentage of children with disabilities who were reported as two or more races?
1. As shown in Part 1 of Example 8.4, calculate the composition for children with disabilities reported as two or more races for total disciplinary removals in District 1.
Removals composition =
Disciplinary removals for children with disabilities reported as
two or more racesDisciplinary removals for children with disabilities
x100
= 1 x 100116
= 0.862069%
2. Next, as shown in Part 2 of Example 8.4, calculate the “A” of the E-formula equation, which is the child count composition for children with disabilities reported as two or more races in District 1 (do not round the results).
Child count composition =
Children with disabilities reported as two or more races
All children with disabilitiesx100
= 216 x 1005,660
= 3.816254%
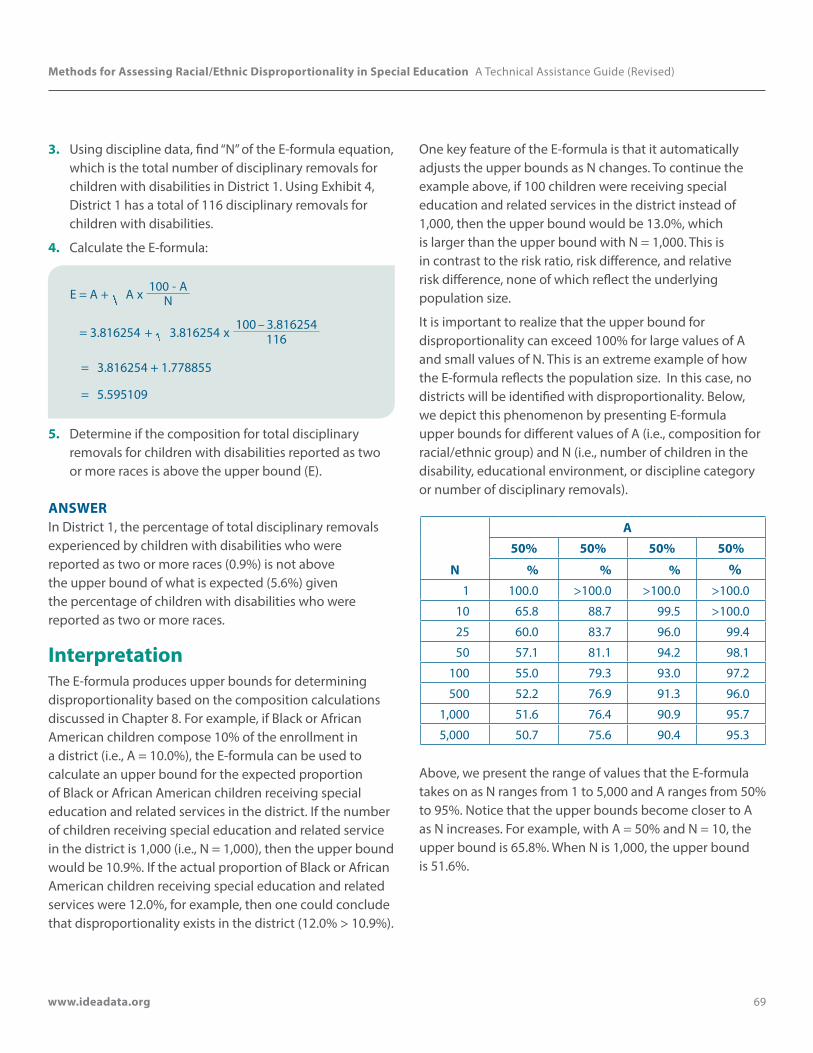
Methods for Assessing Racial/Ethnic Disproportionality in Special Education A Technical Assistance Guide (Revised)
www.ideadata.org 69
3. Using discipline data, find “N” of the E-formula equation, which is the total number of disciplinary removals for children with disabilities in District 1. Using Exhibit 4, District 1 has a total of 116 disciplinary removals for children with disabilities.
4. Calculate the E-formula:
E A A x N100 A
= +-
. 3.816254 x100 3.816254
3 816254 116= +–
= 3.816254 + 1.778855
= 5.595109
5. Determine if the composition for total disciplinary removals for children with disabilities reported as two or more races is above the upper bound (E).
ANSWER In District 1, the percentage of total disciplinary removals experienced by children with disabilities who were reported as two or more races (0.9%) is not above the upper bound of what is expected (5.6%) given the percentage of children with disabilities who were reported as two or more races.
InterpretationThe E-formula produces upper bounds for determining disproportionality based on the composition calculations discussed in Chapter 8. For example, if Black or African American children compose 10% of the enrollment in a district (i.e., A = 10.0%), the E-formula can be used to calculate an upper bound for the expected proportion of Black or African American children receiving special education and related services in the district. If the number of children receiving special education and related service in the district is 1,000 (i.e., N = 1,000), then the upper bound would be 10.9%. If the actual proportion of Black or African American children receiving special education and related services were 12.0%, for example, then one could conclude that disproportionality exists in the district (12.0% > 10.9%).
One key feature of the E-formula is that it automatically adjusts the upper bounds as N changes. To continue the example above, if 100 children were receiving special education and related services in the district instead of 1,000, then the upper bound would be 13.0%, which is larger than the upper bound with N = 1,000. This is in contrast to the risk ratio, risk difference, and relative risk difference, none of which reflect the underlying population size.
It is important to realize that the upper bound for disproportionality can exceed 100% for large values of A and small values of N. This is an extreme example of how the E-formula reflects the population size. In this case, no districts will be identified with disproportionality. Below, we depict this phenomenon by presenting E-formula upper bounds for different values of A (i.e., composition for racial/ethnic group) and N (i.e., number of children in the disability, educational environment, or discipline category or number of disciplinary removals).
N
A
50% 50% 50% 50%
% % % %1 100.0 >100.0 >100.0 >100.0
10 65.8 88.7 99.5 >100.0
25 60.0 83.7 96.0 99.4
50 57.1 81.1 94.2 98.1
100 55.0 79.3 93.0 97.2
500 52.2 76.9 91.3 96.0
1,000 51.6 76.4 90.9 95.7
5,000 50.7 75.6 90.4 95.3
Above, we present the range of values that the E-formula takes on as N ranges from 1 to 5,000 and A ranges from 50% to 95%. Notice that the upper bounds become closer to A as N increases. For example, with A = 50% and N = 10, the upper bound is 65.8%. When N is 1,000, the upper bound is 51.6%.
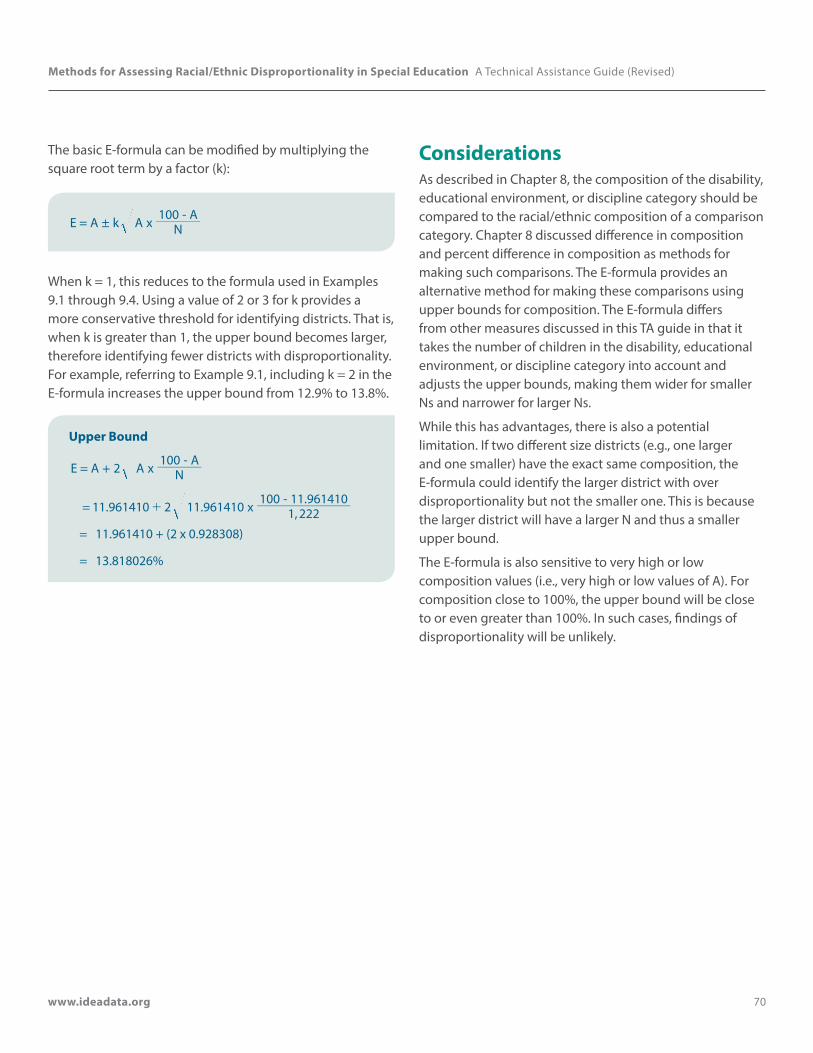
Methods for Assessing Racial/Ethnic Disproportionality in Special Education A Technical Assistance Guide (Revised)
www.ideadata.org 70
The basic E-formula can be modified by multiplying the square root term by a factor (k):
E A A x N100 A
k= ±-
When k = 1, this reduces to the formula used in Examples 9.1 through 9.4. Using a value of 2 or 3 for k provides a more conservative threshold for identifying districts. That is, when k is greater than 1, the upper bound becomes larger, therefore identifying fewer districts with disproportionality. For example, referring to Example 9.1, including k = 2 in the E-formula increases the upper bound from 12.9% to 13.8%.
Upper Bound
E A A x N100 A
2= +-
1 x 1, 222100 11.961410
2= 1.961410 11.961410-
+
= 11.961410 + (2 x 0.928308)
= 13.818026%
ConsiderationsAs described in Chapter 8, the composition of the disability, educational environment, or discipline category should be compared to the racial/ethnic composition of a comparison category. Chapter 8 discussed difference in composition and percent difference in composition as methods for making such comparisons. The E-formula provides an alternative method for making these comparisons using upper bounds for composition. The E-formula differs from other measures discussed in this TA guide in that it takes the number of children in the disability, educational environment, or discipline category into account and adjusts the upper bounds, making them wider for smaller Ns and narrower for larger Ns.
While this has advantages, there is also a potential limitation. If two different size districts (e.g., one larger and one smaller) have the exact same composition, the E-formula could identify the larger district with over disproportionality but not the smaller one. This is because the larger district will have a larger N and thus a smaller upper bound.
The E-formula is also sensitive to very high or low composition values (i.e., very high or low values of A). For composition close to 100%, the upper bound will be close to or even greater than 100%. In such cases, findings of disproportionality will be unlikely.
Methods for Assessing Racial/Ethnic Disproportionality in Special Education A Technical Assistance Guide (Revised)
www.ideadata.org 71
Chapter 10 Small Cell Sizes
IntroductionDisproportionality measures can be unreliable if the number of children included in the analysis is small. Unreliable analyses caused by small cell sizes may result in districts being inappropriately identified with disproportionality. The most common method states use to address this problem is to identify a minimum number of children to be included in the analysis, called a minimum n-size or a minimum cell size.
When deciding to implement a minimum cell size, it is important for states to realize that there is no perfect value; any minimum cell size has trade-offs and limitations. On one hand, small cell sizes may produce unreliable results. On the other hand, if the state implements a large minimum cell size, many districts may be completely eliminated from the analysis, leaving no objective way to identify disproportionality in these districts. According to the SPP/APR Measurement Table, states are required to report on the number of districts excluded from the calculations as a result of the state’s minimum cell size requirements. States need to balance the possibility of inappropriately identifying districts because of small cell sizes against the possibility of eliminating so many districts that a meaningful examination of disproportionality within a state is not possible.
This chapter discusses minimum cell sizes, including choosing and implementing minimum cell sizes and reporting the minimum cell sizes in a clear manner. We also discuss using multiple years of data when making determinations of disproportionality, which is another method that states use to address the possibility of unreliable results due to small numbers.
Choosing and Implementing Minimum Cell SizesWhile, as noted above, there is no perfect minimum cell size value, there are a number of issues that states may want to consider when choosing and implementing a minimum cell size. These issues are discussed in more detail in this section.
In general, states should note that it may not be appropriate to apply one minimum cell-size “rule” to all data sets and all analyses. For example, the minimum cell size for calculating Adequate Yearly Progress (AYP) may not be appropriate for analyzing disproportionality because the purpose and scope of analyses are different and the practical balance between the risk of inappropriately identifying districts versus the risk of failing to identify districts are different. States should be prepared to describe their minimum cell size requirements and provide a rationale regarding how they chose them.
Types of Minimum Cell SizesWhen implementing a minimum cell size, states should determine how “cell” is to be defined for their analyses. For example, the minimum cell size may be based on the:
• Number of children enrolled in the district (e.g., 30 children enrolled in the district);
• Number children enrolled in the district by race/ethnicity (e.g., 10 Hispanic/Latino children enrolled in the district);
• Number of children with disabilities (e.g., 40 children with disabilities in the district);
• Number of children with disabilities by race/ethnicity (e.g., 20 children with disabilities in the district who are Black or African American);
Methods for Assessing Racial/Ethnic Disproportionality in Special Education A Technical Assistance Guide (Revised)
www.ideadata.org 72
• Number of children with disabilities in a particular disability, educational environment, or discipline category (e.g., 15 children receiving special education and related services for ID in the district or 5 children with disabilities suspended/expelled in the district);
• Number of children with disabilities in a particular disability, educational environment, or discipline category by race/ethnicity (e.g., 15 children receiving special education and related services for ID in the district who are reported as two or more races).
States may also implement similar minimum cell sizes based on the number of children in the comparison group (e.g., if analyzing Black or African American children, a state might require that there be at least 20 children enrolled in the district from all other racial/ethnic groups combined).
When implementing minimum cell sizes based on race/ethnicity, states should note that the Department of Education has indicated that, in the context of indicators B9 and B10 and significant disproportionality, using different minimum cell sizes for different racial/ethnic groups is a legally questionable practice.
States should also note that changing minimum cell size requirements from year-to-year can potentially have a dramatic impact on the results of their analyses, making it difficult to compare results across years and determine whether progress has been made towards reducing disproportionality.
Risk Ratios and Minimum Cell SizesWhen using risk ratios, calculating disproportionality can be difficult when a district has only a few children from a given racial/ethnic group. While states may choose to use different types of minimum cell sizes, they should note that it is the risk denominator that determines the reliability of the risk calculation. Consider the following example that focuses on identification.
If the number of children from a racial/ethnic group enrolled in the district is large enough, the district-level risk for that racial/ethnic group will tend to be fairly stable. For example, if a district has 50 American Indian or Alaska Native children enrolled in the district and none are identified with ID, then the ID risk is 0% (i.e., 0 ÷ 50). If the next year, however, 1 of these 50 children is identified with ID, then the ID risk goes from 0% to 2%:
Risk
=
Number of children from racial/ethnic group in disability category
x100Number of enrolled children from
racial/ethnic group
= 1 x 10050
= 2.0%
On the other hand, if the number of children from a racial/ethnic group enrolled in the district is small, the district-level risk for that racial/ethnic group will be less stable. For example, if a district has 4 American Indian or Alaska Native children enrolled in the district and none are identified with ID, then the ID risk is 0% (i.e., 0 ÷ 4). If the next year, however, 1 of these 4 children is identified with ID, then the ID risk goes from 0% to 25%:
Risk
=
Number of children from racial/ethnic group in disability category
x100Number of enrolled children from
racial/ethnic group
= 1 x 1004
= 25.0%

Methods for Assessing Racial/Ethnic Disproportionality in Special Education A Technical Assistance Guide (Revised)
www.ideadata.org 73
This instability may provide an unreliable basis for describing racial/ethnic groups and for comparing them with children of other racial/ethnic groups using the risk ratio. Therefore, the remainder of our discussion of minimum cell sizes in relation to the risk ratio focuses on the number of children from the racial/ethnic group in the denominator of the risk calculation. In this TA guide, the denominator of the risk calculation is based on enrollment data for identification analyses and child count data for placement and discipline analyses.
We suggest the following when calculating risk ratios at the district level:
• Do not calculate any kind of risk ratio for identification unless the number of children in the racial/ethnic group of interest enrolled in the district meets the minimum cell size.
• Do not calculate a risk ratio for educational environment data or discipline data unless the number of children with disabilities from the racial/ethnic group of interest in the district meets the minimum cell size.
• Consider calculating an alternate risk ratio for identification if the number of children in the comparison group enrolled in the district does not meet the minimum cell size. Also consider calculating an alternate risk ratio if the risk for the comparison group is zero.
• Consider calculating an alternate risk ratio for educational environment or discipline data if the number of children with disabilities in the comparison group in the district does not meet the minimum cell size. Also consider calculating an alternate risk ratio if the risk for the comparison group is zero.
• Because the alternate risk ratio uses state-level data to calculate the risk for the comparison group, the minimum cell should be applied at that level. Do not calculate the alternate risk ratio if there are fewer than the minimum required children in the comparison group enrolled in the state (when examining child count data) or in the total state child count (when examining educational environment data or discipline data).
• Do not calculate the alternate risk ratio if there are no children in the comparison group in the disability, educational environment, or discipline category at the state level.
In examining different minimum cell sizes and the risk ratio (Bollmer et al., 2004), we have found 10 to be a reasonable value (i.e., 10 children from the racial/ethnic group enrolled in the district for identification analyses or 10 children with disabilities from the racial/ethnic group in the district for placement or discipline analyses). Making some practical assumptions, an increase from 5 children in a category to 10 generates a large increase in reliability of results, while an increase from 10 to 15 children generates a smaller increase in reliability. While this additional increase in reliability is not negligible, it was judged to be less important than the possibility of eliminating large numbers of districts from the analyses.
However, any minimum cell size must be applied cautiously. Of particular concern are instances where the overall risk is small (e.g., 1% or 2%), which could be the case for some of the less common disabilities and for suspension/expulsion. Often, there will be 0% risk for a racial/ethnic group. However, if 1 child is identified, then the risk will increase to 10% (with a minimum cell size of 10), leading to a risk ratio of 5.00 or more if the comparison group has a risk of 1% or 2%.
Other Methods and Minimum Cell SizesThe discussion above relates to calculating the risk ratio. Other methods can also be affected by small cell sizes. We are not aware of research or guidelines for minimum cell sizes for these methods, however.
In general, though, small cell sizes typically do not have the same effect on analysis involving composition because the denominator for calculating composition consists of all enrolled children or all children with disabilities and is generally a large enough number for composition calculations to be stable.
Methods for Assessing Racial/Ethnic Disproportionality in Special Education A Technical Assistance Guide (Revised)
www.ideadata.org 74
Furthermore, the E-formula can be used with small cell sizes since the E-formula is “self-adjusting” and will automatically reflect differences in cell sizes. When cell sizes are very small, the upper bound will be larger, thus reflecting the decrease in reliability and making it more difficult to identify districts as having disproportionality.
When Racial/Ethnic Groups Within Districts Are Eliminated From the AnalysesWhen specific racial/ethnic groups within districts (or entire districts) are eliminated from the analyses based on minimum cell sizes, states may want to consider other ways of evaluating disproportionality for those groups or districts. For example, if a state uses the risk ratio and sets a minimum cell size of 10 children from the racial/ethnic group enrolled in the district, and a district has 9 enrolled Black or African American children, a risk ratio would not be calculated for that racial/ethnic group. However, if all 9 of those Black or African American children are identified for special education and related services, then the state may want to further examine this instance of possible disproportionality, even though a risk ratio was not calculated.
Reporting Minimum Cell SizesStates should ensure that their reporting on minimum cell sizes is clear. For example, states should describe their minimum cell size requirements separately from their definitions of disproportionality. A second element of clarity is to be sure to report exactly how “cell size” is being defined by the state. As noted previously, some states may base their minimum cell size on the number of children enrolled in a district, while others may base it on the number of children with disabilities in a district. It is very important, therefore, for states to be clear in how they are defining their cell sizes when presenting their minimum cell size requirements.
An example where the cell size is not clear is:
Ñ Risk ratios are calculated for districts with a minimum of 15 children.
This example could be clarified as follows:
X Risk ratios for a given racial/ethnic group are calculated only for districts that have at least 15 children in that racial/ethnic group enrolled in the district.
Another example where the cell size is not clear is:
Ñ The state uses a minimum cell size of 10.
This example could be clarified as follows:
X Risk ratios for a given racial/ethnic group are only calculated when there are at least 10 children in that racial/ethnic group enrolled in the district. In addition, there must be at least 10 children in the comparison group (i.e., children in all other racial/ethnic groups combined) enrolled in the district.
Some states use a combination of minimum cell size requirements (e.g., there must be 15 children with disabilities in the district, AND there must be 30 children enrolled in the district overall). States using multiple minimum cell size requirements should be especially careful to ensure that it is clear how they are defining the various cells that make up their requirements.
Calculating the Percentage of Districts with Disproportionate Representation Due to Inappropriate IdentificationFor indicators B9 and B10, if states use a minimum cell size requirement, they must report the number of districts that were entirely eliminated from the analyses as a result of this requirement. States should consider a district to be eliminated from the analyses if disproportionate representation was not examined for ANY racial/ethnic group in the district. An example of how states might report this information is:
• The state has 150 districts. Of these districts, 25 were eliminated from the analyses because a risk ratio could not be calculated for any racial/ethnic group.
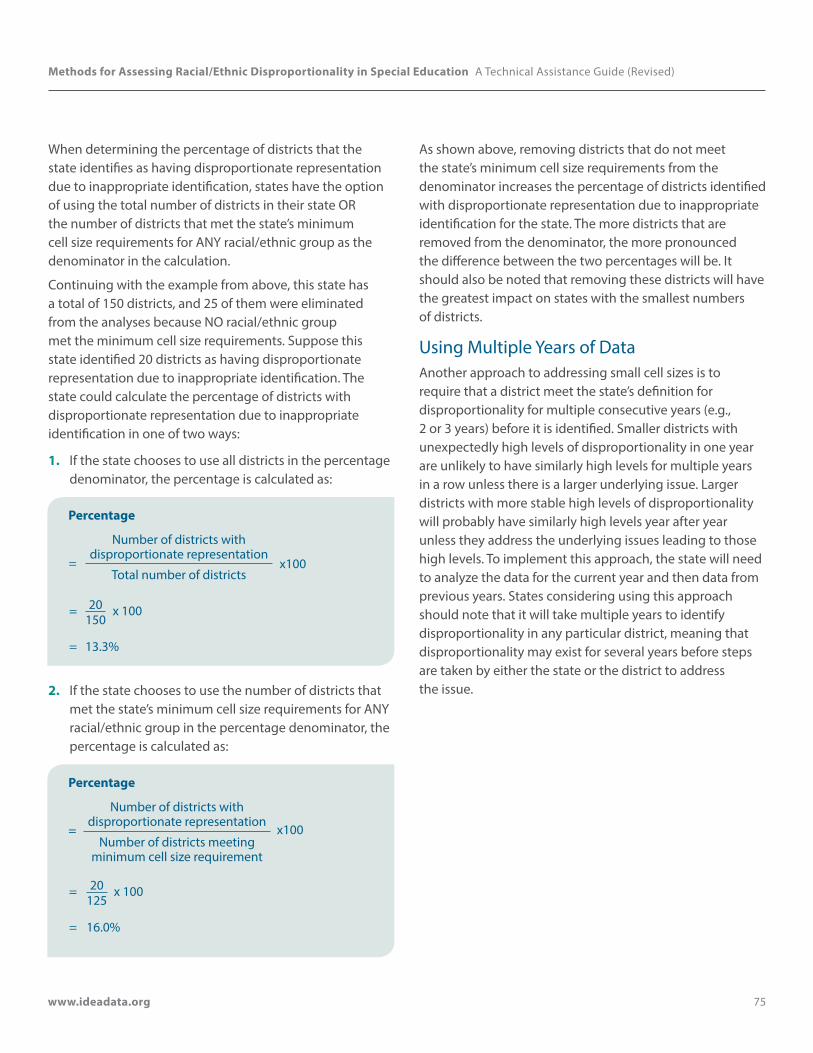
Methods for Assessing Racial/Ethnic Disproportionality in Special Education A Technical Assistance Guide (Revised)
www.ideadata.org 75
When determining the percentage of districts that the state identifies as having disproportionate representation due to inappropriate identification, states have the option of using the total number of districts in their state OR the number of districts that met the state’s minimum cell size requirements for ANY racial/ethnic group as the denominator in the calculation.
Continuing with the example from above, this state has a total of 150 districts, and 25 of them were eliminated from the analyses because NO racial/ethnic group met the minimum cell size requirements. Suppose this state identified 20 districts as having disproportionate representation due to inappropriate identification. The state could calculate the percentage of districts with disproportionate representation due to inappropriate identification in one of two ways:
1. If the state chooses to use all districts in the percentage denominator, the percentage is calculated as:
Percentage
=
Number of districts with disproportionate representation
x100Total number of districts
= 20 x 100150
= 13.3%
2. If the state chooses to use the number of districts that met the state’s minimum cell size requirements for ANY racial/ethnic group in the percentage denominator, the percentage is calculated as:
Percentage
=
Number of districts with disproportionate representation
x100Number of districts meeting
minimum cell size requirement
= 20 x 100125
= 16.0%
As shown above, removing districts that do not meet the state’s minimum cell size requirements from the denominator increases the percentage of districts identified with disproportionate representation due to inappropriate identification for the state. The more districts that are removed from the denominator, the more pronounced the difference between the two percentages will be. It should also be noted that removing these districts will have the greatest impact on states with the smallest numbers of districts.
Using Multiple Years of DataAnother approach to addressing small cell sizes is to require that a district meet the state’s definition for disproportionality for multiple consecutive years (e.g., 2 or 3 years) before it is identified. Smaller districts with unexpectedly high levels of disproportionality in one year are unlikely to have similarly high levels for multiple years in a row unless there is a larger underlying issue. Larger districts with more stable high levels of disproportionality will probably have similarly high levels year after year unless they address the underlying issues leading to those high levels. To implement this approach, the state will need to analyze the data for the current year and then data from previous years. States considering using this approach should note that it will take multiple years to identify disproportionality in any particular district, meaning that disproportionality may exist for several years before steps are taken by either the state or the district to address the issue.
Methods for Assessing Racial/Ethnic Disproportionality in Special Education A Technical Assistance Guide (Revised)
www.ideadata.org 76
Chapter 11 References and Recommended Reading
ReferencesOffice of Management and Budget (2000). The Bridge
Report: Tabulation options for trend analysis. Retrieved April 26, 2011, from http://www.whitehouse.gov/sites/default/files/omb/assets/information_and_regulatory_affairs/re_app-ctables.pdf
Skiba, R. J., Simmons, A. B, Ritter, S., Gibb, A. C., Rausch, M. K., Cuadrado, J., & Chung, C-G. (2008). Achieving equity in special education: History, status, and current challenges. Exceptional Children, 74, 264–288.
U.S. Department of Education, Office of Special Education Programs (OSEP). (2007). [Memorandum. OSEP 07-09] Disproportionality of racial and ethnic groups in special education. Retrieved September 28, 2010, from http://www2.ed.gov/policy/speced/guid/idea/letters/2007-2/osep0709disproportionality2q2007.pdf
U.S. Department of Education, Office of Special Education Programs (OSEP). (2008). [Memorandum. OSEP 08-09] Coordinated Early Intervening Services (CEIS) under Part B of the Individuals with Disabilities Education Act (IDEA). Retrieved September 28, 2010, from http://www2.ed.gov/policy/speced/guid/idea/ceis-guidance.pdf
U.S. Department of Education, Office of Special Education Programs (OSEP). (2010) Reporting and analyzing racial and ethnic data based on seven categories for the U.S. Department of Education related to IDEA state performance plan indicators 4-B, 9 and 10 and significant disproportionality. OSEP Leadership Mega Conference, Strand 4 Pre-session. Retrieved September 28, 2010, from http://www.sde.ct.gov/sde/lib/sde/PDF/DEPS/Special/SPP/Indicator4_ReportingData.pdf
Westat. (2003). Evaluating methods and criteria for defining racial/ethnic disproportionality in special education (Prepared under contract to the Office of Special Education Programs, U.S. Department of Education). Rockville, MD: Westat.
Methods for Assessing Racial/Ethnic Disproportionality in Special Education A Technical Assistance Guide (Revised)
www.ideadata.org 77
Recommended Reading Artiles, A. J., Harry, B., Reschly, D. J., & Chinn, P. C. (2002).
Over-identification of children of color in special education: A critical overview. Multicultural Perspectives, 4, 3–10.
Artiles, A. A., Kozleski, E. B., Trent, S. C., Osher, D., & Ortiz, A. (2010). Justifying and explaining disproportionality, 1968-2008: A critique of underlying views of culture. Exceptional Children, 76, 279–299.
Blanchett, W. J. (2006). Disproportionate representation of African American children in special education: Acknowledging the role of white privilege and racism. Educational Researcher, 35, 24–28.
Chinn, P. C., & Hughes, S. (1987). Representation of minority children in special education classes. Remedial and Special Education, 8, 41–46.
Coutinho, M. J., & Oswald, D. P. (2000). Disproportionate representation in special education: A synthesis and recommendations. Journal of Child and Family Studies, 9, 135–156.
Donovan, M. S., & Cross, C. T. (2002). Minority children in special and gifted education. Washington, DC: National Academy Press.
Heller, K. A., Holtzman, W. H., & Messick, S. (1982). Placing children in special education: A strategy for equity. Washington, DC: National Academy Press.
Hosp, J. L., & Reschly, D. J. (2002). Predictors of restrictiveness of placement for African-American children and Caucasian children. Exceptional Children, 68, 225–228.
Losen, D. J., & Orfield, G. (2002). Racial inequity in special education. Cambridge, MA: Harvard Education Press.
MacMillan, D. L., & Reschly, D. J. (1998). Overrepresentation of minority children: The case for greater specificity or reconsideration of the variables examined. The Journal of Special Education, 32, 15–24.
Roy, L. (2011). An Analysis of Various Measures of Racial/Ethnic Disproportionality in Special Education: The Case for a Joint Measures Approach (Draft). Paper prepared for the California Department of Education, Special Education Division. Available at ftp://ftp.cde.ca.gov/sp/se/ds/Disproportionality%20Paper%20June%202012.pdf
Skiba, R. J., Chung, C. G., Wu, T. C., Simmons, A. B., & St. John, E. P. (2000). Minority overrepresentation in Indiana’s special education programs. Bloomington, IN: Indiana Education Policy Center.
Waitoller, F. R., Artiles, A. J., & Cheney, D. A. (2010). The miner’s canary: A review of overrepresentation research and explanations. The Journal of Special Education, 44, 29–49.

Methods for Assessing Racial/Ethnic Disproportionality in Special Education A Technical Assistance Guide (Revised)
www.ideadata.org A-1
Appendix Summary of Disproportionality Methods
This appendix provides a brief overview of each of the methods discussed in this TA guide. For each method, we present the:
1. question or questions it answers,
2. formula,
3. interpretations, and
4. considerations.
Because this appendix is not intended to provide comprehensive information about each of the methods, the last column provides a direct link back to the chapter that discusses that particular method in more detail.
It should also be noted that this appendix does not specially discuss the application of these various methods to the total disciplinary removals category. Those interested in analyzing the total disciplinary removals category should refer back to the specific chapters for more information.
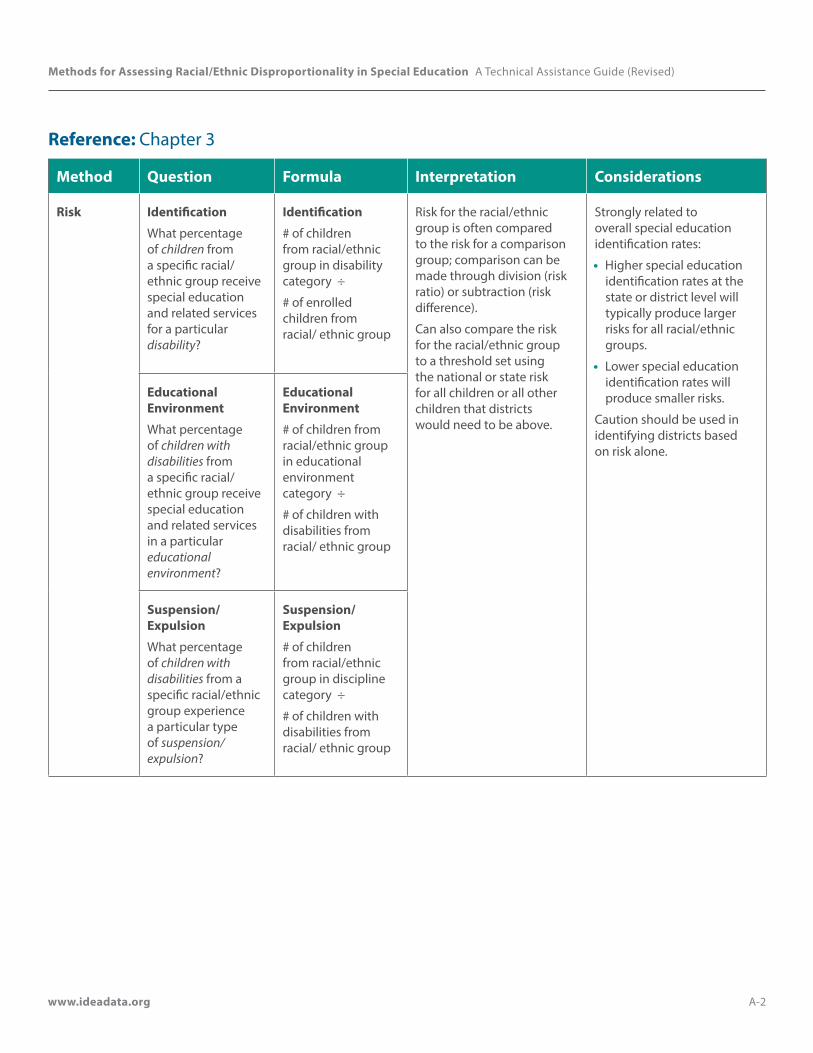
Methods for Assessing Racial/Ethnic Disproportionality in Special Education A Technical Assistance Guide (Revised)
www.ideadata.org A-2
Reference: Chapter 3
Method Question Formula Interpretation Considerations
Risk Identification
What percentage of children from a specific racial/ethnic group receive special education and related services for a particular disability?
Identification
# of children from racial/ethnic group in disability category ÷
# of enrolled children from racial/ ethnic group
Risk for the racial/ethnic group is often compared to the risk for a comparison group; comparison can be made through division (risk ratio) or subtraction (risk difference).
Can also compare the risk for the racial/ethnic group to a threshold set using the national or state risk for all children or all other children that districts would need to be above.
Strongly related to overall special education identification rates:
• Higher special education identification rates at the state or district level will typically produce larger risks for all racial/ethnic groups.
• Lower special education identification rates will produce smaller risks.
Caution should be used in identifying districts based on risk alone.
Educational Environment
What percentage of children with disabilities from a specific racial/ethnic group receive special education and related services in a particular educational environment?
Educational Environment
# of children from racial/ethnic group in educational environment category ÷
# of children with disabilities from racial/ ethnic group
Suspension/Expulsion
What percentage of children with disabilities from a specific racial/ethnic group experience a particular type of suspension/expulsion?
Suspension/Expulsion
# of children from racial/ethnic group in discipline category ÷
# of children with disabilities from racial/ ethnic group
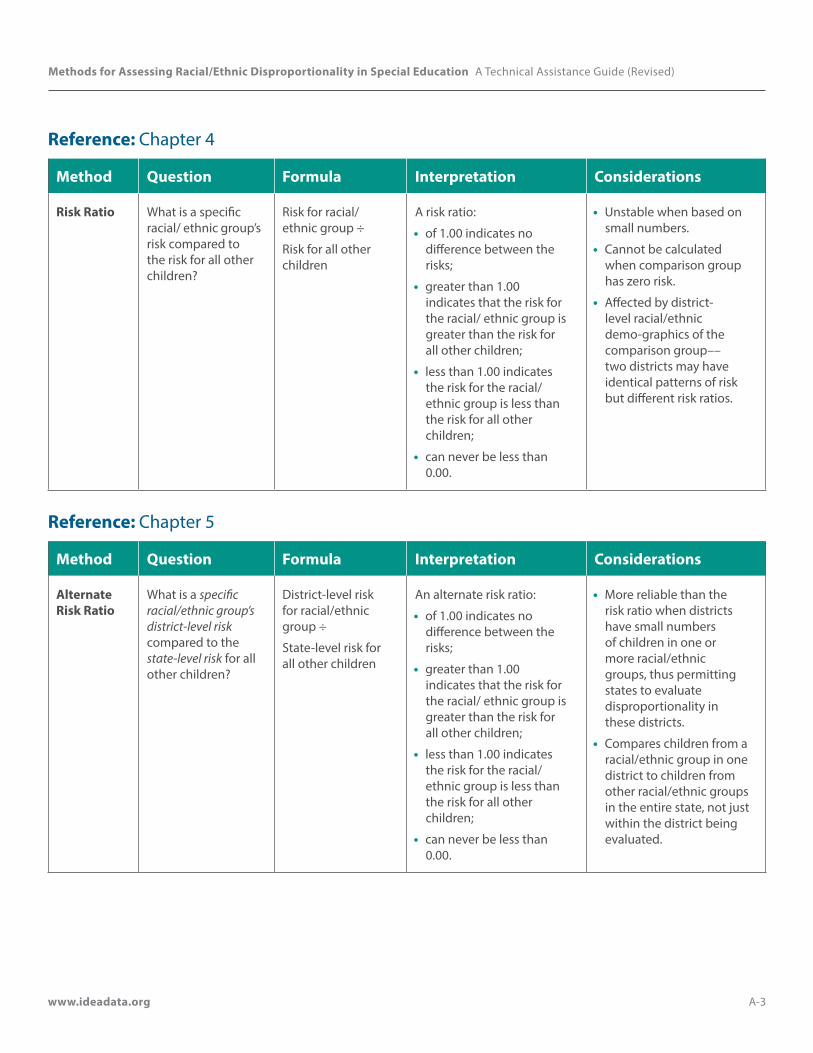
Methods for Assessing Racial/Ethnic Disproportionality in Special Education A Technical Assistance Guide (Revised)
www.ideadata.org A-3
Reference: Chapter 4
Method Question Formula Interpretation Considerations
Risk Ratio What is a specific racial/ ethnic group’s risk compared to the risk for all other children?
Risk for racial/ethnic group ÷
Risk for all other children
A risk ratio:
• of 1.00 indicates no difference between the risks;
• greater than 1.00 indicates that the risk for the racial/ ethnic group is greater than the risk for all other children;
• less than 1.00 indicates the risk for the racial/ethnic group is less than the risk for all other children;
• can never be less than 0.00.
• Unstable when based on small numbers.
• Cannot be calculated when comparison group has zero risk.
• Affected by district-level racial/ethnic demo-graphics of the comparison group––two districts may have identical patterns of risk but different risk ratios.
Reference: Chapter 5
Method Question Formula Interpretation Considerations
Alternate Risk Ratio
What is a specific racial/ethnic group’s district-level risk compared to the state-level risk for all other children?
District-level risk for racial/ethnic group ÷
State-level risk for all other children
An alternate risk ratio:
• of 1.00 indicates no difference between the risks;
• greater than 1.00 indicates that the risk for the racial/ ethnic group is greater than the risk for all other children;
• less than 1.00 indicates the risk for the racial/ ethnic group is less than the risk for all other children;
• can never be less than 0.00.
• More reliable than the risk ratio when districts have small numbers of children in one or more racial/ethnic groups, thus permitting states to evaluate disproportionality in these districts.
• Compares children from a racial/ethnic group in one district to children from other racial/ethnic groups in the entire state, not just within the district being evaluated.
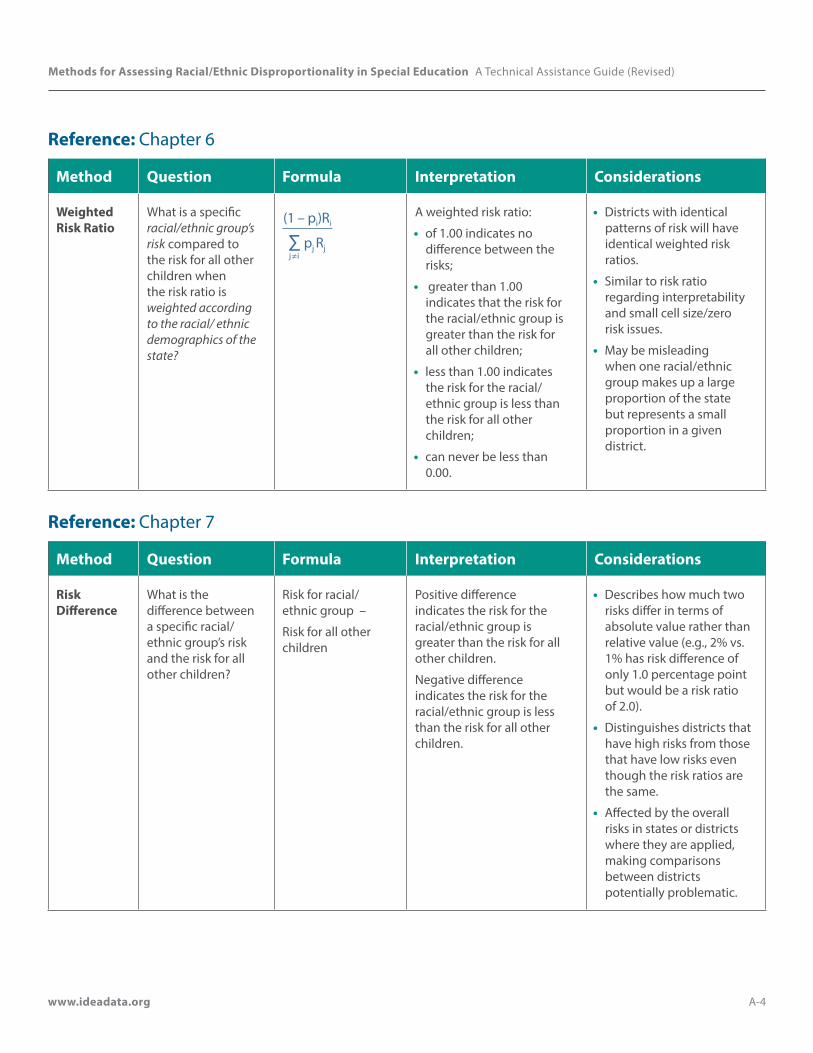
Methods for Assessing Racial/Ethnic Disproportionality in Special Education A Technical Assistance Guide (Revised)
www.ideadata.org A-4
Reference: Chapter 6
Method Question Formula Interpretation Considerations
Weighted Risk Ratio
What is a specific racial/ethnic group’s risk compared to the risk for all other children when the risk ratio is weighted according to the racial/ ethnic demographics of the state?
(1 – pi)Ri
∑ pj Rj j ≠ i
A weighted risk ratio:
• of 1.00 indicates no difference between the risks;
• greater than 1.00 indicates that the risk for the racial/ethnic group is greater than the risk for all other children;
• less than 1.00 indicates the risk for the racial/ethnic group is less than the risk for all other children;
• can never be less than 0.00.
• Districts with identical patterns of risk will have identical weighted risk ratios.
• Similar to risk ratio regarding interpretability and small cell size/zero risk issues.
• May be misleading when one racial/ethnic group makes up a large proportion of the state but represents a small proportion in a given district.
Reference: Chapter 7
Method Question Formula Interpretation Considerations
Risk Difference
What is the difference between a specific racial/ ethnic group’s risk and the risk for all other children?
Risk for racial/ethnic group –
Risk for all other children
Positive difference indicates the risk for the racial/ethnic group is greater than the risk for all other children.
Negative difference indicates the risk for the racial/ethnic group is less than the risk for all other children.
• Describes how much two risks differ in terms of absolute value rather than relative value (e.g., 2% vs. 1% has risk difference of only 1.0 percentage point but would be a risk ratio of 2.0).
• Distinguishes districts that have high risks from those that have low risks even though the risk ratios are the same.
• Affected by the overall risks in states or districts where they are applied, making comparisons between districts potentially problematic.
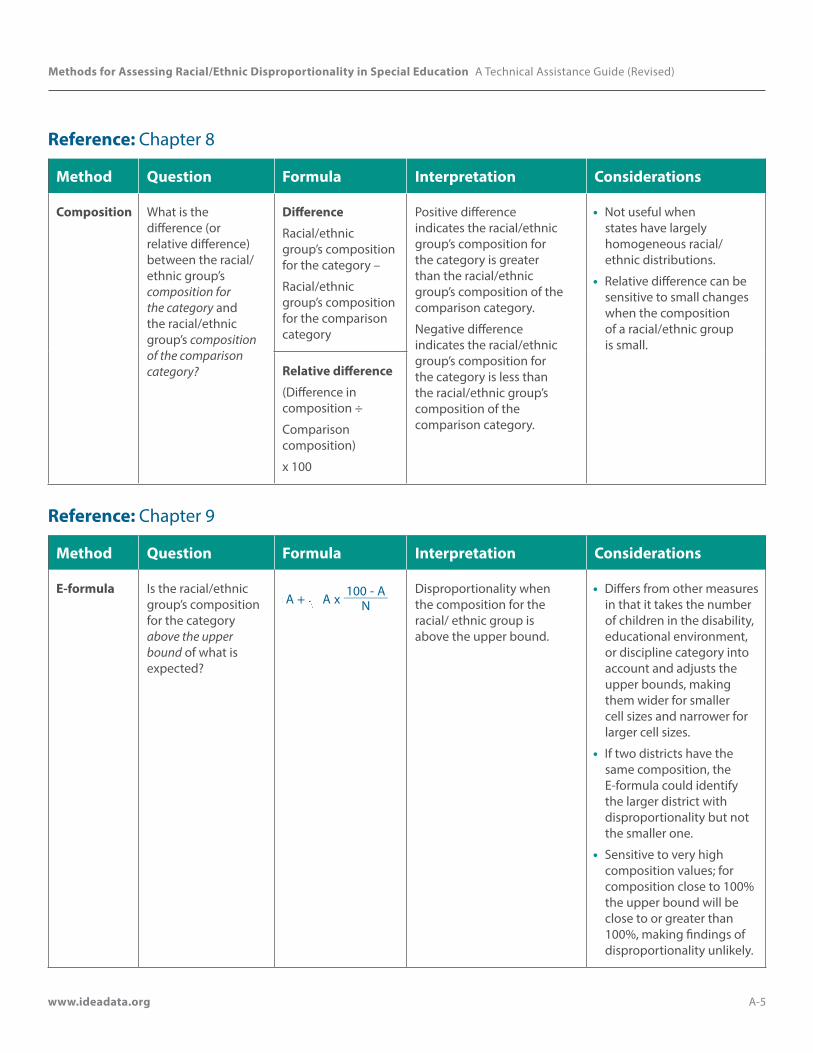
Methods for Assessing Racial/Ethnic Disproportionality in Special Education A Technical Assistance Guide (Revised)
www.ideadata.org A-5
Reference: Chapter 8
Method Question Formula Interpretation Considerations
Composition What is the difference (or relative difference) between the racial/ethnic group’s composition for the category and the racial/ethnic group’s composition of the comparison category?
Difference
Racial/ethnic group’s composition for the category –
Racial/ethnic group’s composition for the comparison category
Positive difference indicates the racial/ethnic group’s composition for the category is greater than the racial/ethnic group’s composition of the comparison category.
Negative difference indicates the racial/ethnic group’s composition for the category is less than the racial/ethnic group’s composition of the comparison category.
• Not useful when states have largely homogeneous racial/ ethnic distributions.
• Relative difference can be sensitive to small changes when the composition of a racial/ethnic group is small.
Relative difference
(Difference in composition ÷
Comparison composition)
x 100
Reference: Chapter 9
Method Question Formula Interpretation Considerations
E-formula Is the racial/ethnic group’s composition for the category above the upper bound of what is expected?
E A A x N100 A
= +- Disproportionality when
the composition for the racial/ ethnic group is above the upper bound.
• Differs from other measures in that it takes the number of children in the disability, educational environment, or discipline category into account and adjusts the upper bounds, making them wider for smaller cell sizes and narrower for larger cell sizes.
• If two districts have the same composition, the E-formula could identify the larger district with disproportionality but not the smaller one.
• Sensitive to very high composition values; for composition close to 100% the upper bound will be close to or greater than 100%, making findings of disproportionality unlikely.
Related Documents