Methods METHODS 287 Methods The research presented in this book relies heavily on an extensive and detailed model package that describes the electricity system of the EU-27, Norway and Switzerland. Included in that package is a comprehensive database that covers all exisng power plants of significant size and officially announced plans for near-term investments in new generaon capacity. This comprehensive resource allows us to take into account the infrastructure (on the supply side) that is already in place and that will influence the development of the future electricity system. A modelling methodology has also been developed that facilitates analyses of possible developments in the energy (and electricity) demands of naonal building stocks of the EU Member States. In this main secon, we present the modelling package associated with the analysis of the electricity-generaon system, as well as the modelling approach applied to the building sector.

Welcome message from author
This document is posted to help you gain knowledge. Please leave a comment to let me know what you think about it! Share it to your friends and learn new things together.
Transcript

Met
hods
METHODS 287
Methods
The research presented in this book relies heavily on an extensive and detailed model package that describes the electricity system of the EU-27, Norway and Switzerland. Included in that package is a comprehensive database that covers all existing power plants of significant size and officially announced plans for near-term investments in new generation capacity. This comprehensive resource allows us to take into account the infrastructure (on the supply side) that is already in place and that will influence the development of the future electricity system. A modelling methodology has also been developed that facilitates analyses of possible developments in the energy (and electricity) demands of national building stocks of the EU Member States.
In this main section, we present the modelling package associated with the analysis of the electricity-generation system, as well as the modelling approach applied to the building sector.

Methods
METHODS288

Met
hods
METHODS 289
In this main section we have chosen to describe only briefly the different modelling approaches that have been used in the research work. For a more extensive (but less updated) description of these approaches, as well as the other methods applied to the analyses of other sectors of the energy systems, we refer to the Methods book (Johnsson, 2011), which was issued concomitant with the completion of the first phase of the Pathways research programme, as a complement to this present main section.
The Method main section does not include separate chapters as in the preceding main sections of this book. Instead, the Method section is written as one coherent chapter that describes the used methodology and models tools.
General model overviewThe objective of the model package, which has been developed and applied in the Pathways research programme, is to analyse the long-term development of, in particular, the European electricity-generation system, given different assumptions as to electricity demand, reductions in CO2 levels, fuel prices, policy measures and so forth. The time horizon stretches to Year 2050. Even though the models jointly cover a larger part of the energy system, the focus is on the electricity system. Thus, efforts to develop the modelling have been directed towards the electricity system, with the consequence that there is a significantly higher level of detailed information on this system, as compared to other parts of the energy system.
The model package is linked to several detailed databases, such as the Chalmers Power Plant and Fuel Databases (see the upcoming section). Thereby, the present system and capacity stock are directly linked to primarily the electricity-supply models ELIN and EPOD. The ELIN model is used for long-term analyses of the European electricity-supply system, while the EPOD model is a dispatch model that is applied to one year at a time, but with a higher time resolution within each year. The ELIN and EPOD models are described in greater detail further below. Other sectorial models applied in the research deal with energy use and associated CO2 emissions in industry and buildings (the building sector being analysed in the ECCABS model, as described below), and assess the long-term development of district heating in Europe (used as input to the ELIN model, as combined heat and power is included in the model framework). The sectorial models are supplemented by more general and overall energy systems models that cover a large part of the overall energy system, albeit with less sectorial-related detail. One example is the MARKAL-Nordic model for energy-system analyses of the Nordic energy system, in which the level of detail related to policy instruments is significantly higher than what is practical to include in the all-European model ELIN. As always, there is a delicate balance between the level of detail and the geographical and sectorial scopes.
Methods
Methods
METHODS290
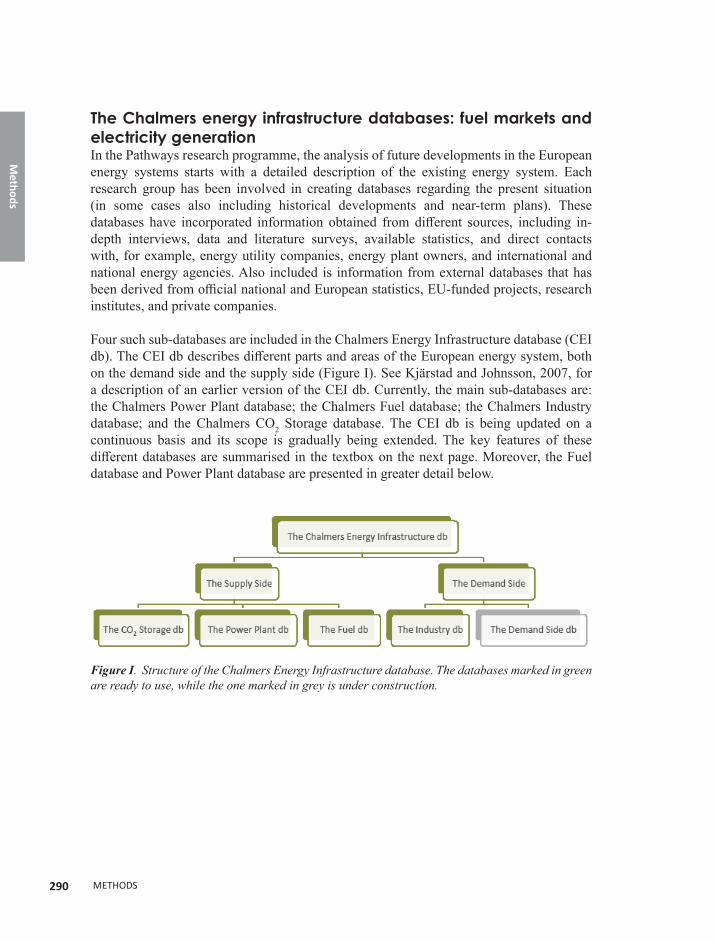
The Chalmers energy infrastructure databases: fuel markets and electricity generation In the Pathways research programme, the analysis of future developments in the European energy systems starts with a detailed description of the existing energy system. Each research group has been involved in creating databases regarding the present situation (in some cases also including historical developments and near-term plans). These databases have incorporated information obtained from different sources, including in-depth interviews, data and literature surveys, available statistics, and direct contacts with, for example, energy utility companies, energy plant owners, and international and national energy agencies. Also included is information from external databases that has been derived from official national and European statistics, EU-funded projects, research institutes, and private companies.
Four such sub-databases are included in the Chalmers Energy Infrastructure database (CEI db). The CEI db describes different parts and areas of the European energy system, both on the demand side and the supply side (Figure I). See Kjärstad and Johnsson, 2007, for a description of an earlier version of the CEI db. Currently, the main sub-databases are: the Chalmers Power Plant database; the Chalmers Fuel database; the Chalmers Industry database; and the Chalmers CO2 Storage database. The CEI db is being updated on a continuous basis and its scope is gradually being extended. The key features of these different databases are summarised in the textbox on the next page. Moreover, the Fuel database and Power Plant database are presented in greater detail below.
Figure I. Structure of the Chalmers Energy Infrastructure database. The databases marked in green are ready to use, while the one marked in grey is under construction.

Met
hods
METHODS 291
Chalmers Fuel database• Global coverage• Contains data on coal mines and on coal, gas, and oil fields• Includes production history, as well as estimates of remaining and ultimately recoverable
reserves in oil and gas fields• Considers global natural gas transport infrastructure, as well as natural gas sales contracts • Lists exact location of the coal, gas and oil fields by geographical co-ordinates, as well as by
name on the local, regional, and global levels• Chalmers power plant database• Covers the EU-28, Iceland, Norway, and Switzerland• Contains all thermal power plants, hydro plants, and offshore wind farms with outputs ≥1
MW; smaller plants (and on-shore wind power plants and solar PV plants) are aggregated by region on an annual basis
• The following items are registered for each plant block: location, age, fuel capacity (thermal and power), technology, present operational status and possible subject to re-powering
• Provides annual levels of electricity generation and CO2 emissions for most of the plants• Separates autoproducers from the electricity supply industry and separates combined heat
and power from conventional power production.
Chalmers CO2 Storage database• Covers all the European countries• Contains all European gas and oil fields with storage potentials of at least 1 MtCO2, as well
as 730 aquifers• Contains site-specific storage parameters, such as water depth, depth to top reservoir, initial
pressure and temperature, formation volume factor, degree of API, reservoir density, R/P ratio, and CO2storage potential
• Contains annual and cumulative production levels, as well as data on economical and geological reserves (oil and gas fields)
• Lists exact location of the storage locations by geographical co-ordinates, as well as by name on the local, regional, and global levels
Chalmers Industry database• Covers the EU-27 and Norway• Covers eight industrial sectors: mineral oil refineries, coking ovens, metal ore roasting or
sintering installations, steel or pig iron production, installations for the production of cement clinker or lime, installations for the manufacture of glass, installations for the manufacture of ceramic products, and paper and pulp mills (including production of board)
• Lists exact geographical locations for industrial plants with annual CO2emissions >0.5 MtCO2• Contains verified CO2 emissions and allocated emission allowances• Includes plant-level characteristics, such as type of production process, fuel mix, capacities,
and age

Methods
METHODS292
The Chalmers Fuel database The Chalmers Fuel database (Chalmers FU db), which is included in the Chalmers Energy Infrastructure database (Figure I), covers the fossil fuel sector. The FU db was developed in part because such a database was lacking in the public domain, and in part to provide a comprehensive and detailed overview of fossil fuel resources and capacities, and the relevant transport infrastructure, as well as providing some indications of the dynamics of fossil fuel markets. The primary objective of the FU db is to track future global production capacities for oil, gas, and coal at the country level, as well as the current and future capacities of the transport infrastructures and contracted transport flows. The overall goal is to provide a solid basis for formulating realistic near-term scenarios for development of the energy system.
The Chalmers FU db (Figure II) contains field-specific data for oil, gas, and coal fields, including production and reserve data, as well as data related to fuel infrastructures, for example, pipelines, ports, LNG plants, and gas storage sites. The database includes both existing and planned capacities. Linked to each entry is information on the geographical location, operational status, ownership etc. Although the focus of the Pathways research programme is on the EU-27 countries, the FU db has global coverage, since an understanding of the fuel markets and associated infrastructures must be based on an analysis of the international market.
Currently, the Chalmers FU db comprises the Coal database (Coal db), the Oil database (Oil db), and the Gas database (Gas db), together with associated sub-databases (Figure II). The database is managed in Windows Access with linkage to the Excel software and, when relevant, a Geographical Information System (GIS). The Chalmers FU db and the associated sub-databases have been applied to investigations of specific issues, such as analyses of coal quality in different regions or evaluations of current and future coal export capabilities, as well as to carry out a broader analysis of the development of the fossil fuel markets, at both the European and global levels (see e.g. Kjärstad and Johnsson (2009a) and Chapter 2 in this book).
Figure II. Structure of the Chalmers Fuel database (Chalmers FU db). The colours used in the figure denote whether the data are continuously updated (blue) or whether the sub-database was established for a specific analysis and is therefore only updated as required by an ongoing research project (red). CF = coal fields, CP = coal ports, CPP = coal-based power plants, OF = oil fields, OFP = oil field projects, OC = oil companies, GF = gas fields, GI = gas infrastructure, GSPA = gas sales and purchase agreements.

Met
hods
METHODS 293
The Chalmers Power Plant databaseThe Chalmers Power Plant database (PP db) is a part of the Chalmers Energy Infrastructure database. The Chalmers PP db describes the power generation structure in the EU-28 countries, Iceland, Norway, and Switzerland. This comprehensive database was established in part to support a detailed analysis of developments of the European energy system, with special focus on the electricity generation system, and taking into consideration the turnover in capital stock of the existing system and the limitations and possibilities imposed by the infrastructure of the energy system (see e.g. Odenberger et al, 2009a, 2009b and 2010).
The Chalmers PP db includes information on all thermal, hydro, offshore wind, and geothermal plants with power output capacities >1 MW. Plants with capacities <1 MW (or <10 MW for solar PV plants and on-shore wind farms) are combined on a regional basis and annual basis for each fuel or technology. With respect to conventional thermal power plants, the total net capacity of plants that are currently (May 2014) in operation in the EU-28 is 474 GW. For comparison, a total thermal capacity of 497 GW for the end of 2012 was reported by Eurostat (Eurostat, 2014), although according to the Chalmers PP db, at least 13 GW conventional thermal capacity was decommissioned between January 2013 and May 2014 (thus, a rough estimate of a corresponding Eurostat figure for 2014 could be 497-13=484 GW which is very close to what is included in the Chalmers PP db for the same year). In addition, 122 GW of nuclear power capacity and 137 GW of hydropower capacity are recorded in the Chalmers PP db.
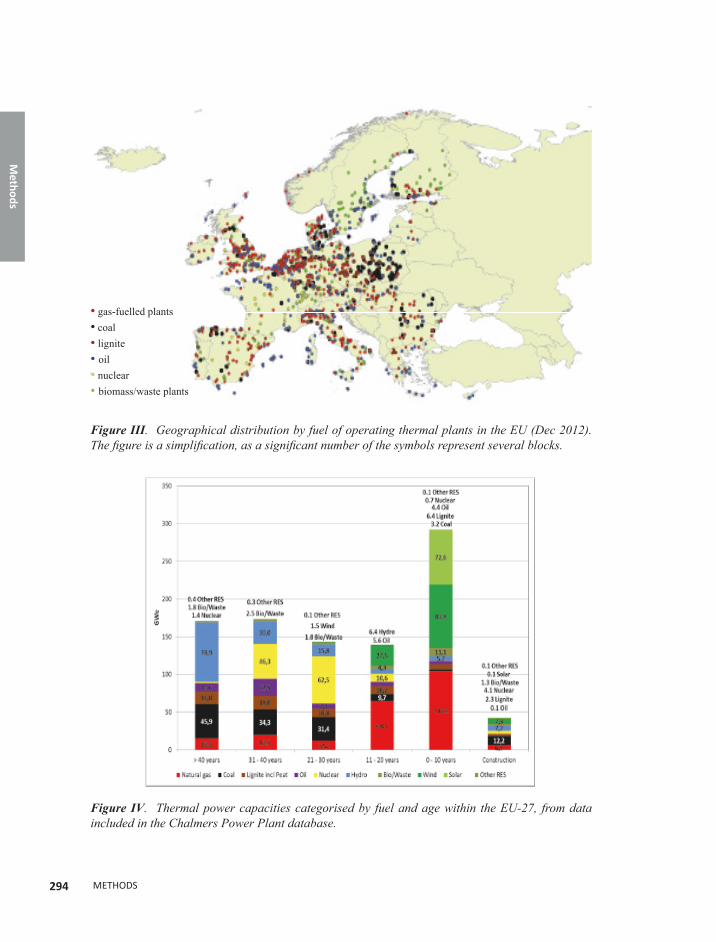
All thermal and hydro plants are registered at the unit level with respect to for instance age, capacity (input and output), fuel, technology and present operational status. Moreover, data on CO2 emissions are provided for many of the plants, whereas data on production levels are derived from the production/capacity data for about 45% of the power plants. The location of each unit is registered using geographical coordinates, together with the name of the location on four levels: locally, town or community; regionally, administrative province; country; and globally, global region, e.g., the EU. Figure III shows the geographical distribution by fuel of thermal plants (> 1MW) that are currently in operation in the EU-28, Norway, and Switzerland, and includes an example of the information available in the Chalmers PP db. In addition to the power units in operation, 163 GW of thermal power plants are registered as being under construction or planned, although many of these are unlikely to ever be built. Figure IV shows the capacities by fuel and age for all operational units and plants under construction in the EU, as contained in the database as of the end of Year 2013 (including also wind and solar power).
Methods
METHODS294
Figure III. Geographical distribution by fuel of operating thermal plants in the EU (Dec 2012). The figure is a simplification, as a significant number of the symbols represent several blocks.
Figure IV. Thermal power capacities categorised by fuel and age within the EU-27, from data included in the Chalmers Power Plant database.
• gas-fuelled plants • coal • lignite • oil • nuclear • biomass/waste plants

Met
hods
METHODS 295
In total, 113 GW of operating wind power was registered in the Chalmers PP db as of December 2013, which is slightly less than the corresponding value of 118 GW reported by the EWEA (2014). Regarding solar power, 73 GW of operational capacity has been registered in the database as of April 2014, of which 71 GW is from solar PV and the rest is from solar thermal plants, the latter being located exclusively in Spain. The Chalmers PP database also includes 140 GW of wind power capacity that is under construction or planned, whereby almost 80% of this capacity is projected to be constructed off-shore. As for thermal and hydro plants, plant-specific data and geographical locations are given. In addition to wind power and biomass power, the Chalmers PP db includes other renewable energy power capacities, such as those of power plants based on geothermal, tidal, and wave technologies, although both the registered and installed capacities are currently low (900 MW in operation, corresponding to less than 0.1% of the total capacity in operation; according to the Chalmers PP db, the total installed electricity-generation capacity in the EU-28, Norway, Iceland and Switzerland was around 920 GW at the end of 2013). Most of the data in the Chalmers PP db have been collected through direct contacts with each utility, although other sources, such as national authorities, Renewable UK (formerly BWEA), and IAEA, have also provided important information.
The Chalmers PP db has been applied to analyse developments in the power generation sector and the impact on future fossil fuel demand, and to estimate the potentials of bridging technologies, such as co-firing of biomass with coal and the CCS technology (see e.g. Kjärstad and Johnsson, 2009b, and Kjärstad et al., 2011). The database is also integrated with the ELIN/EPOD model package, so as to take into account the influences of existing and planned energy infrastructures on the possible future pathways of the European energy system (see e.g. Odenberger 2009 and Chapter 10 in this book).
ELIN and EPOD: the electricity-supply model packageAs indicated above, the two main model approaches used to analyse the electricity supply sector are ELIN and EPOD. The ELIN (ELectricity INvestment) model is a long-term dynamic optimisation model that describes the present generation system, as derived from the Chalmers PP database, and includes an extensive array of new technologies that are to be used to meet the changes in future demand as existing capacity comes of age or becomes unprofitable. The time horizon of the ELIN model is Year 2010 to Year 2050. Each in-between year is separately described. The intra-annual time resolution of the ELIN model is 16 time-steps, including two daily load segments (night load and day load) for weekdays and weekends. Furthermore, this two-variant diurnal weekly load representation is allocated over four different seasons: winter, summer, spring and autumn. Typical model outputs from the ELIN model include capacity and production levels of electricity by fuel and region (or country) until Year 2050, aggregated investment costs, electricity trade between regions (or countries), and marginal costs of electricity. In general, in the model runs, a CO2-emission cap, which is gradually reduced as one nears Year 2050, is imposed on emissions from electricity production. Thus, the marginal cost of CO2-emission reductions is also part of the model output. The fundamentals and the original formulation of the
Methods
METHODS296
ELIN model are more thoroughly described in Odenberger et al., 2009a and in the PhD thesis of Odenberger, 2009.
The short-term dispatch model EPOD (European Power Dispatch) analyses in detail a specific year based on the capacities (existing and new) obtained in a preceding ELIN model run. Fuel prices and prices of CO2 (marginal costs of CO2 reduction, as obtained using the ELIN model) are also taken from the ELIN model. The dispatch analysis may be conducted weekly, diurnally or hourly. The link between the operation of combined heat and power schemes and the district heating load, as well as cycling properties of power plants are taken into consideration. The typical outputs from an EPOD model run include the production levels of electricity by fuel and region (or country), emissions of CO2, electricity trade between regions (or countries), and marginal costs of electricity in each region. Thus, the outputs are basically the same as those from the ELIN model, which enables comparisons and quality checks. The main differences between the models are the time perspective (years in ELIN and hours in EPOD) and the possibility for detailed descriptions of power plant operation and transmission bottlenecks in EPOD (discussed in the upcoming sections). Therefore, findings from the EPOD analyses concerning the feasibility and efficiency of the system can be fed back into ELIN, so as to improve the design of that model.
The principal linkages between the ELIN and EPOD models are presented in Figure V. Existing and new electricity-generation capacities for a selected year, as modelled by the ELIN model, are used as inputs to the EPOD model, thereby yielding an electricity-generation output that has significantly higher temporal detail than that achievable using the ELIN model. Thus, capacity investments are made considering the development until Year 2050 and for a relatively coarse intra-annual resolution (ELIN), while the production of electricity is studied in more detail for one year at a time and with a very high intra-annual temporal resolution (EPOD). The output of the EPOD model, e.g. electricity generation by fuel and country for a specific year, may be directly compared to the corresponding output of a preceding ELIN model run. Thereby, important findings from the considerably higher time resolution in EPOD may be fed back into the ELIN model and, thus, improving the performance and applicability of the latter.
Detailed wind and solar resource dataIncluded in the ELIN-EPOD model package are highly detailed wind-power and solar-power availability data for across Europe. The data have primarily been taken from the ERA Interim database made available through the European Centre for Medium-Range Weather Forecasts (ECMWF). Although the data were originally defined for single spatial cells of 200–700 km2 and covering the entire EU-27, they have been aggregated to fit the ELIN-EPOD regional model structure. Both the annual availability (full-load hours) and

Met
hods
METHODS 297
Figure V. Linkages between the ELIN and EPOD models within the electricity-supply system model package. The upper panel shows a typical ELIN model result (aggregated) for the entire EU-27, Norway and Switzerland until 2050. The lower left panel shows a typical EPOD model result for the Nordic countries and for a selected year with weekly resolution. The lower right panel shows an output example for an hourly EPOD model run for the German electricity-supply system around 2030 (assuming, in this case, a postponed nuclear phaseout).
the production profiles (see Figure VI) for wind and solar power have been implemented on a regional level. The estimated potential for wind power, which is also an important model input parameter, follows the principles described in Chapter 8.
Cycling properties of thermal power plantsAnother feature that is included as an option in the short-term dispatch model EPOD is to assign thermal power plants with cycling properties. Cycling properties include part-load features, such as minimum load requirements, and start and stop decisions. In general, part load implies reduced efficiency, while the start-up phase of a power plant means that fuel must be consumed for several hours, depending on the type of power plant, without generating any income. In both cases, additional costs are incurred and they have an impact on the operation. This is important to consider, especially for electricity systems with a high share of variable renewable electricity production. To include fully

Methods
METHODS298
the start and stop decisions, one needs to use (mixed) integer programming. However, this is time-consuming, especially if the system is sufficiently large, which is why we have implemented two somewhat simpler linear approaches into the EPOD model, namely, the two-variable approach and the effective generation approach. These two approaches and other issues related to the inclusion of cycling properties in the EPOD model are more thoroughly described in the PhD thesis of Göransson, 2014. See also Chapter 17 in this book for a discussion on cycling properties.
RegionalisationDepending on scope, the ELIN and EPOD models can be set up in either national or regional mode. National mode covers 27 of the EU Member States plus Switzerland and Norway (currently, it excludes the 28th Member State, Croatia). The regional mode covers 53 regions across the EU-27, Switzerland, and Norway (see Figure VII). These regions are defined by major bottlenecks in the European electricity-transmission system and the nomenclature of territorial units for statistics (NUTS)-2 areas. NUTS is used for reporting statistics on a regional level1. We use GDP data reported at the NUTS-2 level to estimate electricity demand in each region (i.e. the share of the total national electricity demand allocated to each region within a given country). Thus, running ELIN and EPOD used in regional mode may allow detailed analyses that include also transmission-bottleneck considerations within countries.
1 For further details, see: : http://epp.eurostat.ec.europa.eu/portal/page/portal/nuts_nomenclature/introduction
Figure VI. Detailed wind-power (left) and PV-power (right) production profiles in a specific region, as applied within the Pathways research programme (a profile for two days in summer is shown to increase the “visibility” of the PV power profile)

Met
hods
METHODS 299
Load-flow analysesTightly linked to regionalisation is the option to include load-flow analyses in an EPOD model run. The exchange of electricity between two modelled regions is subject to certain constraints. In its simplest form, the constraint is a thermal limit on capacity or, if available, the Net Transfer Capacity (NTC) value. However, in reality, transmission between two nodes in the transmission system also depends on the generation and load situations at each node. Thus, the transmitted or traded electricity flows through a given interconnector (either between regions or between countries) is a model result that reflects the actual generation and load situations at each end of the interconnector. The inclusion of load-flow constraints in the EPOD model is described in more detail in Göransson et al, 2014 and in the PhD thesis of Göransson, 2014.
Other methodologies included in the model packageAs mentioned, the ELIN and EPOD models are tightly linked to each other and together form the main part of the model package used to analyse the European electricity-supply system towards Year 2050. More loosely linked to the ELIN-EPOD package are supplementary models that also have been used in the research process. These models focus on selected
Figure VII. Regionalisation of the EU-27, Switzerland, and Norway in the ELIN-EPOD model package.

Methods
METHODS300
issues in greater detail and as a consequence, lack the all-European perspective, which is a feature of the ELIN-EPOD package. Some of the outputs from these supplementary model approaches may, nevertheless, be used as the basis for refining certain boundary conditions, e.g., the performance of selected technologies, in the ELIN-EPOD model package.
One example of a supplementary model is a PV solar model for small-scale applications (e.g., in households), which has been developed during the course of the research. This model investigates the incentives that households encounter to invest in solar PV considering the variations in production and in load and considering the different designs of support schemes. The impacts of load shifting, different pricing models for excess production, and subsides are assessed. The optimisation is performed using a mixed integer optimisation approach. Hitherto, the model has been applied primarily to Swedish conditions.
Another example of a supplementary model is the development of a dispatch-type model that includes the distribution of electricity at different voltages. This model is used to analyse further the linkages between transmission and distribution and the role of decentralised electricity production. So far, this model approach has been used only in relation to the German transmission and distribution grid. Decentralised electricity production is, generally, linked to the distribution grid of the electricity-supply system. When there is an increase in the employment of distributed generation, e.g., solar PV on detached houses, the direction of the power flow may change (historically, the direction has been mostly from higher to lower voltage levels), as may the locations of frequently occurring congestions in the grid. Therefore, it is important to come up with a relevant description of the grid subsystems and include this in the analysis methodology and the electricity-system model package. Included in this specific model approach is the interaction dynamics between transmission and distribution networks, and the load characteristics at different voltage levels, as well as the possibilities and technical limitations associated with connecting distributed generation at different voltage levels in the system. In Figure VIII, the electricity loads at three different voltage levels (low, medium and high) are shown for a German distribution network operator. For the low-voltage grid, typical seasonal variations, with high loads during winter and relatively low loads during summer, are observed. The mid-voltage load lacks the same pronounced seasonal variation but instead includes typical load dips during weekends when industrial activity decreases. For the high-voltage grid, there are no corresponding clear seasonal or intra-weekly patterns to the load variations in this case. Another purpose of the distribution-grid modelling is to provide feedback to the supply and transmission ELIN-EPOD model package. Thus, while ELIN and EPOD are practically hard-linked to each other, the optional transfer of data between the distribution-grid modelling and ELIN-EPOD is achieved through soft-linking.

Met
hods
METHODS 301
Figure VIII. Load curves for low, medium, and high voltages (LV, MV, and HV, respectively) for 1 year based on data from one German distribution network operator.
The ECCABS model: analysing energy demand in buildings Numerous tools are available for the modelling of building stocks. However, the challenge remains to define the resolution levels that allow a better understanding of the linkages between the different scales, from issues within buildings’ boundaries to the interactions between markets and policy. The building-stock modelling approach that has been developed within the Pathways research programme represents a framework that allows a combination (or choice) of different assessments at the reference-building level to be extrapolated to the building-stock level for a different combination (or choice) of outputs. Important is to assess the effects of various types of Energy Conservation Measures (ECM) to the building stocks of the different EU Member States. In the assessment of energy use at the building level, the modelling considers e.g. technical building systems, indoor air environment, and on-site generation based on renewable electricity supply. The variety of outputs is tailored for investigations of energy system issues, climate change mitigation, and policy targets.
A building stock of a country can be described in terms of sample buildings or archetypes. Sample buildings represent actual buildings for which data regarding thermal characteristics are obtained through measurements. As the building stock of a country consists of buildings with different characteristics, an extensive sample of the buildings is required

Methods
METHODS302
for derivation of the thermal characteristics of the building stock. Thus, establishment of the sample requires significant efforts for measuring and quantifying the parameters of the building sample. Archetype buildings are instead statistical composites that provide an approximate description of the building stock, based on knowledge of the overall building characteristics within the region (e.g., age, size, construction materials, and house type), in combination with national statistics that relate to the building sector (e.g., energy use and climate). Thus, a methodology has been developed to describe building stocks through archetype buildings. This methodology consists of (see Figure IX): (1) segmentation, in which the number of archetype buildings required to represent the entire stock is decided based on criteria that include building type, construction year, heating system, and climate zone; (2) characterisation, in which each archetype is described by its physical and technical characteristics; (3) quantification, in which the number of buildings in the stock represented by each archetype building is determined.
Figure IX. Illustration of the bottom-up methodology used to describe a building stock through archetype buildings. Adapted from a figure created by Ribas Portella (2012).
4 Validation of the annual final energy demand of the building stock (ECCABS model)
3 Quantification of the archetype buildings in the building stock
2 Characterisation of the physical and technical properties of the archetypes
1 Segmentation Number of archetypes according to building type, climate zone, construction year, and heating system
Met
hods
METHODS 303
Once the aggregation of the building stock based on archetype buildings is completed, it is used as an input to the Energy, Carbon and Cost Assessment for Building Stocks (ECCABS) model, in which the net and final energy demands for the entire building stock under investigation are simulated. Thus, in the fourth step, the validation (4), the building stock description is validated in which the final energy demand and associated CO2 emissions for the building stock, as derived from the model, are compared with the corresponding values obtained from national and international statistical databases.
The ECCABS model is a bottom-up engineering model that has been developed to assess energy conservation measures (ECMs) and CO2 mitigation strategies in building stocks, with the aim of making it applicable to any EU Member State. A major challenge associated with bottom-up engineering models is to find a level of detail with a reasonable input data requirement, while retaining sufficient spatial and temporal resolutions to allow investigations of changes in demand and the indoor climate environment. To meet this challenge, the ECCABS model combines a one-zone approach and hourly calculations. The one-zone spatial resolution of the heat-balance implies that the representative building is modelled as a single thermal zone by means of an equivalent volumetric heat capacity. The hourly temporal resolution of the heat-balance allows considerations of the temporal changes in demand that result from occupancy, the use of different appliances, and the effect of solar radiation gains. This level of resolution reflects the complexity of implementing measures that involve management of the building technical systems or user behaviours, and allows analyses of the effects on indoor temperature of applying ECMs. The hourly calculations of the net and final energy demands are thereafter aggregated to annual values. The model is used both to calculate the energy demand for the different end-uses and to estimate the effects of ECMs, for a set of individual representative buildings (either sample buildings or archetypes buildings may be used). The results are then extrapolated to represent an entire building stock of a region or country.
For the validation of final energy demand, the aggregated model results have been compared to the corresponding data for the building stocks of France, Germany, Sweden, Spain, and the UK, which are found in the national statistics and international databases. The resulting final energy demand for all countries is in general agreement (within the range of +2% to -7%) with the international statistics.
More thorough descriptions of the ECCABS model and energy demands of the European building stock are available in Mata et al., 2013 and 2014, and in the PhD thesis of Mata, 2013.
Related Documents