World Drug Report 2020 Methodology Report Research and Trend Analysis Branch UNODC, Vienna

Welcome message from author
This document is posted to help you gain knowledge. Please leave a comment to let me know what you think about it! Share it to your friends and learn new things together.
Transcript

World Drug Report 2020
Methodology Report
Research and Trend Analysis Branch UNODC, Vienna
Table of Contents
1. Introduction .................................................................................................................. 1
Sources of information .................................................................................................... 1
2. Data on drug use and health consequences of drug use ................................................ 4
Overview........................................................................................................................ 4
Indicators ....................................................................................................................... 7
Extrapolation methods .................................................................................................... 8
Adjustment for differences in age groups ..................................................................... 8
Extrapolation of results from lifetime prevalence to annual prevalence ....................... 11
Extrapolations based on school surveys ..................................................................... 13
Extrapolations based on treatment data ..................................................................... 13
National, regional and global estimates of the number of people who use drugs and the
health consequences of drug use .................................................................................... 14
Estimates of the total number of people who used illicit drugs at least once in the past
year .......................................................................................................................... 16
Estimates of the number of ‘problem drug users’........................................................ 17
Calculation of drug use perception indices................................................................. 18
Calculation of regional and global estimates of cannabis use among 15-16 years old
students .................................................................................................................... 20
Estimates of the prevalence of injecting drug use, HIV and hepatitis (C and B virus)
among people who inject drugs (PWID)..................................................................... 30
Estimates on the number of drug-related deaths (mortality) ........................................ 35
3. Drug cultivation, production and manufacture .......................................................... 35
Net cultivation .............................................................................................................. 40
Indirect estimation of illicit opium poppy cultivation ..................................................... 41
Yield and production..................................................................................................... 43
4. Drug trafficking .......................................................................................................... 50
Seizures........................................................................................................................ 50
Trafficking routes and volumes ..................................................................................... 55
Drug price and purity data ............................................................................................. 57

1
1. Introduction
Considerable efforts have been made over the years to improve the estimates presented in the
World Drug Report, which rely, to a large extent, on information submitted by Member
States through the Annual Reports Questionnaire (ARQ). Nonetheless, challenges remain in
producing such estimates because of the gaps and the varying quality in the available data.
One major problem is the heterogeneity in the completeness and the time frame of data
coverage in ARQs reported by Member States. Irregular reporting may result in absence of
data for some years and may also influence the reported trend in a given year. In addition,
submitted questionnaires are not always comprehensive, and much of the data collected are
subject to limitations and biases. These issues affect the reliability, quality and comparability
of the information received.
Sources of information
Under the International Drug Conventions, Member States are formally required to provide
national drug control related information annually to the ‘Secretary General’ of the United
Nations (i.e. the Secretariat in the UNODC). For this purpose, the Commission on Narcotic
Drugs in 2010 endorsed the revised Annual Reports Questionnaire (ARQ) that is sent to
Member States each calendar year for submission of responses and information on the drug
situation.
The World Drug Report 2020 is based on data primarily obtained from the ARQs submitted
by Governments to UNODC. The data collected in the current ARQ normally refer to the
drug situation in 2018. Out of 200 potential respondents to the ARQ for 2018 (including 193
Member States), UNODC received 104 replies to its questionnaire on the “Extent and
patterns of and trends in drug use (ARQ Part III)” and 109 replies to Part IV on “Extent and
patterns and trends in drug crop cultivation, manufacturing and trafficking”. Europe, had the
best coverage (91 per cent of the respondents provided a reply), followed by Asia (63 per
cent) and the Americas (53 per cent). In the case of Africa, only 32 per cent of the Member
States, and in the Oceania region, only two out of the 16 countries, responded to the Annual
Report Questionnaire.
In general, the quantity of information provided on illicit drug supply is slightly better than
that of information provided on drug demand. Analysis of responses to Part IV of the ARQ

2
revealed that 72 per cent of them were ‘substantially’ completed compared to 70 per cent of
Part III (ARQs with completion rates higher than 50 per cent were classified as having been
‘substantially filled in’; ARQs with completion rates lower than 50 per cent were classified as
having been ‘partially filled in’).
In order to analyse the extent to which Member States provided information, a number of key
questions in the ARQ were identified:
• For Part III, on the extent and patterns and trends of drug abuse, the key questions
used for the analysis referred to: trends in drug use, for which 78 per cent of the
respondents returning the ARQ provided information; prevalence of different drugs
among the general population, for which 69 per cent of the respondents provided
information; for prevalence of drug use among youth 65 per cent responded; for
drug related mortality 52 per cent and for treatment demand 84 per cent. On average,
for the countries which submitted Part III to UNODC, the overall response rate of
completion was 62 per cent. However, this analysis does not take into account the
completeness or quality of the information provided in response to each of the areas
mentioned.
• For Part IV, on the extent and patterns and trends in drug crop cultivation,
manufacturing and trafficking, the analysis included replies to the questions on: the
quantities seized, for which 98 per cent of the Member States returning the ARQ
provided the information; on trafficking of illicit drugs, for which 86 per cent of
these Member States provided responses; on prices and purity 84 per cent of the
Member States responded, and on persons brought into formal contact with the
police and/or the criminal justice system in connection with drug-related offences,
which 83 per cent of the Member States provided information. The overall analysis
of these data revealed that the overall response rate completion was 62 per cent for
Part IV. However, this analysis does not take into account the completeness of
responses of the quality of information provided in each of sections mentioned.
Information provided by Member States in the ARQ form the basis for the estimates and
trend analysis provided in the World Drug Report. Often, this information and data is not
sufficient to provide an accurate or comprehensive picture of the world’s drug markets. When

3
necessary and where available, the data from the ARQ are thus supplemented with data from
other sources.
As in previous years, seizure data made available to UNODC via the ARQ was
complemented primarily with data from other government sources, such as other official
communication with UNODC, official national publications, data provided to UNODC by the
Heads of National Law Enforcement Agencies (HONLEA) at their regional meetings and
data published by international and regional organisations such as Interpol/ICPO, World
Customs Organization, European Monitoring Centre for Drugs and Drug Addiction
(EMCDDA) and the Inter-American Drug Abuse Control Commission (CICAD). Price data
for Europe were complemented with data from Europol. Demand related information was
obtained through a number of additional sources, including the national assessments of the
drug situation supported by UNODC, the drug control agencies participating in the
UNODC’s ‘Drug Abuse Information Network for Asia and the Pacific’ (DAINAP), as well as
various national and regional epidemiological networks such as the European Monitoring
Centre for Drugs and Drug Addiction (EMCDDA) or the Inter-American Drug Abuse
Control Commission (CICAD). Reports published by National governments and academic
research published in the scientific literature were also used as additional sources of
information. This type of supplementary information is useful and necessary as long as
Member States lack the monitoring systems necessary to produce reliable, comprehensive
and internationally comparable data.
To this end, UNODC encourages and supports the improvement of national monitoring
systems. Major progress has been made in the area of illicit crop monitoring over the last few
years in some of the countries that have major illicit crop cultivations. In close cooperation
with UNODC and with the support of major donors – these countries have developed
impressive monitoring systems designed to identify the extent of, and trends in, the
cultivation of narcotic plants. These data form a fundamental basis for trend analysis of illicit
crop cultivation and drug production presented in the World Drug Report.
There remain significant data limitations on the demand side. Despite commendable progress
made in several Member States, in the area of prevalence estimates for example, far more
remains to be done to provide a truly reliable basis for trend and policy analysis and needs
assessments. The work currently being done on the World Drug Report provides yet another
4
opportunity to emphasize the global need for improving the evidence base available to the
policy makers and programme planners.
2. Data on drug use and health consequences of drug use
Overview
UNODC estimates of the extent of illicit drug use in the world have been published
periodically since 1997. Assessing the extent of drug use (the prevalence and estimates of the
number of drug users) is a particularly difficult undertaking because it involves in most
settings measuring the size of a ‘hidden’ population. Regional and global estimates are
reported with ranges to reflect the information gaps. The level of confidence expressed in the
estimates varies across regions and drug types.
A global estimate of the level of use of a specific drug involves the following steps:
1. Identification and analysis of appropriate sources (starting from the ARQ);
2. Identification of key benchmark figures for the level of drug use in all countries where
data are available (annual prevalence of drug use among the general population aged
15-64) which then serve as ‘anchor points’ for subsequent calculations;
3. ‘Standardization’ of existing data if reported with a different reference population
than the one used for the World Drug Report (for example, from age group 12 and
above to a standard age group of 15-64);
4. Adjustments of national indicators to estimate an annual prevalence rate if such a rate
is not available (for example, by using the lifetime prevalence or current use rates; by
aggregating prevalence of two drug types, like use of amphetamine and
methamphetamine to obtain the joint estimates of prevalence of use for the overall
amphetamines; or extrapliating from lifetime or annual prevalence rates among the
youth population to the adult population. The latter includes the identification of
adjustment factors based on information from countries in the region with similar
cultural, social and economic situations where applicable;
5. Imputation for countries where data are not available, based on data from countries in
the same subregion. Ranges are calculated by considering the 10th and 90th weighted

5
percentile of the subregional distribution, using the target population in the countries
as weights;
6. Extrapolation of available results for a subregion were calculated only for subregions
where prevalence estimates for at least two countries covering at least 20% of the
population were available. If, due to a lack of data, subregional estimates were not
extrapolated, a regional calculation was extrapolated based on the 10th and 90th
percentile of the distribution of the data available from countries in the region. Since
the World Drug Report 2018, when this methodology was revised, a weighted
percentile procedure has been used that takes into account the population aged 15-64
in the countries.
7. Aggregation of subregional estimates rolled-up into regional results to arrive at global
estimates.
For countries that did not submit information through the ARQ, or in cases where the data
were older than 10 years, other sources were identified, where available. In nearly all cases,
these were government sources. Many estimates needed to be adjusted to improve
comparability (see below).
In cases of estimates referring to previous years, the prevalence rates are unchanged and
applied to new population estimates for the year 2018. Currently, only a few countries
measure prevalence of drug use among the general population on an annual basis. The
remaining countries that regularly measure it - typically the more economically developed -
do so usually every three to five years. Therefore, caution should be used when interpreting
any change in national, regional or even global prevalence figures, as changes may in part
reflect newer reports from countries, at times with changed methodology, or the exclusion of
older reports, rather than actual changes in prevalence of a drug type.
Detailed information on drug use is available from countries in North America, a large
number of countries in Europe, a number of countries in South America, the two
economically most advanced countries in Oceania and a limited number of countries in Asia
and Africa. For the World Drug Report 2020, new estimates of prevalence of drug use among
the general population for the year 2018 were available for 14 countries, while two Member
States provided already data for the year 2019.
6
One key problem in national data is the level of accuracy, which varies strongly from country
to country. Not all estimates are based on sound epidemiological surveys. In some cases, the
estimates simply reflect the aggregate number of drug users found in drug registries, which
cover only a fraction of the total drug using population in a country. Even in cases where
detailed information is available, there is often considerable divergence in definitions used,
such as chronic or regular users; registry data (people in contact with the treatment system or
the judicial system) versus survey data (usually extrapolation of results obtained through
interviews of a selected sample); general population versus specific surveys of groups in
terms of age (such as school surveys), special settings (such as hospitals or prisons), or high
risk groups, et cetera.
To reduce the error margins that arise from simply aggregating such diverse estimates, an
attempt has been made to standardize - as a far as possible - the heterogeneous data set. All
available estimates were transformed into one single indicator – annual prevalence among the
general population aged 15 to 64 – in most instances using regional average estimates and
using transformation ratios derived from analysis of the situation in neighbouring countries.
The basic assumption is that though the level of drug use differs between countries, there are
general patterns found for the psychoactive substances for which regional and global
estimates are generated (for example, young people consume more drugs than older people;
males consume more drugs than females; people in contact with the criminal justice system
show higher prevalence rates than the general population, et cetera) which apply to most
countries. It is also assumed that the relationship between lifetime prevalence and annual
prevalence among the general population or between lifetime prevalence among young
people and annual prevalence among the general population, except for new or emerging
drug trends, do not vary greatly among countries with similar social, cultural and economic
situations.
UNODC does not publish estimates of the prevalence of drug use in countries with smaller
populations (less than approximately 100,000 population aged 15-64) where the prevalence
estimates were based on the results of youth or school surveys that were extrapolated to the
general adult population, as applying such methods in the context of small countries can
result in inaccurate figures.

7
Indicators
The most widely used indicator at the global level is the annual prevalence rate: the number
of people who have consumed an illicit drug at least once in the twelve months prior to the
study. Annual prevalence has been adopted by UNODC as one of key indicators to measure
the extent of drug use. It is also part of the Lisbon Consensus on core epidemiological
indicators of drug use which has been endorsed by the Commission on Narcotic Drugs. The
key epidemiological indicators of drug use are:
1. Drug consumption among the general population (prevalence and incidence);
2. Drug consumption among the youth population (prevalence and incidence);
3. High-risk drug use (number of injecting drug users and the proportion engaged in
high-risk behaviour, number of daily drug users);
4. Utilization of services for drug problems (treatment demand);
5. Drug-related morbidity (prevalence of HIV, hepatitis B virus and hepatitis C virus
among drug users);
6. Drug-related mortality (deaths attributable to drug use).
Efforts have been made to present the overall drug situation from countries and regions based
on these key epidemiological indicators.
The use of annual prevalence is a compromise between lifetime prevalence data (drug use at
least once in a lifetime) and data on current use (drug use at least once over the past month).
The annual prevalence rate is usually shown as a percentage of the youth and adult
population. The definitions of the age groups vary, however, from country to country. Given
a highly skewed distribution of drug use among the different age cohorts in most countries,
differences in the age groups can lead to substantially diverging results.
Applying different methodologies may also yield diverging results for the same country. In
such cases, the sources were analysed in-depth and priority was given to the most recent data
and to the methodological approaches that are considered to produce the best results. For
example, it is generally accepted that nationally representative household surveys are
reasonably good approaches to estimating cannabis, ATS or cocaine use among the general

8
population, at least in countries where there are no adverse consequences for admitting illicit
drug use. Thus, household survey results were usually given priority over other sources of
prevalence estimates.
When it comes to the use of opiates (opium, heroin, and other illicit opiates), injecting drug
use, or the use of cocaine and ATS among regular or dependent users, annual prevalence data
derived from national household surveys tend to grossly under-estimate such use, because
heroin or other problem drug users often tend to be marginalized or less socially integrated,
and may not be identified as living in a ‘typical’ household (they may be on the streets,
homeless or institutionalized). Therefore, a number of ‘indirect’ methods have been
developed to provide estimates for this group of drug users, including benchmark and
multiplier methods (benchmark data may include treatment demand, police registration or
arrest data, data on HIV infections, other services utilization by problem drug users or
mortality data), capture-recapture methods and multivariate indicators. In countries where
there was evidence that the primary ‘problem drug’ was opiates, and an indirect estimate
existed for ‘problem drug use’ or injecting drug use, this was preferred over household
survey estimates of heroin use. Therefore, for most of the countries, prevalence of opioid or
opiates use reported refers to the extent of use of these substances measured through indirect
methods.
For other drug types, priority was given to annual prevalence data found by means of
household surveys. In order to generate comparable results for all countries, wherever
needed, the reported data was extrapolated to annual prevalence rates and/or adjusted for the
preferred age group of 15-64 for the general population.
Extrapolation methods
Adjustment for differences in age groups
Member States are increasingly using the 15-64 age group, though other groups are used as
well. Where the age groups reported by Member States did not differ significantly from 15-
64, they were presented as reported, and the age group specified. Where studies were based
on significantly different age groups, results were typically adjusted. A number of countries
reported prevalence rates or number of drug users for the age groups 15+ or 18+. In such
cases, adjustments were generally based on the assumption that there was no significant drug
9
use above the age of 64; the reported number of drug users based on the population age 15+
(or age 18+) was shown as a proportion of the population aged 15-64.
Methodology to produce joint estimates for more than one types of drugs
In the collection of information on prevalence of drug use, a number of instances arise where
data are available for specific types of drugs but prevalence data are needed at a higher level
of aggregation. In other words, prevalence data may be available for two particular kinds of
drugs but may also be needed in the form of a single figure which takes into account both
types at the same time. This is especially relevant in the case of closely related types of drugs.
For example, the prevalence of use of cocaine salts and “crack” cocaine may be known, but
in addition the prevalence of cocaine in general may be needed. If no empirical data is
available from Member States, a joint estimate is produced by aggregating the different types
of drugs according to the following method.
The methodology to calculate the estimate for prevalence of use of two drugs considers the
extent to which the group of users of one drug overlaps with the group of the users of the
other drug, for the same reference period (i.e. lifetime, past year or past month).
The prevalence rates of two types of drugs are combined to obtain the estimate of the
prevalence of any of the two drugs, which is derived as the midpoint of a lower (minimum)
estimate and an upper (maximum) estimate. These two estimates represent two opposite
extreme scenarios: in one scenario all the users of one type of drug also consume the other
drug, whereas in the other scenario none of the persons consuming the first drug consume the
other drug (and vice versa).
Given any two drugs A and B, we denote by PA and PB the prevalence of use of drugs A and
B, respectively. We aim to obtain an estimate of the prevalence of use of at least one of the
drugs A and B (e.g. use of cocaine = use of cocaine salts or crack cocaine). We shall call this
value Z = PA&B.
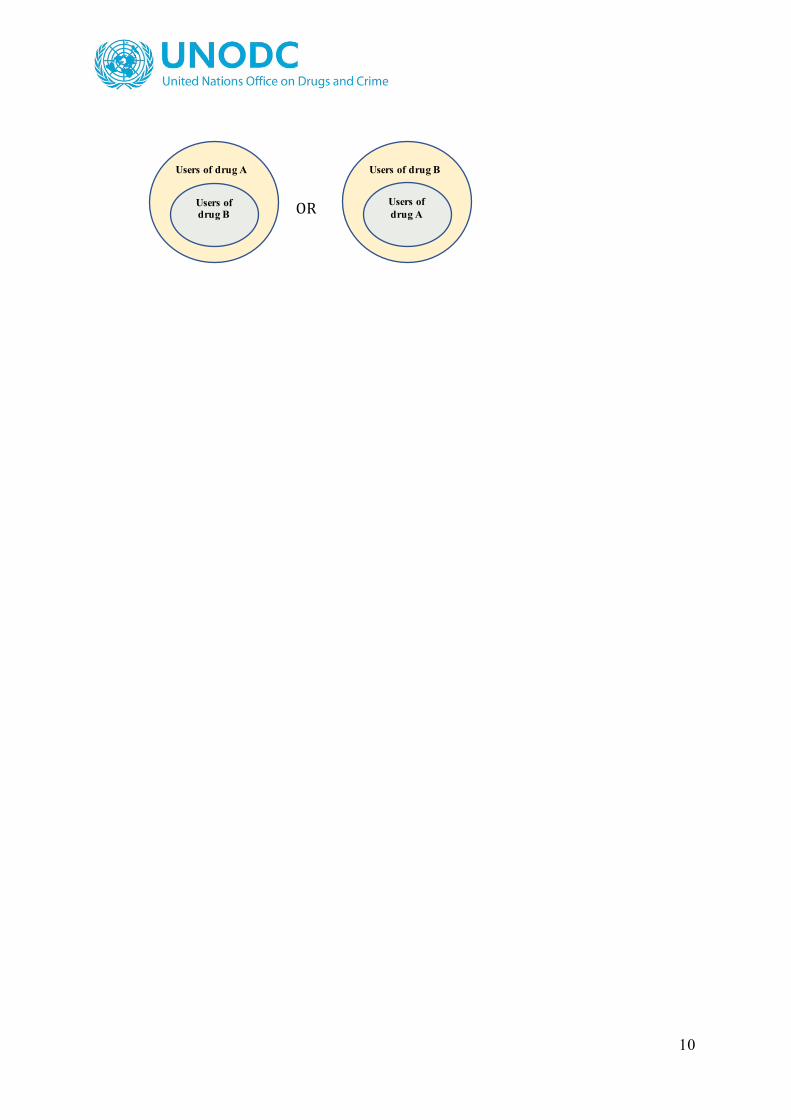
The lower estimate (Z min) corresponds to the scenario where all the users of one drug are to
be found among the users of the other drug. Therefore, the lower (minimum) joint estimate
corresponds to the highest value (maximum) among the two values of prevalence.
Z min = max (PA, PB)
10
OR
Users of drug B
Users of drug A
Users of drug A
Users of drug B

11
The upper (maximum) joint estimate reflects the opposite scenario, where the group of users
of drug A is completely separate from the group users of drug B; that is, none of the users of
drug A consume drug B (and vice versa).
Therefore, the upper (maximum) joint estimate for the two drugs is the sum of the prevalence
of the drug A and drug B; in other words, Z max = PA + PB.
The best estimate is obtained as the midpoint between Z min and Z max; that is Z best = (Z max +
Z min)/2. This represents a scenario in between the two extremes, where some of drug A users
consume also drug B.
Extrapolation of results from lifetime prevalence to annual prevalence
Some countries have conducted surveys in recent years without asking the question whether
drug consumption took place over the last year. In such cases, results were extrapolated to
reach annual prevalence estimates. For example, country X in West and Central Europe
reported a lifetime prevalence of cocaine use of 2%. As an example, taking data for lifetime
and annual prevalence of cocaine use in countries of West and Central Europe, it can be
shown that there is a strong positive correlation between the two measures (correlation
coefficient R = 0.94); that is, the higher the lifetime prevalence, the higher the annual
prevalence and vice versa. Based on the resulting regression line (with annual prevalence as
Users of drug A
Users of Drug B
Users of drug A
Users of drug B
12
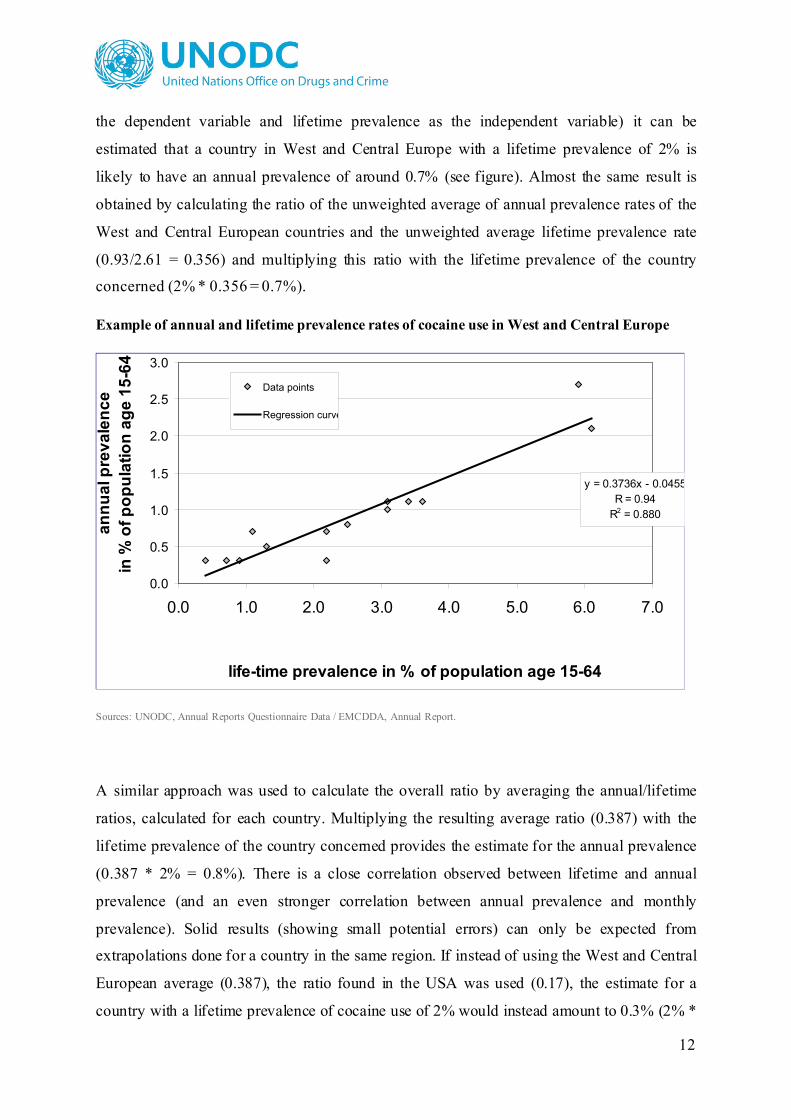
the dependent variable and lifetime prevalence as the independent variable) it can be
estimated that a country in West and Central Europe with a lifetime prevalence of 2% is
likely to have an annual prevalence of around 0.7% (see figure). Almost the same result is
obtained by calculating the ratio of the unweighted average of annual prevalence rates of the
West and Central European countries and the unweighted average lifetime prevalence rate
(0.93/2.61 = 0.356) and multiplying this ratio with the lifetime prevalence of the country
concerned (2% * 0.356 = 0.7%).
Example of annual and lifetime prevalence rates of cocaine use in West and Central Europe
y = 0.3736x - 0.0455R = 0.94
R2 = 0.880
0.0
0.5
1.0
1.5
2.0
2.5
3.0
0.0 1.0 2.0 3.0 4.0 5.0 6.0 7.0
life-time prevalence in % of population age 15-64
annu
al p
reva
lenc
e in
% o
f pop
ulat
ion
age
15-6
4
Data points
Regression curve
Sources: UNODC, Annual Reports Questionnaire Data / EMCDDA, Annual Report.
A similar approach was used to calculate the overall ratio by averaging the annual/lifetime
ratios, calculated for each country. Multiplying the resulting average ratio (0.387) with the
lifetime prevalence of the country concerned provides the estimate for the annual prevalence
(0.387 * 2% = 0.8%). There is a close correlation observed between lifetime and annual
prevalence (and an even stronger correlation between annual prevalence and monthly
prevalence). Solid results (showing small potential errors) can only be expected from
extrapolations done for a country in the same region. If instead of using the West and Central
European average (0.387), the ratio found in the USA was used (0.17), the estimate for a
country with a lifetime prevalence of cocaine use of 2% would instead amount to 0.3% (2% *

13
0.17). Such an estimate is likely to be correct for a country with a drug history similar to the
USA, which has had a cocaine problem for more than two decades, as opposed to West and
Central Europe, where a significant cocaine problem is largely a phenomenon of the last
decade. Therefore, data from countries in the same subregion with similar patterns in drug
use were used, wherever possible, for extrapolation purposes.
Both approaches—the regression model and the ratio model—were used to determine upper
and lower uncertainty range estimates calculated at a 90% confidence interval among those
aged 15-64 years in the given country. The greater the range, the larger the level of
uncertainty around the estimates. The range for each country is reported in the statistical
annex, where available.
Extrapolations based on school surveys
Analysis of countries which have conducted both school surveys and national household
surveys shows that there is, in general, a positive correlation between the two variables,
particularly for cannabis, ATS and cocaine. The correlation, however, is weaker than that of
lifetime and annual prevalence or current use and annual prevalence among the general
population. But it is stronger than the correlation between opiate use and injecting drug use
and between treatment demand and extent of drug use in the general population
These extrapolations were conducted by using the ratios between school surveys and
household surveys of countries in the same region or with similar social structure where
applicable. As was the case with extrapolation of results from lifetime prevalence to annual
prevalence, two approaches were taken: a) the unweighted average of the ratios between
school and household surveys in the comparison countries with an upper and lower
uncertainty range estimate calculated at a 90% confidence interval; and b) a regression-based
extrapolation, using the relationships between estimates from the other countries to predict
the estimate in the country concerned, with an upper and lower uncertainty range estimate
calculated at a 90% confidence interval. The final uncertainty range and best estimate are
calculated using both models, where applicable.
Extrapolations based on treatment data
For a number of developing countries, the only drug use-related data available was drug users
registered or treatment demand. In such cases, other countries in the region with a similar
socio-economic structure were identified, which reported annual prevalence and treatment
14
data. A ratio of people treated per 1,000 drug users was calculated for each country. The
results from different countries were then averaged and the resulting ratio was used to
extrapolate the likely number of drug users from the number of people in treatment.
National, regional and global estimates of the number of people who use drugs
and the health consequences of drug use
For this purpose, the estimated prevalence rates of countries were applied to the population
aged 15-64, as provided by the United Nations Population Division for the year 2018..
In the tables presented in the World Drug Report for regional and global estimates, totals may
not add up due to rounding.
Ranges have been produced to reflect the considerable uncertainty that arises when data are
either extrapolated or imputed. Ranges are provided for estimated numbers and prevalence
rates in the Report. Larger ranges are reported for subregions and regions with less certainty
about the likely levels of drug use – in other words, those regions for which fewer direct
estimates are available, for a comparatively smaller proportion of the region’s population, or
for regions for which the existing estimates show a comparatively larger variability.
Countries with one published estimate (typically those countries with a representative
household survey, or an indirect prevalence estimate that did not report ranges) did not have
uncertainty estimated. This estimate is reported as the ‘best estimate’.
To account for populations in countries with no published estimate, the 10th and 90th
percentile in the range of direct estimates within the subregion was used to produce a lower
and upper estimate. Similarly to the World Drug Report 2019 in this report a weighted
percentile procedure was implemented, that takes into account the population in the 15-64
age group in each country. For example, there are four countries in the Near and Middle East
/ South-West Asia subregion with sufficiently recent past year prevalence estimates for
cocaine use: Afghanistan (0.00, a point estimate), Iran (Islamic Republic of) (0.00 – 0.01,
best estimate 0.01), Israel (0.50 – 0.70, best estimate 0.60) and Pakistan (0.00 – 0.04, best
estimate 0.01). In order to obtain a best estimate for the subregion, the weighted average of
the best estimates for prevalence over these three countries is applied to the population of the
remaining countries in the subregion without prevalence data. To obtain a range for the

15
subregion, the weighted 10th percentile of the lower bounds of the uncertainty ranges (0.00,
0.00, 0.50 and 0.00), namely 0.00, and the 90th percentile of the upper bounds (0.00, 0.01,
0.70 and 0.04), namely 0.04, were considered. It is important to note that, as Israel accounts
for only about 3 per cent of the population within the 15-64 age group in these four countries,
the resulting weighted percentiles are not heavily influenced by the higher prevalence present
in this country. The percentages of 0.00 and 0.04 were applied to the population of the
remaining countries without prevalence data, in combination with the national level data for
Afghanistan, Iran (Islamic Republic of), Israel and Pakistan, to derive subregional lower and
upper estimates of 0.01 and 0.04 per cent respectively.
In some cases, not all the regions in a subregion had sufficient country-level data to allow the
above calculations. In such cases, for the purposes of arriving at estimates at regional level,
lower and upper estimates at the sub-regional level were derived based on the data points
from the entire region, specifically by considering the weighted 10th and 90th percentiles
respectively of the lower and upper country-level estimates. These results were then
combined with the other subregions to arrive at upper and lower estimates, and hence best
estimates, at regional level.
This produces conservative (wide) intervals for subregions where there is geographic
variation and/or variance in existing country-level estimates; but it also reduces the likelihood
that skewed estimates will have a dramatic effect on regional and global figures, as the
weighted percentiles procedure will give a smaller weight to relatively small countries, which
tend to be more likely to present an extreme prevalence.
As in the World Drug Report 2019 in this report the region of Oceania was divided into four
subregions (Australia and New Zealand, Melanesia, Micronesia, and Polynesia), while in
previous years prior to 2018 no subregional estimates of annual prevalence among the
population aged 15-64 were available. Given that the data for Melanesia, Micronesia and
Polynesia is scarce, in order to avoid imputing these regions with data from only Australia
and New Zealand (which are highly developed and thus very different from most other
countries in Oceania), the closest five countries to these regions with available data were
considered in the calculations, when necessary. This was the case for the calculations of the
prevalence of cocaine, “ecstasy”, opiates and opioids.

16
Estimates of the total number of people aged 15-64 who used illicit drugs at least once in the past year
This year’s Report used the same approach as in the previous years. Two ranges were
produced, and the lowest and highest estimate of each approachs was taken to estimate the
lower and upper ranges, respectively, of the total drug using population. This estimate is
obviously tentative given the limited number of countries upon which the data informing the
two approaches were based. The two approaches were as follows:
Approach 1:
The global estimates of the number of people using each of the five drug groups in the past
year were added up. Taking into account that people use more than one drug type and that
these five populations overlap, the total was adjusted downward. The size of this adjustment
was made based upon household surveys conducted in 26 countries globally including
countries from North America (Canada, Mexico and the United States, Europe (including
Italy, Germany, Spain and England and Wales), Latin America (Argentina, Brazil,
Plurinational State of Bolivia, Chile, Peru and Uruguay), Asia and the Pacific (Israel,
Indonesia, Philippines, and Australia) and Africa (Algeria), which assessed all five drug
types, and reported an estimate of total illicit drug use. Across these studies, the extent to
which adding each population of users overestimated the total population was a median factor
of 1.12. The summed total was therefore divided by 1.12 to arrive at an estimate of the global
number of drug users.
Approach 2:
This approach was based on the average proportion of the total drug using population that
used cannabis as a strong positive correlation between cannabis use and overall drug could be
identified.. The average proportion was obtained from household surveys conducted in the
same countries as for Approach 1. Across all of these studies, the median proportion of
cannabis users to total drug users was 81.3 per cent. The range of cannabis users at the global
level was therefore divided by 0.813 to arrive at an estimate of the global number of drug
users.
.
The global lower estimate was the lower of the two values obtained from the two approaches,
while the upper estimates was the upper value derived from the two approaches described.

17
Estimates of the number of ‘problem drug users’
It is useful to make estimates of the number of drug users whose use is particularly
problematic, as a proxy to those who could be diagnosed with drug use disorders, as this
subgroup of drug users is most likely to come to the attention of health and law enforcement.
Moreover, this subgroup’s drug use has been estimated to cause the main burden of disease
and public order.
The number of problem drug users is typically estimated with the number of people with drug
use disorders. Sometimes, an alternative approach is used. The EMCDDA has been using a
definition of ‘injecting or long duration use of opioids, amphetamines or cocaine’ to guide
country-level indirect prevalence estimation studies of problem drug use. Indirect methods
used include the use of treatment multipliers and capture re-capture methods.
In this Report, as in previous years, each of the five range estimates of the number of people
using each of the five drug groups was converted into a ‘heroin user equivalent’. This was
calculated with ‘relative risk coefficients’ (see below) derived from the UNODC Harm Index.
This method enables the aggregation of results from different drugs into one reference drug.
Table: Relative risk coefficient
Treatment index IDU Toxicity
Deaths
index
Relative
risk
coefficient
Index Index
(average
treatment,
IDU, toxicity,
death)
Opiates 100 100 100 100 100
Cocaine 85.3 47.8 88 18.5 59.9
Amphetamines 20.1 59.5 32 6.8 29.6
Ecstasy 3.8 6.1 20.7 1 7.9
Cannabis 9 0 1.5 0.6 2.8
18
A lower range was calculated by summing each of the five lower range estimates; the upper
end of the range was calculated by summing the upper range of the five estimates.
To obtain an estimate of the number of ‘problem drug users’, these totals were multiplied by
the corresponding proportion of dependent heroin users (DSM-IV) among past year heroin
users in the United States National Survey on Drug Use and Health (range 53-68% over a
five year period). Hence, the LOW estimate is the lower proportion (53%) multiplied by the
lower estimated size of the heroin use equivalent population (35.4million heroin user
equivalents). The HIGH estimate is the higher proportion (68%) multiplied by the higher
estimated size of the heroin use equivalent population (76.4 million heroin user equivalents).
This gives a range of 19 to 52.2 million problem drug users globally.
Calculation of trends based on qualitative information
In addition to estimates on the extent of drug use, member states also provide UNODC with
qualitative information on their perceptions of drug use trends as well as qualitative
information on perceptions of trafficking trends and on perceptions of cultivation trends.
The advantage of the use of such indices based on reported trend indicators is that often
larger numbers of countries are able to report such trends, not only developed but also
developing countries, thus reducing a potential reporting bias in the results. This is notably of
importance when it comes to changes in prevalence rates of drug use as there is a strong bias
in favor of household surveys conducted in developed counties. There is also an advantage of
using such qualitative information for the analysis of trafficking as the “traditional method”,
the analysis of trends in quantities seized may reflect not only underlying changes in drug
flow but also changes in law enforcement priorities. Finally, for crops where no
comprehensive, scientific monitoring of the areas under drug cultivation exist, such as for
cannabis, countries report a multitude of indictors that are, in general, not directly comparable
with each other (hectares eradicated, plants eradicated, quantities eradicated, plants seized,
greenhouses dismantled etc.) and which – when aggregated at the global level - often show
into opposite directions. Under such circumstances, the analysis of reported cultivation
trends by Member States provides at least some basic indications for the likely overall trends
in cultivation.
19
Thus, in booklet 3, perceptions of cannabis cultivation trends (both for overall cannabis
cultivation as well as indoor and outdoor cannabis cultivation) were shown as well as
perceptions of trends in the trafficking of amphetamine, methamphetamine and ecstasy, and
in booklet 4, perceptions of trends in overall drug use in developed countries and in
developing countries and economies in transition were as well as trends in methamphetamine
use in countries in the Near and Middle East/South West Asia.
Such trends are typically based on a multitude of indicators, including – in the case of drug
use trends - general population prevalence data, school surveys, treatment data, emergency
room visits, mortality data, reports by social workers, health care officials and law
enforcement officers, arrest data, seizure data, media reports, etc.. Based on this information
a simple index has been created. For reports of “large increase” 2 points were allocated, for
“some increase” 1 point; for “stable” 0 points; for “some decrease” 1 point was deducted and
for “large decrease” 2 points were deducted. The points calculated for each year were
subsequently added to the accumulated points of the previous year to arrive at the respective
trends perception index. Depending on the indictor used (and thus data availability) the years
2000, 2008 or 2010 were chosen as the starting years of the respective index.
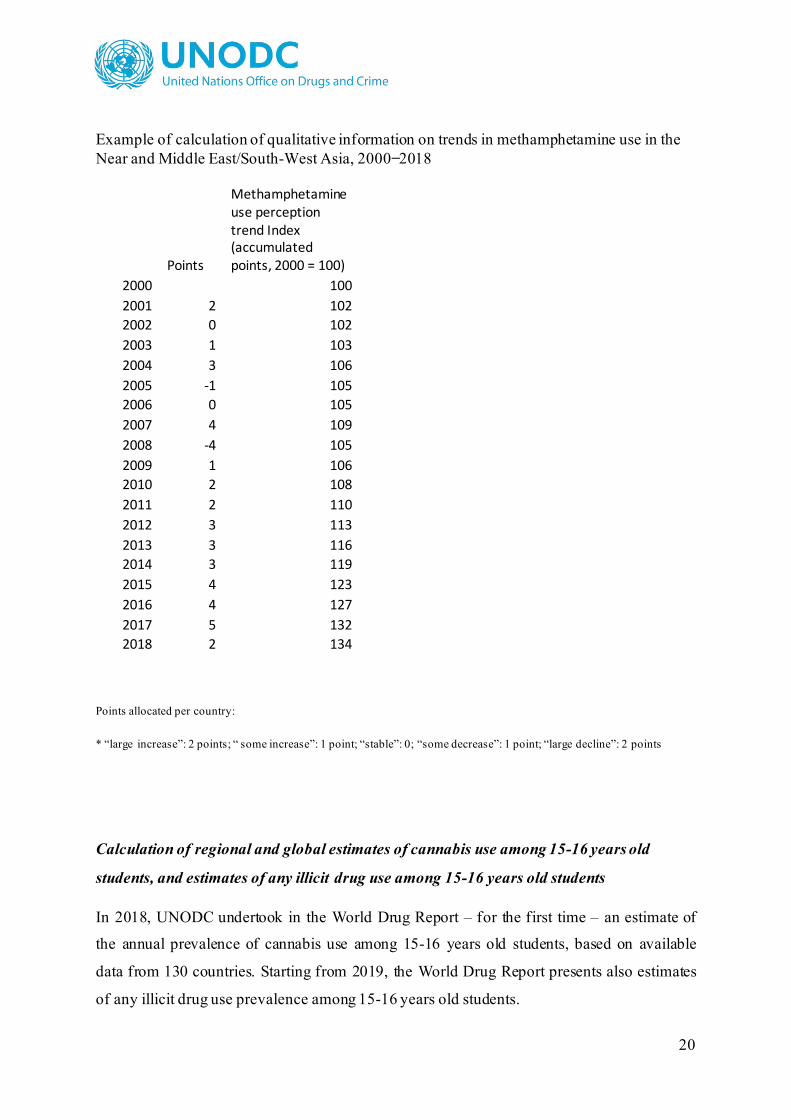
Results of the calculation of the index based on qualitative information of methamphetamine
use in the countries in the Near and Middle East / South West Asia is shown below:
20
Example of calculation of qualitative information on trends in methamphetamine use in the Near and Middle East/South-West Asia, 2000 ̶ 2018
Points
Methamphetamine use perception trend Index (accumulated points, 2000 = 100)
2000 100 2001 2 102 2002 0 102 2003 1 103 2004 3 106 2005 -1 105 2006 0 105 2007 4 109 2008 -4 105 2009 1 106 2010 2 108 2011 2 110 2012 3 113 2013 3 116 2014 3 119 2015 4 123 2016 4 127 2017 5 132 2018 2 134
Points allocated per country:
* “large increase”: 2 points; “ some increase”: 1 point; “stable”: 0; “some decrease”: 1 point; “large decline”: 2 points
Calculation of regional and global estimates of cannabis use among 15-16 years old
students, and estimates of any illicit drug use among 15-16 years old students
In 2018, UNODC undertook in the World Drug Report – for the first time – an estimate of
the annual prevalence of cannabis use among 15-16 years old students, based on available
data from 130 countries. Starting from 2019, the World Drug Report presents also estimates
of any illicit drug use prevalence among 15-16 years old students.
21
The age group “15-16 years” was chosen as this is the “preferred” age group for “youth” that
is asked in UNODC’s annual report questionnaire. This age group was also chosen by
ESPAD which regularly provides data from some 35 European countries on drug and alcohol
use. This age group is also available from the surveys among 10th graders undertaken
annually under the Monitoring the Future project in the United States, funded by the National
Institute on Drug Abuse (NIDA), and from a number of other countries.
Cannabis use prevalence rates typically increase with age until around 18-20 years before
declining again thereafter with age. This also means that for most countries cannabis use
prevalence rates among 15-16 years old students turn out to be rather similar to the broader
group of students aged 12-18 (with those aged 12-14 showing lower rates and those aged 17-
18 showing higher rates). Thus, for the United States the annual cannabis use prevalence
rates amongst 10th graders turn out to be very similar to those found amongst 8th, 10th and 12th
graders combined. Similarly, in Colombia annual prevalence of cannabis use amongst 12 to
18 years old students was found to have been very similar to the rates found among 15-16
years old students. The same applies to students in Pakistan as well. Cannabis use prevalence
rates among students aged 15-16 are thus reasonably good proxies for cannabis use among
the overall student population aged 12-18. They are thus the preferred indicator for measuring
student drug use at the international level as is also reflected in the question on student drug
use in UNODC’s annual report questionnaire.
The methodology chosen to calculate the global average of cannabis use among students
aged 15-16 years was very similar to the methodology used to calculate cannabis use among
the general population aged 15-64:
1. Listing – on a sub-regional basis – the latest annual prevalence rates of cannabis use
among the population aged 15-16 (which in most cases reflected school surveys) and
multiplying such percentages with the average population of those aged 15-16 in
those countries in 2017.
2. For the remaining countries that reported prevalence data on cannabis use (but not the
requested age group of not annual prevalence the following
adjustments/extrapolations were done:
a. Adjusting surveys using different age groups to a likely estimate for the
population aged 15-16 years; the age adjustments were done based on detailed

22
data from the United Stated for countries in North America, Europe and the
developed countries of the Oceania region (i.e. Australia and New Zealand);
for Africa and Asia based on detailed data available from Pakistan and for
South America, Central America and the Caribbean based on detailed data
available from Colombia.
A special model was developed for the adjustments. In short, taking into
account considerations of diversity and representativity, the following data
served as benchmarks for the calculation of the conversion ratios: the 2013
survey in Colombia among people aged 12-651, the 2012 survey carried out in
Pakistan jointly by UNODC and the Government of Pakistan targeting the
population aged 15-642 and the 2015 National Survey on Drug Use and
Health of the United States among people aged 12 years and older3. After
collating or generating prevalence data broken down by age groups,
prevalence data were derived for each single-year age group. In cases where
robust data were not available at this level of granularity (e.g. prevalence data
available only for the age brackets 15-19, 20-24, 25-29, etc.), the prevalence in
single-year age groups was estimated by optimizing for smoothness the
prevalence data as a function of age - subject to the constraints that the total
number of users within each given age bracket remained unchanged (i.e. equal
to the prevalence multiplied by the population within the specific age bracket).
Where necessary boundary conditions were imposed, e.g. a prevalence of 0 for
ages 10 and below. On the basis of single-year prevalence estimates obtained,
the prevalence rates were estimated for each possible age group that could
potentially arise (e.g. 10-15, 12-19, 14-22). Finally, the conversion factors
were calculated as the ratios of the prevalence data within the respective age
groups as compared to the age groups of interest (age 15-16 years).
b. Extrapolating available life-time or past month data of cannabis use from
individual countries to (missing) annual prevalence data based on a regression
1 Gobierno Nacional de la República de Colombia, Estudio Nacional de Consumo de Sustancias Psicoactivas en Colombia – 2013. 2 UNODC, Drug Use in Pakistan 2013. 3 Data query engine at http://pdas.samhsa.gov/ and Substance Abuse and Mental Health Services Administration, Results from the 2015 National Survey on Drug and Health: Detailed Tables.

23
analysis of other countries in the subregion providing both life-time and
annual data among youth or both past month and annual data among youth. A
95 per cent confidence interval was then used to calculate, in addition, a
minimum and a maximum estimate based on such regression data.
3. For the remaining countries which did not report any prevalence data it was assumed
that – on average – they had similar prevalence rates as the population weighted
average of the reporting countries in the subregion. In cases where the reporting
countries accounted for less than 20 per cent of the total population of the subregion,
the (weighted) average of reporting countries in the region as a whole was used
instead.
4. For countries not reporting any prevalence data it was assumed that the lower estimate
was equivalent to the (population weighted) 10th percentile of the reporting countries
in the subregion (or the region if reporting countries in the subregion accounted for
less than 20 per cent of total population in the subregion) while the upper estimate
was equivalent to the (population weighted) 90th percentile of the reporting countries
in the subregion (or the data for the region was used as a proxy if reporting countries
in the subregion accounted for less than 20 per cent of the total population in the
subregion).
The reported ranges reflected primarily the coverage of a region by student surveys;
in short, the larger the reported error margins, the less countries reported school
survey data in a region or sub-region to UNODC. Error margins turned out to be small
for Europe and the Americas where a majority of countries undertook such school
surveys in recent years while they were rather large for Africa, Asia or for the
Oceania region (with the exception of the economically advanced countries in this
region).
5. The totals of the calculated subregional estimates gave the regional estimates and the
total of the regional estimates then gave the global estimates.
6. The number of cannabis users was shown for a hypothetical average age of 15-16
years; in order to calculate the total number of cannabis users of those aged 15 years
and 16 years the totals had to be still multiplied by two (in order to be in line with the
approach used to show general population estimates for those aged 15-64)

24
As mentioned before, UNODC also computed an estimate on the number of users aged 15-16
worldwide that have consumed any illicit drug in the last 12 months. The methodology used
for this estimate replicates the approach through which the prevalence of any illicit drug use
is calculated for the general population aged 15-64, as previously described.
As explained, this methodology examines the relationship between cannabis use prevalence
and any illicit drug use prevalence in the target population to estimate the latter based on the
former. The analysis of information from 51 different countries, representing South, Central
and North America, Europe, Oceania and Asia, yields that the observed median ratio between
cannabis and any illicit drug use annual prevalence for the target population is 90 per cent.
Based on this, the total number of any illicit drug users in the 15-16 age group worldwide was
estimated directly from the global estimate of cannabis drug users in the same age group.
The analysis of drug consumption based on the analysis of waste-water is an alternative
method to estimate drug consumption
The development of analytical tools and methods for the waste-water analysis took place in
recent years in Europe by waste-water research institutes under the umbrella of the COST
initiative (Sewage Analysis CORe group Europe under the European Cooperation in Science
and Technology initiative), supported by the European Union under the EU Framework
Programme Horizon 2020. Both EU and non-EU countries participate in this cooperation.
In order to obtain – as far as possible – comparable data, waste-water in various cities has
been analysed by the research institutes participating in the COST exercise over a one-week
period each year in spring.
The analysis was done for the main cocaine metabolite (benzoylecgonine) as well as for
amphetamine and methamphetamine.
The approach used is exemplified for the case of benzoylecgonine, the main cocaine
metabolite found in waste-water. The amount of benzoylecgonine found each day in the
waste-water was determined and a daily average was calculated. (This is important as
cocaine use is typically more widespread during the weekend than during normal weak days).
In a subsequent step the size of the population responsible for the waste-water in the
respective waste-water catchment areas was determined and the results were shown in terms
of average milligrams of benzoylecgonine (a main cocaine metabolite) per day found in
waste-water per 1000 inhabitants.

25
The waste-water data used for the analysis in the World Drug Report can be found under:
http://www.emcdda.europa.eu/topics/pods/waste-water-analysis_en
as well as under
http://score-cost.eu/monitoring2018/
and
https://score-cost.eu/monitoring2019/
Even though the results from the analysis of waste-water have been obtained applying high
levels of scientific rigour, the subsequent analysis of the trends at the European level has
remained a challenge due to the fact that different cities across Europe took part in this
exercise in different years over the period 2011 ̶2019 and differences of cocaine consumption
across European cities continue to be quite significant. This means that the inclusion or the
exclusion of a specific city can have a significant impact on the overall average. In other
words, calculating and comparing the averages of the cities participating each year in the
survey may lead to misleading results as a growing participation of cities with lower levels of
cocaine consumption could well offset increases in overall cocaine consumption.
This problem can be overcome by analysing the results of the cities which participated each
year in this exercise. However, such results would be based on the results of less than 10
cities and the data from such a limited number of cities are not necessarily a reliable indicator
for overall cocaine consumption trends in Europe.
An alternative approach used and shown in the report was to expand the analysis to 136
European cities participating in at least one year in the study analysing bencoylecgonine in
waste-water (including 15 cities in 2011, 27 in 2012, 43 in 2013, 54 in 2014, 59 in 2015, 68
in 2016, 72 in 2017, 80 in 2018 and 72 in 2019) as reported to UNODC. UNODC included
in its calculations only cities that were geographically located within Europe, i.e. not included
were cities though being part of European countries that are located outside of Europe.
Interpolation techniques were used to account for missing data. A broad range of possibilities
to deal with missing data exists and is discussed in the literature. The proposed approaches
26
have all merits and shortcomings. This also applies to the interpolation techniques used for
this exercise.
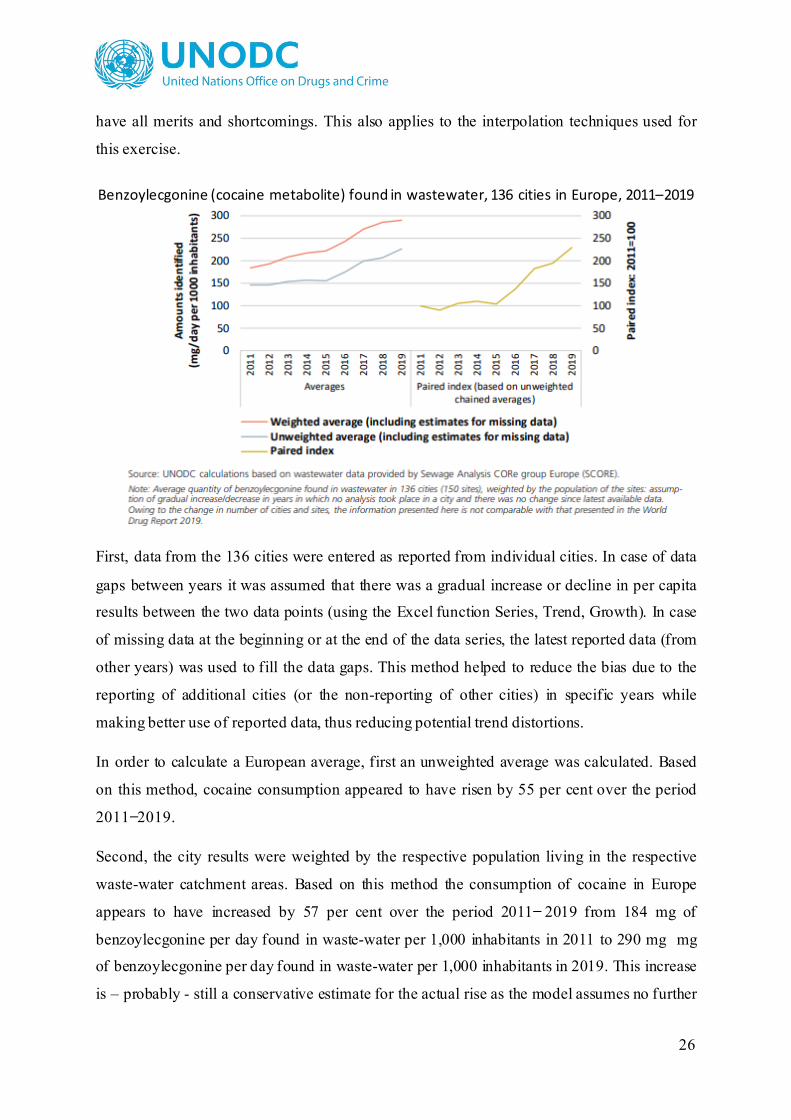
Benzoylecgonine (cocaine metabolite) found in wastewater, 136 cities in Europe, 2011–2019
First, data from the 136 cities were entered as reported from individual cities. In case of data
gaps between years it was assumed that there was a gradual increase or decline in per capita
results between the two data points (using the Excel function Series, Trend, Growth). In case
of missing data at the beginning or at the end of the data series, the latest reported data (from
other years) was used to fill the data gaps. This method helped to reduce the bias due to the
reporting of additional cities (or the non-reporting of other cities) in specific years while
making better use of reported data, thus reducing potential trend distortions.
In order to calculate a European average, first an unweighted average was calculated. Based
on this method, cocaine consumption appeared to have risen by 55 per cent over the period
2011 ̶ 2019.
Second, the city results were weighted by the respective population living in the respective
waste-water catchment areas. Based on this method the consumption of cocaine in Europe
appears to have increased by 57 per cent over the period 2011 ̶ 2019 from 184 mg of
benzoylecgonine per day found in waste-water per 1,000 inhabitants in 2011 to 290 mg mg
of benzoylecgonine per day found in waste-water per 1,000 inhabitants in 2019. This increase
is – probably - still a conservative estimate for the actual rise as the model assumes no further
27
changes after the latest reported data (i.e. using e.g. 2016 data as a proxy for 2017, 2018 and
2019 if no further data were reported after 2016). Thus, the more cities that have not reported
in the latest year(s), the flatter will be the resulting curve, potentially under-estimating overall
growth.
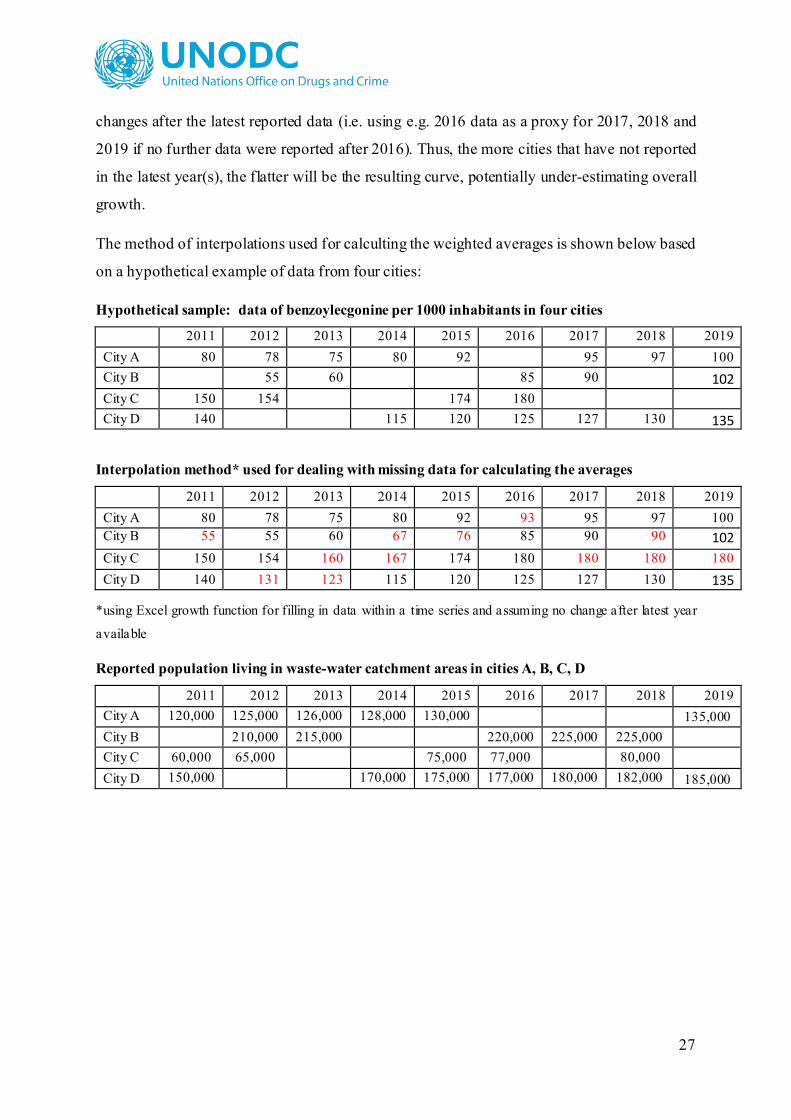
The method of interpolations used for calculting the weighted averages is shown below based
on a hypothetical example of data from four cities:
Hypothetical sample: data of benzoylecgonine per 1000 inhabitants in four cities
2011 2012 2013 2014 2015 2016 2017 2018 2019 City A 80 78 75 80 92 95 97 100 City B 55 60 85 90 102 City C 150 154 174 180 City D 140 115 120 125 127 130 135
Interpolation method* used for dealing with missing data for calculating the averages
2011 2012 2013 2014 2015 2016 2017 2018 2019 City A 80 78 75 80 92 93 95 97 100 City B 55 55 60 67 76 85 90 90 102 City C 150 154 160 167 174 180 180 180 180 City D 140 131 123 115 120 125 127 130 135
*using Excel growth function for filling in data within a time series and assuming no change after latest year
available
Reported population living in waste-water catchment areas in cities A, B, C, D
2011 2012 2013 2014 2015 2016 2017 2018 2019 City A 120,000 125,000 126,000 128,000 130,000 135,000 City B 210,000 215,000 220,000 225,000 225,000 City C 60,000 65,000 75,000 77,000 80,000 City D 150,000 170,000 175,000 177,000 180,000 182,000 185,000

28
Interpolation method* used for estimating population living in waste-water catchment areas in
cities A, B, C, D
2011 2012 2013 2014 2015 2016 2017 2018 2019 City A 120,000 125,000 126,000 128,000 130,000 131,232 132,476 133,732 135,000 City B 210,000 210,000 215,000 216,654 218,321 220,000 225,000 225,000 225,000 City C 60,000 65,000 68,176 71,506 75,000 77,000 77,000 77,000 77,000 City D 150,000 156,391 163,053 170,000 175,000 177,000 180,000 182,000 185,000
*using Excel growth function for filling in data within a time series and assuming no change after
latest year available
Based on these data the population weighted averages can be calculated for the four cities.
(i.e. for 2019: (100*135,000+102*225000+180*77,000+135*185,000) / sum (135,000,
225,000, 77,000, 185,000) = 121). The actual calculation was done in Excel, using for each
year the “sumproduct” function for benzoylecgonine found in the four cities and the
population in the four catchment areas; the resulting total was then divided by the total
population in the four waste-water catchment areas in the respective year to arrive at the
average for the respective year.
Calculation of average of benzoylecgonine per 1000 inhabitants in four cities
2011 2012 2013 2014 2015 2016 2017 2018 2019 Average for cities A, B, C, D
95
93
93
96
105
111
113
115
121
Finally, a chained index was established which took all city results into account once a city
reported data in two subsequent years. The advantage of this method is that it is based
entirely on reported data and does not require any explicit assumptions to be made about
missing data. The disadvantage is that it is based on fewer datapoints as it does not cover
trends once there has not been any immediately following reporting, i.e. a reporting in yearx
followed by a reporting in yearx+1. Emerging trends from reporting in yearx and again in
yearx+2, or in year x+3, etc. are ignored.
The calculated trends for Europe, based on this method, included the analysis of changes in
12 cities over the period 2011 ̶ 2012 period, 23 cities over the period 2012 ̶ 2013, 27 cities
over the period 2013 ̶ 2014, 43 cities over the period 2014 ̶ 2015, 43 cities over the period

29
2015 ̶ 2016, 42 cities over the period 2016 ̶ 2017, 51 cities over the period 2017 ̶ 2018 and 52
cities over the period 2018 ̶2019. This calculation suggested an overall increase of 129 per
cent over the period 2011 ̶ 2019, and thus far more than found in the calculations based on
the assumption of no further changes after the last reporting year . The results based on the
calculation of paired results and a chained index are thus on the high-side. In fact, there could
be a bias in favor of a yearly participation of waste-water analyses among those cities where
the problem is rapidly growing.
Calculating paired averages to calculate the growth rates and combine the results into a
chained index, the hypothetical sample shown above would lead to the following results:
Hypothetical sample: data of benzoylecgonine per 1000 inhabitants in four cities
2011 2012 2013 2014 2015 2016 2017 2018 2019 City A 80 78 75 80 92 95 97 100 City B 55 60 85 90 102 City C 150 154 174 180 City D 140 115 120 125 127 130 135
Hypothetical sample: calculation of growth rates of paired averages
City A City B City C City D
Averages (of data in reporting and subsequent year)
Growth rates
2011 80 150 140 115.0
2012 78 55 154 116.0 1.009
2012 78 55 154 66.5
2013 75 60 67.5 1.015
2013 75 60 75.0
2014 80 115 80.0 1.067
2014 80 115 97.5
2015 92 174 120 106.0 1.087
2015 92 174 120 147.0
2016 85 180 125 152.5 1.037
2016 85 180 125 105.0
2017 95 90 127 108.5 1.033
2017 95 90 127 111.0
2018 97 130 113.5 1.023
2018 97 130 113.5
2019 100 102 135 117.5 1.035

30
Hypothetical sample: Calculation of chained index
2011 2012 2013 2014 2015 2016 2017 2018 2019 100 100*1.009 100.9*1.015 102.4*1.067 109.2*1.087 118.7*1.037 123.2*1.033 127.3*1.023 130.1*1.035
Chained index
100.0
100.9
102.4
109.2
118.7
123.2
127.3
130.1
134.7
While each of the methods used to identify consumption trends has its merits and its
shortcomings, it may be still interesting to note that all calculations of benzoylecgonine found
in waste-water in Europe resulted in strong increases (+55 per cent, + 57 per cent and +129
per cent) so that it can be safely stated, as was done in the World Drug Report, that cocaine
consumption in the European cities investigated rose by more than 50 per cent over the
period 2011 ̶ 2019.
It may be also interesting to note that reported quantities of cocaine seized rose by even 180
per cent of the period 2011 ̶2018. This suggests that European cocaine seizures rose clearly
more than European cocaine consumption, indicating an overall rise in the cocaine
interception rates by European law enforcement. At the same time, data also indicate that
despite of undeniable law enforcement successes in recent years, they were not sufficient to
effectively counter the rapidly increasing trafficking flow of cocaine from South America to
Europe and stabilize or even reduce overall cocaine consumption in Europe.
Estimates of the prevalence of injecting drug use, HIV and hepatitis (C and B virus)
among people who inject drugs (PWID)
Data sources, selection of country estimates and validation process
Population size estimates for PWID, and the prevalence of HIV and hepatitis among PWID,
were identified over the past six years using a comprehensive search of the published peer-
reviewed literature, a search of the “grey” literature, from the official United Nations survey
instruments of UNODC and UNAIDS, from regional organizations (particularly the
European Monitoring Centre for Drugs and Drug Addiction (EMCDDA)), and through the
global network of UNODC HIV/AIDS Advisors.
The criteria for the selection of country estimates primarily involved the consideration of the
methodological soundness of the estimates, determined according to the classification

31
presented in the table below (studies in class A are of higher methodological quality and
those in class D of lower quality), with due regard to national geographic coverage, the year
of the estimate, and the definition of the target population (global and regional estimates were
made for the annual prevalence of injecting among both genders aged 15-64). UNODC,
WHO, UNAIDS and the World Bank reviewed all estimates.
Table: Classification of methodology for people who inject drugs, and those among them living
with HIV and hepatitis
Data are categorized by methodology according to a slightly modified classification originally
proposed in Mathers et. al. (2008) Lancet paper. 4
ClassIndirect prevalence estimation methods
A e.g., capture-recapture, network scale-up method, multiplier methods, etc
B1 Mapping/census and enumerationB2 General population survey C Treatment and other national registers of drug users
· Official government estimate with no methodology reportedD1 · Experts’ judgment with known method of estimation (eg. an estimate obtained through a rapid assessment)
· Modelling studies (e.g. Spectrum)· Delphi method or other consensus estimate
D2* Estimate from non-official source with methodology unknown
Class
A Seroprevalence study A1 Multi-site seroprevalence study with at least two sample types (e.g. treatment or outreach sample) A2 Seroprevalence study from a single sample type B Registration or notification of cases of HIV infection (e.g. from treatment services)C Prevalence study using self-reported HIV
· Official government estimate with no methodology reported· Modelling Studies (e.g. mode of transmission models)
D2* Estimate from non-official source with methodology unknown * Data graded D2 are excluded from the dataset
D1
Data on people who inject drugs
Data on the prevalence of HIV and hepatitis among people who inject drugs
As part of a wider review process, every year since 2014, UNODC, WHO, UNAIDS and the
World Bank have reached out to a broad group of experts from academia (including all
former members of the Reference Group to the United Nations on HIV and Injecting Drug
Use) and regional, international, including civil society, organizations to ensure that a
scientific approach to the methodology was used and that the greatest number of datasets
available worldwide on the subject were included. Data were sent to Member States annually
4 Mathers, B., L. Degenhardt, et al. (2008). Global epidemiology of injecting drug use and HIV among people who inject drugs: a systematic review. The Lancet 372(9651): 1733-1745

32
for their validation and potential comments on the selected estimates, or for completion of
data if surveys had been conducted which UNODC was not aware of.
Calculation of regional and global estimates
Regional and global estimates were calculated for a specific reference year. Presently this is
for the year 2018 (as for most of the data on HIV and hepatitis among PWID presented in
this World Drug Report has been available for the year 2018.).
The regional best estimates for the prevalence of injecting drug use, and HIV and hepatitis
among PWID, were calculated as the population-weighted means. The global estimates for
2018 were calculated as the population-weighted regional means. In the population-weighting
procedure, the population refers to those aged 15-64 years for the year 2018 in the case of the
prevalence of injecting drug use, or to the estimated number of PWID for the year 2018 in the
case of the prevalence of HIV and hepatitis among PWID. For countries where a number of
PWID was reported in the study/survey, a prevalence estimate was subsequently calculated
using the population aged 15-64 corresponding to the year of the estimate. For those
countries where an estimate of the prevalence of HIV or hepatitis among PWID was
available, but a population size estimate for PWID was not, then the regional average
prevalence of injecting drug use was used to produce a population size estimate for PWID
that was used in the weighting procedure for the prevalence of HIV and hepatitis among
PWID.
Uncertainty intervals for the regional and global best estimates were calculated that reflect
both the range in the country prevalence estimates (if these were provided) and the regional
variability in the available country prevalence estimates. To achieve this, the 10th and 90th
percentiles of the known prevalence estimates for countries from within the same region were
determined. These were then applied to countries from within the same region for which no
estimates were available to give a range of plausible population size estimates. This produced
a liberal uncertainty range while excluding the extreme prevalence estimates.
Data quality of estimates on injecting drug use and HIV among PWID
Interpretation of regional and global estimates

33
The global and regional estimates for the prevalence of injecting drug use and HIV among
PWID presented for 2018 in the World Drug Report should be viewed as an update to those
presented in previous editions of the World Drug Report that reflect the latest data available.
This year new or updated information was identified on PWID from 43 countries and on HIV
among PWID from 42 countries. There is no intention to imply that there has been an actual
change in the prevalence of injecting drug use or HIV among PWID at the regional or global
level. The new values represent an update based on the best estimates that can currently be
made using the most recent and highest quality data available to UNODC, WHO, UNAIDS,
and the World Bank.
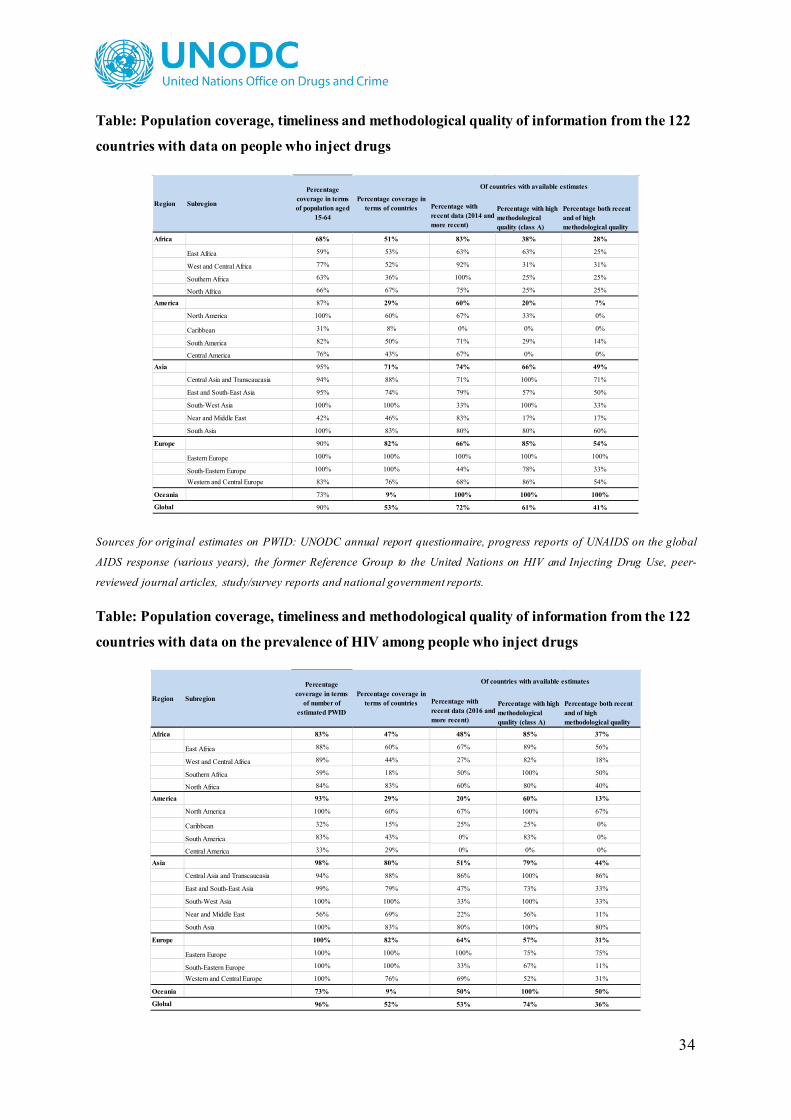
Quality of national-level data on PWID
Of the 122 countries with information on the prevalence of PWID, 61 per cent were of high
methodological quality (class A, as defined in the table above) and 72 per cent related to
timely data from 2014 or more recently. Almost one-half (41 per cent) of the countries have
information that is from recent, methodologically high quality surveys. With a low level of
coverage of the population aged 15-64 compared to other regions there is limited information
on PWID for countries in Africa. It is noticeable that there are relatively few recent,
methodologically high quality data from the Americas. However, for the two sub-regions
with the highest prevalence of PWID (Eastern and South-Eastern Europe, and Central Asia
and Transcaucasia) there is a very high percentage data coverage of the populations aged 15-
64 and approximately one half or more of the estimates are both recent and of high
methodological quality.
Quality of national-level data on HIV among PWID
Of the 121 countries with information on the prevalence of HIV among PWID, 74 per cent
were of high methodological quality (class A, as defined in the table above) and 53 per cent
related to timely data from 2015 or more recently. More than one third (36 per cent) of the
countries have information that is from both recent and methodologically high quality
surveys. The two sub-regions that have by far the highest prevalence of HIV among PWID
(South-West Asia, and Eastern and South-Eastern Europe) have prevalence estimates from all
countries and from methodologically high quality surveys from a good percentage of those
countries.
34
Table: Population coverage, timeliness and methodological quality of information from the 122
countries with data on people who inject drugs
Percentage with recent data (2014 and more recent)
Percentage with high methodological quality (class A)
Percentage both recent and of high methodological quality
Africa 68% 51% 83% 38% 28%
East Africa 59% 53% 63% 63% 25%
West and Central Africa 77% 52% 92% 31% 31%
Southern Africa 63% 36% 100% 25% 25%
North Africa 66% 67% 75% 25% 25%
America 87% 29% 60% 20% 7%
North America 100% 60% 67% 33% 0%
Caribbean 31% 8% 0% 0% 0%
South America 82% 50% 71% 29% 14%
Central America 76% 43% 67% 0% 0%
Asia 95% 71% 74% 66% 49%
Central Asia and Transcaucasia 94% 88% 71% 100% 71%
East and South-East Asia 95% 74% 79% 57% 50%
South-West Asia 100% 100% 33% 100% 33%
Near and Middle East 42% 46% 83% 17% 17%
South Asia 100% 83% 80% 80% 60%
Europe 90% 82% 66% 85% 54%
Eastern Europe 100% 100% 100% 100% 100%
South-Eastern Europe 100% 100% 44% 78% 33%
Western and Central Europe 83% 76% 68% 86% 54%
Oceania 73% 9% 100% 100% 100%
90% 53% 72% 61% 41%Global
Percentage coverage in terms of countries
Percentage coverage in terms of population aged
15-64
Of countries with available estimates
Region Subregion
Sources for original estimates on PWID: UNODC annual report questionnaire, progress reports of UNAIDS on the global
AIDS response (various years), the former Reference Group to the United Nations on HIV and Injecting Drug Use, peer-
reviewed journal articles, study/survey reports and national government reports.
Table: Population coverage, timeliness and methodological quality of information from the 122
countries with data on the prevalence of HIV among people who inject drugs
Percentage with recent data (2016 and more recent)
Percentage with high methodological quality (class A)
Percentage both recent and of high methodological quality
Africa 83% 47% 48% 85% 37%
East Africa 88% 60% 67% 89% 56%
West and Central Africa 89% 44% 27% 82% 18%
Southern Africa 59% 18% 50% 100% 50%
North Africa 84% 83% 60% 80% 40%
America 93% 29% 20% 60% 13%
North America 100% 60% 67% 100% 67%
Caribbean 32% 15% 25% 25% 0%
South America 83% 43% 0% 83% 0%
Central America 33% 29% 0% 0% 0%
Asia 98% 80% 51% 79% 44%
Central Asia and Transcaucasia 94% 88% 86% 100% 86%
East and South-East Asia 99% 79% 47% 73% 33%
South-West Asia 100% 100% 33% 100% 33%
Near and Middle East 56% 69% 22% 56% 11%
South Asia 100% 83% 80% 100% 80%
Europe 100% 82% 64% 57% 31%
Eastern Europe 100% 100% 100% 75% 75%
South-Eastern Europe 100% 100% 33% 67% 11%
Western and Central Europe 100% 76% 69% 52% 31%
Oceania 73% 9% 50% 100% 50%
96% 52% 53% 74% 36%
Of countries with available estimates
Global
Region Subregion
Percentage coverage in terms
of number of estimated PWID
Percentage coverage in terms of countries

35
Sources for original estimates on HIV among PWID: UNODC annual report questionnaire, progress reports of UNAIDS on
the global AIDS response (various years), the former Reference Group to the United Nations on HIV and Injecting Drug Use,
peer-reviewed journal articles, study/survey reports and national government reports.
Estimates on the number of drug-related deaths (mortality) Drug-related mortality includes deaths directly or indirectly caused by the use of drugs.
Direct deaths capture mortality cases where the main underlying cause leading to death was
the use of drugs. Indirect deaths include those caused by Hepatitis C, HIV/AIDS related to
drug use, car accidents, suicide and/or violent deaths under the influence of drugs.
In most cases countries report data on deaths directly related to the use of drugs. However,
due to a variety of existing definitions and data reporting mechanisms, international
comparisons should be carried out with caution. The total number of drug-related deaths
reported by Member States was used to determine a mortality rate per 1 million population
aged 15-64 years, using population figures from the World Population Prospects (WPP 2019
Revision), published by the United Nations Population Division (Department of Economic
and Social Affairs).
3. Drug cultivation, production and manufacture
Data on cultivation of opium poppy and coca bush and production of opium and coca leaf for
the main producing countries (Afghanistan, Myanmar, Mexico and the Lao People’s
Democratic Republic, for opium; and Colombia, Peru and the Plurinational State of Bolivia
for coca) are mainly derived from national monitoring systems supported by UNODC in the
framework of the Global Illicit Crop Monitoring Programme (ICMP). The detailed country
reports can be found on the UNODC website https://www.unodc.org/unodc/en/crop-
monitoring/index.html
UNODC estimates for Afghanistan cover the period 1994-2019. UNDOC supported
monitoring systems in most other countries started following UNGASS 1998, became
operational over the 2000-2002 period and have reported data ever since. Opium cultivation
and production estimates are available up to the year 2019.

36
The preliminary opium poppy cultivation data for 2018 have been revised as new
information from missing countries became available and some country results were revised.
The total area under opium poppy cultivation estimated for the year 2018 thus changed
slightly, from 345,800hectares reported in the 2019 World Drug Report, to 345,000 hectares
reported in the 2020 World Drug Report. Similarly, estimates for 2011, 2015, 2016 and
2017 slightly decreased whereas the estimate for 2014 increased with the revision in the
current 2020 World Drug report..
Preliminary data for 2019 – 240,800 hectares - should be also interpreted with caution. No
opium poppy surveys took place in 2019 in the Lao PDR and the data from 2016 onwards are
provided by the Lao National Commission for Drug Control and Supervision and thus not
comparable to prior years. Estimates of the area under opium poppy cultivation in Mexico are
for the season 2017/2018. No data for the season 2018/2019 are as yet available. Data
published for Mexico up until the year 2014 have been based on estimates provided by the
US State Department in its annual International Narcotics Control Strategy Report (INCSR)
and are – for methodological reasons – not directly comparable with the new estimates from
the new Mexican crop monitoring system (supported by UNODC).
Opium poppy cultivation in countries which do not conduct area surveys, was estimated with
an indirect method (see below). The global opium poppy cultivation estimates for 2019 will
be adjusted again in next year’s World Drug Report once more data will have become
available.
Preliminary estimates suggest that global opium production in 2019 amounted to some 7,610
tonsThe amount estimated for 2017 got revised from 10,415 to 10,270 in the current World
Drug Report 2020 as new data became available. The estimated tons of opium production for
2017 are the highest value on record since UNODC started its annual monitoring of opium
production at the beginning of the 21st century. Earlier estimates exist, but a comparison of
opium poppy cultivation and opium production estimates with estimates from previous
decades, notably those reported for periods prior to World War II are rendered difficult as the
methodologies then used differ from the methodologies used nowadays. Opium production
estimates are nowadays derived from an analysis of satellite photos for the analysis of the
area under cultivation. This area is then multiplied with the respective yields of opium per
hectare found in specific regions, as derived from detailed yield surveys. In contrast, opium
37
production estimates at the turn of the 19th to the 20th century were mainly derived from a
detailed analysis of tax payments and other levies of opium poppy farmers to the authorities.
Such global opium production estimates reported in the proceedings of the Shanghai Opium
Commission, 1909, revealed e.g. a global opium production of 41,600 tons of opium for the
period 1906/07.5 For the year 1934 official reports by the League of Nations saw a global
opium production of some 16,600 tons. 6
Comparisons are further complicated by the fact that the legal status of opium production was
not always clear in the 19th century and the early decades of the 20th century, i.e. data
reported usually comprised both legal and illegal production of opium. Thus, long-term
comparisons should be made with estimates for legal and illegal opium production combined.
In addition to illegal production of some 7,610 tons in 2019, legal production of opium for
the manufacture of morphine in 2019 amounted to – based on preliminary estimates by the
International Narcotics Control Board – to some 279 tons in 2019 (produced on some 6,710
ha).
However, this calculation does not take into account that much of the licit source of morphine
production nowadays is in the form of poppy straw rather than in the form of opium as such.
The next question is how best to convert such poppy straw data into opium equivalents. One
possibility is to calculate the morphine produced out of the poppy straw and to find out how
much opium would have been needed to produce such amounts of morphine. The
International Narcotics Control Board reported for 2017 a global cultivation of poppy straw
on 82,104 ha, resulting in a licit production of 35,063 tons of poppy straw for the extraction
of morphine.
Due to a slightly higher production in previous years, a total of 35,687 tons of poppy straw
was used for the further processing into morphine in 2018, including 34,023 tons for the
manufacture of an anhydrous morphine alkaloid concentrate of poppy straw containing
morphine as the main alkaloid (AMA) and 1,664 tons for the direct conversion of poppy
straw into morphine. Globally, 321 tons of morphine out of AMA and 9tons of morphine
directly out of poppy of morphine were manufactured in 2018, i.e. in total 330 tons of
5 UNODC, A Century of International Drug Control, 2009), based on data reported by the International Opium Commission (Report of the International Opium Commission, Shanghai, China), Feb. 1909. 6 UNODC, A Century of International Drug Control, 2009.

38
morphine out of 35,667 tons of poppy straw. Given an overall slightly lower poppy straw
production of 35,063 tons in 2018 (i.e. 98 per cent of the poppy straw used in the
manufacture of morphine in that year) , one can assume that this would have been sufficient
to have produced 315 tons of morphine (321*0.98) in 2018. However, there are indications
that the area under poppy straw cultivation actually increased from 82,104 ha in 2018 to
146,638 ha in 2019 which – using average ratios over the last five year – might have
increased morphine manufacture to . Preliminary estimates suggest that – given increases in
the area under cultivation - as much as 473 tons of morphine might have been extractable out
of a potential production 68,311 tons of poppy straw in 2019. (The latter numbers may,
however, still change as better data become available).
The INCB report also shows that out of 693 tons of opium used in 2018t for the manufacture
of morphine, 55 tons of morphine were obtained in that year, equivalent to a yield of 7.9 per
cent in 2018. If a 10-year period were used instead, the average yield would have amounted
to 9.5 percent.. Applying such a yield to the 473 tons of morphine potentially obtained from
poppy straw production suggests that some 5,041 tons of opium may have been needed to
produce such a quantity of morphine. This would suggest that legal opium production may
have amounted to some 5,320 tons in 2019 (i.e. 279 tons of opium plus 5,041 tons of poppy
straw converted into opium equivalents). This would have to be added to the illicit opium
production of 6,610 in 2019 tons to arrive at an overall opium production of –- some 12,900
tons in 2019. These are still preliminary estimates – but they should reflect reasonable
orders of magnitude. In last year’s World Drug Report, the preliminary total for 2018 was
estimated at 12,100 tons while the final total for 2018 turned out to be 11,900 tons (a
difference of 1 per cent). In any case, the preliminary estimates for the year 2019 (12,900
tons) are slightly higher than those identified for the year 2018.
Such licit and illicit opium production estimates for 2019 – though one of the highest over
the last two decades (only the estimate for 2017 was with 13,500 tons still higher) – are,
nonetheless, significantly lower than the opium production estimates reported for the year
1906/07 (41,600 tons of opium) and still less than the licit and illicit opium production
estimates reported for the year 1934 (16,600 tons) even though direct comparability remains
limited due to changes in the methodologies used.
Global opium production, 1906-2019
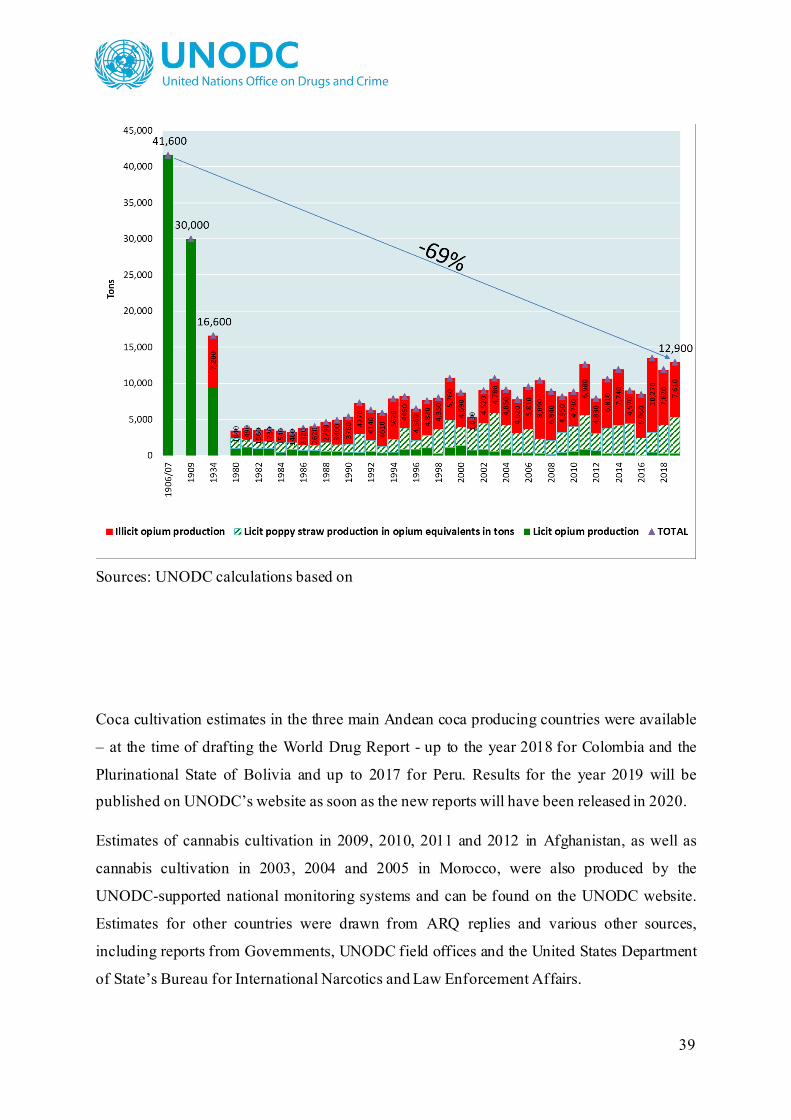
39
Sources: UNODC calculations based on Report of the International Opium Commission, Shanghai, China, Feb. 1909, Vol. II, INCB, Narcotics Report, Narcotic Drugs 2019 (and previous years), UNODC, A Century of International Drug Control (2009), UNODC, World Drug Report 2019 and previous years.
Coca cultivation estimates in the three main Andean coca producing countries were available
– at the time of drafting the World Drug Report - up to the year 2018 for Colombia and the
Plurinational State of Bolivia and up to 2017 for Peru. Results for the year 2019 will be
published on UNODC’s website as soon as the new reports will have been released in 2020.
Estimates of cannabis cultivation in 2009, 2010, 2011 and 2012 in Afghanistan, as well as
cannabis cultivation in 2003, 2004 and 2005 in Morocco, were also produced by the
UNODC-supported national monitoring systems and can be found on the UNODC website.
Estimates for other countries were drawn from ARQ replies and various other sources,
including reports from Governments, UNODC field offices and the United States Department
of State’s Bureau for International Narcotics and Law Enforcement Affairs.
40
A full technical description of the methods used by UNODC-supported national monitoring
systems can be found in the respective national survey reports available at
https://www.unodc.org/unodc/en/crop-monitoring/index.html
Net cultivation
Not all the fields on which illicit crops are planted are actually harvested and contribute to
drug production. For Afghanistan, a system of monitoring opium poppy eradication is in
place which provides all necessary information to calculate the net cultivation area. In
Myanmar and the Lao People’s Democratic Republic, only the area of opium poppy
eradicated before the annual opium survey is taken into account for the estimation of the
cultivation area. Not enough information is available to consider eradication carried out after
the time of the annual opium survey.
A major difference between coca and other narcotic plants such as opium poppy and cannabis
is that the coca bush is a perennial plant which can be harvested several times per year. This
longevity of the coca plant should, in principle, make it easier to measure the area under coca
cultivation. In reality, the area under coca cultivation is dynamic, making it difficult to
determine the exact amount of land under coca cultivation at any specific point in time or
within a given year. There are several reasons why coca cultivation is so dynamic, including
new plantation, abandonment, reactivation of previously abandoned fields, manual
eradication and aerial spraying.7
The issue of different area concepts and data sources used to monitor illicit coca bush
cultivation was repeatedly investigated by UNODC. 8 To improve the comparability of
estimates between countries and years, since 2011 net coca cultivation area at 31 of
December is presented not only for Colombia but also for Peru. For technical reasons, the
initial area measurement of coca fields takes place on satellite images acquired at different
dates of the year and sometimes having different technical specifications. For the
Plurinational State of Bolivia, in contrast, most satellite images are taken close to the 31 of
December in order to reduce potential errors linked to subsequent eradication. In any case, for
7 Plant disease and pests are not considered here as their impact is likely to be captured in the coca leaf yield estimates. 8 See World Drug Report 2011, p. 262.

41
the Bolivian and Peruvian estimate, these differences are considered to have a limited effect
only, whereas the dynamic situation in Colombia requires more adjustments to maintain year-
on-year comparability. For more details, please see the country specific reports.
Indirect estimation of illicit opium poppy cultivation
Eradication and plant seizure reports indicate that illicit opium poppy cultivation exists in
many countries, which do not regularly conduct illicit crop surveys. Starting 2008 a new
methodology was introduced to estimate the extent of this illicit cultivation with an indirect
method based on two indicators available in UNODC’s databases: eradicated poppy area and
opium poppy (plant, capsule) seizures reported as units or weight.
Prioritization of data sources: Whenever possible, the eradicated poppy area was used as this
indicator is conceptually closest. If this indicator was not available, poppy plant seizure data
was used, which requires an additional conversion of the seized amount into area eradicated.
It can be assumed that plant seizures are often a different way of recording eradication. e.g. in
cases where area measurements are technically difficult or because the law requires all seized
material to be weighed even if the seizure consists actually of eradicated plants on a field.
Large-scale or long-distance illicit trade with opium poppy plants is unlikely as the plants are
bulky, perishable and of low value.
Eradication factor: Evidence from countries which provide both illicit cultivation and
eradication data indicates that illicit cultivation is typically a multiple of the area eradicated.
This relationship, averaged over the last five years for which information is available, was
used to calculate a factor which allowed to estimate illicit cultivation in countries from
eradication figures. Since 2008, this factor is based on opium poppy cultivation and
eradication data from Colombia, Lao People’s Republic, Mexico, Myanmar, Pakistan,
Thailand and Guatemala. Over the years, the average over these five countries ranged
between 2.1 and 3.0 (eradicated area * factor = net cultivation area). (Afghanistan was not
considered for the calculation of the factor as the objective was to estimate low to mid-levels
of illicit cultivation. Afghanistan, representing two thirds or more of global illicit poppy
cultivation, clearly fell outside this range).

42
Plant seizures: seizures of poppy plant material usually happen close to the source, i.e. in
vicinity of the cultivated area. The data available to UNODC does not allow to accurately and
systematically differentiate between the various parts (capsules, bulbs, entire plants) of the
plant seized as for plant seizures. Most (roots, stem, leaves, capsules) or only some parts
(poppy straw, capsules only) of the plant may be seized. While this does not influence seizure
data given in plant units, it plays a role when interpreting seizure data given as weight
Plant seizure data in units represent plant numbers, which can be converted into area (ha)
using an average number of opium poppy plants per hectare. Yield measurements from
Afghanistan and Myanmar, where UNODC has conducted yield surveys over several years,
indicate an average figure of about 190,000 plants per hectare. Dividing poppy plant seizure
numbers by this factor results in estimate of the area on which the seized material was
cultivated. This is equivalent to eradicated area, as the seized material was taken out of the
production cycle. Eradicated area multiplied with the eradication factor described above
yields then cultivation area.
Plant seizure data reported as weight: In order to convert the weight of seized poppy plants
into area, a typical biomass per hectare of poppy was estimated based on the evaluation of
various sources. The biomass yield in oven-dry equivalent including stem, leaves, capsule
and seeds reported by a commercial licit opium poppy grower in Spain9 was 2,800 kg/ha for
rain-fed and 7,800 kg/ha for irrigated fields respectively. Information on the weight of roots
was not available. Loewe10 found biomass yields between 3,921 kg/ha to 5,438 kg/ha in trial
cultivation under greenhouse conditions. Acock et al.11 found oven-dry plant weights of
about 37 grams including roots in trials under controlled conditions corresponding to a
biomass yield of around 7,000 kg/ha with the assumed plant density of 190,000/ha. Among
the available biomass measurements only the figures from Spain referred to poppy grown
under field conditions. All other results fell into the range between the non-irrigated and
irrigated biomass yields (2,800 – 7,800 kg/ha) reported. For purposes of this calculation the
simple average of these two values was taken.
9 Personal communication, 2010, from Alcaliber company. 10 Personal communication, 2010, see also Loewe, A. (2010). Remote Sensing based Monitoring of Opium Cultivation in Afghanistan. Philosophische Fakultaet. Bonn, Rheinische Friedrich-Wilhelms-Universitaet: 106. 11 Acock, M. C., R. C. Pausch, et al. (1997). “Growth and development of opium poppy (Papaver Somniferum L.) as a function of temperature.” Biotronics 26: 47-57.

43
Two caveats have to be made: a) As the reporting format does not differentiate between
capsules and plants or between the different growth stages of a poppy plant, it was assumed
that the reported weight refers to whole, mature plants. This leads to a conservative estimate
as many plant seizures are actually carried out on fields before the poppy plants reach
maturity. b) The reference biomass measurements from scientific studies are expressed in
oven-dried equivalents, whereas the reported weights could refer to fresh weight or air-dry
weight; both of which are higher than the oven-dry equivalent weight equivalent. This would
lead to an over-estimation of the illicit cultivation area. In the case of young plants, which are
typically fresh but not yet fully grown, both errors could balance off, whereas in the case of
mature or harvested plants, which tend to be drier, both errors would be smaller.
In order to avoid the fluctuations typically present in seizure and eradication data, the above
calculations were based on plant seizures averaged over the most recent five-year period,
rather than datapoints relative to the specific year. If no eradication or plant seizure was
reported in that period, no value was calculated.
Yield12 and production
To estimate potential production of opium, coca leaf and cannabis (herb and resin), the
number of harvests per year and the total yield of primary plant material has to be
established. The UNODC-supported national surveys take measurements in the field and
conduct interviews with farmers, using results from both to produce the final data on yield.
Opium yield surveys are complex. Harvesting opium with the traditional lancing method can
take up to two weeks as the opium latex that oozes out of the poppy capsule has to dry before
harvesters can scrape it off and several lancings take place until the plant has dried. To avoid
this lengthy process, yield surveyors measure the number of poppy capsules and their size in
sample plots. Using a scientifically developed formula, the measured poppy capsule volume
indicates how much opium gum each plant potentially yields. Thus, the per hectare opium
yield can be estimated. Different formulas were developed for South-East and South-West
Asia. In Afghanistan, yield surveys are carried out annually; in Myanmar regularly.
12 Further information on the methodology of opium and coca leaf yield surveys conducted by UNODC can be found in United Nations (2001): Guidelines for Yield Assessment of Opium Gum and Coca Leaf from Brief Field Visits, New York (ST/NAR/33).
44
For coca bush, the number of harvests varies, as does the yield per harvest. In the
Plurinational State of Bolivia and Peru, UNODC supports monitoring systems that conduct
coca leaf yield surveys in several regions, by harvesting sample plots of coca fields over the
course of a year, at points in time indicated by the coca farmer. In these two countries, yield
surveys are carried out only occasionally, due to the difficult security situation in many coca
regions and because of funding constraints. In Colombia, coca leaf yield estimates are
updated yearly through a rotational monitoring system introduced in 2005 that ensures that
every yield region is revisited about every three years. However, as the security situation does
not allow for surveyors to return to the sample fields, only one harvest is measured, and the
others are estimated based on information from the farmer. In 2013 for the first time the
concept of productive area was applied to calculate the coca leaf yields in Colombia, taking
into account the dynamics of the fields due to spraying and eradication for which some fields
are only partly productive during the year. This new way of calculating was retroactively
applied to the results of 2005-2012, giving slightly different results than published before 13.
In Peru and Bolivia the additional production of partly productive areas is not considered for
the coca leaf yield estimates.14
Conversion factors
The primary plant material harvested - opium in the form of gum or latex from opium poppy,
coca leaves from coca bush, and the cannabis plant - undergo a sequence of extraction and
transformation processes, some of which are done by farmers onsite, others by traffickers in
clandestine laboratories. Some of these processes involve precursor chemicals and may be
done by different people in different places under a variety of conditions, which are not
always known. In the case of opium gum, for example, traffickers extract the morphine
contained in the gum in one process, transform the morphine into heroin base in a second
process, and finally produce heroin hydrochloride. In the case of cocaine, coca paste is
produced from either sun-dried (in the Plurinational State of Bolivia and Peru) or fresh coca
leaves (in Colombia), which is later transformed into cocaine base, from where cocaine
hydrochloride is produced.
13 More information on the results of the methodology used can be found in the report on coca cultivation in Colombia for 2013 (UNODC/ Government of Colombia, June 2014) available on the internet at http://www.unodc.org/unodc/en/crop-monitoring/index.html. 14 In 2013 a correction factor was applied for the time that fields in Peru were productive during the year, however this approach was abolished as of 2014 due to incomplete eradication data. More information about the 2013 calculation to be found at page 73 of the Peru coca cultivation survey report for 2013 available on the internet at http://www.unodc.org/unodc/en/crop-monitoring/index.html.

45
The results of each step, for example from coca leaf to coca paste, can be estimated with a
conversion factor. Such conversion factors are based on interviews with the people involved
in the process, such as farmers in Colombia, who report how much coca leaf they need to
produce 1 kg of coca paste or cocaine base. Tests have also been conducted where so-called
‘cooks’ or ‘chemists’ demonstrate how they do the processing under local conditions. A
number of studies conducted by enforcement agencies in the main drug-producing countries
have provided the orders of magnitude for the transformation from the raw material to the
end product. This information is usually based on just a few case studies, however, which are
not necessarily representative of the entire production process. Farmer interviews are not
always possible due to the sensitivity of the topic, especially if the processing is done by
specialists and not by the farmers themselves. Establishing conversion ratios is complicated
by the fact that traffickers may not know the quality of the raw material and chemicals they
use, which may vary considerably; they may have to use a range of chemicals for the same
purpose depending, on their availability and costs; and the conditions under which the
processing takes place (temperature, humidity, et cetera) differ.
It is important to take into account the fact that the margins of error of these conversion ratios
– used to calculate the potential cocaine production from coca leaf or the heroin production
from opium - are not known. To be precise, these calculations would require detailed
information on the morphine content of opium or the cocaine content of the coca leaf, as well
as detailed information on the efficiency of clandestine laboratories. Such information is
limited. This also applies to the question of the psychoactive content of the narcotic plants.
UNODC, in cooperation with Member States, continues to review coca leaf to cocaine
conversion ratios as well as coca leaf yields and net productive area estimates.15 More
research is needed to establish comparable data for all components of the cocaine production
estimate.
Many cannabis farmers in Afghanistan and Morocco conduct the first processing steps
themselves, either by removing the upper leaves and flowers of the plant to produce cannabis
herb or by threshing and sieving the plant material to extract the cannabis resin. The herb and
resin yield per hectare can be obtained by multiplying the plant material yield with an
extraction factor. The complex area of cannabis resin yield in Afghanistan was investigated in
15 More detailed information on the ongoing review of conversion factors was presented in the 2010 World Drug Report, p.251 ff.
46
2009, 2010, 2011 and 2012. The yield study included observation of the actual production of
resin, which is a process of threshing and sieving the dried cannabis plants. In Morocco, this
factor was established by using information from farmers on the methods used and on results
from scientific laboratories. Information on the yield was obtained from interviews with
cannabis farmers. 16 Given the high level of uncertainty and the continuing lack of
information for the large majority of cannabis-cultivating countries, the estimates of global
cannabis herb and resin production have not been calculated
Potential production
‘Potential’ heroin or cocaine production refers to total production of heroin or cocaine if all
the cultivated opium or coca leaf, less the opium and coca leaf consumed as such, were
transformed into the end products in the respective producer country in the same year.
It should be noted though that a product such as opium can be stored for extended periods of
time and be converted into intermediate or final products long after the harvest year. Thus
‘actual’ heroin manufacture, making use of accumulated stocks of opium from previous
years, can deviate significantly from ‘potential’ heroin manufacture out of the opium
produced in a specific year.
Direct consumption of opium or the coca leaf, in contrast, is being taken into account. For
example, consumption of coca leaf considered licit in the Plurinational State of Bolivia and
Peru is deducted from the amounts of coca available for the transformation into cocaine.
Other factors, such as the actual amount of illicit coca paste or opium consumption and
storage, are difficult to estimate and were not taken into account. Similarly, opium consumed
in Afghanistan and neighbouring countries is deducted from the amounts of opium available
for heroin production. In contrast, opium stocked or opium used from stocks accumulated
over previous years is not considered in the calculation of ‘potential’ heroin manufacture.
16 For greater detail on studies with cannabis farmers, see: UNODC, Enquête sur le cannabis au Maroc 2005, Vienna, 2007.

47
For cocaine, potential production of 100 per cent pure cocaine is estimated. In reality,
clandestine laboratories do not produce 100 per cent pure cocaine but cocaine of lower purity
which is often referred to as ‘export quality’.
For heroin, two conversion ratios are used. Apart from Afghanistan, not enough information
is available to estimate the production of heroin at 100 per cent purity. Instead, potential
production of export quality heroin is estimated, whose exact purity is not known and may
vary. For Afghanistan, the calculations are more detailed. Here the share of all opium
converted to heroin is estimated and a specific conversion ratio is applied, which uses an
estimated purity for heroin of export quality, derived from wholesale purities found in other
countries in the neighbourhood .
Although it is based on current knowledge on the alkaloid content of narcotic plants and the
efficiency of clandestine laboratories, it should be noted that ‘potential production’ is a
hypothetical concept and is not an estimate of actual heroin or cocaine production at the
country or global level. The concept of potential production is also different from the
theoretical maximum amount of drug that could be produced if all alkaloids were extracted
from opium and coca leaf. The difference between the theoretical maximum and the potential
production is expressed by the so-called laboratory efficiency, which describes which
proportion of alkaloids present in plant material clandestine laboratories are actually able to
extract.
Colombia
From 2013 onwards, the yearly productive areas were estimated, instead of using the average
area under coca cultivation of the reporting year and the previous year (the approach used in
previous reports). In addition, a different conversion factor for estimating cocaine base was
applied. Both the adjustment of the productive area estimate and the estimation of the
conversion factor for cocaine base were retroactively applied to the results of 2006-2012.17
In 2019, the overall conversion ratios from coca leaf production to the manufacture of
cocaine hydrochloride in Colombia were reviewed and the results of this review were
17 More information on the results of the two approaches and the methodology used can be found in annex 3 of the report on coca cultivation in Colombia for 2013 (UNODC/ Government of Colombia, June 2014) available on the internet at http://www.unodc.org/unodc/en/crop-monitoring/index.html and in UNODC and Gobierno de Colombia, Colombia, Monitoreo de territorios afectados por cultivos ilícitos 2015, July 2016, available on the internet at: https://www.unodc.org/documents/crop-monitoring/Colombia/Monitoreo_Cultivos_ilicitos_2015.pdf .

48
retroactively applied to the results from Colombia for the years 2014 to 2018. This review
became necessary as due to changes in the overall political context of the country, farmers –
often without in-depth knowledge of chemistry – got increasingly involved in the
manufacture of coca paste and cocaine base, resulting in overall efficiency losses. At the
same time, several of the larger cocaine manufacturing facilities operated by professional
chemists showed efficiency gains.
The net result was still a loss in the overall efficiency as compared to a decade ago (and thus
a downward revision of cocaine manufacturing estimates for Colombia over the period 2014-
2018), going hand in hand with rising levels of efficiency in the manufacturing of cocaine
identified over the period 2014-2018.
Estimates of cocaine hydrochloride manufacture in Colombia (tons), 2005-2018
Estimated cocaine manufacture prior to the review of conversion ratios Estimated cocaine manufacture following the review of conversion ratios
Source: UNODC and Gobierno de Colombia, Monitoreo de territorios afectados por cultivos ilícitos 2018
(August 2019).
a Years to which the revised conversion ratios were applied.
Peru
Potential cocaine production in Peru is estimated from potential coca leaf production and
after deducting the amount of coca leaf estimated to be used for traditional purposes
according to Government sources (9,000 mt of sun-dry coca leaf).
The Plurinational State of Bolivia

49
Potential cocaine production in the Plurinational State of Bolivia is estimated from potential
coca leaf production after deducting the amount of coca leaf produced on 12,000 ha in the
Yungas of La Paz where coca cultivation has been for years authorized under national law.
“Old” versus “new” conversion ratios for cocaine
In previous World Drug Reports, cocaine estimates based on the “old” and the “ new”
conversion ratios were shown. In this report only the results based on the “new” conversion
ratios were shown in the cocaine chapter in booklet 3 while in booklet 4 in the chapter on
market changes estimates based on the “old” conversion ratios were still shown for the years
in which no estimates based on the “new” conversion ratios have been available.
In order to estimate cocaine production from the area under coca cultivation, the coca leaf
yield per region is estimated based on yield studies as well as – based on experiments in the
field - the coca-leaf to coca-paste conversion, the coca-paste to cocaine base conversion and
the cocaine-base to cocaine hydrochloride conversion. The results are then adjusted to show
an overall conversion ratio from coca leaf to (a potential) 100 per cent pure cocaine
hydrochloride.
The ‘old’ conversion ratios from coca leaf to cocaine hydrochloride are based on studies
conducted by the United States Drug Enforcement Administration (DEA) in the Andean
region in the 1990s. The ratios for Colombia – in close cooperation with the Colombian
authorities - were updated in 2004 and are part of the ‘old’ conversion ratio series.
In subsequent years the DEA undertook new studies in Peru (2005) and in the Plurinational
State of Bolivia (2007-2008), following indications that the laboratory efficiency in these
countries may have improved. The ‘new’ conversion rates used in this report – for the years
2007-2018 – however, have not been reconfirmed so far in national studies as funds for such
studies have not been forthcoming. For this reason, cocaine production data are not shown
separately for Peru and the Plurinational State of Bolivia; only the global total based on the
‘new’ conversion ratio is shown. The calculations of cocaine production based on the “new”
conversion ratios refer to the “new” coca leaf to cocaine hydrochloride transformation ratios
found by the DEA for Colombia, Peru and the Plurinational State of Bolivia and the updated
ratios for Colombia. It should be noted that the ‘new’ conversion ratios are still temporary;

50
they will be updated as soon as new data, jointly established between the respective Member
States and UNODC will become available (for more details, see World Drug Report 2010
(United Nations publication, Sales No. E.10.XI.13, pp. 251 and 252).
.
4. Drug trafficking
Seizures
The analysis presented in this report is mainly derived from the ARQ responses from
Member States up to the 2018 reporting year. Including information from other sources,
UNODC was able to obtain seizure data from 121 countries and territories for 2018. Over the
2014-2018 period seizures from in total 154 countries and territories were obtained. Seizures
are thus the most comprehensive indicator of the drug situation and its evolution at the global
level. Although seizures may not always reflect trafficking trends correctly at the national
level, they tend to show reasonable representations of trends at the regional and global levels.
Seizures are reported in volume terms as well as in terms of the number of seizure cases. The
analysis of seizure cases enables a direct comparison of data across drug categories. Reporting
of seizure cases is, however, less comprehensive. A total of 75 countries and territories
reported seizure cases to UNODC in 2018, or 102 countries and territories over the 2014-2018
period.
Countries reporting seizures of drug in volume terms may report seizures using a variety of
units, primarily by weight (kg) but also in litres, tablets, doses, blotters, capsules, ampoules,
et cetera. When reporting about individual countries in individual years, UNODC endeavours
to be as faithful as possible to the reports received, but often it is necessary to aggregate data
of different types for the purposes of comparison. For the aggregation, conversion factors are
used to convert the quantities into ‘kilogram equivalents’ (or ‘ton equivalents’). UNODC
continues to record and report the disaggregated raw data, which are available in the seizure
listings published at: http://www.unodc.org/unodc/en/data-and-analysis/WDR.html In these
51
tables, seizure quantities are reproduced as reported. In the rest of the Report, seizure data are
often aggregated and transformed into this unique unit of measurement. Moreover, at some
points in the analysis, purity adjustments are made where relevant and where the availability
of data allows.
The conversion factors affect seizure totals of amphetamine-type stimulants (ATS), as a
significant share of seizures of these drug types is reported in terms of the number of tablets.
Apart from seizures of ATS tablets, drug seizures are mainly reported to UNODC by weight,
and sometimes by volume. This includes seizures of ATS which are not seized in tablet form
(for example, ATS in powder, crystalline or liquid form) as well as seizures of other drug
types, such as heroin and cocaine. Moreover, ATS seizures made in tablet form are also
sometimes reported by weight, and in some cases, the reported total aggregated weight
possibly includes ATS seized in different forms. Reports of seizures by weight usually refer
to the bulk weight of seizures, including adulterants and diluents, rather than the amount of
controlled substance only. Moreover, given the availability of data, accurate purity
adjustments for bulk seizure totals in individual countries are feasible in only a minority of
cases, as they would require information on purity on a case by case basis or statistically
calibrated data, such as a weighted average or a distribution. The bulk weight of tablets is
easier to obtain and less variable.
To ensure the comparability of seizure totals across different years and countries, UNODC
uses conversion factors for ATS tablets intended to reflect the bulk weight of the tablets
rather than the amount of controlled substance. The factors used in this edition of the World
Drug Report are based on available forensic studies and range between 90 mg and 300 mg,
depending on the region and the drug type, and also apply to other units which are presumed
to represent a single consumption unit (dose). The table below lists the factors used for ATS,
by type and region. The conversion factors remain subject to revision as the information
available to UNODC improves.

52
Weight of tablets in milligramsEcstasy (MDMA or analogue)
Amphetamine Methamphetamine Prescription stimulants
Other stimulants
Non-specified amphetamines
Africa 271 250 250 250 250 250Asia (excluding Near and Middle East/ South-West Asia) 300 250 90 250 250 250Europe 271 253 225 250 250 250Central and South America and Caribbean 271 250 250 250 250 250Near and Middle East/ South-West Asia 237 170 250 250 250 250North America 250 250 250 250 250 250Oceania 276 250 250 250 250 250
For the other drug types, the weight of a ‘typical consumption unit’ was assumed to be: for
cannabis herb, 500 mg; for cannabis resin, 135 mg; cocaine and morphine, 100 mg; heroin,
30 mg; LSD, 0.05 mg (50 micrograms); and opium, 300 mg. For opiate seizures (unless
specified differently in the text), it was assumed that 10 kg of opium were equivalent to 1 kg
of morphine or heroin. Though these transformation ratios can be disputed, they provide a
means of combining the different seizure reports into one comprehensive measure. The
transformation ratios have been derived from those normally used by law enforcement
agencies, in the scientific literature and by the International Narcotics Control Board, and
were established in consultation with UNODC’s Laboratory and Scientific Section. As in
previous editions of the World Drug Report, seizures quantified by volume (litres) are
aggregated using a conversion ratio of 1 kilogram per litre, which applies to all drug types.
Cannabis plants are assumed to have an average weight of 100 grams.
Overall 31.6 tons of tramadol, 37.9 tons of codeine and 2.9 tons of fentanyl were seized in
2018 as well as 0.2 tons of other pharmaceutical opioids. Such seizure figures, however, may
be misleading as doses across pharmaceutical opioids vary significantly.
Directly comparable doses are, however, difficult to identify. The most comprehensive data
set in this regard are the defined daily doses for statistical purposes (S-DDD), established –
with the help of experts - by the INCB. For the transformation of seizures of pharmaceutical
opioids into doses such S-DDD, shown in milligrams of various substances per day, were
used:
Substance S-DDD in mg

53
Source: INCB, Narcotic Drugs 2019 (New York 2020).

54
For buprenorphine, a S-DDD of 8 mg - as reported by the INCB in its annual report on
Psychotgropic Substances18 - was used.
No such conversion ratios, however, have been established by the INCB for tramadol as this
substance is not under international control. In this case, a review of doses provided in the
literature ranged from 50 to 400 mg per day with a median of around 250 mg per day.
(Tramadol tablets typically contain between 50 and 250 mg, i.e. the median daily dose would
be equivalent to between 1 and 5 tablets, depending on the strength of the tablet). This ratio
can be used as the best estimate for converting reported seizures into daily doses of seized
drugs.
Expressed in kilogram equivalents (applying the conversion ratios mentioned above), 52 per
cent of global quantities of pharmaceutical opioids seized in 2018 affected codeine, 43 per
cent tramadol and 4 per cent fentanyl. However, transformed in dose equivalents, global
seizures of pharmaceutical opioids in 2018 appear to have been clearly dominated by fentanyl
(91 per cent of the total), followed by carfentanyl (4 per cent), codeine (3 per cent) and
tramadol (2 per cent).
Distribution of global seizures of pharmaceutical opioids, 2018
Seizures in kg in 2018
Distribution (based on seizures in kg)
S-DDDs (mg per dose)
S-DDDs (incl. estimates for non-defined substances)
Seizures in S-DDDs in 2018
Distribution (based on seizures in S-DDDs)
Codeine 37,866 52% 250 250 15,146 3%
Tramadol 31,576 43% 250 250 12,630 2%
Fentanyl 2,940 4% 0.6 0.6 490,043 91%
Methadone 134 0% 25 25 537 0%
(blank) 44 0% 86 51 0%
Vicodin (hydrocodone) 20 0% 15 15 133 0%
Buprenorphine 5 0% 8 8 68 0%
Oxycodone 4 0% 75 75 6 0%
Hydromorphone 3 0% 20 20 14 0%
Other substitution products 2 0% 86 3 0%
Mephenon (Methadone) 2 0% 25 25 7 0%
Carfentanyl 1 0% 0.006 0.006 22,247 4%
DHC (Dihydrocodone) 1 0% 100 100 1 0%
Oxycontin (oxycodone) 1 0% 75 75 1 0%
18 INCB, Psychotropic Substances 2019 (New York 2020).

55
Suboxone (buprenorphine) 1 0% 8 8 7 0%
Subutex (buprenorphine) 0 0% 8 8 2 0%
Hydrocodone 0 0% 15 15 0 0%
Tapentadol (Nucynta, Palexia, Tapal) 0 0% 250 250 0 0%
Pentazocine 0 0% 333 333 0 0%
Unweighted average 86
Grand Total 72,600 100% 540,895 100%
Source: UNODC calculations based on UNODC, responses to the annual report questionnaire, INCB, Narcotic Drugs 2019 (New York 2020) and INCB, Psychotropic Substances 2019 (New York 2020).
One important caveat, however, needs to be made. Most of the quantities of fentanyl seizures
have been reported form the United States (86 per cent of the global total in 2018). While
fentanyl directly imported from China had typically purity levels above 90 per cent, fentanyl
trafficked overland into the United States from Mexico had usually purity levels of clearly
less than 10 per cent. Overall, the United States reported very high levels of dilutions of
fentanyl found on its black market, resulting in average fentanyl purity levels of just 5.3 per
cent in this country in 2018 ‒ though with a broad range from 0.1 to 96.8 per cent. . Applying
such purity data for fentanyl seized in the USA while assuming that close to 100 per cent
pure fentanyl may have been seized in other countries, the average fentanyl purity worldwide
would have amounted to some 19 per cent in 2018. Applying such a purity level to global
fentanyl seizures, would still show a dominance of global fentanyl seizures, though its
proportion in global seizures of pharmaceutical opioids would fall to some some 64 per
centas compared to 11 per cent for codeine and 9 per cent for tramadol in 2018.
Trafficking routes and volumes
Information of trafficking routes was mainly obtained from analyses of reports by Member
States in the annual report questionnaire and in individual drug seizures reported to UNODC,
as well as analyses of trafficking routes reported by Member States.
Individual drug seizures would be the ideal data source for any in-depth analysis of drug
flows. Unfortunately, reporting of individual drug seizure cases is very uneven. An average
of 53 Member States reported individual drug seizures every year over the 2014-2018 period,
and a significant portion do not provide information on trafficking routes or do so in a very
limited manner.

56
Information for the maps was thus – primarily – based on information contained in the annual
reports questionnaire, while individual drug seizures reports and official national documents
were used to fill gaps. Two types of maps were published in the World Drug Report for each
of the analysed drug types (heroin and cocaine): one based solely on seizures, and another
based on both seizures and available drug use information.
Main trafficking routes as described by reported seizures
First of all, seizures made in the various regions over the 2014-2018 period were used as a
proxy for the importance of drug trafficking activities. Such seizures were distributed
according to the countries of departure and transit mentioned by countries in the various
regions for the period 2014-2018 (outside of the regions analysed), as weighted by the total
reported seizures at the national level. This served as a basis for the calculation of (likely)
importance of the various trafficking flows, taking into account that drugs could be seized at
different stages along the trafficking route and drugs may need to travel across several sub-
regions to reach the seizing country.
A similar approach was implemented using the countries of intended destination reported by
the seizing Member States. Afterwards, the flows obtained from using reported
departure/transit and destination information separately were put together to estimate the final
relative size of the flow. This procedure was implemented at the sub-regional level to
produce a matrix of flows across sub-regions. Afterwards, the main countries of departure or
transit (and destination) were identified based on the weighted amounts that were seized
while being trafficked from (to) them, according to reported seizures by Member States.
Main trafficking flows based on use and seizures data
Given the underground nature of drug trafficking, it is virtually impossible to obtain a full
picture with reliable data on the routes used by traffickers and the volumes that these
represent. Seizures data is used as a proxy, but it has many limitations, notably the fact that
different regions and countries differ in their seizing capacities, which could result in biases
when using solely this type of information. Therefore, using other sources of data and
triangulating the available information, could help paint a more complete picture. In this
context, these maps were created using available seizures and drug use data.
57
While ideally this methodology would make use of consumption information (e.g., average
annual consumption per user or per capita), this data is extremely scarce and available only in
a very limited number of countries. Hence, information reported on the prevalence of heroin
and cocaine was used to establish the share of drugs consumed at the global level that each
sub-region represents.
Based on these sub-regional consumption levels, for each type of drug, the matrix of flows at
the sub-regional level created in the map described above was used to estimate the flows
between sub-regions necessary to satisfy these consumption needs (and for further transit to
other consuming sub-regions). This procedure was done in an iterative manner to account for
the different steps of trafficking across sub-regions.
Drug price and purity data
Price and purity data, if properly collected and reported, can be powerful indicators of market
trends. Trends in supply can change over a shorter period of time when compared with
changes in demand and shifts in prices and purities are relatively good indicators for
increases or declines of market supply. Research has shown that short-term changes in the
consumer markets are first reflected in purity changes while prices tend to be rather stable
over longer periods of time. UNODC collects its price data from the ARQ, and supplements
this data with other sources such as DAINAP, EMCDDA and Government reports. Prices are
collected at farm-gate level, wholesale level (‘kilogram prices’) and at retail level (‘gram
prices’). Countries are asked to provide minimum, maximum and typical prices and purities.
When countries do not provide typical prices/purities, for the purposes of certain estimates,
the mid-point of these estimates is calculated as a proxy for the ‘typical’ prices/purities
(unless scientific studies are available which provide better estimates). What is generally not
known is how data were collected and how reliable it is. Although improvements have been
made in some countries over the years, a number of law enforcement bodies have not yet
established a regular system for collecting purity and price data.
Prices are collected in local currency or in the currency in which the transactions take place
and are then converted by UNODC into US dollars for the purposes of comparability among
countries. The conversion into US dollars is based on official UN rates of exchange for the
year. If comparisons of prices, expressed in US dollars are made over different years it should

58
be noted that changes in such prices may be also influenced by changes in the exchange rates
and may not necessarily reflect changes in the local markets.
Standardized prices of cocaine and heroin in the United States and Western Europe
Some of the figures presented in the statistical annex Table 3 available in
http://www.unodc.org/wdr2019 can follow a different methodology than the one described
above.
For the case of heroin and cocaine prices in the 17 European countries in this Table, the
published prices correspond an average of the available prices for the specific year (e.g.,
“crack” and cocaine salts, or white and brown heroin), if more than one type of drug is
reported, or the typical value if only one price is reported by the country. In order to properly
calculate the weighted averages across the 17 European Member States, in those countries for
which no data is available, a “best estimate” is reported. This “best estimate” is based on: a)
the latest reported value, b) an interpolation between two reported values, or c) the midpoint
between the reported low and high observed prices (when a typical value is not available).
In order to properly reflect the prices faced by the population within these 17 countries, the
average prices are weighted by the population. A reported average price per gram in Euro is
also published based on the average exchange rates for the corresponding year, and the
reported units (gram for retail, kilogram for wholesale). Finally, the inflation-adjusted
weighted average is expressed in 2018 Euro, by deflating the prices using the Consumer Price
Index (CPI) published by Eurostat.
For the case of heroin and cocaine average prices at the retail level in the United States of
America, both series were reviewed this year given the availability of new data. Authorities
from the United States of America provided UNODC with newly available quarterly data on
the price and purity of cocaine and heroin at the retail level for the 2005-2018 period. The
average quarterly price for each of these years is reported. In the case of years prior to 2005,
the yearly trends from the previously published series are used to retropolate the price
available for 2005. These trends are based on ARQ data and data from ONDCP, 2015
National Drug Control Strategy - 2015 Data Supplement.
In the calculation of purity adjusted average heroin prices, the purity provided by national
authorities at the quarterly level are used for 2005-2018, while data available through the

59
ARQ or published in ONDCP, 2015 National Drug Control Strategy - 2015 Data Supplement
are used for previous years. In the calculation of purity adjusted cocaine prices, data from
ONDCP is also used up to the year 2004.
Inflation adjusted prices in the United States were deflated using the CPI, published by the
Bureau of Labor Statistics.
Related Documents