GLOBAL MIGRATION BAROMETER Sponsored by Western Union METHODOLOGY, RESULTS & FINDINGS August 2008 Prepared by the Economist Intelligence Unit

Welcome message from author
This document is posted to help you gain knowledge. Please leave a comment to let me know what you think about it! Share it to your friends and learn new things together.
Transcript

GLOBAL MIGRATION BAROMETER
Sponsored by Western Union
METHODOLOGY, RESULTS & FINDINGS
August 2008
Prepared by the Economist Intelligence Unit

EXECUTIVE SUMMARY Globalisation has been the most far-reaching economic and social force of the last 50 years. At its simplest, globalisation takes three forms: the free movement of goods, capital and labour. Of these, the movement of people is potentially the most controversial and the most personal: it has the power to transform not only economies but politics and public policy. It can also profoundly alter the way societies view themselves. Globalisation has resulted in a significant increase in migration flows. The United Nations estimates that the number of people worldwide who live abroad has increased from about 75m to 191m in the last four decades, bringing the issue of migration policy to centre stage. This is mainly because of the perception that an increase in migration drives down wages and employment opportunities, at the expense of the local population. At the same time, migration is essential to the smooth functioning of major industries, from agriculture and construction to medicine and information technology. Western Union commissioned the Economist Intelligence Unit to compile a migration index that ranks 61 countries by how attractive and accessible they are for migrants (the Global Migration Barometer), with a separate assessment of their need for migrants. The Economist Intelligence Unit developed the methodology behind the index, collected the data and scored the countries, with input from Western Union and an independent panel of migration experts. The index has been produced for 61 developed and emerging markets using a standard analytical framework. The model used to generate the index employs indicators that reflect the standard of living and economic development of a country, legislative policy and attitudes towards migration, and demographics and social welfare commitments. Many of the 32 indicators used to generate the index are based on quantitative data and have been drawn from national and international statistical sources. The others are qualitative in nature and have been produced by the Economist Intelligence Unit. Each of the indicators has been adjusted and weighted to produce a score of 0 to 100, where 100 represents the highest attractiveness, accessibility or need for migrants. The 61 countries have been ranked according to the scores they receive. With the exception of Hong Kong and Singapore, the top 10 countries by rank in the Global Migration Barometer are the advanced economies of North America, western Europe and Australasia. Seven of the top ten countries use English as their official language, the other three being Sweden, Norway and Belgium. In terms of Need for Migrants, all of the top 10 countries are in Europe, with the exception of Japan. This is largely because the ageing process is well underway in most advanced economies, as well as in the developing countries of eastern Europe and some Asian economies, highlighting the need for immigrants to supplement the workforce. The Economist Intelligence Unit bears responsibility for the migration index and for this report. The findings and conclusions expressed here do not reflect the views or opinions of Western Union. No data have been sourced from Western Union.
METHODOLOGY AND DATA SOURCES Definitions The migration model assesses three broad issues: A country’s Attractiveness to Migrants, its Accessibility for Migrants and its Need for Migrants. The first two themes have been aggregated into a single composite indicator—a Global Migration Barometer (GMB)—which captures a country’s appeal to migrants, as well as its attitudes towards migrants. A separate measure of a country’s Need for Migrants—which assesses a country’s ability to sustain economic growth based on its demographics and social welfare commitments—has been included for comparative purposes. The categories are defined as: 1. Global Migration Barometer (GMB) A composite of two categories: Attractiveness to Migrants and Accessibility for Migrants. Attractiveness to Migrants measures a country’s appeal to migrants, based on its economic and social environment. This category aims to capture migrant aspirations, rather than explain existing stocks of migrants. That is, the category assesses where migrants would choose to go, if there was free movement of labour and if geographic location was not an issue. Accessibility for Migrants measures ease of entry, integration and the legal environment for migrants in the host (emigrant) country. The definition of a country’s accessibility is not restricted to the ease of obtaining a work permit: other pertinent issues include public attitudes to migration and the steps that host country governments take to safeguard the rights of migrants and facilitate their integration in the host country. 2. Need for Migrants This category assesses a country’s possible need for migrants, in order to sustain economic growth. For example, it examines the contingent impact that an increase in the pension-age population or high social welfare commitments will have on a country’s ability to maintain living standards. It measures need outside the current stock of migrants, and apart from net migration flows. Several of the indicators in this category are forward looking, capturing both present and future need. As this category assesses a possible need for labour in the future, governments have an opportunity to address the shortages not only by importing labour but also through policy responses aimed at drawing greater numbers of host country nationals into the labour force. For example, countries with low rates of female labour participation may try to implement policies designed to make it easier for women to join the workforce, such as the public provision of childcare. Other measures may include an increase in the retirement age or the restructuring of pension and healthcare systems—the introduction of private insurance would take the pressure off public finances.

Country Choice The 61 countries assessed in the model have been chosen on the following basis:
• Large existing stock of migrants in host country • Anticipation of large migrants flows based on leading indicators, such as
evidence of labour shortages and increasing remittances • Important regional economy or hub
We have chosen a representative sample from each geographical region. However, our choice of countries has in some cases been restricted by data availability. We have used the United Nations’ definition of a long-term international migrant, which is “a person who moves to a country other than that of his or her usual residence for a period of at least a year (12 months), so that the country of destination effectively becomes his or her new country of usual residence. From the perspective of the country of departure, the person will be a long-term emigrant and from that of the country of arrival the person will be a long-term immigrant”. A list of the countries assessed in this model is given in Appendix 1. The Indicators The Global Migration Barometer, with its two associated measures, and the Need for Migrants measure, contain a range of indicators, varying from eight (Accessibility for Migrants) to 14 (Attractiveness to Migrants). There are 32 indicators in total, of which 17 are qualitative and 15 are quantitative. Data for the quantitative indicators are drawn from national and international statistical sources for the latest available year of comparable data. Gaps in the quantitative data have been filled by estimates. The qualitative data have been drawn from a range of surveys and data sources adjusted by the Economist Intelligence Unit. The main sources used in the model are the Economist Intelligence Unit; Bank for International Settlements; International Labour Organisation; International Monetary Fund; Organisation for Economic Co-operation and Development; United Nations Educational, Scientific and Cultural Organisation; United Nations Development Programme; World Bank; World Health Organisation; US Bureau of Census; and national statistical offices. The categories and their associated indicators are as follows:
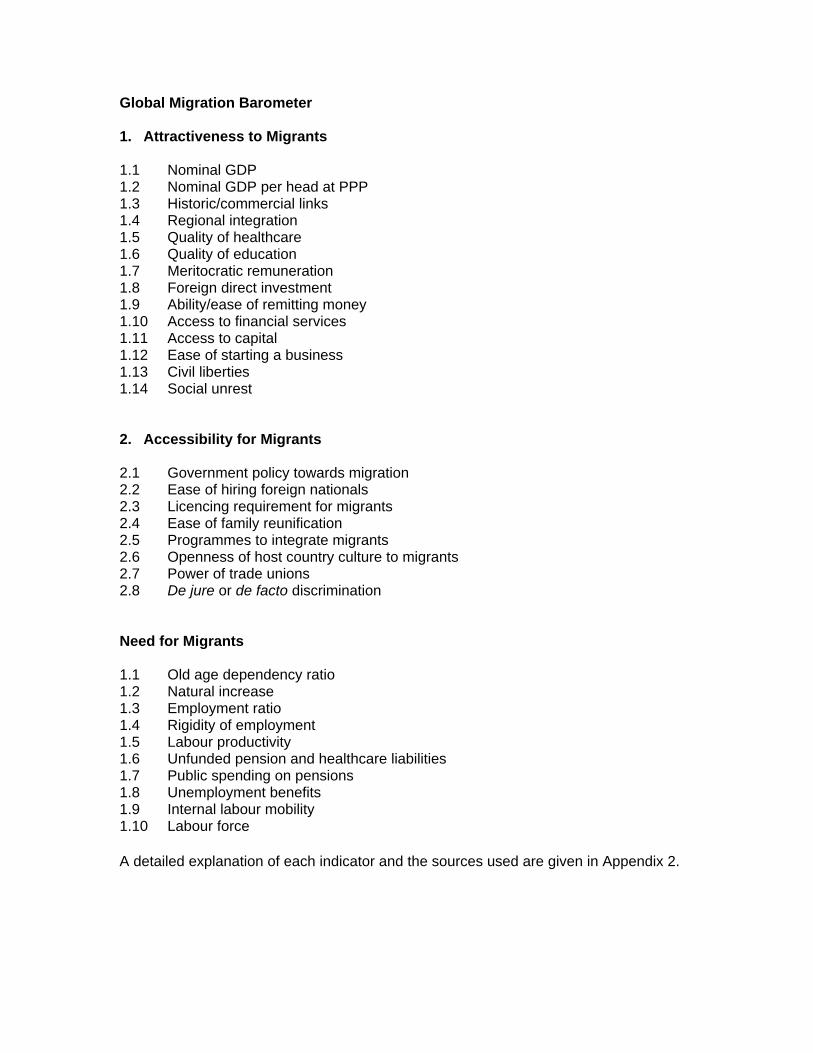
Global Migration Barometer 1. Attractiveness to Migrants 1.1 Nominal GDP 1.2 Nominal GDP per head at PPP 1.3 Historic/commercial links 1.4 Regional integration 1.5 Quality of healthcare 1.6 Quality of education 1.7 Meritocratic remuneration 1.8 Foreign direct investment 1.9 Ability/ease of remitting money 1.10 Access to financial services 1.11 Access to capital 1.12 Ease of starting a business 1.13 Civil liberties 1.14 Social unrest 2. Accessibility for Migrants 2.1 Government policy towards migration 2.2 Ease of hiring foreign nationals 2.3 Licencing requirement for migrants 2.4 Ease of family reunification 2.5 Programmes to integrate migrants 2.6 Openness of host country culture to migrants 2.7 Power of trade unions 2.8 De jure or de facto discrimination Need for Migrants 1.1 Old age dependency ratio 1.2 Natural increase 1.3 Employment ratio 1.4 Rigidity of employment 1.5 Labour productivity 1.6 Unfunded pension and healthcare liabilities 1.7 Public spending on pensions 1.8 Unemployment benefits 1.9 Internal labour mobility 1.10 Labour force A detailed explanation of each indicator and the sources used are given in Appendix 2.

Data Issues Some indicators that may have enhanced and influenced the results of the migration model have not been included. In some cases this was due to a lack of available data for all the 61 countries assessed in the model; in other cases, comprehensive data were available only for the advanced OECD countries. Despite these data limitations, the Economist Intelligence Unit believes the model’s findings represent a useful start at setting the parameters for the discussion on migration. The Economist Intelligence Unit will be pleased to consider additions and improvements in future versions of the index, as and when more comprehensive data becomes available. For example, in the Accessibility for Migrants category, it would have been desirable to include indicators on supply and demand for work permits—that is, the number of applicants for work permits and the number of work permits actually issued. Other data –such as a breakdown of host country demand for labour with specific skill-sets or for particular occupations—would have been useful to include, and might potentially have changed some of the scores. The Economist Intelligence Unit would have welcomed the opportunity to include some of the following metrics, none of which were available on a comprehensive basis for emerging markets: the employment rate of migrants in the host country, in total and by occupation/sector of activity; the number of migrants who are self-employed; the percent of migrants obtaining legal permanent residence or citizenship; and the causes of migration, such as whether it is driven by economic factors or family reunification issues. The nature of the modeling process itself also restricted the choice of indicators, particularly in the Attractiveness to Migrants category. Because a benchmarking model was used to arrive at the results, it could not adequately consider specific relations between a host country and a particular country of origin. Rather, the model attempts to capture which countries are most attractive to migrants globally, regardless of factors such as geographical proximity or the existence of bilateral labour agreements. As discussed above, the Attractiveness to Migrants category aims to capture migrant aspirations, rather than assessing the ease of migration, which would be based on factors such as the cost of moving, geographical distance or any special arrangements between two countries. These country specific factors can only be captured using a “gravity” model, which predicts the movement of people between two places, based on indicators such as geographical distance and population size, among others. A gravity model would predict the movement of people between the US and Mexico only, or the US and the UK. Data Modelling Quantitative data Indicator scores are normalised and then aggregated across categories to enable a comparison of broader concepts across countries. Normalisation rebases the raw indicator data to a common unit so that it can be aggregated. Indicators of quantitative data where a higher value indicates greater attractiveness, accessibility or need for migrants—such as GDP per head at PPP, Openness of host
country culture to migrants or the Old age dependency ratio—have been normalised on the basis of: x = (x - Min(x)) / (Max(x) - Min(x)) where Min(x) and Max(x) are, respectively, the lowest and highest values in the 61 countries for any given indicator. The normalised value is then transformed from a 0-1 value to a 0-100 score to make it directly comparable with other indicators. This effectively means that the country with the highest raw data value will score 100, while the lowest will score 0. For the four quantitative indicators where a high value indicates low attractiveness or need for migrants—ease of starting a business, natural increase, labour productivity and the labour force—the normalisation function takes the form of: x = (x - Max(x)) / (Max(x) - Min(x)) where Min(x) and Max(x) are, respectively, the lowest and highest values in the 61 countries for any given indicator. The normalised value is then transformed into a positive number on a scale of 0-100 to make it directly comparable with other indicators. Qualitative data Most of the qualitative indicators have been “banded” on a scale of 1-5 and scored by the Economist Intelligence Unit’s team of country analysts. The scores are then transformed from a 1-5 value to a 0-100 score to make them comparable with the quantitative indicators. One of the indicators, government policy towards migration, has been banded on a scale of 1-3 and has been converted to a 0-100 score to make it comparable across all indicators. The raw data for two indicators, rigidity of employment and civil liberties, are already indexed. The former is on a 0-100 scale, while the latter is on a 0-10 scale that has been multiplied by a factor of 10 to obtain the 0-100 scale. Weighting the Index Several external experts, specialising in migration issues, apportioned weights based on the relative importance of each of the indicators. The total weight assigned to indicators in any one category was 100%. The result is a score and rank for each of the three categories: Attractiveness to Migrants, Accessibility for Migrants and Need for Migrants. The composite Global Migration Barometer score and ranking was formulated by applying a 50% weight to both Attractiveness to Migrants and Accessibility for Migrants, so that the total weight equaled 100%. The standalone Need for Migrants category has a weight of 100%. The indicator and category weights are given in Appendix 3.

Details of the external panel of experts have been included in Appendix 4. Calculating the Global Migration Barometer Modelling and weighting the indicators and categories in the model results in scores of 0-100 for each country, where 100 represents the highest attractiveness, accessibility or need for migrants and 0 the lowest. This is the same for the Global Migration Barometer. The 61 countries assessed, which include the developed economies and the largest emerging markets, can then be ranked according to these indices.
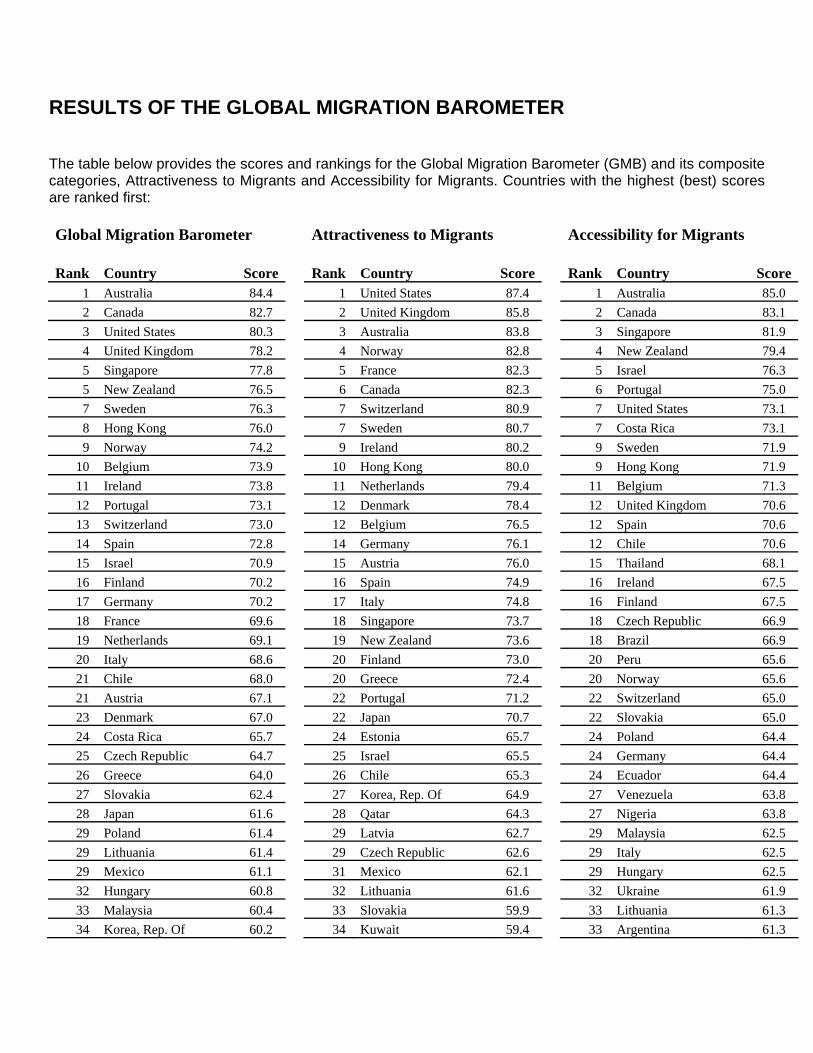
RESULTS OF THE GLOBAL MIGRATION BAROMETER The table below provides the scores and rankings for the Global Migration Barometer (GMB) and its composite categories, Attractiveness to Migrants and Accessibility for Migrants. Countries with the highest (best) scores are ranked first: Global Migration Barometer Attractiveness to Migrants Accessibility for Migrants Rank Country Score Rank Country Score Rank Country Score
1 Australia 84.4 1 United States 87.4 1 Australia 85.0 2 Canada 82.7 2 United Kingdom 85.8 2 Canada 83.1 3 United States 80.3 3 Australia 83.8 3 Singapore 81.9 4 United Kingdom 78.2 4 Norway 82.8 4 New Zealand 79.4 5 Singapore 77.8 5 France 82.3 5 Israel 76.3 5 New Zealand 76.5 6 Canada 82.3 6 Portugal 75.0 7 Sweden 76.3 7 Switzerland 80.9 7 United States 73.1 8 Hong Kong 76.0 7 Sweden 80.7 7 Costa Rica 73.1 9 Norway 74.2 9 Ireland 80.2 9 Sweden 71.9
10 Belgium 73.9 10 Hong Kong 80.0 9 Hong Kong 71.9 11 Ireland 73.8 11 Netherlands 79.4 11 Belgium 71.3 12 Portugal 73.1 12 Denmark 78.4 12 United Kingdom 70.6 13 Switzerland 73.0 12 Belgium 76.5 12 Spain 70.6 14 Spain 72.8 14 Germany 76.1 12 Chile 70.6 15 Israel 70.9 15 Austria 76.0 15 Thailand 68.1 16 Finland 70.2 16 Spain 74.9 16 Ireland 67.5 17 Germany 70.2 17 Italy 74.8 16 Finland 67.5 18 France 69.6 18 Singapore 73.7 18 Czech Republic 66.9 19 Netherlands 69.1 19 New Zealand 73.6 18 Brazil 66.9 20 Italy 68.6 20 Finland 73.0 20 Peru 65.6 21 Chile 68.0 20 Greece 72.4 20 Norway 65.6 21 Austria 67.1 22 Portugal 71.2 22 Switzerland 65.0 23 Denmark 67.0 22 Japan 70.7 22 Slovakia 65.0 24 Costa Rica 65.7 24 Estonia 65.7 24 Poland 64.4 25 Czech Republic 64.7 25 Israel 65.5 24 Germany 64.4 26 Greece 64.0 26 Chile 65.3 24 Ecuador 64.4 27 Slovakia 62.4 27 Korea, Rep. Of 64.9 27 Venezuela 63.8 28 Japan 61.6 28 Qatar 64.3 27 Nigeria 63.8 29 Poland 61.4 29 Latvia 62.7 29 Malaysia 62.5 29 Lithuania 61.4 29 Czech Republic 62.6 29 Italy 62.5 29 Mexico 61.1 31 Mexico 62.1 29 Hungary 62.5 32 Hungary 60.8 32 Lithuania 61.6 32 Ukraine 61.9 33 Malaysia 60.4 33 Slovakia 59.9 33 Lithuania 61.3 34 Korea, Rep. Of 60.2 34 Kuwait 59.4 33 Argentina 61.3

Rank Country Score Rank Country Score Rank Country Score35 Brazil 59.8 34 Hungary 59.0 35 Kazakhstan 60.6 36 Qatar 59.3 36 Poland 58.4 36 Mexico 60.0 37 Argentina 59.3 37 Malaysia 58.3 37 Netherlands 58.8 38 Kazakhstan 58.6 38 Costa Rica 58.2 37 Cote D'Ivoire 58.8 39 Peru 57.8 39 United Arab Emirates 58.2 39 Russian Federation 58.1 40 Thailand 57.1 40 Argentina 57.3 39 India 58.1 41 Latvia 57.0 41 Kazakhstan 56.6 39 China 58.1 42 Russian Federation 56.3 42 Russian Federation 54.4 39 Austria 58.1 43 Estonia 55.7 43 South Africa 54.4 43 Turkey 56.9 44 Turkey 55.3 44 Romania 53.8 43 France 56.9 44 Ukraine 55.0 45 Turkey 53.7 45 Romania 56.3 46 Romania 55.0 46 Bulgaria 53.2 45 Botswana 56.3 46 United Arab Emirates 54.7 47 Brazil 52.7 47 Korea, Rep. Of 55.6 48 Kuwait 54.4 48 Jordan 52.7 47 Greece 55.6 49 Botswana 54.3 49 Botswana 52.4 47 Denmark 55.6 50 Ecuador 54.2 50 Peru 49.9 50 Qatar 54.4 51 China 53.7 51 Saudi Arabia 49.7 51 Jordan 53.8 52 South Africa 53.5 52 China 49.4 52 Bulgaria 53.1 53 Jordan 53.2 53 Ukraine 48.2 53 South Africa 52.5 53 Bulgaria 53.2 54 India 46.8 53 Japan 52.5 53 India 52.5 55 Thailand 46.1 55 United Arab Emirates 51.3 56 Nigeria 50.3 56 Ecuador 44.1 55 Latvia 51.3 57 Venezuela 50.3 57 Iran 38.6 57 Kuwait 49.4 58 Cote D'Ivoire 48.3 58 Ghana 38.2 58 Ghana 47.5 59 Saudi Arabia 47.0 59 Cote D'Ivoire 37.9 59 Estonia 45.6 60 Ghana 42.9 60 Nigeria 36.9 60 Saudi Arabia 44.4 61 Iran 40.9 61 Venezuela 36.8 61 Iran 43.1
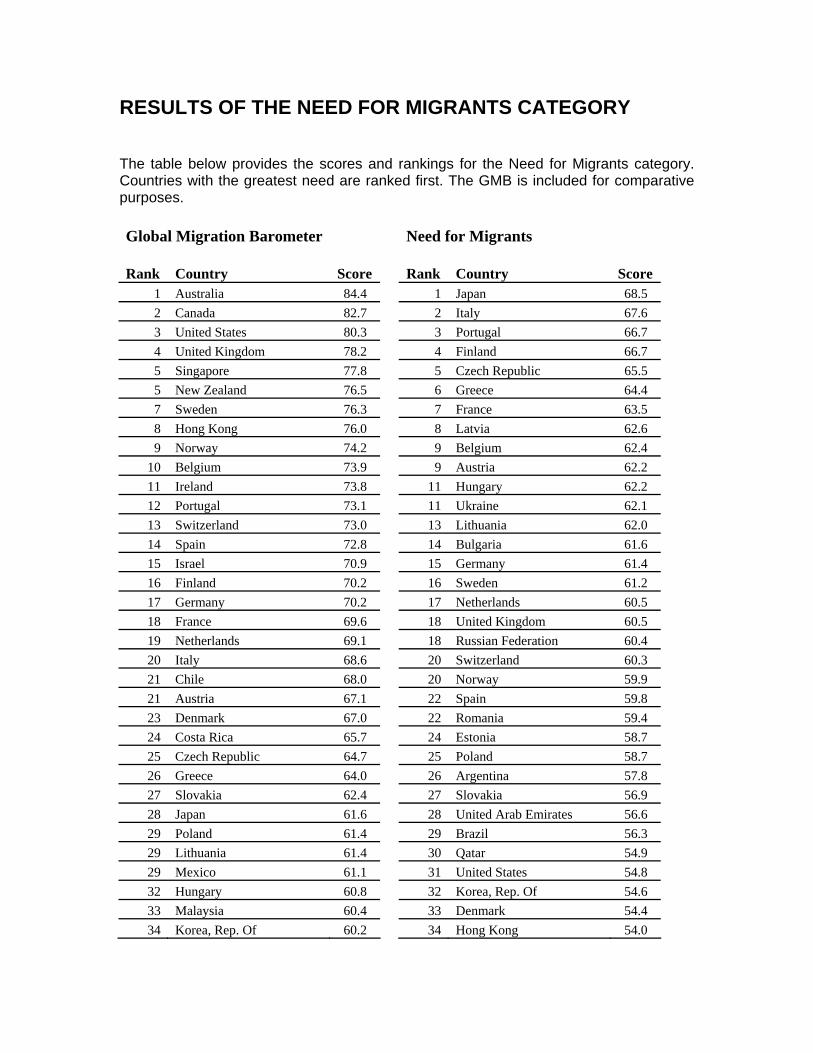
RESULTS OF THE NEED FOR MIGRANTS CATEGORY The table below provides the scores and rankings for the Need for Migrants category. Countries with the greatest need are ranked first. The GMB is included for comparative purposes. Global Migration Barometer Need for Migrants Rank Country Score Rank Country Score
1 Australia 84.4 1 Japan 68.5 2 Canada 82.7 2 Italy 67.6 3 United States 80.3 3 Portugal 66.7 4 United Kingdom 78.2 4 Finland 66.7 5 Singapore 77.8 5 Czech Republic 65.5 5 New Zealand 76.5 6 Greece 64.4 7 Sweden 76.3 7 France 63.5 8 Hong Kong 76.0 8 Latvia 62.6 9 Norway 74.2 9 Belgium 62.4
10 Belgium 73.9 9 Austria 62.2 11 Ireland 73.8 11 Hungary 62.2 12 Portugal 73.1 11 Ukraine 62.1 13 Switzerland 73.0 13 Lithuania 62.0 14 Spain 72.8 14 Bulgaria 61.6 15 Israel 70.9 15 Germany 61.4 16 Finland 70.2 16 Sweden 61.2 17 Germany 70.2 17 Netherlands 60.5 18 France 69.6 18 United Kingdom 60.5 19 Netherlands 69.1 18 Russian Federation 60.4 20 Italy 68.6 20 Switzerland 60.3 21 Chile 68.0 20 Norway 59.9 21 Austria 67.1 22 Spain 59.8 23 Denmark 67.0 22 Romania 59.4 24 Costa Rica 65.7 24 Estonia 58.7 25 Czech Republic 64.7 25 Poland 58.7 26 Greece 64.0 26 Argentina 57.8 27 Slovakia 62.4 27 Slovakia 56.9 28 Japan 61.6 28 United Arab Emirates 56.6 29 Poland 61.4 29 Brazil 56.3 29 Lithuania 61.4 30 Qatar 54.9 29 Mexico 61.1 31 United States 54.8 32 Hungary 60.8 32 Korea, Rep. Of 54.6 33 Malaysia 60.4 33 Denmark 54.4 34 Korea, Rep. Of 60.2 34 Hong Kong 54.0
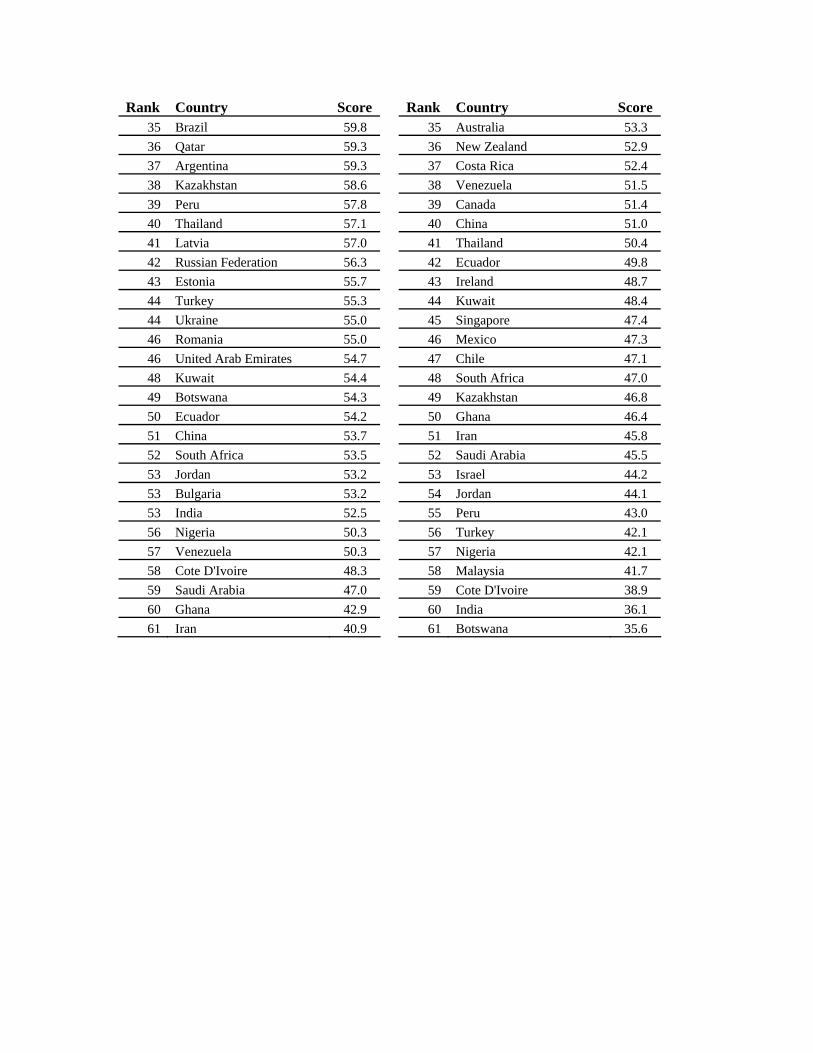
Rank Country Score Rank Country Score 35 Brazil 59.8 35 Australia 53.3 36 Qatar 59.3 36 New Zealand 52.9 37 Argentina 59.3 37 Costa Rica 52.4 38 Kazakhstan 58.6 38 Venezuela 51.5 39 Peru 57.8 39 Canada 51.4 40 Thailand 57.1 40 China 51.0 41 Latvia 57.0 41 Thailand 50.4 42 Russian Federation 56.3 42 Ecuador 49.8 43 Estonia 55.7 43 Ireland 48.7 44 Turkey 55.3 44 Kuwait 48.4 44 Ukraine 55.0 45 Singapore 47.4 46 Romania 55.0 46 Mexico 47.3 46 United Arab Emirates 54.7 47 Chile 47.1 48 Kuwait 54.4 48 South Africa 47.0 49 Botswana 54.3 49 Kazakhstan 46.8 50 Ecuador 54.2 50 Ghana 46.4 51 China 53.7 51 Iran 45.8 52 South Africa 53.5 52 Saudi Arabia 45.5 53 Jordan 53.2 53 Israel 44.2 53 Bulgaria 53.2 54 Jordan 44.1 53 India 52.5 55 Peru 43.0 56 Nigeria 50.3 56 Turkey 42.1 57 Venezuela 50.3 57 Nigeria 42.1 58 Cote D'Ivoire 48.3 58 Malaysia 41.7 59 Saudi Arabia 47.0 59 Cote D'Ivoire 38.9 60 Ghana 42.9 60 India 36.1 61 Iran 40.9 61 Botswana 35.6

ANALYSIS OF THE RESULTS Global Migration Barometer The Global Migration Barometer is a composite of the scores for Attractiveness to Migrants and Accessibility for Migrants. Eight of the top ten countries in this category have English as their official language, the other two being Sweden and Norway. All ten countries are open, fully developed, economies, with attractive operating environments. They are stable democracies with firmly entrenched rules of law, and have good educational and healthcare systems. They have solid legal environments, which helps to protect the rights of legal migrants, and many have an open attitude towards migrant family reunification. Attractiveness to Migrants With the exception of Hong Kong and Singapore, the top 20 most attractive countries to migrants are the advanced economies of North America, western Europe and Australasia. Countries that score well in this category have high standards of living (captured by income per head), and are politically and socially stable democracies with well-entrenched rules of law. Many are former colonial powers, as a result of which they have a large presence of national/ethnic migrant groups. Others are the English-speaking former colonies of the developed world, such as the US, Australia, New Zealand, Hong Kong and Singapore. The Scandinavians also rank well, owing to their equitable and well-developed social infrastructure. Generally, a country is highly attractive to migrants if it treats its own citizens well, in terms of social justice, healthcare and educational opportunities, and if it has a business environment that promotes free enterprise and competition. Most of the countries that score well in this category do not necessarily have a need for migrants—indeed, with the exception of France, there is no overlap between the top ten countries in terms of the rankings for attractiveness and need for migrants (there is more overlap if the top 20 rankings for each category are considered). This is largely because many of the countries with a high need for migrants are smaller, more homogenous—or less multicultural—economies, often with no historic connections to other countries through colonial ties. (The migrants in these countries are likely to be from neighbouring nations that have lower incomes per head). As a result, many of them do not have a substantial existing presence of migrant groups. This means that the informal information networks between the migrant group and the home (emigrant) country that often encourages increased migrant flows do not exist. The US ranks first in terms of attractiveness to migrants. It is by far the world’s largest economy and one of its most advanced. It is a nation of immigrants, and its resulting status as a so-called “melting pot” also makes it attractive to migrants. The UK ranks second in terms of attractiveness. This is largely because it was one of the largest colonial powers—at its height in the early 20th century, the British empire covered almost one-quarter of the world’s land surface. As a result, it has strong historic links with a number of countries assessed in this model. In addition, the UK’s system of higher education is among the best in Europe, healthcare provision is free for all, it has a favourable attitude towards free enterprise and competition, and its capital markets are deep and sophisticated.
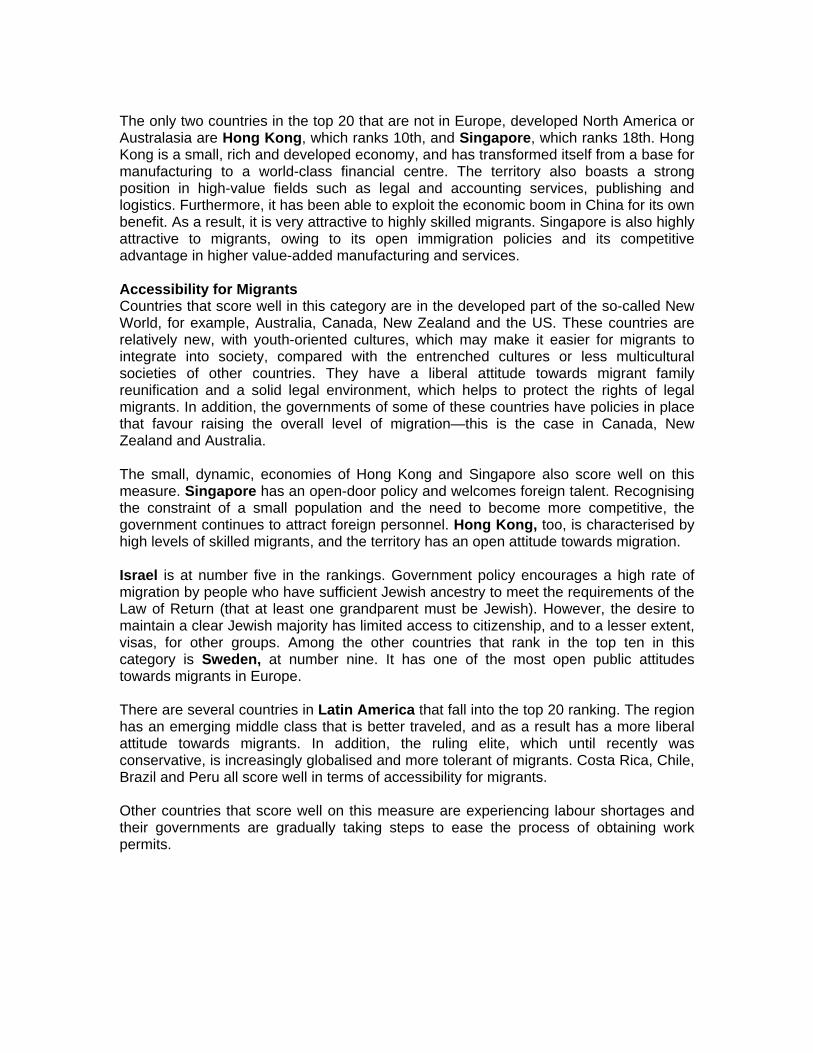
The only two countries in the top 20 that are not in Europe, developed North America or Australasia are Hong Kong, which ranks 10th, and Singapore, which ranks 18th. Hong Kong is a small, rich and developed economy, and has transformed itself from a base for manufacturing to a world-class financial centre. The territory also boasts a strong position in high-value fields such as legal and accounting services, publishing and logistics. Furthermore, it has been able to exploit the economic boom in China for its own benefit. As a result, it is very attractive to highly skilled migrants. Singapore is also highly attractive to migrants, owing to its open immigration policies and its competitive advantage in higher value-added manufacturing and services. Accessibility for Migrants Countries that score well in this category are in the developed part of the so-called New World, for example, Australia, Canada, New Zealand and the US. These countries are relatively new, with youth-oriented cultures, which may make it easier for migrants to integrate into society, compared with the entrenched cultures or less multicultural societies of other countries. They have a liberal attitude towards migrant family reunification and a solid legal environment, which helps to protect the rights of legal migrants. In addition, the governments of some of these countries have policies in place that favour raising the overall level of migration—this is the case in Canada, New Zealand and Australia. The small, dynamic, economies of Hong Kong and Singapore also score well on this measure. Singapore has an open-door policy and welcomes foreign talent. Recognising the constraint of a small population and the need to become more competitive, the government continues to attract foreign personnel. Hong Kong, too, is characterised by high levels of skilled migrants, and the territory has an open attitude towards migration. Israel is at number five in the rankings. Government policy encourages a high rate of migration by people who have sufficient Jewish ancestry to meet the requirements of the Law of Return (that at least one grandparent must be Jewish). However, the desire to maintain a clear Jewish majority has limited access to citizenship, and to a lesser extent, visas, for other groups. Among the other countries that rank in the top ten in this category is Sweden, at number nine. It has one of the most open public attitudes towards migrants in Europe. There are several countries in Latin America that fall into the top 20 ranking. The region has an emerging middle class that is better traveled, and as a result has a more liberal attitude towards migrants. In addition, the ruling elite, which until recently was conservative, is increasingly globalised and more tolerant of migrants. Costa Rica, Chile, Brazil and Peru all score well in terms of accessibility for migrants. Other countries that score well on this measure are experiencing labour shortages and their governments are gradually taking steps to ease the process of obtaining work permits.

Need for Migrants With the exception of Japan, the 20 countries that most need migrants are in western and eastern Europe. This is largely because the ageing process is well underway in most advanced economies (resulting in a shrinking working-age population—one of the key drivers of economic performance, along with productivity), as well as in the developing economies of eastern Europe and some Asian economies. However, by and large, working-age populations are expected to increase in many other emerging markets, such as India. And unlike many developed economies, the US is expected to retain a favourable demographic profile, owing to higher birth rates than in Europe. Japan ranks first in need for migrants, as it faces severe demographic problems. Its birth rate has been declining sharply, and stood at 1.3 in 2007, well below the 2.1 needed to maintain the current population. In the developed world, only Italy and Germany produce fewer children. The declining birth rate, coupled with a rise in life expectancy since the end of the second world war, has also pushed up the average age of the population. Although this is not an unusual phenomenon in many developed countries, its speed in Japan is worrying. In the 33 years to 2003, for example, the percentage of Japan’s population aged 65 and over more than doubled, from 7.1% to 19%, a process that took around 100 years in many developed European countries. A high old-age dependency ratio and a shrinking labour force will put pressure on public finances, which are already among the worst in the industrialised world. Like Japan, western Europe is facing similar, albeit less pronounced, changes in its demographic structure. Italy, Portugal, Finland, Greece and France will have a particularly high need for labour in the future. However, demographic trends are even worse in eastern Europe, and these will offset relatively strong labour productivity performance. This will reduce eastern Europe’s economic growth potential and its ability, therefore, to rapidly converge with west European living standards. Some east European countries have among the lowest birth rates in the world. The Czech Republic’s rate of 1.2 per woman is lower even than Italy’s, which is the lowest in western Europe. In many Eastern European countries, the current demographic decline is part of a long-term trend. In Hungary, for example, the population started to shrink in the 1980s, and the Czech Republic was more or less stagnant throughout the 1970s and 1980s. In others, however, demographic change owed much to the economic and political upheavals that accompanied the dissolution of the Soviet Union. At present, the populations of some countries, such as Poland, are still, on average, younger than those in many EU15 countries. Other countries, such as the Czech Republic and Lithuania, already face a shrinking workforce. Another negative factor affecting the functioning of labour markets is low regional mobility (this also applies to western Europe), which has contributed to a very high inter-regional dispersion in unemployment rates. This is caused by several factors, the most important of which are the combination of significant social transfers and the rigidity of housing markets. Russia’s demographic profile in particular is very unfavourable, combining the worst features of the developed and developing worlds (a falling and ageing population, low life expectancy, and a declining working-age population). Russia faces a severe demographic challenge resulting from low birth rates, poor medical care, and a potentially explosive AIDS situation. In the absence of large-scale immigration, Russia

will not have the labour resources to sustain high economic growth rates. Poor health will affect the quality of the workforce and make it all the more difficult to sustain the productivity improvements needed for catch-up growth. Finally, Russia’s rapidly ageing workforce will result in increasing pension and healthcare costs, which will exert strong pressure on the budget and divert resources away from economic development. On the other side of the spectrum is India, whose working-age population will continue to grow. This will prove to be a catalyst for sustained, rapid economic growth, but also for social discontent. If growth remains concentrated in high technology areas, such as telecommunications, IT and pharmaceuticals, India’s demographic bonus may prove to be a hindrance as the economy fails to generate sufficient employment opportunities for the rapidly expanding labour force. Nevertheless, India’s workforce is likely to fill the gaps in the labour markets of other countries, either through the outsourcing of manufacturing and services operations to India, or by the migration of Indian workers to other countries. However for this to occur, there will need to be a match with the skills offered by Indian workers, and at present only India’s most highly skilled workers are globally competitive.

APPENDIX 1 COUNTRY LIST The table below provides a list of countries assessed in the Global Migration Barometer (GMB): Western Europe North America Middle-East Austria Canada Iran Belgium United States Jordan Denmark Kuwait Finland Latin America Qatar France Argentina Saudi Arabia Germany Brazil United Arab Emirates Greece Chile Ireland Costa Rica Sub-Saharan Africa Israel Ecuador Botswana Italy Mexico Cote D'Ivoire Netherlands Peru Ghana Norway Venezuela Nigeria Portugal South Africa Spain Asia Sweden Australia Switzerland China Turkey Hong Kong United Kingdom India Japan Eastern Europe Korea, Republic of Bulgaria Malaysia Czech Republic New Zealand Estonia Singapore Hungary Thailand Kazakhstan Latvia Lithuania Poland Romania Russian Federation Slovakia Ukraine
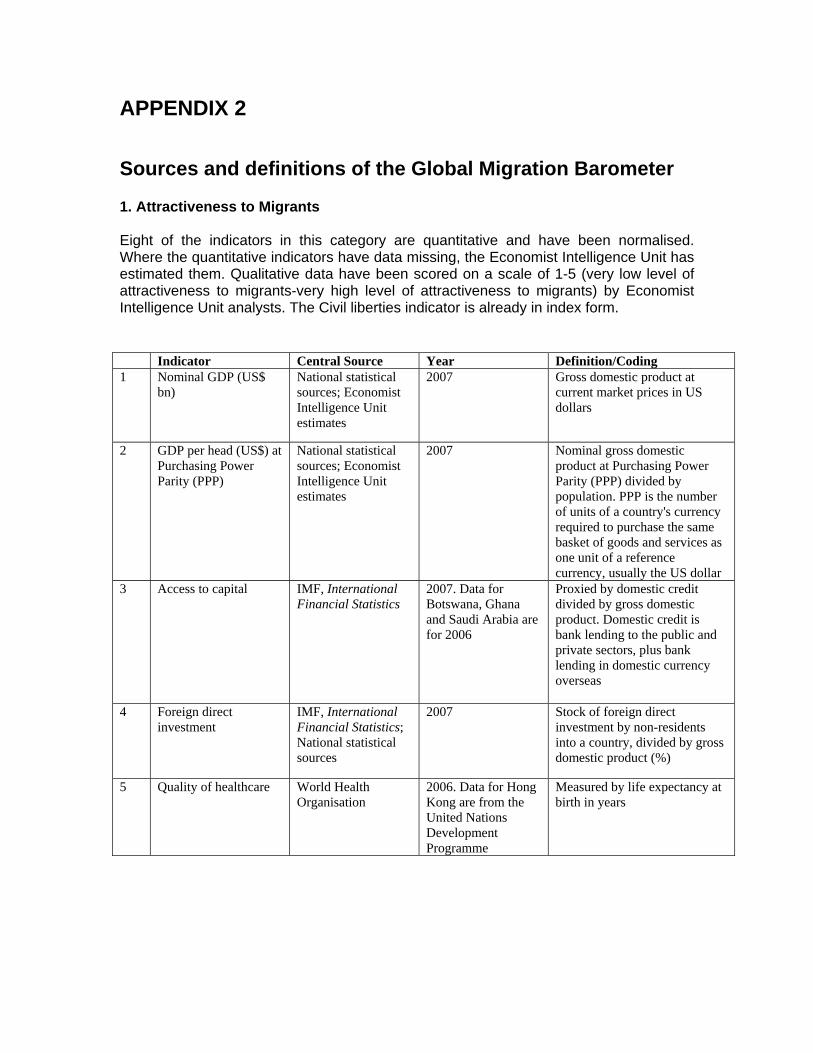
APPENDIX 2 Sources and definitions of the Global Migration Barometer 1. Attractiveness to Migrants Eight of the indicators in this category are quantitative and have been normalised. Where the quantitative indicators have data missing, the Economist Intelligence Unit has estimated them. Qualitative data have been scored on a scale of 1-5 (very low level of attractiveness to migrants-very high level of attractiveness to migrants) by Economist Intelligence Unit analysts. The Civil liberties indicator is already in index form. Indicator Central Source Year Definition/Coding 1 Nominal GDP (US$
bn) National statistical sources; Economist Intelligence Unit estimates
2007 Gross domestic product at current market prices in US dollars
2 GDP per head (US$) at Purchasing Power Parity (PPP)
National statistical sources; Economist Intelligence Unit estimates
2007 Nominal gross domestic product at Purchasing Power Parity (PPP) divided by population. PPP is the number of units of a country's currency required to purchase the same basket of goods and services as one unit of a reference currency, usually the US dollar
3 Access to capital IMF, International Financial Statistics
2007. Data for Botswana, Ghana and Saudi Arabia are for 2006
Proxied by domestic credit divided by gross domestic product. Domestic credit is bank lending to the public and private sectors, plus bank lending in domestic currency overseas
4 Foreign direct investment
IMF, International Financial Statistics; National statistical sources
2007 Stock of foreign direct investment by non-residents into a country, divided by gross domestic product (%)
5 Quality of healthcare World Health Organisation
2006. Data for Hong Kong are from the United Nations Development Programme
Measured by life expectancy at birth in years

6 Quality of education United Nations Educational, Scientific and Cultural Organisation
2006. If 2006 data are not available, the latest available data has been selected. Data for Ecuador, Saudi Arabia and Singapore are Economist Intelligence Unit estimates
Measured by school life expectancy (primary to tertiary) in years
7 Ease of starting a business
World Bank, Doing Business
2008. Data for Qatar is an Economist Intelligence Unit estimate
Measured by number of days required to start a business
8 Ability/ease of remitting money
Economist Intelligence Unit
2007 Qualitative assessment of capital account liberalisation by Economist Intelligence Unit analysts. See next table for details
9 Access to financial services
World Bank; Bank for International Settlements; Economist Intelligence Unit
2007. Data for Qatar is an Economist Intelligence Unit estimate
Banded qualitative data of the percentage of households with a bank account. See next table for details
10 Meritocratic remuneration
Economist Intelligence Unit
2007 Qualitative assessment by Economist Intelligence Unit analysts of the extent to which increases in wages are directly related to productivity increases. See next table for details
11 Social unrest Economist Intelligence Unit
2007 Qualitative assessment of the risk of social unrest by Economist Intelligence Unit analysts. See next table for details
12 Historic/commercial links
Economist Intelligence Unit
2007 Qualitative assessment by Economist Intelligence Unit analysts of historic or commercial links between the host and migrant country. See next table for details
13 Regional integration Economist Intelligence Unit
2007 Qualitative assessment of the extent of regional integration by Economist Intelligence Unit analysts. See next table for details
14 Civil liberties Economist Intelligence Unit
2008 Civil liberties is a component of the Economist Intelligence Unit's Democracy Index. It captures the principle of the protection of basic human rights, such as freedom of speech, expression and the

press; freedom of religion; freedom of assembly and association; and the right to due judicial process. Each country assessed on this indicator is ranked on a 0-10 scale

Attractiveness to Migrants: Qualitative indicator details The score for each indicator is on a scale from 1 (less attractive) to 5 (very attractive) Scores
Indicator Notes Guidance 5 4 3 2 1
Ability/ease of remitting money
Considers if money can easily be moved in and out of the country for financial transactions?
Full liberalisation
Almost all capital flows are free; minor administrative procedures
Inward/outward investment are allowed, but there are significant regulatory restrictions
Government approval required for outward investment; heavy restrictions on inward flows
Tightly controlled capital flows
Access to financial services
Percentage of households with a bank account
More than 80% of households have a bank account
60-79% have a bank account
40-59% have a bank account
20-39% have a bank account
Less than 19% have a bank account
Meritocratic remuneration
To what extent are increases in wages directly related to productivity increases?
Considers the extent to which wage setting is done at the company rather than national, regional, provincial or industry level
Very high High Moderate Low Very low
Social unrest Assesses the risk of significant social unrest
Social unrest can include large-scale demonstrations, political strikes, inter-ethnic/racial/religious clashes
Very low Low Moderate High Very high

Historic/commercial links
Assesses whether the host country attracts migrants owing to strong historic or commercial links
Criteria determining whether the host country attracts migrants due to strong historic or commercial links: 1. The host country is a former colonial power. 2. The host country speaks one of the 6 UN languages (English, Russian, French, Spanish, Arabic or Chinese). 3. The host country is a world financial/commercial centre. 4. There is an existing large presence of national/ethnic groups in the host country.
Very high: The host country meets all 4 criteria
High: The host country meets 3 criteria
Moderate: The host country meets 2 of the criteria
Low: The host country meets 1 criterion
Very low: The host country does not meet any of the criteria
Regional integration Assesses the extent of regional integration
The country belongs to an economic union. There is freedom of movement for goods, capital and people. (e.g. the EU)
The country is part of a free trade area, (e.g. NAFTA) and there are few sectoral restrictions. Or the country enjoys a very high level of preferential access to a major regional trade area
The RTA is formally a free trade area, but there are a large number of sectoral and other restrictions (e.g. Mercosur and ASEAN). Or the country enjoys a considerable level of preferential access to a major regional trade area
Formally may be a member of a regional trade grouping, but, in practice, intra-bloc trade remains significantly restricted and any preferential access to major regional trade areas is limited
Not a member of any regional trade grouping

2. Accessibility for Migrants All the data in this category are qualitative and have been scored on a scale of 1-5 (very low accessibility for migrants-very high accessibility for migrants) by Economist Intelligence Unit analysts, unless otherwise indicated. The only exception is Government policy towards migration, which has been scored on a scale of 1-3.
Indicator Central Source
Year Definition/Coding
1 Degree of openness of host country culture to migrants
Economist Intelligence Unit
2007 Qualitative assessment of public attitudes towards migration by Economist Intelligence Unit analysts. See next table for details
2 Power of trade unions Economist Intelligence Unit
2007 Qualitative assessment of the power of trade unions by Economist Intelligence Unit analysts. See next table for details
3 Do migrants face de jure or de facto discrimination in economic or social affairs
Economist Intelligence Unit
2007 Qualitative assessment by Economist Intelligence Unit analysts of discrimination towards migrants. See next table for details
4 Ease of hiring foreign nationals
Economist Intelligence Unit
2007 Qualitative assessment by Economist Intelligence Unit analysts of official and unofficial migration barriers. See next table for details
5 Licencing requirement for migrants
Economist Intelligence Unit
2007 Qualitative assessment by Economist Intelligence Unit analysts of whether migrants need to meet stringent licencing requirements to work in the host country. See next table for details
6 Programmes to integrate migrants
Economist Intelligence Unit
2007 Qualitative assessment by Economist Intelligence Unit analysts of whether the host country actively promotes migrant integration. See next table for details
7 Ease of family reunification
Economist Intelligence Unit
2007 Qualitative assessment by Economist Intelligence Unit analysts of the ease with which migrants can bring their families to the host country. See next table for details

8 Government policy towards migration
United Nations, World Population Policies
2007; Data for Hong Kong is an Economist Intelligence Unit estimate
This UN publication gives country information on government policies regarding the overall level of immigration. This is divided into four attitudes: the government has policies in favour of raising the overall level of immigration; the government has policies to maintain the overall level of immigration; the government has policies to lower the overall level of immigration; or the government does not intervene with regard to the overall level of immigration. As the last response is not cited by any of the countries under consideration, we have converted these responses into a three-point score: a country receives a score of 3 if the government plans to raise immigration; a score of 2 if it wishes to maintain the current level of immigration; and a score of 1 if it plans to lower the level of immigration

Accessibility for Migrants: Qualitative indicator details The score for each indicator is on a scale from 1 (less access) to 5 (very accessible) Scores
Indicator Notes Guidance 5 4 3 2 1
Degree of openness of national (host country) culture to migrants
Considers public attitudes to migration Very open Open Moderate Closed Very closed
Do migrants face de jure or de facto discrimination in economic or social affairs
Considers discrimination in the workplace, property ownership and religious rights
Very low discrimination
Low levels of discrimination Moderate High levels of
discrimination Very high discrimination
Programmes to integrate migrants
Considers whether the host country actively promotes migrant integration through programmes such as language classes, provision of practical advice on country administration systems and formalities that need to be fulfilled
Very high High Moderate Low Very low
Ease of hiring foreign nationals
Considers migration barriers and rules on employment of local nationals
The hiring of foreign nationals is done very easily
The hiring of foreign nationals is done easily
The hiring of foreign nationals is done with some difficulty
The hiring of foreign nationals is done with great difficulty
The hiring of foreign nationals is done is almost impossible
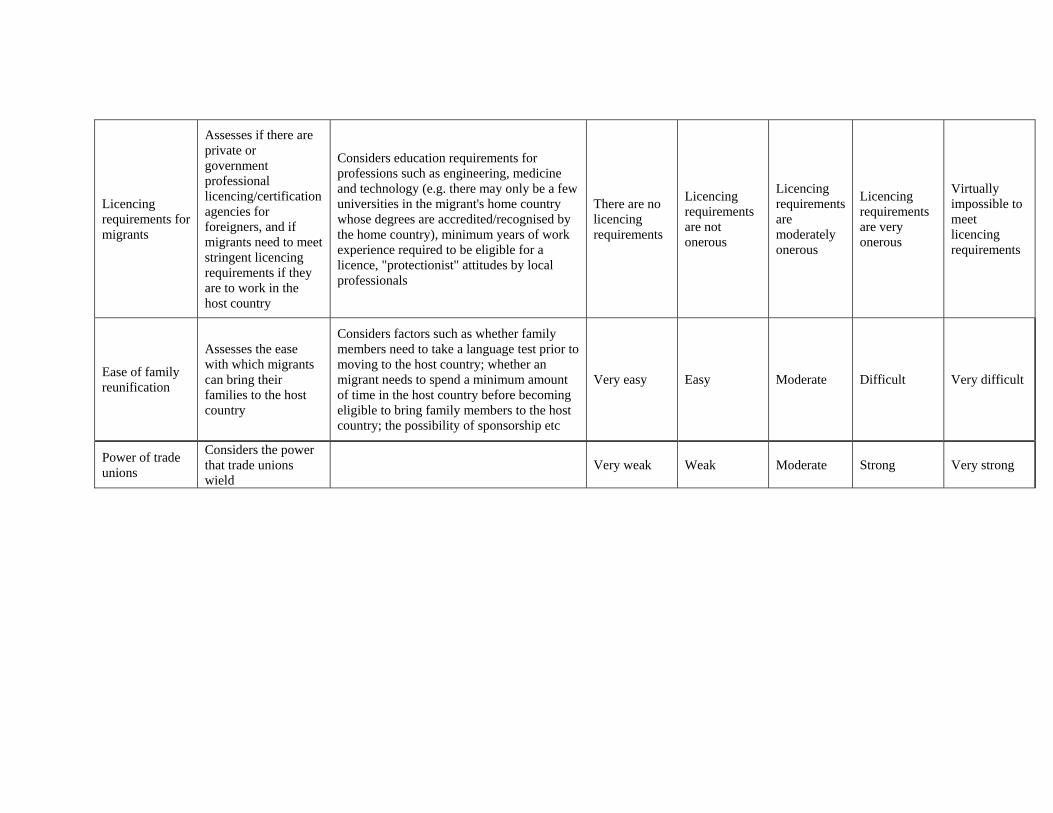
Licencing requirements for migrants
Assesses if there are private or government professional licencing/certification agencies for foreigners, and if migrants need to meet stringent licencing requirements if they are to work in the host country
Considers education requirements for professions such as engineering, medicine and technology (e.g. there may only be a few universities in the migrant's home country whose degrees are accredited/recognised by the home country), minimum years of work experience required to be eligible for a licence, "protectionist" attitudes by local professionals
There are no licencing requirements
Licencing requirements are not onerous
Licencing requirements are moderately onerous
Licencing requirements are very onerous
Virtually impossible to meet licencing requirements
Ease of family reunification
Assesses the ease with which migrants can bring their families to the host country
Considers factors such as whether family members need to take a language test prior to moving to the host country; whether an migrant needs to spend a minimum amount of time in the host country before becoming eligible to bring family members to the host country; the possibility of sponsorship etc
Very easy Easy Moderate Difficult Very difficult
Power of trade unions
Considers the power that trade unions wield
Very weak Weak Moderate Strong Very strong

Need for Migrants Seven of the indicators in this category are quantitative and have been normalized (with the exception of the Rigidity of Employment Index, which is already an index, and, therefore, normalized). Where the quantitative indicators have data missing, the Economist Intelligence Unit has estimated them. The remaining data are qualitative and have been scored on a scale of 1-5 (very low need for migrants-very high need for migrants) by Economist Intelligence Unit analysts.
Indicator Central Source Year Definition/Coding 1 Old age dependency
ratio US Bureau of Census 2015 Ratio of people over the age of
65 to those aged 15-64
2 Employment ratio International Labour Organisation
2006 Calculated by dividing the number of people employed who are over the age of 15, by the population over the age of 15
3 Natural increase US Bureau of Census 2008-15; average Births minus deaths per 100 people
4 Rigidity of Employment Index
World Bank, Doing Business
2008; Data for Qatar is an Economist Intelligence Unit estimate
Average of three indices: Rigidity of Hours Index (restrictions on expanding or contracting the number of working hours); Difficulty of Hiring Index (difficulty of hiring a new worker); Difficulty of Firing Index (difficulty and expense of firing a redundant worker)
5 Labour productivity (%)
International Labour Organisation
2002-06 or 2001-05 (if 2006 data are not available); average. Data for Botswana is an Economist Intelligence Unit estimate
Efficiency of labour measured in terms of output per worker. Data are in constant 1990 prices in US$ at Purchasing Power Parity (PPP). PPP is the number of units of a country's currency required to purchase the same basket of goods and services as one unit of a reference currency, usually the US dollar
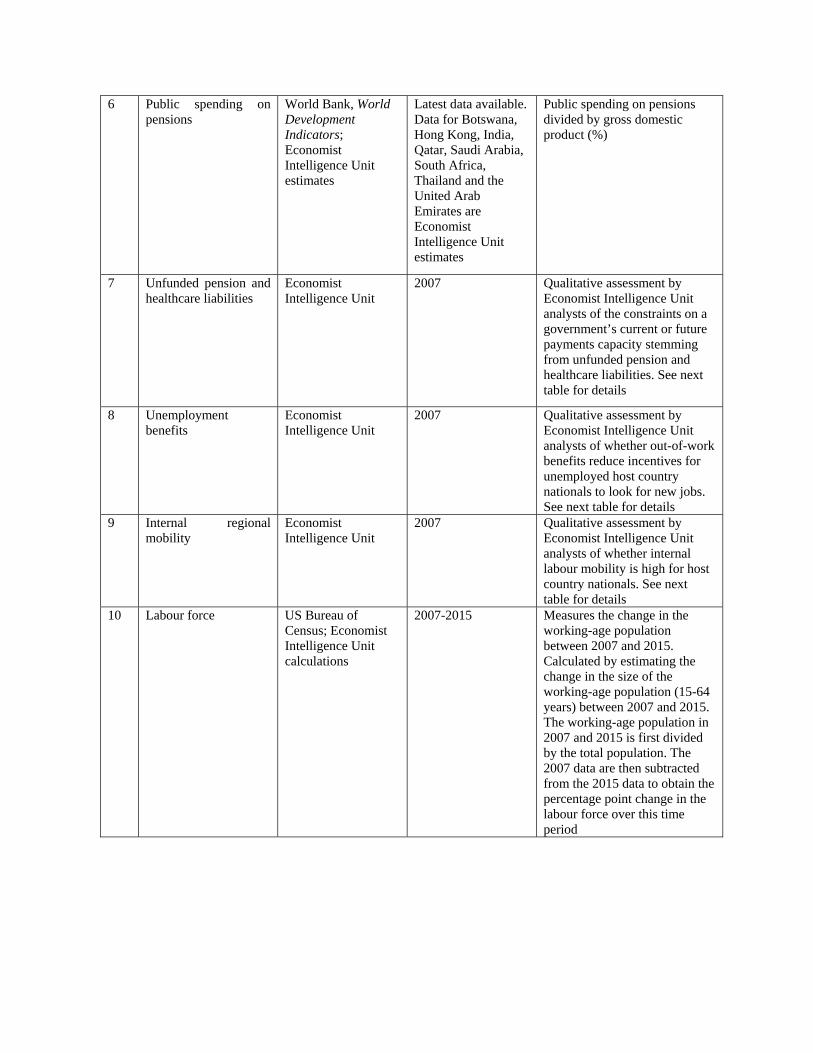
6 Public spending on pensions
World Bank, World Development Indicators; Economist Intelligence Unit estimates
Latest data available. Data for Botswana, Hong Kong, India, Qatar, Saudi Arabia, South Africa, Thailand and the United Arab Emirates are Economist Intelligence Unit estimates
Public spending on pensions divided by gross domestic product (%)
7 Unfunded pension and healthcare liabilities
Economist Intelligence Unit
2007 Qualitative assessment by Economist Intelligence Unit analysts of the constraints on a government’s current or future payments capacity stemming from unfunded pension and healthcare liabilities. See next table for details
8 Unemployment benefits
Economist Intelligence Unit
2007 Qualitative assessment by Economist Intelligence Unit analysts of whether out-of-work benefits reduce incentives for unemployed host country nationals to look for new jobs. See next table for details
9 Internal regional mobility
Economist Intelligence Unit
2007 Qualitative assessment by Economist Intelligence Unit analysts of whether internal labour mobility is high for host country nationals. See next table for details
10 Labour force US Bureau of Census; Economist Intelligence Unit calculations
2007-2015 Measures the change in the working-age population between 2007 and 2015. Calculated by estimating the change in the size of the working-age population (15-64 years) between 2007 and 2015. The working-age population in 2007 and 2015 is first divided by the total population. The 2007 data are then subtracted from the 2015 data to obtain the percentage point change in the labour force over this time period

Need for Migrants: Qualitative indicator details The score for each indicator is on a scale from 1 (low need) to 5 (high need) Scores
Indicator Notes Guidance 1 2 3 4 5
Unfunded pension and healthcare liabilities
Assesses any constraints on the government's current and/or future payments capacity stemming from unfunded pension and healthcare liabilities
Takes into account both the level of underfunding and the timeframe in which the liabilities fall due. For example, a country with unfunded liabilities already generating costs of more than 3% of GDP per year should score a 1
Healthcare and pensions fully funded or privatised
Unfunded liabilities that are not large and do not fall due until beyond the medium-term
Unfunded liabilities that are not large but are already due or fall due within the medium-term
Large unfunded liabilities but which do not fall due until the medium or long term
Large unfunded liabilities that are already being funded out of general government revenue
Welfare benefits for the unemployed
Assesses if out-of-work benefits reduce incentives (for unemployed host country nationals) to look for new jobs
Consider the duration and level of unemployment compensation (cash and non-cash) relative to last salary, healthcare coverage for the unemployed and other social benefits
Very high incentive for the unemployed to seek re-employment, owing to structure of welfare benefits
High incentive for the unemployed to seek re-employment
Moderate
Low incentive for the unemployed to seek re-employment
Very low incentive for the unemployed to seek re-employment
Internal (regional) labour mobility
Assesses if internal labour mobility high for host country nationals
Considers whether there is a culture of low labour mobility, whether governments have subsidised owner-occupied housing with little effort being put into the development of a rental market, if eligibility for unemployment benefits is restricted by location
Very high internal labour mobility
High internal labour mobility
Moderate
Low internal labour mobility
Very low internal labour mobility
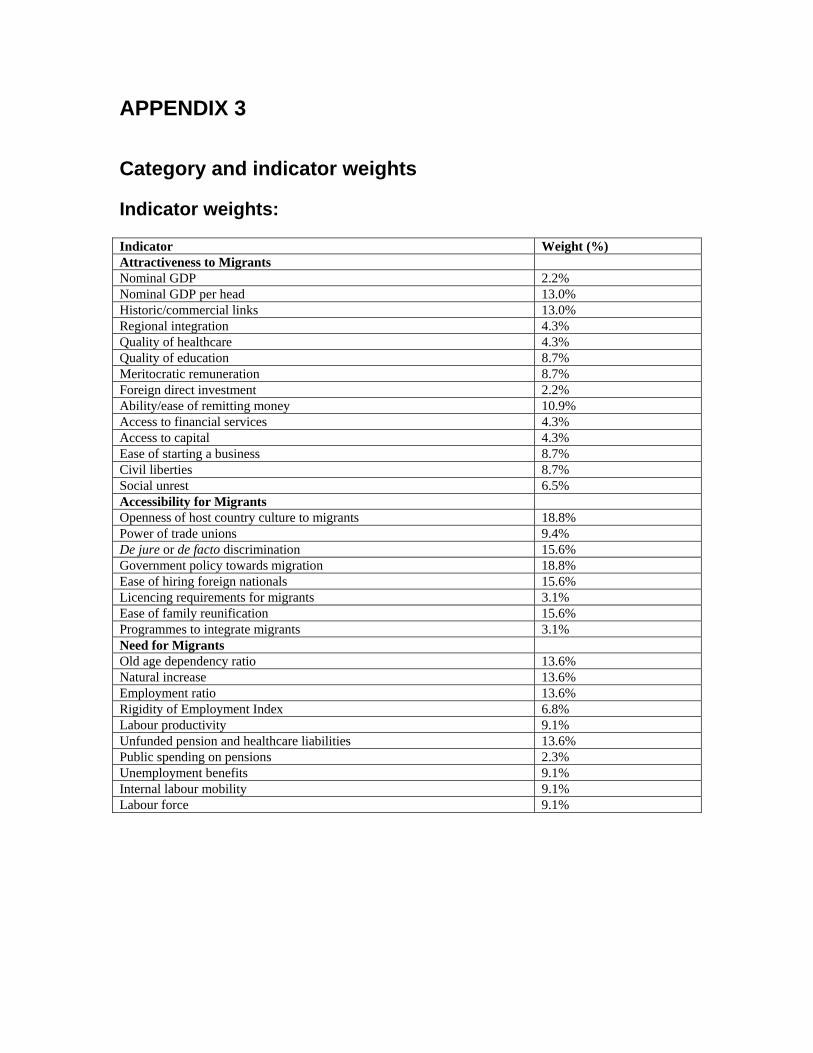
APPENDIX 3 Category and indicator weights Indicator weights: Indicator Weight (%) Attractiveness to Migrants Nominal GDP 2.2% Nominal GDP per head 13.0% Historic/commercial links 13.0% Regional integration 4.3% Quality of healthcare 4.3% Quality of education 8.7% Meritocratic remuneration 8.7% Foreign direct investment 2.2% Ability/ease of remitting money 10.9% Access to financial services 4.3% Access to capital 4.3% Ease of starting a business 8.7% Civil liberties 8.7% Social unrest 6.5% Accessibility for Migrants Openness of host country culture to migrants 18.8% Power of trade unions 9.4% De jure or de facto discrimination 15.6% Government policy towards migration 18.8% Ease of hiring foreign nationals 15.6% Licencing requirements for migrants 3.1% Ease of family reunification 15.6% Programmes to integrate migrants 3.1% Need for Migrants Old age dependency ratio 13.6% Natural increase 13.6% Employment ratio 13.6% Rigidity of Employment Index 6.8% Labour productivity 9.1% Unfunded pension and healthcare liabilities 13.6% Public spending on pensions 2.3% Unemployment benefits 9.1% Internal labour mobility 9.1% Labour force 9.1%
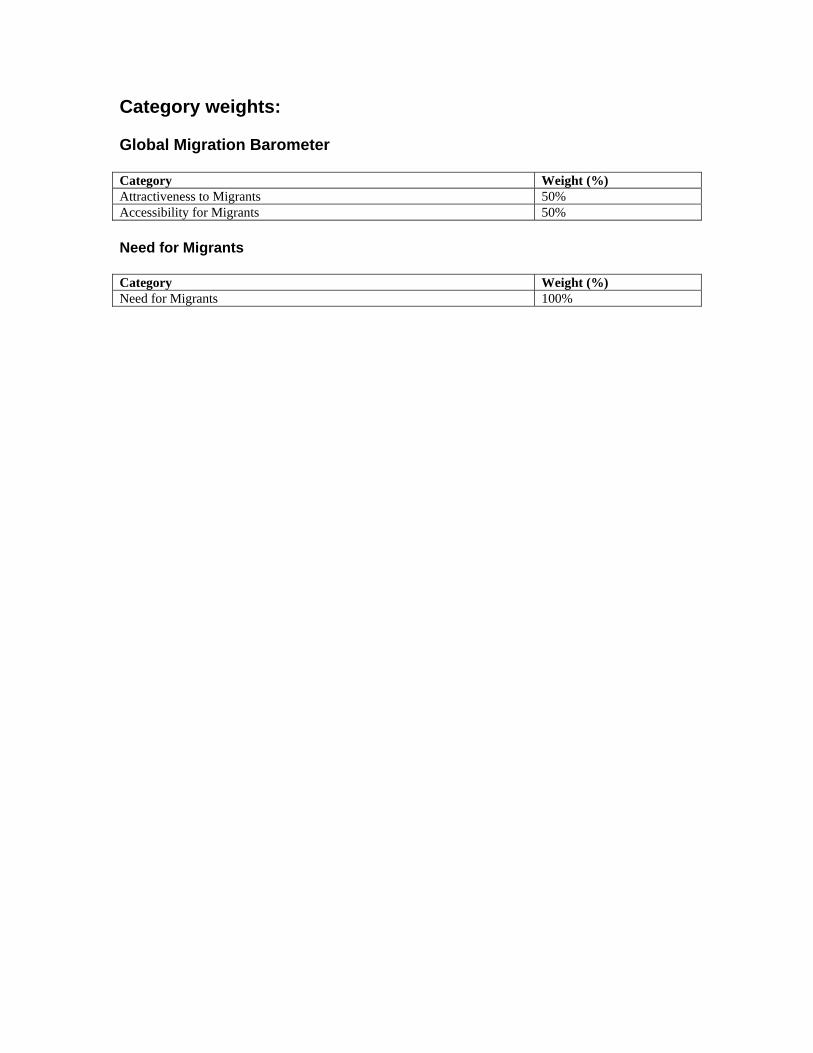
Category weights: Global Migration Barometer Category Weight (%) Attractiveness to Migrants 50% Accessibility for Migrants 50% Need for Migrants Category Weight (%) Need for Migrants 100%
APPENDIX 4 Migration experts Dr Graeme Hugo University Professorial Research Fellow University of Adelaide Dr Demetrios Papademetriou President Migration Policy Institute Thomas Debass Senior Advisor, Remittances and Diaspora, Global Development Alliance USAID Dr Arun Kashyap Advisor, Private Sector Development, Capacity Development Group United Nations Development Programme Donald Terry Manager, Multi-Lateral Investment Fund Inter-American Development Bank Robert Wilke Meins Remittance Specialist Inter-American Development Bank Christopher Sabatini Senior Director of Policy Council of the Americas Dr Rainer Muenz Head, Research & Development ErsteBank Dr Dilip Ratha Senior Economist, Development Prospects Group; Manager, Migration and Remittances World Bank
Related Documents


