Methodology Manual Regional ECONomic System for Federal Spending U.S. Army Corps of Engineers Institute for Water Resources

Welcome message from author
This document is posted to help you gain knowledge. Please leave a comment to let me know what you think about it! Share it to your friends and learn new things together.
Transcript

Methodology Manual
Regional ECONomic System for Federal Spending
U.S. Army Corps of Engineers Institute for Water Resources
Table of Contents
Introduction ..................................................................................................................................... 1
Evaluating Business Line Expenditures.......................................................................................... 3
USACE Operational Expenditures ............................................................................................. 3
USACE Project Expenditures ..................................................................................................... 5
IMPLAN Data and Modifications ............................................................................................ 17
Database Information ................................................................................................................ 27
Other RECONS Data ................................................................................................................ 31
ARRA Approach ........................................................................................................................... 33
Civil Works Budget Economic Impacts ....................................................................................... 34
Civil Works Budget Approach.................................................................................................. 34
CW Budget Economic Impact Results ..................................................................................... 38
References ..................................................................................................................................... 42
Appendix A: Resource Guide for Work Activities and Spending Profiles .................................. 43
Appendix B: Glossary .................................................................................................................. 43
Appendix C: FTE Industry Ratios ............................................................................................... 46
Appendix D: FTE Work Activity Ratios for Indirect and Induced Employment Impacts .......... 57
Appendix E: Generic Multipliers by Industry for Each Type of Region ..................................... 63
Appendix F: USACE Program Codes Mapped to Local and State/Multi State Impact Area...... 63
Appendix G: Local/Regional Impact Areas and Included Counties ............................................ 65
Appendix H: Multi-State Impact Areas and Included States ....................................................... 66
Appendix H: Multi-State Impact Areas and Included States ....................................................... 66
Appendix I: Civil Works Budget Spending Profiles.................................................................... 67

Tables Table 1: CEFMS 2009 USACE Labor and Total Expenditures ..................................................... 4 Table 2: Navigation Work Activities List with Definitions............................................................ 8 Table 3: Dispersion Statistics for the 65 Industry Multipliers in RECONS ................................. 16 Table 4: Private Sector Labor Response Coefficients for $1 Million in Wages ........................... 19 Table 5: ARRA Spending by Work Activity for Sectors that Do Not Exist in Local Impact Areas....................................................................................................................................................... 22 Table 6: ARRA Spending on Services by IMPLAN Sector where No Industry Sectors Exist .... 23 Table 7: ARRA Spending on Manufacturing by IMPLAN Sector Where No Industry Exists .... 23 Table 8: Equipment Rental and Leasing Industries where No Industry Exists ............................ 26 Table 9: ARRA Spending on Services by IMPLAN Sector where No Industry Sectors Exist .... 32 Table 10: Labor and Overhead Percentages by Business Line and Appropriation Account ........ 35 Table 11: Hydropower Construction Profile for CW Budget ....................................................... 36 Table 12: Approach for CW Budget Appropriation Accounts ..................................................... 38
Figures Figure 1. Flow Diagram of USACE Operational Expenditures ..................................................... 3 Figure 2. Flow Diagram of USACE Project Expenditures ............................................................. 6
The Louis Berger Group, Inc. 1 December 29, 2010
Introduction The U.S Army Corps of Engineers (USACE) Institute for Water Resources has developed a Regional ECONomic System (RECONS) that provides accurate and defensible estimates of regional and national job creation and other economic measures such as income, value added, and sales. RECONS will be used as a means to document the performance of direct investment spending of the USACE as directed by the American Recovery and Reinvestment Act (ARRA). RECONS provides the USACE the ability to evaluate project and program expenditures associated with the annual expenditure by the USACE. In addition, RECONS offers USACE users the ability to evaluate economic consequences of USACE projects and programs at a regional level across all business lines, which has not been possible in the past. A primary objective of RECONS was to create a modeling tool to evaluate the economic impacts of the direct investment and operational spending of the USACE, whether through the ARRA or through annual capital and operating budgets. A subsequent objective was to develop a tool that can estimate forward linkages or stemming-from effects of the USACE business line activities. Additional modules of RECONS were developed to examine important stemming-from effects of USACE business lines. This aspect of RECONS will be discussed in a subsequent model design documents. The USACE’s Civil Works (CW) program has authority to carry out projects associated with water resource development in several important mission areas: (1) Navigation; (2) Flood Damage Control/Flood Risk Management; (3) Environment (Aquatic Ecosystem Restoration; Environmental Stewardship; Environment: Formerly Utilized Sites Remediation Action Program [FUSRAP]); (4) Regulatory; (5) Emergency Management; (6) Water Storage for Water Supply; (7) Hydropower; and (8) Recreation. Efforts to develop RECONS centered on these different business lines. This allowed the project team to build in expenditure profiles, appropriate impact areas, and estimate project multipliers that can be used to evaluate economic impacts of business line investments. RECONS differentiates the 1) USACE Operational Expenditures from the 2) Project Expenditures. USACE wages, benefits and overhead expenditures are provided in the Operational Expenditures module of RECONS. The Project Expenditures module of RECONS focuses on expenditures associated with contracted work activities and USACE labor in support of business line activities. RECONS utilizes the IMpact on PLANning (IMPLAN) software and data system, provided by the Minnesota IMPLAN Group, to estimate the economic impacts of Federal Spending. IMPLAN model(s) were created for each USACE project, and the impact area data, multipliers, direct ratios, and geographic capture rates were extracted from the IMPLAN models and imported into RECONS. Each USACE project, associated with a program code, is linked with one or more county-based impact areas. USACE work activities were identified with single or multiple IMPLAN industry sectors, depending on the complexity of the activity, and are termed “spending profiles.” IMPLAN’s trade flows regional purchase coefficients and margins are

The Louis Berger Group, Inc. 2 December 29, 2010
primarily utilized, although in some instances they have been customized to more accurately represent USACE expenditures. This methodology document provides the approach for the development of RECONS. USACE CW expenditures are run through RECONS to estimate their respective effects on local, state, and national economies. In addition to this methodology document, there are four additional documents describing RECONS: the Resource Guide for Work Activities and Spending Profiles (Appendix A of this report), the User’s Guide, and the ARRA Report. A summary of the CW expenditures is included in this document. The ARRA results are summarized in the ARRA Economic Impacts Report.

The Louis Berger Group, Inc. 3 December 29, 2010
Evaluating Business Line Expenditures USACE Operational Expenditures The USACE generates a significant economic contribution through their expenditures on goods and services for administration (expenses not allocated to projects) and on the compensation of government employees. RECONS includes a module that estimates this contribution for fiscal year (FY) 2009. Also included in this module of RECONS are FY2009 non-salary administrative expenses such as overhead and burden, which were budgeted for district office and headquarters operations (and not otherwise accounted for in project analysis by business line). Figure 1 illustrates the approach for the estimation of USACE salary expenditures.
Figure 1. Flow Diagram of USACE Operational Expenditures
USACE provided the project team with aggregate data on labor costs by business line. These expenditures were obtained from the U.S. Army Corps of Engineers Financial Management System /Operations and Maintenance Business Information Link (CEFMS/OMBIL) databases for FY2009 and are summarized in Table 1. The Method of Accomplishment (MOA) codes for this data identified the USACE labor and administrative expenditures (MOA=I2) as well as the total USACE expenditures (MOA=I1, I2, C1, and C2).
USACE Labor Expenditures
Estimate Wages, Benefit, and Overhead Percentages
Aggregate USACE Labor Expenditure Data by Business Line
Identify and Aggregate Labor Expenditures by Appropriate Resource
Code
Identify Employee Compensation & Administrative Expenditures
IMPLAN Library of Employee Compensation and Administrative Expenditures for Each Impact area
Industry and Household Multipliers
Economic Contribution Direct and Induced Effects
Measured as Jobs, Earnings, Output (Sales), and Valued Added (GDP)
IMPLAN Industry and Employee Compensation Spending Profiles

The Louis Berger Group, Inc. 4 December 29, 2010
Table 1: CEFMS 2009 USACE Labor and Total Expenditures
Business Line USACE Labor and Overhead (I2)
Contracted and Other Expenses
(I1, C1, C2) Total
Percent (%) Labor and Overhead
Navigation $483,117,869 $1,719,309,874 $2,202,427,744 22
Flood Risk Management $434,231,948 $1,323,170,542 $1,757,402,490 25 Hydropower $218,891,544 $184,232,448 $403,123,993 54 Regulatory $173,902,940 $11,812,071 $185,715,011 94 Recreation $147,417,171 $191,338,683 $338,755,855 44 Environmental Restoration $105,687,975 $289,385,338 $395,073,313 27 Environmental Stewardship $73,076,015 $59,117,593 $132,193,608 55 Other $67,166,426 $171,241,180 $238,407,606 28 EO $10,753,070 $21,823,049 $32,576,118 33 Water Supply $9,271,209 $47,004,216 $56,275,425 16 JT $2,237,729 $2,085,183 $4,322,912 52 Emergency Management $1,182,740 $1,307,720 $2,490,460 47
Total $1,723,516,168 $4,021,827,897 $5,745,344,065 30 These business line expenditures were specified based on an analysis of the CEFMS/OMBIL data. Overall, approximately 30% of the USACE annual expenditures are associated with wages, benefits, and overhead costs. The next step, as illustrated in Figure 2, is the mapping of labor costs to wages, salaries, benefits, and other administrative costs such as overhead and burden. A further analysis of the Resource Codes within the USACE Labor and Overhead I2 MOA code indicates that approximately 67% of the in-house labor expense is associated with direct labor costs and benefits, while the remaining 33% is overhead and burden costs. USACE labor costs are mapped to IMPLAN Sector 439, Federal Non-Military Government Employee Compensation. Version 3 of IMPLAN allows impacts to be estimated for employee compensation, which includes both wages/salaries and benefits. For consistency with IMPLAN’s employee compensation approach, the USACE payroll costs should include both direct labor or wage costs as well as benefits. IMPLAN Sector 439 allocates approximately 13.6% of the direct output to a capital consumption allowance (ratio of total output to employee compensation) (Lindall, 2010). Since all of this spending should be allocated to employee compensation, the income allocated to this sector was increased by 13.6% to capture all impacts as employee compensation.

The Louis Berger Group, Inc. 5 December 29, 2010
An advantage of running employee compensation as a labor income change is that IMPLAN provides an adjustment for disposable income or marginal propensity to spend for each identified impact area. This approach assumes that all government payroll spending is distributed across all of the household income sectors, using the same distribution as the impact area as a whole. Sensitivity analyses were run to compare the Sector 439 multipliers with those of the household income change for $50,000 to $75,000 (less payroll taxes). There were no consistent differences in the results. For example, sometimes Sector 439 response coefficients were greater and sometimes the response coefficients for the household income changes ($50,000 to $75,000 income level) was greater. These differences ranged from 3% to 15%. IMPLAN’s Sector 439 direct ratios are also utilized for this impact, resulting in direct, indirect, induced, and total effects of the USACE wages and overhead expenditures. USACE overhead expenditures for the business lines are also included in this part of RECONS. The USACE cost of doing business includes overhead, facility burden, and other operational expenditures for buildings, equipment, and facilities. These expenditures were extracted from the CEFMS/OMBIL labor costs with the applicable Resource Codes and are mapped to IMPLAN Sector 386, Business Support Services. This sector supports the operations and maintenance of facilities. The choice of this sector was approved by IMPLAN expert, Greg Alward. Any USACE labor expenditures either for ARRA or for the CW spending assume a default spending profile of 67% wages, salaries, and benefits and 33% overhead and burden. As described previously, this allocation was based on the CEFMS/OMBIL Resources Codes within the In-house Labor (I2) Account.
USACE Project Expenditures In its mission to contribute to the national welfare and to serve the public, the USACE has four areas of emphasis for its CW program including:
• development and management of the nation’s water resources • protection, restoration, and management of the environment • disaster response and recovery • engineering and technical services (USACE 2004)
In meeting these objectives, the USACE makes a number of direct government expenditures on goods and services. These expenditures range from contracting large construction projects to operating and maintaining water-related infrastructure throughout the U.S. Figure 1 shows how contracted project expenditures of the USACE can be evaluated using an expenditure approach (Alward 2009). This method, also known as a “bill-of-goods” or “second-round” approach seeks to disaggregate project expenditures into key component activities, where appropriate, so these activities can be mapped separately to the corresponding industry in IMPLAN for estimation of the multiplier effects. Because the nature and magnitude of project expenditures vary by business line, research was undertaken to identify the types of business line expenditures. Thus, the first line in the diagram

The Louis Berger Group, Inc. 6 December 29, 2010
below shows how USACE project expenditures would be tracked by business line. Typical project activities associated with each of the business lines as well as project activities that may occur across all of the business lines were identified.
Figure 2. Flow Diagram of USACE Project Expenditures
In order to estimate the full economic impact (i.e., direct effects plus indirect and induced multiplier effects through backward-linkages) of USACE work activity expenditures, the project team estimated a series of industry multipliers, using the IMPLAN model, that can be applied to the expenditures discussed above. Multipliers were estimated for every output measure reported, including number of jobs, employment earnings, output (sales), and value added (gross domestic product [GDP]). The multipliers were specific to the local and state (or multi-state) in which the activity takes place (see section on Impact Areas). Economic impacts are identified for three categories of impacts: direct, indirect, and induced. For purposes of this effort, the direct effect is defined as the work activity expenditures made by the USACE under each business line. In the impact area in which a project is located, direct effects represent that proportion of the expenditure in each industry that flows to material and service providers in the region. For employment and earnings measures, the direct effect represents the jobs associated with the work activity (e.g., construction jobs onsite that are likely to be filled by residents of the region [i.e., after adjustment for in-commuting by workers residing outside the region]). The extent to which an effect is captured within the impact area is represented by regional purchase coefficients (RPCs), which are primarily obtained from the IMPLAN model. This parameter is based on trade flow data for each industry sector. For retail and wholesale trade sales, primarily associated with the purchase of manufactured products, materials, or structures, a margin is applied to the direct effect, allocating it among the
Business Line Work Activities
Expenditure by Work Activity
Navigation, Hydropower, Environmental,
Flood Risk, Emergency Management, Regulatory, Recreation, Water Storage
Construction, Operations and Maintenance, Investigations
Spending Profile Labor, Materials, Equipment, Fuel, Services and Other Expenditures
Industry Multipliers for Impact area
Economic Contribution Direct, Indirect and Induced Effects Measured as Jobs, Earnings, Output
(Sales), and Valued Added (GDP)
IMPLAN Industry Multipliers (Region, State, Nation)

The Louis Berger Group, Inc. 7 December 29, 2010
manufacturing, retail trade, wholesale trade, and transportation sectors. Margins are further described below. The indirect effects include the backward-linked suppliers for any goods and services used by the directly affected activities. The induced effect to the region occurs from household expenditures associated with workers’ earnings from both direct and indirect businesses. RECONS will also be capable of analyzing future or prospective USACE work activity expenditures in each of the business lines. The analysis of these new expenditures will be based on the work activities, and spending profiles and multipliers derived from the ARRA FY2009 project dataset. The user will have the opportunity to enter key information about the project and view and edit the spending profile, as necessary to accurately represent the proposed activity. To summarize, RECONS will use a series of industry multipliers, derived from IMPLAN, to characterize the contribution of USACE work activities to a region’s economy. The multipliers used will correspond to the distribution of work activity expenditures across key spending categories (spending profile). To facilitate the analysis of existing and proposed investments, projects will be categorized by business line and work activity. Work activities by business line as well as general work activities that fall across all business lines are described in the Resource Guide for Work Activities and Spending Profiles (Appendix A). Work Activities and Spending Profiles Work activities associated with each of the USACE CW business lines were identified, as well as work activities that are currently associated with multiple business lines or are general enough that they could be included in all business lines. Information on work activities was obtained from USACE documents, web searches, and interviews with USACE experts and a number of key vendors. A detailed description of the work activities, the spending profiles, and interviews conducted on which these profiles and categories were developed is provided in the Resource Guide for Work Activities and Spending Profiles (Appendix A). The work activity classification system serves two purposes:
1. To organize and arrange both USACE CW ARRA-funded projects as well as CW federal work activities in a manner that is easily identifiable to the end-users of RECONS.
2. To create a mapping structure whereby USACE work activities map directly to one or multiple IMPLAN sectors.
As an example, Table 2 provides the work activities and definitions associated with the navigation business line (dredging activities were handled separately).

The Louis Berger Group, Inc. 8 December 29, 2010
Table 2: Navigation Work Activities List with Definitions
Work Activity Work Activity Definition Construction and Repair of Concrete / Wooden Breakwaters and Jetties
Concrete or wooden breakwater and seawall construction or repair. Examples include construction of rubblemounds, breakwaters, breakwater extensions, and the purchase of concrete and other materials for repairs to historic wooden structures.
Construction and Repair of Large Stone Breakwaters and Jetties
Breakwater and seawall construction or repair. Examples include construction of rubblemounds, breakwaters, breakwater extensions, and the purchase and placement of jetty stone.
Lock Construction of On-Site Features
New construction and major rehabilitation of locks (using either wet or dry construction practices, such as cofferdams). Examples include foundation and drainage work, construction of guide walls and partial height monoliths, and construction and rehabilitation of access roads and bridges.
Lock or Dam Gate Fabrication and Installation
Fabrication or installation of lock or dam gates. Examples include the fabrication, transportation, and installation of lock gates, culvert valves, new miter gates, and lift gates.
New Construction or Major Repair of Navigation or Multi-Purpose Dams
New construction or major rehabilitation of dams and related structures. Examples include drainage, foundation work, earthworks, seepage control, stilling basins, spillways, stoplogs, outlet works, intake structure, power intake works, water supply systems, pumping plants, access roads, and bridges.
Repair and Maintenance of Locks
Repair and maintenance of locks. Examples include rehabilitation of lockport controlling works, fabrication of new culvert valve machinery, tainter gate shell placement, lock culvert valve machinery repairs, and replacement of mechanical/electrical equipment.
Repair and Maintenance of Navigation or Multi-Purpose Dams
Repairs and maintenance to multi-purpose dams. Examples include valves, associated mechanical/electrical equipment, and other related systems.
Structural Activities for Channel Maintenance (does not include dredging)
Activities undertaken to stabilize banks (such as rehabilitation of canal walls) and activities to control erosion near navigation areas.
Placement Area Construction and Rehabilitation
Carrying out the construction or rehabilitation of placement areas, including activities to increase dredged material placement capacity to reduce future maintenance costs.
All work activities map to at least one IMPLAN sector and in some cases map to multiple sectors, depending on the complexity of the activity. For instance, it is anticipated that a large infrastructure construction project would have several items within a spending profile, while a contract to provide security services at a facility may have only one item. For complex projects, sub-groupings (e.g., materials separated into steel, concrete, glass; or services into architecture/engineering, security, business services) will be added, as appropriate, to best match expenditure types to IMPLAN industry categories.
The Louis Berger Group, Inc. 9 December 29, 2010
For each business line, the Resource Guide for Work Activities and Spending Profiles (Appendix A) identifies and defines the typical work activities, describes the associated spending profile, and provides a rationale for each spending profile. These profiles are based on an evaluation of how similar the work activities associated with the business align with the industries and their activities, as defined by the IMPLAN model. If the work activities aligned well with an IMPLAN sector, the spending profile was mapped to only one IMPLAN sector. The North American Industry Classification System (NAICS) was consulted for relevant industry sectors as well as IMPLAN’s bridge to the NAICS codes.
Work activities mapping to more than one IMPLAN sector are denoted as “multi-sector” spending profiles. Generally, the multi-sector spending profile table presents: (1) the cost components; and (2) the estimated geographical capture rate (local, state, national) of those cost components. The spending profile of the cost components identifies the proportion of work activity spending associated with each of the cost components. The methodology of how labor costs and impacts are estimated in RECONS is provided in the General Work Activities section of the Resource Guide (Appendix A), under the labor work activities.
For example, turbine rehabilitation projects (hydropower business line) include the purchasing of the turbines and the installation and assembly labor. Typically, the costs of these projects are 55% turbine manufacturing costs and 45% labor costs, which are assigned to two distinct IMPLAN sectors. These are the cost components of this spending profile.
The spending profile also identifies the geographical capture rate of the cost components, which is discussed in the next section.
In general, IMPLAN’s margins are utilized for the analysis, although a number of industry sector margins were modified to more accurately estimate the economic impacts of purchasing work activities. Additional discussion on margins is provided in the Margins section in this document.
RECONS provides the general or default spending profile—the cost allocations and geographic capture rate—of the “multi” work activities. This general or default spending profile is provided if the user of RECONS does not have information on the specific costs of the project. However, RECONS user is also able to modify the spending profile cost allocation and the geographic capture rate if the user has more information from the project cost estimates or, for example, understands the contractor and its labor force.

The Louis Berger Group, Inc. 10 December 29, 2010
The development of work activities and spending profiles was accomplished through a comprehensive program of data analysis, research, and interviews. Additionally, each ARRA budget line item work description by business line was researched to better understand the nature of work being contracted for USACE work activities.
Geographical Capture Rates
The spending profile also identifies the geographical capture rate, also called Local Purchase Coefficient (LPC) in RECONS, of the cost components. The geographic capture rate is the portion of USACE spending on industries (sales) captured by industries located within the impact area. In many cases, IMPLAN’s trade flows Regional Purchase Coefficients (RPCs) are utilized as a proxy to estimate where the money flows for each of the receiving industry sectors of the cost components within each of the impact areas (See additional description of RPCs below). However, in some cases, the USACE or contractor experts were able to provide better geographic capture rate (economic leakages) estimates than the trade flows RPCs in IMPLAN, and the geographic capture rate was customized for these specific industry sectors. For example, the geographic allocation for labor on a lock construction project could include 20% labor from the local region (general laborers and likely locally residing employees), 50% labor pool from the state (includes the local), and 50% highly specialized labor coming from outside the region. A detailed description of the rationale regarding the selection of IMPLAN sectors and their RPCs or customized RPCs is provided for each work activity in the Resource Guide (Appendix A of the Methodology Manual).
Impact Areas
RECONS provides the ability to evaluate impacts on the three levels of geography:
1. Local or regional 2. State or multi-state 3. National
The smallest level of geography was based on the nature of the specific project or work being evaluated and the geographic extent of the work activity (e.g. discrete project location such as a single lock rehabilitation versus a linear project such as a channel dredging project spanning
The Louis Berger Group, Inc. 11 December 29, 2010
multiple counties). Each local or regional impact area was associated with a state or multi-state region. For example, the Kansas City district office was associated with the Kansas City metropolitan statistical area (MSA), which was associated with the Kansas and Missouri multi-state region.
Impact areas were determined during the model development stage based on project location and the type of work activity. Initially the ARRA projects, which were identified by program codes, were researched along with the ARRA work descriptions for each of the projects. In general USACE projects, which are usually identified with a unique program code, are names of locations of the projects.
There were approximately 784 program codes associated with the almost 3,000 ARRA budget line items. A list of the ARRA projects is found in the ARRA report.
Impact Area Types
Each of the program codes was identified with one or multiple local impact areas. The impact area types for the smallest level of geography, or the local regions, were organized into four different types of regions:
• Metropolitan • Micropolitan • Rural • Large scale
In some cases the program code and the accompanying work activity were not identified with a local impact model, only a state or nation. For example, the program codes for the Inspection of Completed Works were only associated with a state model; no local impact area was identified. A number of program codes were identified with only the national model if the work fell in multiple locations that were not easily identifiable. Examples of program code names where this was the case include Hydrologic Studies, Flood Damage data, National Dam Safety Program, and others. For the ARRA projects, there were 61 program codes that were not identified with local impact areas (only state impact areas were identified), and there were 21 program codes that were only identified with the national region (local or state or multi-state regions were not identified).

The Louis Berger Group, Inc. 12 December 29, 2010
Multi-county metropolitan and micropolitan regions were utilized if a site-specific or large-scale project fell within one or more counties within the Office of Management and Budget (OMB)-defined metropolitan or micropolitan statistical area. These core-based statistical areas (CBSAs) are defined based on population and labor force commuting patterns. The U.S. Census Bureau summarizes the OMB-defined statistical areas this way:
The 2000 standards provide that each CBSA, including both metropolitan and micropolitan statistical areas) must contain at least one urban area of 10,000 or more in population. Each metropolitan statistical area must have at least one urbanized area of 50,000 or more inhabitants. Each micropolitan statistical area must have at least one urban cluster of at least 10,000 but less than 50,000 population. Under the standards, the county (or counties) in which at least 50 percent of the population resides within urban areas of 10,000 or more in population, or that contain at least 5,000 people residing within a single urban area of 10,000 or more in population, is identified as a "central county" (counties). Additional "outlying counties" are included in the CBSA if they meet specified requirements of commuting to or from the central counties. Counties or equivalent entities form the geographic "building blocks" for metropolitan and micropolitan statistical areas throughout the United States and Puerto Rico.
These CBSAs were utilized to capture the majority of the workforce surrounding a USACE project location as workers are not necessarily coming from the county in which the project resides, but from the entire micropolitan or metropolitan region. Any site-specific region that did not fall in a metropolitan or micropolitan area (county) was defined as a rural region (i.e., counties with less than 10,000 people). The counties associated with the rural impact areas were identified based on an approach called Functional Economic Areas, as developed by the U.S. Department of Agriculture (USDA) Forest Service (METI Corp n.d.; Retzlaff 2008). For projects that were not located in a metropolitan or micropolitan area, the USDA Forest Service Protocols for Delineation of Economic Impact Analysis Areas (Forest Service Protocols or Protocols) on non-metro project locations were followed.
The Forest Service Protocols (METI Corp n.d.) provide step-by-step instructions on how to use LED OnTheMap, a tool developed by Longitudinal Employer-Household Dynamics (LEHD) Program from the U.S. Census Bureau in collaboration with the state labor departments to analyze labor flows. The Protocols also establish criteria on how to use this commuting data to define study areas that are comparable to the criteria used by the Office of Management and Budget (OMB), the Bureau of Economic Analysis (BEA) and the Bureau of Labor Statistics (BLS). The LED OnTheMap tool and the Forest Service Protocols are further explained below.
The Louis Berger Group, Inc. 13 December 29, 2010
The Protocols have three main components:
1. Issue Identification 2. Labor Market Protocols 3. Trade Flow Protocols
During the issue identification stage, the question to ask is, “Are the issues fundamentally concerned with labor and income or with business interactions?” If the dominant issue is labor and income, then the study area will be defined based on labor flows. For instance, the project will create jobs; How will it affect the local economy? If the dominant issue is business interactions, then the study area will be defined based on trade flows. The project will lead to the closing of a pulp mill; How will this affect the local sawmills, which are the major suppliers to pulp mills? If the issues are general in nature, such as, “Consider the local economic impacts of the alternatives…”, the labor and income approach will be used (USDA 2003).
After a review of the project activities by business line, the study team utilized the Protocols to determine impact areas to analyze the economic contribution of non-metropolitan or non-micropolitan projects.
Functional economic areas based on labor markets are derived from data on commute flows. The general rules for defining an impact area using labor flow data from LED OnTheMap included in the Forest Service Protocols are as follows:
• Include the top counties in terms of residential location of workers until a cumulative share of jobs reaches at least 60% in the selection area; subject to the following:
o Counties that account for at least 25% of the jobs in the selection area should always be included.
o Counties that account for less than 25% of jobs may be included if at least 25% of its residents work in the selection area.
Finally, the last rule excludes urban counties if the issue is focused on rural or non-metropolitan counties. As a result of following the Protocols, site-specific program codes that were not in MSAs or micropolitan statistical areas were identified with single or multi-county impact areas.
Large-scale impact areas generally required more research of locations. Some of the program codes that were large-scale projects, such as the Ohio River, were identified with multiple sub-program codes. This approach is further described in the following section. These impact areas typically included metropolitan, micropolitan, and rural counties along and adjacent to river stretches. For example, if a river stretch included a metropolitan area, such as Pittsburgh, all counties along the river on both sides and those counties comprising the Pittsburgh MSA (7-county region) were included in the impact area.

The Louis Berger Group, Inc. 14 December 29, 2010
Approach for Identifying the Impact Areas
There were approximately 784 program codes and names in the ARRA data. These program codes were reviewed to identify program codes that have potentially large-scale locations. These codes needed additional research to define the impact area. The process to identify the local impact areas associated with the more site-specific local regions began with the project team obtaining part of the Watershed Investment Decision Tool geographic information system (GIS) locations. The names of each of the program codes were matched with those in the Watershed Investment Decision Tool. The names that matched were defined with a county. Those counties were then identified as associated with an MSA, a micropolitan statistical area, or neither. Counties that were not associated with an MSA or a micropolitan statistical area were analyzed through the functional economic area, labor market approach, described in the previous section.
The potentially large-scale project locations (program code names) were researched by looking at the ARRA work descriptions and researching USACE district web sites to identify the location or locations of the work being undertaken. For 454 program codes, multiple impact areas were created for one program code; these were titled as “location ID” and were numbered with increasing digits added to the end of the program code. For example, the Allegheny River (program code 002300) had seven locations identified within this program code, adding seven location IDs to the database, 0023001 to 0023007. In all cases, where multiple impact areas were identified for a program code, a broad area was defined which was inclusive of the site-specific locations. This broad impact area was utilized for the CW budget economic impacts.
The recreation impact areas were also analyzed in a slightly different fashion. Many of these areas, typically lake regions, are encompassed within one or multiple counties. The GIS coordinates from the Watershed Investment Decision Tool identified the dam location for these lake regions. However, work activities at these lakes occur at the dam location, but also in other locations within the recreation area. For this reason, both site-specific (typically, dam locations), and broader impact areas were created for these program codes. The project team obtained the multi-county regions from the Recreation Stemming-From Effects Module, which identified multi-county impact areas associated with counties within 30 miles of the recreation area. These multi-county impact areas were analyzed to ascertain if any of the included counties were also included in a MSA or micropolitan statistical area. If one or more of the counties were included in the metropolitan statistical area, then the impacted region included the multi-county 30-mile region as well as all counties within the MSA or micropolitan statistical area.
If the large-scale project was a river stretch, the impact area included the adjacent river counties and adjacent MSA and micropolitan statistical area counties in the impact area. If the ARRA work description identified a specific site location, one was created. In all cases, if the project location fell in an MSA or a micropolitan county, all other counties within that CBSA were included in the impact area. Similarly, if the county was not in a CBSA, then a functional economic analysis was undertaken.

The Louis Berger Group, Inc. 15 December 29, 2010
In total, approximately 1,146 local impact areas were created for the ARRA analysis: 409 MSAs; 345 micropolitan statistical areas; 197 rural regions; and 42 large-scale regions. In addition, there are 50 state and 98 multi-state models in RECONS.
The CW budget program codes were also added into RECONS. An additional 467 program codes were in the CW budget that did not occur in the ARRA projects. Large-scale program code names were flagged and research as described above. Of the 467 program codes, 99 program codes were not identified with local impact areas, only state impact areas, and 49 program codes were not identified with local or state (or multi-state) regions, only the nation. Of the 467 program codes, 409 matched existing impact areas associated with the ARRA data, while 59 new impact areas needed to be created.
Estimating Generic Multipliers and LPCs
Generic multipliers were created for the situation when a specific impact area is not available in RECONS. If the RECONS user does not find a relevant impact area for the analysis, he or she can choose to use generic multipliers developed from the available impact areas in RECONS. The multipliers typically vary by the rural or urban nature of the economy, so these were analyzed based on the types of local impact areas, as discussed in this section.
There were four types of local impact areas: metropolitan; micropolitan; rural; and large-scale study areas. The multiplier table was divided into four subsets based on the impact area types for all the ARRA projects. There were 993 impact areas on which these generic multipliers were calculated: 409 MSAs; 345 micropolitan statistical areas; 197 rural regions; and 42 large-scale regions.
Multipliers that were zero for industries absent from impact areas were deleted so the averages would not be skewed. Generic multipliers were developed for each impact area type by averaging relevant multiplier (direct, indirect, and induced) for each sector for each type of impact (employment, labor income, value added, output) for each type of region. The average LPC was also created for each local impact area. The generic multipliers and LPCs are shown in Appendix E.
Dispersion statistics around the mean were analyzed to ensure that the variations were not too broad for each of the region types. The range and standard deviation for the multipliers for the 65 industries in RECONS were analyzed. There is one instance where the average of the standard deviations for each region type is greater than one, which occurs in the direct output ratio for the micropolitan regions.

The Louis Berger Group, Inc. 16 December 29, 2010
Table 3: Dispersion Statistics for the 65 Industry Multipliers in RECONS
Multipliers and Statistic
Indirect Output
Induced Output
Direct Employment
Indirect Employment
Induced Employment
Direct Labor Income
Indirect Labor Income
Induced Labor Income
Direct Value Added
Indirect Value Added
Induced Value Added
Rural Models Average of Ranges 0.20 0.17 7.75 1.51 1.74 0.17 0.06 0.05 0.22 0.10 0.10 Micro Models Average of Ranges 0.28 0.26 7.56 2.28 2.42 0.26 0.08 0.08 0.34 0.14 0.15 Metro Models Average of Ranges 0.58 0.53 6.89 3.21 4.03 0.29 0.18 0.17 0.39 0.29 0.31 Large Scale Models Average of Ranges 0.40 0.41 2.74 1.79 2.71 0.15 0.13 0.14 0.20 0.20 0.24 Rural Models Averages of Standard Deviation 0.01 0.01 0.04 0.03 0.04 0.00 0.00 0.00 0.00 0.00 0.00 Micro Models Average of Standard Deviation 0.06 0.05 1.03 0.42 0.46 0.04 0.02 0.02 0.06 0.03 0.03 Metro Models Averages of Standard Deviation 0.11 0.10 0.85 0.57 0.74 0.04 0.04 0.03 0.06 0.06 0.06 Large Scale Models Average of Standard Deviation 0.10 0.11 0.62 0.44 0.76 0.03 0.03 0.04 0.05 0.05 0.06
The Louis Berger Group, Inc. 17 December 29, 2010
Choosing an Impact area For evaluation of new projects in locations not yet identified, one of the following two methods should be employed as, appropriate.
• Utilize an impact area which is loaded into the system for another project. This option can be used if the project is located in the same county or CBSA or other functional economic area as a project that was previously uploaded into RECONS. Searching by county to identify the various impact areas from which to choose is possible.
• The user can identify the type of location in which the project is expected to occur. Generic multipliers are identified for the following types of regions: rural, micropolitan, metropolitan, and large-scale (see previous definitions). The generic multipliers can be used to estimate economic contribution where a precise study area has not been determined.
IMPLAN Data and Modifications Extracting IMPLAN Data Minnesota IMPLAN Group, Inc. (MIG) created IMPLAN models for more than 1,200 impact areas defined by the project team, as described in the previous section. The multipliers within these models were created with RPCs based on the trade flow dataset included in IMPLAN Version 3 (see description below on Trade Flows RPCs). A unique model ID was assigned to each impact area. There are seven types of impact areas:
• Metropolitan areas (one or more counties) • Micropolitan areas (one or more counties) • Rural areas (one or more counties) • Large-scale study area (group of counties) • State (single state) • Multi-state (group of states) • Nation
The project team exported the following tables from each IMPLAN model:
1. StudyAreaGeneralInformation – This table provides the names and Federal Information Processing Standard (FIPS) codes of the counties and states included in the model. It also provides total number of households and total personal income. This table includes one record for each county within the study area.
2. StudyAreaIndustryData – This table provides study area overview information including study area output, jobs, labor income, and value added in 2008. This table includes one record for each IMPLAN industry (440).

The Louis Berger Group, Inc. 18 December 29, 2010
3. CommonMargins – This table include both industry and household margins. Type 1 margins refer to household margins, while Type 2 refers to industry margins.
4. RegionalCommodityBalances – This table includes the average RPC. This table includes one record for each IMPLAN industry (440).
5. ReportsMultipliersOutput – This table includes the direct output ratio, and indirect and induced output multiplier, per million dollars in output. This table includes one record for each IMPLAN industry (440).
6. ReportsMultipliersEmployment – This table includes the direct employment ratio, indirect, and induced employment multiplier, per million dollars in output. This table includes one record for each IMPLAN industry (440).
7. ReportsMultipliersLaborIncome – This table includes the direct labor income ratio, and indirect and induced labor income multiplier, per million dollars in output. This table includes one record for each IMPLAN industry (440).
8. ReportsMultiplierValueAdded – This table includes the direct value-added ratio, and indirect and induced value-added multiplier, per million dollars in output. This table includes one record for each IMPLAN industry (440).
The Project Team combined the extracted IMPLAN data into four summary tables for use in RECONS:
1. Impact area overview (based on StudyAreaGeneralInformation table from IMPLAN models for metropolitan, micropolitan, rural, and large scale study areas)
2. Local baseline and multipliers (based on StudyAreaIndustryData, RegionalCommodityBalances, ReportsMultipliersOutput, ReportsMultipliersEmployment, ReportsMultipliersLaborIncome, and ReportsMultipliersValueAdded tables from IMPLAN models for metropolitan, micropolitan, rural, and large-scale study areas)
3. State baseline and multipliers (based on RegionalCommodityBalances, ReportsMultipliersOutput, ReportsMultipliersEmployment, ReportsMultipliersLaborIncome, and ReportsMultipliersValueAdded tables from IMPLAN models for state and multi-state study areas)
4. National baseline and multipliers (based on RegionalCommodityBalances, ReportsMultipliersOutput, ReportsMultipliersEmployment, ReportsMultipliersLaborIncome, and ReportsMultipliersValueAdded tables from IMPLAN models for national study areas)
Private Sector Labor Response Coefficients Household income and labor income expenditures are not associated with direct multipliers in IMPLAN, but have vectors of spending associated with differing income levels. All USACE labor is estimated through IMPLAN Sector 439—Federal Government, Non-Military Employee Compensation. However, to determine the private sector labor impact on local and regional
The Louis Berger Group, Inc. 19 December 29, 2010
economies, employee compensation response coefficients were estimated for each of the types of impact areas. The household income level of $35,000 to $50,000 was utilized for these estimates based on the average income for a worker in the construction industry (IMPLAN Sector 36). Impact areas were identified as:
• Metropolitan • Micropolitan • Rural • Large-scale, state, or multi-state • The nation
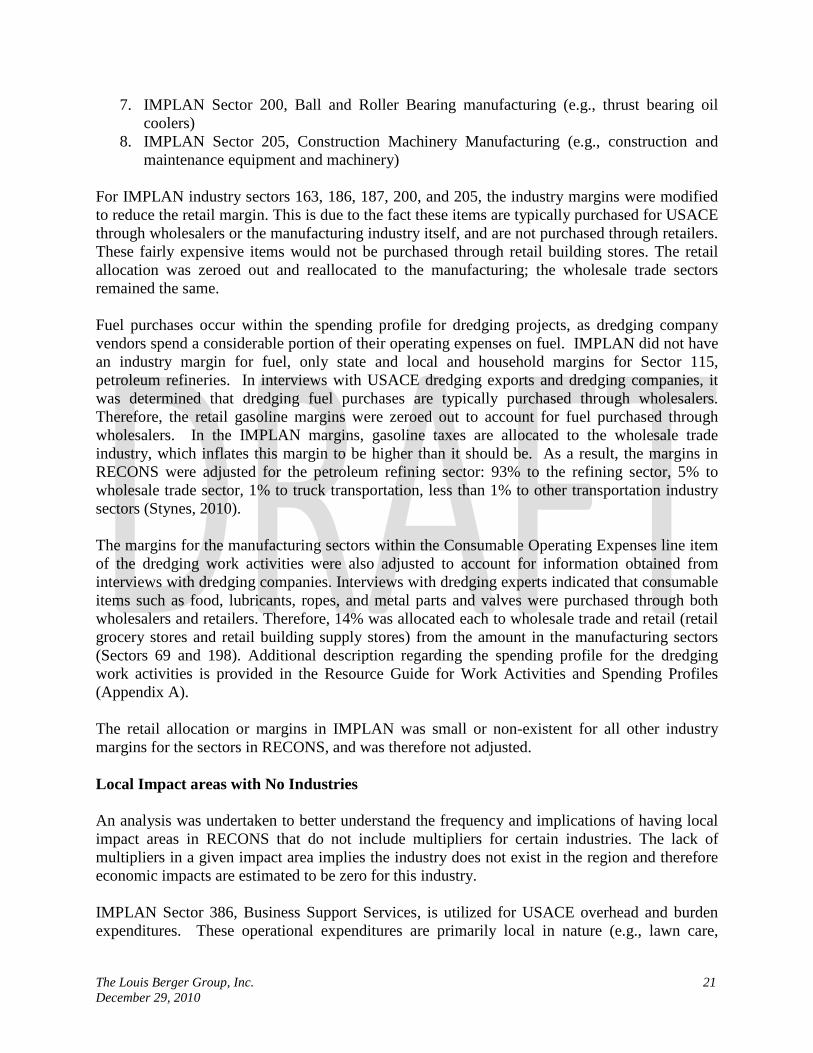
One million dollars less 15.3% payroll taxes was run through ten randomly chosen impact areas of each type. Average response coefficients for each type of region were computed and are shown in Table 4. These are the induced response coefficients, representing jobs, income, value added, and output effects associated with households spending their income within the local and regional economies. The direct employment ratio of employee compensation to employment was utilized from IMPLAN Sector 36, Other New Non-Residential Construction, for each region type. For example, in metropolitan regions, $1 million in wages equates to 24.2 jobs in the construction industry. Other direct ratios for output, value added, and labor income are assumed to equal the employee compensation amount or the amount allocated to labor. These private sector labor response coefficients are summarized in Table 4.
Table 4: Private Sector Labor Response Coefficients for $1 Million in Wages
Type of Impact area
Direct Induced Employment (Number of
Jobs)
Employment (Number of
Jobs) Labor
Income Value Added Output
Metropolitan 24.2 6.61 $280,159 $505,916 $852,362
Micropolitan 35.8 5.12 $153,659 $288,451 $490,970
Rural 42.9 3.58 $97,119 $204,194 $345,804
State/Multi-State/Large-
scale 27.1 7.77 $310,097 $551,598 $960,371
Nation 24.9 11.7 $554,792 $972,984 $1,831,594

The Louis Berger Group, Inc. 20 December 29, 2010
Trade Flow Regional Purchase Coefficients (RPCs) and LPCs MIG defines RPC as the proportion of the total demand for a commodity by all users in the impact area that is supplied by producers located within the impact area. IMPLAN Version 3 incorporates a new approach to measuring RPCs: the IMPLAN National Trade Flows Model. This new approach utilizes a doubly constrained gravity model using IMPLAN’s county-level estimates of commodity demand and supply. In general terms, the import and export flows between regions are thought to be proportional to the “mass,” “attractiveness,” or “size” of an economy and inversely proportional to the “distance” or cost of moving goods and services between them. There are three main databases used in the Trade Flows Model: the Oak Ridge National Laboratory county-to-county distances by mode of transportation, the Commodity Flows Survey ton-miles data by commodity, and the IMPLAN commodity supply and demand by county. In RECONS’ application, the RPC is utilized as a proxy for the portion of industry sales (as a result of USACE spending) within an impact area that is supplied by industries and producers within the impact area. In many cases, RECONS utilizes IMPLAN Trade Flows RPCs as the default geographic capture rate or LPC. In a number of cases, these rates were customized when information collected from industry and USACE experts was better than the default trade flows values. These customized geographic capture rates are explained in detail in the Resource Guide for Work Activities and Spending Profiles (Appendix A). Margins Margins represent the difference between producer and purchaser prices. Margins allocate the expenditures among the industry sectors that manufacture the products, the retail and wholesale trade industries that sell the products, and the industries that transport the products, including truck, rail, waterborne, and pipeline sectors. IMPLAN’s industry margins, extracted from the IMPLAN data, are primarily utilized in RECONS to allocate these expenditures and revenues for all the manufacturing, transportation, and trade industry sectors to which industry margins are applied. For RECONS, several of the margins included in IMPLAN were modified as identified below.
1. IMPLAN Sector 69, Other Food Manufacturing (e.g., consumable operating expenses for dredging projects -- food)
2. IMPLAN Sector 115, Petroleum Refining (e.g., fuel or gasoline) 3. IMPLAN Sector 163, Other Concrete Product Manufacturing (e.g.,concrete security
barriers) 4. IMPLAN Sector 186, Plate Work and Fabricated Structural Product Manufacturing (e.g.,
pre-fabricated metal/aluminum structures) 5. IMPLAN Sector 187, Ornamental and Architectural Metal Products Manufacturing (e.g.,
elevators) 6. IMPLAN Sector 198, Valve and Fittings Other than Plumbing (e.g., consumable
operating expenses -- non-durable items for dredging projects)
The Louis Berger Group, Inc. 21 December 29, 2010
7. IMPLAN Sector 200, Ball and Roller Bearing manufacturing (e.g., thrust bearing oil coolers)
8. IMPLAN Sector 205, Construction Machinery Manufacturing (e.g., construction and maintenance equipment and machinery)
For IMPLAN industry sectors 163, 186, 187, 200, and 205, the industry margins were modified to reduce the retail margin. This is due to the fact these items are typically purchased for USACE through wholesalers or the manufacturing industry itself, and are not purchased through retailers. These fairly expensive items would not be purchased through retail building stores. The retail allocation was zeroed out and reallocated to the manufacturing; the wholesale trade sectors remained the same. Fuel purchases occur within the spending profile for dredging projects, as dredging company vendors spend a considerable portion of their operating expenses on fuel. IMPLAN did not have an industry margin for fuel, only state and local and household margins for Sector 115, petroleum refineries. In interviews with USACE dredging exports and dredging companies, it was determined that dredging fuel purchases are typically purchased through wholesalers. Therefore, the retail gasoline margins were zeroed out to account for fuel purchased through wholesalers. In the IMPLAN margins, gasoline taxes are allocated to the wholesale trade industry, which inflates this margin to be higher than it should be. As a result, the margins in RECONS were adjusted for the petroleum refining sector: 93% to the refining sector, 5% to wholesale trade sector, 1% to truck transportation, less than 1% to other transportation industry sectors (Stynes, 2010). The margins for the manufacturing sectors within the Consumable Operating Expenses line item of the dredging work activities were also adjusted to account for information obtained from interviews with dredging companies. Interviews with dredging experts indicated that consumable items such as food, lubricants, ropes, and metal parts and valves were purchased through both wholesalers and retailers. Therefore, 14% was allocated each to wholesale trade and retail (retail grocery stores and retail building supply stores) from the amount in the manufacturing sectors (Sectors 69 and 198). Additional description regarding the spending profile for the dredging work activities is provided in the Resource Guide for Work Activities and Spending Profiles (Appendix A). The retail allocation or margins in IMPLAN was small or non-existent for all other industry margins for the sectors in RECONS, and was therefore not adjusted. Local Impact areas with No Industries An analysis was undertaken to better understand the frequency and implications of having local impact areas in RECONS that do not include multipliers for certain industries. The lack of multipliers in a given impact area implies the industry does not exist in the region and therefore economic impacts are estimated to be zero for this industry. IMPLAN Sector 386, Business Support Services, is utilized for USACE overhead and burden expenditures. These operational expenditures are primarily local in nature (e.g., lawn care,
The Louis Berger Group, Inc. 22 December 29, 2010
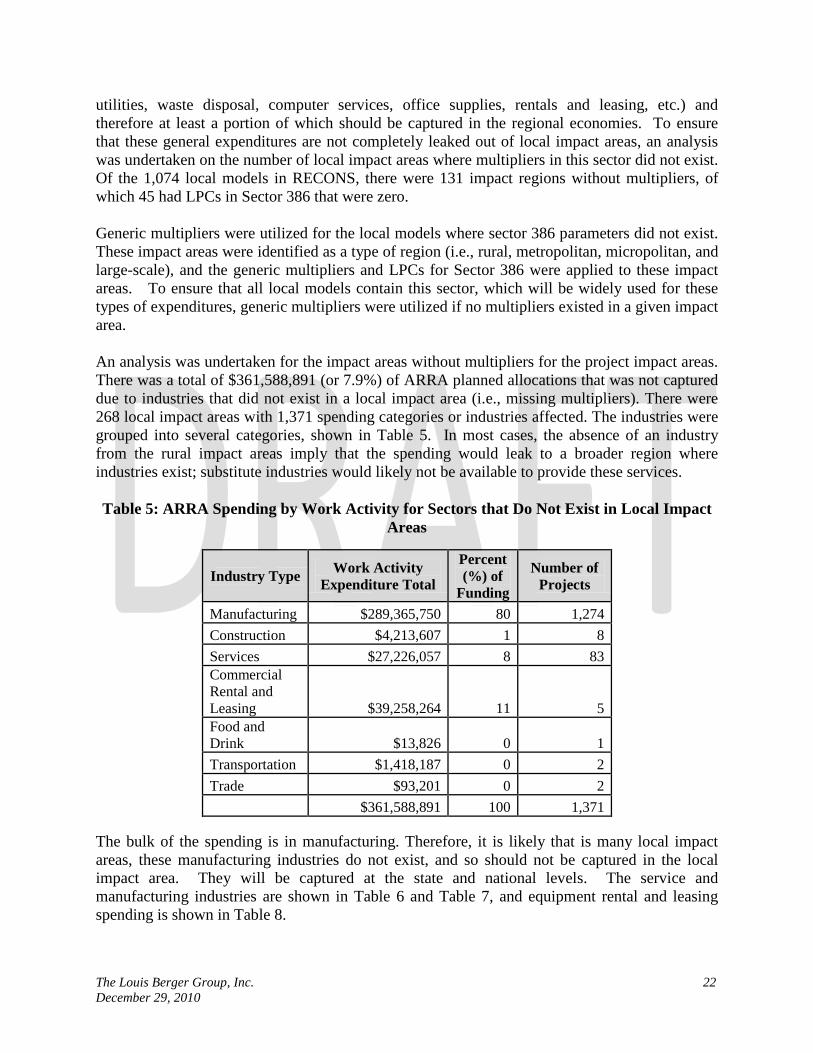
utilities, waste disposal, computer services, office supplies, rentals and leasing, etc.) and therefore at least a portion of which should be captured in the regional economies. To ensure that these general expenditures are not completely leaked out of local impact areas, an analysis was undertaken on the number of local impact areas where multipliers in this sector did not exist. Of the 1,074 local models in RECONS, there were 131 impact regions without multipliers, of which 45 had LPCs in Sector 386 that were zero. Generic multipliers were utilized for the local models where sector 386 parameters did not exist. These impact areas were identified as a type of region (i.e., rural, metropolitan, micropolitan, and large-scale), and the generic multipliers and LPCs for Sector 386 were applied to these impact areas. To ensure that all local models contain this sector, which will be widely used for these types of expenditures, generic multipliers were utilized if no multipliers existed in a given impact area. An analysis was undertaken for the impact areas without multipliers for the project impact areas. There was a total of $361,588,891 (or 7.9%) of ARRA planned allocations that was not captured due to industries that did not exist in a local impact area (i.e., missing multipliers). There were 268 local impact areas with 1,371 spending categories or industries affected. The industries were grouped into several categories, shown in Table 5. In most cases, the absence of an industry from the rural impact areas imply that the spending would leak to a broader region where industries exist; substitute industries would likely not be available to provide these services. Table 5: ARRA Spending by Work Activity for Sectors that Do Not Exist in Local Impact
Areas
Industry Type Work Activity Expenditure Total
Percent (%) of
Funding Number of
Projects
Manufacturing $289,365,750 80 1,274 Construction $4,213,607 1 8 Services $27,226,057 8 83 Commercial Rental and Leasing $39,258,264 11 5 Food and Drink $13,826 0 1 Transportation $1,418,187 0 2 Trade $93,201 0 2 $361,588,891 100 1,371
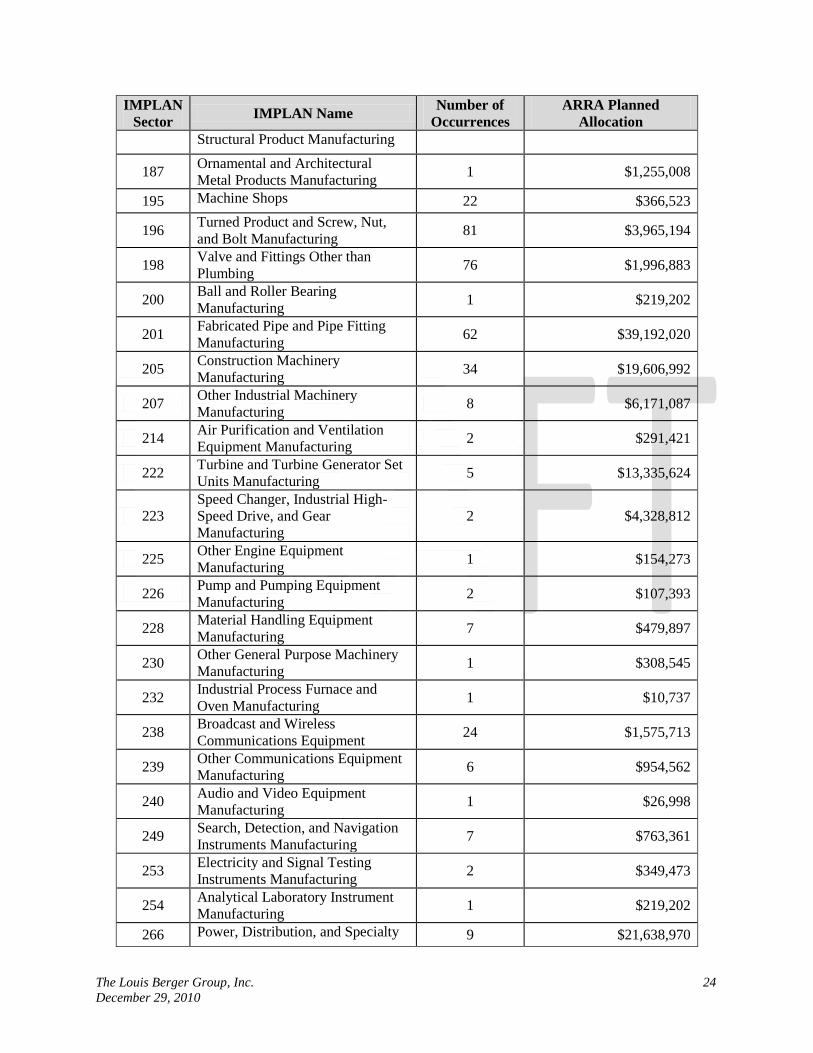
The bulk of the spending is in manufacturing. Therefore, it is likely that is many local impact areas, these manufacturing industries do not exist, and so should not be captured in the local impact area. They will be captured at the state and national levels. The service and manufacturing industries are shown in Table 6 and Table 7, and equipment rental and leasing spending is shown in Table 8.

The Louis Berger Group, Inc. 23 December 29, 2010
Table 6: ARRA Spending on Services by IMPLAN Sector where No Industry Sectors Exist
IMPLAN Sector IMPLAN Name Number of
Occurrences ARRA Planned
Allocation 369 Architectural, Engineering, and
Related Services 1 $38,520
375 Environmental and Other Technical Consulting Services 41 $19,723,128
376 Scientific Research and Development Services 4 $1,250,200
385 Facilities Support Services 36 $6,197,041 393 Other Educational Services 1 $17,168
Table 7: ARRA Spending on Manufacturing by IMPLAN Sector Where No Industry Exists
IMPLAN Sector IMPLAN Name Number of
Occurrences ARRA Planned
Allocation 25 Stone Mining and Quarrying 4 $1,242,164
26 Sand, Gravel, Clay, and Ceramic and Refractory Minerals Mining and Quarrying
39 $27,081,019
53 Frozen Food Manufacturing 101 $1,397,285
54 Fruit and Vegetable Canning, Pickling, and Drying 61 $915,974
62 Bread and Bakery Product Manufacturing 28 $218,665
65 Snack Food Manufacturing 92 $1,517,958 69 All Other Food Manufacturing 87 $987,301 70 Soft Drink and Ice Manufacturing 58 $837,968 85 All Other Textile Product Mills 49 $852,926
97 Engineered Wood Member and Truss Manufacturing 21 $349,878
115 Petroleum Refineries 95 $35,072,976
141 All Other Chemical Product and Preparation Manufacturing 84 $3,801,158
149 Other Plastics Product Manufacturing 1 $160,906
160 Cement Manufacturing 38 $7,065,716
163 Other Concrete Product Manufacturing 1 $8,003
171 Steel Product Manufacturing from Purchased Steel 42 $45,452,425
174 Aluminum Product Manufacturing from Purchased Aluminum 1 $46,282
186 Plate Work and Fabricated 1 $115,704
The Louis Berger Group, Inc. 24 December 29, 2010
IMPLAN Sector IMPLAN Name Number of
Occurrences ARRA Planned
Allocation Structural Product Manufacturing
187 Ornamental and Architectural Metal Products Manufacturing 1 $1,255,008
195 Machine Shops 22 $366,523
196 Turned Product and Screw, Nut, and Bolt Manufacturing 81 $3,965,194
198 Valve and Fittings Other than Plumbing 76 $1,996,883
200 Ball and Roller Bearing Manufacturing 1 $219,202
201 Fabricated Pipe and Pipe Fitting Manufacturing 62 $39,192,020
205 Construction Machinery Manufacturing 34 $19,606,992
207 Other Industrial Machinery Manufacturing 8 $6,171,087
214 Air Purification and Ventilation Equipment Manufacturing 2 $291,421
222 Turbine and Turbine Generator Set Units Manufacturing 5 $13,335,624
223 Speed Changer, Industrial High-Speed Drive, and Gear Manufacturing
2 $4,328,812
225 Other Engine Equipment Manufacturing 1 $154,273
226 Pump and Pumping Equipment Manufacturing 2 $107,393
228 Material Handling Equipment Manufacturing 7 $479,897
230 Other General Purpose Machinery Manufacturing 1 $308,545
232 Industrial Process Furnace and Oven Manufacturing 1 $10,737
238 Broadcast and Wireless Communications Equipment 24 $1,575,713
239 Other Communications Equipment Manufacturing 6 $954,562
240 Audio and Video Equipment Manufacturing 1 $26,998
249 Search, Detection, and Navigation Instruments Manufacturing 7 $763,361
253 Electricity and Signal Testing Instruments Manufacturing 2 $349,473
254 Analytical Laboratory Instrument Manufacturing 1 $219,202
266 Power, Distribution, and Specialty 9 $21,638,970

The Louis Berger Group, Inc. 25 December 29, 2010
IMPLAN Sector IMPLAN Name Number of
Occurrences ARRA Planned
Allocation Transformer Manufacturing
267 Motor and Generator Manufacturing 14 $3,779,416
268 Switchgear and Switchboard Apparatus Manufacturing 67 $25,676,070
270 Storage Battery Manufacturing 1 $215,982 279 Motor Vehicle Body Manufacturing 1 $115,704 290 Ship Building and Repairing 5 $9,507,982 291 Boat Building 9 $2,304,802
311 Sporting and Athletic Goods Manufacturing 7 $545,611
317 All Other Miscellaneous Manufacturing 11 $2,777,985
The Louis Berger Group, Inc. 26 December 29, 2010
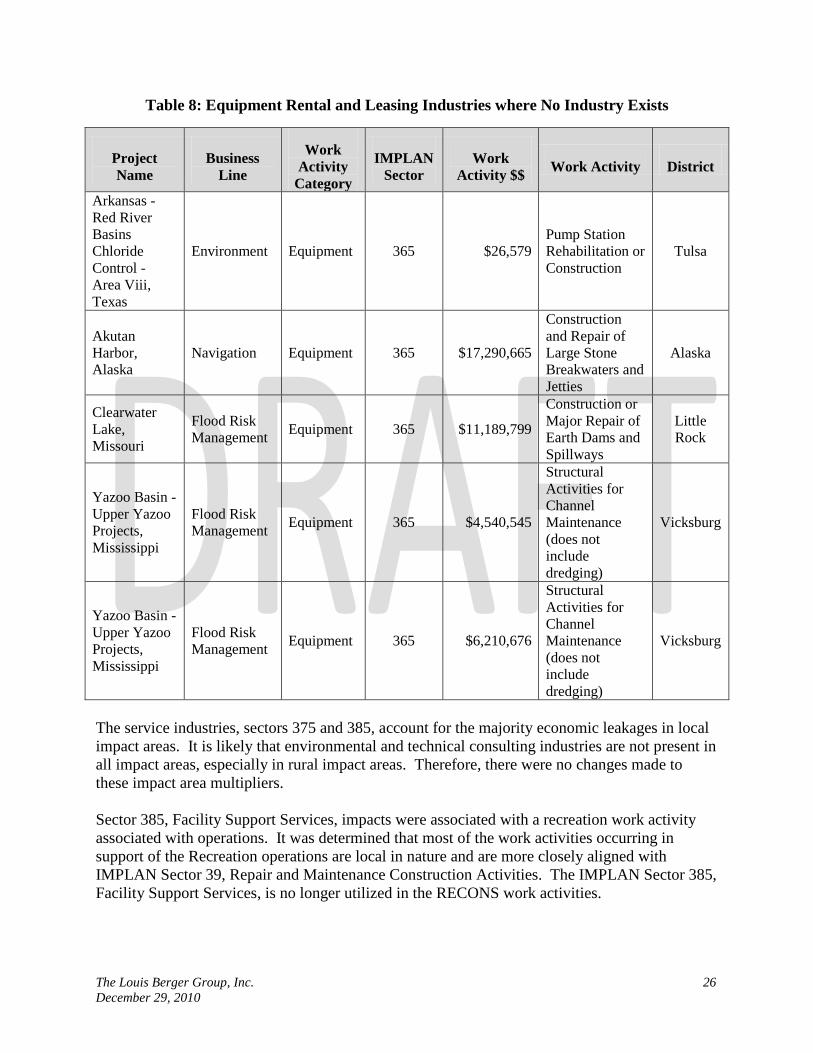
Table 8: Equipment Rental and Leasing Industries where No Industry Exists
Project Name
Business Line
Work Activity
Category IMPLAN
Sector Work
Activity $$ Work Activity District
Arkansas - Red River Basins Chloride Control - Area Viii, Texas
Environment Equipment 365 $26,579 Pump Station Rehabilitation or Construction
Tulsa
Akutan Harbor, Alaska
Navigation Equipment 365 $17,290,665
Construction and Repair of Large Stone Breakwaters and Jetties
Alaska
Clearwater Lake, Missouri
Flood Risk Management Equipment 365 $11,189,799
Construction or Major Repair of Earth Dams and Spillways
Little Rock
Yazoo Basin - Upper Yazoo Projects, Mississippi
Flood Risk Management Equipment 365 $4,540,545
Structural Activities for Channel Maintenance (does not include dredging)
Vicksburg
Yazoo Basin - Upper Yazoo Projects, Mississippi
Flood Risk Management Equipment 365 $6,210,676
Structural Activities for Channel Maintenance (does not include dredging)
Vicksburg
The service industries, sectors 375 and 385, account for the majority economic leakages in local impact areas. It is likely that environmental and technical consulting industries are not present in all impact areas, especially in rural impact areas. Therefore, there were no changes made to these impact area multipliers. Sector 385, Facility Support Services, impacts were associated with a recreation work activity associated with operations. It was determined that most of the work activities occurring in support of the Recreation operations are local in nature and are more closely aligned with IMPLAN Sector 39, Repair and Maintenance Construction Activities. The IMPLAN Sector 385, Facility Support Services, is no longer utilized in the RECONS work activities.

The Louis Berger Group, Inc. 27 December 29, 2010
It is likely that commercial and industrial machinery and equipment rental companies do not exist in some local impact areas, especially rural areas; therefore these multipliers were not changed.
Database Information This section describes the identifiers, the data tables, and the links between the different tables that are part of the Microsoft Office Access database used to estimate the economic impacts. Database Tables Profile Table – The profile table in the Access database provides the spending profile for each work activity ID. The spending profile includes the distribution of spending across industries and the LPCs. These profiles are described in detail in the Resource Guide for Work Activities and Spending Profiles (Appendix A). Main IMPLAN Tables – This IMPLAN multiplier tables includes the regional and local industry-specific LPCs, direct ratios, and multipliers for each impact area as described above. Each local and regional impact area is identified with a Model ID. The IMPLAN tables are linked to the work activity ID table with the IMPLAN industry code. Main States IMPLAN Table -- This IMPLAN multiplier tables includes the state industry-specific LPCs, direct ratios, and multipliers for each state impact area as described above. Each state or multi-state impact area is identified with a Model ID. The IMPLAN tables are linked to the work activity ID table with the IMPLAN industry code. Main US IMPLAN Table -- This IMPLAN multiplier tables includes the US industry-specific LPCs, direct ratios, and multipliers for the US model, as described above. The US model was identified with a Model ID. The IMPLAN tables are linked to the work activity ID table with the IMPLAN industry code. Model ID to Program Code Bridge – A bridge table links the program code with the model ID associated with the IMPLAN tables, which include local, state (multi-state), and nation. This bridge table ensures that the multipliers applied to the spending are impact area-specific. This bridge is provided in Appendix F. Project Data – The USACE provided the project team with the most current ARRA allocations in August, 2010, which lists 2,959 projects. Key information, summarized in the ARRA Report, includes project name, program code, USACE district, congressional district, work description, and allocated amount. Additional information on the ARRA economic impacts can be found in the ARRA Report. The USACE also provided the project team with the CW fiscal year 2009 budget data. This data was organized to identify the dollar amount, district identifier, business line, and appropriation code. A budget line item identifier was associated with each ARRA and CW budget line item. The project team added a work activity ID to the USACE ARRA and CW

The Louis Berger Group, Inc. 28 December 29, 2010
budget data. The profile table is linked to the project data table in the database using the work activity ID. It should be noted that there are three funding amounts for each ARRA budget line item, consistent with the approach outlined in the ARRA Report. Each ARRA budget line item was reduced by 3%, of which 75% was mapped to the local or regional project location as USACE labor and overhead, and 25% was mapped to the appropriate district office location as USACE labor and overhead. The remaining 97% of the ARRA budget line item allocation was assumed to be private sector work activity funding. Deflator Table – This table includes the Office of Management and Budget GDP deflators, which are applied to the spending or allocations prior to being applied to the employment multipliers. Margin Table – This table includes both industry and household margins. The margins were extracted from IMPLAN, and a number of industry and household margins were modified, consistent with the section on IMPLAN Data and Modifications. The margin table is linked to the profiles table through the IMPLAN industry sectors. General Information Table – This table includes general impact area information that was extracted from each IMPLAN model. This includes information such as population, land area, number of households and personal income. Direct FTE Table – This table provides the part time to full time ratio for each industry sector, which was obtained from the MIG site. This table is provided in Appendix C. FTE Indirect and Induced – This table provides the indirect and induced part time to full time ratio that was calculated for each work activity, as described in the Other RECONS Data section. This table is provided in Appendix D. Top Ten Industries Table – This table provides the top ten employing industries and total employment associated with $1 million in spending on each work activity, when this spending is applied to the national model. Counties Included Table – This table specifies the counties and FIPS codes included in each of the models. This table is provided in Appendix G. States Included Table – This table specifies the states included in each of the single and multiple state models. This table is provided in Appendix H. Industry Summary Bridge Table – This table identifies the approach aggregate the 440 industries in IMPLAN to show broader categories of industry sectors. This information is provided in RECONS as the impact area profile. Database Structure

The Louis Berger Group, Inc. 29 December 29, 2010
ARRA and CW Budget Line Item Identifiers – A unique project identifier was assigned to each ARRA budget line item. Program Codes – Also called AMSCO codes, program codes are identifiers from the USACE financial and reporting systems. Program codes often, but not always, refer to a geographic location. Program codes were associated with most of the CW budget, the CEFMS/OMBIL expenditures, and the ARRA budget line items. Each program code has one or more projects associated with it. For large-scale projects identified with one program code, it was necessary to create multiple sub-locations within the program code to account for the specific locations identified in the ARRA work description. If the RECONS user chooses a program code with multiple locations, the locations and titles show up on a subsequent screen; these are also called program codes, but are the USACE program code plus one or two digits to uniquely identify the specific location. Work Activity ID – The project team developed 140 work activities, each with a unique work activity ID. The work activities are described by business in the Resource Guide for Work Activities and Spending Profiles (Appendix A). Model Identifier – As described above, each IMPLAN impact area was assigned a unique model ID. IMPLAN Industry – There are 440 unique IMPLAN industry codes. Analysis of Local, State, and National Impacts (Query Descriptions) Using the structure outlined above, the project team estimated the local, state, and national impact of the CW budget or ARRA budget line item. The impact is expressed in terms of employment, labor income, value added, and output. To ensure that state and national LPCs are never lower than local LPCs, a check and replace is done before queries are implemented. Direct and secondary multipliers can vary depending on the geographic extent and economic conditions of the impact area of concern. Typically, direct effects, especially the employment and labor income multipliers, are larger in small rural areas, and smaller in urban regions. To more accurately capture these impacts, the direct state and national impacts are calculated incrementally to capture the direct impacts at the smaller geography (i.e., the local and state impact area, respectively). For example, the state direct jobs are the calculated by the sum of the local direct jobs plus the amount that is captured at the state level and not at the local level (state LPC less local LPC), multiplied by the state direct employment multipliers. The state and national induced and indirect multipliers are utilized to calculate these respective impacts, as the entire rollover effect is captured within the broader geographic region. The detailed queries are explained below.
1. Local Impacts The local capture amount is the federal spending on industries (allocated by work activity profiles) m ultiplied by the local impact area LPC. The direct effects are equal to the local

The Louis Berger Group, Inc. 30 December 29, 2010
capture amount multiplied by the local impact area direct ratios for employment, value added, and labor income. The local capture is equal to the direct output. The local indirect impacts are equal to the local capture multiplied by the induced multipliers, and the local induced impacts are equal to the local capture multiplied by the induced multipliers. The local total effects are equal to the sum of the direct, indirect, and induced effects for output, employment, value added, and labor income.
2. State Impacts
The state capture amount is equal to the federal spending on industries multiplied by the state geographic capture rate. The “state increment spending” is equal to the federal spending multiplied by the difference between the state and local geographic capture rate. The direct state impacts are equal to the local direct impacts (calculated in “Local Impacts” above) plus the state increment spending multiplied by the state direct multipliers. The state indirect impacts are equal to the state capture multiplied by the state induced impacts multipliers. The state induced impacts are equal to the state capture multiplied by the state induced multipliers. The total state impacts are equal to the direct, indirect, and induced state impacts for output, employment, value added, and labor income.
3. National Impacts The national capture amount is equal to the federal spending on industries multiplied by the national industry geographic capture rate. The “national increment spending” is equal to the national federal spending multiplied by the difference between the nation and state geographic capture rates. The direct national impacts are equal to the state direct impacts (calculated in “Local Impacts” above) plus the national increment multiplied by the national direct multipliers. The national indirect impacts are equal to the national capture multiplied by the national induced impacts multipliers. The national induced impacts are equal to the national capture multiplied by the national induced multipliers. The total national impacts are equal to the direct, indirect, and induced national impacts for output, employment, value added, and labor income. Model Testing Large-scale impact areas were verified and quality controlled through GIS. Each of the large scale regions were mapped and were viewed to ensure that they were contiguous and appropriate to the program code name. Michigan State University was provided with the Access database, on which they created a consistent web-based on-line tool. They verified the queries and approach and tested their on-line model such that it was consistent with the desk-top version.

The Louis Berger Group, Inc. 31 December 29, 2010
Other RECONS Data Inflation The USACE spending is adjusted for inflation before it is applied to the employment ratios and multipliers, based on the consumer price index (CPI). The White House, OMB GDP deflators are utilized as the deflation indices (OMB, 2010). The spending is not adjusted prior to being applied to the output, labor income, and value added multipliers so the year the spending or funding occurs is assumed to be the current year. Top Ten Industries Affected Each of the work activities, as described in the Resource Guide for Work Activities and Spending Profiles (Appendix A), was run through the IMPLAN Version 3 model for $1 million spending on a project. The results were used to estimate the top ten industries, in terms of employment, for each of the work activities. Amounts allocated to IMPLAN Sector 5001 were reduced by 15.3 percent to account for payroll taxes. In cases where there were multi-sector profiles for which labor was a part, the estimates were adjusted to include the direct component, as IMPLAN only estimates induced effects for household income changes (see the Private Sector Labor Response Coefficients section). The top ten industries affected are provided for each work activity as part of RECONS output. These affected industries apply to the nation’s economy; some of these industries in the nation may not be present in local impact areas. These assumptions are provided in RECONS output reports in the User’s Manual. Full-Time Equivalent Employment Calculations One of the requirements of ARRA is to report job impacts in full-time equivalents (FTE). IMPLAN data and multipliers include full-time and part-time job estimates, and as such, need to be adjusted to provide full-time employment equivalent measures. MIG provides a spreadsheet on its website to adjust IMPLAN’s full- and part-time estimates to FTEs on an industry basis. The directly affected industries were identified in RECONS query, and the ratios were applied to these specific industries for the direct jobs adjustment. These industry ratios are provided in Appendix C. For the indirect and induced employment effects, it was necessary to take an additional step. The top ten employing industries for each work activity in the nation were identified as part of separate step. The FTE IMPLAN ratios were identified with each of the ten industries for each work activity. From this analysis, a weighted ratio was then calculated for each work activity for each induced and indirect employment. These weighted FTE ratios were then applied to all indirect and induced employment for the relevant work activity. These indirect and induced FTE ratios by work activity are provided in Appendix D.

The Louis Berger Group, Inc. 32 December 29, 2010
Aggregating Industries for Impact Area Reporting In RECONS, each impact area has demographic and socioeconomic information provided in one of the screens. This includes impact areas data such as population, average household income, employment, employment by industry, etc. This information is all provided by tables extracted from the IMPLAN models. IMPLAN provides economic data on 440 industry sectors. To report employment by industry in a more user-friendly manner, the industries were aggregated into broader industry groupings. Table 9 summarizes the IMPLAN sectors included in each aggregate industry group. Table 9: ARRA Spending on Services by IMPLAN Sector where No Industry Sectors Exist
IMPLAN Sectors
Aggregated Industry Name Aggregated Industry
Number 1-19 Agricultural, Forestry, Fishing and Hunting 1 20-30 Mining 2 31-33 Utilities 3 34-40 Construction 4 41-318 Manufacturing 5 319 Wholesale Trade 6 320-331 Retail Trade 7 332-340 Transportation and Warehousing 8 341-353 Information 9 354-360 Finance, Insurance, Real Estate, and Leasing 10 362-380 Professional, Scientific and Technological Services 11 381 Management of Companies and Enterprises 12 382-390 Administration and Waste Management Services 13 391-393,438 Education 14 394-401 Health Care and Social Assistance 15 402-410 Arts, Entertainment, and Recreation 16 411-413 Accommodations and Food Service 17 414-426 Other Services 18 427-437, 439-440 Government 19 361 Imputed Rents 20

The Louis Berger Group, Inc. 33 December 29, 2010
ARRA Approach RECONS was utilized to run the budget line items for USACE ARRA projects. The approach and results are documented in the ARRA Report.

The Louis Berger Group, Inc. 34 December 29, 2010
Civil Works Budget Economic Impacts The economic impact of the Civil Works budget for Fiscal Year 2009 was estimated using RECONS. This section explains the approach to estimate these impacts, and summarizes the impact results.
Civil Works Budget Approach To utilize RECONS to estimate the economic impact of the FY2009 CW budget, the following steps were implemented:
1. Identify impact areas associated with the program codes not already captured in the RECONS
2. Develop work activity profiles for the business lines and appropriation accounts 3. Develop an approach for expenditures that were not identified with programs codes
(e.g., Rivers and Harbors, Regulatory, Expenses, ASA, etc.) Identify Impact Areas There were an additional 467 program codes in the CW budget that did not occur in the ARRA project database. Large-scale program code names were flagged and researched as described above. Of the 467 program codes, 99 program codes were not identified with local impact areas, only state impact areas, and 49 program codes were not identified with local or state (or multi-state) regions, only the nation. Of the 467 program codes, 409 matched existing impact areas associated with the ARRA data, while 59 new impact areas needed to be created. For the 409 program codes that matched with ARRA impact areas, if the program code was identified with multiple impact areas, the broadest impact area associated with the program code was utilized for the CW budget economic impact analysis. Work Activity Profiles Spending profiles were developed for each of the business lines and appropriation accounts. This was based on an analysis of the ARRA national work activities specified by business line and appropriation account as well as an assessment of the USACE labor and overhead expenditures, also analyzed by business line and appropriation account. The labor and overhead percentage by business line and appropriation account was obtained from the FY2009 CEFMS/OMBIL data on USACE expenditures by Method of Accomplishment (MOA) code, as described in the Business Line Operational Expenditures Section. Queries of the CEFMS/OMBIL data reveal the following USACE labor and overhead percentages as a portion of all MOA expenditures for the following business lines and appropriation accounts (Table 10).
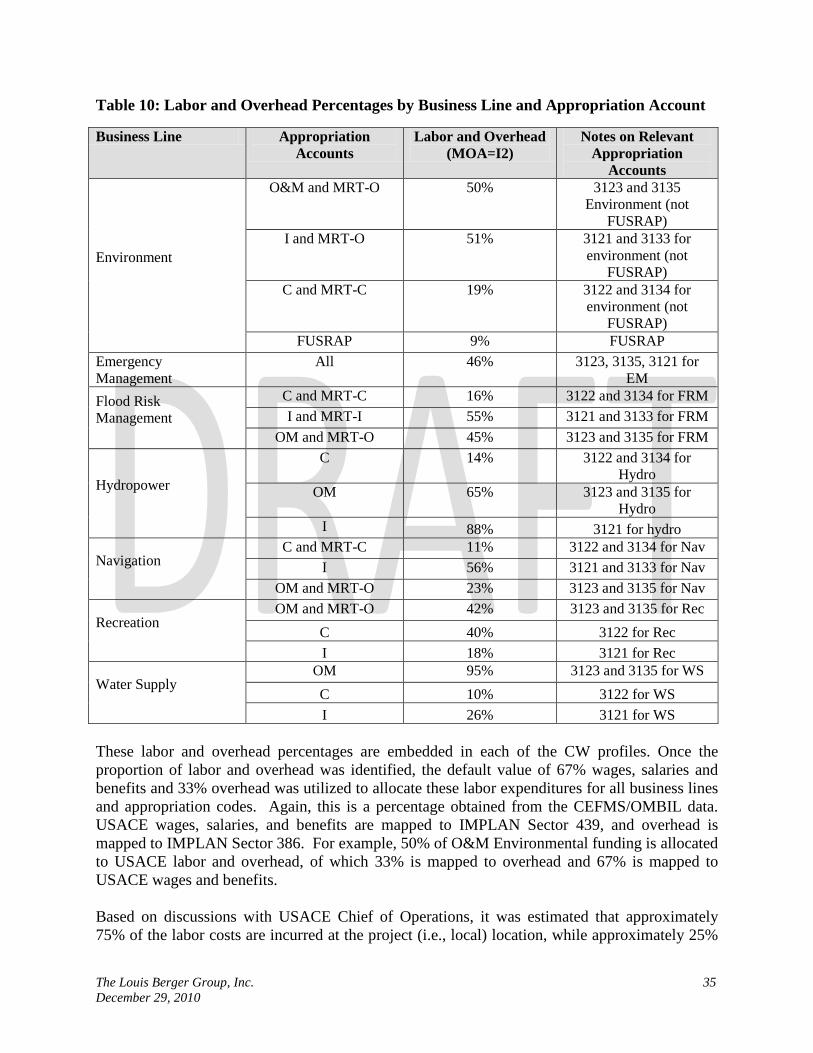
The Louis Berger Group, Inc. 35 December 29, 2010
Table 10: Labor and Overhead Percentages by Business Line and Appropriation Account
Business Line Appropriation Accounts
Labor and Overhead (MOA=I2)
Notes on Relevant Appropriation
Accounts
Environment
O&M and MRT-O 50% 3123 and 3135 Environment (not
FUSRAP) I and MRT-O 51% 3121 and 3133 for
environment (not FUSRAP)
C and MRT-C 19% 3122 and 3134 for environment (not
FUSRAP) FUSRAP 9% FUSRAP
Emergency Management
All 46% 3123, 3135, 3121 for EM
Flood Risk Management
C and MRT-C 16% 3122 and 3134 for FRM I and MRT-I 55% 3121 and 3133 for FRM
OM and MRT-O 45% 3123 and 3135 for FRM
Hydropower
C 14% 3122 and 3134 for Hydro
OM 65% 3123 and 3135 for Hydro
I 88% 3121 for hydro
Navigation
C and MRT-C 11% 3122 and 3134 for Nav I 56% 3121 and 3133 for Nav
OM and MRT-O 23% 3123 and 3135 for Nav
Recreation
OM and MRT-O 42% 3123 and 3135 for Rec C 40% 3122 for Rec I 18% 3121 for Rec
Water Supply
OM 95% 3123 and 3135 for WS C 10% 3122 for WS I 26% 3121 for WS
These labor and overhead percentages are embedded in each of the CW profiles. Once the proportion of labor and overhead was identified, the default value of 67% wages, salaries and benefits and 33% overhead was utilized to allocate these labor expenditures for all business lines and appropriation codes. Again, this is a percentage obtained from the CEFMS/OMBIL data. USACE wages, salaries, and benefits are mapped to IMPLAN Sector 439, and overhead is mapped to IMPLAN Sector 386. For example, 50% of O&M Environmental funding is allocated to USACE labor and overhead, of which 33% is mapped to overhead and 67% is mapped to USACE wages and benefits. Based on discussions with USACE Chief of Operations, it was estimated that approximately 75% of the labor costs are incurred at the project (i.e., local) location, while approximately 25%

The Louis Berger Group, Inc. 36 December 29, 2010
of these costs are incurred at the district office location (Lichy, 2010). As a result, the LPC for the labor IMPLAN Sector 439 was set to 75% local, while 100% was assumed to be incurred at the state and national level. IMPLAN’s LPC for overhead expenditures, Sector 386, was utilized for the analysis. The ARRA budget line items, identified by business lines and appropriation accounts, were queried to develop an aggregate industry profile associated with all work activities in the grouping. The profile identified industries, not specific work activities, proportioned by the amount of spending on the relevant work activities, which are mapped to industries. The spending profile then embedded the appropriate percentage of labor and overhead for the OMBIL/CEFMS data. Industries with less than one percent of profile were deleted and the remaining profile redistributed among the remaining industries to aggregate to 100%. These profiles were based on the national work activities, again sorted by business line and appropriation account. An example is provided for the Hydropower Construction Profile in Table 11. Table 11: Hydropower Construction Profile for CW Budget
IMPLAN Sector Spending Category Name Percent 222 Turbine equipment and parts 9.2 266 Power, Distribution, and Specialty Transformer Equipment 18.3 268 Switchgear and Switchboard Apparatus Equipment 12.1 36 Construction of Other New Nonresidential Structures 6.4
369 Architectural, Engineering, and Related Services 2.0
375 Planning, Environmental, Engineering and Design Studies and Services 7.8
39 Repair and Maintenance Construction Activities 16.8 5001 Private Sector Labor or Staff Augmentation 12.9 439 USACE Wages and Benefits 9.7 386 USACE Overhead 4.8
Total 100.0
Where data was not available from the ARRA budget line items, default profiles were developed based on the labor percentages, and the following IMPLAN industry sectors: investigations was mapped to IMPLAN Sector 375; construction was mapped to IMPLAN Sector 36; and operations and maintenance was mapped to IMPLAN Sector 39. The following profiles used these default allocations:
• Hydropower investigations
• Recreation construction
• Recreation investigations
• Water supply construction
• Water supply investigations

The Louis Berger Group, Inc. 37 December 29, 2010
There were no Emergency Management ARRA budget items; therefore, the profile was based on the industries present in the work activities associated with this business line, including erosion control, repair and maintenance construction, and private sector labor. These work activities were identified through research on USACE activities associated with this business line. The CW budget profiles by business line and appropriation account are provided in Appendix F; the work activity IDs range from 1011 to 1029.
Once the business line and appropriation accounts profiles were developed, it was necessary to develop profiles for only the business lines. This provides the user with the flexibility to run business line expenditures either through an appropriation account or just through the business line. The business line profiles were created by weighting the business line/appropriation account profiles by the proportional funding in the FY2009 CW budget. The result is a generic business line profile. These profiles are provided in Appendix F; the work activity IDs range from 1001 to 1010.
All program code expenditures by business line and appropriation account were run through the appropriate spending profile in the location identified with the program code, which included in most cases, the local or regional, state or multi-state, and national impact areas. Approach for Non-Program Code CW Budget Data The final step in the process was to determine how the appropriation accounts for which there was no ARRA data would be modeled. All of the following budget items were not associated with a program code and were therefore applied at either the headquarters location (i.e., Washington, DC) or the national level. ASA and half of the Expenses account were run through the Washington DC model. The remainder of the Expenses account and the Regulatory business line were applied only to the national impact area. The Rivers and Harbors and FCCE accounts were only associated with the national impact area. The approach is summarized in Table 12.

The Louis Berger Group, Inc. 38 December 29, 2010
Table 12: Approach for CW Budget Appropriation Accounts
Account/Business Line FY2009 Amount Approach Impact Area
Rivers and Harbors – Investigations 23,000,000
Use Navigation Investigations Profile
Nation Only
Rivers and Harbors – Construction 308,000,000
Use Navigation Construction Profile
Nation Only
Rivers and Harbors – Mississippi River and Tributaries 34,000,000 Use Navigation Profile
Nation Only
Rivers and Harbors – Operations and Maintenance 35,000,000
Use Navigation Operations and Maintenance Profile
Nation Only
Flood Control and Coastal Emergencies (FCCE) 40,000,000
Use Emergency Management Profile
Nation Only
Expenses 177,000,000 USACE Labor and Overhead
Half to Washington, DC, multi-state, and nation; half only to nation
Regulatory 180,000,000 USACE Labor and Overhead Nation Only
ASA 6,000,000 USACE Labor and Overhead Washington, DC, multi-state, and nation
CW Budget Economic Impact Results
The approach described above was applied to the 2009 fiscal year budget line items. A total of $5.1 billion was included in the budget, which supports a total of $14 million in economic output, almost $8 million in value added or Gross Domestic Product, and almost 100,000 jobs nationally. Fewer direct expenditures were spent at the state and local levels due to the non-specific nature of the projects. Typically, the LPCs are lower at the local than the state level, and lower at the state level than the nation. Therefore, there is less direct output captured at the local and state levels of geography and therefore fewer economic impacts are supported in aggregate at these state and local impact regions when compared to that of the nation. Table 13 summarizes the national impacts associated with the 2009 FY budget and also includes the aggregation of the economic impacts estimated at the state/multi-state and local impact areas.
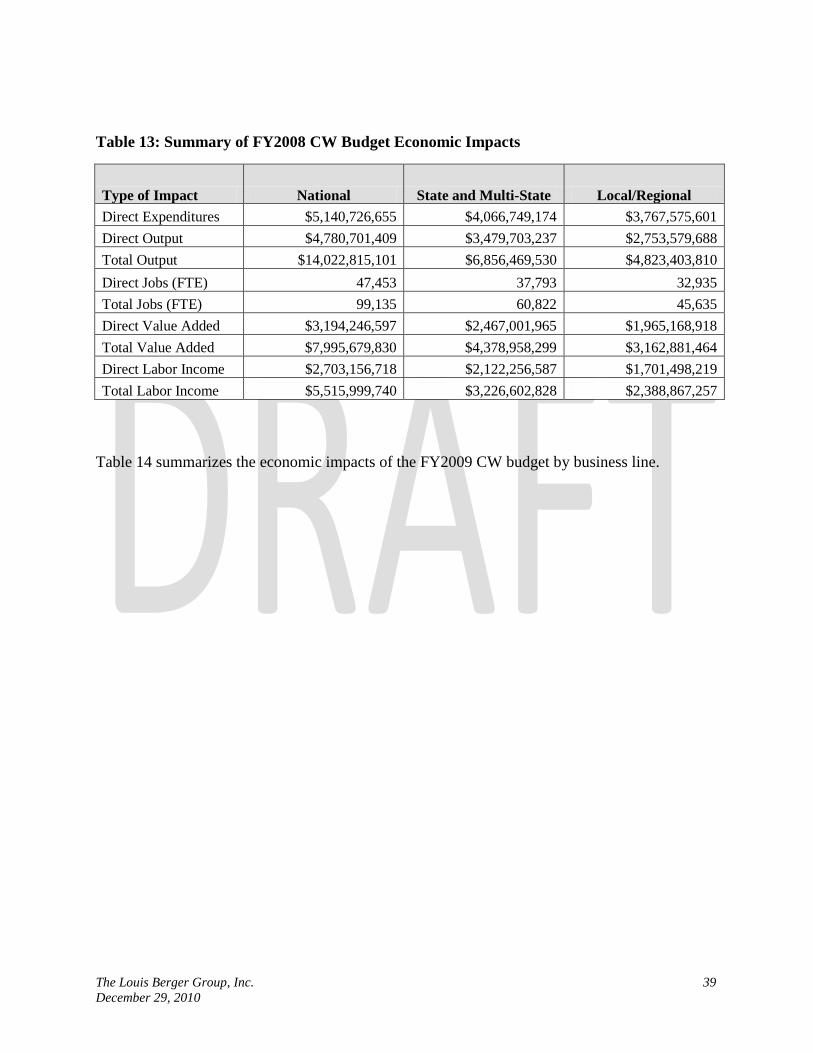
The Louis Berger Group, Inc. 39 December 29, 2010
Table 13: Summary of FY2008 CW Budget Economic Impacts
Type of Impact National State and Multi-State Local/Regional Direct Expenditures $5,140,726,655 $4,066,749,174 $3,767,575,601 Direct Output $4,780,701,409 $3,479,703,237 $2,753,579,688 Total Output $14,022,815,101 $6,856,469,530 $4,823,403,810 Direct Jobs (FTE) 47,453 37,793 32,935 Total Jobs (FTE) 99,135 60,822 45,635 Direct Value Added $3,194,246,597 $2,467,001,965 $1,965,168,918 Total Value Added $7,995,679,830 $4,378,958,299 $3,162,881,464 Direct Labor Income $2,703,156,718 $2,122,256,587 $1,701,498,219 Total Labor Income $5,515,999,740 $3,226,602,828 $2,388,867,257
Table 14 summarizes the economic impacts of the FY2009 CW budget by business line.

The Louis Berger Group, Inc. 40 December 29, 2010
Table 14: National FY 2009 CW Budget Economic Impacts by Business Line
Type of Impact USACE
Expenditures
Economic Impacts Direct Indirect Induced Total
Business Line Output Navigation $2,298,647,195 $2,196,609,556 $1,298,784,250 $2,712,690,325 $6,208,084,131 Flood Risk Management $1,314,558,809 $1,269,851,719 $668,861,937 $1,788,486,488 $3,727,200,144 Environment $511,233,900 $491,296,753 $324,365,055 $648,943,834 $1,464,605,643 Expenses $183,000,000 $137,021,250 $34,856,708 $279,601,740 $451,479,698 Hydropower $318,697,751 $276,241,756 $110,214,531 $434,057,133 $820,513,420 Recreation $270,583,000 $270,570,400 $137,701,245 $374,572,096 $782,843,741 Regulatory $180,000,000 $89,550,000 $34,285,287 $275,018,105 $398,853,392 Emergency Management $58,000,000 $44,515,000 $28,889,389 $80,413,696 $153,818,085 Water Supply $6,006,000 $5,044,976 $1,285,521 $9,086,351 $15,416,848 Total $5,140,726,655 $4,780,701,409 $2,639,243,924 $6,602,869,768 $14,022,815,101
Business Line USACE
Expenditures Jobs Navigation $2,298,647,195 20,262 6,075 15,818 42,154 Flood Risk Management $1,314,558,809 14,001 3,489 10,457 27,947 Environment $511,233,900 4,437 1,681 3,812 9,930 Hydropower $183,000,000 3,111 562 2,543 6,216 Recreation $318,697,751 2,918 676 2,201 5,794 Expenses $270,583,000 1,266 217 1,645 3,128 Regulatory $180,000,000 973 213 1,618 2,805 Emergency Management $58,000,000 432 143 473 1,047 Water Supply $6,006,000 53 8 53 114 Total $5,140,726,655 47,453 13,063 38,619 99,135
Business Line USACE
Expenditures Value Added Navigation $2,298,647,195 $1,377,985,335 $633,231,499 $1,431,516,079 $3,442,732,913 Flood Risk Management $1,314,558,809 $878,642,728 $336,738,528 $947,143,893 $2,162,525,148 Environment $511,233,900 $297,251,348 $160,773,995 $345,526,721 $803,552,063 Hydropower $183,000,000 $217,875,460 $54,117,371 $230,583,066 $502,575,897 Recreation $318,697,751 $191,501,221 $65,852,793 $199,608,330 $456,962,344 Expenses $270,583,000 $126,404,594 $19,017,143 $149,376,576 $294,798,313 Regulatory $180,000,000 $72,494,866 $18,705,386 $146,927,780 $238,128,032 Emergency Management $58,000,000 $27,462,190 $13,875,177 $42,878,716 $84,216,083 Water Supply $6,006,000 $4,628,856 $705,722 $4,854,459 $10,189,037 Total $5,140,726,655 $3,194,246,597 $1,303,017,613 $3,498,415,619 $7,995,679,830

The Louis Berger Group, Inc. 41 December 29, 2010
Table 15 summarizes the national economic impacts of the FY 2009 CW budget by appropriation accounts. Table 15: National FY 2009 CW Budget Economic Impacts by Appropriation Accounts
Appropriations Direct
Expenditures Total Output Total FTE Total VA O&M $2,474,727,471 $6,741,890,977 47,853 $3,910,738,318 Construction $1,402,000,000 $3,967,569,345 28,868 $2,196,516,072 Rivers and Harbors $400,000,000 $1,070,494,956 7,093 $572,463,637 Expenses $183,000,000 $451,479,698 3,128 $294,798,313 Regulatory $180,000,000 $398,853,392 2,805 $238,128,032 MR&T - O&M $162,743,184 $460,331,114 3,431 $272,503,394 FUSRAP $130,000,000 $369,653,841 2,027 $188,114,304 Investigations $91,000,000 $235,208,228 1,575 $139,811,947 MR&T - Construction $75,807,000 $217,315,911 1,607 $122,092,197 Flood Control and Coastal Emergencies $40,000,000 $106,081,438 722 $58,080,057 MR&T - Investigations $1,449,000 $3,936,202 27 $2,433,559 Total $5,140,726,655 $14,022,815,101 99,135 $7,995,679,830

The Louis Berger Group, Inc. 42 December 29, 2010
References Alward, Greg, MIG, Inc., “Using IMPLAN to Monitor Job Creation; Complying with the
Reporting Requirements of the American Recovery and Reinvestment Act of 2009”, Webinar Presentation, March 4, 2009.
Lichy, Dave, USACE, Institute for Water Resources, Personal Email Communication, April 4,
2010. Lindall, Scott, MIG, Inc. Personal Telephone Communication. September 9, 2010. METI Corp/Economic Insights of Colorado, LLC, “USDA Forest Service Protocols for
Delineation of Economic Impact Analysis Areas,” (no date) Office of Management and Budget, The White House. Table 10.1—Gross Domestic Product and
Deflators Used in the Historical Tables: 1940–2015. Available: http://www.whitehouse.gov/omb/budget/Historicals/.
Retzlaff, M., “Economic Area Delineation – Identifying Areas for Economic Impact Analysis in
the USDA-Forest Service,” December 2008. Stynes, Dan. Economist at Michigan State University. Email and personal communication,
August 27, 2010. U.S. Army Corp of Engineers, “Civil Works Strategic Plan, Fiscal Year 2004 – Fiscal Year
2009”, March 2004. USDA, Forest Service, “Evaluating the Economic Significance of the USDA Forest Service
Strategic Plan (2000 Revision): Methods and Results for Programmatic Evaluations,” Inventory and Monitoring Institute Report No. 6, May 2003.

The Louis Berger Group, Inc. 43 December 29, 2010
Appendix A: Resource Guide for Work Activities and Spending Profiles See Document: Work Activity Spending Profiles Resource Guide_Final.docx
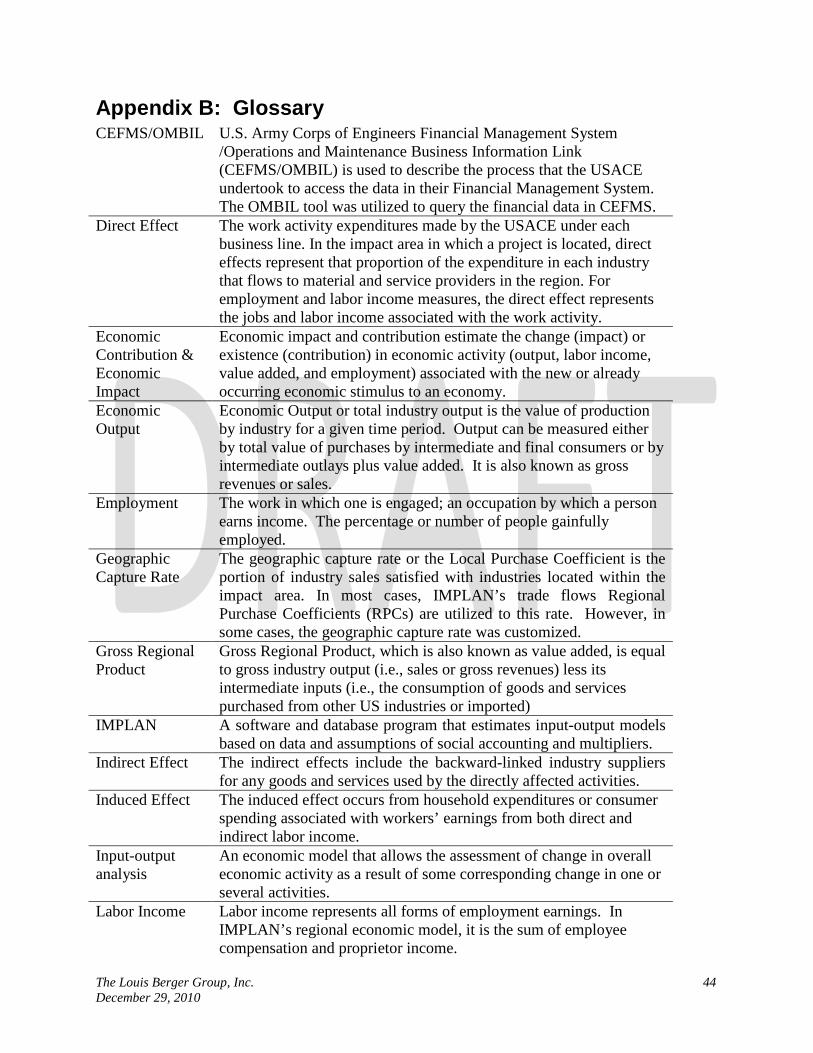
The Louis Berger Group, Inc. 44 December 29, 2010
Appendix B: Glossary CEFMS/OMBIL U.S. Army Corps of Engineers Financial Management System
/Operations and Maintenance Business Information Link (CEFMS/OMBIL) is used to describe the process that the USACE undertook to access the data in their Financial Management System. The OMBIL tool was utilized to query the financial data in CEFMS.
Direct Effect The work activity expenditures made by the USACE under each business line. In the impact area in which a project is located, direct effects represent that proportion of the expenditure in each industry that flows to material and service providers in the region. For employment and labor income measures, the direct effect represents the jobs and labor income associated with the work activity.
Economic Contribution & Economic Impact
Economic impact and contribution estimate the change (impact) or existence (contribution) in economic activity (output, labor income, value added, and employment) associated with the new or already occurring economic stimulus to an economy.
Economic Output
Economic Output or total industry output is the value of production by industry for a given time period. Output can be measured either by total value of purchases by intermediate and final consumers or by intermediate outlays plus value added. It is also known as gross revenues or sales.
Employment The work in which one is engaged; an occupation by which a person earns income. The percentage or number of people gainfully employed.
Geographic Capture Rate
The geographic capture rate or the Local Purchase Coefficient is the portion of industry sales satisfied with industries located within the impact area. In most cases, IMPLAN’s trade flows Regional Purchase Coefficients (RPCs) are utilized to this rate. However, in some cases, the geographic capture rate was customized.
Gross Regional Product
Gross Regional Product, which is also known as value added, is equal to gross industry output (i.e., sales or gross revenues) less its intermediate inputs (i.e., the consumption of goods and services purchased from other US industries or imported)
IMPLAN A software and database program that estimates input-output models based on data and assumptions of social accounting and multipliers.
Indirect Effect The indirect effects include the backward-linked industry suppliers for any goods and services used by the directly affected activities.
Induced Effect The induced effect occurs from household expenditures or consumer spending associated with workers’ earnings from both direct and indirect labor income.
Input-output analysis
An economic model that allows the assessment of change in overall economic activity as a result of some corresponding change in one or several activities.
Labor Income Labor income represents all forms of employment earnings. In IMPLAN’s regional economic model, it is the sum of employee compensation and proprietor income.
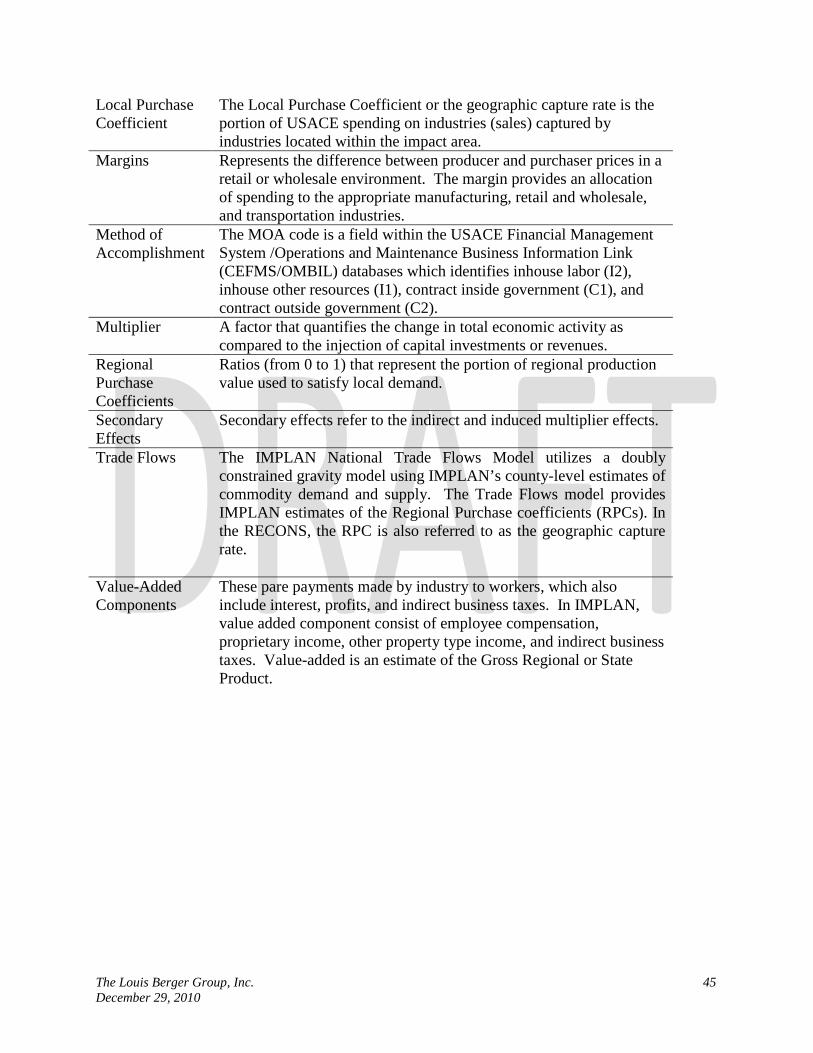
The Louis Berger Group, Inc. 45 December 29, 2010
Local Purchase Coefficient
The Local Purchase Coefficient or the geographic capture rate is the portion of USACE spending on industries (sales) captured by industries located within the impact area.
Margins Represents the difference between producer and purchaser prices in a retail or wholesale environment. The margin provides an allocation of spending to the appropriate manufacturing, retail and wholesale, and transportation industries.
Method of Accomplishment
The MOA code is a field within the USACE Financial Management System /Operations and Maintenance Business Information Link (CEFMS/OMBIL) databases which identifies inhouse labor (I2), inhouse other resources (I1), contract inside government (C1), and contract outside government (C2).
Multiplier A factor that quantifies the change in total economic activity as compared to the injection of capital investments or revenues.
Regional Purchase Coefficients
Ratios (from 0 to 1) that represent the portion of regional production value used to satisfy local demand.
Secondary Effects
Secondary effects refer to the indirect and induced multiplier effects.
Trade Flows The IMPLAN National Trade Flows Model utilizes a doubly constrained gravity model using IMPLAN’s county-level estimates of commodity demand and supply. The Trade Flows model provides IMPLAN estimates of the Regional Purchase coefficients (RPCs). In the RECONS, the RPC is also referred to as the geographic capture rate.
Value-Added Components
These pare payments made by industry to workers, which also include interest, profits, and indirect business taxes. In IMPLAN, value added component consist of employee compensation, proprietary income, other property type income, and indirect business taxes. Value-added is an estimate of the Gross Regional or State Product.

The Louis Berger Group, Inc. 46 December 29, 2010
Appendix C: FTE Industry Ratios FTE Ratios by Industry Applied to the Direct Employment Impacts (Source: IMPLAN)
IND IMPLAN Description FTE 1 Oilseed farming 0.85676 2 Grain farming 0.85676 3 Vegetable and melon farming 0.85676 4 Fruit farming 0.85676 5 Tree nut farming 0.85676 6 Greenhouse, nursery, and floriculture production 0.85676 7 Tobacco farming 0.85676 8 Cotton farming 0.85676 9 Sugarcane and sugar beet farming 0.85676
10 All other crop farming 0.85676 11 Cattle ranching and farming 0.85676 12 Dairy cattle and milk production 0.85676 13 Poultry and egg production 0.85676 14 Animal production, except cattle and poultry and eggs 0.85676 15 Forest nurseries, forest products, and timber tracts 0.879884 16 Logging 0.879884 17 Fishing 0.879884 18 Hunting and trapping 0.879884 19 Support activities for agriculture and forestry 0.879884 20 Oil and gas extraction 0.986395 21 Coal mining 0.982143 22 Iron ore mining 0.982143 23 Copper, nickel, lead, and zinc mining 0.982143 24 Gold, silver, and other metal ore mining 0.982143 25 Stone mining and quarrying 0.982143
26 Sand, gravel, clay, and ceramic and refractory minerals mining and quarrying 0.982143
27 Other nonmetallic mineral mining and quarrying 0.982143 28 Drilling oil and gas wells 0.986254 29 Support activities for oil and gas operations 0.986254 30 Support activities for other mining 0.986254 31 Electric power generation, transmission, and distribution 0.987342 32 Natural gas distribution 0.987342 33 Water, sewage and other systems 0.987342 34 Construction of new nonresidential commercial and health care structures 0.966756

The Louis Berger Group, Inc. 47 December 29, 2010
35 Construction of new nonresidential manufacturing structures 0.966756 36 Construction of other new nonresidential structures 0.966756
37 Construction of new residential permanent site single- and multi-family structures 0.966756
38 Construction of other new residential structures 0.966756
39 Maintenance and repair construction of nonresidential maintenance and repair 0.966756
40 Maintenance and repair construction of residential structures 0.966756 41 Dog and cat food manufacturing 0.967475 42 Other animal food manufacturing 0.967475 43 Flour milling and malt manufacturing 0.967475 44 Wet corn milling 0.967475 45 Soybean and other oilseed processing 0.967475 46 Fats and oils refining and blending 0.967475 47 Breakfast cereal manufacturing 0.967475 48 Sugar cane mills and refining 0.967475 49 Beet sugar manufacturing 0.967475 50 Chocolate and confectionery manufacturing from cacao beans 0.967475 51 Confectionery manufacturing from purchased chocolate 0.967475 52 Nonchocolate confectionery manufacturing 0.967475 53 Frozen food manufacturing 0.967475 54 Fruit and vegetable canning, pickling, and drying 0.967475 55 Fluid milk and butter manufacturing 0.967475 56 Cheese manufacturing 0.967475 57 Dry, condensed, and evaporated dairy product manufacturing 0.967475 58 Ice cream and frozen dessert manufacturing 0.967475 59 Animal (except poultry) slaughtering, rendering, and processing 0.967475 60 Poultry processing 0.967475 61 Seafood product preparation and packaging 0.967475 62 Bread and bakery product manufacturing 0.967475 63 Cookie, cracker, and pasta manufacturing 0.967475 64 Tortilla manufacturing 0.967475 65 Snack food manufacturing 0.967475 66 Coffee and tea manufacturing 0.967475 67 Flavoring syrup and concentrate manufacturing 0.967475 68 Seasoning and dressing manufacturing 0.967475 69 All other food manufacturing 0.967475 70 Soft drink and ice manufacturing 0.967475 71 Breweries 0.967475 72 Wineries 0.967475 73 Distilleries 0.967475 74 Tobacco product manufacturing 0.967475
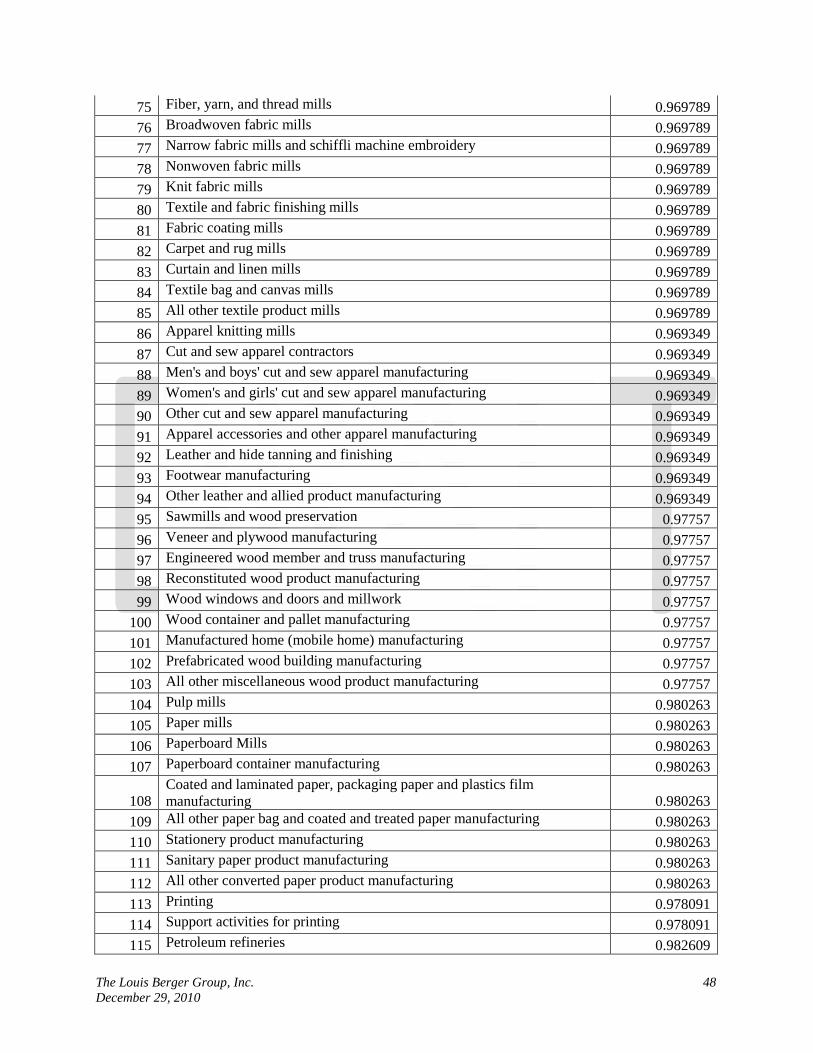
The Louis Berger Group, Inc. 48 December 29, 2010
75 Fiber, yarn, and thread mills 0.969789 76 Broadwoven fabric mills 0.969789 77 Narrow fabric mills and schiffli machine embroidery 0.969789 78 Nonwoven fabric mills 0.969789 79 Knit fabric mills 0.969789 80 Textile and fabric finishing mills 0.969789 81 Fabric coating mills 0.969789 82 Carpet and rug mills 0.969789 83 Curtain and linen mills 0.969789 84 Textile bag and canvas mills 0.969789 85 All other textile product mills 0.969789 86 Apparel knitting mills 0.969349 87 Cut and sew apparel contractors 0.969349 88 Men's and boys' cut and sew apparel manufacturing 0.969349 89 Women's and girls' cut and sew apparel manufacturing 0.969349 90 Other cut and sew apparel manufacturing 0.969349 91 Apparel accessories and other apparel manufacturing 0.969349 92 Leather and hide tanning and finishing 0.969349 93 Footwear manufacturing 0.969349 94 Other leather and allied product manufacturing 0.969349 95 Sawmills and wood preservation 0.97757 96 Veneer and plywood manufacturing 0.97757 97 Engineered wood member and truss manufacturing 0.97757 98 Reconstituted wood product manufacturing 0.97757 99 Wood windows and doors and millwork 0.97757
100 Wood container and pallet manufacturing 0.97757 101 Manufactured home (mobile home) manufacturing 0.97757 102 Prefabricated wood building manufacturing 0.97757 103 All other miscellaneous wood product manufacturing 0.97757 104 Pulp mills 0.980263 105 Paper mills 0.980263 106 Paperboard Mills 0.980263 107 Paperboard container manufacturing 0.980263
108 Coated and laminated paper, packaging paper and plastics film manufacturing 0.980263
109 All other paper bag and coated and treated paper manufacturing 0.980263 110 Stationery product manufacturing 0.980263 111 Sanitary paper product manufacturing 0.980263 112 All other converted paper product manufacturing 0.980263 113 Printing 0.978091 114 Support activities for printing 0.978091 115 Petroleum refineries 0.982609

The Louis Berger Group, Inc. 49 December 29, 2010
116 Asphalt paving mixture and block manufacturing 0.982609 117 Asphalt shingle and coating materials manufacturing 0.982609 118 Petroleum lubricating oil and grease manufacturing 0.982609 119 All other petroleum and coal products manufacturing 0.982609 120 Petrochemical manufacturing 0.982609 121 Industrial gas manufacturing 0.983759 122 Synthetic dye and pigment manufacturing 0.983759 123 Alkalies and chlorine manufacturing 0.983759 124 Carbon black manufacturing 0.983759 125 All other basic inorganic chemical manufacturing 0.983759 126 Other basic organic chemical manufacturing 0.983759 127 Plastics material and resin manufacturing 0.983759 128 Synthetic rubber manufacturing 0.983759 129 Artificial and synthetic fibers and filaments manufacturing 0.983759 130 Fertilizer manufacturing 0.983759 131 Pesticide and other agricultural chemical manufacturing 0.983759 132 Medicinal and botanical manufacturing 0.983759 133 Pharmaceutical preparation manufacturing 0.983759 134 In-vitro diagnostic substance manufacturing 0.983759 135 Biological product (except diagnostic) manufacturing 0.983759 136 Paint and coating manufacturing 0.983759 137 Adhesive manufacturing 0.983759 138 Soap and cleaning compound manufacturing 0.983759 139 Toilet preparation manufacturing 0.983759 140 Printing ink manufacturing 0.983759 141 All other chemical product and preparation manufacturing 0.983759
142 Plastics packaging materials and unlaminated film and sheet manufacturing 0.98543
143 Unlaminated plastics profile shape manufacturing 0.98543 144 Plastics pipe and pipe fitting manufacturing 0.98543
145 Laminated plastics plate, sheet (except packaging), and shape manufacturing 0.98543
146 Polystyrene foam product manufacturing 0.98543 147 Urethane and other foam product (except polystyrene) manufacturing 0.98543 148 Plastics bottle manufacturing 0.98543 149 Other plastics product manufacturing 0.98543 150 Tire manufacturing 0.98543 151 Rubber and plastics hoses and belting manufacturing 0.98543 152 Other rubber product manufacturing 0.98543 153 Pottery, ceramics, and plumbing fixture manufacturing 0.992032 154 Brick, tile, and other structural clay product manufacturing 0.992032 155 Clay and nonclay refractory manufacturing 0.992032

The Louis Berger Group, Inc. 50 December 29, 2010
156 Flat glass manufacturing 0.992032 157 Other pressed and blown glass and glassware manufacturing 0.992032 158 Glass container manufacturing 0.992032 159 Glass product manufacturing made of purchased glass 0.992032 160 Cement manufacturing 0.992032 161 Ready-mix concrete manufacturing 0.992032 162 Concrete pipe, brick, and block manufacturing 0.992032 163 Other concrete product manufacturing 0.992032 164 Lime and gypsum product manufacturing 0.992032 165 Abrasive product manufacturing 0.992032 166 Cut stone and stone product manufacturing 0.992032 167 Ground or treated mineral and earth manufacturing 0.992032 168 Mineral wool manufacturing 0.992032 169 Miscellaneous nonmetallic mineral products 0.992032 170 Iron and steel mills and ferroalloy manufacturing 0.978118 171 Steel product manufacturing from purchased steel 0.978118 172 Alumina refining and primary aluminum production 0.978118 173 Secondary smelting and alloying of aluminum 0.978118 174 Aluminum product manufacturing from purchased aluminum 0.978118 175 Primary smelting and refining of copper 0.978118
176 Primary smelting and refining of nonferrous metal (except copper and aluminum) 0.978118
177 Copper rolling, drawing, extruding and alloying 0.978118
178 Nonferrous metal (except copper and aluminum) rolling, drawing, extruding and alloying 0.978118
179 Ferrous metal foundries 0.978118 180 Nonferrous metal foundries 0.978118 181 All other forging, stamping, and sintering 0.979513 182 Custom roll forming 0.979513 183 Crown and closure manufacturing and metal stamping 0.979513 184 Cutlery, utensil, pot, and pan manufacturing 0.979513 185 Handtool manufacturing 0.979513 186 Plate work and fabricated structural product manufacturing 0.979513 187 Ornamental and architectural metal products manufacturing 0.979513 188 Power boiler and heat exchanger manufacturing 0.979513 189 Metal tank (heavy gauge) manufacturing 0.979513 190 Metal can, box, and other metal container (light gauge) manufacturing 0.979513 191 Ammunition manufacturing 0.979513 192 Arms, ordnance, and accessories manufacturing 0.979513 193 Hardware manufacturing 0.979513 194 Spring and wire product manufacturing 0.979513 195 Machine shops 0.979513

The Louis Berger Group, Inc. 51 December 29, 2010
196 Turned product and screw, nut, and bolt manufacturing 0.979513 197 Coating, engraving, heat treating and allied activities 0.979513 198 Valve and fittings other than plumbing 0.979513 199 Plumbing fixture fitting and trim manufacturing 0.979513 200 Ball and roller bearing manufacturing 0.979513 201 Fabricated pipe and pipe fitting manufacturing 0.979513 202 Other fabricated metal manufacturing 0.979513 203 Farm machinery and equipment manufacturing 0.98406 204 Lawn and garden equipment manufacturing 0.98406 205 Construction machinery manufacturing 0.98406 206 Mining and oil and gas field machinery manufacturing 0.98406 207 Other industrial machinery manufacturing 0.98406 208 Plastics and rubber industry machinery manufacturing 0.98406 209 Semiconductor machinery manufacturing 0.98406 210 Vending, commercial, industrial, and office machinery manufacturing 0.98406 211 Optical instrument and lens manufacturing 0.98406 212 Photographic and photocopying equipment manufacturing 0.98406 213 Other commercial and service industry machinery manufacturing 0.98406 214 Air purification and ventilation equipment manufacturing 0.98406 215 Heating equipment (except warm air furnaces) manufacturing 0.98406
216 Air conditioning, refrigeration, and warm air heating equipment manufacturing 0.98406
217 Industrial mold manufacturing 0.98406 218 Metal cutting and forming machine tool manufacturing 0.98406 219 Special tool, die, jig, and fixture manufacturing 0.98406 220 Cutting tool and machine tool accessory manufacturing 0.98406 221 Rolling mill and other metalworking machinery manufacturing 0.98406 222 Turbine and turbine generator set units manufacturing 0.98406 223 Speed changer, industrial high-speed drive, and gear manufacturing 0.98406 224 Mechanical power transmission equipment manufacturing 0.98406 225 Other engine equipment manufacturing 0.98406 226 Pump and pumping equipment manufacturing 0.98406 227 Air and gas compressor manufacturing 0.98406 228 Material handling equipment manufacturing 0.98406 229 Power-driven handtool manufacturing 0.98406 230 Other general purpose machinery manufacturing 0.98406 231 Packaging machinery manufacturing 0.98406 232 Industrial process furnace and oven manufacturing 0.98406 233 Fluid power process machinery 0.98406 234 Electronic computer manufacturing 0.986646 235 Computer storage device manufacturing 0.986646 236 Computer terminals and other computer peripheral equipment 0.986646
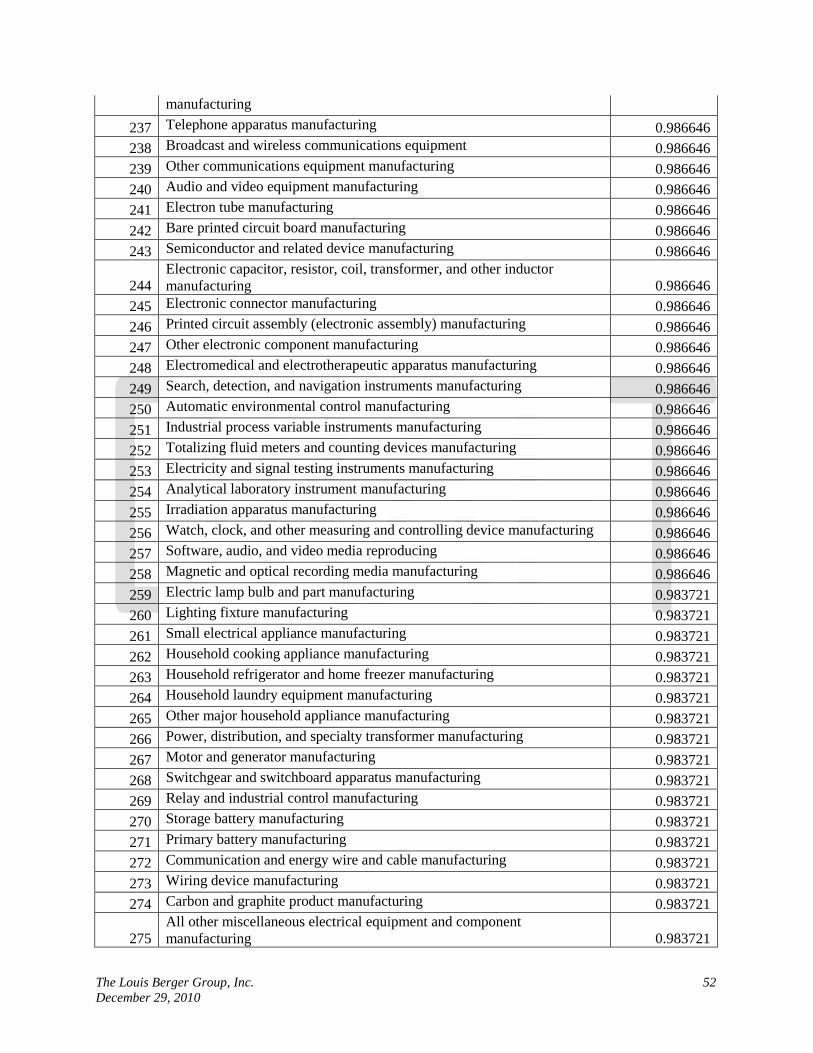
The Louis Berger Group, Inc. 52 December 29, 2010
manufacturing 237 Telephone apparatus manufacturing 0.986646 238 Broadcast and wireless communications equipment 0.986646 239 Other communications equipment manufacturing 0.986646 240 Audio and video equipment manufacturing 0.986646 241 Electron tube manufacturing 0.986646 242 Bare printed circuit board manufacturing 0.986646 243 Semiconductor and related device manufacturing 0.986646
244 Electronic capacitor, resistor, coil, transformer, and other inductor manufacturing 0.986646
245 Electronic connector manufacturing 0.986646 246 Printed circuit assembly (electronic assembly) manufacturing 0.986646 247 Other electronic component manufacturing 0.986646 248 Electromedical and electrotherapeutic apparatus manufacturing 0.986646 249 Search, detection, and navigation instruments manufacturing 0.986646 250 Automatic environmental control manufacturing 0.986646 251 Industrial process variable instruments manufacturing 0.986646 252 Totalizing fluid meters and counting devices manufacturing 0.986646 253 Electricity and signal testing instruments manufacturing 0.986646 254 Analytical laboratory instrument manufacturing 0.986646 255 Irradiation apparatus manufacturing 0.986646 256 Watch, clock, and other measuring and controlling device manufacturing 0.986646 257 Software, audio, and video media reproducing 0.986646 258 Magnetic and optical recording media manufacturing 0.986646 259 Electric lamp bulb and part manufacturing 0.983721 260 Lighting fixture manufacturing 0.983721 261 Small electrical appliance manufacturing 0.983721 262 Household cooking appliance manufacturing 0.983721 263 Household refrigerator and home freezer manufacturing 0.983721 264 Household laundry equipment manufacturing 0.983721 265 Other major household appliance manufacturing 0.983721 266 Power, distribution, and specialty transformer manufacturing 0.983721 267 Motor and generator manufacturing 0.983721 268 Switchgear and switchboard apparatus manufacturing 0.983721 269 Relay and industrial control manufacturing 0.983721 270 Storage battery manufacturing 0.983721 271 Primary battery manufacturing 0.983721 272 Communication and energy wire and cable manufacturing 0.983721 273 Wiring device manufacturing 0.983721 274 Carbon and graphite product manufacturing 0.983721
275 All other miscellaneous electrical equipment and component manufacturing 0.983721

The Louis Berger Group, Inc. 53 December 29, 2010
276 Automobile manufacturing 0.988934 277 Light truck and utility vehicle manufacturing 0.988934 278 Heavy duty truck manufacturing 0.988934 279 Motor vehicle body manufacturing 0.988934 280 Truck trailer manufacturing 0.988934 281 Motor home manufacturing 0.988934 282 Travel trailer and camper manufacturing 0.988934 283 Motor vehicle parts manufacturing 0.988934 284 Aircraft manufacturing 0.988842 285 Aircraft engine and engine parts manufacturing 0.988842 286 Other aircraft parts and auxiliary equipment manufacturing 0.988842 287 Guided missile and space vehicle manufacturing 0.988842 288 Propulsion units and parts for space vehicles and guided missiles 0.988842 289 Railroad rolling stock manufacturing 0.988842 290 Ship building and repairing 0.988842 291 Boat building 0.988842 292 Motorcycle, bicycle, and parts manufacturing 0.988842 293 Military armored vehicle, tank, and tank component manufacturing 0.988842 294 All other transportation equipment manufacturing 0.988842 295 Wood kitchen cabinet and countertop manufacturing 0.97561 296 Upholstered household furniture manufacturing 0.97561 297 Nonupholstered wood household furniture manufacturing 0.97561 298 Metal and other household furniture (except wood) manufacturing1 0.97561 299 Institutional furniture manufacturing 0.97561 300 Wood television, radio, and sewing machine cabinet manufacturing1 0.97561
301 Office furniture and custom architectural woodwork and millwork manufacturing1 0.97561
302 Showcase, partition, shelving, and locker manufacturing 0.97561 303 Mattress manufacturing 0.97561 304 Blind and shade manufacturing 0.97561 305 Surgical and medical instrument manufacturing 0.969743 306 Surgical appliance and supplies manufacturing 0.969743 307 Dental equipment and supplies manufacturing 0.969743 308 Ophthalmic goods manufacturing 0.969743 309 Dental laboratories 0.969743 310 Jewelry and silverware manufacturing 0.969743 311 Sporting and athletic goods manufacturing 0.969743 312 Doll, toy, and game manufacturing 0.969743 313 Office supplies (except paper) manufacturing 0.969743 314 Sign manufacturing 0.969743 315 Gasket, packing, and sealing device manufacturing 0.969743

The Louis Berger Group, Inc. 54 December 29, 2010
316 Musical instrument manufacturing 0.969743 317 All other miscellaneous manufacturing 0.969743 318 Broom, brush, and mop manufacturing 0.969743 319 Wholesale trade 0.963663 320 Retail - Motor vehicle and parts 0.871001 321 Retail - Furniture and home furnishings 0.870653 322 Retail - Electronics and appliances 0.870653 323 Retail - Building material and garden supply 0.870653 324 Retail - Food and beverage 0.870408 325 Retail - Health and personal care 0.870653 326 Retail - Gasoline stations 0.870653 327 Retail - Clothing and clothing accessories 0.870653 328 Retail - Sporting goods, hobby, book and music 0.870653 329 Retail - General merchandise 0.870626 330 Retail - Miscellaneous 0.870653 331 Retail - Nonstore 0.870653 332 Air transportation 0.947047 333 Rail transportation 0.945545 334 Water transportation 0.938462 335 Truck transportation 0.946259 336 Transit and ground passenger transportation 0.944954 337 Pipeline transportation 0.95
338 Scenic and sightseeing transportation and support activities for transportation 0.945319
339 Couriers and messengers 0.945319 340 Warehousing and storage 0.945455 341 Newspaper publishers 0.917611 342 Periodical publishers 0.917611 343 Book publishers 0.917611 344 Directory, mailing list, and other publishers 0.917611 345 Software publishers 0.917611 346 Motion picture and video industries 0.825974 347 Sound recording industries 0.825974 348 Radio and television broadcasting 0.980896 349 Cable and other subscription programming 0.980896 350 Internet publishing and broadcasting 0.980896 351 Telecommunications 0.980896 352 Data processing, hosting, and related services 0.936556 353 Other information services 0.980896 354 Monetary authorities and depository credit intermediation 0.962336 355 Nondepository credit intermediation and related activities 0.962336 356 Securities, commodity contracts, investments, and related activities 0.961364
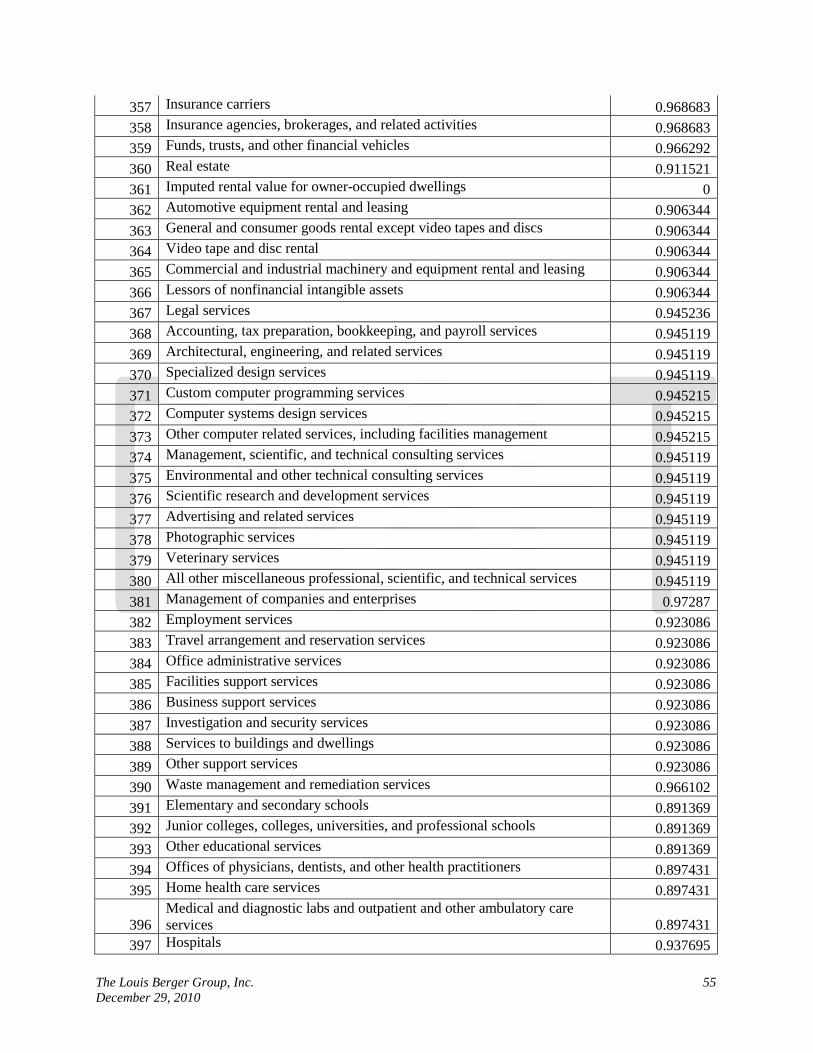
The Louis Berger Group, Inc. 55 December 29, 2010
357 Insurance carriers 0.968683 358 Insurance agencies, brokerages, and related activities 0.968683 359 Funds, trusts, and other financial vehicles 0.966292 360 Real estate 0.911521 361 Imputed rental value for owner-occupied dwellings 0 362 Automotive equipment rental and leasing 0.906344 363 General and consumer goods rental except video tapes and discs 0.906344 364 Video tape and disc rental 0.906344 365 Commercial and industrial machinery and equipment rental and leasing 0.906344 366 Lessors of nonfinancial intangible assets 0.906344 367 Legal services 0.945236 368 Accounting, tax preparation, bookkeeping, and payroll services 0.945119 369 Architectural, engineering, and related services 0.945119 370 Specialized design services 0.945119 371 Custom computer programming services 0.945215 372 Computer systems design services 0.945215 373 Other computer related services, including facilities management 0.945215 374 Management, scientific, and technical consulting services 0.945119 375 Environmental and other technical consulting services 0.945119 376 Scientific research and development services 0.945119 377 Advertising and related services 0.945119 378 Photographic services 0.945119 379 Veterinary services 0.945119 380 All other miscellaneous professional, scientific, and technical services 0.945119 381 Management of companies and enterprises 0.97287 382 Employment services 0.923086 383 Travel arrangement and reservation services 0.923086 384 Office administrative services 0.923086 385 Facilities support services 0.923086 386 Business support services 0.923086 387 Investigation and security services 0.923086 388 Services to buildings and dwellings 0.923086 389 Other support services 0.923086 390 Waste management and remediation services 0.966102 391 Elementary and secondary schools 0.891369 392 Junior colleges, colleges, universities, and professional schools 0.891369 393 Other educational services 0.891369 394 Offices of physicians, dentists, and other health practitioners 0.897431 395 Home health care services 0.897431
396 Medical and diagnostic labs and outpatient and other ambulatory care services 0.897431
397 Hospitals 0.937695
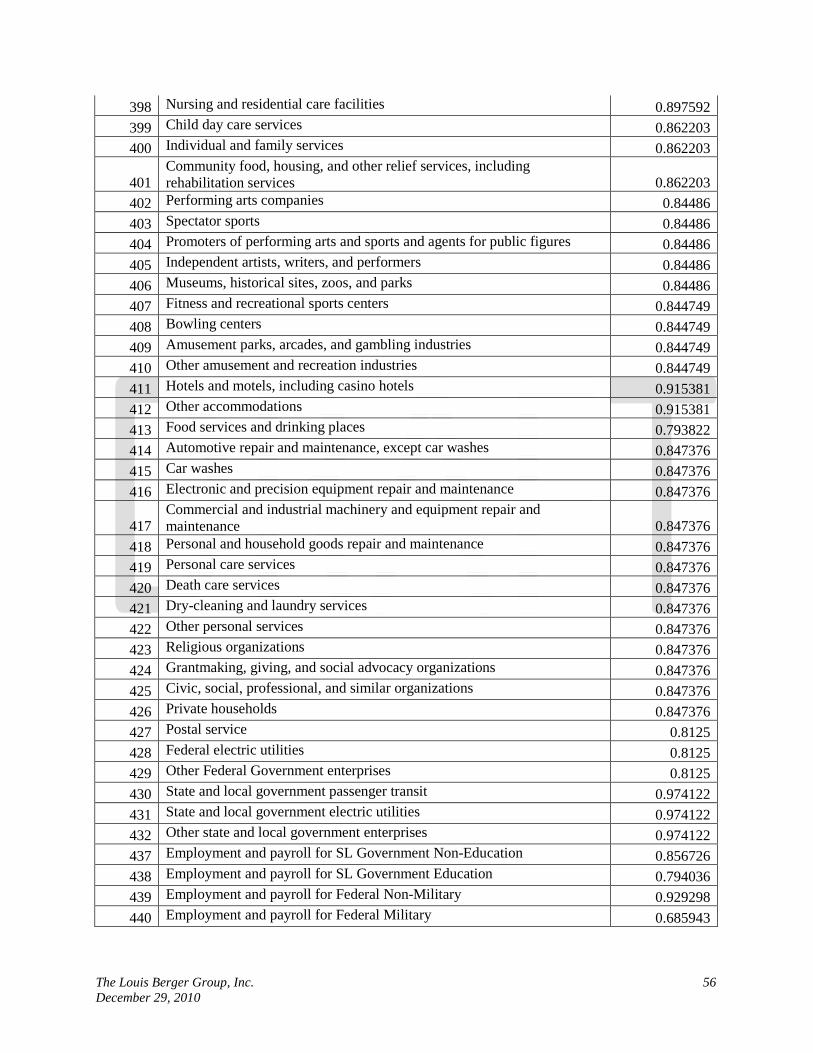
The Louis Berger Group, Inc. 56 December 29, 2010
398 Nursing and residential care facilities 0.897592 399 Child day care services 0.862203 400 Individual and family services 0.862203
401 Community food, housing, and other relief services, including rehabilitation services 0.862203
402 Performing arts companies 0.84486 403 Spectator sports 0.84486 404 Promoters of performing arts and sports and agents for public figures 0.84486 405 Independent artists, writers, and performers 0.84486 406 Museums, historical sites, zoos, and parks 0.84486 407 Fitness and recreational sports centers 0.844749 408 Bowling centers 0.844749 409 Amusement parks, arcades, and gambling industries 0.844749 410 Other amusement and recreation industries 0.844749 411 Hotels and motels, including casino hotels 0.915381 412 Other accommodations 0.915381 413 Food services and drinking places 0.793822 414 Automotive repair and maintenance, except car washes 0.847376 415 Car washes 0.847376 416 Electronic and precision equipment repair and maintenance 0.847376
417 Commercial and industrial machinery and equipment repair and maintenance 0.847376
418 Personal and household goods repair and maintenance 0.847376 419 Personal care services 0.847376 420 Death care services 0.847376 421 Dry-cleaning and laundry services 0.847376 422 Other personal services 0.847376 423 Religious organizations 0.847376 424 Grantmaking, giving, and social advocacy organizations 0.847376 425 Civic, social, professional, and similar organizations 0.847376 426 Private households 0.847376 427 Postal service 0.8125 428 Federal electric utilities 0.8125 429 Other Federal Government enterprises 0.8125 430 State and local government passenger transit 0.974122 431 State and local government electric utilities 0.974122 432 Other state and local government enterprises 0.974122 437 Employment and payroll for SL Government Non-Education 0.856726 438 Employment and payroll for SL Government Education 0.794036 439 Employment and payroll for Federal Non-Military 0.929298 440 Employment and payroll for Federal Military 0.685943
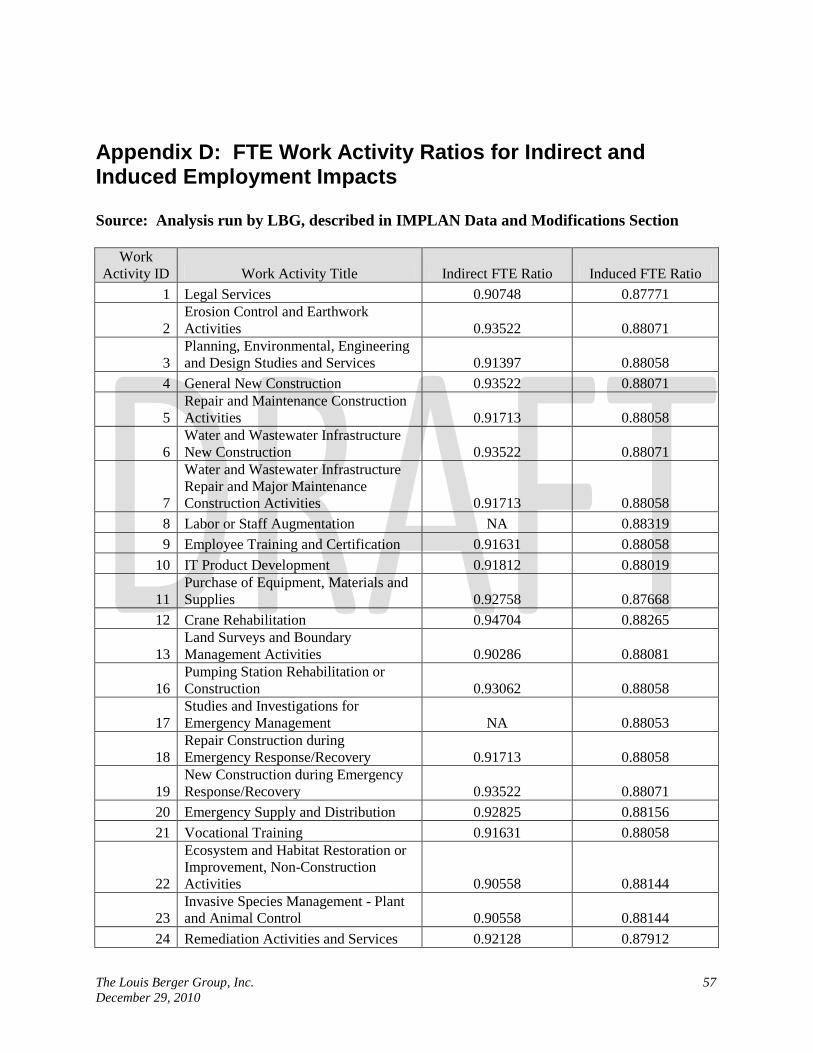
The Louis Berger Group, Inc. 57 December 29, 2010
Appendix D: FTE Work Activity Ratios for Indirect and Induced Employment Impacts Source: Analysis run by LBG, described in IMPLAN Data and Modifications Section
Work Activity ID Work Activity Title Indirect FTE Ratio Induced FTE Ratio
1 Legal Services 0.90748 0.87771
2 Erosion Control and Earthwork Activities 0.93522 0.88071
3 Planning, Environmental, Engineering and Design Studies and Services 0.91397 0.88058
4 General New Construction 0.93522 0.88071
5 Repair and Maintenance Construction Activities 0.91713 0.88058
6 Water and Wastewater Infrastructure New Construction 0.93522 0.88071
7
Water and Wastewater Infrastructure Repair and Major Maintenance Construction Activities 0.91713 0.88058
8 Labor or Staff Augmentation NA 0.88319 9 Employee Training and Certification 0.91631 0.88058
10 IT Product Development 0.91812 0.88019
11 Purchase of Equipment, Materials and Supplies 0.92758 0.87668
12 Crane Rehabilitation 0.94704 0.88265
13 Land Surveys and Boundary Management Activities 0.90286 0.88081
16 Pumping Station Rehabilitation or Construction 0.93062 0.88058
17 Studies and Investigations for Emergency Management NA 0.88053
18 Repair Construction during Emergency Response/Recovery 0.91713 0.88058
19 New Construction during Emergency Response/Recovery 0.93522 0.88071
20 Emergency Supply and Distribution 0.92825 0.88156 21 Vocational Training 0.91631 0.88058
22
Ecosystem and Habitat Restoration or Improvement, Non-Construction Activities 0.90558 0.88144
23 Invasive Species Management - Plant and Animal Control 0.90558 0.88144
24 Remediation Activities and Services 0.92128 0.87912
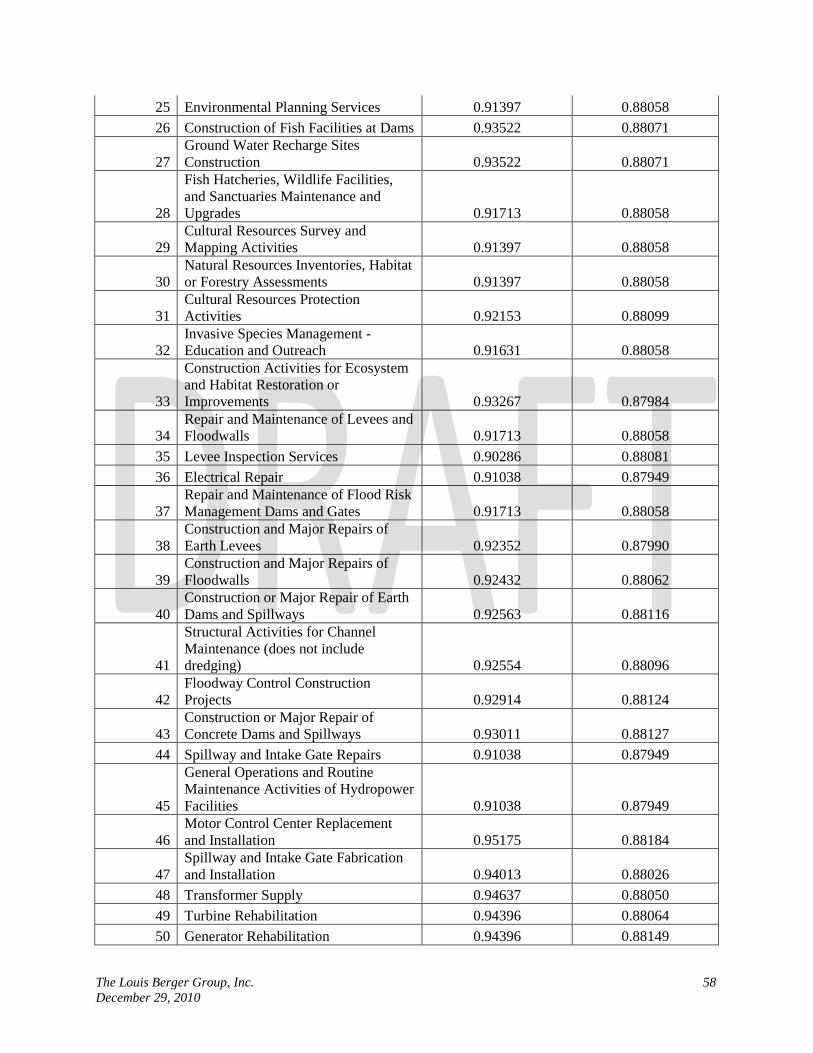
The Louis Berger Group, Inc. 58 December 29, 2010
25 Environmental Planning Services 0.91397 0.88058 26 Construction of Fish Facilities at Dams 0.93522 0.88071
27 Ground Water Recharge Sites Construction 0.93522 0.88071
28
Fish Hatcheries, Wildlife Facilities, and Sanctuaries Maintenance and Upgrades 0.91713 0.88058
29 Cultural Resources Survey and Mapping Activities 0.91397 0.88058
30 Natural Resources Inventories, Habitat or Forestry Assessments 0.91397 0.88058
31 Cultural Resources Protection Activities 0.92153 0.88099
32 Invasive Species Management - Education and Outreach 0.91631 0.88058
33
Construction Activities for Ecosystem and Habitat Restoration or Improvements 0.93267 0.87984
34 Repair and Maintenance of Levees and Floodwalls 0.91713 0.88058
35 Levee Inspection Services 0.90286 0.88081 36 Electrical Repair 0.91038 0.87949
37 Repair and Maintenance of Flood Risk Management Dams and Gates 0.91713 0.88058
38 Construction and Major Repairs of Earth Levees 0.92352 0.87990
39 Construction and Major Repairs of Floodwalls 0.92432 0.88062
40 Construction or Major Repair of Earth Dams and Spillways 0.92563 0.88116
41
Structural Activities for Channel Maintenance (does not include dredging) 0.92554 0.88096
42 Floodway Control Construction Projects 0.92914 0.88124
43 Construction or Major Repair of Concrete Dams and Spillways 0.93011 0.88127
44 Spillway and Intake Gate Repairs 0.91038 0.87949
45
General Operations and Routine Maintenance Activities of Hydropower Facilities 0.91038 0.87949
46 Motor Control Center Replacement and Installation 0.95175 0.88184
47 Spillway and Intake Gate Fabrication and Installation 0.94013 0.88026
48 Transformer Supply 0.94637 0.88050 49 Turbine Rehabilitation 0.94396 0.88064 50 Generator Rehabilitation 0.94396 0.88149

The Louis Berger Group, Inc. 59 December 29, 2010
51 Transformer Installation 0.93367 0.87987 52 Ancillary Electrical Replacement 0.95175 0.88027 53 Turbine Repair 0.91438 0.88191
54 Placement Area Construction and Rehabilitation 0.93522 0.88071
55 Construction and Repair of Concrete / Wooden Breakwaters and Jetties 0.93522 0.88071
56
Structural Activities for Channel Maintenance (does not include dredging) 0.93522 0.88071
57 Repair and Maintenance of Locks 0.91038 0.87949
58 Repair and Maintenance of Navigation or Multi-Purpose Dams 0.91038 0.87949
59 Lock construction of On-site features 0.92787 0.88122
60 Lock or dam gate fabrication and installation 0.94030 0.88043
61 New Construction or Major Repair of Navigation or Multi-Purpose Dams 0.93016 0.88022
62 Construction and Repair of Large Stone Breakwaters and Jetties 0.92361 0.88081
63 Dredging Hopper 0.93318 0.88128
68 Dredging Large Mechanical_Gulf Coast and Lower Mississippi 0.00000 0.88214
69 Dredging Large Mechanical_Southeast 0.92785 0.88118
70 Dredging Large Mechanical_West Coast 0.00000 0.88214
71 Dredging Large Mechanical_Northeast and Mid_Atlantic 0.00000 0.88214
72 Dredging Large Mechanical_Alaska and Hawaii 0.93299 0.88142
73 Dredging Small Mechanical_Gulf Coast and Lower Mississippi 0.92745 0.88065
74 Dredging Small Mechanical_Southeast 0.92813 0.88084
75 Dredging Small Mechanical_Great Lakes 0.92964 0.88129
76 Dredging Small Mechanical_Northeast and Mid_Atlantic 0.92478 0.88139
77 Dredging Small Mechanical_West Coast 0.92478 0.88139
78 Dredging Small Mechanical_Alaska and Hawaii 0.92478 0.88139
79 Dredging Pipelines_Gulf Coast and Lower Mississippi 0.93895 0.88122
80 Dredging Pipelines_Southeast 0.93930 0.88150 81 Dredging Pipelines_Great Lakes 0.93930 0.88167
82 Dredging Pipelines_Northeast and Mid_Atlantic 0.94124 0.88120
83 Dredging Pipelines_West Coast 0.94102 0.88143

The Louis Berger Group, Inc. 60 December 29, 2010
84 Dredging Pipelines_Alaska and Hawaii 0.94035 0.88133
85 General Operations and Routine Maintenance of Recreation Areas 0.91711 0.88019
86 New Construction in Recreation Areas 0.93522 0.88071
87 Repair and Maintenance Construction in Recreation Areas 0.91713 0.88058
88 Environmental and Technical Consulting Services 0.91397 0.88058
89 Dredging Large Mechanical_Central Inland Waterways 0.92982 0.88116
90 Dredging Small Mechanical_Central Inland Waterways 0.92891 0.88101
91 Dredging Pipelines_Central Inland Waterways 0.00000 0.88214
92 FUSRAP 0.92115 0.87995 93 USACE Labor NA 0.88053 94 USACE Admin 0.90146 0.88010
95
Purchase and Installation of Non-Technical Equipment and Structures - Miscellaneous Equipment 0.93746 0.88124
96
Purchase and Installation of Non-Technical Equipment and Structures - Playground Equipment 0.92618 0.88125
97
Purchase and Installation of Non-Technical Equipment and Structures - Plumbing Fixtures 0.93200 0.88126
98
Purchase and Installation of Non-Technical Equipment and Structures - Pre-fabricated Metal Structures 0.92480 0.88102
99 Purchase and Installation of Technical Equipment - Channels 0.95177 0.88122
100 Purchase and Installation of Technical Equipment - Generator 0.94099 0.88109
101
Purchase and Installation of Technical Equipment - Piezometers and other Technical Equipment 0.93494 0.88105
102 Purchase of Equipment, Materials and Supplies - Air Compressor 0.93588 0.88001
103 Purchase of Equipment, Materials and Supplies - Boats 0.92133 0.88002
104 Purchase of Equipment, Materials and Supplies - Buoy 0.91704 0.87996
105 Purchase of Equipment, Materials and Supplies - Concrete Security Barriers 0.93222 0.87999
106
Purchase of Equipment, Materials and Supplies - Construction and Maintenance Machinery and Equipment 0.94742 0.88002

The Louis Berger Group, Inc. 61 December 29, 2010
107 Purchase of Equipment, Materials and Supplies - Digital Line Relays 0.92852 0.88003
108
Purchase of Equipment, Materials and Supplies - Dump Truck and other Motor Vehicles 0.94538 0.88003
109 Purchase of Equipment, Materials and Supplies - Elevator 0.93413 0.88002
110
Purchase of Equipment, Materials and Supplies - Equipment for Testing Electricity and Electrical Signals 0.92824 0.88005
111 Purchase of Equipment, Materials and Supplies - Filters/Screens 0.93390 0.88003
112 Purchase of Equipment, Materials and Supplies - Furnace 0.94069 0.88004
113 Purchase of Equipment, Materials and Supplies - Gearboxes 0.93502 0.88003
114 Purchase of Equipment, Materials and Supplies - Generator 0.94427 0.88004
115 Purchase of Equipment, Materials and Supplies - Gravel 0.94190 0.87986
116 Purchase of Equipment, Materials and Supplies - Handrails 0.94612 0.88000
117 Purchase of Equipment, Materials and Supplies - HVAC 0.93593 0.88003
118
Purchase of Equipment, Materials and Supplies - Load-sensing Safety Equipment 0.93342 0.88004
119 Purchase of Equipment, Materials and Supplies - Log Booms 0.88842 0.87968
120
Purchase of Equipment, Materials and Supplies - Miscellaneous Electricity Equipment 0.93508 0.88003
121 Purchase of Equipment, Materials and Supplies - Miscellaneous Equipment 0.93498 0.87990
122 Purchase of Equipment, Materials and Supplies - Motors 0.94296 0.88002
123
Purchase of Equipment, Materials and Supplies - Piezometers and other Technical Equipment 0.93494 0.88004
124
Purchase of Equipment, Materials and Supplies - Pre-fabricated Metal Structures 0.92480 0.88001
125 Purchase of Equipment, Materials and Supplies - Publications 0.91856 0.87992
126 Purchase of Equipment, Materials and Supplies - Pumps 0.94344 0.88002
127
Purchase of Equipment, Materials and Supplies - Radio Emergency Equipment and GPS Equipment 0.93668 0.88003

The Louis Berger Group, Inc. 62 December 29, 2010
128 Purchase of Equipment, Materials and Supplies - Rock and Crushed Stone 0.95496 0.87984
129
Purchase of Equipment, Materials and Supplies - SCADA Communications Equipment 0.93173 0.88003
130
Purchase of Equipment, Materials and Supplies - Security System and Camera 0.93173 0.88003
131 Purchase of Equipment, Materials and Supplies - Steel Doors 0.93413 0.88002
132 Purchase of Equipment, Materials and Supplies - Stop Logs 0.93835 0.88004
133 Purchase of Equipment, Materials and Supplies - Street Cleaner 0.93637 0.88002
134 Purchase of Equipment, Materials and Supplies - Tainter Gate Parts 0.94218 0.88002
135 Purchase of Equipment, Materials and Supplies - Thrust Bearing Oil Coolers 0.94218 0.88002
136 Purchase of Equipment, Materials and Supplies - Toe Drain 0.92963 0.88002
137
Purchase of Equipment, Materials and Supplies - Tractor or other Industrial Machinery 0.93839 0.88003
138 Purchase of Equipment, Materials and Supplies - Transformer 0.94223 0.88004
139 Purchase of Equipment, Materials and Supplies - Video Equipment 0.94336 0.88002
140
Purchase and Installation of Non-Technical Equipment and Structures - Construction and Maintenance Machinery and Equipment 0.94335 0.88108

The Louis Berger Group, Inc. 63 December 29, 2010
Appendix E: Generic Multipliers by Industry for Each Type of Region The following table provides the generic multipliers for four different types of regions: large scale, metropolitan, micropolitan, and rural. Each multiplier is provided for each $1 million in direct output.
Generic Multipliers_forManual.xlsx

The Louis Berger Group, Inc. 64 December 29, 2010
Appendix F: USACE Program Codes Mapped to Local and State/Multi State Impact Area The following table provides the USACE program codes and names and the mapping to the local/regional and state/multistate impact areas and model numbers.
ProgCode&ModelName_ForManual.xlsx

The Louis Berger Group, Inc. 65 December 29, 2010
Appendix G: Local/Regional Impact Areas and Included Counties The following table provides counties included in each of the local/regional impact areas.
Model Counties Included_For Manual.xlsx

The Louis Berger Group, Inc. 66 December 29, 2010
Appendix H: Multi-State Impact Areas and Included States The following table provides the states included in the multi-state impact areas.
States Impact Areas_For Manual.xlsx

The Louis Berger Group, Inc. 67 December 29, 2010
Appendix I: Civil Works Budget Spending Profiles
Work Activity
ID
Business Line and/or Appropriation Account – Title of Profile
IMPLAN Sector Spending Category Name Percentage
1001 Environment for CW Budget
171 Metals and Steel Materials 1.4
19 Support Activities for Agriculture and Forestry 3.4
26 Aggregate Materials 0.8
36 Construction of Other New Nonresidential Structures 20.7
39 Repair and Maintenance Construction Activities 5.7
365 Industrial and Machinery Equipment Rental and Leasing 2.1
369 Architectural, Engineering, an Related Services 0.7
371 IT Product Development 0.2
375 Planning, Environmental, Engineering and Design Studies and Services
13.1
376 Scientific Research and Development Services 0.2
386 USACE Overhead 8.1 390 Remediation Services 22 393 Other Education Services 0.3 439 USACE Wages and Benefits 16.4
5001 Private Sector Labor or Staff Augmentation 4.9
1002
FRM for CW Budget
171 Metals and Steel Materials 1.2 26 Aggregate Materials 3.4
36 Construction of Other New Nonresidential Structures 9.1
365 Industrial and Machinery Equipment Rental and Leasing 11.5
375 Planning, Environmental, Engineering and Design Studies and Services
3.6
39 Repair and Maintenance Construction Activities 24.2
5001 Private Sector Labor or Staff Augmentation 12.8
439 USACE Wages and Benefits 20.3 386 USACE Overhead 10
369 Architectural, Engineering, an Related Services 3.9
Hydropower for CW 222 Turbine equipment and parts 2.4

The Louis Berger Group, Inc. 68 December 29, 2010
1003
Budget 266 Power, Distribution, and Specialty Transformer Equipment 2.4
268 Switchgear and Switchboard Apparatus Equipment 3.3
36 Construction of Other New Nonresidential Structures 0.7
369 Architectural, Engineering, an Related Services 0.3
375 Planning, Environmental, Engineering and Design Studies and Services
3.1
39 Repair and Maintenance Construction Activities 10.8
5001 Private Sector Labor or Staff Augmentation 8.2
439 USACE Wages and Benefits 39.5 386 USACE Overhead 19.4 171 Metals and Steel Materials 3
205 Construction Machinery Manufacturing 2.6
417 Industrial Machinery and Equipment Repair and Maintenance
4.3
1004 Navigation for CW Budget
115 Dredging Fuel 6.1 171 Metals and Steel Materials 4.3
198 Textiles, Lubricants, and Metal Valves and Parts (Dredging) 2.1
268 Switchgear and Switchboard Apparatus Equipment 0.3
290 Hopper Equipment and Repairs 1.9
365 Industrial and Machinery Equipment Rental and Leasing 7.3
5001 Private Sector Labor or Staff Augmentation 15.3
69 All Other Food Manufacturing 1.9
375 Planning, Environmental, Engineering and Design Studies and Services
4.6
201 Pipeline Dredge Equipment and Repairs 5.2
26 Aggregate Materials 2.9
36 Construction of Other New Nonresidential Structures 13.6
39 Repair and Maintenance Construction Activities 4.1
417 Industrial Machinery and Equipment Repair and Maintenance
10.5

The Louis Berger Group, Inc. 69 December 29, 2010
439 USACE Wages and Benefits 13.3 386 USACE Overhead 6.6
1005 Recreation for CW Budget
36 Construction of Other New Nonresidential Structures 17.6
39 Repair and Maintenance Construction Activities 36.7
5001 Private Sector Labor or Staff Augmentation 3.9
439 USACE Wages and Benefits 28 386 USACE Overhead 13.8
1006 Water Supply for CW Budget
375 Planning, Environmental, Engineering and Design Studies and Services
5.1
439 USACE Wages and Benefits 63.6 386 USACE Overhead 31.3
1008 Regulatory for CWB 439 USACE Wages and Benefits 67 386 USACE Overhead 33
1009 Expenses for CWB 439 USACE Wages and Benefits 67 386 USACE Overhead 33
1010 Emergency Management for CWB
439 USACE Wages and Benefits 31 39 Repair and Maintenance
Construction Activities 30
36 Erosion Control and Earthwork Activities 20
5001 Private Sector Labor or Staff Augmentation 3
386 USACE Overhead 16
1011 Environment Construction for CW Budget
171 Metals and Steel Materials 2.9 19 Support Activities for Agriculture
and Forestry 4.6 26 Aggregate Materials 1.6 36 Construction of Other New
Nonresidential Structures 39.7
365 Industrial and Machinery Equipment Rental and Leasing 4.3
375 Planning, Environmental, Engineering and Design Studies and Services
10
39 Repair and Maintenance Construction Activities 8.4
5001 Private Sector Labor or Staff Augmentation 9.7
386 USACE Overhead 6.2 439 USACE Wages and Benefits 12.6
1012 FRM Construction for CW Budget
171 Metals and Steel Materials 2.3 26 Aggregate Materials 5.8 36 Construction of Other New
Nonresidential Structures 11.8

The Louis Berger Group, Inc. 70 December 29, 2010
365 Industrial and Machinery Equipment Rental and Leasing 20.1
375 Planning, Environmental, Engineering and Design Studies and Services
1.5
39 Repair and Maintenance Construction Activities 22.5
5001 Private Sector Labor or Staff Augmentation 20.3
439 USACE Wages and Benefits 10.5 386 USACE Overhead 5.2
1013 Hydropower Construction for CW Budget
222 Turbine equipment and parts 9.2 266 Power, Distribution, and Specialty
Transformer Equipment 18.3
268 Switchgear and Switchboard Apparatus Equipment 12.1
36 Construction of Other New Nonresidential Structures 6.4
369 Architectural, Engineering, an Related Services 2
375 Planning, Environmental, Engineering and Design Studies and Services
7.8
39 Repair and Maintenance Construction Activities 16.8
5001 Private Sector Labor or Staff Augmentation 12.9
439 USACE Wages and Benefits 9.7 386 USACE Overhead 4.8
1014 Navigation Construction for CW Budget
115 Dredging Fuel 3.9 171 Metals and Steel Materials 9.5 198 Textiles, Lubricants, and Metal
Valves and Parts (Dredging) 1.5
201 Pipeline Dredge Equipment and Repairs 3.5
26 Aggregate Materials 4.6 268 Switchgear and Switchboard
Apparatus Equipment 1.1 290 Hopper Equipment and Repairs 2 36 Construction of Other New
Nonresidential Structures 16.6
365 Industrial and Machinery Equipment Rental and Leasing 11.6
375 Planning, Environmental, Engineering and Design Studies and Services
4.6
39 Repair and Maintenance Construction Activities 3.1
417 Industrial Machinery and Equipment Repair and 7.5

The Louis Berger Group, Inc. 71 December 29, 2010
Maintenance 5001 Private Sector Labor or Staff
Augmentation 18.4 69 Dredging Food and Beverages 1.3 439 USACE Wages and Benefits 7.2 386 USACE Overhead 3.6
1015
Environment-FUSRAP for CW Budget
375 Planning, Environmental, Engineering and Design Studies and Services
4.1
390 Remediation Services 87.2 439 USACE Wages and Benefits 5.8 386 USACE Overhead 2.9
1016
Environment Investigations for CW Budget
371 IT Product Development 2.7 375 Environmental and Other
Technical Consulting Services 44.6
5001 Private Sector Labor or Staff Augmentation 2
439 USACE Wages and Benefits 34 386 USACE Overhead 16.7
1017
FRM Investigations for CW Budget
375 Planning, Environmental, Engineering and Design Studies and Services
44.6
439 USACE Wages and Benefits 37.1 386 USACE Overhead 18.3
1018 Navigation Investigations for CW Budget
375 Planning, Environmental, Engineering and Design Studies and Services
43.6
439 USACE Wages and Benefits 37.8 386 USACE Overhead 18.6
1019
Environment Operations and Maintenance for CW Budget
19 Support Activities for Agriculture and Forestry 6.1
36 Construction of Other New Nonresidential Structures 6.7
369 Architectural, Engineering, an Related Services 3.8
375 Planning, Environmental, Engineering and Design Studies and Services
21.5
376 Scientific Research and Development Services 1.1
39 Repair and Maintenance Construction Activities 8.2
390 Remediation Services 1 393 Other Education Services 1.8 439 USACE Wages and Benefits 33.4 386 USACE Overhead 16.4
1020
FRM Operations and Maintenance for CW Budget
26 Aggregate Materials 1.1 36 Construction of Other New
Nonresidential Structures 6.6

The Louis Berger Group, Inc. 72 December 29, 2010
365 Industrial and Machinery Equipment Rental and Leasing 2.4
369 Architectural, Engineering, an Related Services 8.6
375 Planning, Environmental, Engineering and Design Studies and Services
3.3
39 Repair and Maintenance Construction Activities 27.7
5001 Private Sector Labor or Staff Augmentation 5
439 USACE Wages and Benefits 30.4 386 USACE Overhead 14.9
1021 Hydropower Operations and Maintenance for CW Budget
171 Metals and Steel Materials 3.4 205 Construction Machinery
Manufacturing 3 222 Turbine Equipment and Parts 1.4 268 Switchgear and Switchboard
Apparatus Equipment 2
375 Planning, Environmental, Engineering and Design Studies and Services
2.4
39 Repair and Maintenance Construction Activities 9.9
417 Industrial Machinery and Equipment Repair and Maintenance
4.9
5001 Private Sector Labor or Staff Augmentation 7.5
439 USACE Wages and Benefits 43.9 386 USACE Overhead 21.6
1022
Navigation Operations and Maintenance for CW Budget
115 Petroleum Refining 7 171 Metals and Steel Materials 2.4 198 Textiles, Lubricants, and Metal
Valves and Parts (Dredging) 2.4
201 Pipeline Dredge Equipment and Repairs 5.9
26 Aggregate Materials 2.3 290 Hopper Equipment and Repairs 1.9 36 Construction of Other New
Nonresidential Structures 12.7
365 Industrial and Machinery Equipment Rental and Leasing 5.8
375 Planning, Environmental, Engineering and Design Studies and Services
4
39 Repair and Maintenance Construction Activities 4.6
417 Industrial Machinery and Equipment Repair and 11.8

The Louis Berger Group, Inc. 73 December 29, 2010
Maintenance 5001 Private Sector Labor or Staff
Augmentation 14.3 69 All Other Food Manufacturing 2.1 439 USACE Wages and Benefits 15.3 386 USACE Overhead 7.5
1023 Recreation Operations and Maintenance for CW Budget
36 Construction of Other New Nonresidential Structures 17.6
39 Repair and Maintenance Construction Activities 36.7
5001 Private Sector Labor or Staff Augmentation 3.9
439 USACE Wages and Benefits 28 386 USACE Overhead 13.8
1024 Water Supply Operations and Management for CW Budget
375 Planning, Environmental, Engineering and Design Studies and Services
5.1
439 USACE Wages and Benefits 63.6 386 USACE Overhead 31.3
1025
Hydropower Investigations for CW Budget
439 USACE Wages and Benefits 59 386 USACE Overhead 29
375 Planning, Environmental, Engineering and Design Studies and Services
12
1026 Water Supply Construction for CW Budget
439 USACE Wages and Benefits 6.7 386 USACE Overhead 3.3 36 Construction of Other New
Nonresidential Structures 90
1027
Water Supply Investigations for CW Budget
439 USACE Wages and Benefits 17.4 386 USACE Overhead 8.6
375 Planning, Environmental, Engineering and Design Studies and Services
74
1028
Recreation Construction for CW Budget
439 USACE Wages and Benefits 26.8 386 USACE Overhead 13.2 36 Construction of Other New
Nonresidential Structures 6
1029 Recreation Investigations for CW Budget
439 USACE Wages and Benefits 12.1 386 USACE Overhead 5.9
375 Planning, Environmental, Engineering and Design Studies and Services
82
Related Documents