Project Start: 01/03/2018 | Duration: 36 Months 1 Deliverable D4.1 METHODOLOGY AND KEY PEFORMANCE INDICATORS FOR THE MONITORING AND ASSESSMENT OF THE LIGHTHOUSE PARKS Organisation: RINA-C Main authors: Carlo Strazza, Silvia Vela (RINA-C) V2, 30/11/2019 Envisioning and Testing New Models of Sustainable Energy Cooperation and Services in Industrial Parks This project has received funding from the European Union’s Horizon 2020 research and innovation program under grant agreement No 785134.

Welcome message from author
This document is posted to help you gain knowledge. Please leave a comment to let me know what you think about it! Share it to your friends and learn new things together.
Transcript

Project Start: 01/03/2018 | Duration: 36 Months 1
Deliverable D4.1
METHODOLOGY AND KEY PEFORMANCE
INDICATORS FOR THE MONITORING AND
ASSESSMENT OF THE LIGHTHOUSE PARKS
Organisation: RINA-C
Main authors: Carlo Strazza, Silvia Vela (RINA-C)
V2, 30/11/2019
Envisioning and Testing New Models of Sustainable
Energy Cooperation and Services in Industrial Parks
This project has received funding from the European Union’s Horizon 2020 research and
innovation program under grant agreement No 785134.
Project Start: 01/03/2018 | Duration: 36 Months 2
DELIVERABLE 4.1 – VERSION 2
WORK PACKAGE N° 4
Quality procedure
Date Version Reviewers Comments
5/10/2018 1 Velte D. (TECNALIA) Comments on KPIs
22/10/2018 1 Kollmann A. (EI-JKU) General comments
23/10/2018 1 Zaldua Urretabizkaia M. (TECNALIA) General comments
24/10/2018 1
Annunziata E. (SSSA) Comments on Financial and Economic KPIs, general comments
25/10/2018 1 Strazza C., Peccianti F. (RINA-C) General comments
26/10/2018 1
Mainar L. (CIRCE) General comments and potential connections with IAT
30/11/2019 2 Periodic Reporting General comments
Annex
Number Name Content Format
I Overview of KPIs Description of impact category, unit of measure, data needs, main data sources and monitoring protocol for each KPI
Word
II Guideline for application Schematic representation of the methodology and its steps
Word
III Cross-matching between solutions and KPIs
Indications about the relevance of the KPIs for each solution outlined in D1.1
Word
Acknowledgements
This report is part of the deliverables from the project "S-PARCS" which has received funding
from the European Union’s Horizon 2020 research and innovation program under grant
agreement No 785134.
More information on the project can be found at http://www.sparcs-h2020.eu/
Nature of the deliverable
R Document, report (excluding the periodic and final reports) x
DEM Demonstrator, pilot, prototype, plan designs
DEC Websites, patents filing, press & media actions, videos, etc.
OTHER Software, technical diagram, etc.
Dissemination Level
PU Public, fully open, e.g. web x
CO Confidential, restricted under conditions set out in Model Grant Agreement
CI Classified, information as referred to in Commission Decision 2001/844/EC

Project Start: 01/03/2018 | Duration: 36 Months 3
Disclaimer
The opinions expressed in this document reflect only the authors’ view and reflect in no way
the European Commission’s opinions. The European Commission is not responsible for any
use that may be made of the information it contains.
Executive summary
Performance measurement is one of the first steps in process improvement, and involves the
choice, designation and use of specific performance indicators as metrics for the effectiveness
and success of methods being examined in the most various contexts. Organizations typically
analyse performance information at a particular point in time and can track their progress and
external indicators in subsequent periods. The evaluation of performance of industrial parks,
specifically, is an important issue. Indeed, as industrial organization, the industrial park
develops interactions with resources and business environments.
Within this conceptual context, the aim of this deliverable is to develop a methodological
framework that allows the assessment and monitoring of the performance of proposed
solutions and instruments in the Lighthouse Parks of S-PARCS project.
The methodology is outlined considering the following key principles:
► easily available and simple input data – to facilitate the implementation of the full
methodology for industrial parks;
► synthetic and immediate representation of results – to condense information and
allow sound decision-making;
► multi-criteria approach – to consider performance from various perspectives;
► focus on industrial parks’ intrinsic features – to include peculiar features of
industrial parks that involve multiple actors and synergies;
► quantitative method – to facilitate direct and objective comparison between solutions.
Furthermore, the methodology is structured to be flexible, in terms of both solutions that can
be assessed and KPIs that can be used for the assessment. It is also highlighted that the
methodology is intended to provide a quantitative output. Nevertheless, some of the aspects
that influence the performance of a solution are qualitative. When converting qualitative values
into quantitative ones through scales, a certain degree of arbitrariness is necessarily
introduced.
In parallel, quantitative and qualitative KPIs are selected according to relevance,
interpretability, timeliness, reliability, validity and materiality criteria and cover
organizational, financial and economic, legal and regulatory, social, environmental and
technical impact categories. For each KPI, clear definition, scale, unit of measure, instruments
to measure, monitoring protocol and additional details are given.
Afterwards, calculation rules are developed. Specifically, different calculations rules are
associated with park level KPIs – related to the overall performance of the park – and to
solution-specific KPIs – related to the features of a specific solution installed within a selected
park. Rules are differentiated also to take into account that some KPIs are qualitative, while
Project Start: 01/03/2018 | Duration: 36 Months 4
others are quantitative. Thus, according to the type of KPI, a certain specific calculation rule
shall be used. Following the calculation rules provided, the assessment of performance shall
be repeated for each impact category.
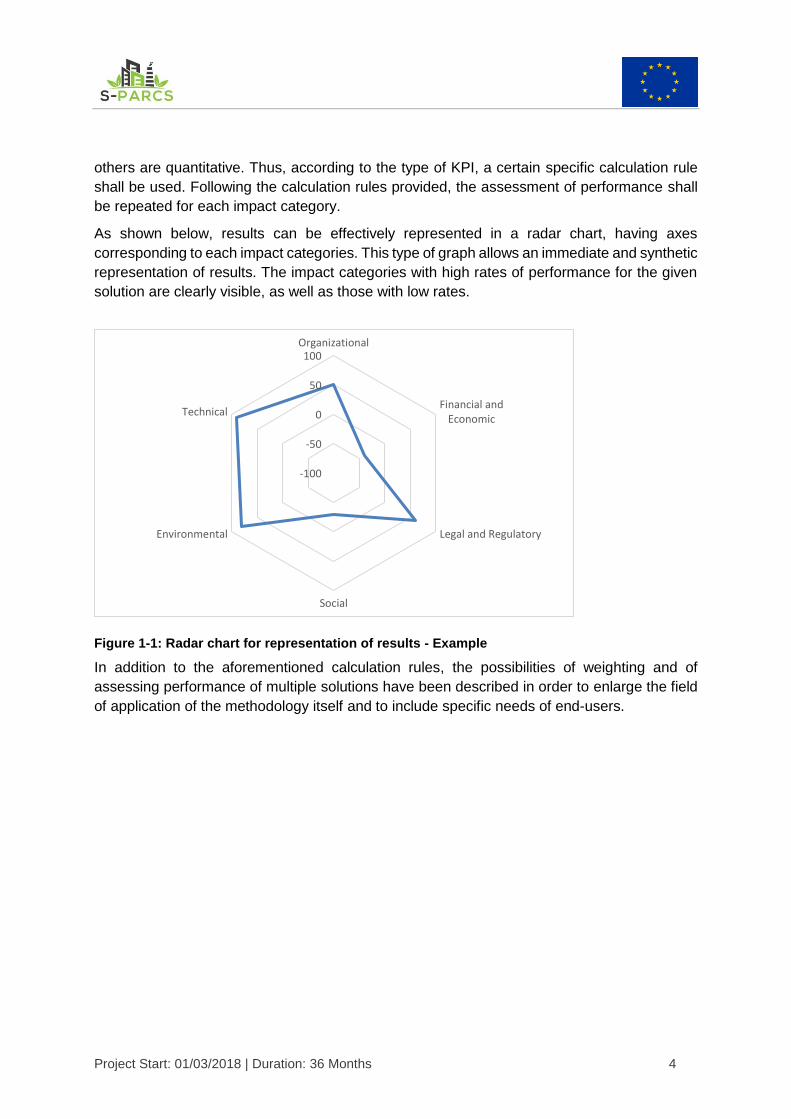
As shown below, results can be effectively represented in a radar chart, having axes
corresponding to each impact categories. This type of graph allows an immediate and synthetic
representation of results. The impact categories with high rates of performance for the given
solution are clearly visible, as well as those with low rates.
Figure 1-1: Radar chart for representation of results - Example
In addition to the aforementioned calculation rules, the possibilities of weighting and of
assessing performance of multiple solutions have been described in order to enlarge the field
of application of the methodology itself and to include specific needs of end-users.
-100
-50
0
50
100Organizational
Financial andEconomic
Legal and Regulatory
Social
Environmental
Technical

Project Start: 01/03/2018 | Duration: 36 Months 5
Table of contents
Acknowledgements ............................................................................................................... 2
Executive summary ............................................................................................................... 3
Table of contents ................................................................................................................... 5
List of Figures ........................................................................................................................ 6
List of Tables ......................................................................................................................... 6
1 INTRODUCTION ............................................................................................................ 7
1.1 STATE OF THE ART IN PERFORMANCE ASSESSMENT .................................... 7
1.2 KEY MESSAGES .................................................................................................... 9
2 METHODOLOGY ..........................................................................................................10
2.1 MAIN PRINCIPLES ................................................................................................10
2.2 DEFINITION OF KEY PERFORMANCE INDICATORS ..........................................12
2.2.1 Organizational KPIs.........................................................................................14
2.2.2 Financial and Economic KPIs ..........................................................................15
2.2.3 Legal and Regulatory KPIs ..............................................................................19
2.2.4 Social KPIs ......................................................................................................20
2.2.5 Environmental KPIs .........................................................................................24
2.2.6 Technical KPIs ................................................................................................30
2.3 CALCULATION RULES .........................................................................................32
2.3.1 Overview .........................................................................................................32
2.3.2 Rules for park level quantitative KPIs ..............................................................35
2.3.3 Rules for solution-specific KPIs .......................................................................36
2.3.3.1 Rules for solution-specific KPIs – Qualitative KPIs ...................................37
2.3.3.2 Rules for solution-specific KPIs – Quantitative KPIs .................................38
2.3.4 Overall performance assessment ....................................................................40
2.3.5 Results representation and interpretation ........................................................40
2.3.6 Minimum requirements for application .............................................................42
2.3.7 Variants ...........................................................................................................44
2.3.7.1 Weighting .................................................................................................44
2.3.7.2 Multiple solutions ......................................................................................45
3 CONCLUSIONS ............................................................................................................47
4 REFERENCES ..............................................................................................................48
5 ANNEX I – OVERVIEW OF KPIs ..................................................................................49
6 ANNEX II – GUIDELINE FOR APPLICATION ...............................................................54
7 ANNEX III – CROSS-MATCHING BETWEEN SOLUTIONS AND KPIs .........................55

Project Start: 01/03/2018 | Duration: 36 Months 6
List of Figures
Figure 1-1: Radar chart for representation of results - Example ............................................. 4
Figure 2-1: Radar chart for representation of results - Example ............................................41
Figure 2-2: Radar chart for comparison of two solutions – Example .....................................42
List of Tables
Table 2-1: KPIs’ class and type ............................................................................................33
Table 2-2: p1 calculation .......................................................................................................36
Table 2-3: Conversion table for Likert scales ........................................................................37
Table 2-4: Conversion scales for quantitative solution-specific KPIs .....................................38
Table 2-5: Minimum n° of KPIs for each impact category .....................................................43
Table 2-6: Core KPIs and categories exempted ...................................................................43

Project Start: 01/03/2018 | Duration: 36 Months 7
1 INTRODUCTION
The aim of this deliverable is to develop a methodological framework that allows the
assessment of the performance of the proposed solutions and instruments in the Lighthouse
Parks.
The methodology proposed is tailored to evaluate the effects related to the implementation and
functioning of one or more solutions and to obtain generalized results that can support a
broader community of industrial parks for replication in further contexts. The approach
identified to develop the methodology provides common monitoring for the assessment of the
performance the solutions and instruments.
The methodology is built upon a selection of Key Performance Indicators (KPIs), which capture
a wide variety of potential impacts of the solutions on the parks and allow a comprehensive
assessment of performance. With this perspective, KPIs are clustered into six macro-
categories (organizational, financial and economic, legal and regulatory, social, environmental,
technical). Common conventions for the calculation of KPIs are defined, along with the set of
data necessary to perform the assessment. Furthermore, the methodology relies on
measurements and monitoring protocols developed specifically for each KPI.
The output of the methodology consists in a quantitative evaluation of the performance of a
solution within a specific industrial park. The output can support parks during either decision
making process – when evaluating the implementation of different solutions – or after the
implementation of a solution – when monitoring its effects.
It is highlighted that the methodology is intentionally kept wide and detailed, in order to cover
an exhaustive range of solutions and impacts. Nevertheless, criteria and guidance to apply the
methodology at a simple level are introduced, in order to limit the burden for end-users and to
assess only the most significant KPIs for the solutions actually implemented.
1.1 STATE OF THE ART IN PERFORMANCE ASSESSMENT
This section includes a review of already existing methodology for performance evaluation. It
must be pointed out that not all the methodologies here mentioned satisfy the needs of the
methodology to be developed within the S-PARCS project, nevertheless they are useful to
extract general considerations deriving from the state of the art in the field and they represent
a starting point for the development of a new methodology specifically tailored to the needs of
the project.
The review covers initially performance evaluation in general, and then focuses on
performance evaluation specifically for industrial parks.
The assessment of performance through the definition of KPIs is a consolidated matter in
industrial practice and at organization management level. Indeed, performance measurement
is one of the first steps in process improvement, and involves the choice, designation and use
of specific performance indicators to put a number on the effectiveness and success of
methods being examined in the most various contexts. Organizations typically analyse
performance information at a particular point in time and can track their progress and external
indicators in subsequent periods.

Project Start: 01/03/2018 | Duration: 36 Months 8
The Global Reporting Initiative (GRI) developed a credible framework for performance
evaluation and reporting, focused on sustainability-related factors, that can be used by
organizations of any sector, size or location. The GRI Reporting Framework [1] is thus intended
to report on an organization’s economic, environmental, and social performance. The GRI
Reporting Framework contains general and sector-specific content that has been agreed by a
wide range of stakeholders around the world to be generally applicable for reporting an
organization’s sustainability performance. The methodology for assessment is based on the
definition of several KPIs, both qualitative and quantitative. For each indicator, a protocol
containing definition, compilation guidance and any other additional information is given, in
order to ensure consistency in the interpretation of the indicators. Within this Framework, the
level of aggregation of the KPIs has to be established by the organization performing the
evaluation, depending on the desired result and balancing the needs of avoiding reporting of
meaningless information and avoid loss of significant amount of meaning. Furthermore, the
framework accurately describes a selection of reporting principles to help achieve the
appropriate level of quality for the reported information.
In addition, various frameworks and schemes have been recently developed to evaluate
environmental performance at various scales [2], [3]. Among them, the Eco-Management and
Audit Scheme (EMAS) has acquired great relevance within the European area. EMAS is a
premium management instrument developed by the European Commission for companies and
other organisations to evaluate, report, and improve their environmental performance1. Criteria
and standard for the implementation of EMAS are established by a regulation of the European
Commission published in 2009 [4] and partially amended in 2017 [5]. While the main body of
the regulation focuses on key definitions, necessary steps for the implementation of the
scheme within the company, audit programmes, involved parties and bodies, connection with
similar activities within the EU and reporting activities, the Annexes focus on specific
environmental aspects related to the EMAS.
Specifically, Annex I includes a description of direct and indirect environmental aspects that
must be considered by the organizations during their activity; Annex II includes requirements
that organizations implementing EMAS shall fulfil with respect to environmental awareness,
knowledge of the management system, roles identification, planning and monitoring activities
and auditing, among other more specific issues; Annex III describes the internal audit phase
in detail, stating its objectives, its frequency, and activities; Annex IV provides guidelines for
environmental reporting, including a list of core indicators of environmental performance
evaluation. The following Annexes cover aspects outside the scope of this work.
The evaluation of performance of industrial parks, specifically, is an important issue. Indeed,
as industrial organization, the industrial park develops interactions with resources and
business environments. From the perspective of business management, it can be divided into
the processes of promotion, facilitating production, and generating tax for government.
Measuring the efficiencies of these divisions has become critical. Potential can be located
effectively in the improvement of overall performance, enabling management in the areas from
strategic planning to organizational learning, and eventually improving the competitive
advantage of the organization [6].
1 http://ec.europa.eu/environment/emas/index_en.htm

Project Start: 01/03/2018 | Duration: 36 Months 9
In [7], a benchmarking study is carried out in order to evaluate the operational performance of
industrial park infrastructures in Germany to find first indications for cost saving potentials with
respect to maintenance of buildings, communication infrastructures and traffic infrastructures
within the park. An overview of performance measurement and the relationship between
benchmarking as well as the underlying metrics is given. KPIs are defined through discussion
among involved actors and then calculated after a data-gathering phase. In this study, only
quantitative indicators are included.
In [8], the economic and environmental performance of eco-industrial parks is assessed, based
on the selection of ten metrics including resource consumption, economic development, and
waste emissions. The assessment consists in comparing the value of different metrics between
two different years. The method applied for the evaluation of performance consists in a
simplified quasi-grey box model that addresses both economic and environmental
performance. The inputs for the method are land, employees, fresh water and energy and are
associated directly with the park entity as a whole. The outputs are subdivided into economic
and environmental outputs, represented by selection of quantitative metrics.
In [9], KPIs for science/technological parks are studied in order to explore the implementation
of a performance management practice in an Indonesian park. The findings of the study show
that there are some standard KPIs that are commonly and widely used for the assessment of
such type of parks and these are selected as core KPIs for the performance assessment.
Within the study, all the KPIs presented are quantitative and are all directly defined at park
level.
In [10], the authors performed a comprehensive review aimed at the selection of available
indicators for economic, environmental and social aspects of eco-industrial parks. The KPIs
are then scanned and sorted in order to define a subset of indicators according to criteria of
understanding, pragmatism, relevance and partial representation of sustainability.
1.2 KEY MESSAGES
► This document describes a methodology for the quantitative evaluation of
performance of solutions in the Lighthouse Industrial Parks. The performance is
intended from multiple perspectives, namely organizational, financial and economic,
legal and regulatory, social, environmental and technical.
► In order to allow such a broad assessment on one hand, and to make the
implementation of the methodology as easiest as possible, a balance has been sought.
An extensive list of Key Performance Indicators is proposed, but – according to the
type of solution implemented - only some of them may be identified as most relevant
for the evaluation.
► The methodology is structured to be flexible, in order to remain valid even in case of
future modifications. Specifically, it is flexible because performance can be assessed
also for solutions that are not included in D1.1 [11] – given that they can be classified
into the categories of D1.1 – and because additional KPIs can be introduced – given
that they are selected according to the described criteria and that they can be grouped
into the KPI’s categories introduced in this document.

Project Start: 01/03/2018 | Duration: 36 Months 10
► The methodology is intended to provide a quantitative output. Nevertheless, some of
the aspects that influence the performance of a solution are qualitative. When
converting qualitative values into quantitative ones through scales, a certain degree of
arbitrariness is necessarily introduced.
► Annexes are thought to summarize the main contents of this document and to support
a straightforward application of the performance assessment methodology.
► Considering that at this stage of S-PARCS project the Lighthouse Industrial Parks have
not clearly decided which solution(s) they will investigate/implement, in order to
respond to future specific needs that may arise at the time of implementation, further
refinements may be integrated to this deliverable.
► Deliverable 4.2 describes a comprehensive data collection framework for the KPIs
assessed in D4.1. It ensures that necessary data to feed the methodology are
calculated coherently and homogeneously by all the end-users. D4.2 shall thus be
considered as the natural prosecution of D4.1 and should be referred to for obtaining
more detailed information about KPIs calculation.
► The generalist nature of the methodology developed in task 4.1 well fit the objective of
“Initial Assessment Tool (IAT)” to be developed in S-PARCS, which will be able to
serve industrial park managers and companies within different countries. Moreover, a
preliminary list of necessary input data to deploy this methodology is presented in this
document and summarised in Annex I “Overview of KPIs”.
2 METHODOLOGY
This section focuses on the development of the methodology for the monitoring and
assessment of the parks, objective of this deliverable. Firstly, the main principles followed to
structure the methodology are described, and they will function as guidelines through the rest
of the section. Afterwards, Key Performance Indicators (KPIs) are introduced and they express
the core data needed within the methodology. KPIs are subdivided according to the sectors
they address, to their scale and to their type (i.e. qualitative/quantitative). Calculation rules are
then defined on the basis of the classification of KPIs and diagrams for results representation
are illustrated. To conclude, minimum requirements for the application of the methodology and
variants to consider weights in the calculation and the assessment of performance of multiple
solutions are explained.
2.1 MAIN PRINCIPLES
This section explores the principles that the methodology shall satisfy in order to be consistent
with the overall aim of the project and of the task, useful and easily implementable by its users.
In detail, the following principles are identified:
1. Easily available and simple input data. A defined and limited set of input data allows
the majority of industrial parks to have all the necessary information for the full
implementation of the methodology. On one hand, basing the methodology on complex
inputs would lead to a difficult or only partial implementation of the methodology. On
Project Start: 01/03/2018 | Duration: 36 Months 11
the other hand, input data should be enough to provide a complete picture of the status
of the park;
2. Synthetic and immediate representation of results. An industrial park is a complex
and articulated reality, which includes a broad range of aspects and for this reason it is
essential to condense aggregate results in order to allow sound decision making;
3. Multi-criteria approach. The performance of an industrial park can be assessed by
several perspectives and many factors, often complementary, contribute to the status
of the industrial park. In order to provide a complete and non-misleading assessment,
the methodology must cover different spheres, such as the organisational, the financial,
the legal, the social, the technical and the environmental sphere;
4. Focus on industrial parks’ intrinsic features. Due to the peculiar features of
industrial parks, which are composed of more entities and managed by multiple actors,
all the synergies and components of a park must be precisely addressed by the
methodology;
5. Quantitative method. The methodology shall assess the performance of industrial
parks quantitatively, to allow direct and objective comparison of the results obtained
from its application. Nevertheless, also qualitative aspects may be assessed, given that
they are properly converted in quantitative form.
In addition, the scheme chosen for the entire methodology is flexible, in order to allow
adjustments depending on data availability and specific needs.
As previously mentioned, the methodology identifies the baseline situation of the park and also
the effects of the solutions selected or implemented. In order to guarantee that the
methodology is able to assess the main effects of the solutions and to account for their benefits
and impacts, it is crucial to have a general idea about possible solutions of interest for the
industrial parks. For this reason, the methodology is developed taking into account the
preliminary list of solutions proposed in D1.1 [11]. In detail, the S-PARCS solution inventory
includes energy cooperation/services solutions qualified for mutualized procurement and
utilisation. Within the inventory, solutions are clustered into five categories, namely new
physical installations, information and communication technologies, logistics and mobility,
managerial actions and contractual instruments. Most of the solutions addresses issues
directly related to energy efficiency opportunities.
Finally, as a general approach, whenever possible, direct KPIs (i.e.: the KPIs directly available
as raw data) are preferred to indirect KPIs (i.e.: KPIs that have to be calculated through
collection of multiple raw data, from different sources). Even though this kind of KPIs can be
effective in capturing the performance of a solution, their evaluation can turn quite resourceful
and it can lead to a potential increase of inconsistencies in case of comparison of results
generated through different assumptions for system boundaries (both in time and space) or
other restraints for KPIs calculation. This approach is also consistent with the need of
evaluating the performance from the perspective of different categories, as it makes more
linear the process of associating KPIs to different categories.
Project Start: 01/03/2018 | Duration: 36 Months 12
2.2 DEFINITION OF KEY PERFORMANCE INDICATORS
The methodology for the assessment of the performance of the Lighthouse Industrial Parks is
based on the definition of a set of Key Performance Indicators (KPIs).
This approach enables to enclose and summarize data and information available to the park
manager or the single plants into a restricted number of key indicators.
According to [12], appropriate KPIs shall present the following features:
1. Relevance. Include data that are essential to provide a basis for understanding the
accomplishments of goals and objectives of the park;
2. Interpretability. Communicate in a readily understandable manner that is concise, yet
comprehensive. Indeed, information should be easily accessible and understandable
without unreasonable effort;
3. Timeliness. Report in a timely manner so that the information will be available to users
before it loses its value in making decisions;
4. Reliability. Report consistency from period to period;
5. Validity. The measure should determine the intended quality indicator (performance
indicator in this case).
It is reasonable that the concepts underlying the characteristics of the KPIs recall the
requirements that the methodology shall satisfy, as they represent the core of the methodology
itself. For example, relevant KPIs are capable of capturing intrinsic features of industrial parks
and the effects of the solutions proposed within the project; interpretable KPIs are suitable to
collect accurate data as inputs.
Specifically, in order to identify the indicators that are relevant and appropriate to be evaluated
the materiality principle is introduced. Materiality is the criteria according to which an indicator
becomes sufficiently important for reflecting the asset’s (i.e. the industrial park) economic,
environmental and social impacts, or influencing the decision of stakeholders and thus
deserves to be accounted for in the performance assessment. Nevertheless, material metrics
do not necessarily have the same level of importance and the same priority within the
assessment. Thus, materials KPIs:
► reflect the organization’s significant economic, environmental, and social impacts. A
significant impact is interpreted as a matter of established concern according to the aim
of the methodology that uses the indicator. Within the context of this deliverable,
significant impacts cover a wide range of impacts: organizational, financial and
economic, legal, social, environmental and technical. In such way, the performance
of a solution is assessed in a comprehensive and holistic framework. It is highlighted
that the environmental impacts were not explicitly foreseen in the preliminary concepts
of the document, but general considerations from the project contents and focuses and
issues encountered during the literature review, led to the choice of considering
environmental impacts explicitly in the methodology.
► influence the assessments and decisions of stakeholders substantially.
Project Start: 01/03/2018 | Duration: 36 Months 13
Timeliness is a crucial aspect to produce results representative of the current status of the
industrial park. Indeed, the usefulness of information is closely tied to whether the timing of its
disclosure to stakeholders enables them to effectively integrate it into their decision-making.
According to the timeliness principle, a monitoring protocol is provided for each indicator.
The monitoring protocol suggests the parks timing and schedule to assess the KPIs, in order
to guarantee that main changes in the performance of the solution are captured on one hand
and to minimize the burden of monitoring activities on the other. The monitoring protocol is
developed also considering that some kind of data are commonly available to the industrial
parks and companies and their collection does not represent an excessive extra-effort for the
parks.
Monitoring can be associated with the evaluation of a KPI prior to the implementation of the
solution, which aims at providing either a forecast of the effects of the solution that can be
useful in the decision making process or a baseline status of the industrial park without the
solution that will be used as reference status. Furthermore, the monitoring protocol also
indicates optimal frequencies to repeat the assessment of the KPIs and thus the evaluation of
performance. With the purpose of limiting the burden of the application of the methodology for
the parks, frequencies are always proportional (i.e.: every year, every three years, every six
years). Besides, along the entire duration of the project, it is desirable that all the KPIs are
often monitored (ideally every year) in order to depict a more accurate measure of performance
that allows to evaluate also the results of the S-PARCS project.
Reliability guarantees that assessments performed at different times, typically at the time of
the baseline status and then after the implementation of the solution, results are coherent and
homogeneous.
The set of KPIs includes both qualitative and quantitative indicators. This assumption is
related to the variety of aspects that influence the performance of an industrial park, which are
not always directly quantifiable or measurable. Qualitative indicators are expressed by mean
of a qualitative scale and are then converted into quantitative terms to obtain a more objective
representation of results; quantitative indicators may be either directly measured or calculated
starting from available measures.
The Likert scale is used to measure qualitative KPIs. The Likert scale is commonly used to
understand and investigate the opinions opinions/perceptions of participants related with a
phenomenon of interest [14]. Scales can indicate, for example, agreement, value, relevance,
frequency, importance, quality or likelihood.
A key issue for the development of the methodology is the scale and level of aggregation of
the information included in the KPIs. Indeed, as noticed during the preliminary literature review,
there are no consolidated methods for aggregation of information even for performance
assessment tailored on industrial parks.
Within this methodology, KPIs are all defined at industrial park scale and cover the effects of
the solution on the entire park. Nevertheless, most of data for calculation of KPIs are retrievable
at company scale and are then summed up at park scale. In addition, when possible
information is aggregated in synthetic indicators in order to keep the methodology as simple
as possible and to facilitate its application.

Project Start: 01/03/2018 | Duration: 36 Months 14
In order to catch the effects of a specific solution on the smaller scale of the companies
involved, it is suggested to evaluate time by time, if a specific KPI could and/or should be
evaluated also only at company level.
For the selection of the specific KPIs, the following approach is followed:
► understanding and analysis of the solutions proposed in D1.1 mainly at category level;
► identification of main KPIs, according to information available in literature and
professional judgement based on the materiality principle;
► final set of KPIs.
The following sections list, for each impact category, the identified KPIs. For each KPI, clear
definition, scale, unit of measure, instruments to measure, monitoring protocol and additional
details are given. Details for each KPI are summarized in Annex I.
2.2.1 Organizational KPIs
O1. Staff involvement [%]: percentage of staff (n° of staff involved/n° of total staff) involved
in the implementation of the solution.
A high percentage of staff involvement is a proxy for employee engagement. When employees
are effectively engaged with the company, they tend to be more productive and to develop
passion to deliver beyond expectations [13].
Staff involvement can be calculated either at company level, for example through
questionnaires or studies promoted by human resources departments, and then aggregated
at park level or directly at park level if aggregated information is already available to the park
managers.
This indicator is evaluated depending on factors such as internal questionnaires, information
from similar experience in other parks/companies, information from the manufacturers of the
solution (when relevant), expert judgement.
Monitoring of this KPI should be carried out:
► before the implementation of the solution, in order to investigate its potential effects;
► annually, after the solution is implemented.
O2. Stakeholder involvement [%]: percentage of companies (n° of companies involved/total
n° of companies within the park) involved (actively participating in terms of economic or human
resources contribution) in the implementation or maintaining of the solution.
A high grade of involvement represents a consolidated commitment and is a basis for further
future development of the solution or of other solutions.
Data about stakeholder involvement are retrievable from the park managers, who are in
constant contact with all the companies of the park.
This KPI shall be evaluated prior to the installation of the solution in order to evaluate its
potential effects and – after the solution is implemented – a scheduled monitoring is not needed
Project Start: 01/03/2018 | Duration: 36 Months 15
if all the changes in the number of companies involved in the implementation and functioning
of the solution are registered time by time.
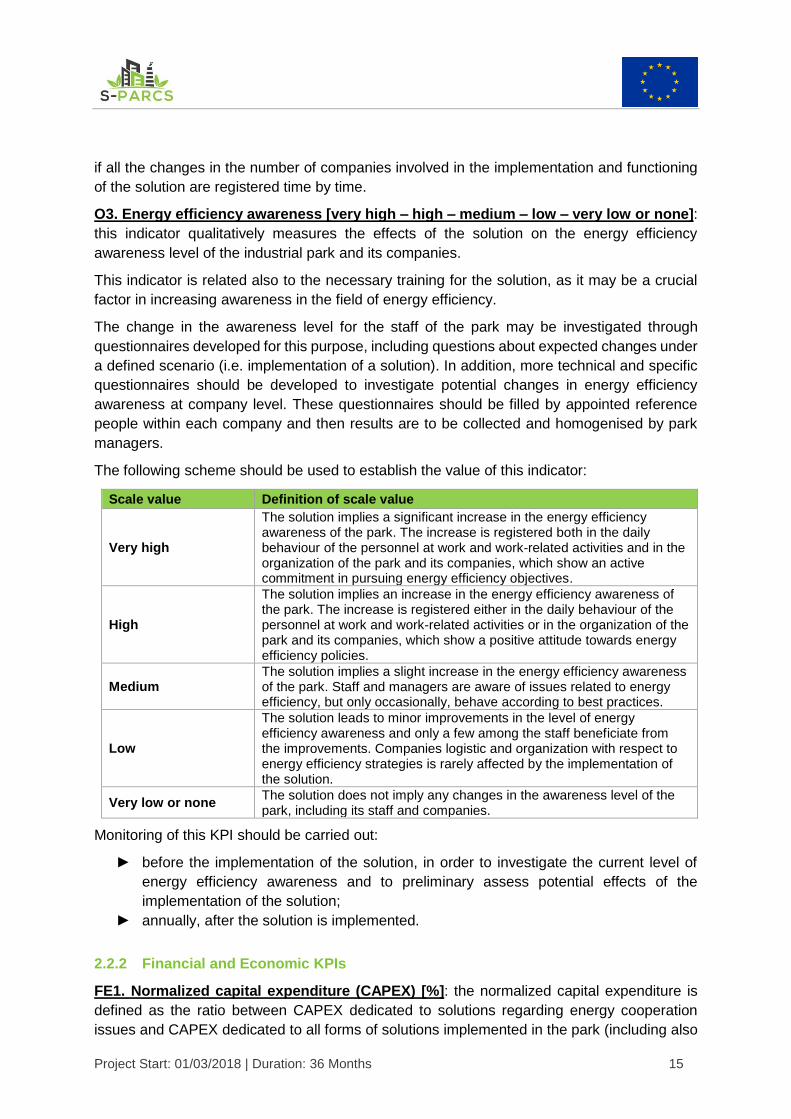
O3. Energy efficiency awareness [very high – high – medium – low – very low or none]:
this indicator qualitatively measures the effects of the solution on the energy efficiency
awareness level of the industrial park and its companies.
This indicator is related also to the necessary training for the solution, as it may be a crucial
factor in increasing awareness in the field of energy efficiency.
The change in the awareness level for the staff of the park may be investigated through
questionnaires developed for this purpose, including questions about expected changes under
a defined scenario (i.e. implementation of a solution). In addition, more technical and specific
questionnaires should be developed to investigate potential changes in energy efficiency
awareness at company level. These questionnaires should be filled by appointed reference
people within each company and then results are to be collected and homogenised by park
managers.
The following scheme should be used to establish the value of this indicator:
Scale value Definition of scale value
Very high
The solution implies a significant increase in the energy efficiency awareness of the park. The increase is registered both in the daily behaviour of the personnel at work and work-related activities and in the organization of the park and its companies, which show an active commitment in pursuing energy efficiency objectives.
High
The solution implies an increase in the energy efficiency awareness of the park. The increase is registered either in the daily behaviour of the personnel at work and work-related activities or in the organization of the park and its companies, which show a positive attitude towards energy efficiency policies.
Medium The solution implies a slight increase in the energy efficiency awareness of the park. Staff and managers are aware of issues related to energy efficiency, but only occasionally, behave according to best practices.
Low
The solution leads to minor improvements in the level of energy efficiency awareness and only a few among the staff beneficiate from the improvements. Companies logistic and organization with respect to energy efficiency strategies is rarely affected by the implementation of the solution.
Very low or none The solution does not imply any changes in the awareness level of the park, including its staff and companies.
Monitoring of this KPI should be carried out:
► before the implementation of the solution, in order to investigate the current level of
energy efficiency awareness and to preliminary assess potential effects of the
implementation of the solution;
► annually, after the solution is implemented.
2.2.2 Financial and Economic KPIs
FE1. Normalized capital expenditure (CAPEX) [%]: the normalized capital expenditure is
defined as the ratio between CAPEX dedicated to solutions regarding energy cooperation
issues and CAPEX dedicated to all forms of solutions implemented in the park (including also

Project Start: 01/03/2018 | Duration: 36 Months 16
energy cooperation solutions). These terms should be calculated considering CAPEX
expenditure foreseen/registered in the year of the evaluation.
CAPEX is an essential parameter for the evaluation of the economic feasibility of the solution.
If solutions for energy cooperation foreseen a minor economic effort, they will be more likely
engaged by companies and park managers.
CAPEX should be estimated directly on the basis of the solution selected, but it may also be
calculated by summing the contributions of the single companies for the implementation of the
solution.
Estimation of CAPEX shall be made considering all the costs related to the solution, including
materials, person hours, management and costs for auxiliary works and activities. CAPEX
estimations are commonly provided by manufactures and installers to the clients.
This KPI shall be evaluated prior to the installation of the solution and does not have to be
monitored in time.
FE2. Normalized net annual balance [%]: ratio between annual economic balance related to
the implementation of the solution for energy cooperation and annual economic balance
related to the all the solutions (including also energy cooperation solutions) implemented within
the park and its companies.
Specifically, the annual economic balance is calculated by subtracting annual costs to the sum
annual savings and annual direct income.
Annual costs correspond to OPEX costs, which are the annual expenses for the operation and
maintenance of a system or component. OPEX should be estimated directly on the basis of
the solution selected, but it may also be calculated by summing the contributions of the single
companies for the implementation of the solution. Estimation of OPEX costs shall be carried
out based on information given by the system’s manufacturer, by suppliers or consulting
companies and should possibly take into account site-specific features.
Annual savings correspond to the savings gained by the park from the implementation of the
solution. Savings can be calculated either directly at park level or by summing up savings
gained by the single companies and may be associated, for example, with avoided purchase
of energy from the grid, reduction of staff costs, increase in process efficiency, reduction of
fares for energy.
Annual direct income corresponds to the income generated by the implementation of the
solution. Indeed, a number of energy efficiency options allow the industrial parks to become
service providers to other companies in the park or even outside the park. This leads to the
opportunity of generating new sources of direct income for the park and its companies. Most
common sources would include selling of electric and thermal energy available in surplus. The
indicator shall be evaluated on an annual basis, as the amount of income may not be uniform
throughout the different seasons. With reference to direct income related to energy selling,
evaluation must be carried out considering: foreseen amount of energy produced by the
solution, foreseen energy surplus, considering the demand of the park, foreseen sale costs
per unit and calculation of final costs.
The normalized net annual balance indicator can assume either positive or negative value.
Project Start: 01/03/2018 | Duration: 36 Months 17
Monitoring of this KPI should be carried out:
► before the implementation of the solution, in order to assess the economic feasibility of
the solution;
► annually, in order to check that initial estimations are reliable.
FE3. Normalized Payback Period (PBP) [-]: ratio between the payback period (i.e. number
of years necessary to recover the total amount of the CAPEX investment) for the implemented
energy cooperation solution and the average payback period for all implemented solutions in
the industrial park.
Calculation of payback periods shall be carried out on the basis of estimated annual savings
and direct income generated by the implementation of the solution itself. CAPEX, annual
savings and direct income are referred to the entire park.
High values of payback period may not be compatible with the park and companies’ business
development and plans and, consequently, it is desirable that the normalized payback period
assumes low values – meaning that investments for solutions for energy cooperation are
recovered quickly in comparison with the investments dedicated to the other solutions.
Monitoring of this KPI should be carried out:
► before the implementation of the solution, in order to assess the economic feasibility of
the solution;
► annually, in order to check that initial estimations are reliable.
FE4. Normalized internal rate of return (IRR) [-]: ratio between the internal rate of return for
the implemented energy cooperation solution and average internal rate of return for all
implemented solutions in the industrial park.
The internal rate of return is the interest rate at which the net present value of all the cash flows
(positive and negative) for the CAPEX investment is equal to zero. Similarly, it is the profitability
of an investment. The internal rate of return is commonly used to assess the attractiveness of
a project or investment.
It is thus desirable that the normalized internal rate of return is higher than one – meaning that
the energy cooperation solution is more profitable than an average solution.
Monitoring of this KPI should be carried out:
► before the implementation of the solution, in order to assess the economic feasibility of
the solution;
► annually, in order to check that initial estimations are reliable.
FE5. Financial assistance from public entities [%]: percentage of financial assistance from
public entities, calculated with respect to the correspondent costs and expenses that the park
bears for the implementation and functioning of the solution.
The indicator can be calculated considering financial assistance in form of either CAPEX,
through funding opportunities (e.g. subsidies) and fiscal incentives or OPEX, in form for
example of discounted rates. When necessary, it can be calculated for both CAPEX and OPEX
forms of public assistance. It is highlighted that the percentage shall be calculated with respect
to the corresponding expense of the park, avoiding merging CAPEX and OPEX values.

Project Start: 01/03/2018 | Duration: 36 Months 18
Financial assistance is interpreted as an incentive or compensation for actions taken (in this
case, the implementation of one or more solutions), the cost of an asset or expenses incurred.
This indicator may strongly influence the decision making process as public funding decreases
the amount of the investment of the park and its companies. It is highlighted that also forms of
fiscal incentives such as VAT reduction, low interest financing, shall be accounted as forms of
financial assistance.
This datum is to be evaluated according to existing and potentially available funding
opportunities at either local, regional, national or community level. Opportunities can be
identified internally, by the companies or by the park managers. Companies providing
consulting services can be engaged to support the park and its companies in exploiting public
assistance.
Monitoring of this KPI should be carried out before the implementation of the solution, in order
to be able to benefit from available financial assistance from public entities when implementing
the solution. The indicator does not have to be monitored in time.
FE6. Marketing communication and opportunities [very high – high - medium – low –
very low or none]: level of expectation about potential marketing communication and
opportunities deriving from the implementation of the solution.
Forms of marketing communication and opportunities in the sector of industrial parks include
the instauration of new collaborations and allies, the increase of popularity on social networks
and advertising activities and social engagement. These activities can be carried out either at
park level, whenever this approach is able to generate return, wither at company level, in order
to facilitate involvement of customers and consumers making it more direct.
It is possible to exploit a solution also for marketing purposes, to generate indirect benefits and
returns for the park and its companies.
The following scheme should be used to establish the value of this indicator:
Scale value Definition of scale value
Very high
The solution generates significant and valuable marketing communication and opportunities. It is used to support advertising and promotion activities and to develop green marketing initiatives. Benefits from the initiatives are expected both in the short and long term horizon.
High
The solution generates significant and valuable marketing communication and opportunities. It is used to support advertising and promotion activities and to develop green marketing initiatives. Benefits from the initiatives are expected both in the medium/short term horizon.
Medium
The solution generates small-scale marketing and communication opportunities. It may be used to support advertising and promotion activities and to develop green marketing initiatives. Benefits of these activities are still unknown/unforeseeable.
Low The solution generates minor marketing and communication opportunities. Benefits of these activities are still unknown/unforeseeable.
Very low or none The solution does not generate marketing communication and opportunities.
Monitoring of this KPI should be carried out:
► before the implementation of the solution, in order to investigate its potential effects;

Project Start: 01/03/2018 | Duration: 36 Months 19
► every 3 years, after the solution is implemented.
2.2.3 Legal and Regulatory KPIs
LR1. Simplicity of bureaucratic steps [very high – high – medium – low – very low]: level
of the simplicity of steps requiring bureaucracy related to the implementation of the solution.
The assessment shall include considerations with respect to the number, costs and complexity
of permits, authorizations and certifications needed.
Administrative departments shall be consulted in the evaluation of this KPI.
The following scheme should be used to establish the value of this indicator:
Scale value Definition of scale value
Very high
Only a few minor and common bureaucratic steps are necessary and procedures are already known to the administrative offices of the park or its companies. Costs and time constraints are sustainable by the park with minimum effort.
High
A few bureaucratic steps are necessary and procedures are already known to the administrative offices of the park or its companies. Costs or/and time constraints can be sustained with suitable planning, but obstacles are not foreseen.
Medium
Some bureaucratic steps are necessary and a few of them are not known by the administrative offices of the park or its companies. Nevertheless, no major obstacles in terms of costs and time are foreseen for the implementation of the installation.
Low Some bureaucratic steps are necessary and most of them are not known by the administrative offices of the park or its companies. Obstacles in terms of costs and/or time may arise during the procedures.
Very low or none
A significant number of bureaucratic steps is necessary and most of them are not known by the administrative offices of the park or its offices. Likely, obstacles in terms of costs and/or time will arise during the procedures.
Monitoring of this KPI should be carried out:
► before the implementation of the solution, in order to investigate its potential effects;
► every three years, after the solution is implemented.
LR2. Legal and regulatory feasibility [very high – high – medium – low – very low or
none]: level of expectation about the feasibility of the implementation of the solution from a
legal and regulatory perspective.
Often, legal and regulatory requirements stand as significant obstacles to the realization of
new technologies, initiatives or solutions, in terms of both costs and time.
The assessment of this indicator shall account for the number and type of agreements to be
tied between the park companies for the implementation of the solution and their
interdependency. These types of agreements are needed, for example, for a shared use of
park area, partitions of benefits and costs of the solution, actors involved and their roles and
responsibilities. In addition, it shall account for the number of formal agreements that link the
companies within the park (or the entire park directly) to external entities. External entities
include for example service providers and companies outside the park.

Project Start: 01/03/2018 | Duration: 36 Months 20
The value of this indicator is established by park managers or other appointed people having
a clear framework of the interactions that the solution will create within the park.
The following scheme should be used to establish the value of this indicator:
Scale value Definition of scale value
Very high No further contract or agreement is stipulated for the solution. Existing agreements and contracts may be updated.
High
A limited number of contracts and agreements is stipulated for the solution, and mainly between the companies within the park. Contracts and agreements with external entities are ordinary types of contracts, which do not require effort from the park or its companies.
Medium Few contracts and agreements are stipulated, both between the companies of the park and between the companies of the park and external entities. No major obstacle is foreseen for the stipulation.
Low
A relevant number of contracts and agreements is stipulated, both between the companies of the park and between the companies of the park and external entities. Significant restrictions may be imposed and obstacles may arise during stipulation and during the duration of the contract.
Very low or none
A relevant number of contracts and agreements is stipulated, both between the companies of the park and between the companies of the park and external entities. Significant restrictions are imposed and obstacles will likely arise during stipulation and during the duration of the contracts.
Monitoring of this KPI should be carried out before the implementation of the solution.
2.2.4 Social KPIs
S1. Replication potential [very high – high – medium – low – very low or none]: level of
expectation about the replication potential of the solution in other industrial parks.
The assessment of the replication potential shall be based on various factors, including, social
context of the park and the area where it is located, economical profitability of the related
business model, specific technical/site requirements for the solution, and feasibility of
implementation and can influence the decision making process. Replication potential
evaluation should be carried out based on expert judgement.
The following scheme should be used to establish the value of this indicator:
Scale value Definition of scale value
Very high The solution is highly replicable from an overall perspective, including social context, affordability/business model and technical feasibility. It is able to adapt to other parks’ features and needs without complications.
High
The solution is easily replicable in other parks, from an overall perspective, including social context, affordability/business model and technical feasibility. Minor adjustments may be needed to accomplish the necessity of each park.
Medium
The solution can be replicated in other parks, but mainly in terms of “concept”. Adjustments and modifications are likely needed, as the solution is commonly designed to fit a specific park’s constraints in terms of social context, affordability/business model and technical feasibility of a park and is not available in a standard layout directly replicable.

Project Start: 01/03/2018 | Duration: 36 Months 21
Scale value Definition of scale value
Low
The solution is designed to satisfy specific requirements in terms of social context, affordability/business model and technical feasibility of a park. It is not conceived for replication, even though replication opportunities may arise in specific conditions.
Very low or none
The solution is highly specific and it is designed to satisfy specific requirements in terms of social context, affordability/business model and technical feasibility of a park. It is unlikely that it will be replicated in other parks.
Monitoring of this KPI should be carried out before the implementation of the solution.
S2. Job creation [%]: ratio between the net number of full-time job places created by the
implementation of the solution within the park and its companies and the total number of staff
of the park and its companies.
An initiative that requires the creation of job places is beneficial for the local community. Job
places created can be estimated taking into account the size and complexity of the solution
implemented and the necessary expertise or specific skills to use it.
Job places created are intended as the difference between the number of additional staff
members that shall be hired and the number of staff members that are fired if the solution is
realized. If the indicator scores a negative value, it shall be assumed as 0.
The number of job created can be retrieved from companies and then aggregated at park level
or, possibly, park managers can estimate it.
Monitoring of this KPI should be carried out:
► before the implementation of the solution, in order to investigate its potential effects;
► annually, after the implementation of the solution.
S3. Impact on local development [very positive - positive – no impact – negative – very
negative]: level of the impact of the implementation of the solution within the industrial park.
A solution may be effective not only in the day-to-day routine inside the park, but it may also
influence local development and activities.
For the assessment of this indicator, factors such as creation of local jobs, involvement of local
suppliers and manpower, involvement of local authorities, that may be willing to replicate the
solution in the future in the local area, demonstration activities, services offered.
The following scheme should be used to establish the value of this indicator:
Scale value Definition of scale value
Very positive
The solution has a sensible positive impact on local development. It involves local communities’ manpower (directly or indirectly) and exploits local products and services. In addition, it offers services that are also available for non-staff members (i.e. mobility, energy services). Local municipalities may be involved and it is expected that it will carry medium/long term benefits.

Project Start: 01/03/2018 | Duration: 36 Months 22
Scale value Definition of scale value
Positive
The solution has a positive impact on local development. It involves local communities’ manpower (directly or indirectly) and exploits local products and services. It may offer services that are also available for non-staff members (i.e. mobility, energy services). Local municipalities may be involved and duration of positive effects in time is not foreseeable.
Slightly positive
The solution has a slightly positive impact on local development. Punctual involvement of local manpower, or products and services, municipalities is registered or foreseen. Services available for non-staff members may be offered, but positive effects are mainly expected in the short term.
Neutral The solution has no impact on local development and its effects are confined to the park activities.
Negative The solution has a negative impact on local development, for example in terms of mobility, local job opportunities and services to the local community.
Monitoring of this KPI should be carried out:
► before the implementation of the solution, in order to investigate its potential effects;
► every year after the solution is implemented.
S4. Impacts on human health and safety [very positive – positive – slightly positive –
neutral – negative]: level of human health and safety impacts associated with the
implementation of the solution.
This indicator is essential to address health and safety concerns, which are recognized
conditions of many national and international regulations. Health and safety at work is indeed
one of the area where the EU and related entities have had the biggest impact – with a solid
legal framework covering the maximum number of risks with the minimum number of
regulations, dissemination and information activities and guidance2.
Potential risks for human health and safety scanned should include risks for both the staff,
local community and end-users of products manufactured within the park. Evaluation of this
KPI shall take into account also: presence of hazardous or toxic substances, harmful
emissions, impacts on air quality and water quality, land use and deployment, probability of
incidents during use, number of people affected (considering both staff members and local
communities), number and type of reported incidents.
Information to evaluate the indicators can also be retrieved from safety audits and inspections.
The companies of the park, targeting at the specific solution, can carry out these activities
jointly or the park managers may play as leading parts in the evaluation.
The following scheme should be used to establish the value of this indicator:
Scale value Definition of scale value
Very positive
Potential risks for health and safety caused by the solution are negligible and risks related to baseline status of the park are significantly mitigated in terms of consequences and people affected thanks to the implementation of the solution.
2 http://ec.europa.eu/social/main.jsp?catId=148

Project Start: 01/03/2018 | Duration: 36 Months 23
Scale value Definition of scale value
Positive Potential risks for health and safety caused by the solution are negligible, and there is an overall beneficial effect on the baseline health and safety status of the park.
Slightly positive Potential risks for health and safety caused by the solution are negligible and there are overall slight beneficial effects on the baseline health and safety status of the park.
Neutral Potential risks for health and safety caused by the solution are negligible.
Negative There are risks associated with the implementation of the solution, in terms of severity of consequences or number of people affected.
Monitoring of this KPI should be carried out:
► before the implementation of the solution, in order to investigate its potential effects;
► every year after the solution is implemented.
S5. Benefits for sustainable mobility [very high - high – medium – low – very low or
none]: level of the beneficial effects of the measure on sustainable mobility.
A competitive, sustainable and resource-efficient mobility is among the objectives of the EC
[15] and this aspect may be addressed by the application of solutions within the industrial park.
The assessment of the impact on mobility shall rely also on considerations about benefits from
joint mobility and public transport, accessibility to the park area, use of electric H2 or hybrid
vehicles, decrease of time spent for transferring to the work-place, decrease of expenses for
transportation, and about possible side benefits/impacts for the local community.
In addition, factors such as comfort of mobility, security, space usage and public finance may
be taken into account.
In order to assess this indicator, from the employees’ perspective, it is possible to set up
questionnaires to collect opinions directly. Suitable questions may include: “How much time do
you spend on average to reach your work-place?”, “Which transport(s) do you use to go to
work?”. “Do/Would you use any form of joint mobility?”, etc.
As far as possible effects of the measure may affect the local mobility, local authorities and
municipalities shall be involved whenever possible.
The following scheme should be used to establish the value of this indicator:
Scale value Definition of scale value
Very high
The solution produces visible benefits for a sustainable mobility, both for the park staff members and non-members. A high percentage of the park staff is positively affected by the solution. Moreover, at least two of the following facts are registered/foreseen in the daily mobility: - increase in the number of people using shared mobility or “green” vehicles; - decrease of time spent in transportations to/from the work place; - decrease of transportation costs; - improved accessibility to the park facilities.

Project Start: 01/03/2018 | Duration: 36 Months 24
Scale value Definition of scale value
High
The solution produces visible benefits for a sustainable mobility, especially for park staff members. A high percentage of the staff is positively affected by the solution. Moreover, at least one of the following facts is registered/foreseen in the daily mobility: - increase in the number of people using shared mobility or “green” vehicles; - decrease of time spent in transportations to/from the work place; - decrease of transportation costs; - improved accessibility to the park facilities.
Medium
The solution produces benefits for a sustainable mobility, mainly for staff members and only rarely for local population. A limited percentage of the park staff benefits from the solution in its daily mobility, but only occasionally positive effects affect a high percentage of staff members.
Low The solution produces limited benefits for a sustainable mobility of staff members. Only a very limited percentage of staff members benefits from the solution and most of it only occasionally.
Very low or none The solution does not produce benefits for a sustainable mobility, for neither staff members or local population.
Monitoring of this KPI should be carried out:
► before the implementation of the solution, in order to investigate its potential effects;
► every three years after the solution is implemented.
2.2.5 Environmental KPIs
E1. Total annual water consumption [l/year], [m3/year]: total amount of water consumed at
park level.
The volume of water withdrawn provides an evidence of the site of the industrial park and
strictly influences the environmental performance. An increased efficiency with respect to
water use is a desirable result both from an economic and environmental perspective.
This indicator is able to capture also the effects of changes in the rates of internal water recycle
and reuse.
Data on water consumption can be retrieved from water bills received from water suppliers, if
all the water consumed comes from the distribution network or from installed metering systems
if other sources are present. Useful information may also be retrievable from audits concerning
energy and resource efficiency. It is highlighted that also waste water amount, if present, shall
be included in this indicator. According to data availability, the consumption can be calculated
also per each end use (i.e. sanitary, process) and the indicator can be replicated for each end
use.
It is expected that data necessary for the calculation of this KPI are commonly available at
company levels. For a correct implementation of the methodology, data at company level must
be summed to calculate the overall consumption at park level. It is important that the entire
amount of water consumed within the park is included. For this task, it may be useful to produce
an inventory of water sources not included within water bills of the companies – for any reason
– that are to be accounted in this indicator, in order to avoid neglecting them.

Project Start: 01/03/2018 | Duration: 36 Months 25
Projections for scenarios different from the baseline/current status can be obtained by
technical studies, own estimation, based on expert judgment and opinion. Defined scenarios
shall be realistic and representative of all the changes expected in the selected time-frame or
configuration.
Monitoring of this KPI should be carried out:
► before the implementation of the solution, in order to have a reference baseline value;
► annually, after the solution is implemented.
E2. Total annual waste generation [kg/year]: total mass of solid waste annually generated
at park level.
Issues related to waste generation and management have acquired growing importance in the
EU framework3. A low amount of waste generated corresponds to a more effective exploitation
of natural resources, to a reduction of environmental impacts, and to a decrease of waste
management costs. Series of data on the amount of waste generated indicate the level of
development achieved by the organization in its effort to reduce waste. They can indicate also
the potential improvement in the process of effectiveness and productivity. From an economic
perspective, reduction of waste contributes to direct reduction on the cost of materials and
waste treatment.
This indicator is able to capture also the effects of changes in the rates of internal waste
recovery, recycle and reuse.
Information about the mass of waste annually generated can be retrieved from waste
traceability systems, waste records, waste shipping documents, resource efficiencies audits or
calculations based on mass flows and balances performed at company level. This indicator
may be sub-divided, depending on data availability, into more specific indicators, such as
waste generation per material type or disposal method.
Data should be commonly available at company level and shall be aggregated at park level for
a correct implementation of the methodology.
Projections for scenarios different from the baseline/current status can be obtained by
technical studies, own estimation, based on expert judgment and opinion. Defined scenarios
shall be realistic and representative of all the changes expected in the selected time-frame or
configuration.
Monitoring of this KPI should be carried out:
► before the implementation of the solution, in order to have a reference baseline value;
► annually, after the solution is implemented.
E3. Annual by-products internal use [kg/year]: mass of by-products both produced and
exploited within the park’s activities over the total mass of by-products generated within the
park.
This indicator has a similar meaning to the one of the previous indicator. Indeed, by-products
are substances or objects resulting from a production process whose primary aim is not the
production of that item. For this reason, by-products do not belong to the category of waste,
3 http://ec.europa.eu/environment/waste/framework/

Project Start: 01/03/2018 | Duration: 36 Months 26
but their exploitation within the park can be considered as a form of implementation of circular
economy principles.
Data about internal use of by-products can be obtained from resource efficiency audits, or
calculations based on mass flows and balances performed a company level.
In addition, questionnaires may be used as a support for data collection. They should be
addressed to each company and, specifically, to the employees responsible for by-products
management. The questionnaires should address information regarding the use of by-products
within the company on one hand, and regarding the final destination of by-products generated
by the company (i.e. internal/external with respect to the park’s boundaries). An appointed
person, possibly belonging to the park managers’ staff, shall perform final merging of data
collected. Particular attention shall be paid to track all the by-products flows within the park
correctly, avoiding double-counting. The cross-match of data from multiple companies is a
helpful instrument of control.
Monitoring of this KPI should be carried out:
► before the implementation of the solution, in order to have a reference baseline value;
► annually, after the solution is implemented.
E4. Total annual energy consumption [MWh/year]: annual overall energy consumption,
including both purchased and self-produced energy.
Energetic performance is an important factor for the overall performance of a company/park,
as it strongly influences directly economic and environmental performance. Energy
consumption is a key parameter to investigate the effect of energy efficiency measure.
The indicator can be split and calculated per energy vector type (i.e. electricity, gas, fuel).
The energy consumption shall be diminished of the amount of surplus self-produced energy
that is sold in one year (if any) and shall take into account consumption of self-produced
renewable energy.
Data for estimation of annual energy consumption are commonly retrievable from bills from
retailer companies for the amount of energy purchased, or for metering systems especially for
the amounts of self-produced consumed and sold energy. Useful information are also available
from energy and resource efficiency audits.
These type of data are usually available at company level, and for a correct implementation of
the methodology must be aggregated at park level. Attention must be paid to include all the
sources of consumptions of common use (i.e. external lighting) properly, without double
counting. An inventory of shared consumptions may be useful to facilitate data aggregation
from company to park level.
Projections for scenarios different from the baseline/current status can be obtained by
technical studies, own estimation, based on expert judgement and opinion. Defined scenarios
shall be realistic and representative of all the changes expected in the selected time-frame or
configuration.
In order to assure a coherent approach in measuring and monitoring the performance of the
solution, a good practice is to calculate GHG and air emissions coherently with the overall
Project Start: 01/03/2018 | Duration: 36 Months 27
energy consumption. For this purpose, boundaries set for the two indicators shall be the same.
This approach allows also relying on a single block flow diagram – for both emissions and
energy consumption - illustrating all the relevant processes and sub-processes, including mass
and energy flows and exchanges between them. Furthermore, these boundaries should be the
same used for costs and savings evaluations.
The scale considered for relevant processes and sub-processes shall allow to limit the level of
detailing of the data necessary for the calculation on one hand and to capture the most
significant contributions to emissions and energy consumption on the other.
Monitoring of this KPI should be carried out:
► before the implementation of the solution, in order to have a reference baseline value;
► annually, after the solution is implemented.
E5. Total annual greenhouse gases emissions [kgCO2e/year]: total mass of greenhouse
gases emitted at park level in a year.
Greenhouse gases (GHGs) emissions, are responsible for the phenomenon of global warming,
which is one of the major concerns in modern society and often a significant criterion during
the decision making process.
At least emissions of CO2, CH4, N2O, HFCs, PFCs and SF6 shall be included.
GHGs emissions can be calculated (as for baseline status and as for different scenario) based
on resources consumption values and on emission factors available from literature or from
several software commercially available. Emissions factors shall take into account the specific
energy mix of the region.
In order to obtain consistent results, able to capture the effects of the solution relevant for the
park, it is important that – according to the definitions given by the Greenhouse Gas Protocol4
- both Scope 1 and Scope 2 emissions are included. Specifically, Scope 1 emissions are direct
emissions associated with the parks’ facilities and vehicles and they are associated with
sources that are owned and controlled by the park and its companies. Scope 2 emissions are
indirect emissions, which means that are a consequence of the activity of the park but occur
at sources owned and controlled by another entity, and are associated with the generation of
purchased or acquired electricity, steam, heating, or cooling consumed.
In the calculation of emissions related to transportation, in order to limit uncertainties and to
allow a simpler assessment, only emissions related to the vehicles owned by the companies
of the park shall be accounted for. The annual consumption for the vehicles of the fleet of each
company within the park shall be assumed, or calculated based on available data from fuel
cards, employees expenses reports; from the consumption, according to the fuel type, it is
possible to estimate the emissions.
This KPI can be seen as an indirect KPI, in the sense that its evaluation is quite straightforward,
but only provided that data concerning material and energy flows are available.
Projections for scenarios different from the baseline/current status can be obtained by
technical studies, own estimation, based on expert judgment and opinion. Defined scenarios
4 http://ghgprotocol.org/

Project Start: 01/03/2018 | Duration: 36 Months 28
shall be realistic and representative of all the changes expected in the selected time-frame or
configuration.
In order to assure a coherent approach in measuring and monitoring the performance of the
solution, a good practice is to calculate GHG emissions coherently with the overall energy
consumption. For this purpose, boundaries set for the two indicators shall be the same. This
approach allows also relying on a single block flow diagram – for both GHG emissions and
energy consumption - illustrating all the relevant processes and sub-processes, including mass
and energy flows and exchanges between them. Furthermore, these boundaries should be the
same used for costs and savings evaluations.
The scale considered for relevant processes and sub-processes shall allow to limit the level of
detailing of the data necessary for the calculation on one hand and to capture the most
significant contributions to emissions and energy consumption on the other.
Monitoring of this KPI should be carried out:
► before the implementation of the solution, in order to have a reference baseline value;
► annually, after the solution is implemented.
E6. Renewable energy sources share [%]: ratio between the consumption of energy
(electricity and heat) produced from renewable energy sources onsite and total energy
consumption (electricity and heat) calculated considering a suitable time period, typically a
year.
Consumptions are referred to the entire park. Renewable energy forms include namely wind,
solar, aerothermal, geothermal, hydrothermal and ocean energy, hydropower, biomass, landfill
gas, sewage treatment plant gas and biogases [16].
This KPI is often used in statistics to investigate trends concerning the use of renewable energy
and is a key element in energy policy and in the reduction of dependence on fuel imported
from extra-EU countries.
Calculation of the amount of energy from renewable sources can be carried out based on the
characteristics of the site and the features of the equipment for renewable energy production
can be estimated through sensors or metering instruments or can be established as the
difference between total energy used and purchased energy.
Projections for scenarios different from the baseline/current status can be obtained by
technical studies, own estimation, based on expert judgment and opinion. Defined scenarios
shall be realistic and representative of all the changes expected in the selected time-frame or
configuration.
Monitoring of this KPI should be carried out:
► before the implementation of the solution, in order to have a reference baseline value;
► annually, after the solution is implemented.
E7. Total annual air emissions [kg/year]: total mass of air pollutant emitted at park level in
a year.

Project Start: 01/03/2018 | Duration: 36 Months 29
Main air pollutants in Europe include SO2, NOX, NH3, NMVOCs, PM2.55, and they all shall be
included in the calculation of this indicator. It is preferable if the indicator is calculated singularly
per each substance.
Air pollution is among the main concerns of global framework and its reduction is a key
objective of EU strategies.
Emissions can be either be measured or estimated for the different sources and should include
emissions related to both industrial processes realized within the park and transports
associated with the fleet of the park and its companies.
Projections for scenarios different from the baseline/current status can be obtained by
technical studies, own estimation, based on expert judgment and opinion. Defined scenarios
shall be realistic and representative of all the changes expected in the selected time-frame or
configuration.
In order to assure a coherent approach in measuring and monitoring the performance of the
solution, a good practice is to calculate GHG and air emissions coherently with the overall
energy consumption. For this purpose, boundaries set for the two indicators shall be the same.
This approach allows also relying on a single block flow diagram – for both emissions and
energy consumption - illustrating all the relevant processes and sub-processes, including mass
and energy flows and exchanges between them. Furthermore, these boundaries should be the
same used for costs and savings evaluations.
The scale considered for relevant processes and sub-processes shall allow to limit the level of
detailing of the data necessary for the calculation on one hand and to capture the most
significant contributions to emissions and energy consumption on the other.
Monitoring of this KPI should be carried out:
► before the implementation of the solution, in order to have a reference baseline value;
► annually, after the solution is implemented.
E8. Reduction of indirect (Scope 3) greenhouse gases emissions [very high – high –
medium – low – very low or none]: level of reduction of indirect (Scope 3) GHG emissions
caused by the implementation and functioning of the solution.
According to the GHG Protocol6, Scope 3 indirect GHG emissions are the emissions resulting
from value chain activities, excluding those related to the generation of purchased energy
consumed. The evaluation of this type of emissions helps the parks and companies to
understand their full value chain emissions impact in order to focus efforts on the greatest GHG
reduction opportunities, leading to more sustainable decisions about parks’ activities and the
products they buy, sell, and produce [17].
Examples of activities causing Scope 3 emissions include those related to leased assets,
employee commuting, business travel, transportation and distribution, capital goods, use and
5 https://www.eea.europa.eu/airs/2017/environment-and-health/air-pollutant-emissions 6 http://ghgprotocol.org/

Project Start: 01/03/2018 | Duration: 36 Months 30
processing of sold products, etc. Activities can be associated either with the upstream or
downstream value chain.
The assessment of this KPI shall be carried out considering both companies’ and park
managers’ perspectives. For some activities (e.g. employee commuting), investigations for
evaluating the KPI can include consultation with staff members, through questionnaires or
through representative appointed people. For other activities (e.g. capital goods), companies
and park managers are expected to provide significant and valuable information, as they are
aware of the entire value-chain. Expert judgement or forms of external consulting may support
the evaluation.
The following scheme should be used to establish the value of this indicator:
Scale value Definition of scale value
Very high
Two or more types of Scope 3 GHG emissions are reduced by the implementation and functioning of the solution. Reductions are expected to be significant as, for example, emissions due to activities of high percentages of staff/assets are reduced or emissions related to notably highly GHG-emitting activities are reduced.
High Two or more types of Scope 3 GHG emissions are reduced by the implementation and functioning of the solution.
Medium
One type of Scope 3 GHG emission is reduced by the implementation and functioning of the solution. Reduction is expected to be significant as, for example, emissions due to activities of high percentages of staff/assets are reduced or emissions related to notably highly GHG-emitting activities are reduced.
Low One type of Scope 3 GHG emission is reduced by the implementation and functioning of the solution.
Very low or none Scope 3 GHG emissions are not reduced by the implementation and functioning of the solution.
Monitoring of this KPI should be carried out:
► before the implementation of the solution, in order to investigate its potential effects;
► every three years after the solution is implemented.
2.2.6 Technical KPIs
T1. Thermal energy recovery [%/year]: percentage of thermal energy annually recovered
divided by the total amount of thermal energy annually consumed at park level.
This KPI measures the results of energy efficiency strategies implemented to increase thermal
energy recovery within a process/plant/park. Indeed, these strategies may turn particularly
effective in a complex system such as the industrial park, where the simultaneous presence of
different industries increases the opportunities of recovery, when technically efficient and
convenient.
Data for estimation of thermal energy annually recovered shall be retrieved from audits,
measures, design assumptions or calculations. Double counting shall be avoided.
Projections for scenarios different from the baseline/current status can be obtained by
technical studies, own estimation, based on expert judgement and opinion. Defined scenarios
shall be realistic and representative of all the changes expected in the selected time-frame or
configuration.

Project Start: 01/03/2018 | Duration: 36 Months 31
Monitoring of this KPI should be carried out:
► before the implementation of the solution, in order to have a reference baseline value;
► annually, after the solution is implemented.
T2. Technical feasibility [very high – high – medium – low – very low or none]: level of
expectation about the feasibility of the implementation of the solution from a technical and
technological perspective.
The realization of solutions for energy efficiency improvements in industrial parks often
requires complex systems and grids and demanding installation works.
The assessment of this indicator shall take into account factors such as deployment time, from
the beginning of installation works to their end, including time for auxiliary and preliminary
works. As a matter of fact, during this time span, the functionality of the park may be altered or
reduced. Another crucial aspect for the technical feasibility of a solution is the adequacy of
available infrastructures and lines, in terms of both performance and number. Information
about these aspects may be provided by suppliers and installers and can be estimated based
on expert judgment.
The following scheme should be used to establish the value of this indicator:
Scale value Definition of scale value
Very high
The present network of infrastructures and lines is compatible with the solution or requires only minor and quick adjustments, without any reduction of the park functionality. In addition, no major obstacles are foreseen in case of future changes in the layout of the solution.
High
The present network of infrastructures and lines is generally compatible, but it requires only minor and quick adjustments that can reduce the functionality of a limited area of the park for a short period. In addition, no major obstacles are foreseen in case of future changes in the layout of the solution.
Medium
The present network of infrastructures and lines requires some modifications and minor additional components for the implementation and functioning of the solution. The functionality of some areas of the park is reduced or compromised during the deployment time.
Low
The present network of infrastructures and lines requires considerable modifications or additional components for the implementation and functioning of the solution. The functionality of some areas of the park is reduced or compromised during the deployment time.
Very low or none
The present network of infrastructures and lines is not adequate to integrate the solution. Heavy modifications must be carried out or several additional components must be installed. The functionality of considerable areas of the park is reduced or compromised during the deployment time.
Monitoring of this KPI should be carried out before the implementation of the solution.
T3. Annual uniformity [very high – high – medium – low – very low or none]: level of
expectation about the performance of the solution in time and its seasonality.
In some cases, a solution may significantly improve the performance of the park in a certain
period of the year but may not be reliable or efficient enough during another season. This
aspect is strongly related, for example, to the introduction of some kinds of renewable energy
sources. A good uniformity in time may help in increasing the efficiency and in facilitating the

Project Start: 01/03/2018 | Duration: 36 Months 32
management of the park. Moreover, a non-annual uniform solution could be preferably
implemented in pre-determined time period in order to boost its impact. When evaluating this
indicator, local climate conditions and seasonality of production processes within the park shall
be considered. Nevertheless, it is not always possible to predict the factors that contribute to
vary the performance of the solution and some uncertainties remain in most of the situations.
Assessment should be carried out by park managers, companies’ appointed people or base
don expert judgement.
The following scheme should be used to establish the value of this indicator:
Scale value Definition of scale value
Very high The solution has a uniform performance over the entire year and it is not affected by external climate conditions or rate of production activities.
High The solution has an overall uniform performance over the entire year. Fluctuations related to external climate conditions or rate of production activities are expected/registered in less than 2 months per year.
Medium The solution performance varies over the entire year. Fluctuations related to external climate conditions or rate of production activities are expected/registered in less than 4 months per year.
Low The solution performance varies significantly over the entire year. Fluctuations related to external climate conditions or rate of production activities are expected/registered during most of the year.
Very low or none The solution performance is not uniform along the year and it is in some cases unpredictable, making it complicated to plan the activities within the park.
Monitoring of this KPI should be carried out:
► before the implementation of the solution;
► annually, after the solution is implemented.
2.3 CALCULATION RULES
In this section, rules for the calculation of the performance of a solution within the industrial
park are given.
Firstly, a general overview of the calculation scheme adopted is given, while in the following
sections all the rules are explained in detail. To conclude, methods for results representation
and interpretations are introduced, conditions for proper application of the methodology are
explained and some variants to meet specific needs and make the methodology more flexible
are proposed.
Furthermore, Annex II provides a schematic guideline for the application of the methodology.
2.3.1 Overview
This section provides a complete overview on the methodology developed for the evaluation
of performance of a solution within an industrial park.
Before developing rules for calculation, an additional clusterization of KPIs is necessary. This
need arises from the fact that among the indicators previously introduced:

Project Start: 01/03/2018 | Duration: 36 Months 33
► some indicators are related directly to the overall performance of the park. These
indicators can be evaluated even if solutions are not implemented and are also able to
capture the baseline status of the park. Nevertheless, their calculation can be carried
out considering the implementation of one or more solutions and related effects on the
park;
► some indicators are related to the specific solution to be implemented. They describe
and measure the features of the solution and directly assess its performance, which
however depends on the specific industrial park the solution is implemented in. These
indicators are fundamental to evaluate the performance of the park when a solution is
implemented.
In order to reflect the above described properties of the indicators, two KPI’s categories are
introduced:
► Park level KPIs, which assess directly the overall performance of the park;
► Solution-specific KPIs, which refer to the specific solution to be implemented.
Within the two classes introduced, KPIs may be either of quantitative type or qualitative type.
Table 2-1 indicates for each KPI the correspondent class and type.
Table 2-1: KPIs’ class and type
Impact category KPI
Park level KPIs
Solution-specific KPIs
Quantitative Qualitative Quantitative
Organizational KPIs
Staff involvement x
Stakeholder involvement
x
Energy efficiency awareness
x
Financial and Economic KPIs
Normalized CAPEX x
Normalized net annual balance
x
Normalized PBP (pay back period)
x
Normalized IRR (internal rate of return)
x
Financial assistance from public entities
x
Marketing communication and opportunities
x
Legal and Regulatory KPIs
Simplicity of bureaucratic steps
x
Legal and regulatory feasibility
x
Social KPIs
Replication potential x
Job creation x
Impact on local development
x

Project Start: 01/03/2018 | Duration: 36 Months 34
Impact category KPI
Park level KPIs
Solution-specific KPIs
Quantitative Qualitative Quantitative
Impacts on human health and safety
x
Benefits for sustainable mobility
x
Environmental KPIs
Total annual water consumption
x
Total annual waste generation
x
Annual by-products internal use
x
Annual energy consumption
x
Total annual greenhouse gases emissions
x
Renewable energy source share
x
Total annual air emissions
x
Reduction of indirect (scope 3) greenhouse gases emissions
x
Technical KPIs
Thermal energy recovery
x
Technical feasibility x
Annual uniformity x
The different characteristics of the KPIs selected highlight the importance of developing
different rules for performance calculation, depending on the class and type of KPI used.
The entire methodology is based on the assumption that the performance is assessed
independently and in parallel for each impact category, in order to avoid an excessive
compression of results, which would lead to a difficult and potentially misleading interpretation
and to loss of valuable information. Thus, when the assessment is carried out for a specific
impact category, only the KPIs belonging to that specific impact category must be considered.
For each impact category, the performance of a solution within a specific park results from the
following three terms:
𝑝1: performance term associated with quantitative KPIs for performance assessment at park
level;
𝑝2: performance term associated with qualitative KPIs for performance assessment through
solution-specific KPIs;
𝑝3: performance term associated with quantitative KPIs for performance assessment through
solution-specific KPIs.
It is thus highlighted that each KPI contributes to only one of the terms above, according to its
class and its type.

Project Start: 01/03/2018 | Duration: 36 Months 35
Subsequently, an approach to aggregate and compress the results obtained for 𝑝1, 𝑝2, 𝑝3 and
harmonize them into the overall indicator of performance for the studied impact category is
developed, considering the general principles outlined both for the methodology and the KPIs
definition.
2.3.2 Rules for park level quantitative KPIs
Calculation rules defined within this section apply to all the quantitative KPIs defined at park
level.
The performance assessment of a solution at park level consists in calculating the term 𝑝1 for
the available KPIs and for each impact category.
The performance term 𝑝1 associated with a generic KPI is conceived in relative terms, by
comparing the baseline status in terms of the given KPI, usually representative of the current
condition of the park, with the status of the same park after the solution is implemented in terms
of the given KPI.
Specifically, the following equation shall be used to calculate the variation ∆𝑖 associated with
the i-th KPI:
∆𝑖= 𝐾𝑃𝐼𝑖,𝑝𝑜𝑠𝑡−𝑠𝑜𝑙 − 𝐾𝑃𝐼𝑖,𝑏𝑎𝑠𝑒𝑙𝑖𝑛𝑒
𝐾𝑃𝐼𝑖,𝑏𝑎𝑠𝑒𝑙𝑖𝑛𝑒∙ 100 [%]
where:
∆𝑖: percentage variation with respect to the i-th KPI;
𝐾𝑃𝐼𝑖,𝑝𝑜𝑠𝑡−𝑠𝑜𝑙: value of the i-th KPI – selected among those belonging to the park level class –
calculated considering the status of the park after the solution is implemented and
expressed in the unit of measure indicated for the i-th KPI itself;
𝐾𝑃𝐼𝑖,𝑏𝑎𝑠𝑒𝑙𝑖𝑛𝑒: value of the i-th KPI – selected among those belonging to the park level class –
calculated considering the baseline status of the park and expressed in the unit of
measure indicated for the i-th KPI itself.
Based on the percentage variation calculated for the i-th, the performance term 𝑝1,𝑖 is obtained
according to the following table (Table 2-2). Specifically, two different rules are outlined
because, depending on the meaning of the specific KPI, a positive Δ may correspond to either
a positive or a negative performance.
KPIs for which a positive Δ corresponds to a positive performance (positive Δ-positive
performance) are: annual by-products internal use, renewable energy source share, thermal
energy recovery.
KPIs for which a positive Δ corresponds to a negative performance (positive Δ-negative
performance) are: total annual water consumption, total annual waste generation, annual
energy consumption, total annual emissions of GHGs, total annual air emissions.

Project Start: 01/03/2018 | Duration: 36 Months 36
Table 2-2: p1 calculation
KPIs Δ value p1
Positive Δ-positive performance
> 25% 100%
< 25% > 15%
75%
< 15% > 10%
50%
< 10% > 5%
25%
< 5% > - 5%
0%
< - 5% > - 10%
- 25%
< - 10% > - 15%
- 50%
< - 15% > - 25%
- 75%
< - 25% -100%
Positive Δ-negative performance
< -25% 100%
> -25% < -15%
75%
> -15% < -10%
50%
> -10% < -5%
25%
> -5% < 5%
0%
> 5% < 10%
- 25%
> 10% < 15%
- 50%
> 15% < 25%
- 75%
> 25% -100%
The calculation of 𝑝1,𝑖 is to be repeated for all the KPIs relevant for the solution and available
within the park.
Having evaluated an appropriate number 𝑁1 of 𝑝1,𝑖 terms, the performance term 𝑝1 can be
calculated as follows:
𝑝1 = 𝑝1,1 + 𝑝1,𝑖 + ⋯ + 𝑝1,𝑁1
𝑁1
It is important to recall that this procedure shall be applied for each impact category assessed
and using only the KPIs belonging to that impact category.
2.3.3 Rules for solution-specific KPIs
Calculation rules defined within this section apply to all the solution-specific KPIs defined.

Project Start: 01/03/2018 | Duration: 36 Months 37
Rules for the calculation of performance are defined separately for qualitative and quantitative
KPIs, corresponding respectively to the contributions 𝑝2 and 𝑝3, previously introduced.
Calculations shall be carried out separately for each impact category.
2.3.3.1 Rules for solution-specific KPIs – Qualitative KPIs
In this section, rules for calculation of performance term 𝑝2 are given.
Rules are developed considering that all the qualitative KPIs are measured and expressed
through a Likert scale with five grades. Likert scales can differ from one indicator to another,
specifically, in the case of the defined KPIs, a value scale and an impact scale are introduced.
In order to homogenize the qualitative measure of performance to the quantitative one, for
each Likert scale type a conversion scheme is proposed in Table 2-3. Schemes are developed
based on expert judgement. In addition, they are set in order to allow a fair, balanced and
coherent aggregation of performance levels. To this aim, considering the European context
and the type of solutions considered in the boundaries of this project, the possibility of
experiencing negative impacts on human health and safety and local development (i.e.: the
two KPIs for which the scale is applicable) is considered rare and thus, the detailing of the
negative side of the Likert scale is not carried out, and a sole score is proposed. On the other
hand, the extension of positive impacts may present great variations.
For example, performance values for high/positive grades of the Likert scale are pushed
towards 100% as – according to the definition of the scales given for each specific KPI – it is
recognized that criteria to score a high/positive grades may be quite demanding for industrial
parks.
In these scales, the performance – being associated directly with the solution - acquires
meaning in absolute sense. High level of performance, close to 100%, indicate an effective
solution, while low level of performance corresponds to an ineffective or limitedly effective
solution.
Table 2-3: Conversion table for Likert scales
Likert Scale Scale Grade p2
Value
Very high 100%
High 85%
Medium 50%
Low 15%
Very low or none 0%
Impact
Very positive 100%
Positive 85%
Slightly positive 50%
Neutral 0 %
Negative - 50%
It results that given a generic KPI 𝐾𝑃𝐼𝑖, Table 2-3 allows to establish the correspondent term
of performance 𝑝2,𝑖.

Project Start: 01/03/2018 | Duration: 36 Months 38
The calculation of 𝑝2,𝑖 is to be repeated for all the KPIs relevant for the solution and available
within the park.
Having evaluated an appropriate number of 𝑝2,𝑖 terms, the performance term 𝑝2 is calculated
as the average value of performance between all the KPIs. Specifically, considering a set of
𝑁2 KPIs, the performance term 𝑝2 is calculated as follows:
𝑝2 = 𝑝2,1 + 𝑝2,𝑖 + ⋯ + 𝑝2,𝑁2
𝑁2
It is important to recall that this procedure shall be applied for each impact category assessed
and using only the KPIs belonging to that impact category.
2.3.3.2 Rules for solution-specific KPIs – Quantitative KPIs
In this section, rules for calculation of the previously introduced term 𝑝3 are given.
Quantitative solution-specific KPIs express quantifiable aspects strictly connected to the
solution. In order to associate with each value of the KPI an adequate term of performance,
multiple conversion scales are introduced. In particular, a scale is tailored for each KPI.
Scales are developed based on expert judgement. In addition, they are set in order to allow a
fair, balanced and coherent aggregation of performance levels. Table 2-4 shows - for each
relevant KPI – the conversion scale from its value to a value of performance.
In these scales, the performance – being associated directly with the solution - acquires
meaning in absolute sense. High level of performance, close to 100%, indicate an effective
solution, while low level of performance corresponds to an ineffective or limitedly effective
solution.
It is highlighted that setting performance criteria is to some extent a subjective task, which is
often performed internally at company level. For this reason, the following scale may be
adjusted to take into account specific needs and features of each park and on the basis of
companies consultation. Nevertheless, the above mentioned criteria for the definition of the
scales shall be respected.
Table 2-4: Conversion scales for quantitative solution-specific KPIs
KPI KPI value p3
Staff involvement
>80% 100%
<80% >50%
75%
<50% >30%
50%
<30% >10%
25%
<10% 0%
Stakeholder involvement
>80% 100%
<80% >50%
75%

Project Start: 01/03/2018 | Duration: 36 Months 39
KPI KPI value p3
<50% >30%
50%
<30% >5%
25%
<5% 0%
Normalized capital expenditure
<10% 100%
>10%- <20%
75%
>20% <30%
50%
>30% <50%
25%
>50% 0%
Normalized net annual balance
>80% 100%
<80% >50%
75%
<50% >30%-
50%
<30% >10%
25%
<10% 0%
Normalized Payback Period
<0.5 100%
>0.5 <0.75
50%
>0.75 <1.25
0%
>1.25 <1.5
-50%
>1.5 -100%
Normalized internal rate of return (IRR)
>1.5 100%
<1.5 >1.25
50%
<1.25 >0.75
0%
<0.75 >0.5
-50%
<0.5 -100%
Job creation
>15% 100%
<15% >10%
50%
<5% >-5%
0%
<-5% >-15%
-50%
<-15% -100%
It results that given a generic KPI 𝐾𝑃𝐼𝑖, Table 2-4 allows to establish the correspondent term
of performance 𝑝3,𝑖.

Project Start: 01/03/2018 | Duration: 36 Months 40
The calculation of 𝑝3,𝑖 is to be repeated for all the KPIs relevant for the solution and available
within the park.
Having evaluated an appropriate number of 𝑝3,𝑖 terms, the performance term 𝑝2 is calculated
as the average value of performance between all the KPIs. Specifically, considering a set of
𝑁3 KPIs, the performance term 𝑝3 is calculated as follows:
𝑝3 = 𝑝3,1 + 𝑝3,𝑖 + ⋯ + 𝑝3,𝑁3
𝑁3
It is important to recall that this procedure shall be applied for each impact category assessed
and using only the KPIs belonging to that impact category.
2.3.4 Overall performance assessment
Having provided calculation rules to assess the three performance terms 𝑝1, 𝑝2 and 𝑝3, this
section focuses on developing rules for their aggregation and for the calculation of the overall
indicator of performance 𝑃. The aggregation procedure shall be repeated for each impact
category.
In detail, the overall performance 𝑃 can be calculated as the average of the terms 𝑝1, 𝑝2 and
𝑝3 weighted on the number of KPIs used for the assessment of each performance term,
indicated as 𝑁1, 𝑁2 and 𝑁3 respectively. Specifically, the following equation shall be applied:
𝑃 = 𝑁1𝑝1 + 𝑁2𝑝2 + 𝑁3𝑝3
𝑁1 + 𝑁2 + 𝑁3
Weights are introduced in order to guarantee that robust performance terms, calculated from
a significant number of indicators, become more significant in the final assessment. On the
other hand, if the same number of indicators is used for the calculation of each of the three
performance terms, the weighted average corresponds to a normal average, where all the
contributions share the same importance.
2.3.5 Results representation and interpretation
This section provides information about the final representation of results, in order to guarantee
their interpretability.
When the methodology is fully and completely applied, for each impact category a quantitative
measure of performance 𝑃 is assessed. The value of 𝑃 ranges from -100% - corresponding to
a low performance of the solution - to 100% - corresponding to a very good performance of the
solution.

Project Start: 01/03/2018 | Duration: 36 Months 41
As commonly done for the representation of multivariate variables, a radar chart - having axes
correspondent to the impact categories - is used to show the results. Figure 2-1 illustrates an
invented example.
Figure 2-1: Radar chart for representation of results - Example
This type of graph allows an immediate and synthetic representation of results. The impact
categories with high rates of performance for the given solution are clearly visible, as well as
those with low rates.
It is then part of the decision making process to assess whether the performance of the solution
for a specific impact category is acceptable from a quantitative point of view and then to
assess, from a qualitative perspective, if the overall performance of the solution within the
specific industrial park is satisfying. In general terms, the area enclosed within the graph is a
measure of the overall performance of the solution.
This type of representation is also suitable to carry out comparisons between the performances
of different solutions within the same park, as shown for example in Figure 2-2. In the same
way, in order to monitor the performance of the solution within the park, the comparison may
concern the same solution in two different moments in time.
-100
-50
0
50
100Organizational
Financial andEconomic
Legal and Regulatory
Social
Environmental
Technical

Project Start: 01/03/2018 | Duration: 36 Months 42
Figure 2-2: Radar chart for comparison of two solutions – Example
In a complementary view, the methodology in theory allows also the comparison of the
performance of the implementation of a solution in two different parks/companies. In this case,
the performance of the solution is strongly driven by national factors and local features (e.g.:
size, existing energy systems, etc.).
Nevertheless, within the scope of this work and within the IAT tool, the main purpose of the
assessment is to evaluate the performance of a solution and to compare different solutions
within a park/company. Those solutions selected or with highly satisfactory performance levels
will represent “success stories”, to be publicly shared for dissemination purposes and
benchmarking of good practices.
2.3.6 Minimum requirements for application
The application of the full methodology presented may turn to be a demanding task, especially
because of the large amount of information necessary to the calculation of all the KPIs.
In addition, due to the variety of solution covered within the project and of the impact category
assessed, it is possible that some KPIs are not relevant for the evaluation of the performance
of a certain solution.
For this reason, this section describes the criteria that shall be followed to apply the
methodology only partially, reducing the burden of the data-gathering phase without
threatening the quality and validity of the results. Specifically, one among the following two
options can be followed:
► Option A:
For each impact category identified, the performance evaluation shall include at least
a number of KPIs higher than one third of the total number of KPIs for that impact
category.
The user is free to select which KPIs to include and which ones not. Of course, it is
desirable that in the choice of KPIs to be included within the assessment the materiality
-100
-50
0
50
100Organizational
Financial andEconomic
Legal and Regulatory
Social
Environmental
Technical
Solution 1 Solution 2

Project Start: 01/03/2018 | Duration: 36 Months 43
principle is applied and the most relevant indicators for the studied solution within the
specific park are not neglected.
Table 2-5 below shows the minimum number of KPIs to evaluate for each impact
category if option A is followed:
Table 2-5: Minimum n° of KPIs for each impact category
Impact category Minimum n° of KPIs
Organizational 2
Financial and Economic 3
Legal and Regulatory 1
Social 2
Environmental 3
Technical 2
► Option B:
The performance evaluation of a solution shall be carried out through core indicators.
Core indicators are indicators generally applicable, as they are relevant and respect
the materiality principle for most of the solutions. In order to guarantee a
comprehensive and significant application of the methodology, one or more core KPIs
are identified for each impact category.
In order to select an adequate panel of core KPIs, the steps below have been followed:
1. Matching between each of the solution proposed in D1.1 with correspondent relevant
KPIs (Annex III);
2. Identification of KPIs that are relevant and respect the materiality principle for all the
categories of solutions (D1.1 classification);
3. Selection of core KPIs, among the KPIs identified in Step 2. The selection is based on
considerations about data accessibility, possibility of evaluation for the industrial park
and expert judgement.
Nevertheless, not all the impact categories include a KPI that is relevant for all the
categories of solutions. In such cases, a core KPI is identified among the KPIs that are
relevant and respect the materiality principle for most of the categories and the
categories for which the core KPI is not applicable or relevant are exempted from the
evaluation.
Table 2-6 shows for each impact category, the correspondent core KPIs and the
solution categories that are exempted from their calculation. If the solution for which
the performance is being evaluated, belongs to one of the exempted categories, the
correspondent core KPI must not be calculated.
Table 2-6: Core KPIs and categories exempted
Impact category Core KPIs Categories exempted
Organizational O2. Stakeholder
involvement -

Project Start: 01/03/2018 | Duration: 36 Months 44
Impact category Core KPIs Categories exempted
Financial and Economic
FE1. Normalized CAPEX
FE3. Normalized Payback period
Managerial actions (for KPI FE3 only)
Legal and Regulatory LR2. Legal and
Regulatory feasibility -
Social S4. Benefits for human
health and safety -
Environmental
E4. Annual energy consumption
E5. Total annual GHG emissions
Contractual instruments and managerial actions
Technical T2. Technical feasibility Managerial actions
It is highlighted that having defined core indicators based on the classification of
solution used in D1.1 does not limit the applicability of these minimum requirements for
solutions that were not introduced in D1.1, as it can be reasonably assumed that each
unforeseen solution can be easily classified according to the scheme proposed in D1.1.
2.3.7 Variants
This section explores two basic variants for the application of the proposed methodology.
Variants may be useful when specific needs arise during the evaluation of the performance of
a solution.
2.3.7.1 Weighting
This section introduces calculation rules to take into account that some KPIs may be
considered more significant and valuable than others during the performance assessment.
For this purpose, weights shall be introduced and assigned to each KPI. In such situation, the
previously introduced equations for the calculation of the terms 𝑝1, 𝑝2 and 𝑝3 are modified.
Below, the modified equation for the term 𝑝1 is reported, and equations for 𝑝2 and 𝑝3 can be
adjusted in the same way.
𝑝1 = 𝑤1𝑝1,1 + 𝑤𝑖𝑝1,𝑖 + ⋯ + 𝑤𝑁1
𝑝1,𝑁1
𝑤1 + 𝑤𝑖 + ⋯ + 𝑤𝑁1
where:
𝑝1: performance terms associated with quantitative KPIs at park level;
𝑝1,𝑖: performance of the solution at park level with respect to the i-th KPI;
𝑤𝑖: weight associated with the i-th indicator.
The other steps of the methodology can be applied as already defined in the previous sections,
without any further modification.
Project Start: 01/03/2018 | Duration: 36 Months 45
A delicate phase of the performance evaluation process with weighting is indeed the definition
of weights.
Weights definition should be under the responsibility of park managers and should be the result
of a consultation process with appointed people of the companies of the industrial park and
other relevant stakeholder and actors, such as municipalities, employees’ representatives, etc.
Some general criteria for weights definition are, for example:
► Uncertainty: high weights shall be assigned to those KPIs that are confidently estimated
and with a good level of approximation; low weights shall be assigned to those KPIs
that are estimated with significant uncertainty and approximation;
► Priority: high weights shall be assigned to those KPIs that are representative of the
priorities and the strategies of the park; low weights shall be assigned to those KPIs
that are less relevant for the development strategy of the park. The policy framework
in force can also influence the aforementioned priorities.
It is of paramount importance to avoid weighting when final results are to be used for
comparison purposes. Indeed, this can lead to misleading conclusions generated by different
weighting approaches and values. It is suggested that also when weights are applied, a parallel
correspondent application of the methodology is carried out without weighting, in order to have
a clear understanding of the effects of this variant and to rely on results suitable for
comparability in case of future needs.
2.3.7.2 Multiple solutions
The presented methodology is defined in order to evaluate, if necessary, the performance
related to the implementation of more than one solution simultaneously.
This opportunity may be very useful as often strategies for improving energy efficiency and
sustainability of an asset (i.e. the industrial park) foresee the implementation of more than one
solution at the time, in order to cover as many aspects as possible, from industrial processes,
to waste management, staff mobility, etc.
When the user is willing to implement the methodology to evaluate the performance of multiple
solutions, the following criteria shall be followed:
► With reference to calculation rules for the performance term 𝑝1 (Section 2.3.2), the
index 𝑝𝑜𝑠𝑡 − 𝑠𝑜𝑙 must be referred to the scenario in which multiple solutions are
implemented;
► With reference to calculation rules for the performance term 𝑝2 (Section 2.3.3.1), the
grade of each indicator must be assigned taking into account all the solutions that affect
the indicator itself. Due to the fact that the KPIs belonging to this class are solution-
specific, it may happen that conflicting grade are associated with each KPI,
nevertheless, it is responsibility of the user to figure the final situation of the park after
the implementation of multiple solutions and the grade should be assigned
consequently;
► With reference to calculation rules for the performance term 𝑝3 (Section 2.3.3.2), the
value of each KPI must be calculated in the scenario where multiple solutions are
implemented;

Project Start: 01/03/2018 | Duration: 36 Months 46
► With reference to minimum requirements for the application of the methodology
(Section 2.3.6), in case of implementation of multiple solutions, it shall be guaranteed
that the minimum requirements for each single solution are covered;
It is reasonably expected that the installation of multiple solutions simultaneously generates
better performances compared to the installation of a single solution. This aspect can be
captured by the developed methodology only under the condition that the same KPIs are used
when applying the methodology to the single solution scenario and to the multiple solutions
scenario.
Project Start: 01/03/2018 | Duration: 36 Months 47
3 CONCLUSIONS
A monitoring methodology for the quantitative assessment of the performance of solutions and
instruments applicable in all S-PARCS Lighthouse Parks - potentially replicable in other
contexts - has been developed.
The methodology has been built upon a group of KPIs, which capture a wide variety of potential
effects of the solutions on the parks and allow a comprehensive assessment of performance.
KPIs have been selected following an extensive desk analysis according to criteria of
relevance, interpretability, timeliness, reliability, validity and materiality. Nevertheless, it is
acknowledged that the selected KPIs shall be carefully validated by the end-users of the
methodology and for this reason they may be subject to possible refinements in the near future.
Along with the calculation methodology, instructions for results representation and basic
interpretation are given. In addition, possibilities of weighting and of assessing performance of
multiple solutions have been described in order to enlarge the field of application of the
methodology itself.
The generalist nature of the methodology developed in task 4.1 well fit the objective of “Initial
Assessment Tool (IAT)” to be developed in S-PARCS, which will be able to serve industrial
park managers and companies within different countries. Moreover, a preliminary list of
necessary input data to deploy this methodology is presented in this document and
summarised in Annex I “Overview of KPIs”.
Furthermore, it is highlighted that the contents of this deliverable regarding the description of
KPIs are further expended and explored in task 4.2, which aims at providing a comprehensive
data collection framework for the KPIs. D4.2 shall thus be considered as the natural
prosecution of D4.1 and should be referred to for obtaining more detailed information about
KPIs calculation.
Finally, even if the suitable KPIs to evaluate the effects of the solutions proposed by S-PARCS
project have been presented according to different impact categories, as the Lighthouse Parks
have not yet identified the solution(s) to be investigated/implemented, the possibility of furtherly
tailoring the selection of KPIs based on the coupling solution-park is not excluded.

Project Start: 01/03/2018 | Duration: 36 Months 48
4 REFERENCES
[1] Global Reporting Initiative. (2011). Sustainability Reporting Guidelines.
[2] RICOH Group (2016). Sustainability Report – Integrated report.
[3] European Environmental Agency (2017). Environmental indicator report 2017 – In
support to the monitoring of the Seventh Action Programme. EEA Report N° 21/2017.
[4] European Parliament and Council. (2009). Regulation (EC) N° 1221/2009 on the
voluntary participation by organizations in a Community eco-management and audit
scheme (EMAS).
[5] Commission Regulation. (2017). Regulation (EU) N° 2017/1505 amending Annexes I, II
and III to Regulation (EC) No 1221/2009 of the European Parliament and of the Council
on the voluntary participation by organisations in a Community eco-management and
audit scheme (EMAS).
[6] Yang, Z., Hao, G., Cheng, Z. (2018). Investigating operations of industrial parks in
Beijing: efficiency at different stages. Economic Research.
[7] Festel, G., Wurmseher, M. (2013). Benchmarking of industrial park infrastructures in
Germany. Benchmarking: An International Journal.
[8] Tian, j., Liu, W., Lai, B., Li, X., Chen L. (2013). Study of the performance of eco-industrial
park development in China. Journal of Cleaner Production.
[9] Sudiana, K. (2017). Key performance indicators of science technology parks and
performance management practice of Bandung techno park.
[10] Valenzuela-Venegas, G., Salgado J. C., Díaz-Alvarado F. A. (2016). Sustainability
indicators for the assessment of eco-industrial parks: classification and criteria for
selection. Journal of Cleaner Production.
[11] S-Parcs European H2020 Project. (2018). D1.1 S-PRACS solution inventory.
[12] Al- Turki, U., Duffuaa, S. (2002). Performance measures for academic departments.
6th Saudi Engineering Conference.
[13] Kapoor, S., Meachem, A. (2012). Employee Engagement – A bond between
Employee and Organisation.
[14] Joshi, A., Kale, S., Chandel, S., Pal, D.K. (2015). Likert Scale: Explored and
Explained. SCIENCEDOMAIN International.
[15] European Commission (2013). Communication from the Commission to the European
Parliament, the Council, the European economic and social committee and the committee
of the regions “Together towards competitive and resource-efficient urban mobility”.
[16] European Parliament and Council. (2009). Directive 2009/28/EC on the promotion of
the use of energy from renewable sources.
[17] World Resources Institute and World Business Council for Sustainable Development.
(2011). Corporate Value Chain (Scope 3) Accounting and Reporting Standard.
Greenhouse Gas Protocol.

Project Start: 01/03/2018 | Duration: 36 Months 49
5 ANNEX I – OVERVIEW OF KPIs
Impact Category KPI Unit of Measure
Data needs Main data sources Monitoring protocol
Organizational KPIs
Staff involvement %
N° of employees involved in the implementation of the solution
Questionnaires, HR studies for the employees, at company level
Before implementation and every year after implementation
Stakeholder involvement %
N° of stakeholders involved in the implementation of the solution
Questionnaires for reference people of the companies, park managers studies
Before implementation and when changes are registered
Energy efficiency awareness Likert scale
Effects of the solution on the energy efficiency awareness level
Questionnaires, interviews for appointed people (park or company level)
Before implementation and every year after implementation
Financial and Economic KPIs
Normalized CAPEX %
CAPEX dedicated to solutions regarding energy cooperation issues and to all the other solutions implemented
Price quotations from manufacturers, installers and suppliers
Before implementation
Normalized net annual balance %
Annual economic balance related to the implementation of the solution for energy cooperation and all the other solutions
Price quotations from manufacturers, installers and suppliers, energy bills, personnel costs analysis, income analysis
Before implementation and every year after implementation

Project Start: 01/03/2018 | Duration: 36 Months 50
Impact Category KPI Unit of Measure
Data needs Main data sources Monitoring protocol
Normalized PBP (payback period) -
CAPEX and annual economic balance dedicated to solutions regarding energy cooperation and to all the other solutions implemented
See sources for normalized CAPEX and normalized net annual balance
Before implementation and every year after implementation
Normalized IRR (internal rate of return)
-
IRR of return for the implemented energy cooperation solution and for all the other implemented solutions
See sources for normalized CAPEX and normalized net annual balance
Before implementation and every year after implementation
Financial assistance from public entities
% Available funding opportunities
Tenders, reports of consulting entities
Before implementation
Marketing communication and opportunities
Likert scale Forms of marketing communication and opportunities
Analysis of communication/marketing departments at company or park level
Before implementation and every 3 years after implementation
Legal and Regulatory KPIs
Simplicity of bureaucratic steps Likert scale
Number, simplicity of steps requiring bureaucracy (i.e. permits)
Analysis of administrative departments at company or park level
Before implementation and every 3 years after implementation
Legal and regulatory feasibility Likert scale
Number, type of agreements and contracts (within and outside park boundaries)
Analysis of administrative departments at company or park level
Before implementation

Project Start: 01/03/2018 | Duration: 36 Months 51
Impact Category KPI Unit of Measure
Data needs Main data sources Monitoring protocol
Social KPIs
Replication potential Likert scale
Assessment of replication potential in other industrial parks
Experts consultation Before implementation
Job creation % N° of job places created/canceled by the solution
HR studies
Before implementation and every year after implementation
Impact on local development Likert scale Assessment of the impact of the solution outside the parks
Experts consultation, municipalities and local authorities consultation
Before implementation and every year after implementation
Benefits for human health and safety
Likert scale
Human health and safety benefits generated by the solution
Health and Safety experts consultation
Before implementation and every year after implementation
Benefits for sustainable mobility Likert scale Beneficial effects of the solution towards sustainable mobility
Experts consultation, municipalities and local authorities consultation
Before implementation and every 3 years after implementation
Environmental KPIs
Total annual water consumption liters/year or
m3/year
Annual water consumption of the entire park
Water bills and resource efficiency audits (company or park level), monitoring systems, specific studies
Before implementation and every year after implementation
Total annual waste generation kg/year Mass of solid waste generated by the entire park
Waste registers, waste traceability systems, resource efficiency audits, specific studies (company or park level)
Before implementation and every year after implementation

Project Start: 01/03/2018 | Duration: 36 Months 52
Impact Category KPI Unit of Measure
Data needs Main data sources Monitoring protocol
Annual by-products internal use kg/year
Mass of by-products both produced and exploited within the park
Resource efficiency audits, specific studies (company level)
Before implementation and every year after implementation
Total annual energy consumption MWh/year Total annual energy consumption
Energy bills, monitoring systems, energy audits, specific studies (company and park level)
Before implementation and every year after implementation
Total annual GHG emissions kgCO2e/year Mass of GHGs emitted by the park’s activities
Resource efficiency audits and energy audits, bills, fuel cards, specific studies, literature analysis, commercial software
Before implementation and every year after implementation
Renewable energy source share %
Renewable energy produced within the park and total energy consumption
Specifications of renewable energy production systems, monitoring systems, specific studies (park level)
Before implementation and every year after implementation
Total annual air emissions kg/year Mass of pollutants emitted
Metering systems, specific studies, fuel cards (company or park level)
Before implementation and every year after implementation
Reduction of indirect (Scope 3) GHG emissions
Likert scale
Basic identification of indirect (Scope 3) GHG emissions sources and information about their area of influence
Questionnaires and interviews to staff members, information from companies’ and parks’ managers on value chain activities, expert judgement
Before implementation and every 3 years after implementation

Project Start: 01/03/2018 | Duration: 36 Months 53
Impact Category KPI Unit of Measure
Data needs Main data sources Monitoring protocol
Technical KPIs
Thermal energy recovery %/year
Amount of thermal energy recovered and total amount of thermal energy consumed
Energy bills, monitoring systems, energy audits, specific studies (company and park level)
Before implementation and every year after implementation
Technical feasibility Likert scale Assessment of technical feasibility
Indications from suppliers and installers,
Before implementation
Annual uniformity Likert scale Uniformity of performance of the solution in time
Assessment from appointed people within the park and companies, based on expert judgement
Before implementation and every year after implementation

Project Start: 01/03/2018 | Duration: 36 Months 54
6 ANNEX II – GUIDELINE FOR APPLICATION
To be repeated for each impact category.
Overall representation of results after having assessed the performance for all the impact categories.
Selection of impact category
•Impact categories' list - section 2.2
Selection of KPIs
•KPIs' list - section 2.2
•Definition of class and type of each KPI -section 2.3.1
•Minimum requirements - section 2.3.6
Data collection
•Data collection at company and park level -section 2.2
Calculation of KPIs
•Assumptions and guidelines -section 2.1
Calculation of performance
terms
•Different equations according to class and type of each KPI -sections 2.3.2, 2.3.3
Overall performance assessment
•Equations - section 2.3.4
•Minimum requirements - section 2.3.6
•Weighting and muliple solutions - section 2.3.7

Project Start: 01/03/2018 | Duration: 36 Months 55
7 ANNEX III – CROSS-MATCHING BETWEEN SOLUTIONS AND KPIs
The following cross-matching exercise consists in associating to each solution the KPIs that are relevant and respect the materiality principle for that
solution.
Sta
ff in
vo
lvem
en
t
Sta
keh
old
er
invo
lvem
en
t
En
erg
y e
ffic
ien
cy a
ware
ness
No
rmalized
CA
PE
X
No
rmalized
net
an
nu
al b
ala
nce
No
rmalized
PB
P
No
rmalized
IR
R
Assis
tan
ce P
A
Mark
eti
ng
an
d
co
mm
un
icati
on
op
po
rtu
nit
ies
Sim
plic
ity o
f b
ure
au
cra
tic
ste
ps
Leg
al an
d r
eg
ula
tory
fea
sib
ilit
y
O1 O2 O3 FE1 FE2 FE3 FE4 FE5 FE6 LR1 LR2
Installation of RES plants x x x x x x x x x x
Joint biomass based CHP x x x x x x x x x x
District heating between the park premises
x x x x x x x x x x x
District heating linking to existing network serving local community
x x x x x x x x x x
New district heating network x x x x x x x x x x

Project Start: 01/03/2018 | Duration: 36 Months 56
Sta
ff in
vo
lvem
en
t
Sta
keh
old
er
invo
lvem
en
t
En
erg
y e
ffic
ien
cy a
ware
ness
No
rmalized
CA
PE
X
No
rmalized
net
an
nu
al b
ala
nce
No
rmalized
PB
P
No
rmalized
IR
R
Assis
tan
ce P
A
Mark
eti
ng
an
d
co
mm
un
icati
on
op
po
rtu
nit
ies
Sim
plic
ity o
f b
ure
au
cra
tic
ste
ps
Leg
al an
d r
eg
ula
tory
fea
sib
ilit
y
O1 O2 O3 FE1 FE2 FE3 FE4 FE5 FE6 LR1 LR2
Joint investment in energy efficiency
x x x x x x x x x x x
Electricity production from WH x x x x x x x x x x
Electrical storage installations x x x x x x x x x x
Thermal storage installations x x x x x x x x x x
Joint reactive power compensation
x
x x x x x x x x
Joint sustainable/self-produced fuel
x x x x x x x x x x x
Joint heat pumps for district heating purposes via power-to-heat
x x x x x x x x x x

Project Start: 01/03/2018 | Duration: 36 Months 57
Sta
ff in
vo
lvem
en
t
Sta
keh
old
er
invo
lvem
en
t
En
erg
y e
ffic
ien
cy a
ware
ness
No
rmalized
CA
PE
X
No
rmalized
net
an
nu
al b
ala
nce
No
rmalized
PB
P
No
rmalized
IR
R
Assis
tan
ce P
A
Mark
eti
ng
an
d
co
mm
un
icati
on
op
po
rtu
nit
ies
Sim
plic
ity o
f b
ure
au
cra
tic
ste
ps
Leg
al an
d r
eg
ula
tory
fea
sib
ilit
y
O1 O2 O3 FE1 FE2 FE3 FE4 FE5 FE6 LR1 LR2
Waste heat recovery via heat pumps and/or heat exchanger
x x x x x x x x x x
Realisation of a Smart Grid within the park premises
x x x x x x x x x x x
Joint purchase of monitoring equipment
x x x x x x x x x x
Demand response schemes x x x x x x x x x x x
Energy management System at industry/park level
x x x x x x x x x x x
Shared central servers x x x x x x x x x
Joint fleet for employees to reach the park
x x x x x x x x x x x

Project Start: 01/03/2018 | Duration: 36 Months 58
Sta
ff in
vo
lvem
en
t
Sta
keh
old
er
invo
lvem
en
t
En
erg
y e
ffic
ien
cy a
ware
ness
No
rmalized
CA
PE
X
No
rmalized
net
an
nu
al b
ala
nce
No
rmalized
PB
P
No
rmalized
IR
R
Assis
tan
ce P
A
Mark
eti
ng
an
d
co
mm
un
icati
on
op
po
rtu
nit
ies
Sim
plic
ity o
f b
ure
au
cra
tic
ste
ps
Leg
al an
d r
eg
ula
tory
fea
sib
ilit
y
O1 O2 O3 FE1 FE2 FE3 FE4 FE5 FE6 LR1 LR2
Joint car pooling x x x
x x x
Joint electic vehicles / H2 based fleet
x x x x x x x x x x x
Shared charging points for electric H2 vehicles
x x x x x x x x x x x
Shared office buildings x x x x x x x x x x x
Joint logistics x x x x x x x x x
Common energy audits x x x
x x x
Joint use of CHP x x x x x x x x x x
Joint energy manager x x
x
x x x

Project Start: 01/03/2018 | Duration: 36 Months 59
Sta
ff in
vo
lvem
en
t
Sta
keh
old
er
invo
lvem
en
t
En
erg
y e
ffic
ien
cy a
ware
ness
No
rmalized
CA
PE
X
No
rmalized
net
an
nu
al b
ala
nce
No
rmalized
PB
P
No
rmalized
IR
R
Assis
tan
ce P
A
Mark
eti
ng
an
d
co
mm
un
icati
on
op
po
rtu
nit
ies
Sim
plic
ity o
f b
ure
au
cra
tic
ste
ps
Leg
al an
d r
eg
ula
tory
fea
sib
ilit
y
O1 O2 O3 FE1 FE2 FE3 FE4 FE5 FE6 LR1 LR2
Clustering of common processes
x x x x x x x x x x x
Common buildings design x x x x x x x x x x
Matching companies according to energy/material demand and production
x x x x x
x x x
Joint emergency plan of the area
x x
x
x x
Exploitation of one plant's by-products in other plant(s) - Industrial symbiosis
x x x x x x x x x x
Joint waste management and disposal
x x
x
x x x

Project Start: 01/03/2018 | Duration: 36 Months 60
Sta
ff in
vo
lvem
en
t
Sta
keh
old
er
invo
lvem
en
t
En
erg
y e
ffic
ien
cy a
ware
ness
No
rmalized
CA
PE
X
No
rmalized
net
an
nu
al b
ala
nce
No
rmalized
PB
P
No
rmalized
IR
R
Assis
tan
ce P
A
Mark
eti
ng
an
d
co
mm
un
icati
on
op
po
rtu
nit
ies
Sim
plic
ity o
f b
ure
au
cra
tic
ste
ps
Leg
al an
d r
eg
ula
tory
fea
sib
ilit
y
O1 O2 O3 FE1 FE2 FE3 FE4 FE5 FE6 LR1 LR2
Joint organic waste treatment energy valorisation
x
x x x x x x x x
Joint sewage water treatment and valorisation
x
x x x x x
x x
Biogas production in wastewater treatment plants
x x x x x x x x
Joint purchase of electricity x x x x x x x
Joint purchase of energy carriers (gas/fuel/wood)
x
x x x
x x x
Joint purchase of raw materials x x x x x
x x x
Joint insurance provider x x
x x x
x x x
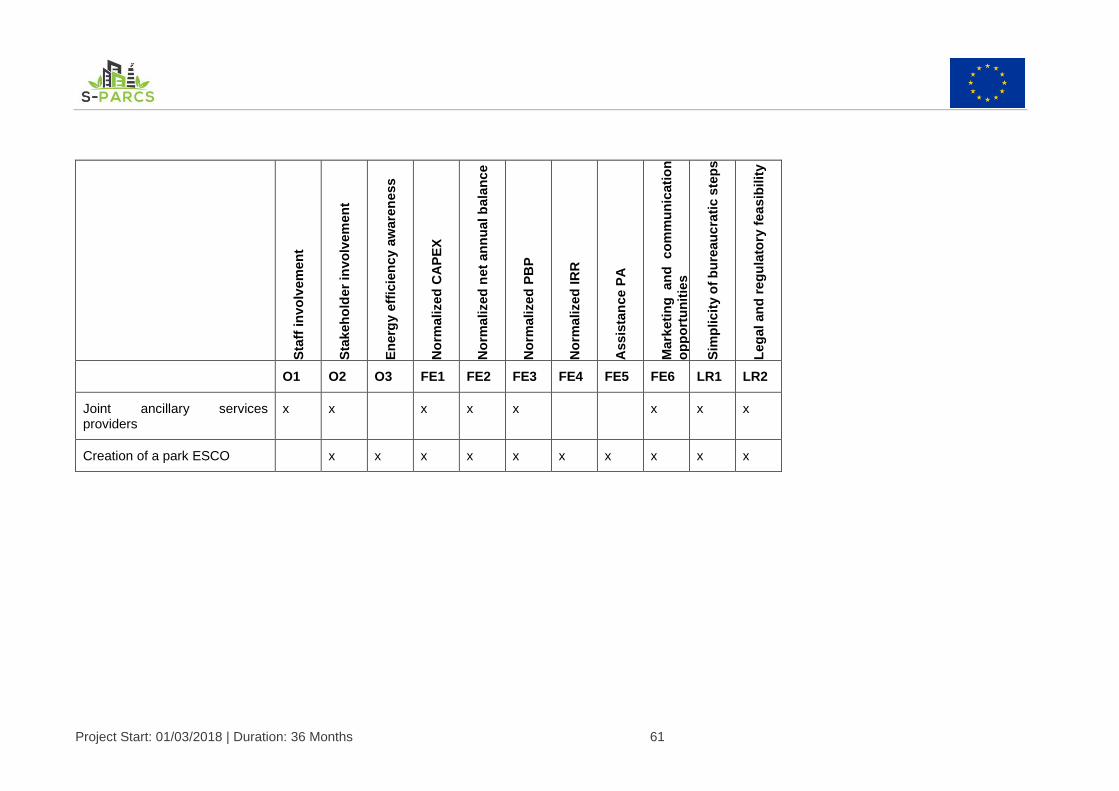
Project Start: 01/03/2018 | Duration: 36 Months 61
Sta
ff in
vo
lvem
en
t
Sta
keh
old
er
invo
lvem
en
t
En
erg
y e
ffic
ien
cy a
ware
ness
No
rmalized
CA
PE
X
No
rmalized
net
an
nu
al b
ala
nce
No
rmalized
PB
P
No
rmalized
IR
R
Assis
tan
ce P
A
Mark
eti
ng
an
d
co
mm
un
icati
on
op
po
rtu
nit
ies
Sim
plic
ity o
f b
ure
au
cra
tic
ste
ps
Leg
al an
d r
eg
ula
tory
fea
sib
ilit
y
O1 O2 O3 FE1 FE2 FE3 FE4 FE5 FE6 LR1 LR2
Joint ancillary services providers
x x
x x x
x x x
Creation of a park ESCO x x x x x x x x x x

Project Start: 01/03/2018 | Duration: 36 Months 62
Rep
licati
on
po
ten
tia
l
Jo
b c
reati
on
Imp
act
on
lo
cal d
ev
elo
pm
en
t
Hu
man
HS
Ben
efi
ts f
or
su
sta
inab
le
mo
bilit
y
To
tal an
nu
al w
ate
r
co
nsu
mp
tio
n
To
tal an
nu
al w
aste
gen
era
tio
n
An
nu
al b
y-p
rod
uct
inte
rnal u
se
An
nu
al en
erg
y c
on
su
mp
tio
n
To
tal an
nu
al G
HG
em
issio
ns
RE
S s
ha
re
To
tal an
nu
al air
em
iss
ion
s
Red
ucti
on
of
ind
ire
ct
(Sc
op
e 3
)
GH
G e
mis
sio
ns
Th
erm
al
en
erg
y r
eco
very
Tech
nic
al
feas
ibilit
y
An
nu
al u
nif
orm
ity
S1 S2 S3 S4 S5 E1 E2 E3 E4 E5 E6 E7 E8 T1 T2 T3
Installation of RES plants x x x x x x x x
x x
Joint biomass based CHP x x x x
x x x x x x x
x x x
District heating between the park premises
x x x x
x
x x x x
x x x
District heating linking to existing network serving local community
x x x x
x
x x x x
x x x
New district heating network x x x x
x
x x x x
x x x
Joint investment in energy efficiency
x x x x x x x
x x x x x x x x
Electricity production from WH x x x x x x
x x
x
x x x

Project Start: 01/03/2018 | Duration: 36 Months 63
Rep
licati
on
po
ten
tia
l
Jo
b c
reati
on
Imp
act
on
lo
cal d
ev
elo
pm
en
t
Hu
man
HS
Ben
efi
ts f
or
su
sta
inab
le
mo
bilit
y
To
tal an
nu
al w
ate
r
co
nsu
mp
tio
n
To
tal an
nu
al w
aste
gen
era
tio
n
An
nu
al b
y-p
rod
uct
inte
rnal u
se
An
nu
al en
erg
y c
on
su
mp
tio
n
To
tal an
nu
al G
HG
em
issio
ns
RE
S s
ha
re
To
tal an
nu
al air
em
iss
ion
s
Red
ucti
on
of
ind
ire
ct
(Sc
op
e 3
)
GH
G e
mis
sio
ns
Th
erm
al
en
erg
y r
eco
very
Tech
nic
al
feas
ibilit
y
An
nu
al u
nif
orm
ity
S1 S2 S3 S4 S5 E1 E2 E3 E4 E5 E6 E7 E8 T1 T2 T3
Electrical storage installations x x x x
x x x x
x x
Thermal storage installations x x x x
x x x x
x x
Joint reactive power compensation
x x
x
x x
x
x
Joint sustainable/self-produced fuel
x x - x x x
x x x x x
x x
Joint heat pumps for district heating purposes via power-to-heat
x x x x
x
x x x x
x x x
Waste heat recovery via heat pumps and/or heat exchanger
x x x x x x x x x x x

Project Start: 01/03/2018 | Duration: 36 Months 64
Rep
licati
on
po
ten
tia
l
Jo
b c
reati
on
Imp
act
on
lo
cal d
ev
elo
pm
en
t
Hu
man
HS
Ben
efi
ts f
or
su
sta
inab
le
mo
bilit
y
To
tal an
nu
al w
ate
r
co
nsu
mp
tio
n
To
tal an
nu
al w
aste
gen
era
tio
n
An
nu
al b
y-p
rod
uct
inte
rnal u
se
An
nu
al en
erg
y c
on
su
mp
tio
n
To
tal an
nu
al G
HG
em
issio
ns
RE
S s
ha
re
To
tal an
nu
al air
em
iss
ion
s
Red
ucti
on
of
ind
ire
ct
(Sc
op
e 3
)
GH
G e
mis
sio
ns
Th
erm
al
en
erg
y r
eco
very
Tech
nic
al
feas
ibilit
y
An
nu
al u
nif
orm
ity
S1 S2 S3 S4 S5 E1 E2 E3 E4 E5 E6 E7 E8 T1 T2 T3
Realisation of a Smart Grid within the park premises
x x x x x x x x x x x x x x
Joint purchase of monitoring equipment
x x
x
x
x x x x
x
Demand response schemes x x
x
x x x x x
x x
Energy management System at industry/park level
x x
x
x
x x x x
x x
Shared central servers x x
x x x
Joint fleet for employees to reach the park
x x x x x x x x x x
Joint car pooling x
x x x
x x
x x
x

Project Start: 01/03/2018 | Duration: 36 Months 65
Rep
licati
on
po
ten
tia
l
Jo
b c
reati
on
Imp
act
on
lo
cal d
ev
elo
pm
en
t
Hu
man
HS
Ben
efi
ts f
or
su
sta
inab
le
mo
bilit
y
To
tal an
nu
al w
ate
r
co
nsu
mp
tio
n
To
tal an
nu
al w
aste
gen
era
tio
n
An
nu
al b
y-p
rod
uct
inte
rnal u
se
An
nu
al en
erg
y c
on
su
mp
tio
n
To
tal an
nu
al G
HG
em
issio
ns
RE
S s
ha
re
To
tal an
nu
al air
em
iss
ion
s
Red
ucti
on
of
ind
ire
ct
(Sc
op
e 3
)
GH
G e
mis
sio
ns
Th
erm
al
en
erg
y r
eco
very
Tech
nic
al
feas
ibilit
y
An
nu
al u
nif
orm
ity
S1 S2 S3 S4 S5 E1 E2 E3 E4 E5 E6 E7 E8 T1 T2 T3
Joint electic vehicles / H2 based fleet
x
x x x
x x x x x
x
Shared charging points for electric H2 vehicles
x x x x x
x x x x x
x
Shared office buildings x x
x
x x
x x
x x
x
Joint logistics x x x x x x x x x x x x
Common energy audits x x x x x x x x x x x x
Joint use of CHP x x
x
x x
x x x x
x x
Joint energy manager x x
x x
x
Clustering of common processes
x x
x
x x x x x
x x x x

Project Start: 01/03/2018 | Duration: 36 Months 66
Rep
licati
on
po
ten
tia
l
Jo
b c
reati
on
Imp
act
on
lo
cal d
ev
elo
pm
en
t
Hu
man
HS
Ben
efi
ts f
or
su
sta
inab
le
mo
bilit
y
To
tal an
nu
al w
ate
r
co
nsu
mp
tio
n
To
tal an
nu
al w
aste
gen
era
tio
n
An
nu
al b
y-p
rod
uct
inte
rnal u
se
An
nu
al en
erg
y c
on
su
mp
tio
n
To
tal an
nu
al G
HG
em
issio
ns
RE
S s
ha
re
To
tal an
nu
al air
em
iss
ion
s
Red
ucti
on
of
ind
ire
ct
(Sc
op
e 3
)
GH
G e
mis
sio
ns
Th
erm
al
en
erg
y r
eco
very
Tech
nic
al
feas
ibilit
y
An
nu
al u
nif
orm
ity
S1 S2 S3 S4 S5 E1 E2 E3 E4 E5 E6 E7 E8 T1 T2 T3
Common buildings design x
x
x
Matching companies according to energy/material demand and production
x x
x x x x x x x
x
x x
Joint emergency plan of the area
x
Exploitation of one plant's by-products in other plant(s) - Industrial symbiosis
x x
x
x x x x
x
x x
Joint waste management and disposal
x x x x
x x
x
x
Joint organic waste treatment energy valorisation
x x x x
x x x x x
x

Project Start: 01/03/2018 | Duration: 36 Months 67
Rep
licati
on
po
ten
tia
l
Jo
b c
reati
on
Imp
act
on
lo
cal d
ev
elo
pm
en
t
Hu
man
HS
Ben
efi
ts f
or
su
sta
inab
le
mo
bilit
y
To
tal an
nu
al w
ate
r
co
nsu
mp
tio
n
To
tal an
nu
al w
aste
gen
era
tio
n
An
nu
al b
y-p
rod
uct
inte
rnal u
se
An
nu
al en
erg
y c
on
su
mp
tio
n
To
tal an
nu
al G
HG
em
issio
ns
RE
S s
ha
re
To
tal an
nu
al air
em
iss
ion
s
Red
ucti
on
of
ind
ire
ct
(Sc
op
e 3
)
GH
G e
mis
sio
ns
Th
erm
al
en
erg
y r
eco
very
Tech
nic
al
feas
ibilit
y
An
nu
al u
nif
orm
ity
S1 S2 S3 S4 S5 E1 E2 E3 E4 E5 E6 E7 E8 T1 T2 T3
Joint sewage water treatment and valorisation
x x x
x x
x
Biogas production in wastewater treatment plants
x x x x x x x x
Joint purchase of electricity x x
Joint purchase of energy carriers (gas/fuel/wood)
x x
x
Joint purchase of raw materials x x
x
Joint insurance provider x x
Joint ancillary services providers x x
x
Creation of a park ESCO x x x x x x x x x x

Project Start: 01/03/2018 | Duration: 36 Months 68
Related Documents