IEEE TRANSACTIONS ON BIOMEDICAL ENGINEERING, VOL. 52, NO. 4, APRIL 2005 599 Methodological Principles of T Wave Alternans Analysis: A Unified Framework Juan Pablo Martínez* and Salvador Olmos, Member, IEEE Abstract—Visible T wave alternans (TWA) in the electrocardio- gram (ECG) had been regarded as an infrequent phenomenon during the first 80 years of electrocardiography. Nevertheless, computerized analysis changed this perception. In the last two decades, a variety of techniques for automatic TWA analysis have been proposed. These techniques have allowed researchers to detect nonvisible TWA in a wide variety of clinical and experi- mental conditions. Such studies have recently shown that TWA is related to cardiac instability and increased arrhythmogenicity. Comparison of TWA analysis methods is a difficult task due to the diversity of approaches. In this paper, we propose a unified framework which holds the existing methods. In the light of this framework, the methodological principles of the published TWA analysis schemes are compared and discussed. This framework may have an important role to develop new approaches to this problem. Index Terms—Detection, estimation, framework, T wave alter- nans. I. INTRODUCTION T -WAVE ALTERNANS (TWA), also called repolarization alternans, is a phenomenon appearing in the electrocar- diogram (ECG) as a consistent fluctuation in the repolarization morphology on an every-other-beat basis. Since the first cases of TWA reported at the beginning of the 20th century [1], [2], the interest for this phenomenon has continued in the subse- quent decades [3]–[5], but it was generally considered as a rare finding. It was not until the 1980s, when Adam et al. measured nonvisible (microvolt-level) alternans with the aid of a computer [6]–[8], that subtle TWA was shown to be much more common than visible TWA. Since then, TWA has been related to electrical disorder and high risk of sudden cardiac death during pacing [9], stress tests [10], coronary angioplasty [11] or ambulatory recordings [12], associated with a wide range of pathological conditions such as long QT syndrome (LQTS) [13], myocardial ischemia [12], in- farction [14], Printzmetal angina [15], dilated cardiomyopathy [16] and others [17]. It has also been found in some healthy sub- jects, always at elevated heart rate [18]–[20]. Manuscript received January 15, 2004; revised August 29, 2004. This work was supported in part by grants TEC2004-05263-C02-02/TCM from Ministerio de Ciencia y Tecnología (Spain), PI04/0689, PI04/1795 from Fondo de Investi- gaciones Sanitarias and P075/2001 from Autonomous Government of Aragon. Asterisk indicates corresponding author. *J. P. Martínez is with the Communications Technology Group, Aragon Insti- tute of Engineering Research, University of Zaragoza. María de Luna, 1, 50018 Zaragoza, Spain (e-mail [email protected]). S. Olmos is with the Communications Technology Group, Aragon Institute of Engineering Research, University of Zaragoza. 50018 Zaragoza, Spain. Digital Object Identifier 10.1109/TBME.2005.844025 In the last two decades, a variety of analysis methods have been proposed to automatically detect and estimate TWA in the ECG [9], [17], [21]–[33], ranging from the widely-used spec- tral method to some recently presented nonlinear methods. In the cited references, methods are described as a concatenation of procedures (filters, transforms, decision rules, ). The per- formance of such procedures depends on design parameters and heuristic rules, which are usually not optimized, but selected ad-hoc from the designer’s experience. This fact, together with the diversity of approaches, make comparison of methods a dif- ficult task. The need for a methodological systematization effort is, thus, established. A unified framework valid for all existing methods but general enough to hold other possible approaches would permit proper characterization and comparison of each method’s constituting stages, allowing the explanation of the observed performance differences. The conclusions would be then generalizable, providing valuable and solid information for future algorithm design. We are not aware that such effort has been done up to now. Whereas the published TWA literature contains extensive re- views on TWA physiological mechanisms [34], [35] and clin- ical impact [36]–[40], only brief reviews of the first published methods can be found on the methodological side [36]–[38], [41]. They include some discussion about their performance, based on published results obtained under heterogeneous con- ditions. Other works, such as [23], [27], [42] perform a direct comparison of different methods over the same clinical or sim- ulated dataset, but they do not tackle the problem of parameter choice. This paper aims to provide a methodological overview of the different approaches to TWA analysis and is outlined as follows: In Section II, a brief historical panorama of TWA methods is de- picted. In Section III, we establish a unified framework for TWA analysis. Section IV is dedicated to review, compare and discuss the implementations of each of the stages of the proposed gen- eral structure. Finally some considerations about validation are expressed in Section V, and conclusions are given in Section VI. II. A HISTORICAL OVERVIEW OF TWA ANALYSIS METHODS We present next the different approaches which, to our knowl- edge, have been proposed for automatic TWA analysis. 1) The Beginnings; Energy Spectral Method (ESM): The first quantitative studies relating TWA with myocardial insta- bility were published by Adam et al. in 1981–1984 [6]–[8]. The underlying idea was that alternans is usually observed as a 0.5 cycles-per-beat (cpb) fluctuation in the beat-to-beat measured T wave energy. TWA magnitude was measured as 0018-9294/$20.00 © 2005 IEEE

Welcome message from author
This document is posted to help you gain knowledge. Please leave a comment to let me know what you think about it! Share it to your friends and learn new things together.
Transcript
IEEE TRANSACTIONS ON BIOMEDICAL ENGINEERING, VOL. 52, NO. 4, APRIL 2005 599
Methodological Principles of T Wave AlternansAnalysis: A Unified Framework
Juan Pablo Martínez* and Salvador Olmos, Member, IEEE
Abstract—Visible T wave alternans (TWA) in the electrocardio-gram (ECG) had been regarded as an infrequent phenomenonduring the first 80 years of electrocardiography. Nevertheless,computerized analysis changed this perception. In the last twodecades, a variety of techniques for automatic TWA analysis havebeen proposed. These techniques have allowed researchers todetect nonvisible TWA in a wide variety of clinical and experi-mental conditions. Such studies have recently shown that TWAis related to cardiac instability and increased arrhythmogenicity.Comparison of TWA analysis methods is a difficult task due tothe diversity of approaches. In this paper, we propose a unifiedframework which holds the existing methods. In the light of thisframework, the methodological principles of the published TWAanalysis schemes are compared and discussed. This frameworkmay have an important role to develop new approaches to thisproblem.
Index Terms—Detection, estimation, framework, T wave alter-nans.
I. INTRODUCTION
T -WAVE ALTERNANS (TWA), also called repolarizationalternans, is a phenomenon appearing in the electrocar-
diogram (ECG) as a consistent fluctuation in the repolarizationmorphology on an every-other-beat basis. Since the first casesof TWA reported at the beginning of the 20th century [1], [2],the interest for this phenomenon has continued in the subse-quent decades [3]–[5], but it was generally considered as a rarefinding. It was not until the 1980s, when Adam et al. measurednonvisible (microvolt-level) alternans with the aid of a computer[6]–[8], that subtle TWA was shown to be much more commonthan visible TWA.
Since then, TWA has been related to electrical disorder andhigh risk of sudden cardiac death during pacing [9], stress tests[10], coronary angioplasty [11] or ambulatory recordings [12],associated with a wide range of pathological conditions such aslong QT syndrome (LQTS) [13], myocardial ischemia [12], in-farction [14], Printzmetal angina [15], dilated cardiomyopathy[16] and others [17]. It has also been found in some healthy sub-jects, always at elevated heart rate [18]–[20].
Manuscript received January 15, 2004; revised August 29, 2004. This workwas supported in part by grants TEC2004-05263-C02-02/TCM from Ministeriode Ciencia y Tecnología (Spain), PI04/0689, PI04/1795 from Fondo de Investi-gaciones Sanitarias and P075/2001 from Autonomous Government of Aragon.Asterisk indicates corresponding author.
*J. P. Martínez is with the Communications Technology Group, Aragon Insti-tute of Engineering Research, University of Zaragoza. María de Luna, 1, 50018Zaragoza, Spain (e-mail [email protected]).
S. Olmos is with the Communications Technology Group, Aragon Instituteof Engineering Research, University of Zaragoza. 50018 Zaragoza, Spain.
Digital Object Identifier 10.1109/TBME.2005.844025
In the last two decades, a variety of analysis methods havebeen proposed to automatically detect and estimate TWA in theECG [9], [17], [21]–[33], ranging from the widely-used spec-tral method to some recently presented nonlinear methods. Inthe cited references, methods are described as a concatenationof procedures (filters, transforms, decision rules, ). The per-formance of such procedures depends on design parameters andheuristic rules, which are usually not optimized, but selectedad-hoc from the designer’s experience. This fact, together withthe diversity of approaches, make comparison of methods a dif-ficult task.
The need for a methodological systematization effort is,thus, established. A unified framework valid for all existingmethods but general enough to hold other possible approacheswould permit proper characterization and comparison of eachmethod’s constituting stages, allowing the explanation of theobserved performance differences. The conclusions would bethen generalizable, providing valuable and solid informationfor future algorithm design.
We are not aware that such effort has been done up to now.Whereas the published TWA literature contains extensive re-views on TWA physiological mechanisms [34], [35] and clin-ical impact [36]–[40], only brief reviews of the first publishedmethods can be found on the methodological side [36]–[38],[41]. They include some discussion about their performance,based on published results obtained under heterogeneous con-ditions. Other works, such as [23], [27], [42] perform a directcomparison of different methods over the same clinical or sim-ulated dataset, but they do not tackle the problem of parameterchoice.
This paper aims to provide a methodological overview of thedifferent approaches to TWA analysis and is outlined as follows:In Section II, a brief historical panorama of TWA methods is de-picted. In Section III, we establish a unified framework for TWAanalysis. Section IV is dedicated to review, compare and discussthe implementations of each of the stages of the proposed gen-eral structure. Finally some considerations about validation areexpressed in Section V, and conclusions are given in Section VI.
II. A HISTORICAL OVERVIEW OF TWA ANALYSIS METHODS
We present next the different approaches which, to our knowl-edge, have been proposed for automatic TWA analysis.
1) The Beginnings; Energy Spectral Method (ESM): Thefirst quantitative studies relating TWA with myocardial insta-bility were published by Adam et al. in 1981–1984 [6]–[8].The underlying idea was that alternans is usually observedas a 0.5 cycles-per-beat (cpb) fluctuation in the beat-to-beatmeasured T wave energy. TWA magnitude was measured as
0018-9294/$20.00 © 2005 IEEE
600 IEEE TRANSACTIONS ON BIOMEDICAL ENGINEERING, VOL. 52, NO. 4, APRIL 2005
the periodogram evaluated at 0.5 cpb of the normalized T waveenergy series minus an estimate of the spectral backgroundnoise.
2) Spectral Method (SM): The SM was proposed in 1988by Smith et al. [17] as a more elaborated version of the ESM.In the SM, digitized ECG beats are aligned, and periodogram-based power spectral estimates are computed for each samplein the segment of interest. The value of an aggregate spectrumat 0.5 cpb is compared with the spectral noise level to decideif TWA is present. A slightly modified version was presentedby the same group in 1994 [9]. Since then, it has been exten-sively used for clinical research [16], [43]–[46]. It is included incommercial equipments, such as CH2000 and Heartwave (Cam-bridge Heart Inc, Bedford, MA).
3) Complex Demodulation Method (CD): The CD was pre-sented in 1991 by Nearing and Verrier [21] as an alternative tothe SM, allowing dynamic tracking of TWA. A more detaileddescription was given in [22]. In this method, the beats are alsoaligned, and TWA is modeled in each series as a sinusoidalsignal of frequency and variable amplitude andphase. TWA amplitude in each beat-to-beat series is estimatedby demodulation of the 0.5-cpb component. This method hasbeen used in several clinical studies during ischemia [12], [47].
4) Correlation Method (CM): A rather different time-domain approach to TWA analysis was proposed by Burat-tini and coworkers in 1997 [23]–[25]. Two main differencesarise with respect to the previous ones: a) the ST-T complexis jointly analyzed, reducing all the available information ineach beat to a single cross-correlation coefficient, and b) thesingle beat-to-beat series of coefficients is analyzed using atime-domain zero-crossing counter. The CM has been used tostudy TWA in coronary artery disease and LQTS [48].
5) Karhunen-Loève Transform (KLT): The truncated KLThas been used to compact the energy of the ST-T complex ina reduced number of coefficients. Two proposals have made useof this transform: the first method, by Laguna et al. [26] in 1996,reduced each ST-T complex to the first four coefficients of theKLT. Then, each beat-to-beat series of coefficients was spec-trally analyzed by means of the periodogram (KLSM). Thismethod was tested in ambulatory ischemia records [26]. TheKLT was also used by our group in 2000 [27], but analyzingthe resulting coefficient series by means of complex demodula-tion (KLCD).
6) Capon Filtering Method (CF): CF was also proposed in[27] as a variant of the CD. In CD, an a priori designed low-passfilter is used to discern the demodulated alternant componentfrom nondesired components. In CF, a FIR filter that minimizesthe power of the output signal while preserving the alternantcomponent is applied instead of an invariant low-pass filter. Theoptimal Capon filter depends on the autocorrelation function ofthe input signal [49].
7) Poincaré Mapping Method (PM): Poincaré Maps areused to analyze dynamic systems showing periodicity. In2002, this technique was proposed for TWA analysis by Stru-millo and Ruta [28]. For each sample in the ST-T complex, aPoincaré map is obtained by representing pairs of consecutivebeat-to-beat differences in the phase space. Alternans is iden-tified when two clusters of points are present in the Poincaré
maps and is measured in terms of the distance between thecentroids of even and odd points.
8) Periodicity Transform Method (PT): Srikanth et al. [29]proposed in 2002 a new approach for TWA detection based onthe Periodicity Transform [50]. The technique is applied to thebeat-to-beat series of some T wave features, such as peak am-plitude, area or variance. This method computes the energy ofthe orthogonal projection of each series in the subspace of se-quences with 2-beat periodicity.
9) Statistical Tests Method (ST): The same authors pre-sented, also in 2002, an alternative approach based on threestatistical tests [30]: Student’s tests for independent and pairedsamples to test the differences between T wave features in oddand even beats, and Rayleigh’s test for periodicity.
10) Modified Moving Average Method (MMA): In 2002,MMA was proposed by the authors of CD as a more robustanalysis approach [31]. The time-domain analysis procedureconsists of continuously computing a recursive running averageof odd and even beats, where a limiting nonlinearity is appliedto the innovation of every new beat to avoid the effect ofimpulsive artifacts. Since its publication, it has been used toassess risk in post myocardial infarction patients [14] and inpatients with implantable cardioverter defibrillators [20]. It isincluded in commercial equipment such as CASE-8000 (GEMedical Systems, Milwaukee, WI).
11) Laplacian Likelihood Ratio Method (LLR): In 2002, wepresented a detection theoretical approach to TWA detection[32], [33]. Given a signal model including alternans and noiseterms, the maximum likelihood estimator (MLE) and the gen-eralized likelihood ratio test (GLRT) [51] can be derived foralternans estimation and detection, respectively. The physio-logical noise was shown to be leptokurtic: that is, the tails ofthe distribution are heavier than those of a normal distribution,and therefore, we proposed a Laplacian noise model. The MLEand GLRT for this model are based on median filters. In [33]the model was extended to account for nonstationary noise.The LLR has been used to robustly detect TWA in patientsundergoing coronary angioplasty [52].
12) Other Proposals: Besides the earlier reported methods,Nearing and Verrier also mentioned in 1996 [36], [53] estima-tion-by-subtraction, least squares estimation and parametric es-pectral estimation (AR and ARM) as possible techniques forTWA analysis, but their implementation has not been reported.
III. GENERAL STRUCTURE
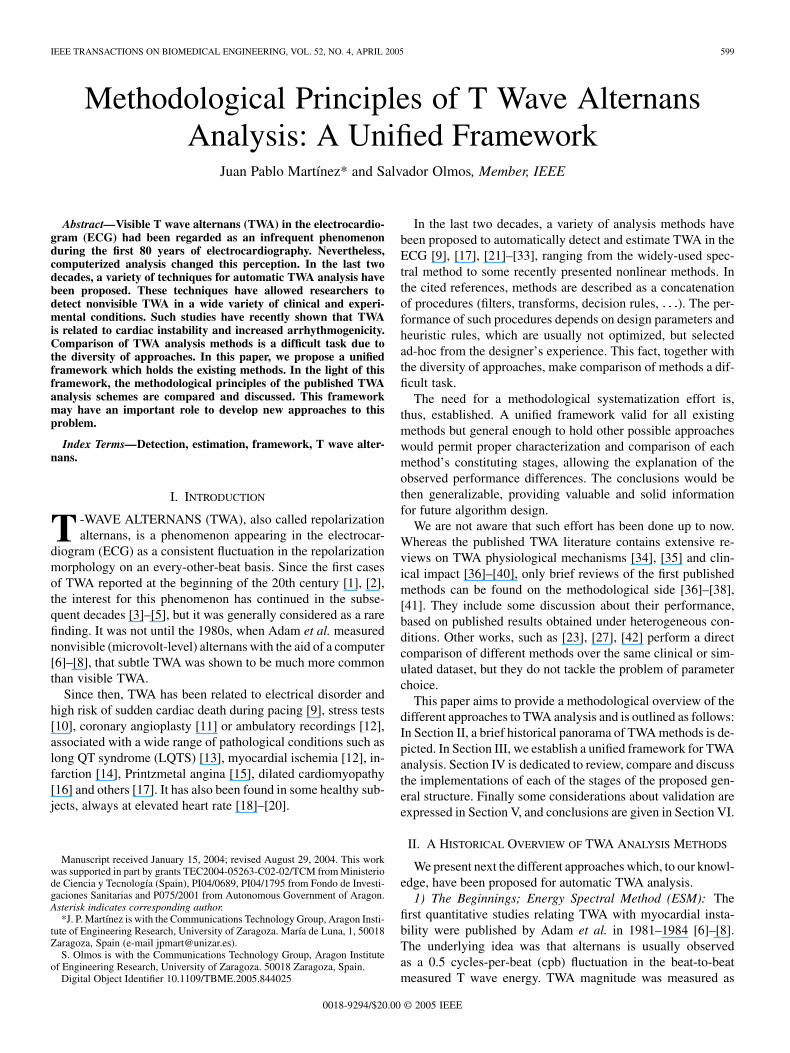
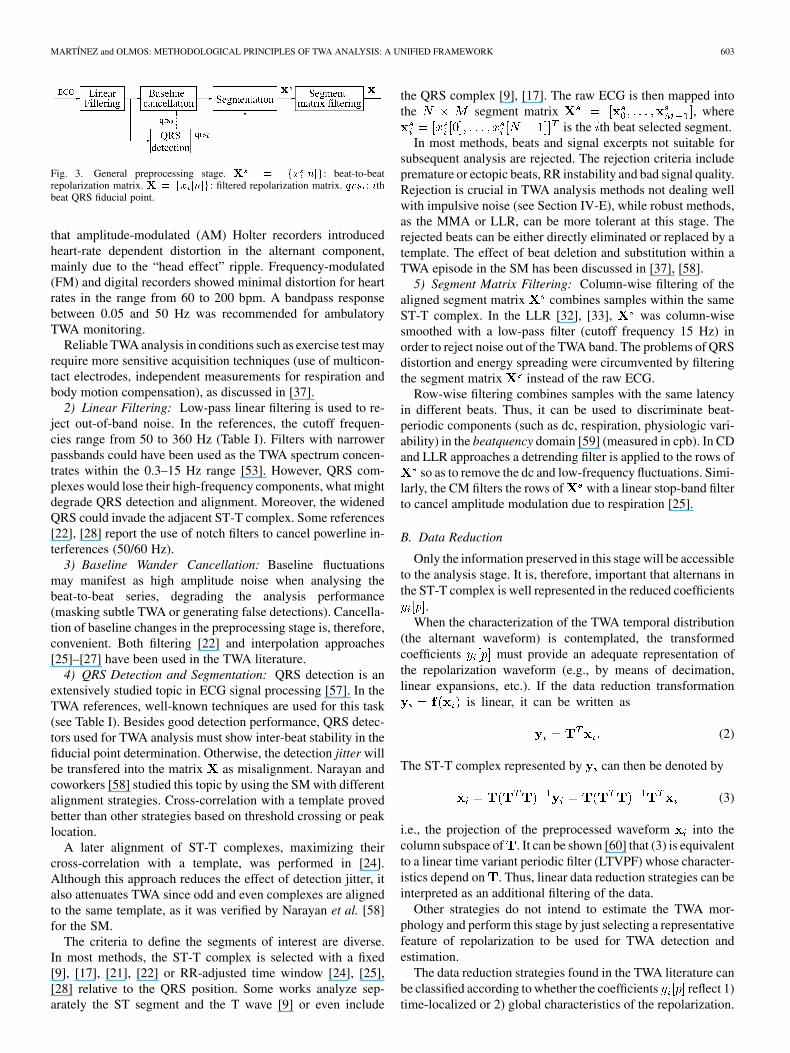
A TWA analysis system can be dissected into three stages:preprocessing, data reduction and the TWA analysis proper,which can be further decomposed into the detection and estima-tion substages. This scheme is represented in Fig. 1. The inputto the system is the digitized ECG signal. The possible outputsinclude the decision whether TWA is present (hypothesis )or absent (hypothesis ), the TWA amplitude and thealternant waveform computed at th beat.
A. Preprocessing
The aim of this stage is to condition the acquired ECG forposterior analysis. As TWA is a beat-to-beat phenomenon and
MARTÍNEZ and OLMOS: METHODOLOGICAL PRINCIPLES OF TWA ANALYSIS: A UNIFIED FRAMEWORK 601
Fig. 1. General structure of a TWA analyzer. X = fx [n]g: preprocessedsegment matrix, Y = fy [p]g: reduced coefficient matrix. H =H : decisionabout absence/presence of alternans. V : TWA amplitude. a [n]: alternantwaveform.
is associated with the cardiac repolarization (ST-T complex), analignment and segmentation procedure must be defined. QRSdetection and ST-T complex segmentation are, therefore, nec-essary tasks. Also in this stage, the signal quality can be en-hanced by filtering the signal. The output of the preprocessingstage is an matrix of filtered ECG segments
, where is thepreprocessed repolarization interval (ST-T complex) of the thbeat and is the total number of beats. The rows of arebeat-to-beat series of samples with the same latency in the re-polarization interval. The number of samples of each segment
depends on the sampling frequency, the heart rate and thesegmentation criterion (usually the whole ST-T complex).
B. Data Reduction
The purpose of this stage is to reduce the number of beat-to-beat series to be processed while preserving information aboutTWA. This can be done by removing redundancies in the signal.Note that the signal of interest, which is the possible alternantwaveform in , is mostly concentrated between 0.3 Hz and15 Hz [53].
A data reduction transformation is applied to eachsegment , where is thereduced coefficient vector of the th segment. Theoutput of the stage is the matrix .In some cases, no data reduction is performed and .
C. TWA Analysis
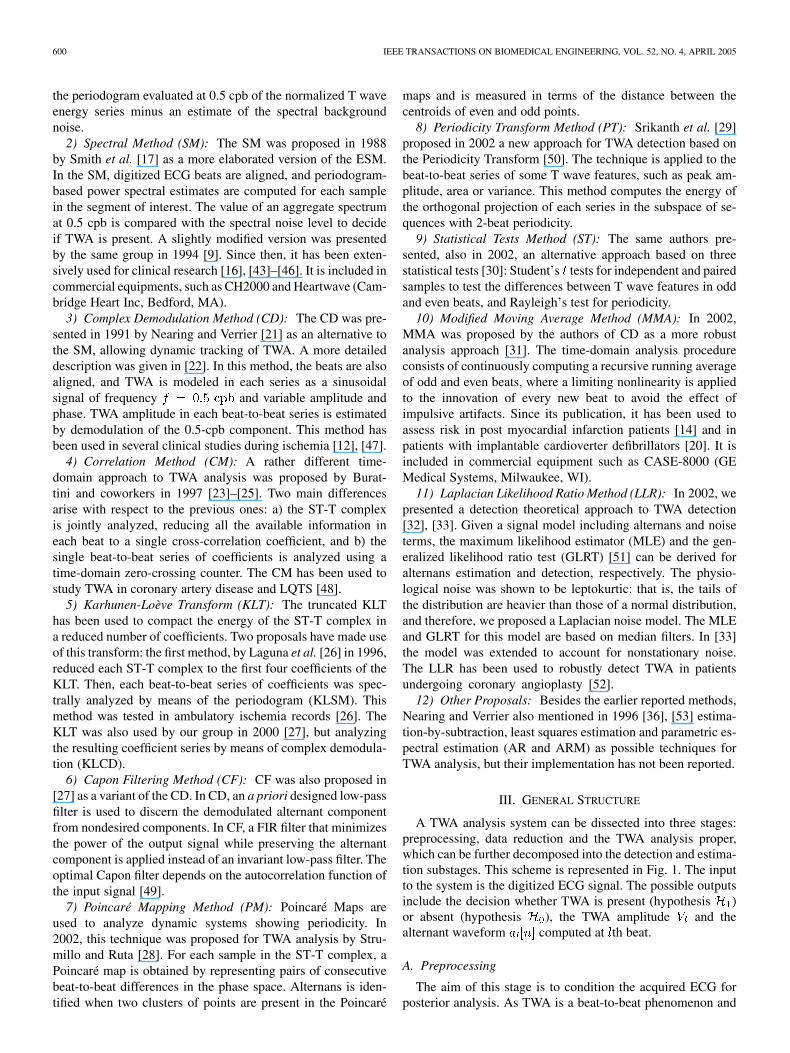
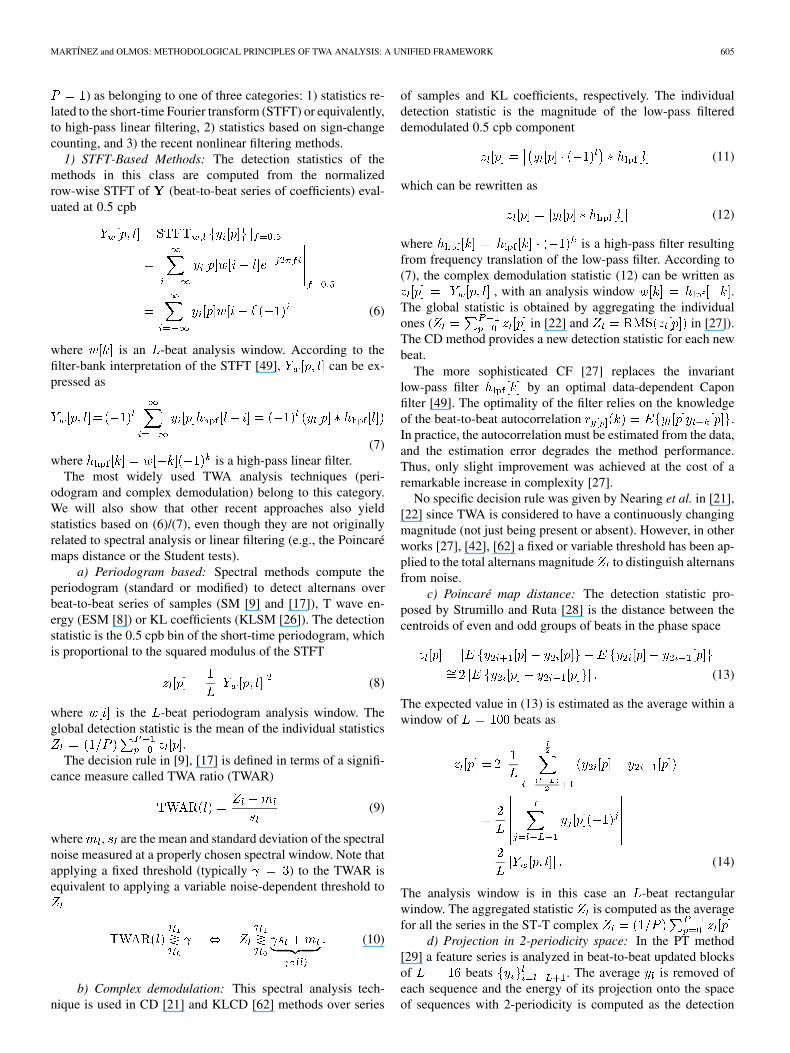
In the last stage, the transformed matrix is analyzed to de-cide about the presence or absence of TWA, and where appro-priate, to estimate its amplitude. We can, therefore, distinguishthe detection and estimation substages (Fig. 2).
Due to the transient, nonstationary nature of TWA, detec-tion and estimation must involve a limited set of neighbor beats.Thus, we can speak of an -beat analysis window, which mustbe shifted in order to cover the whole signal. Let be the shift(in beats) of the window between two consecutive steps. Then,detection statistics and estimators will be computed everybeats. The analysis can be performed on nonoverlapping
or overlapping blocks , whose extreme case is thebeat-by-beat sliding window analysis .
1) TWA Detection: To decide between hypotheses and, a detection statistic is computed in the neighborhood of
the th beat (where ), quantifying the significanceof the alternant component. Then, a decision rule is applied,consisting of comparing with a threshold , either fixedor variant
(1)
Fig. 2. Block diagram of the TWA analysis stage (see text for notation).
When , a set of individual statistics is usu-ally computed, quantifying alternans in each row of matrix .The global statistic summarizes the individual statistics(e.g., through the RMS value, mean, maximum value, ).
2) TWA Estimation: When alternans is detected, this sub-stage provides an estimate of TWA amplitude.
The alternant amplitude is first estimated in each beat-to-beatcoefficient series. Let be the estimate for the th coeffi-cient. A global TWA amplitude (in voltage units) is computedas a function of .
Note that the alternant amplitude is defined by some authorsas the difference between an alternating value and the center ofthe fluctuation (e.g., [9] and [37]), and by others as the differ-ence between two consecutive beats, which is exactly the double(e.g., [21] and [25]). In this paper, we will use the later defi-nition, which provides a more true-to-life measurement, sincethere is no physiological significance in the average of the alter-nating beats.
Additionally, some methods allow the estimation of the TWAwaveform , describing the distri-bution of TWA amplitude during the ventricular repolarizationinterval.
IV. METHODOLOGICAL REVIEW
In this section, the existing approaches to TWA analysisare reviewed, compared and discussed in the light of thethree-stage unified framework given in the previous section(Fig. 1), giving emphasis to the similarities and differences ofthe various methods. Implementation details nonrelevant fordiscussion and comparison are omitted in the text. The readercan find more information in Tables I–III as well as in thecited references. The terminology and notation used by otherauthors have been adapted to the ones in Section III. Additionalexplanations are provided when identification with originalnotation is not clear.
A. Preprocessing Stage
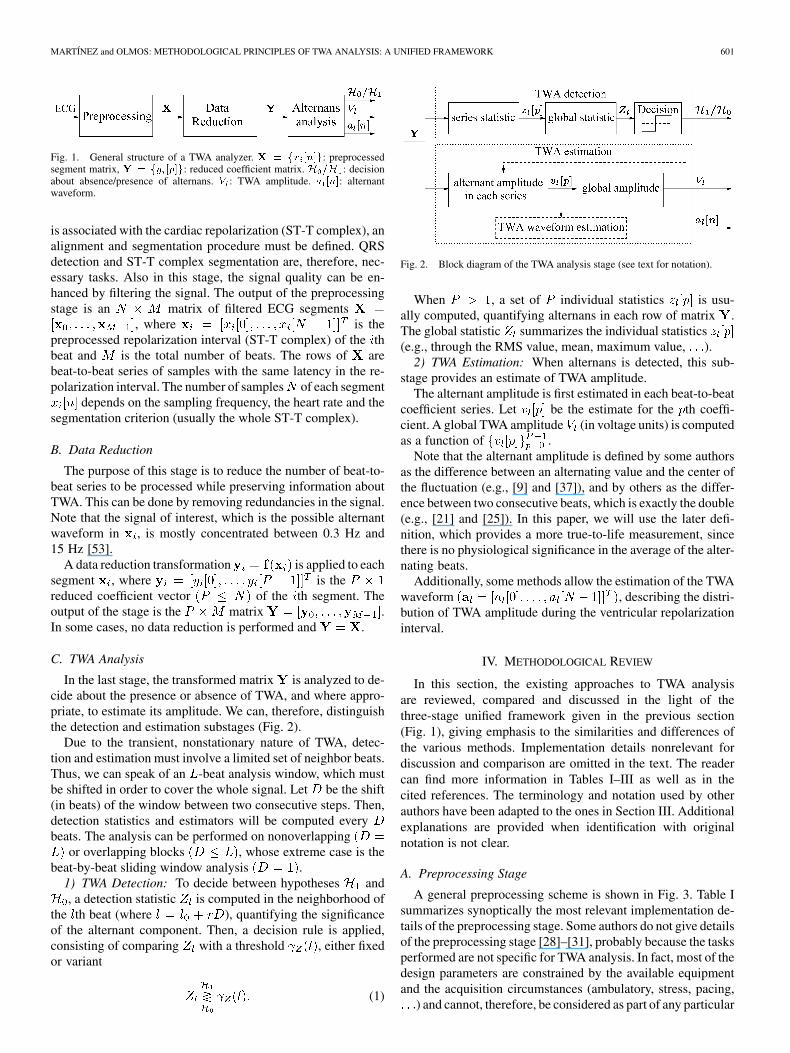
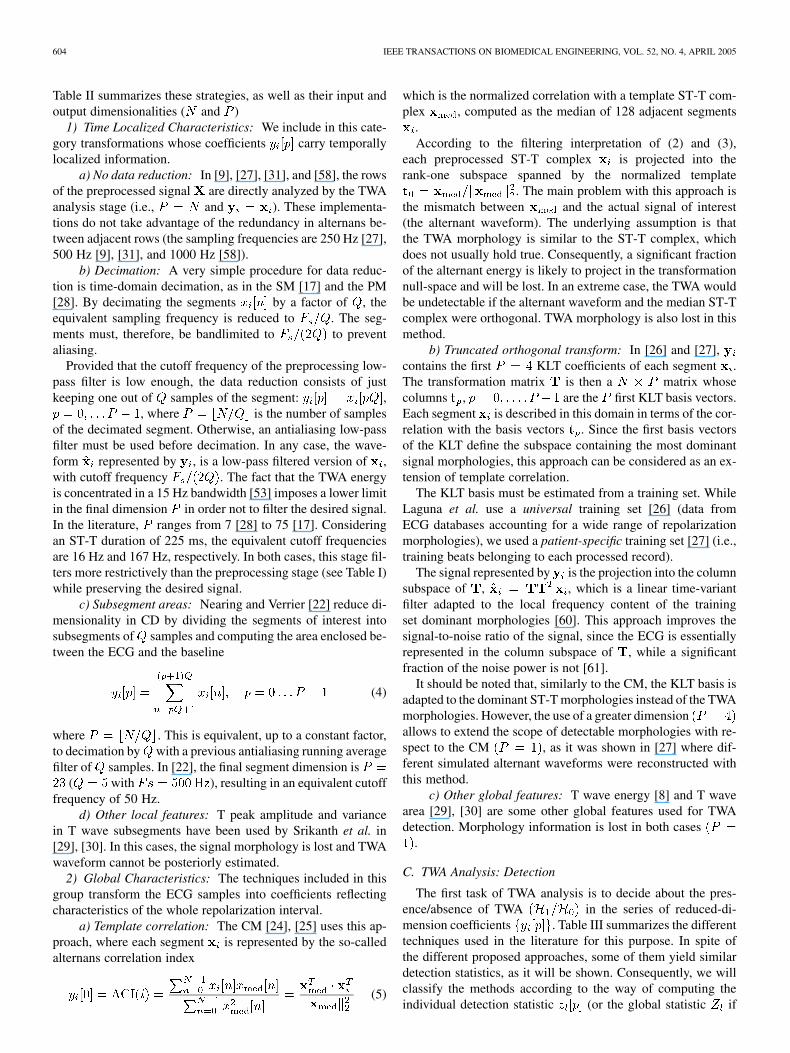
A general preprocessing scheme is shown in Fig. 3. Table Isummarizes synoptically the most relevant implementation de-tails of the preprocessing stage. Some authors do not give detailsof the preprocessing stage [28]–[31], probably because the tasksperformed are not specific for TWA analysis. In fact, most of thedesign parameters are constrained by the available equipmentand the acquisition circumstances (ambulatory, stress, pacing,
) and cannot, therefore, be considered as part of any particular
602 IEEE TRANSACTIONS ON BIOMEDICAL ENGINEERING, VOL. 52, NO. 4, APRIL 2005
TABLE ISYNOPTIC TABLE OF PREPROCESSING AND SEGMENTATION STAGE IMPLEMENTATIONS (N.S.: NOT SPECIFIED)
TABLE IIDATA REDUCTION STAGE IMPLEMENTATIONS
method. The requirements of this stage may also be increasedor relaxed depending on the robustness of subsequent stages.
1) Digitized ECG Signal: The electrical potentials mea-sured at the body surface must be converted into digital signals.The characteristics of the acquisition equipment, i.e., sam-pling rate, amplitude resolution, and frequency response, set alimit on the signal quality, influencing, therefore, the analysisperformance.
The sampling rates used in the literature range from 250 to1000 Hz (Table I). With any of them, the main ECG componentsare well preserved [55]. In [56], it was concluded that TWAamplitude estimates (using the CM) were essentially identicalfor sampling rates in the range 250–1000 Hz, observing onlyslight differences when sampling at 100 Hz.
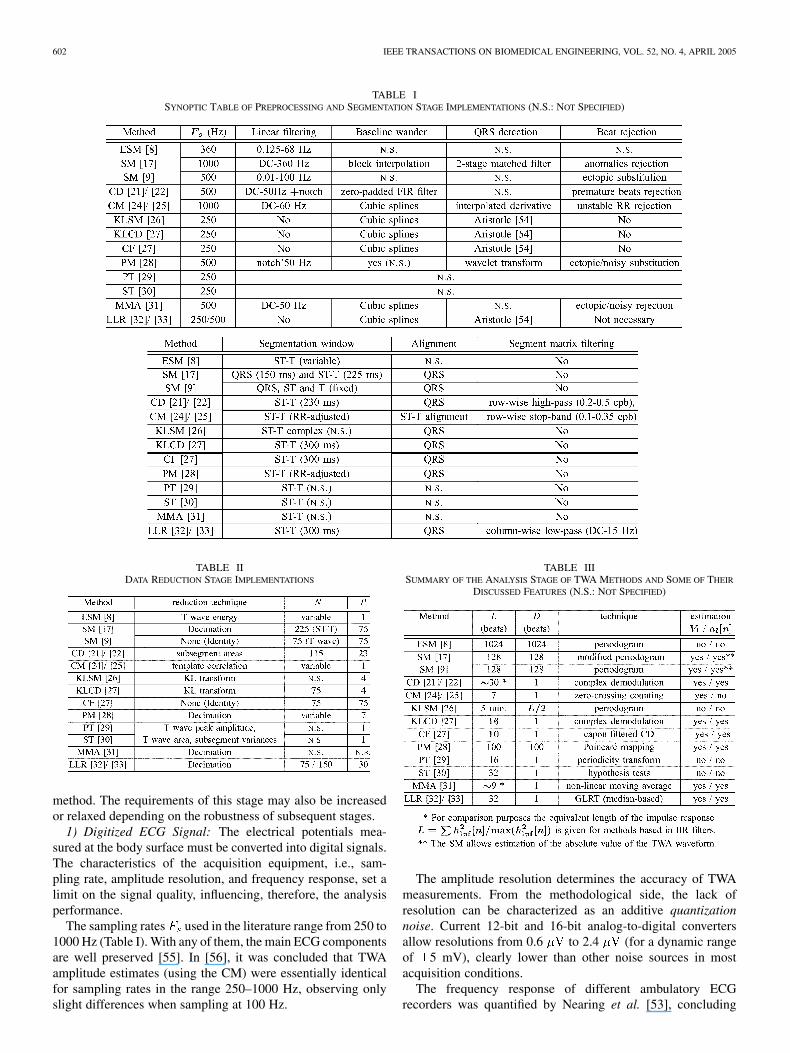
TABLE IIISUMMARY OF THE ANALYSIS STAGE OF TWA METHODS AND SOME OF THEIR
DISCUSSED FEATURES (N.S.: NOT SPECIFIED)
The amplitude resolution determines the accuracy of TWAmeasurements. From the methodological side, the lack ofresolution can be characterized as an additive quantizationnoise. Current 12-bit and 16-bit analog-to-digital convertersallow resolutions from 0.6 to 2.4 (for a dynamic rangeof 5 mV), clearly lower than other noise sources in mostacquisition conditions.
The frequency response of different ambulatory ECGrecorders was quantified by Nearing et al. [53], concluding
MARTÍNEZ and OLMOS: METHODOLOGICAL PRINCIPLES OF TWA ANALYSIS: A UNIFIED FRAMEWORK 603
Fig. 3. General preprocessing stage. X = fx [n]g: beat-to-beatrepolarization matrix. X = fx [n]g: filtered repolarization matrix. qrs : ithbeat QRS fiducial point.
that amplitude-modulated (AM) Holter recorders introducedheart-rate dependent distortion in the alternant component,mainly due to the “head effect” ripple. Frequency-modulated(FM) and digital recorders showed minimal distortion for heartrates in the range from 60 to 200 bpm. A bandpass responsebetween 0.05 and 50 Hz was recommended for ambulatoryTWA monitoring.
Reliable TWA analysis in conditions such as exercise test mayrequire more sensitive acquisition techniques (use of multicon-tact electrodes, independent measurements for respiration andbody motion compensation), as discussed in [37].
2) Linear Filtering: Low-pass linear filtering is used to re-ject out-of-band noise. In the references, the cutoff frequen-cies range from 50 to 360 Hz (Table I). Filters with narrowerpassbands could have been used as the TWA spectrum concen-trates within the 0.3–15 Hz range [53]. However, QRS com-plexes would lose their high-frequency components, what mightdegrade QRS detection and alignment. Moreover, the widenedQRS could invade the adjacent ST-T complex. Some references[22], [28] report the use of notch filters to cancel powerline in-terferences (50/60 Hz).
3) Baseline Wander Cancellation: Baseline fluctuationsmay manifest as high amplitude noise when analysing thebeat-to-beat series, degrading the analysis performance(masking subtle TWA or generating false detections). Cancella-tion of baseline changes in the preprocessing stage is, therefore,convenient. Both filtering [22] and interpolation approaches[25]–[27] have been used in the TWA literature.
4) QRS Detection and Segmentation: QRS detection is anextensively studied topic in ECG signal processing [57]. In theTWA references, well-known techniques are used for this task(see Table I). Besides good detection performance, QRS detec-tors used for TWA analysis must show inter-beat stability in thefiducial point determination. Otherwise, the detection jitter willbe transfered into the matrix as misalignment. Narayan andcoworkers [58] studied this topic by using the SM with differentalignment strategies. Cross-correlation with a template provedbetter than other strategies based on threshold crossing or peaklocation.
A later alignment of ST-T complexes, maximizing theircross-correlation with a template, was performed in [24].Although this approach reduces the effect of detection jitter, italso attenuates TWA since odd and even complexes are alignedto the same template, as it was verified by Narayan et al. [58]for the SM.
The criteria to define the segments of interest are diverse.In most methods, the ST-T complex is selected with a fixed[9], [17], [21], [22] or RR-adjusted time window [24], [25],[28] relative to the QRS position. Some works analyze sep-arately the ST segment and the T wave [9] or even include
the QRS complex [9], [17]. The raw ECG is then mapped intothe segment matrix , where
is the th beat selected segment.In most methods, beats and signal excerpts not suitable for
subsequent analysis are rejected. The rejection criteria includepremature or ectopic beats, RR instability and bad signal quality.Rejection is crucial in TWA analysis methods not dealing wellwith impulsive noise (see Section IV-E), while robust methods,as the MMA or LLR, can be more tolerant at this stage. Therejected beats can be either directly eliminated or replaced by atemplate. The effect of beat deletion and substitution within aTWA episode in the SM has been discussed in [37], [58].
5) Segment Matrix Filtering: Column-wise filtering of thealigned segment matrix combines samples within the sameST-T complex. In the LLR [32], [33], was column-wisesmoothed with a low-pass filter (cutoff frequency 15 Hz) inorder to reject noise out of the TWA band. The problems of QRSdistortion and energy spreading were circumvented by filteringthe segment matrix instead of the raw ECG.
Row-wise filtering combines samples with the same latencyin different beats. Thus, it can be used to discriminate beat-periodic components (such as dc, respiration, physiologic vari-ability) in the beatquency domain [59] (measured in cpb). In CDand LLR approaches a detrending filter is applied to the rows of
so as to remove the dc and low-frequency fluctuations. Simi-larly, the CM filters the rows of with a linear stop-band filterto cancel amplitude modulation due to respiration [25].
B. Data Reduction
Only the information preserved in this stage will be accessibleto the analysis stage. It is, therefore, important that alternans inthe ST-T complex is well represented in the reduced coefficients
.When the characterization of the TWA temporal distribution
(the alternant waveform) is contemplated, the transformedcoefficients must provide an adequate representation ofthe repolarization waveform (e.g., by means of decimation,linear expansions, etc.). If the data reduction transformation
is linear, it can be written as
(2)
The ST-T complex represented by can then be denoted by
(3)
i.e., the projection of the preprocessed waveform into thecolumn subspace of . It can be shown [60] that (3) is equivalentto a linear time variant periodic filter (LTVPF) whose character-istics depend on . Thus, linear data reduction strategies can beinterpreted as an additional filtering of the data.
Other strategies do not intend to estimate the TWA mor-phology and perform this stage by just selecting a representativefeature of repolarization to be used for TWA detection andestimation.
The data reduction strategies found in the TWA literature canbe classified according to whether the coefficients reflect 1)time-localized or 2) global characteristics of the repolarization.
604 IEEE TRANSACTIONS ON BIOMEDICAL ENGINEERING, VOL. 52, NO. 4, APRIL 2005
Table II summarizes these strategies, as well as their input andoutput dimensionalities ( and )
1) Time Localized Characteristics: We include in this cate-gory transformations whose coefficients carry temporallylocalized information.
a) No data reduction: In [9], [27], [31], and [58], the rowsof the preprocessed signal are directly analyzed by the TWAanalysis stage (i.e., and ). These implementa-tions do not take advantage of the redundancy in alternans be-tween adjacent rows (the sampling frequencies are 250 Hz [27],500 Hz [9], [31], and 1000 Hz [58]).
b) Decimation: A very simple procedure for data reduc-tion is time-domain decimation, as in the SM [17] and the PM[28]. By decimating the segments by a factor of , theequivalent sampling frequency is reduced to . The seg-ments must, therefore, be bandlimited to to preventaliasing.
Provided that the cutoff frequency of the preprocessing low-pass filter is low enough, the data reduction consists of justkeeping one out of samples of the segment: ,
, where is the number of samplesof the decimated segment. Otherwise, an antialiasing low-passfilter must be used before decimation. In any case, the wave-form represented by , is a low-pass filtered version of ,with cutoff frequency . The fact that the TWA energyis concentrated in a 15 Hz bandwidth [53] imposes a lower limitin the final dimension in order not to filter the desired signal.In the literature, ranges from 7 [28] to 75 [17]. Consideringan ST-T duration of 225 ms, the equivalent cutoff frequenciesare 16 Hz and 167 Hz, respectively. In both cases, this stage fil-ters more restrictively than the preprocessing stage (see Table I)while preserving the desired signal.
c) Subsegment areas: Nearing and Verrier [22] reduce di-mensionality in CD by dividing the segments of interest intosubsegments of samples and computing the area enclosed be-tween the ECG and the baseline
(4)
where . This is equivalent, up to a constant factor,to decimation by with a previous antialiasing running averagefilter of samples. In [22], the final segment dimension is
( with ), resulting in an equivalent cutofffrequency of 50 Hz.
d) Other local features: T peak amplitude and variancein T wave subsegments have been used by Srikanth et al. in[29], [30]. In this cases, the signal morphology is lost and TWAwaveform cannot be posteriorly estimated.
2) Global Characteristics: The techniques included in thisgroup transform the ECG samples into coefficients reflectingcharacteristics of the whole repolarization interval.
a) Template correlation: The CM [24], [25] uses this ap-proach, where each segment is represented by the so-calledalternans correlation index
(5)
which is the normalized correlation with a template ST-T com-plex , computed as the median of 128 adjacent segments
.According to the filtering interpretation of (2) and (3),
each preprocessed ST-T complex is projected into therank-one subspace spanned by the normalized template
. The main problem with this approach isthe mismatch between and the actual signal of interest(the alternant waveform). The underlying assumption is thatthe TWA morphology is similar to the ST-T complex, whichdoes not usually hold true. Consequently, a significant fractionof the alternant energy is likely to project in the transformationnull-space and will be lost. In an extreme case, the TWA wouldbe undetectable if the alternant waveform and the median ST-Tcomplex were orthogonal. TWA morphology is also lost in thismethod.
b) Truncated orthogonal transform: In [26] and [27],contains the first KLT coefficients of each segment .The transformation matrix is then a matrix whosecolumns , are the first KLT basis vectors.Each segment is described in this domain in terms of the cor-relation with the basis vectors . Since the first basis vectorsof the KLT define the subspace containing the most dominantsignal morphologies, this approach can be considered as an ex-tension of template correlation.
The KLT basis must be estimated from a training set. WhileLaguna et al. use a universal training set [26] (data fromECG databases accounting for a wide range of repolarizationmorphologies), we used a patient-specific training set [27] (i.e.,training beats belonging to each processed record).
The signal represented by is the projection into the columnsubspace of , , which is a linear time-variantfilter adapted to the local frequency content of the trainingset dominant morphologies [60]. This approach improves thesignal-to-noise ratio of the signal, since the ECG is essentiallyrepresented in the column subspace of , while a significantfraction of the noise power is not [61].
It should be noted that, similarly to the CM, the KLT basis isadapted to the dominant ST-T morphologies instead of the TWAmorphologies. However, the use of a greater dimensionallows to extend the scope of detectable morphologies with re-spect to the CM , as it was shown in [27] where dif-ferent simulated alternant waveforms were reconstructed withthis method.
c) Other global features: T wave energy [8] and T wavearea [29], [30] are some other global features used for TWAdetection. Morphology information is lost in both cases
.
C. TWA Analysis: Detection
The first task of TWA analysis is to decide about the pres-ence/absence of TWA in the series of reduced-di-mension coefficients . Table III summarizes the differenttechniques used in the literature for this purpose. In spite ofthe different proposed approaches, some of them yield similardetection statistics, as it will be shown. Consequently, we willclassify the methods according to the way of computing theindividual detection statistic (or the global statistic if
MARTÍNEZ and OLMOS: METHODOLOGICAL PRINCIPLES OF TWA ANALYSIS: A UNIFIED FRAMEWORK 605
) as belonging to one of three categories: 1) statistics re-lated to the short-time Fourier transform (STFT) or equivalently,to high-pass linear filtering, 2) statistics based on sign-changecounting, and 3) the recent nonlinear filtering methods.
1) STFT-Based Methods: The detection statistics of themethods in this class are computed from the normalizedrow-wise STFT of (beat-to-beat series of coefficients) eval-uated at 0.5 cpb
(6)
where is an -beat analysis window. According to thefilter-bank interpretation of the STFT [49], can be ex-pressed as
(7)where is a high-pass linear filter.
The most widely used TWA analysis techniques (peri-odogram and complex demodulation) belong to this category.We will also show that other recent approaches also yieldstatistics based on (6)/(7), even though they are not originallyrelated to spectral analysis or linear filtering (e.g., the Poincarémaps distance or the Student tests).
a) Periodogram based: Spectral methods compute theperiodogram (standard or modified) to detect alternans overbeat-to-beat series of samples (SM [9] and [17]), T wave en-ergy (ESM [8]) or KL coefficients (KLSM [26]). The detectionstatistic is the 0.5 cpb bin of the short-time periodogram, whichis proportional to the squared modulus of the STFT
(8)
where is the -beat periodogram analysis window. Theglobal detection statistic is the mean of the individual statistics
.The decision rule in [9], [17] is defined in terms of a signifi-
cance measure called TWA ratio (TWAR)
(9)
where , are the mean and standard deviation of the spectralnoise measured at a properly chosen spectral window. Note thatapplying a fixed threshold (typically ) to the TWAR isequivalent to applying a variable noise-dependent threshold to
(10)
b) Complex demodulation: This spectral analysis tech-nique is used in CD [21] and KLCD [62] methods over series
of samples and KL coefficients, respectively. The individualdetection statistic is the magnitude of the low-pass filtereddemodulated 0.5 cpb component
(11)
which can be rewritten as
(12)
where is a high-pass filter resultingfrom frequency translation of the low-pass filter. According to(7), the complex demodulation statistic (12) can be written as
, with an analysis window .The global statistic is obtained by aggregating the individualones ( in [22] and in [27]).The CD method provides a new detection statistic for each newbeat.
The more sophisticated CF [27] replaces the invariantlow-pass filter by an optimal data-dependent Caponfilter [49]. The optimality of the filter relies on the knowledgeof the beat-to-beat autocorrelation .In practice, the autocorrelation must be estimated from the data,and the estimation error degrades the method performance.Thus, only slight improvement was achieved at the cost of aremarkable increase in complexity [27].
No specific decision rule was given by Nearing et al. in [21],[22] since TWA is considered to have a continuously changingmagnitude (not just being present or absent). However, in otherworks [27], [42], [62] a fixed or variable threshold has been ap-plied to the total alternans magnitude to distinguish alternansfrom noise.
c) Poincaré map distance: The detection statistic pro-posed by Strumillo and Ruta [28] is the distance between thecentroids of even and odd groups of beats in the phase space
(13)
The expected value in (13) is estimated as the average within awindow of beats as
(14)
The analysis window is in this case an -beat rectangularwindow. The aggregated statistic is computed as the averagefor all the series in the ST-T complex
d) Projection in 2-periodicity space: In the PT method[29] a feature series is analyzed in beat-to-beat updated blocksof beats . The average is removed ofeach sequence and the energy of its projection onto the spaceof sequences with 2-periodicity is computed as the detection
606 IEEE TRANSACTIONS ON BIOMEDICAL ENGINEERING, VOL. 52, NO. 4, APRIL 2005
statistic. The two coefficients of the projection are given by themean of the even and odd samples of the zero-meaned sequence
(15)
(16)
with . The detection statistic be-comes . Substituting the value of
in (15) it can be shown that
(17)
where again an -beat rectangular window is used in the anal-ysis.
e) Student’s -tests: Student’s t test for independent andpaired samples are used in the ST [30] to decide whether thedifferences observed between the features of the odd and evenbeats are significant. The analysis is performed in sequences of
beats updated for every new beat.When using the standard -test, the statistic
(18)
is computed where , , , and are the samplemean and sample standard deviation of even and odd beats, re-spectively. The -value of the test is compared to a significancelevel (the -level) to make the decision. Due to the monotonicrelation between the -value and , this decision rule is equiv-alent to decide TWA if where is the critical valueof the test statistic for the considered -level (e.g.,for and which are the values used in [30]).Then, TWA is decided if
(19)
Note that for an -beatrectangular analysis window.
The paired -test is an alternative to avoid the influence oflow frequency trends in the analyzed sequence which inflate theintra-group variances. In this case, couples of consecutive beatsare considered to be paired. The statistic
(20)
where , are the sample mean and standard deviation ofthe differences , is used to test if the meandifference between consecutive beats is significantly different
from zero. The decision rule can again be expressed as
or
(21)
where is the same statistic as in thestandard test.
2) Sign Change Counting Methods: The Rayleigh test (in-cluded in ST) and the CM belong to this category. Both usea strategy based on the time-domain observation of the signchanges (or zero-crossings) in a beat-to-beat series.
The Rayleigh test in [30] decides if a series can be explainedeither by a random distribution or by a periodic pattern by mea-suring the regularity of the phase reversal pattern (sign reversalpattern for 2-beat periodicity). The feature series is ana-lyzed with a sliding window of beats. In each datablock, the number of deviations with respect to one of the twoalternant patternsor is measured,and a significance value is given meaning the probability of ob-taining such a pattern from a random variable. A given signifi-cance value is associated with a fixed threshold in the numberof beats following one of the patterns. Thus, is decided if
(22)
where . Rewriting (22) as
(23)
highlights the relation to the STFT-based methods. The STFTis now applied to the sign of the series.
In the CM, the alternans correlation index (5) is usu-ally near one, since ST-T complexes are similar to the template.However, when TWA is present, the correlation is expected toalternate between values greater and lesser than one. Burattiniet al. [25] require consecutive sign changes in the series
to decide the presence of TWA. Using ournotation, the decision rule for detecting alternans is also (22)with threshold .
3) Nonlinear Filtering Methods: This category includessome very recently proposed analysis methods where nonlinearfilters are used to compute the detection statistics and magni-tude estimates.
a) Nonlinear moving average: In the MMA method [14]an MMA is applied in parallel to even and odd beats as
(24)
where is a nonlinear limiting functionififif
(25)
The TWA at the th beat is computed as the absolute differencebetween even and odd estimates
(26)
MARTÍNEZ and OLMOS: METHODOLOGICAL PRINCIPLES OF TWA ANALYSIS: A UNIFIED FRAMEWORK 607
and the global detection statistic is quantified as
(27)
b) Median-based GLRT detectors: In [32] (LLR), a GLRTdetector was derived for TWA in Laplacian noise with knownpower. The individual statistic in each series is beat-to-beat com-puted as
(28)
It is proportional to the absolute sum of the values of the de-modulated series lying between 0 and the MLE of the alternantamplitude . For Laplacian noise, is twice the medianfiltered demodulated series
(29)
The global GLRT is the mean of the series statistics, and is compared to a fixed threshold.
When noise power is not assumed to be stationary [33],the resulting GLRT is equivalent to comparing the previous
with a variable threshold , where is theMLE of the noise standard deviation under hypothesis :
.
D. TWA Analysis: Estimation
1) Amplitude Estimation: The SM [9] estimates the globalTWA amplitude as the squared root of the alternant power, mea-sured as the difference between the averaged power spectrum at0.5 cpb and the spectral noise level
(30)In complex demodulation based methods, the amplitude in eachseries is demodulated as
(31)
The aggregate value is computed as in [22] andas in KLCD [27].
In the rest of STFT-based methods (PM, PT, Studenttests), no amplitude estimator is given. However, it isstraightforward to derive an estimator based on the STFT:
and from thestatistics (14), (17), (19) and (21).
Assuming a constant value for the TWA in the repolarizationinterval, Burattini et al. [25] propose the following beat-to-beatamplitude estimator for the CM
(32)
In the MMA method, and are, respectively, individualand global amplitude estimators.
The LLR method proposes the MLE under the assumption ofLaplacian noise for estimating the alternans amplitude. The in-dividual estimators are given by twice the median filtered com-plex demodulated series (29). The global TWA amplitude canbe quantified as .
The global TWA amplitude is, thus, computed either asan averaged amplitude across the ST-T complex or as the max-imum amplitude. When averaging, noise reduction is achievedat the expense of a certain underestimation of the measuredamplitude.
2) Waveform Estimation: Since the first TWA observations,it is well known that alternans is not uniformly distributed alongthe ST-T complex. The characterization of TWA waveform,though still little studied in the TWA literature, might be clin-ically relevant. Some of the cited works [9], [22] give exam-ples of TWA distributions. Recently, some studies have shownthat TWA morphology may indicate ventricular tachycardia in-ducibility [63] and the location of alternating sources [52].
The ability to estimate the TWA morphology depends on bothdata reduction and analysis schemes. Information lost in the datareduction stage cannot be recovered even in the case of idealanalysis, as suggested by (3). Thus, methods reducing each beatto a single coefficient (see Table II) cannot be used for waveformestimation.
When the performed data reduction is equivalent to decima-tion (SM, CD, CF, PM, MMA and LLR), the are direct es-timates of TWA amplitude at several instants within the ST-Tcomplex. Strictly speaking, is an estimator of the deci-mated TWA waveform. The alternant signal at its originalsampling rate can be obtained by interpolation of . In theSM, only the absolute value of the distribution can beobtained as the (30) do not preserve the alternans phase.
In reduction schemes based on linear transforms (KLTmethods), the show the TWA distribution in the trans-formed domain. As suggested by (3), the TWA waveform canbe reconstructed by adequately combining the , providedthat the relative alternans sign/phase between series is pre-served. In KLCD [27], the alternant waveform was estimatedas the inverse KLT of , i.e., .
E. TWA Analysis: Discussion and Examples
The discussion in this section is complemented by examplesin real and simulated ECG records. They have been selectedto illustrate some of the discussed aspects, and do not intendto serve as validation. We selected one signal (lead V2) digi-tally recorded with , and resolution of 0.6during a coronary angioplasty intervention. Other details aboutthe dataset can be found in [52]. The duration of the signal is of6 min. 22 s. (6:22), with a total of 482 beats. The balloon wasinflated at time 0:30, and released at 5:24. A TWA episode ispresent from 4:00 to 5:30. This was visually checked in the rawECG and by representing superposed beats.
This real ECG (Sig1) and two simulated signals were usedin the examples. The simulated signal Sig2 is built from Sig1,where four ectopic beats recorded in the same patient were in-serted at times 1:18, 2:35, 4:16, and 4:55. The two first aresimulated before the TWA episode and the other two withinalternans. From the last two, one breaks the TWA phase (i.e.,ABXAB, where A,B represent alternating beats and X the ec-topic beat) and the other does not break it (i.e., ABXBA). An-other signal (Sig3) was synthesized by adding Gaussian noisewith standard deviation of 50 in the band dc-20 Hz to the
608 IEEE TRANSACTIONS ON BIOMEDICAL ENGINEERING, VOL. 52, NO. 4, APRIL 2005
real ECG in two 50-beat intevals, one before (from 1:57 until2:35) and the other during TWA (from 3:56 until 4:36).
The same preprocessing stage was applied to the signals forall the methods, consisting on QRS detection, baseline rejec-tion (cubic splines interpolation), ST-T segmentation (320-mssegments), alignment and column-wise filtering of the segmentmatrix (20-Hz cuttoff frequency). As data reduction stage, dec-imation by was used for STFT-based andnonlinear filtering methods, while the maximum of T wave wasselected for the sign-counting methods.
1) STFT-Based Methods: It has been shown that the de-tection statistics of methods based on periodogram, complexdemodulation, Poincaré maps distance, periodicity transformand Student tests are monotonically related to the STFT ofthe beat-to-beat series at 0.5 cpb and, therefore, equivalent tothe statistic . The differences between theapproaches reside mainly in the shape and length of the analysiswindow .
The high-pass filter equivalence given by (7) can help to un-derstand the effect of the analysis window in the detection per-formance. The filter should preserve the alternant componentin each series, tracking its dynamic changes while rejecting asmuch noise as possible. We find, therefore, the classical tradeoffbetween tracking and denoising capabilities.
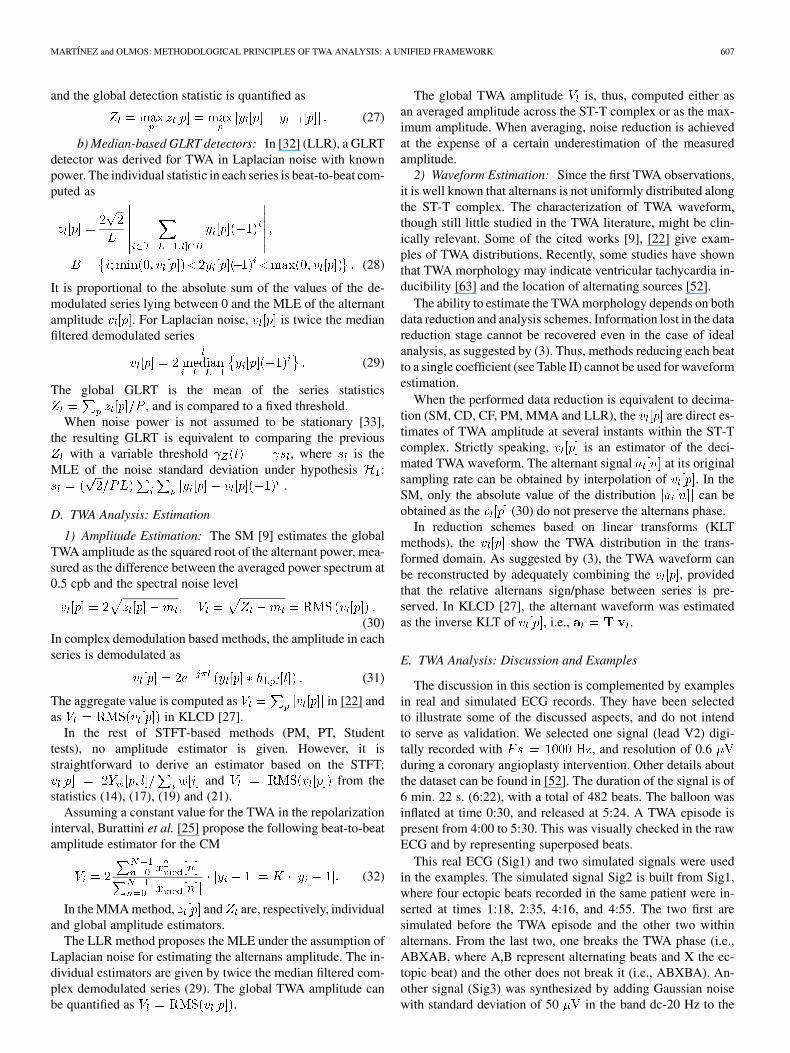
Short filters (low ) present better tracking of abrupt TWAchanges and transient episodes than long filters (high ). Onthe other hand, the amount of smoothing performed on thebeat-to-beat series by longer filters is greater, reducing thenoise in the detection statistics and amplitude estimators. Thistradeoff can be appreciated in Fig. 4(a) where the global detec-tion statistic is representedfor the signal Sig1, using Hanning analysis windows of lengths
, 32 and 128 beats. Normalization by allows tocompare different windows regardless of their scale and length.The smoothing effect of the 128-beat window does not allowa correct tracking of the transient TWA episode. However,the noise in (or ) is reduced with respect to the shorterwindows. The 8-beat window results in noisy statistics, makingdifficult the work of the detection decision rule. In this case, the32-beat window achieves a good compromise between trackingand denoising.
The assumption of stationarity within a 128-beat interval hasbeen considered by Verrier et al. as one of the limitations ofthe SM in comparison to CD, as it is commonly practiced [36].However, this limitation is attributable to the selected parame-ters rather than to the method itself. The kernel of the SM algo-rithm could track transient TWA episodes as well as the CD ifthe SM analysis window were the same as the effective durationof the CD impulse response, as it is illustrated in Fig. 4(b), wherethe statistic of CD in [22] (which uses an IIR filter with an effec-tive length of 30 beats) shows similar tracking and noise charac-teristics as a 32-point periodogram (either standard or Hanningwindowed).
In [32], it was also shown that the STFT at 0.5 cpb is theGLRT detector for TWA in stationary Gaussian noise, matchedto TWA episodes with shape and duration given by the analysiswindow. This indicates that, from a detection point of view, thelength of the window should be in the order of the expectedepisode length.
Fig. 4. STFT-based detection statistic Z applied to Sig1 with differentanalysis windows. The scale at the right represents the estimated amplitudeV . (a) Hanning windows of different lengths. (b) Hanning and rectangularwindows with L = 32, and CD method with the IIR filter used in [22].
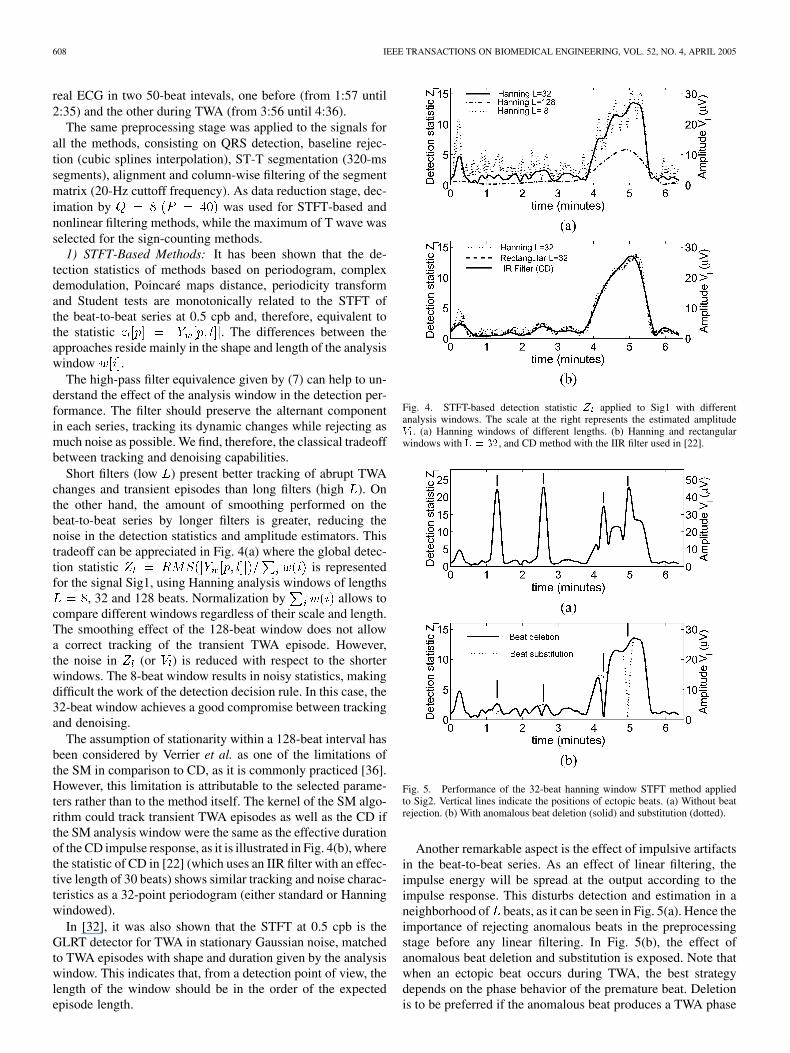
Fig. 5. Performance of the 32-beat hanning window STFT method appliedto Sig2. Vertical lines indicate the positions of ectopic beats. (a) Without beatrejection. (b) With anomalous beat deletion (solid) and substitution (dotted).
Another remarkable aspect is the effect of impulsive artifactsin the beat-to-beat series. As an effect of linear filtering, theimpulse energy will be spread at the output according to theimpulse response. This disturbs detection and estimation in aneighborhood of beats, as it can be seen in Fig. 5(a). Hence theimportance of rejecting anomalous beats in the preprocessingstage before any linear filtering. In Fig. 5(b), the effect ofanomalous beat deletion and substitution is exposed. Note thatwhen an ectopic beat occurs during TWA, the best strategydepends on the phase behavior of the premature beat. Deletionis to be preferred if the anomalous beat produces a TWA phase
MARTÍNEZ and OLMOS: METHODOLOGICAL PRINCIPLES OF TWA ANALYSIS: A UNIFIED FRAMEWORK 609
change, while substitution by a template beat works better whenthe phase is not broken by the ectopic beat. Both types ofbehavior have been observed in premature beats [63].
The shift parameter defines the rate at which the detectionstatistic and amplitude estimate are computed. A running anal-ysis window allows a beat-to-beat sampling of the TWA evolu-tion (as shown in the figures of this paper). Some methods arepresented in the literature following nonoverlapping[28] or partial overlapping [26] schemes. The SM isdefined on a block by block basis , but a sliding windowanalysis can also be used as in [64] ( , ). Anyhow,the resolution of the method is determined by the effective filterduration , rather than by the output rate defined by . Overlapintroduces correlation between consecutive detection statisticsor estimates. The main benefits of using very overlapped win-dows (small ) is the better representation of TWA evolution,allowing the accurate location of the episode onsets, peaks andends.
Although the detection statistic design has a great incidencein the analysis performance (time resolution, tracking of suddenchanges, accuracy, robustness, ), the sensitivity and robust-ness of a detector also depend on the decision rules.
In CD, PM and PT, is compared with a fixed threshold.In contrast, the decision rules in the SM and the tests allowadaptations to changing noise conditions. Equations (10), (19),and (21) reflect their equivalent thresholds. They depend on theestimated characteristics of the noise in the observed data:and measured in a spectral window for the SM and the pooledstandard deviations and for the standard and paired tests.Since only accounts for the variability of the even-odd dif-ferences, the paired test remains unaffected by slow drifts inthe beat-to-beat series, unlike the standard test. In the threecases, the required significance level can be set by adjusting theparameter .
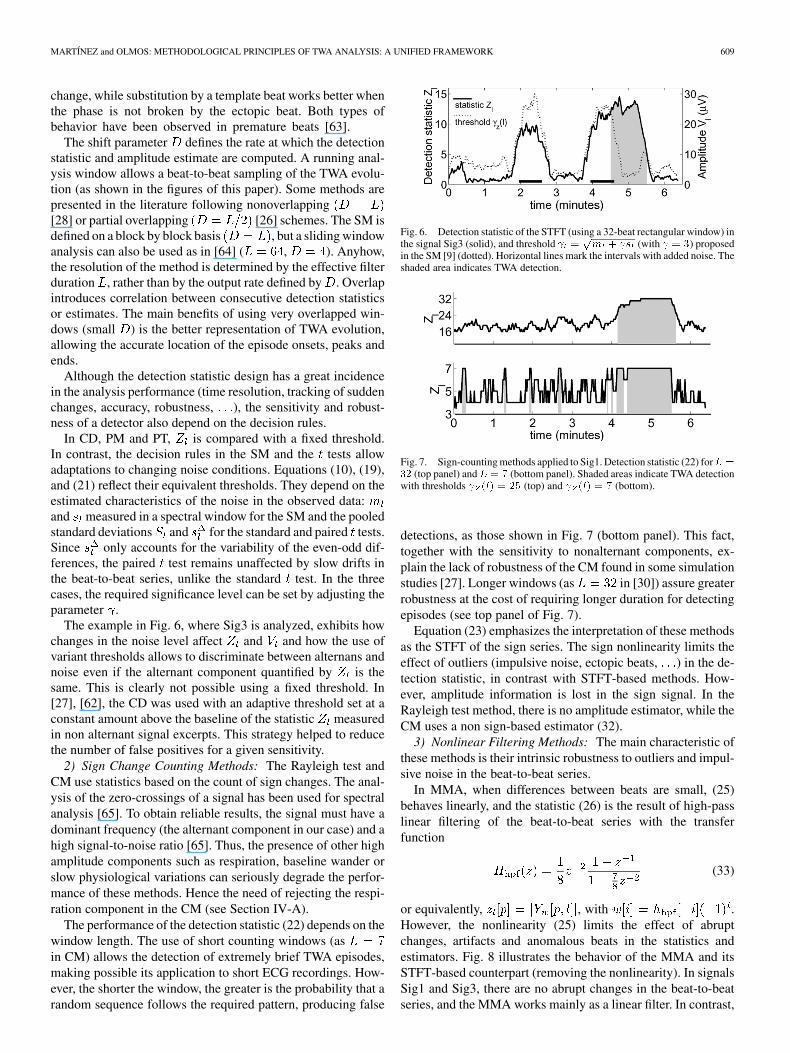
The example in Fig. 6, where Sig3 is analyzed, exhibits howchanges in the noise level affect and and how the use ofvariant thresholds allows to discriminate between alternans andnoise even if the alternant component quantified by is thesame. This is clearly not possible using a fixed threshold. In[27], [62], the CD was used with an adaptive threshold set at aconstant amount above the baseline of the statistic measuredin non alternant signal excerpts. This strategy helped to reducethe number of false positives for a given sensitivity.
2) Sign Change Counting Methods: The Rayleigh test andCM use statistics based on the count of sign changes. The anal-ysis of the zero-crossings of a signal has been used for spectralanalysis [65]. To obtain reliable results, the signal must have adominant frequency (the alternant component in our case) and ahigh signal-to-noise ratio [65]. Thus, the presence of other highamplitude components such as respiration, baseline wander orslow physiological variations can seriously degrade the perfor-mance of these methods. Hence the need of rejecting the respi-ration component in the CM (see Section IV-A).
The performance of the detection statistic (22) depends on thewindow length. The use of short counting windows (asin CM) allows the detection of extremely brief TWA episodes,making possible its application to short ECG recordings. How-ever, the shorter the window, the greater is the probability that arandom sequence follows the required pattern, producing false
Fig. 6. Detection statistic of the STFT (using a 32-beat rectangular window) inthe signal Sig3 (solid), and threshold =
pm + s (with = 3) proposed
in the SM [9] (dotted). Horizontal lines mark the intervals with added noise. Theshaded area indicates TWA detection.
Fig. 7. Sign-counting methods applied to Sig1. Detection statistic (22) forL =32 (top panel) andL = 7 (bottom panel). Shaded areas indicate TWA detectionwith thresholds (l) = 25 (top) and (l) = 7 (bottom).
detections, as those shown in Fig. 7 (bottom panel). This fact,together with the sensitivity to nonalternant components, ex-plain the lack of robustness of the CM found in some simulationstudies [27]. Longer windows (as in [30]) assure greaterrobustness at the cost of requiring longer duration for detectingepisodes (see top panel of Fig. 7).
Equation (23) emphasizes the interpretation of these methodsas the STFT of the sign series. The sign nonlinearity limits theeffect of outliers (impulsive noise, ectopic beats, ) in the de-tection statistic, in contrast with STFT-based methods. How-ever, amplitude information is lost in the sign signal. In theRayleigh test method, there is no amplitude estimator, while theCM uses a non sign-based estimator (32).
3) Nonlinear Filtering Methods: The main characteristic ofthese methods is their intrinsic robustness to outliers and impul-sive noise in the beat-to-beat series.
In MMA, when differences between beats are small, (25)behaves linearly, and the statistic (26) is the result of high-passlinear filtering of the beat-to-beat series with the transferfunction
(33)
or equivalently, , with .However, the nonlinearity (25) limits the effect of abruptchanges, artifacts and anomalous beats in the statistics andestimators. Fig. 8 illustrates the behavior of the MMA and itsSTFT-based counterpart (removing the nonlinearity). In signalsSig1 and Sig3, there are no abrupt changes in the beat-to-beatseries, and the MMA works mainly as a linear filter. In contrast,
610 IEEE TRANSACTIONS ON BIOMEDICAL ENGINEERING, VOL. 52, NO. 4, APRIL 2005
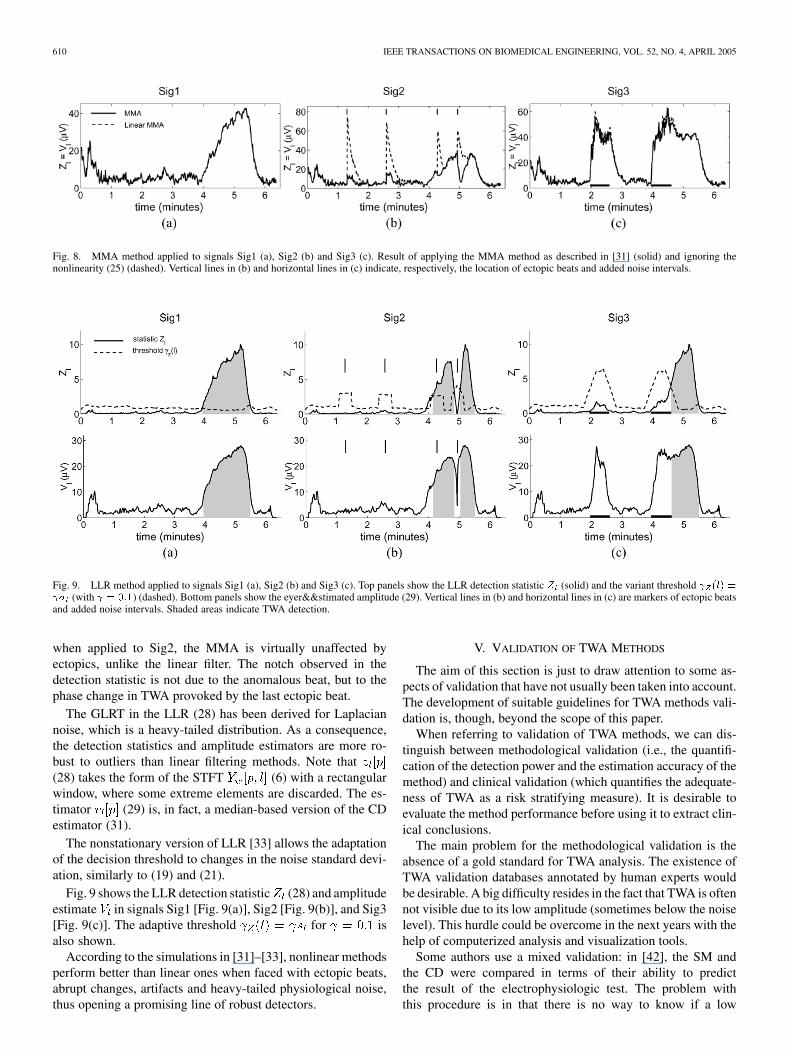
Fig. 8. MMA method applied to signals Sig1 (a), Sig2 (b) and Sig3 (c). Result of applying the MMA method as described in [31] (solid) and ignoring thenonlinearity (25) (dashed). Vertical lines in (b) and horizontal lines in (c) indicate, respectively, the location of ectopic beats and added noise intervals.
Fig. 9. LLR method applied to signals Sig1 (a), Sig2 (b) and Sig3 (c). Top panels show the LLR detection statistic Z (solid) and the variant threshold (l) = � (with = 0:1) (dashed). Bottom panels show the eyer&&stimated amplitude (29). Vertical lines in (b) and horizontal lines in (c) are markers of ectopic beatsand added noise intervals. Shaded areas indicate TWA detection.
when applied to Sig2, the MMA is virtually unaffected byectopics, unlike the linear filter. The notch observed in thedetection statistic is not due to the anomalous beat, but to thephase change in TWA provoked by the last ectopic beat.
The GLRT in the LLR (28) has been derived for Laplaciannoise, which is a heavy-tailed distribution. As a consequence,the detection statistics and amplitude estimators are more ro-bust to outliers than linear filtering methods. Note that(28) takes the form of the STFT (6) with a rectangularwindow, where some extreme elements are discarded. The es-timator (29) is, in fact, a median-based version of the CDestimator (31).
The nonstationary version of LLR [33] allows the adaptationof the decision threshold to changes in the noise standard devi-ation, similarly to (19) and (21).
Fig. 9 shows the LLR detection statistic (28) and amplitudeestimate in signals Sig1 [Fig. 9(a)], Sig2 [Fig. 9(b)], and Sig3[Fig. 9(c)]. The adaptive threshold for isalso shown.
According to the simulations in [31]–[33], nonlinear methodsperform better than linear ones when faced with ectopic beats,abrupt changes, artifacts and heavy-tailed physiological noise,thus opening a promising line of robust detectors.
V. VALIDATION OF TWA METHODS
The aim of this section is just to draw attention to some as-pects of validation that have not usually been taken into account.The development of suitable guidelines for TWA methods vali-dation is, though, beyond the scope of this paper.
When referring to validation of TWA methods, we can dis-tinguish between methodological validation (i.e., the quantifi-cation of the detection power and the estimation accuracy of themethod) and clinical validation (which quantifies the adequate-ness of TWA as a risk stratifying measure). It is desirable toevaluate the method performance before using it to extract clin-ical conclusions.
The main problem for the methodological validation is theabsence of a gold standard for TWA analysis. The existence ofTWA validation databases annotated by human experts wouldbe desirable. A big difficulty resides in the fact that TWA is oftennot visible due to its low amplitude (sometimes below the noiselevel). This hurdle could be overcome in the next years with thehelp of computerized analysis and visualization tools.
Some authors use a mixed validation: in [42], the SM andthe CD were compared in terms of their ability to predictthe result of the electrophysiologic test. The problem withthis procedure is in that there is no way to know if a low
MARTÍNEZ and OLMOS: METHODOLOGICAL PRINCIPLES OF TWA ANALYSIS: A UNIFIED FRAMEWORK 611
stratifying sensitivity/specificity is due to the errors of theanalysis method or just to a lack of sensitivity/specificity ofthe clinical parameter.
In other cases, a new method is validated by correlating theirresults with those of the SM, i.e., using the SM as [28]. Thisprocedure allows to test if a new method achieves a performancesimilar to a previously validated one, but does not allow anyconclusion about the discordances between both methods.
The most common way of performance assessment is bymeans of simulation studies where TWA parameters (location,amplitude, duration, waveform) are known a priori [24], [26],[27], [29]–[33], [48], [53], [58], [62], [66]. Two aspects mayinfluence their reliability: the degree of realism of the simu-lated signals (including the background ECG, TWA, and noiseterms) and the possible overfit of the simulation to the method’sunderlying model.
We can find simulations with different degrees of realism inthe literature. A synthesized alternating waveform is usuallyadded to the ST-T complexes of a simulated noisy ECG. Thebackground ECG is usually built as the repetition of a singlenoiseless beat (either synthetic [24], [31], [48], [53] or extractedfrom a real ECG [26], [27], [29], [30], [32], [58], [66]). Onedrawback of these approaches is that they do not consider phys-iological variability which can mask TWA in real recordings.Some of them scale the waveforms simulating heart rate vari-ability [24], [31], [48]. Computer generated noise is added tothe background ECG in [24], [26], [27], [29], [30], [32], [48] totest the performance in different levels of noise. A more realisticapproach is to add recorded physiological noise as in [27], [32],where the MIT-BIH noise stress database was used. Finally,other settings [33], [58], [62] add simulated alternans to realnonalternant ECG recordings, with their own noise and physi-ological variability. These simulations provide very realistic re-sults since neither the background ECG nor the noise terms aresimulated.
As it has been shown in Section IV-E, the use of an analysismethod with a parameter set has implications in the charac-teristics of TWA and noise that the method can cope with.Hence, overfitting between the parameters of the simulation(TWA episode duration, waveform, noise distribution, andstationarity, ) and those of the analysis could yield biasedresults and should, therefore, be avoided.
VI. CONCLUSION
Two decades of computerized TWA analysis techniques havebeen revisited in this work and a three-stage unified frameworkhas been proposed to dissect and analytically study the differentmethods. This framework has allowed us to find an analyticalclose relation between several methods regarded as markedlydistinct in the literature, and also to isolate the principles ofTWA detection and estimation from other auxiliary proceduresand parameters.
The preprocessing stage is necessary to condition the signalfor analysis. Its requirements are very dependent on the acqui-sition conditions, but also on the robustness of the subsequentstages.
Some linear data reduction schemes decrease the computa-tional load by removing redundancy and nondesired compo-nents. Their effect in the ECG is that of a linear time-variantperiodic filter. Other methods use nonlinear schemes to extractrelevant features of repolarization.
The core of the TWA methods lies in the detection and estima-tion substages. We have shown that most methods (including themost widely used SM and CD) are grounded in the short-timeFourier transform of the beat-to-beat series. The differences inperformance among these methods can be explained on onehand by the characteristics of the analysis window, and on theother hand by the adaptation of the decision rule to changes inthe noise characteristics. A second category gathers sign-changecounting methods. The main drawback of these methods is theirsensitivity to the presence of high amplitude nonalternant com-ponents. Finally, two recently proposed methods (MMA andLLR) form at the moment the category of nonlinear filteringmethods. These are intrinsically robust to outliers or impulsivenoise and have shown to perform better than linear methods inphysiological noise.
REFERENCES
[1] H. E. Hering, “Experimentelle studien an Säugetieren über das Elektro-cardiogram,” Zeitschrift für experimentelle Pathologie und Therapie, no.7, pp. 363–378, 1909.
[2] T. Lewis, “Notes upon alternation of the heart,” Quart. J. Med., no. 4,pp. 141–144, 1910.
[3] W. W. Hamburger, L. N. Katz, and O. Saphir, “Electrical alternans:a clinical study with a report of two necropsies,” JAMA, no. 106, pp.902–905, 1936.
[4] H. H. Kalter and M. L. Schwartz, “Electrical alternans,” N. Y. State J.Med., no. 1, pp. 1164–1166, 1948.
[5] P. J. Schwartz and A. Malliani, “Electrical alternation of the T-wave:clinical and experimental evidence of its relationship with the sympa-thetic nervous system and with the long Q-T syndrome,” Am. Heart J.,vol. 89, no. 1, pp. 45–50, 1975.
[6] D. R. Adam, S. Akselrod, and R. J. Cohen, “Estimation of ventricularvulnerability to fibrillation through T-wave time series analysis,”Comput. Cardiol., vol. 8, pp. 307–310, 1981.
[7] D. R. Adam, A. O. Powell, H. Gordon, and R. J. Cohen, “Ventricular fib-rillation and fluctuations in the magnitude of the repolarizacion vector,”Comput. Cardiol., vol. 9, pp. 241–244, 1982.
[8] D. R. Adam, J. M. Smith, S. Akselrod, S. Nyberg, A. O. Powell, andR. J. Cohen, “Fluctuations in T-wave morphology and susceptibility toventricular fibrillation,” J. Electrocardiol., vol. 17, pp. 209–218, 1984.
[9] D. S. Rosenbaum, L. E. Jackson, J. M. Smith, H. Garan, J. N. Ruskin,and R. J. Cohen, “Electrical alternans and vulnerability to ventriculararrhytimias,” N. Engl. J. Med., vol. 330, no. 4, pp. 235–241, 1994.
[10] N. A. Estes III, G. Michaud, D. P. Zipes, N. El-Sherif, F. J. Venditti, D. S.Rosenbaum, P. Albrecht, P. J. Wang, and R. J. Cohen, “Electrical alter-nans during rest and exercise as predictors of vulnerability to ventriculararrhythmias,” Am. J. Cardiol., no. 80, pp. 1314–1318, 1997.
[11] T. Kwan, A. Feit, M. Alam, E. Afflu, and L. T. Clark, “ST-T alternansand myocardial ischemia,” Angiology, vol. 50, no. 3, pp. 217–222, 1999.
[12] R. L. Verrier, B. D. Nearing, G. MacCallum, and P. H. Stone, “T-wave al-ternans during ambulatory ischemia in patients with stable coronary dis-ease,” Ann. Noninvasive Electrocardiol., pt. 1, vol. 1, no. 2, pp. 113–120,1996.
[13] W. Zareba, A. J. Moss, S. Le Cessie, and W. Hall, “T wave alternansin idiopathic long QT syndrome,” J. Am. Coll. Cardiol., no. 23, pp.1541–1546, 1994.
[14] R. L. Verrier, B. D. Nearing, M. T. LaRovere, G. D. Pinna, M. A. Mit-tleman, J. T. Bigger, and P. J. Schwartz, “Ambulatory electrocardio-gram-based tracking of T wave alternans in postmyocardial infarctionpatients to assess risk of cardiac arrest or arrhythmic death,” J. Cardio-vasc. Electrophysiol., vol. 14, no. 7, pp. 705–711, 2003.
[15] G. Turitto and N. El-Sherif, “Alternans of the ST segment in variantangina. incidence, time course and relation to ventricular arrhythmiasduring ambulatory electrocardiographic recording,” Chest, vol. 93, pp.587–591, 1988.
612 IEEE TRANSACTIONS ON BIOMEDICAL ENGINEERING, VOL. 52, NO. 4, APRIL 2005
[16] K. Adachi, Y. Ohnisch, T. Shima, K. Yamashiro, A. Takei, N. Tamura,and M. Yokoyama, “Determinant of microvolt-level T-wave alternans inpatients with dilated cardiomyopathy,” J. Am. Coll. Cardiol., vol. 34, no.2, pp. 374–380, 1999.
[17] J. M. Smith, E. A. Clancy, C. R. Valeri, J. N. Ruskin, and R. J. Cohen,“Electrical alternans and cardiac electrical instability,” Circulation, vol.77, no. 1, pp. 110–121, 1988.
[18] G. Turitto, E. B. Caref, G. El-Attar, M. Helal, A. Mohamed, R. P. Ped-alino, and N. El-Sherif, “Optimal target heart rate for exercise-inducedT-wave alternans,” Ann. Noninvasive Electrocardiol., vol. 6, no. 2, pp.123–128, 2001.
[19] S. Weber, H. Tillmanns, and B. Waldecker, “Prevalence of T wave alter-nans in healthy subjects,” Pacing Clin. Electrophysiol., vol. 26, no. 1p1,pp. 49–51, 2003.
[20] W. J. Kop, D. S. Krantz, B. D. Nearing, J. S. Gottdiener, J. F. Quigley, M.O’Callahan, A. A. DelNegro, T. D. Friehling, P. Karasik, S. Suchday, J.Levine, and R. L. Verrier, “Effects of acute mental stress and exercise onT-wave alternans in patients with implantable cardioverter defibrillatorsand controls,” Circulation, vol. 109, pp. 1864–1869, 2004.
[21] B. D. Nearing, A. H. Huang, and R. L. Verrier, “Dynamic tracking ofcardiac vulnerability by complex demodulation of the T wave,” Science,no. 252, pp. 437–440, 1991.
[22] B. D. Nearing and R. L. Verrier, “Personal computer system for trackingcardiac vulnerability by complex demodulation of the T wave,” J. Appl.Physiol., vol. 74, no. 5, pp. 2606–2612, 1993.
[23] L. Burattini, W. Zareba, J. P. Couderc, E. L. Titlebaum, and A. J. Moss,“Computer detection of nonstationary T-wave alternans using a new cor-relative method,” Comput. Cardiol., vol. 24, pp. 657–660, 1997.
[24] L. Burattini, “Electrocardiographic T Wave Alternans Detection andSignificance,” Ph.D. dissertation, University of Rochester, Rochester,NY, 1998.
[25] L. Burattini, W. Zareba, and A. J. Moss, “Correlation method for de-tection of transient T-wave alternans in digital Holter ECG recordings,”Ann. Electrocardiol., vol. 4, no. 4, pp. 416–426, 1999.
[26] P. Laguna, M. Ruiz, G. B. Moody, and R. G. Mark, “Repolarization al-ternans detection using the KL transform and the beatquency spectrum,”Comput. Cardiol., vol. 23, pp. 673–676, 1996.
[27] J. P. Martínez, S. Olmos, and P. Laguna, “Simulation study and perfor-mance evaluation of T-wave alternans detectors,” in Proc. 22nd Ann. Int.Conf. IEEE Engineering in Meicine and Biolog. Soc. (CD-ROM), 2000.
[28] P. Strumillo and J. Ruta, “Poincaré mapping for detecting abnormal dy-namics of cardiac repolarization,” IEEE Eng. Med. Biol. Mag., vol. 21,no. 1, pp. 62–65, 2002.
[29] T. Srikanth, D. Lin, N. Kanaan, and H. Gu, “Estimation of low levelalternans using periodicity transform—simulation and european ST/Tdatabase results,” in Proc. 24th Ann. Int. Conf. IEEE Engineering in Me-icine and Biology Soc., 2002, pp. 1407–1408.
[30] , “Presence of T wave alternans in the statistical context—a newapproach to low amplitude alternans measurement,” Comput. Cardiol.,vol. 29, pp. 681–684, 2002.
[31] B. D. Nearing and R. L. Verrier, “Modified moving average analysis ofT-wave alternans to predict ventricular fibrillation with high accuracy,”J. Appl. Physiol., no. 92, pp. 541–549, 2002.
[32] J. P. Martínez and S. Olmos, “A robust T-wave alternans detector basedon the GLRT for Laplacian noise distribution,” in Proc. Comput. Car-diol. 2002, Piscataway, NJ, 2002, pp. 677–680.
[33] , “Detection of T wave alternans in nonstationary noise: a GLRT ap-proach,” in Proc. Computers in Cardiology 2003, Piscataway, NJ, 2003,pp. 161–164.
[34] D. E. Euler, “Cardiac alternans: mechanisms and pathophysiological sig-nificance,” Cardiovasc. Res., vol. 42, pp. 583–590, 1999.
[35] M. V. Walker and D. S. Rosenbaum, “Repolarization alternans: implica-tions for the mechanism and prevention of sudden cardiac death,” Car-diovasc. Res., vol. 57, pp. 599–614, 2003.
[36] R. L. Verrier, W. Zareba, and B. D. Nearing, “T-wave alternans moni-toring to assess risk for ventricular tachycardia and fibrilation,” in Non-invasive Electrocardiology. Clinical Aspects of Holter Monitoring, A.J. Moss and S. Stern, Eds. London, U.K.: Saunders, 1996, ch. 25, pp.445–464.
[37] D. S. Rosenbaum, P. Albrecht, and R. J. Cohen, “Predicting suddencardiac death from T wave alternans of the surface electrocardiogram:promise and pitfalls,” J. Cardiovasc. Electrophysiol., vol. 7, no. 11, pp.1095–1111, 1996.
[38] E. Locati, L. Burattini, and W. Zareba, “Identification of T-wave alter-nans: review of methods and clinical perspectives,” in Rhythm Control:From Cardiac Evaluation to Treatment, E. Adornato, Ed. Roma: Edi-zioni Luigi Pozzi, 1998, pp. 173–184.
[39] M. Takagi and J. Yoshikawa, “T wave alternans and ventricular tach-yarrhythmia risk stratification: a review,” Indian Pacing Electrophysiol.J., vol. 3, no. 2, pp. 67–73, 2003.
[40] Q. Pham, K. J. Quan, and D. S. Rosenbaum, “T-wave alternans: marker,mechanism, and methodology for predicting sudden cardiac death,” J.Electrocardiol., vol. 36, pp. 75–81, 2003.
[41] W. Zareba, J. P. Couderc, and A. J. Moss, “Automatic detection of spatialand temporal heterogeneity of repolarization,” in Dispersion of Ventric-ular Repolarization: State of the Art, S. B. Olsson, S. Yuan, and J. P.Amlie, Eds. New York: Futura, 2000, ch. 6, pp. 85–107.
[42] D. S. Rosenbaum, X. Fang, and J. A. Mackall, “How to detect ECGT-wave alternans in patients at risk for sudden cardiac death,” J. Am.Coll. Cardiol., vol. 25, no. 2, p. 409A, 1995.
[43] S. H. Hohnloser, T. Klingenheben, L. Yi-Gang, M. Zabel, J. Peetermans,and R. J. Cohen, “T-wave alternans as a predictor of recurrent ventric-ular tachyarrhythmias in ICD recipients: prospective comparison withconventional risk markers,” J. Cardiovasc. Electrophysiol., vol. 9, pp.1258–1268, 1998.
[44] M. R. Gold, D. M. Bloomfield, K. Anderson, N. El Sherif, D. Wilber, E.Kaufman, M. Greenberg, and D. Rosenbaum, “A comparison of T-wavealternans, signal averaged electrocardiography and programmed ventric-ular stimulation for arrhytmia risk stratification,” J. Am. Coll. Cardiol.,no. 36, pp. 2247–2253, 2000.
[45] T. Klingenheben, M. Zabel, R. B. D’Agostino, R. J. Cohen, and S. H.Hohnloser, “Predictive value of T-wave alternans for arrhythmic eventsin patients with congestive heart failure,” Lancet, vol. 356, pp. 651–652,2000.
[46] T. Ikeda, H. Saito, K. Tanno, H. Shimizu, J. Watanabe, Y. Ohnishi, Y.Kasamaki, and Y. Ozawa, “T-wave alternans as a predictor for suddencardiac death after myocardial infarction,” Am. J. Cardiol., vol. 89, pp.79–82, 2002.
[47] B. D. Nearing, S. N. Oesterle, and R. L. Verrier, “Quantification of is-chaemia induced vulnerability by precordial T wave alternans analysisin dog and human,” Cardiovasc. Res., vol. 28, pp. 1440–1449, 1994.
[48] L. Burattini, W. Zareba, E. J. Rashba, J. P. Couderc, J. Konecki, and A. J.Moss, “ECG features of microvolt T-wave alternans in coronary arterydisease and long QT syndrome patients,” J. Electrocardiol., vol. 31, pp.114–120, 1998.
[49] P. Stoica and R. Moses, Introduction to Spectral Analysis. UpperSaddle River, NJ: Prentice-Hall, 1997.
[50] W. A. Sethares and T. W. Staley, “Periodicity transforms,” IEEE Trans.Signal. Process., vol. 47, no. 11, pp. 2953–2964, Nov. 1999.
[51] S. M. Kay, Fundamentals of Statistical Signal Processing. UpperSaddle River, NJ: Prentice-Hall, 1998, vol. II, Detection theory.
[52] J. P. Martínez, S. Olmos, and P. Laguna, “T wave alternans and acuteischemia in patients undergoing angioplasty,” in Proc. Comput. Cardiol.2002, vol. 29, 2002, pp. 569–572.
[53] B. D. Nearing, P. H. Stone, and R. L. Verrier, “Frequency-response char-acteristics required for detection of T-wave alternans during ambulatoryECG monitoring,” Ann. Noninvasive Electrocardiol., pt. 1, vol. 1, no. 2,pp. 103–112, 1996.
[54] G. B. Moody and R. G. Mark, “Development and evaluation of a 2-leadECG analysis program,” Comput. Cardiol., pp. 39–44, 1982.
[55] N. V. Thakor, J. G. Webster, and W. J. Tompkins, “Estimation of QRScomplex power spectrum for design of a QRS filter,” IEEE Trans.Biomed. Eng., vol. BME-31, no. 11, pp. 702–706, Nov. 1984.
[56] L. Burattini, W. Zareba, J. P. Couderc, J. A. Konecki, and A. J. Moss,“Optimizing ECG signal sampling frequency for T-wave alternans de-tection,” Comput. Cardiol., vol. 25, pp. 721–724, 1998.
[57] B.-U. Köhler, C. Hennig, and R. Orglmeister, “The principles of soft-ware QRS detection,” IEEE Eng. Med. Biol. Mag., vol. 21, no. 1, pp.42–57, Jan./Feb. 2002.
[58] S. M. Narayan and J. M. Smith, “Spectral analysis of periodic fluctua-tions in electrocardiographic repolarization,” IEEE Trans. Biomed. Eng.,vol. 46, no. 2, pp. 203–212, Feb. 1999.
[59] M. J. Lisenby and P. C. Richardson, “The beatquency domain: an un-usual application of the fast Fourier transform,” IEEE Trans. Biomed.Eng., vol. BME-24, pp. 405–408, 1977.
[60] S. Olmos, J. Garcia, R. Jané, and P. Laguna, “Truncated orthogonal ex-pansions of recurrent signals: equivalence to a linear time-variant peri-odic filter,” IEEE Trans. Signal Process., vol. 47, no. 11, pp. 3164–3172,Nov. 1999.
[61] , “ECG signal compression plus noise filtering with truncated or-thogonal expansions,” Signal Process., vol. 79, no. 1, pp. 97–115, Oct1999.
[62] J. P. Martínez, S. Olmos, and P. Laguna, “T wave alternans detection: asimulation study and analysis of the European ST-T database,” Comput.Cardiol., vol. 27, pp. 155–158, 2000.
[63] S. M. Narayan, B. D. Lindsay, and J. M. Smith, “Demonstration of theproarrhythmic preconditioning of single premature extrastimuli by useof the magnitude, phase and distribution of repolarization alternans,”Circulation, vol. 100, pp. 1887–1893, 1999.
MARTÍNEZ and OLMOS: METHODOLOGICAL PRINCIPLES OF TWA ANALYSIS: A UNIFIED FRAMEWORK 613
[64] E. S. Kaufman, J. A. Mackall, B. Julka, C. Drabek, and D. S. Rosen-baum, “Influence of heart rate and sympathetic stimulation on arrhyth-mogenic T wave alternans,” Am. J. Physiol. Heart Circ. Physiol., vol.279, pp. H1248–H1255, 2000.
[65] B. Kedem, “Spectral analysis and discrimination by zero-crossings,”Proc. IEEE, vol. 74, no. 11, pp. 1477–1493, Nov. 1986.
[66] R. Mrowka, H. Theres, A. Patzak, and G. Baumann, “Alternans-like phe-nomena due to filtering of electrocardiographic data,” Comput. Cardiol.1998, pp. 725–727, 1998.
Juan Pablo Martínez was born in Zaragoza,Aragon, Spain, in 1976. He received the M. Sc.degree in telecommunication engineering (withhighest honors) from the University of Zaragoza(UZ), in 1999.
From 1999 to 2000 he was with the Departmentof Electronic Engineering and Communications,UZ, as a Research Fellow. Since 2000, he is asan Assistant Professor in the same Department.He is also involved as researcher with the AragonInstitute of Engineering Research (I3A), UZ. His
professional research activity lies in the field of biomedical signal processing,with main interest in signals of cardiovascular origin.
Salvador Olmos (A’01–M’03) was born in Va-lencia, Spain in 1969. He received the IndustrialEngineering degree and the Ph.D. degree from thePolytechnic University of Catalonia, Catalonia,Spain, in 1993 and 1998, respectively.
He is currently an Associate Professor of SignalProcessing and Communications in the Departmentof Electronics Engineering and Communicationsat Zaragoza University, Spain. From August 2000to August 2001 he was with the Department ofElectroscience, Lund University, Lund, Sweden,
supported by a postdoctoral research grant from Spanish Government. Hisprofessional research interests are in signal processing of biomedical signals.
Related Documents