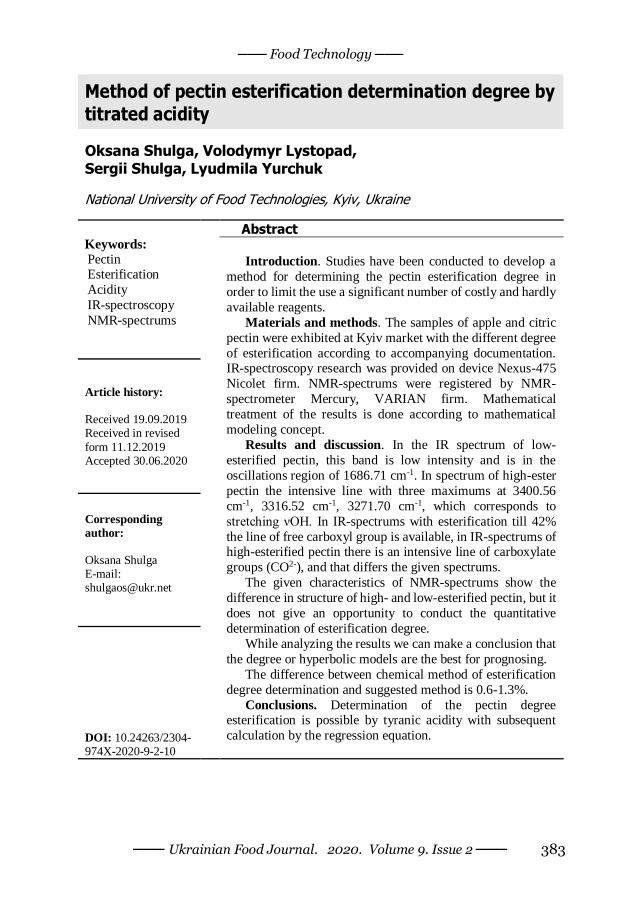
─── Food Technology ─── ─── Ukrainian Food Journal. 2020. Volume 9. Issue 2 ─── 383 Method of pectin esterification determination degree by titrated acidity Oksana Shulga, Volodymyr Lystopad, Sergii Shulga, Lyudmila Yurchuk National University of Food Technologies, Kyiv, Ukraine Keywords: Pectin Esterification Acidity IR-spectroscopy NMR-spectrums Abstract Introduction. Studies have been conducted to develop a method for determining the pectin esterification degree in order to limit the use a significant number of costly and hardly available reagents. Materials and methods. The samples of apple and citric pectin were exhibited at Kyiv market with the different degree of esterification according to accompanying documentation. IR-spectroscopy research was provided on device Nexus-475 Nicolet firm. NMR-spectrums were registered by NMR- spectrometer Mercury, VARIAN firm. Mathematical treatment of the results is done according to mathematical modeling concept. Results and discussion. In the IR spectrum of low- esterified pectin, this band is low intensity and is in the oscillations region of 1686.71 cm -1 . In spectrum of high-ester pectin the intensive line with three maximums at 3400.56 cm -1 , 3316.52 cm -1 , 3271.70 cm -1 , which corresponds to stretching νOH. In IR-spectrums with esterification till 42% the line of free carboxyl group is available, in IR-spectrums of high-esterified pectin there is an intensive line of carboxylate groups (CO 2- ), and that differs the given spectrums. The given characteristics of NMR-spectrums show the difference in structure of high- and low-esterified pectin, but it does not give an opportunity to conduct the quantitative determination of esterification degree. While analyzing the results we can make a conclusion that the degree or hyperbolic models are the best for prognosing. The difference between chemical method of esterification degree determination and suggested method is 0.6-1.3%. Conclusions. Determination of the pectin degree esterification is possible by tyranic acidity with subsequent calculation by the regression equation. Article history: Received 19.09.2019 Received in revised form 11.12.2019 Accepted 30.06.2020 Corresponding author: Oksana Shulga E-mail: [email protected] DOI: 10.24263/2304- 974X-2020-9-2-10

Welcome message from author
This document is posted to help you gain knowledge. Please leave a comment to let me know what you think about it! Share it to your friends and learn new things together.
Transcript
─── Food Technology ───
─── Ukrainian Food Journal. 2020. Volume 9. Issue 2 ─── 383
Method of pectin esterification determination degree by
titrated acidity
Oksana Shulga, Volodymyr Lystopad,
Sergii Shulga, Lyudmila Yurchuk
National University of Food Technologies, Kyiv, Ukraine
Keywords: Pectin Esterification
Acidity
IR-spectroscopy
NMR-spectrums
Abstract
Introduction. Studies have been conducted to develop a
method for determining the pectin esterification degree in
order to limit the use a significant number of costly and hardly
available reagents.
Materials and methods. The samples of apple and citric
pectin were exhibited at Kyiv market with the different degree
of esterification according to accompanying documentation. IR-spectroscopy research was provided on device Nexus-475
Nicolet firm. NMR-spectrums were registered by NMR-
spectrometer Mercury, VARIAN firm. Mathematical
treatment of the results is done according to mathematical
modeling concept.
Results and discussion. In the IR spectrum of low-
esterified pectin, this band is low intensity and is in the
oscillations region of 1686.71 cm-1. In spectrum of high-ester
pectin the intensive line with three maximums at 3400.56
cm-1, 3316.52 cm-1, 3271.70 cm-1, which corresponds to
stretching νOH. In IR-spectrums with esterification till 42%
the line of free carboxyl group is available, in IR-spectrums of high-esterified pectin there is an intensive line of carboxylate
groups (CO2-), and that differs the given spectrums.
The given characteristics of NMR-spectrums show the
difference in structure of high- and low-esterified pectin, but it
does not give an opportunity to conduct the quantitative
determination of esterification degree.
While analyzing the results we can make a conclusion that
the degree or hyperbolic models are the best for prognosing.
The difference between chemical method of esterification
degree determination and suggested method is 0.6-1.3%.
Conclusions. Determination of the pectin degree esterification is possible by tyranic acidity with subsequent
calculation by the regression equation.
Article history:
Received 19.09.2019 Received in revised
form 11.12.2019 Accepted 30.06.2020
Corresponding
author: Oksana Shulga E-mail: [email protected]
DOI: 10.24263/2304-974X-2020-9-2-10
─── Food Technology ───
─── Ukrainian Food Journal. 2020. Volume 9. Issue 2 ─── 384
Introduction One the most important nutritional and technological characteristics of pectin is its
esterification degree [1]. The determining of this indicator needs the use of essential amount
of reagents according to approved methods and time. A task was set up to find an alternative method of determining the degree of pectin esterification, since it is necessary to know the
degree of pectin esterification in order to produce marmalade products.
According to the known method by national standard of Ukraine the esterification degree
is a correlation of polygalacturonic acid esterified carboxyl groups to their general amount in
pectin. This method of determination of pectin esterification degree needs the following
reagents: hydrochloric acid, sodium hydroxide, ethyl alcohol rectified, silver nitrate,
indicator alizarin, ammonia aqueous solution concentrate, bromothymol blue, cresol red,
phenol red.
In literature there are data about the alternative methods of determination of pectin
esterification degree such as the suggested method with the use IR-spectroscopy [2, 3, 7],
NMR-spectroscopy [8], chromatography [9]. It is developed the improved method of high-
performance liquid chromatography (HPLC) for simultaneous determination of pectin degrees of methylation and acetylation [5]. The suggested way includes the saponification in
heterogeneous environment with the next separation of methanol, acetic acid and inner
standard on C18 column and the quantitative determination with the help of refractometry
[6]. But the suggested alternative methods need the use of special expensive equipment: IR-
and NMR-spectroscopes and chromatograph [4, 8]. That is why the search of the alternative
method which does not need the use of expensive equipment and big amount of reagents on
determination of pectin esterification degree remains actual.
The purpose of the study is to develop a method for determining the esterification degree
using a minimum number of reagents, which does not require a significant amount of time.
Materials and methods
Materials
Samples of apple and citrus pectin presented with different esterification degrees.
Methods
The total acidity was determined by the titration method of pectin batch solution in the
presence of phenolphthalein [16].
The esterification degree was determined method that is based on the titrimetric analysis
of free and after saponification esterified carboxyl groups of polygalacturonic acid in pectin
batch, which is purified from soluble ballast additives and cations [16].
The presence of a carboxyl group in pectin of different esterification degrees was
determined by IR spectroscopy [7]. IR-spectroscopy research was provided on device Nexus-
475 Nicolet firm, in pills with KBr. The chemical shift of the protons that are part of the pectin structural components was
recorded using NMR spectra [8]. NMR-spectrums were registered by NMR-spectrometer
Mercury, VARIAN firm, 400 MHz in the solution DMSO-d6.

─── Food Technology ───
─── Ukrainian Food Journal. 2020. Volume 9. Issue 2 ─── 385
Processing of research results
Mathematical treatment of the results is done according to mathematical modeling
concept [11].
Results and discussion With the aim to get the complete characteristics of pectin properties with different degree
of esterification, except total acidity, IR- and NMR-researches of chosen pectin samples were
conducted.
The structure of pectin with different degrees of esterification is characterized by the
presence of methylated carboxyl groups (see Figure 1).
a b
Figure. 1. Pectin structure: a – highly esterified; b – low esterified
The given different pectin structure is confirmed by IR- and NMR-spectrometric
researches, which are given further.
IR-spectroscopy research
According to the above given literature data [12], high- and low-esterified pectin have different IR-spectrums.
The IR-spectrums of high-ester (58-62%) and low-ester pectin (27-33%) Figure 2.
─── Food Technology ───
─── Ukrainian Food Journal. 2020. Volume 9. Issue 2 ─── 386
a
b
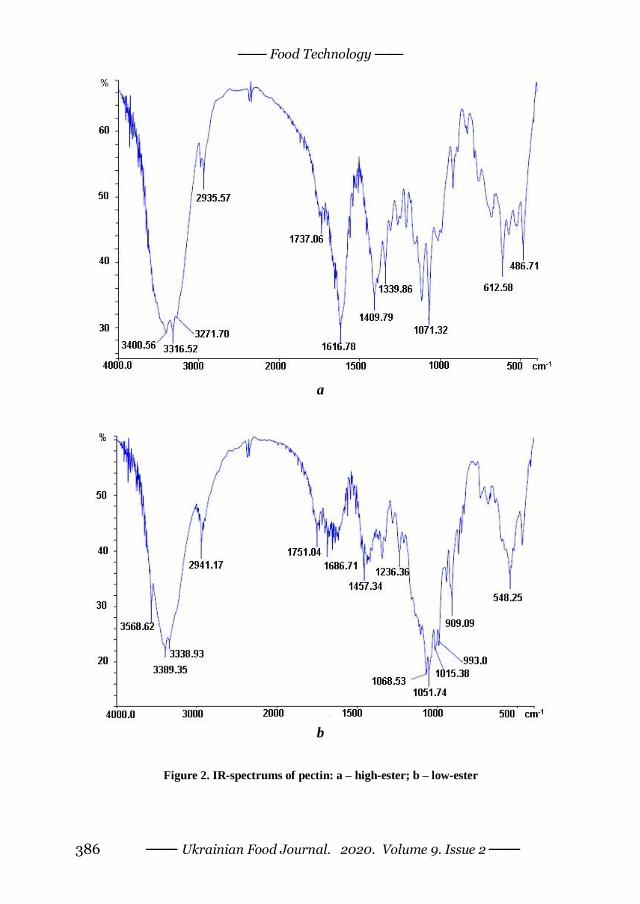
Figure 2. IR-spectrums of pectin: a – high-ester; b – low-ester
─── Food Technology ───
─── Ukrainian Food Journal. 2020. Volume 9. Issue 2 ─── 387
In spectrum of high-ester pectin the intensive line with three maximums at 3400.56
cm-1, 3316.52 cm-1, 3271.70 cm-1 is presented, which corresponds to stretching νOH. In IR-
spectrum of low-ester pectin this line has maximum at 3568.62 cm-1, separated from the
other two 3389.35 cm-1 is located in weaker vibrations region, that shows a greater degree
of hydrogen bonds, and confirms a lower degree of esterification. Maximum at 3568.62 cm-
1 it corresponds to stretching of free carboxyl group, that also confirms low esterification
degree.
The line at 2935.57 cm-1 of high-ester pectin sample and at 2941.41 cm-1 of low-ester sample are due to the presence of asymmetric and symmetric vibrations νC-H, which are
located in remainders of galactopyranose rings of pectin.
In both spectrums of low- and high-ester pectin samples lines at 1737.06 cm-1 and at
1751.04 cm-1 of weak intensity exist, which correspond to vibrations of ester group C=O in
composition of high- and low-ester pectin respectively.
In IR-spectrum of high-ester pectin sample the presented line of high intensity at 1616.78
cm-1 belongs to latitudinal vibrations of adsorbed related water that is crossed by asymmetric
vibrations of carboxylate ion (CO2-). In IR-spectrum of low-ester pectin sample this line is of
weak intensity and is located in vibration region at 1686.71 cm-1.
Besides this, IR-spectrums samples with esterification degree 24%, 28-36%, 38%, 36-
42%, 65-68%, 66-68% were received. In IR-spectrums with esterification till 42% the line of
free carboxyl group is available, in IR-spectrums of high-ester pectin there is an intensive line of carboxylate groups (CO2-), and that differs the given spectrums.
NMR-researches research
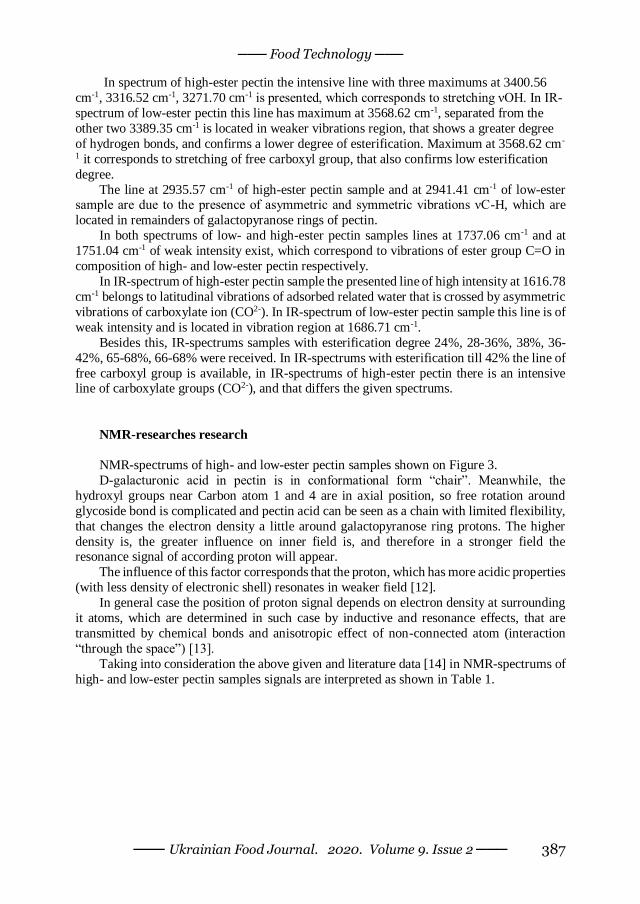
NMR-spectrums of high- and low-ester pectin samples shown on Figure 3.
D-galacturonic acid in pectin is in conformational form “chair”. Meanwhile, the
hydroxyl groups near Carbon atom 1 and 4 are in axial position, so free rotation around
glycoside bond is complicated and pectin acid can be seen as a chain with limited flexibility,
that changes the electron density a little around galactopyranose ring protons. The higher
density is, the greater influence on inner field is, and therefore in a stronger field the resonance signal of according proton will appear.
The influence of this factor corresponds that the proton, which has more acidic properties
(with less density of electronic shell) resonates in weaker field [12].
In general case the position of proton signal depends on electron density at surrounding
it atoms, which are determined in such case by inductive and resonance effects, that are
transmitted by chemical bonds and anisotropic effect of non-connected atom (interaction
“through the space”) [13].
Taking into consideration the above given and literature data [14] in NMR-spectrums of
high- and low-ester pectin samples signals are interpreted as shown in Table 1.
─── Food Technology ───
─── Ukrainian Food Journal. 2020. Volume 9. Issue 2 ─── 388
a
b
Figure 3. NMR-spectrums of pectin: a – high-ester; b – low-ester
─── Food Technology ───
─── Ukrainian Food Journal. 2020. Volume 9. Issue 2 ─── 389
Table 1
Interpretation of NMR-spectrums of high- and low-ester pectin
Proton type Value of chemical shift ppm
High-ester pectin Low-ester pectin
-ОСН3 3.579 3.567
4-Н 3.632 3.639
5-Н 3.780*
3.769
3-Н 3.870
2-ОН 4.605 4.425
1-Н 5.102 4.805
3-ОН 5.514 5.170
2-Н - 3.184
*signals overlapped one by one
The given characteristics of NMR-spectrums shows the difference in structure of high-
and low-ester pectin, but it does not give an opportunity to conduct the quantitative
determination of esterification degree.
Total pectin acidity research
Results of research of total acidity determination of pectin samples shown on Figure 4.
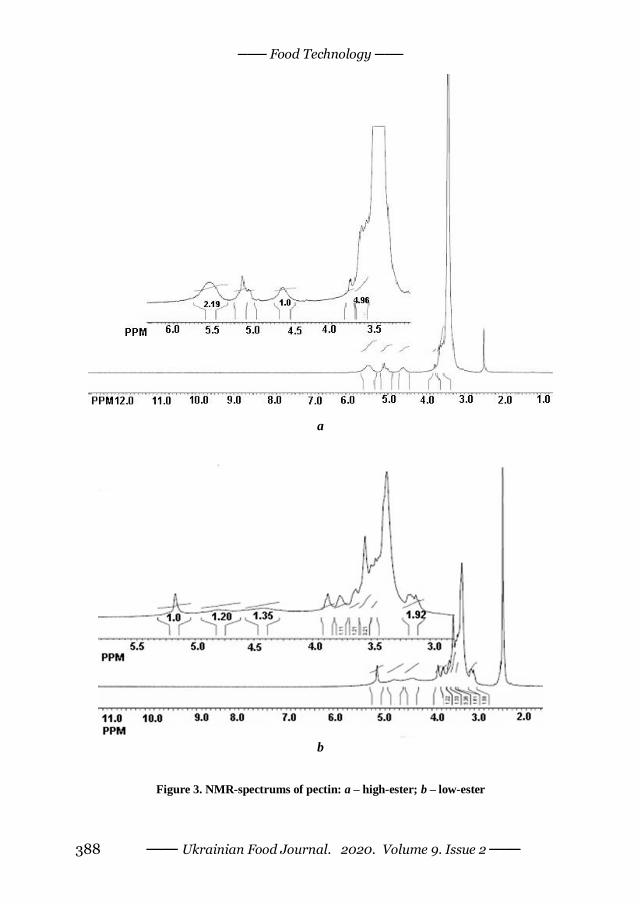
Figure 4. Total acidity change depending on pectin esterification degree
According to the given results (see Figure 4) there is a certain dependence between total
acidity and degree of pectin esterification. It gives the base for searching the mathematical
model.
0
10
20
30
40
50
60
70
80
80 100 120 140 160 180 200 220 240
Es
teri
fic
ati
on
de
gre
e,%
Acidity, derrees
─── Food Technology ───
─── Ukrainian Food Journal. 2020. Volume 9. Issue 2 ─── 390
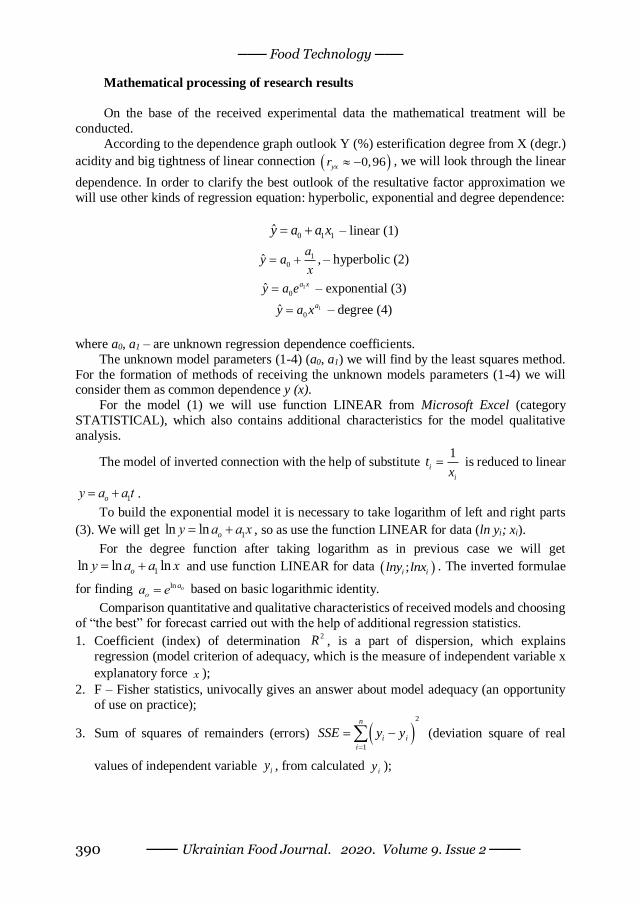
Mathematical processing of research results
On the base of the received experimental data the mathematical treatment will be
conducted.
According to the dependence graph outlook Y (%) esterification degree from X (degr.)
acidity and big tightness of linear connection 0,96yxr , we will look through the linear
dependence. In order to clarify the best outlook of the resultative factor approximation we
will use other kinds of regression equation: hyperbolic, exponential and degree dependence:
0 1 1y a a x – linear (1)
1
0ˆ ,
аy a
х – hyperbolic (2)
1
0ˆ a xy a e
– exponential (3)
1
0ˆ ay a x
– degree (4)
where a0, a1 – are unknown regression dependence coefficients.
The unknown model parameters (1-4) (a0, a1) we will find by the least squares method.
For the formation of methods of receiving the unknown models parameters (1-4) we will consider them as common dependence y (x).
For the model (1) we will use function LINEAR from Microsoft Excel (category
STATISTICAL), which also contains additional characteristics for the model qualitative
analysis.
The model of inverted connection with the help of substitute 1
i
i
tx
is reduced to linear
1oу a a t .
To build the exponential model it is necessary to take logarithm of left and right parts
(3). We will get 1ln ln oу a a x , so as use the function LINEAR for data (ln yi; xi).
For the degree function after taking logarithm as in previous case we will get
1ln ln lnoу a a x and use function LINEAR for data ;i ilny lnx . The inverted formulae
for finding ln oa
оа e based on basic logarithmic identity.
Comparison quantitative and qualitative characteristics of received models and choosing
of “the best” for forecast carried out with the help of additional regression statistics.
1. Coefficient (index) of determination 2R , is a part of dispersion, which explains
regression (model criterion of adequacy, which is the measure of independent variable x
explanatory force х );
2. F – Fisher statistics, univocally gives an answer about model adequacy (an opportunity
of use on practice);
3. Sum of squares of remainders (errors) 2
1
n
i i
i
SSE y y
(deviation square of real
values of independent variable iy , from calculated iy );
─── Food Technology ───
─── Ukrainian Food Journal. 2020. Volume 9. Issue 2 ─── 391
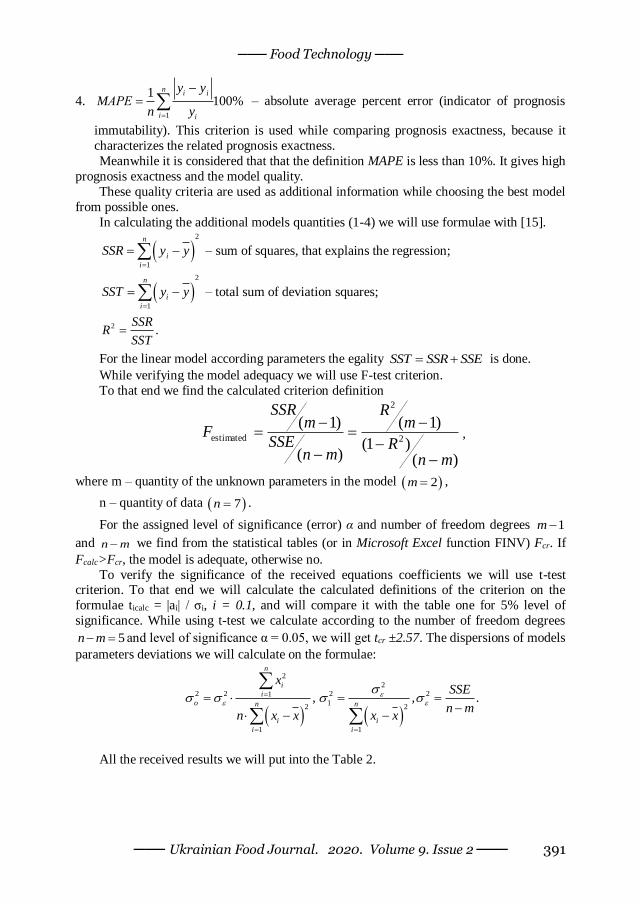
4. 1
1100%
ni i
i i
y yMАPE
n y
– absolute average percent error (indicator of prognosis
immutability). This criterion is used while comparing prognosis exactness, because it
characterizes the related prognosis exactness.
Meanwhile it is considered that that the definition MAPE is less than 10%. It gives high
prognosis exactness and the model quality.
These quality criteria are used as additional information while choosing the best model
from possible ones.
In calculating the additional models quantities (1-4) we will use formulae with [15].
2
1
n
i
i
SSR y y
– sum of squares, that explains the regression;
2
1
n
i
i
SST y y
– total sum of deviation squares;
2 .SSR
RSST
For the linear model according parameters the egality SST SSR SSE is done.
While verifying the model adequacy we will use F-test criterion.
To that end we find the calculated criterion definition
)()1(
)1(
)(
)1(2
2
estimated
mnR
mR
mnSSE
mSSR
F
,
where m – quantity of the unknown parameters in the model 2m ,
n – quantity of data 7n .
For the assigned level of significance (error) α and number of freedom degrees 1m
and n m we find from the statistical tables (or in Microsoft Excel function FINV) Fcr. If
Fcalc>Fcr, the model is adequate, otherwise no.
To verify the significance of the received equations coefficients we will use t-test criterion. To that end we will calculate the calculated definitions of the criterion on the
formulae ticalc = |ai| / σi, i = 0.1, and will compare it with the table one for 5% level of
significance. While using t-test we calculate according to the number of freedom degrees
5n m and level of significance α = 0.05, we will get tcr ±2.57. The dispersions of models
parameters deviations we will calculate on the formulae:
2
2
2 2 2 21
12 2
1 1
, , .
n
i
i
o n n
i i
i i
xSSE
n mn x x x x
All the received results we will put into the Table 2.
─── Food Technology ───
─── Ukrainian Food Journal. 2020. Volume 9. Issue 2 ─── 392
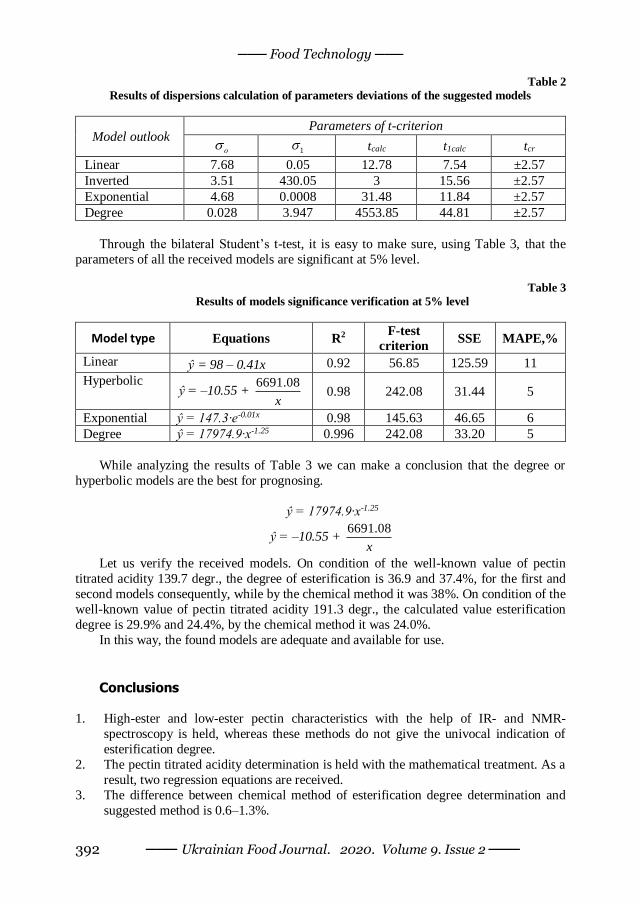
Table 2
Results of dispersions calculation of parameters deviations of the suggested models
Model outlook Parameters of t-criterion
о 1 tcalc t1calc tcr
Linear 7.68 0.05 12.78 7.54 ±2.57
Inverted 3.51 430.05 3 15.56 ±2.57
Exponential 4.68 0.0008 31.48 11.84 ±2.57
Degree 0.028 3.947 4553.85 44.81 ±2.57
Through the bilateral Student’s t-test, it is easy to make sure, using Table 3, that the
parameters of all the received models are significant at 5% level.
Table 3
Results of models significance verification at 5% level
Model type Equations R2 F-test
criterion SSE MAPE,%
Linear ŷ = 98 – 0.41x 0.92 56.85 125.59 11
Hyperbolic ŷ = –10.55 +
6691.08
x 0.98 242.08 31.44 5
Exponential ŷ = 147.3∙e-0.01x 0.98 145.63 46.65 6
Degree ŷ = 17974.9∙x-1.25 0.996 242.08 33.20 5
While analyzing the results of Table 3 we can make a conclusion that the degree or
hyperbolic models are the best for prognosing.
ŷ = 17974.9∙x-1.25
ŷ = –10.55 + 6691.08
x
Let us verify the received models. On condition of the well-known value of pectin
titrated acidity 139.7 degr., the degree of esterification is 36.9 and 37.4%, for the first and
second models consequently, while by the chemical method it was 38%. On condition of the
well-known value of pectin titrated acidity 191.3 degr., the calculated value esterification
degree is 29.9% and 24.4%, by the chemical method it was 24.0%.
In this way, the found models are adequate and available for use.
Conclusions
1. High-ester and low-ester pectin characteristics with the help of IR- and NMR-
spectroscopy is held, whereas these methods do not give the univocal indication of
esterification degree.
2. The pectin titrated acidity determination is held with the mathematical treatment. As a
result, two regression equations are received.
3. The difference between chemical method of esterification degree determination and
suggested method is 0.6–1.3%.
─── Food Technology ───
─── Ukrainian Food Journal. 2020. Volume 9. Issue 2 ─── 393
References
1. Gnanasambandam R., Proctor A. (2000), Determination of pectin degree of
esterification by diffuse reflectance Fourier transform infrared spectroscopy. Food
chemistry, 68(3), pp. 327–332.
2. Chatjigakis A. K., Pappas, C., Proxenia N., Kalantzi O., Rodis, P., & Polissiou M.
(1998), FT–IR spectroscopic determination of the degree of esterification of cell wall
pectins from stored peaches and correlation to textural changes. Carbohydrate
Polymers, 37(4), pp. 395–408.
3. Manrique G. D., & Lajolo F. M. (2002), FT–IR spectroscopy as a tool for measuring
degree of methyl esterification in pectins isolated from ripening papaya fruit.
Postharvest Biology and Technology, 25(1), pp. 99–107. 4. Monsoor M. A., Kalapathy U., & Proctor A. (2001), Improved method for
determination of pectin degree of esterification by diffuse reflectance Fourier transform
infrared spectroscopy. Journal of Agricultural and Food Сhemistry, 49(6), pp. 2756–
2760. DOI: 10.1021/jf0009448
5. Fellah A., Anjukandi P., Waterland M. R., & Williams M. A. (2009), Determining the
degree of methylesterification of pectin by ATR/FT–IR: Methodology optimisation and
comparison with theoretical calculations. Carbohydrate polymers, 78(4), pp. 847–853.
6. Pappas C. S., Malovikova A., Hromadkova Z., Tarantilis P. A., Ebringerova A., &
Polissiou M. G. (2004), Determination of the degree of esterification of pectinates with
decyl and benzyl ester groups by diffuse reflectance infrared Fourier transform
spectroscopy (DRIFTS) and curve–fitting deconvolution method. Carbohydrate
Polymers, 56(4), pp. 465–469. 7. Barros A. S., Mafra I., Ferreira D., Cardoso S., Reis A., da Silva J. L., & Coimbra M.
A. (2002), Determination of the degree of methylesterification of pectic polysaccharides
by FT–IR using an outer product PLS1 regression. Carbohydrate Polymers, 50(1), pp.
85–94.
8. Grasdalen H., Bakøy, O. E., & Larsen B. (1988), Determination of the degree of
esterification and the distribution of methylated and free carboxyl groups in pectins by
1H–NMR spectroscopy. Carbohydrate Research, 184, pp. 183–191.
9. Voragen A. G. J., Schols H. A., & Pilnik W. (1986), Determination of the degree of
methylation and acetylation of pectins by HPLC. Food hydrocolloids, 1(1): 65–70. DOI:
10.1016/S0268–005X(86)80008–X
10. Levigne S., Thomas M., Ralet M. C., Quemener B., & Thibault J. F. (2002), Determination of the degrees of methylation and acetylation of pectins using a C18
column and internal standards. Food Hydrocolloids, 16(6), pp. 547–550.
11. Bondar A. G. (1976), Planirovanie eksperimenta v himicheskoy tehnologii (osnovnyie
polozheniya, primeryi i zadachi), Vischa shkola, Kyiv.
12. Mironov V. A., Yankovskiy S.A. (1985), Spektroskopiya v organicheskoy himii.
Sbornik zadach. Himiya, Moscow.
13. Braun D., Floyd A., Seynzberi M. (1992), Spektroskopiya organicheskih veschestv.
Mir, Moscow.
14. Namazi H., Fathi F., & Dadkhah A. (2011), Hydrophobically modified starch using
long–chain fatty acids for preparation of nanosized starch particles. Scientia Iranica,
18(3), pp. 439–445.
15. Luk’yanenko I. G., KrasnIkova L. I. (1998), Ekonometrika. Znannya, Kyiv. 16. Harris D. C. (2010), Quantitative chemical analysis. Macmillan, New York.
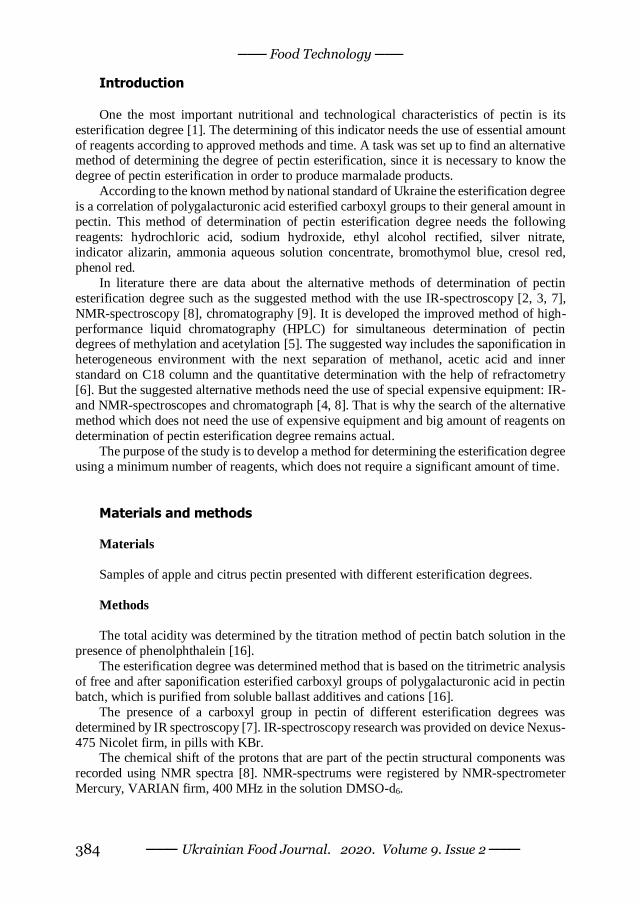
Related Documents

![INDEX [chempap.org] Filippov, M. P. and Kohn, В., Determination of the esterification degree of carboxyl groups of pectin with methanol by means of infrared spectroscopy. 88 Fojtík,](https://static.cupdf.com/doc/110x72/60b77059ac9b0159985c14f6/index-filippov-m-p-and-kohn-determination-of-the-esterification-degree.jpg)