Method for quantitative measurements of the elastic modulus of biological cells in AFM indentation experiments Igor Sokolov a,⇑ , Maxim E. Dokukin a , Nataliia V. Guz b a Department of Mechanical Engineering, Department of Biomedical Engineering, Tufts University, Medford, MA 02155, USA b Department of Physics, Clarkson University, Potsdam, NY 13699-5820, USA article info Article history: Available online 30 April 2013 Keywords: Cell mechanics The Young’s modulus The elastic modulus Indentation of soft materials Atomic force microscopy (AFM) abstract Here we overview and further develop a quantitative method to measure mechanics of biological cells in indentation experiments, which is based on the use of atomic force microscopy (AFM). We demonstrate how the elastic modulus of the cell body should be measured when the cellular brush is taken into account. The brush is an essential inelastic part of the cell, which surrounds all eukaryotic (the brush is mostly microvilli and glycocalyx) and gram-negative prokaryotic cells (the brush is polysaccharides). The other main feature of the described method is the use of a relatively dull AFM probe to stay in the linear stress–strain regime. In particular, we show that the elastic modulus (aka the Young’s modulus) of cells is independent of the indentation depth up to 10–20% deformation for the eukaryotic cells studied here. Besides the elastic modulus, the method presented allows obtaining the parameters of cellular brush, such as the effective length and grafting density of the brush. Although the method is demon- strated on eukaryotic cells, it is directly applicable for all types of cells, and even non-biological soft mate- rials surrounded by either a brush or any field of long-range forces. Ó 2013 Elsevier Inc. All rights reserved. 1. Introduction Cell mechanics is a relatively young, yet not a well-developed area. Under regular functioning inside organisms, cells are subject to various mechanical forces. Most cell types in the human body, like muscle, epithelial, blood cells, neurons, and others stay under permanently changing force environment. Mechanical properties of cells define a different physical response of cells to these exter- nal stresses. Therefore, the study of cell mechanics is expected to be of fundamental interest. There is also a recently emerged practical interest to measure cell mechanics quantitatively. The changes in the mechanical prop- erties of cell may alter the biological and mechanical responses of tissue and organs. Therefore, it is plausible to expect that the alter- ation of the cell mechanics may lead to various pathologies or dis- eases. It makes the analysis of basic parameters of cell mechanics an important instrument to derive new fundamental insights of the diseases, to help develop new methods of diagnosis. Correla- tion between elasticity of cells and different human diseases or abnormalities has been recently reported. It has been implicated in the pathogenesis of many progressive diseases, including vascu- lar diseases, cancer, malaria, kidney disease, cataracts, Alzheimer’s Dementia, complications of diabetes, cardiomyopathies [1–3]. In some cases, it is believed that the loss of tissue elasticity arises from the changes in the extracellular matrix [4], not the cells them- selves. However, it has recently been shown that the cells them- selves can also change their rigidity quite considerably due to cancer, malaria, arthritis, and even aging [81,39,7]. For instance, the stiffening of red blood cells infected with malaria [8–11] was found to be responsible for fatal incidents of this disease. It was also discovered that the mobility and spreading of cancer cells may be controlled by the application of external forces, which may alter the rigidity of a tumor. Recently, the reported low rigid- ity of cancer cells was suggested to be used for cancer diagnosis [7,12–15]. At present, there are several methods to study cell mechanics, which are based on Atomic Force Microscopy (AFM) probe inden- tation [15,16], optical tweezers [17–19], magnetic beads [20–30], and micropipettes [31–38]. While every method has its pros and cons, AFM is presumably one of the most versatile approaches allowing high-accuracy measurements of forces and deformations [6] in a rather broad range of strains. The present paper deals with a method developed by the authors to measure cell mechanics by using the AFM technique. The main features of the described method are: (A) taking into ac- count the cellular brush, an essential inelastic part of the cell, which surrounds all eukaryotic (the brush is mostly microvilli and glycocalyx) and gram-negative prokaryotic cells (the brush is polysaccharides); (B) the method uses a relatively dull AFM probe 1046-2023/$ - see front matter Ó 2013 Elsevier Inc. All rights reserved. http://dx.doi.org/10.1016/j.ymeth.2013.03.037 ⇑ Corresponding author. E-mail address: [email protected] (I. Sokolov). Methods 60 (2013) 202–213 Contents lists available at SciVerse ScienceDirect Methods journal homepage: www.elsevier.com/locate/ymeth

Welcome message from author
This document is posted to help you gain knowledge. Please leave a comment to let me know what you think about it! Share it to your friends and learn new things together.
Transcript

Methods 60 (2013) 202–213
Contents lists available at SciVerse ScienceDirect
Methods
journal homepage: www.elsevier .com/locate /ymeth
Method for quantitative measurements of the elastic modulus of biologicalcells in AFM indentation experiments
Igor Sokolov a,⇑, Maxim E. Dokukin a, Nataliia V. Guz b
a Department of Mechanical Engineering, Department of Biomedical Engineering, Tufts University, Medford, MA 02155, USAb Department of Physics, Clarkson University, Potsdam, NY 13699-5820, USA
a r t i c l e i n f o
Article history:Available online 30 April 2013
Keywords:Cell mechanicsThe Young’s modulusThe elastic modulusIndentation of soft materialsAtomic force microscopy (AFM)
1046-2023/$ - see front matter � 2013 Elsevier Inc. Ahttp://dx.doi.org/10.1016/j.ymeth.2013.03.037
⇑ Corresponding author.E-mail address: [email protected] (I. Sokolov)
a b s t r a c t
Here we overview and further develop a quantitative method to measure mechanics of biological cells inindentation experiments, which is based on the use of atomic force microscopy (AFM). We demonstratehow the elastic modulus of the cell body should be measured when the cellular brush is taken intoaccount. The brush is an essential inelastic part of the cell, which surrounds all eukaryotic (the brushis mostly microvilli and glycocalyx) and gram-negative prokaryotic cells (the brush is polysaccharides).The other main feature of the described method is the use of a relatively dull AFM probe to stay in thelinear stress–strain regime. In particular, we show that the elastic modulus (aka the Young’s modulus)of cells is independent of the indentation depth up to 10–20% deformation for the eukaryotic cells studiedhere. Besides the elastic modulus, the method presented allows obtaining the parameters of cellularbrush, such as the effective length and grafting density of the brush. Although the method is demon-strated on eukaryotic cells, it is directly applicable for all types of cells, and even non-biological soft mate-rials surrounded by either a brush or any field of long-range forces.
� 2013 Elsevier Inc. All rights reserved.
1. Introduction
Cell mechanics is a relatively young, yet not a well-developedarea. Under regular functioning inside organisms, cells are subjectto various mechanical forces. Most cell types in the human body,like muscle, epithelial, blood cells, neurons, and others stay underpermanently changing force environment. Mechanical propertiesof cells define a different physical response of cells to these exter-nal stresses. Therefore, the study of cell mechanics is expected tobe of fundamental interest.
There is also a recently emerged practical interest to measurecell mechanics quantitatively. The changes in the mechanical prop-erties of cell may alter the biological and mechanical responses oftissue and organs. Therefore, it is plausible to expect that the alter-ation of the cell mechanics may lead to various pathologies or dis-eases. It makes the analysis of basic parameters of cell mechanicsan important instrument to derive new fundamental insights ofthe diseases, to help develop new methods of diagnosis. Correla-tion between elasticity of cells and different human diseases orabnormalities has been recently reported. It has been implicatedin the pathogenesis of many progressive diseases, including vascu-lar diseases, cancer, malaria, kidney disease, cataracts, Alzheimer’sDementia, complications of diabetes, cardiomyopathies [1–3]. In
ll rights reserved.
.
some cases, it is believed that the loss of tissue elasticity arisesfrom the changes in the extracellular matrix [4], not the cells them-selves. However, it has recently been shown that the cells them-selves can also change their rigidity quite considerably due tocancer, malaria, arthritis, and even aging [81,39,7]. For instance,the stiffening of red blood cells infected with malaria [8–11] wasfound to be responsible for fatal incidents of this disease. It wasalso discovered that the mobility and spreading of cancer cellsmay be controlled by the application of external forces, whichmay alter the rigidity of a tumor. Recently, the reported low rigid-ity of cancer cells was suggested to be used for cancer diagnosis[7,12–15].
At present, there are several methods to study cell mechanics,which are based on Atomic Force Microscopy (AFM) probe inden-tation [15,16], optical tweezers [17–19], magnetic beads [20–30],and micropipettes [31–38]. While every method has its pros andcons, AFM is presumably one of the most versatile approachesallowing high-accuracy measurements of forces and deformations[6] in a rather broad range of strains.
The present paper deals with a method developed by theauthors to measure cell mechanics by using the AFM technique.The main features of the described method are: (A) taking into ac-count the cellular brush, an essential inelastic part of the cell,which surrounds all eukaryotic (the brush is mostly microvilliand glycocalyx) and gram-negative prokaryotic cells (the brush ispolysaccharides); (B) the method uses a relatively dull AFM probe
I. Sokolov et al. / Methods 60 (2013) 202–213 203
to stay in the linear stress–strain regime. AFM is known to be aquantitative method to study mechanics of soft materials in gen-eral [40–42]. It has been widely used to measure the various cellproperties [43], in particular, the cell mechanics [81,7,44–52].AFM combines (a) high sensitivity to force and deformations inthe right range of strains to probe virtually all cell types, and (b)a precise positioning the AFM probe on the cell surface [53–56].This combination of features makes it possible to perform theAFM indentation measurements in a highly quantitative way.
Let us discuss the basic requirements that one expects whenmeasuring mechanical properties of materials, in particular, cellmechanics in indentation experiments. First, it is important tocharacterize cell mechanics in an instrument-independent way.The elastic moduli are typically used to describe material specificcharacteristics [57]. The moduli can be used to describe both staticand dynamic measurements. The measurement of the static mod-ulus is simpler because it requires less number of measurements,simpler hardware. Therefore, it makes sense to establish the proce-dure to measure the static modulus first. This is the goal of thepresent paper. Next, there are three primary moduli (static) of elas-ticity used: the Young’s modulus (tensile), shear, and bulk modu-lus. If we assume that cell can be described as a homogeneousand isotropic material (it obviously makes sense to assume forsmall indentation depth only), the cell can be characterized by justtwo moduli, for example, by the Young’s modulus and the Poissonratio [57]. Although being plausible, tensile behavior of the celldeformation under the load of a spherical indenter is yet to be pro-ven. For the sake of accuracy, we will use a more generic term‘‘elastic modulus’’ instead of the Young’s modulus. Since the Pois-son ratio of soft materials typically ranges within 0.3–0.5 [58–60], the maximum error due to the unknown Poisson ratio is ex-pected to be less than 10% [40]. Therefore it is typically sufficientto characterize mechanics of soft material with just one elasticmodulus (aka the Young’s modulus).
When measuring the elastic modulus of cells, one has toremember that the cell is a rather complex object which shouldnot necessarily demonstrate the linear elastic behavior [61]. Theassumption of cell homogeneity/isotropy and elasticity is rathernon-trivial and to be proven for each cell type. Probably one ofthe simplest ways to prove it is to use the following: if a cell be-haves as a homogeneous/isotropic linear elastic material, thenthe derived elastic modulus of the cell must be independent ofthe indentation depth at least up to some limit of indentations.We suggest calling this ‘‘necessary condition’’ because the depthindependence of the modulus is necessary (but not sufficient, theother way around) condition of homogeneous/isotropic linear elas-tic property of material). Here we will check if our method is inagreement with the necessary condition principle.
Here we describe the method which allows obtaining the elasticmodulus to describe the cell deformations. In particular, we willshow that the elastic modulus of cells is independent of the inden-tation depth up to 10–20% deformation for the eukaryotic cellsstudied here. The main features of the described method are: (A)taking into account the cellular brush, an essential inelastic partof the cell which surrounds all eukaryotic and gram-negative pro-karyotic cells; (B) the method requires the use of a relatively dullAFM probe to avoid overstretching the material of cell body. Be-sides the elastic modulus, the method presented here allowsobtaining parameters of brush surrounding the cells, such as theeffective length and density of the brush.
Although the method is demonstrated on eukaryotic cells, itshould be applicable for all types of cells, and even soft materialssurrounded by either brush or a field of long-range forces. Forexample, one could measure a field of electrostatic force occurredas an electrical double layer around virtually all hydrophilic sur-faces immersed in aqueous medium [62,63].
2. Object of study: cells
2.1. Cells to study
Human breast cancer MCF-7 cell line was provided by AmericanType Culture Collection (ATCC). Cells were cultured in 60 mmdishes with ATCC-formulated Eagle’s Minimum Essential Medium(Catalog No. 30-2003) with 0.01 mg/ml bovine insulin and 10% bo-vine serum in an incubator (at 5% CO2 and 37 �C temperature)according to the ATCC protocol. The medium was changed threetimes per week. Cells were studied at passage 4 after first platingcells in culture dish. Before measurements, cells were placed ona sterilized (in 70% ethanol for 30 min) microscope glass cover(GaineXpress, Hong Kong) in the same medium but without serumand kept for 16 h. Right before the experiment, all samples weregently rinsed with the serum-free medium to remove not well at-tached cells, and left for 30 min in the same serum-free medium inthe incubator. The slides used for experiments when cells were lessthan 10% confluent.
Primary cultures of human cervical epithelial cells were pre-pared by a two-stage enzymatic digestion of cervical tissue as de-scribed [33]. Briefly, each tissue was digested for 16 h at 4 �C indispase and the layer of epithelial cells was removed from theunderlying connective tissue by scraping. The sheet of epithelialcells was cut into 1 mm2 pieces and digested in 0.25% trypsin at37 �C for 10 min. Trypsin was neutralized by adding fetal bovineserum and cells were collected by low speed centrifugation. Cul-tures consisting of P95% epithelial cells were maintained in kerat-inocyte serum-free medium (Invitrogen) which preventsoutgrowth of fibroblasts and other stromal cells (no evidence ofcontamination by fibroblasts or other stromal cells was observed).All human tissue was obtained from the Cooperative Human TissueNetwork. Informed consent was obtained from patients accordingto their published guidelines (<http://chtn.nci.nih.gov/phspoli-cies.html>). Normal cervical cells were used between 40 and 60population doublings (PDs). All cells were plated in 60 mm tissueculture dishes and dishes were used for experiments when cellswere less than 50% confluent. Right before imaging, the cells weretwice washed with Hank’s Balanced Salt Solution medium (HBSSby Life Technologies) and imaged in this medium.
2.2. Notes about sample preparation
There are several important steps to prepared the cell sample.First, unless specifically interesting, it is easier to work with cellsin a low confluence. If cells start to interact with each other, thereare a number of biological changes may happen. These alterationsmay introduce factors that would be hard to control in the re-peated experiments.
Next, the choice of the medium may play important role. A non-trivial influence of the growth medium on the cell rigidity was re-ported [64]. The use of serum and bovine growth factors simplifiesculturing, but introduces factors that are hard to control due tovariable sources of those components. The use of purely inorganicbuffers (PBS, HBSS, etc.) is free of this shortcoming. In addition, itallows obtaining a better force signal because some organicagglomerates can interfere with the laser beam used to controlthe position of the cantilever, which creates a noticeable noise dur-ing the force recording. Of course, the price to pay for a clear inor-ganic buffer is the limited lifetime of cells in the culture dish. Notall inorganic buffers are equal in that respect. We found that HBSSbuffer allows for non-degrading measurement of cell mechanics upto 5–6 h, whereas up to 3–4 h in PBS buffer.
Lastly, cell mechanics may depend on the number of passagesand the time of cell plating. A biophysical reason for such depen-

204 I. Sokolov et al. / Methods 60 (2013) 202–213
dences is clear: cells can adhere differently to the rigid substrate.For example, MCF-7 cells demonstrate a rather poor attachmentto the culture dish during the first three passages. Secondly, cellstend to adhere better with time even within the same passage.When the indentation is measured on a poorly adhered cell, the de-rived elastic modulus will obviously be noticeably lower, see, e.g.,[65] because the regular elastic model assume no cell deformationat the cell-dish interface. The presence of such loosely attachedcells can be verified with either using confocal 3-D imaging (moreaccurate method) or just a simple observing of wiggling of cellswhen portion of them with a gentle media flow with the help ofa pipette (simple qualitative method).
2.3. Importance of brush: cellular brush and its role in the AFMindentation experiments
What we call ‘‘brush’’ is an outer layer that covers all eukaryoticand gram-negative prokaryotic cells. In the case of eukaryotic cells,it consists of membrane protrusions, such as microvilli, microridg-es, cilia, etc. and molecules grafted to the cellular membrane, suchas glycosaccharide and glycoproteins (glycocalyx) [66,67]. Itshould be noted that in some cells the glycocalyx can become avery large and dense in specific conditions (for example, in fibro-blast cells in presence of serum). It is then called pericellularmolecular coating. This is just a particular case the cellular brushlayer. As we showed previously [68], the behavior of the brushlayer is not elastic in nature, and is well-described by the equationsof the entropic brush. That is why we suggested calling this part ofcell as brush layer.
This brush layer is responsible for the cell–cell interaction [69],cell migration [70], differentiation, and proliferation [71,72]. Thebrush is important in embryonic development [73], wound healing[74], inflammation [75,76], and mammalian fertilization [77]. It isinvolved in epithelial–mesenchymal transition [73], resistance toapoptosis (cell death), and multidrug resistance [78]. Molecularentropic brushes are known to surround neurofilaments to main-tain interfilament spacing [79,80]. An example of the brush on hu-man epithelial cervical cells imaged with electron microscopy isshown in Fig. 1a and b. One can clearly see a brushy layer of thesize of 0.5–3 lm. A similar size brush can be seen when using opti-cal confocal fluorescent microscopy (Fig. 1c).
When using AFM, the presence of the brush cannot be ignoredbecause the AFM probe detects the physical presence of brush irre-spectively to its composition, electron contrast and optical trans-parency (which will be important for other types of microscopy).It has been recently found that the cellular brush would interferewith indentation measurements of elastic properties of cell body,and a new model has to be used [68] which separates the contribu-tion of the cellular brush and the deformation of the cell body.Thus, taking the brush into account is important to understandproper cell mechanics.
Fig. 1. An example of the surface of human cervical epithelial cells demonstrating brush:10 lm. The methods of obtaining these images are described in Refs. [1,2].
3. Atomic force microscopy (AFM)
3.1. Principle of work
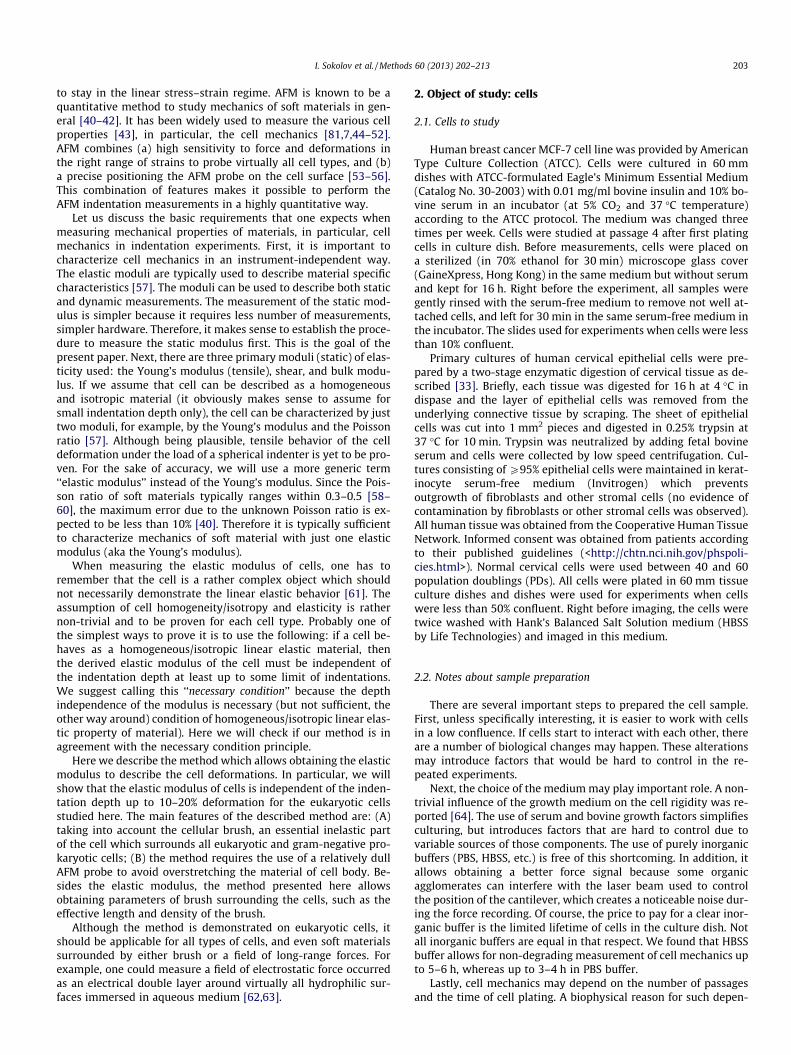
AFM is based on the detection of forces acting between a probeand sample surface, Fig. 2 (left). The probe is attached to a flexiblecantilever. By scanning over the surface, AFM records the deflec-tion of the cantilever with sub-nanometer precision. AFM isbroadly used to study cell morphology. However, it is possible touse the AFM probe as an indenter to study cell mechanics. Byrecording the cantilever deflection while it is moving up and downand deforming a cell, one can obtain information about cellmechanics [5,82–96] as shown in the schematic, Fig. 2 (right). Instudying cell mechanics, the AFM method has a unique advantage.The lateral position of the AFM tip, as well as the load force can becontrolled with very high precision. This can be done on eitherindividual cells or cell layers in a culture dish (in vitro), or evenon pieces of tissue (ex vivo) [43].
3.2. Importance of statistics
In contrast to a typical non-biological material, cells demon-strate high variability. Cells can differ significantly even withinthe same type, see the Examples section for more detail. Thereare definitely a number of questions that can be addressed bystudying a single cell. However, the majority of the biologically rel-evant questions require the analysis of a number of cells (samplesize). Depending on the variability of data, the number of cells re-quired to obtain a robust statistics ranges from �10 to 30 or more[5,97–99]. The exact sample size could be found using the powercalculator [100].
Furthermore, mechanical properties can change substantiallyeven across the surface of single cell, see Section 5.1 for more de-tail. It is important to do the measurements of multiple forcecurves at different points on the cell surface. In the simplest case,it can be the top part of the cell (usually, above the nucleus). Onecan get as many pixels as desired even on a small area of cell. How-ever, to avoid multiple probing of essentially the same area, it doesnot make sense to collect data at the points separated from eachother less than the radius of the cell-probe contact.
3.3. Specific instruments used
Many different force microscopes can be used to measure cellmechanics. Nevertheless, there are a few features that are requiredfor quantitative measurements. A combination between forcemicroscope and optical microscopy is extremely helpful to locatethe AFM probe in the vicinity of the cell. A must feature is a scannerwith a relatively large vertical ramp size with the close-loop feed-back at least for the vertical (Z) displacement. If one needs to scanthe whole cell, the vertical ramp size of the scanner should defi-
(a) and (b) are electron microscopy images, (c) optical confocal image. Scale-bars are
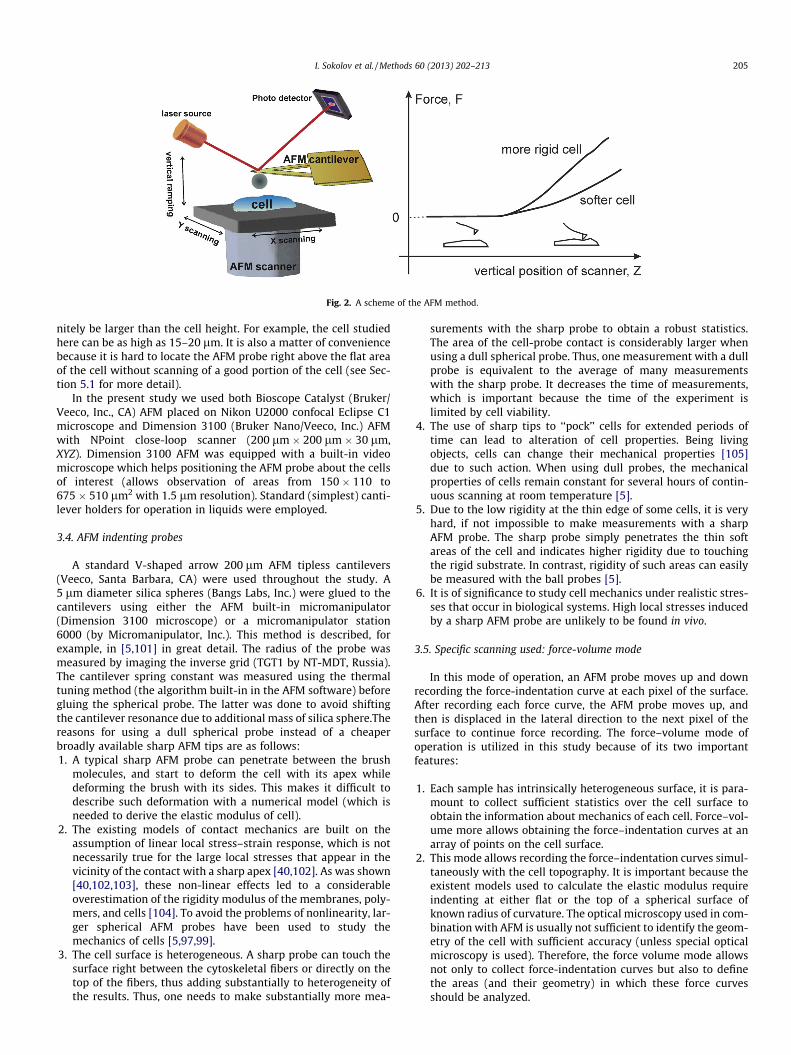
Fig. 2. A scheme of the AFM method.
I. Sokolov et al. / Methods 60 (2013) 202–213 205
nitely be larger than the cell height. For example, the cell studiedhere can be as high as 15–20 lm. It is also a matter of conveniencebecause it is hard to locate the AFM probe right above the flat areaof the cell without scanning of a good portion of the cell (see Sec-tion 5.1 for more detail).
In the present study we used both Bioscope Catalyst (Bruker/Veeco, Inc., CA) AFM placed on Nikon U2000 confocal Eclipse C1microscope and Dimension 3100 (Bruker Nano/Veeco, Inc.) AFMwith NPoint close-loop scanner (200 lm � 200 lm � 30 lm,XYZ). Dimension 3100 AFM was equipped with a built-in videomicroscope which helps positioning the AFM probe about the cellsof interest (allows observation of areas from 150 � 110 to675 � 510 lm2 with 1.5 lm resolution). Standard (simplest) canti-lever holders for operation in liquids were employed.
3.4. AFM indenting probes
A standard V-shaped arrow 200 lm AFM tipless cantilevers(Veeco, Santa Barbara, CA) were used throughout the study. A5 lm diameter silica spheres (Bangs Labs, Inc.) were glued to thecantilevers using either the AFM built-in micromanipulator(Dimension 3100 microscope) or a micromanipulator station6000 (by Micromanipulator, Inc.). This method is described, forexample, in [5,101] in great detail. The radius of the probe wasmeasured by imaging the inverse grid (TGT1 by NT-MDT, Russia).The cantilever spring constant was measured using the thermaltuning method (the algorithm built-in in the AFM software) beforegluing the spherical probe. The latter was done to avoid shiftingthe cantilever resonance due to additional mass of silica sphere.Thereasons for using a dull spherical probe instead of a cheaperbroadly available sharp AFM tips are as follows:1. A typical sharp AFM probe can penetrate between the brush
molecules, and start to deform the cell with its apex whiledeforming the brush with its sides. This makes it difficult todescribe such deformation with a numerical model (which isneeded to derive the elastic modulus of cell).
2. The existing models of contact mechanics are built on theassumption of linear local stress–strain response, which is notnecessarily true for the large local stresses that appear in thevicinity of the contact with a sharp apex [40,102]. As was shown[40,102,103], these non-linear effects led to a considerableoverestimation of the rigidity modulus of the membranes, poly-mers, and cells [104]. To avoid the problems of nonlinearity, lar-ger spherical AFM probes have been used to study themechanics of cells [5,97,99].
3. The cell surface is heterogeneous. A sharp probe can touch thesurface right between the cytoskeletal fibers or directly on thetop of the fibers, thus adding substantially to heterogeneity ofthe results. Thus, one needs to make substantially more mea-
surements with the sharp probe to obtain a robust statistics.The area of the cell-probe contact is considerably larger whenusing a dull spherical probe. Thus, one measurement with a dullprobe is equivalent to the average of many measurementswith the sharp probe. It decreases the time of measurements,which is important because the time of the experiment islimited by cell viability.
4. The use of sharp tips to ‘‘pock’’ cells for extended periods oftime can lead to alteration of cell properties. Being livingobjects, cells can change their mechanical properties [105]due to such action. When using dull probes, the mechanicalproperties of cells remain constant for several hours of contin-uous scanning at room temperature [5].
5. Due to the low rigidity at the thin edge of some cells, it is veryhard, if not impossible to make measurements with a sharpAFM probe. The sharp probe simply penetrates the thin softareas of the cell and indicates higher rigidity due to touchingthe rigid substrate. In contrast, rigidity of such areas can easilybe measured with the ball probes [5].
6. It is of significance to study cell mechanics under realistic stres-ses that occur in biological systems. High local stresses inducedby a sharp AFM probe are unlikely to be found in vivo.
3.5. Specific scanning used: force-volume mode
In this mode of operation, an AFM probe moves up and downrecording the force-indentation curve at each pixel of the surface.After recording each force curve, the AFM probe moves up, andthen is displaced in the lateral direction to the next pixel of thesurface to continue force recording. The force–volume mode ofoperation is utilized in this study because of its two importantfeatures:
1. Each sample has intrinsically heterogeneous surface, it is para-mount to collect sufficient statistics over the cell surface toobtain the information about mechanics of each cell. Force–vol-ume more allows obtaining the force–indentation curves at anarray of points on the cell surface.
2. This mode allows recording the force–indentation curves simul-taneously with the cell topography. It is important because theexistent models used to calculate the elastic modulus requireindenting at either flat or the top of a spherical surface ofknown radius of curvature. The optical microscopy used in com-bination with AFM is usually not sufficient to identify the geom-etry of the cell with sufficient accuracy (unless special opticalmicroscopy is used). Therefore, the force volume mode allowsnot only to collect force-indentation curves but also to definethe areas (and their geometry) in which these force curvesshould be analyzed.
Fig. 3. A schematic of AFM probe–cell surface interaction. Brush layer is shown. Z isthe relative piezo position of the cantilever, d is the cantilever deflection; Z0 nondeformed position of the sample; i deformation of the sample; Z = 0 is for themaximum deflection assigned by the AFM user. h is the separation between sampleand the AFM probe.
206 I. Sokolov et al. / Methods 60 (2013) 202–213
The force–volume images of cells were collected with the reso-lution typically of 16 � 16 pixels within 50 � 50 lm2 area.
3.6. Ramping speed when measuring static modulus
Strictly speaking, the definition of the static modulus meansvery small indentation speed, or ramping speed in the AFM exper-iments. However, this is not easy to do when dealing with softmaterials in general because of the creep, a slow increase of inden-tation depth under constant load. In some cases, creep can be verylarge, which makes it impractical to wait until creep relaxing. Inthe case of biological cells, this issue is even more complicated be-cause a very slow indentation can easily induce a non-trivial bio-logical response. For example, cells may start to restructure theircytoskeleton, to develop non-trivial adhesion to the AFM probe[106,107], and finally, simply to crawl away.
As a compromise, the force-indentation curves are typically re-corded with a ramp frequency of 1–2 Hz with the vertical rampsize of 3–6 lm. This reasonably minimizes the viscoelastic effectsof the indentation though a difference between approaching andretracting force-indentation curves is still seen even at thesespeeds. Therefore, it is important to consider the same (or at leastsimilar) speeds when comparing the results of different works.
3.7. Theory/models
The Hertz model [108] and its various modifications [49,109]have been widely used to determine the elastic modulus of cells.In these models, the cell is assumed to be a homogenous material,and the cell border is a well-defined interface. While homogeneityof the cell material may be considered as a reasonable approxima-tion for small deformations, the cell surface is far from being well-defined flat interface because it is covered with the cellular brush(see Section 2.3; similar images can be obtained for all cell).
Here we describe the model that takes into account the pres-ence of such brush. It allows deriving the elastic modulus of thecell body as well as the parameters of the surrounding brush.The results of these models will be compared with the standardHertz model, which is briefly overviewed below as well. The modeldescribed was developed for a known geometry as a sphere overeither plane or hemisphere or sphere. Thus, we processed onlythe force curves from the top area the cell. Following the previousworks [45,68,97], we take the force curves in the surface pointsaround the top when the incline of the surface is <10–15�. To iden-tify such curves, the AFM image of cell heights was used (theheight image was collected as a part of the force–volume dataset; the effective radius of the cell was derived from these imagesafter taking into account the cell deformation, see Section 5.1 fordetail). A nonlinear curve fitting of corresponding equations allowsderiving both the elastic modulus of the cell body and parametersof the brush (length and grafting density).
3.7.1. Model to take into account the brush when deriving the elasticmodulus of cell
When the AFM probe squeezes the cell, it deforms both thebrush and cell body as shown in Fig. 3. To separate the elasticdeformation of the cell body from the deformation of the brushlayer, the following model was suggested [68]. A well-definedspherical AFM probe deforms an elastic material covered with‘‘brush’’, Fig. 3. A geometrical consideration (see the notations de-fined in Fig. 3) gives the following equation:
h ¼ Z � Z0 þ iþ d: ð1Þ
The relative piezo position of the cantilever Z and the cantileverdeflection d are directly measured with AFM when collecting theforce–load curves (so-called ‘‘raw data’’). The other two parame-
ters, deformation of the sample i and non-deformed position ofthe sample Z0, have to be found. The elastic modulus is includedin the deformation of the cell body i. Because we are using a spher-ical indenter, the deformation of the cell body is described by theHertz model, one has:
h ¼ Z � Z0 þ9
16kE
ffiffiffiffiffiffiffiffiffiffiffiffiffiffiffiffiffiffiffiffiffiffiffiffiffiRprobe þ Rcell
RprobeRcell
s" #2=3
d2=3 þ d: ð2Þ
Here E is the elastic modulus of the cell body; the Poisson ra-tio m of the cells is chosen to be equal to 0.5, Rprobe and Rcell arethe radii of curvature of the AFM probe and cell, respectively.Rprobe can be found before starting measurements as describedabove. Rcell can be restored from the topographical image of thecell obtained in the force volume mode (after taking into accountthe deformation of the cellular body, see Section 5.1 for moredetail).
One can find the parameters of Eq. (1), the elastic modulus Eand non-deformed position of the sample Z0, if one assumes thatthe AFM probe squeezes the brush layer so that h ? 0 somewherebefore reaching the maximum load. Obviously, this assumptiondepends on the value of the maximum load. We assume that itis possible because (a) it is the parameter one can control withthe AFM setup, (b) it can be directly checked retrospectively(finding h after find calculating the elastic modulus). It is moreelegant to test this assumption by choosing different parts ofthe force curve to check a possible change of the sought parame-ters (the elastic modulus E and Z0). If the brush is squeezed start-ing from some force, it will obviously be squeezed for higherforces (higher indentations, higher cantilever deflection d). Seeingconstancy of the sought parameters starting from some force(cantilever deflection d), one can conclude that the brush issqueezed. It is worth noting that observing such depth indepen-dence of the elastic modulus E, we can prove the necessary prin-ciple of linearity. The lack of coincidental compensation of bothnonlinearity and changing contribution of squeezing brush is veryunlikely because of too large number of different cells probed, seethe Examples section. (In addition, one can always do retrospec-tive verification of the assumption of the squeezed brush as de-scribed above.)
To summarize, the method of finding the elastic modulus andbrush parameters of cells consists of two steps:
Step 1. Finding the elastic modulus (E) from the recorded forcecurves (raw data, d vs Z).

I. Sokolov et al. / Methods 60 (2013) 202–213 207
Taking h = 0 for the forces near the maximum load, one can re-write Eq. (2) as follows
Z0 � d� Z ¼ d2=3 � 916
kE
ffiffiffiffiffiffiffiffiffiffiffiffiffiffiffiffiffiffiffiffiffiffiffiffiffiRprobe þ Rcell
RprobeRcell
s" #2=3
: ð3Þ
The elastic modulus can be found by using non-linear curve fit-ting of this equation with respect to the unknown Z0 and E.
It is sometime useful to have a simple formula to estimate themodulus E analytically. It is possible when the force is equal itsmaximum value, which is reached when Zi ! 0 or d! dmax (themaximum deflection of the cantilever). Then Eq. (2) can be rewrit-ten as
Z ¼ 916
kE
ffiffiffiffiffiffiffiffiffiffiffiffiffiffiffiffiffiffiffiffiffiffiffiffiffiRprobe þ Rcell
RprobeRcell
s" #2=3
ðd2=3max � d2=3Þ þ ðdmax � dÞ; ð4Þ
The elastic modulus can now be found from the experimentaldata by using the form of explicit formula
Ei ¼9
16k
ffiffiffiffiffi1R
rd2=3
max � d2=3i
Zi � dmax þ di
!3=2
� 38
ffiffiffi23
rkd�1=2
max
ffiffiffiffiffi1R
rdmax � di
Zi � dmax þ di
� �3=2�����d!dmax
: ð5Þ
Step 2. Finding of the force dependence due to brush (F vs h)from the recorded force curves (raw data, d vs Z). The sought forcedependence d(h) can be found from Eq. (2) by using the found elas-tic modulus E as follows:
hðdÞ ¼ Z � 916
kE
ffiffiffiffiffiffiffiffiffiffiffiffiffiffiffiffiffiffiffiffiffiffiffiffiffiRprobe þ Rcell
RprobeRcell
s" #2=3
ðd2=3max � d2=3Þ � ðdmax � dÞ: ð6Þ
The force F(h) caused by the existence of the brush can now bereconstructed using the following formula:
FðhÞ ¼ kd ¼ k � ðh� Z þ Z0 � iÞ ð7Þ
It is worthwhile noting that the method described so far is inde-pendent on the nature of the brush force. This force could comefrom the electrostatic interaction (electrical double layer forces),polymeric entropic brush, etc.
Further reducing our derivation to the case of entropic brush,we can introduce the following brush parameters: effective graft-ing surface density of the brush constituents (grafting density) Nand the brush length L (the Flory radius of the brush constituents)[45,68,110] as follows:
FðhÞ � 50kBTR�N3=2 exp �2phL
� �L; ð8Þ
where kB is the Boltzmann constant, T is the temperature,R� ¼ Rprobe � Rcell=Rprobe þ Rcell.
The exponential presentation of the entropic brush model is thebest for numerical fitting because of the lack of correlation be-tween fitting parameters N and L. It should also be noted thatone has to verify that derived brush length is within the validityof this formula (0.2 < h/L < 0.8) [110].
3.7.2. The Hertz modelSince we will compare the model described above with the
Hertz model widely used in the literature [81,49,109,111,93,112],we briefly describe this model as well. In that approach, the cellis treated as a homogenous smooth (well-defined boundary) med-ium of radius Rcell. To derive the elastic modulus of the cell, theexperimental force–indentation curves are fitted with followingformula:
FðicÞ ¼169
E
ffiffiffiffiffiffiffiffiffiffiffiffiffiffiffiffiffiffiffiffiffiffiffiffiffiRprobe � Rcell
Rprobe þ Rcell
si3=2c ; ð9Þ
where F is the load force, E is the elastic modulus, and ic is theindentation depth. Here the Poisson ratio of the cells is set to 0.5.
4. Examples of the method application
Here we will demonstrate representative examples of applica-tion of the described method to breast and cervical epithelial cells.In the examples described below, the rigidity of cells are studied atthe top part of cells (right above the nucleus).
4.1. Human cervical epithelial cells
Let us demonstrate how the brush method described aboveworks on human epithelial cervical cells. Fig. 4a presents a typicalraw data, d(Z) curve recorded on the surface of a cell. The force canbe found by multiplying the deflection d by the cantilever springconstant k (�0.25 N/m in this case).
Step 1. Fitting Eq. (3) near the maximum load (0 < Z < 200 nm),yields E = 1.80 ± 0.02 kPa, Z0 = 1250 ± 20 nm. To check the assump-tion of completely squeezed brush and simultaneously to verifythe necessary condition principle (independence of the elasticmodulus of the indentation depth), several fitting ranges (up to0 < Z < 450 nm) were tested. For example, if one takes the fittinginterval 0 < Z < 450 nm, then one obtains E = 1.60 ± 0.01 kPa andZ0 = 1330 ± 10 nm. Fig. 4b shows the dependence of the derivedelastic modulus as a function of the indentation depth. One cansee sufficiently constant value of the modulus with a slight in-crease towards large deformations. The latter is quite typicalbehavior, see the example and explanations below.
Step 2. The force due to brush can be obtained from Eqs. (6) and(7) by plugging in the values of E and Z0 found in Step 1. The resultsare shown in Fig. 4c. Several force curves corresponding to differ-ent values of E and Z0 (corresponding to different fitting intervalspresented in Fig. 4a). Note that the force derived (plotted in loga-rithmic scale) shows the middle part of the force dependence tobe an exponential function with respect to the probe-cell surfacedistance h (linear function in logarithmic scale). This is a typicalcase of the force due to an entropic brush described by Eq. (8). Inprinciple, electrical double layer forces could also demonstratethe exponential behavior. However, the range of action of this force(analog of the brush length) is only about 3 nm in physiologicalbuffers, and therefore, it can be neglected.
Using the exponential curve fitting of the derived data with Eq.(8) (shown with straight lines in Fig. 3c), one can derive the un-known parameters of brush, the graphing density N and brushlength L. One can see that the difference in the parameters of thederived brush is quite small: L changes from 1460 to 1400 nm,and N ranges between 300 and 360 lm�2 when using differentforce curves shown in Fig. 4c.
4.2. Human breast cancer MCF-7 cells
To exemplify universality of the method, it is applied to a differ-ent type of cells, human breast cancer cells. Fig. 5a shows the rawdata collected on such cells. Both steps of the method applied tothese cells are described below.
Step 1. For the curve presented in Fig. 5a, elastic deformation ofthe cell body is well fitted starting from the cantilever deflectiond = 60–100 nm (the load force of 3.2–5.3 nN; 0 < Z < 350 nm). Be-low these forces, the fitted curve substantially deviates from theexperimental data. This implies that we have simultaneous defor-mation of both the brush and cell’s body. Above those forces, we

Fig. 4. An example of processing raw indentation data d(Z) for a cervical epithelial cell. The model allows separating deformations of the brush layer and the elastic responseof the cell body. (a) Fitting the rigid contact to determine Z0 and the elastic modulus of the cell body (several (red) lines are shown to demonstrate variability of the fittingtaking different numbers of points near the maximum deflection (Z ranges from 0–200 to 0–450 nm); (b) the derived elastic modulus as a function of the indentation depth.(c) The forces F due to brush as a function of h obtained from Eqs. (6) and (7).
208 I. Sokolov et al. / Methods 60 (2013) 202–213
can calculate the elastic modulus of the cell body for differentprobe penetrations. This allows checking the assumption of com-pletely squeezed brush and simultaneously verifying the necessarycondition principle. The results are shown in Fig. 5b. One can seethat the elastic modulus is rather independent on probe penetra-tion. Nevertheless, starting from some penetrations, the modulusrapidly increases, which is similar to the case of cervical cells con-sidered in the previous section. We discuss this behavior in thenext section.
Step 2. To find the parameters of the brush surrounding cells,the force–separation curve corresponding to brush was first calcu-lated through Eqs. (6) and (7). The brush parameters, length (L) andgrafting density (N), can now be derived from the force-separationcurve by fitting with the Eq. (8) for the region 0.2 < h/L < 0.8. Boththe force–separation curve and fitting are shown in Fig. 5c. One cansee clear exponential force dependence.
5. Discussion of the example results
5.1. Verification of the necessary principle, the modulus independenceof the indentation depth
Independence of the rigidity modulus of the indentation depthis the necessary condition of applicability of any model in whichthe material is considered linearly elastic and homogeneous/iso-tropic. One can see that such independence was observed in theabove examples. However, starting from some indentation, themodulus typically demonstrates a sharp increase. This is expectedbecause the AFM probe eventually starts squeezing the cell organ-elles, in particular, the nucleus (because in the above examples, thecell is deformed right above the nucleus).
The same indentation independence allows us to verify the ba-sic assumption of the model: starting from some load force (canti-
lever deflection) the brush can be squeezed to a negligible size.With those forces, the AFM probe deforms the cell body directly.This part of the cell deformation curve should then be describedby Eq. (3). Obviously, this assumption has always to be verified be-cause it is not necessarily true for all cells, forces, and probes. Forexample, the force required to squeeze the brush may be exces-sively high. The probe may start squeezing some organelles insidethe cell when the brush is sufficiently squeezed. As a result, the cellbody cannot be described as a linear elastic medium (violating thenecessary condition principle). The elastic modulus also increaseswith the probe penetration also in the case when exceeding thelimit of linearity [40].
It is worth noting that the use of regular sharp AFM probes typ-ically leads to an overestimation of the elastic modulus [104] andthe violation of the necessary condition principle. The latter willbe discussed in detail in our future works.
To amplify, the independence of the elastic modulus of theindentation depth serves as a good verification of both the assump-tion of squeezed brush and the validity of the necessary conditionprinciple (linearity of the stress–strain relation and homogeneity/isotropy of the cell material). Analyzing the statistics of such sharpincreases for cervical and breast epithelial cells, we can concludethat it typically happens when the cell body is deformed up to10–20% of its physical size (the cell size, its height was estimatedusing confocal optical microscopy, similar to Fig. 1c after theappropriate scaling to take into account the refractive indexes ofthe media).
5.2. What if brush is ignored?
To compare our method with the widely used simple Hertzmodel (when no brush taken into account), we processed theexperimental raw data through the Hertz model, Eq. (9). A repre-
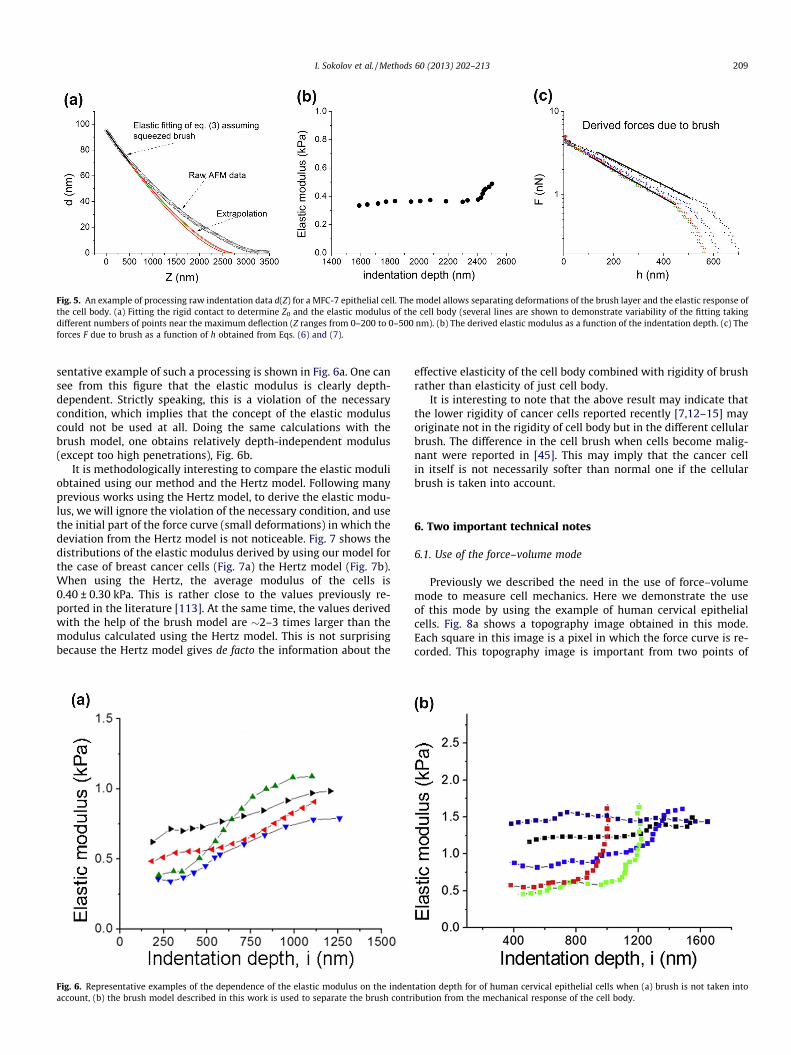
Fig. 5. An example of processing raw indentation data d(Z) for a MFC-7 epithelial cell. The model allows separating deformations of the brush layer and the elastic response ofthe cell body. (a) Fitting the rigid contact to determine Z0 and the elastic modulus of the cell body (several lines are shown to demonstrate variability of the fitting takingdifferent numbers of points near the maximum deflection (Z ranges from 0–200 to 0–500 nm). (b) The derived elastic modulus as a function of the indentation depth. (c) Theforces F due to brush as a function of h obtained from Eqs. (6) and (7).
I. Sokolov et al. / Methods 60 (2013) 202–213 209
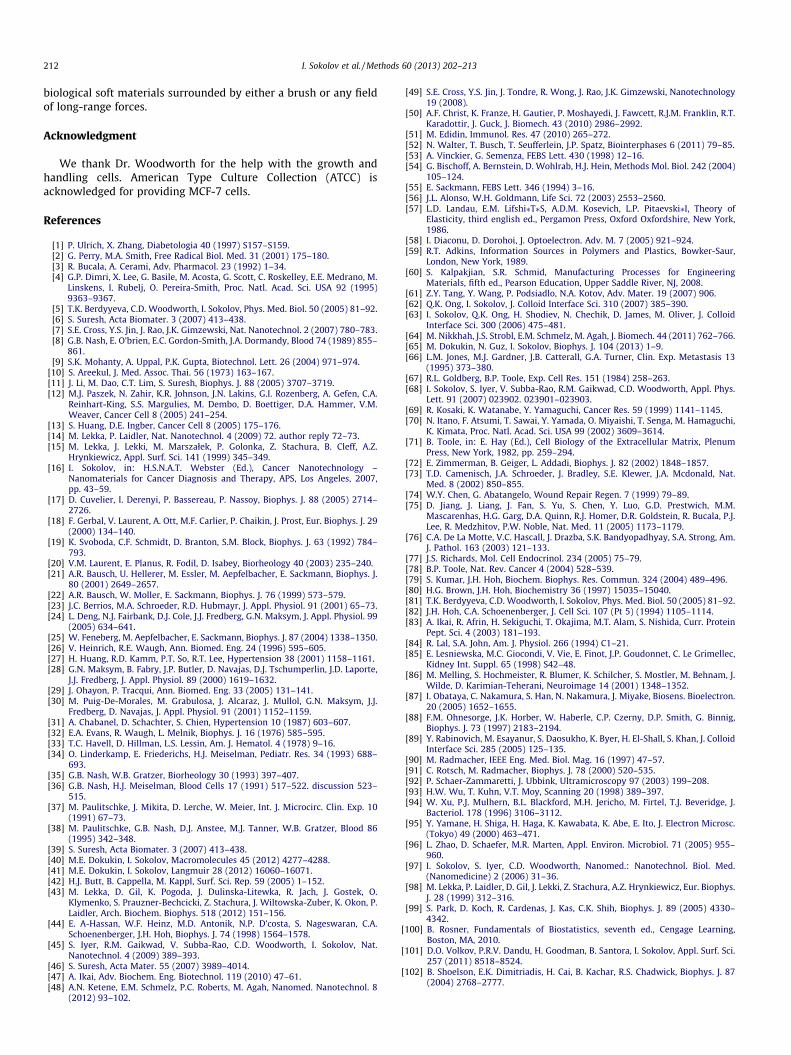
sentative example of such a processing is shown in Fig. 6a. One cansee from this figure that the elastic modulus is clearly depth-dependent. Strictly speaking, this is a violation of the necessarycondition, which implies that the concept of the elastic moduluscould not be used at all. Doing the same calculations with thebrush model, one obtains relatively depth-independent modulus(except too high penetrations), Fig. 6b.
It is methodologically interesting to compare the elastic moduliobtained using our method and the Hertz model. Following manyprevious works using the Hertz model, to derive the elastic modu-lus, we will ignore the violation of the necessary condition, and usethe initial part of the force curve (small deformations) in which thedeviation from the Hertz model is not noticeable. Fig. 7 shows thedistributions of the elastic modulus derived by using our model forthe case of breast cancer cells (Fig. 7a) the Hertz model (Fig. 7b).When using the Hertz, the average modulus of the cells is0.40 ± 0.30 kPa. This is rather close to the values previously re-ported in the literature [113]. At the same time, the values derivedwith the help of the brush model are �2–3 times larger than themodulus calculated using the Hertz model. This is not surprisingbecause the Hertz model gives de facto the information about the
Fig. 6. Representative examples of the dependence of the elastic modulus on the indenaccount, (b) the brush model described in this work is used to separate the brush contr
effective elasticity of the cell body combined with rigidity of brushrather than elasticity of just cell body.
It is interesting to note that the above result may indicate thatthe lower rigidity of cancer cells reported recently [7,12–15] mayoriginate not in the rigidity of cell body but in the different cellularbrush. The difference in the cell brush when cells become malig-nant were reported in [45]. This may imply that the cancer cellin itself is not necessarily softer than normal one if the cellularbrush is taken into account.
6. Two important technical notes
6.1. Use of the force–volume mode
Previously we described the need in the use of force–volumemode to measure cell mechanics. Here we demonstrate the useof this mode by using the example of human cervical epithelialcells. Fig. 8a shows a topography image obtained in this mode.Each square in this image is a pixel in which the force curve is re-corded. This topography image is important from two points of
tation depth for of human cervical epithelial cells when (a) brush is not taken intoibution from the mechanical response of the cell body.

Fig. 7. The distribution of the elastic modulus calculated for breast cancer cells using (a) our brush models and (b) the Hertz model.
Fig. 8. A representative example of the use of the force–volume mode on a human cervical epithelial cell. (a) A topography image collected in this mode. Results of processingof the row data recorded at each pixel: (b) the elastic modulus, (c) and grafting density and (d) length of the cellular brush. The lateral size of each pixel in all images is 2.5 lm.
210 I. Sokolov et al. / Methods 60 (2013) 202–213
view. First, it allows identifying the particular pixels in which theforce curves can be used for the data processing. As was men-tioned, we take the force curves in the surface points around thetop when the incline of the surface is <10–15�. The surface pixelsthat satisfy this condition can be identified in this image. Secondly,the radius of curvature of the cell should be known to use the for-mulas of the model. This can again be found by using the profile ofthis topology image. It should be noted that the profile should becorrected by the amount of cell deformation, parameter i of Eq.(1). This parameter is found at Step 1 of the model for each pixelof interest.
Fig. 8b–d shows the example of the elastic modulus and thebrush parameters derived at each pixel of the cell surface whichis close to the top. The results clearly indicate the necessity of col-lecting sufficient statistics. One can see that all parameters cansubstantially change from pixel to pixel.
6.2. Can the raw data be averaged before processing?
As one could see from the previous section, one needs to collecta large amount of data to make statistically sound conclusions. It istime- and resource-consuming to process each force curve sepa-

Fig. 9. Methods 1 and 2 of averaging of AFM raw data. An example of three forcecurves collected with the AFM technique (raw data) are shown. Method 1corresponds to the averaging of d1, d2, d3 for a fixed Z. Method 2 corresponds tothe averaging of Z1; Z2; Z3 for a fixed d. Taken from [114] with permission.
Fig. 10. A sketch of comparison of two averaging methods for different situation.Taken from [114] with permission.
I. Sokolov et al. / Methods 60 (2013) 202–213 211
rately (it is hard to algorithmize the process completely). The anal-ysis of an averaged raw force data is a simple and time saving op-tion, which also averages out the noise and measurement artifactsof the force curves being analyzed. The time improvement of thedata processing can be really substantial (20–30 times). Moreover,some biomedical applications require just an average number perbiological cell.
The problem of averaging the raw data before processing hasbeen recently analyzed in [114]. Two ways of doing the averagingwas investigated. These two ways are presented in Fig. 9, over theforce data for each particular distance (method 1, the most com-monly used way), and over the distances for each particular force(method 2).
It was shown that both methods gave a rather good accuracywhen calculating the elastic modulus of cells (the error is <2%) ifthe heterogeneity of the surface rigidity is small (<50%). Whenthe heterogeneity is large (>100�), method 2 underestimates theaverage rigidity modulus by a factor of 2, whereas the error ofmethod 1 is still only �15%. However, when analyzing the differentsurface brush, the accuracy of the methods behaves oppositely:method 1 can produce a noticeable averaging artifact in the deriv-ing of the long-range forces; whereas method 2 can be successfullyused to derive the averaged long-range force parameters withoutartifacts. As expected, both methods become accurate when thesurface heterogeneity is low. This is summarized in Fig. 10 whichshows a comparison of both averaging methods.
7. Seven rules to measure elastic modulus of cells
In summary, we formulate the following rules of the methoddescribed.
Rule 1. To process experimental data to calculate the elasticmodulus (material-only specific), not stiffness (load force, probegeometry, and material specific).
Rule 2. To take into consideration only the top part of the cell (ora flat part) because all elastic models used are built for such ageometry only. Do not use tilted cell sides.
Rule 3. To use the same relatively slow speed of vertical rampingof the scanner in all measurements (1–10 lm/s). Strictly speaking,one needs to keep the speed of strain change constant. But as thefirst order approximation, it can be treated the same as the speedof vertical ramping.
Rule 4. To use the model with cellular brush described here.Ignoring the brush does not allow treating the cell as an elastic
medium because brush is essentially inelastic in nature. It is stilla surprise that the rest ‘‘cell body’’ demonstrates linear elasticbehavior of homogeneous isotropic material. And one needs to testit for all cell types, see the next rules.
Rule 5. (a) To use a sufficiently dull probe to avoid non-linearityof the cell body material; (b) Necessary condition of linearity ofelastic homogeneous isotropic material should be verified: themodulus must be independent of penetration. This should be cal-culated/checked for all cell types.
Rule 6. Do not overload to avoid artifacts due to the cell organ-elles or substrate. The limiting load forces should be seen when thedependence of the derived modulus on the indentation depth isplotted (Rule 5b).
Rule 7. (a) To collect enough statistics even within each cell. Theradius of curvature of each cell is recovered from the topographicimage of the force-volume mode. To find the proper radius beforedeforming the cell, each height pixel should be corrected by theamount of deformation.
(b) Averaging of the collected raw data is a possible time-savingoption. An appropriate averaging method should be used, whichdepends on the goal and heterogeneity of the cell surface.
8. Conclusion
Here we present a method to process force-indentation curvesobtained on living biological cells under physiological buffer ormedium. Although the method can be applied to any indenterinstrument, we focus on describing the use of atomic force micros-copy. The method has two main features (a) the cellular brush (anon-elastic layer surrounding cells) is taken into account, (b)rather dull AFM probes are used to avoid non-linearity in stress–strain behavior. In particular, we showed that the elastic modulusof cells is independent of the indentation depth up to 10–20%deformation for the epithelial cells studied here. Besides the elasticmodulus, our method allows obtaining the parameters of the brushsurrounding the cells, such as the effective length and grafting den-sity. Although the method is demonstrated on eukaryotic cells, itshould be directly applicable for all types of cells, and even non-
212 I. Sokolov et al. / Methods 60 (2013) 202–213
biological soft materials surrounded by either a brush or any fieldof long-range forces.
Acknowledgment
We thank Dr. Woodworth for the help with the growth andhandling cells. American Type Culture Collection (ATCC) isacknowledged for providing MCF-7 cells.
References
[1] P. Ulrich, X. Zhang, Diabetologia 40 (1997) S157–S159.[2] G. Perry, M.A. Smith, Free Radical Biol. Med. 31 (2001) 175–180.[3] R. Bucala, A. Cerami, Adv. Pharmacol. 23 (1992) 1–34.[4] G.P. Dimri, X. Lee, G. Basile, M. Acosta, G. Scott, C. Roskelley, E.E. Medrano, M.
Linskens, I. Rubelj, O. Pereira-Smith, Proc. Natl. Acad. Sci. USA 92 (1995)9363–9367.
[5] T.K. Berdyyeva, C.D. Woodworth, I. Sokolov, Phys. Med. Biol. 50 (2005) 81–92.[6] S. Suresh, Acta Biomater. 3 (2007) 413–438.[7] S.E. Cross, Y.S. Jin, J. Rao, J.K. Gimzewski, Nat. Nanotechnol. 2 (2007) 780–783.[8] G.B. Nash, E. O’brien, E.C. Gordon-Smith, J.A. Dormandy, Blood 74 (1989) 855–
861.[9] S.K. Mohanty, A. Uppal, P.K. Gupta, Biotechnol. Lett. 26 (2004) 971–974.
[10] S. Areekul, J. Med. Assoc. Thai. 56 (1973) 163–167.[11] J. Li, M. Dao, C.T. Lim, S. Suresh, Biophys. J. 88 (2005) 3707–3719.[12] M.J. Paszek, N. Zahir, K.R. Johnson, J.N. Lakins, G.I. Rozenberg, A. Gefen, C.A.
Reinhart-King, S.S. Margulies, M. Dembo, D. Boettiger, D.A. Hammer, V.M.Weaver, Cancer Cell 8 (2005) 241–254.
[13] S. Huang, D.E. Ingber, Cancer Cell 8 (2005) 175–176.[14] M. Lekka, P. Laidler, Nat. Nanotechnol. 4 (2009) 72. author reply 72–73.[15] M. Lekka, J. Lekki, M. Marszałek, P. Golonka, Z. Stachura, B. Cleff, A.Z.
Hrynkiewicz, Appl. Surf. Sci. 141 (1999) 345–349.[16] I. Sokolov, in: H.S.N.A.T. Webster (Ed.), Cancer Nanotechnology –
Nanomaterials for Cancer Diagnosis and Therapy, APS, Los Angeles, 2007,pp. 43–59.
[17] D. Cuvelier, I. Derenyi, P. Bassereau, P. Nassoy, Biophys. J. 88 (2005) 2714–2726.
[18] F. Gerbal, V. Laurent, A. Ott, M.F. Carlier, P. Chaikin, J. Prost, Eur. Biophys. J. 29(2000) 134–140.
[19] K. Svoboda, C.F. Schmidt, D. Branton, S.M. Block, Biophys. J. 63 (1992) 784–793.
[20] V.M. Laurent, E. Planus, R. Fodil, D. Isabey, Biorheology 40 (2003) 235–240.[21] A.R. Bausch, U. Hellerer, M. Essler, M. Aepfelbacher, E. Sackmann, Biophys. J.
80 (2001) 2649–2657.[22] A.R. Bausch, W. Moller, E. Sackmann, Biophys. J. 76 (1999) 573–579.[23] J.C. Berrios, M.A. Schroeder, R.D. Hubmayr, J. Appl. Physiol. 91 (2001) 65–73.[24] L. Deng, N.J. Fairbank, D.J. Cole, J.J. Fredberg, G.N. Maksym, J. Appl. Physiol. 99
(2005) 634–641.[25] W. Feneberg, M. Aepfelbacher, E. Sackmann, Biophys. J. 87 (2004) 1338–1350.[26] V. Heinrich, R.E. Waugh, Ann. Biomed. Eng. 24 (1996) 595–605.[27] H. Huang, R.D. Kamm, P.T. So, R.T. Lee, Hypertension 38 (2001) 1158–1161.[28] G.N. Maksym, B. Fabry, J.P. Butler, D. Navajas, D.J. Tschumperlin, J.D. Laporte,
J.J. Fredberg, J. Appl. Physiol. 89 (2000) 1619–1632.[29] J. Ohayon, P. Tracqui, Ann. Biomed. Eng. 33 (2005) 131–141.[30] M. Puig-De-Morales, M. Grabulosa, J. Alcaraz, J. Mullol, G.N. Maksym, J.J.
Fredberg, D. Navajas, J. Appl. Physiol. 91 (2001) 1152–1159.[31] A. Chabanel, D. Schachter, S. Chien, Hypertension 10 (1987) 603–607.[32] E.A. Evans, R. Waugh, L. Melnik, Biophys. J. 16 (1976) 585–595.[33] T.C. Havell, D. Hillman, L.S. Lessin, Am. J. Hematol. 4 (1978) 9–16.[34] O. Linderkamp, E. Friederichs, H.J. Meiselman, Pediatr. Res. 34 (1993) 688–
693.[35] G.B. Nash, W.B. Gratzer, Biorheology 30 (1993) 397–407.[36] G.B. Nash, H.J. Meiselman, Blood Cells 17 (1991) 517–522. discussion 523–
515.[37] M. Paulitschke, J. Mikita, D. Lerche, W. Meier, Int. J. Microcirc. Clin. Exp. 10
(1991) 67–73.[38] M. Paulitschke, G.B. Nash, D.J. Anstee, M.J. Tanner, W.B. Gratzer, Blood 86
(1995) 342–348.[39] S. Suresh, Acta Biomater. 3 (2007) 413–438.[40] M.E. Dokukin, I. Sokolov, Macromolecules 45 (2012) 4277–4288.[41] M.E. Dokukin, I. Sokolov, Langmuir 28 (2012) 16060–16071.[42] H.J. Butt, B. Cappella, M. Kappl, Surf. Sci. Rep. 59 (2005) 1–152.[43] M. Lekka, D. Gil, K. Pogoda, J. Dulinska-Litewka, R. Jach, J. Gostek, O.
Klymenko, S. Prauzner-Bechcicki, Z. Stachura, J. Wiltowska-Zuber, K. Okon, P.Laidler, Arch. Biochem. Biophys. 518 (2012) 151–156.
[44] E. A-Hassan, W.F. Heinz, M.D. Antonik, N.P. D’costa, S. Nageswaran, C.A.Schoenenberger, J.H. Hoh, Biophys. J. 74 (1998) 1564–1578.
[45] S. Iyer, R.M. Gaikwad, V. Subba-Rao, C.D. Woodworth, I. Sokolov, Nat.Nanotechnol. 4 (2009) 389–393.
[46] S. Suresh, Acta Mater. 55 (2007) 3989–4014.[47] A. Ikai, Adv. Biochem. Eng. Biotechnol. 119 (2010) 47–61.[48] A.N. Ketene, E.M. Schmelz, P.C. Roberts, M. Agah, Nanomed. Nanotechnol. 8
(2012) 93–102.
[49] S.E. Cross, Y.S. Jin, J. Tondre, R. Wong, J. Rao, J.K. Gimzewski, Nanotechnology19 (2008).
[50] A.F. Christ, K. Franze, H. Gautier, P. Moshayedi, J. Fawcett, R.J.M. Franklin, R.T.Karadottir, J. Guck, J. Biomech. 43 (2010) 2986–2992.
[51] M. Edidin, Immunol. Res. 47 (2010) 265–272.[52] N. Walter, T. Busch, T. Seufferlein, J.P. Spatz, Biointerphases 6 (2011) 79–85.[53] A. Vinckier, G. Semenza, FEBS Lett. 430 (1998) 12–16.[54] G. Bischoff, A. Bernstein, D. Wohlrab, H.J. Hein, Methods Mol. Biol. 242 (2004)
105–124.[55] E. Sackmann, FEBS Lett. 346 (1994) 3–16.[56] J.L. Alonso, W.H. Goldmann, Life Sci. 72 (2003) 2553–2560.[57] L.D. Landau, E.M. Lifshi⁄T⁄S, A.D.M. Kosevich, L.P. Pitaevski⁄I, Theory of
Elasticity, third english ed., Pergamon Press, Oxford Oxfordshire, New York,1986.
[58] I. Diaconu, D. Dorohoi, J. Optoelectron. Adv. M. 7 (2005) 921–924.[59] R.T. Adkins, Information Sources in Polymers and Plastics, Bowker-Saur,
London, New York, 1989.[60] S. Kalpakjian, S.R. Schmid, Manufacturing Processes for Engineering
Materials, fifth ed., Pearson Education, Upper Saddle River, NJ, 2008.[61] Z.Y. Tang, Y. Wang, P. Podsiadlo, N.A. Kotov, Adv. Mater. 19 (2007) 906.[62] Q.K. Ong, I. Sokolov, J. Colloid Interface Sci. 310 (2007) 385–390.[63] I. Sokolov, Q.K. Ong, H. Shodiev, N. Chechik, D. James, M. Oliver, J. Colloid
Interface Sci. 300 (2006) 475–481.[64] M. Nikkhah, J.S. Strobl, E.M. Schmelz, M. Agah, J. Biomech. 44 (2011) 762–766.[65] M. Dokukin, N. Guz, I. Sokolov, Biophys. J. 104 (2013) 1–9.[66] L.M. Jones, M.J. Gardner, J.B. Catterall, G.A. Turner, Clin. Exp. Metastasis 13
(1995) 373–380.[67] R.L. Goldberg, B.P. Toole, Exp. Cell Res. 151 (1984) 258–263.[68] I. Sokolov, S. Iyer, V. Subba-Rao, R.M. Gaikwad, C.D. Woodworth, Appl. Phys.
Lett. 91 (2007) 023902. 023901–023903.[69] R. Kosaki, K. Watanabe, Y. Yamaguchi, Cancer Res. 59 (1999) 1141–1145.[70] N. Itano, F. Atsumi, T. Sawai, Y. Yamada, O. Miyaishi, T. Senga, M. Hamaguchi,
K. Kimata, Proc. Natl. Acad. Sci. USA 99 (2002) 3609–3614.[71] B. Toole, in: E. Hay (Ed.), Cell Biology of the Extracellular Matrix, Plenum
Press, New York, 1982, pp. 259–294.[72] E. Zimmerman, B. Geiger, L. Addadi, Biophys. J. 82 (2002) 1848–1857.[73] T.D. Camenisch, J.A. Schroeder, J. Bradley, S.E. Klewer, J.A. Mcdonald, Nat.
Med. 8 (2002) 850–855.[74] W.Y. Chen, G. Abatangelo, Wound Repair Regen. 7 (1999) 79–89.[75] D. Jiang, J. Liang, J. Fan, S. Yu, S. Chen, Y. Luo, G.D. Prestwich, M.M.
Mascarenhas, H.G. Garg, D.A. Quinn, R.J. Homer, D.R. Goldstein, R. Bucala, P.J.Lee, R. Medzhitov, P.W. Noble, Nat. Med. 11 (2005) 1173–1179.
[76] C.A. De La Motte, V.C. Hascall, J. Drazba, S.K. Bandyopadhyay, S.A. Strong, Am.J. Pathol. 163 (2003) 121–133.
[77] J.S. Richards, Mol. Cell Endocrinol. 234 (2005) 75–79.[78] B.P. Toole, Nat. Rev. Cancer 4 (2004) 528–539.[79] S. Kumar, J.H. Hoh, Biochem. Biophys. Res. Commun. 324 (2004) 489–496.[80] H.G. Brown, J.H. Hoh, Biochemistry 36 (1997) 15035–15040.[81] T.K. Berdyyeva, C.D. Woodworth, I. Sokolov, Phys. Med. Biol. 50 (2005) 81–92.[82] J.H. Hoh, C.A. Schoenenberger, J. Cell Sci. 107 (Pt 5) (1994) 1105–1114.[83] A. Ikai, R. Afrin, H. Sekiguchi, T. Okajima, M.T. Alam, S. Nishida, Curr. Protein
Pept. Sci. 4 (2003) 181–193.[84] R. Lal, S.A. John, Am. J. Physiol. 266 (1994) C1–21.[85] E. Lesniewska, M.C. Giocondi, V. Vie, E. Finot, J.P. Goudonnet, C. Le Grimellec,
Kidney Int. Suppl. 65 (1998) S42–48.[86] M. Melling, S. Hochmeister, R. Blumer, K. Schilcher, S. Mostler, M. Behnam, J.
Wilde, D. Karimian-Teherani, Neuroimage 14 (2001) 1348–1352.[87] I. Obataya, C. Nakamura, S. Han, N. Nakamura, J. Miyake, Biosens. Bioelectron.
20 (2005) 1652–1655.[88] F.M. Ohnesorge, J.K. Horber, W. Haberle, C.P. Czerny, D.P. Smith, G. Binnig,
Biophys. J. 73 (1997) 2183–2194.[89] Y. Rabinovich, M. Esayanur, S. Daosukho, K. Byer, H. El-Shall, S. Khan, J. Colloid
Interface Sci. 285 (2005) 125–135.[90] M. Radmacher, IEEE Eng. Med. Biol. Mag. 16 (1997) 47–57.[91] C. Rotsch, M. Radmacher, Biophys. J. 78 (2000) 520–535.[92] P. Schaer-Zammaretti, J. Ubbink, Ultramicroscopy 97 (2003) 199–208.[93] H.W. Wu, T. Kuhn, V.T. Moy, Scanning 20 (1998) 389–397.[94] W. Xu, P.J. Mulhern, B.L. Blackford, M.H. Jericho, M. Firtel, T.J. Beveridge, J.
Bacteriol. 178 (1996) 3106–3112.[95] Y. Yamane, H. Shiga, H. Haga, K. Kawabata, K. Abe, E. Ito, J. Electron Microsc.
(Tokyo) 49 (2000) 463–471.[96] L. Zhao, D. Schaefer, M.R. Marten, Appl. Environ. Microbiol. 71 (2005) 955–
960.[97] I. Sokolov, S. Iyer, C.D. Woodworth, Nanomed.: Nanotechnol. Biol. Med.
(Nanomedicine) 2 (2006) 31–36.[98] M. Lekka, P. Laidler, D. Gil, J. Lekki, Z. Stachura, A.Z. Hrynkiewicz, Eur. Biophys.
J. 28 (1999) 312–316.[99] S. Park, D. Koch, R. Cardenas, J. Kas, C.K. Shih, Biophys. J. 89 (2005) 4330–
4342.[100] B. Rosner, Fundamentals of Biostatistics, seventh ed., Cengage Learning,
Boston, MA, 2010.[101] D.O. Volkov, P.R.V. Dandu, H. Goodman, B. Santora, I. Sokolov, Appl. Surf. Sci.
257 (2011) 8518–8524.[102] B. Shoelson, E.K. Dimitriadis, H. Cai, B. Kachar, R.S. Chadwick, Biophys. J. 87
(2004) 2768–2777.

I. Sokolov et al. / Methods 60 (2013) 202–213 213
[103] E.K. Dimitriadis, F. Horkay, J. Maresca, B. Kachar, R.S. Chadwick, Biophys. J. 82(2002) 2798–2810.
[104] F. Rico, P. Roca-Cusachs, N. Gavara, R. Farre, M. Rotger, D. Navajas, Phys. Rev.E Stat. Nonlin. Soft Matter Phys. 72 (2005) 021914.
[105] A.B. Mathur, G.A. Truskey, W.M. Reichert, Biophys. J. 78 (2000) 1725–1735.[106] R.M. Gaikwad, M.E. Dokukin, K.S. Iyer, C.D. Woodworth, D.O. Volkov, I.
Sokolov, The Analyst 136 (2011) 1502–1506.[107] S. Iyer, C.D. Woodworth, R.M. Gaikwad, Y.Y. Kievsky, I. Sokolov, Small 5
(2009) 2277–2284.[108] A. Gruverman, O. Auciello, H. Tokumoto, Annu. Rev. Mater. Sci. 28 (1998)
101–123.
[109] P. Carl, H. Schillers, Pflug. Arch. Eur. J. Phy. 457 (2008) 551–559.[110] H.J. Butt, M. Kappl, H. Mueller, R. Raiteri, W. Meyer, J. Ruhe, Langmuir 15
(1999) 2559–2565.[111] C. Rotsch, F. Braet, E. Wisse, M. Radmacher, Cell Biol. Int. 21 (1997) 685–696.[112] R. Matzke, K. Jacobson, M. Radmacher, Nat. Cell Biol. 3 (2001) 607–610.[113] Q.S. Li, G.Y. Lee, C.N. Ong, C.T. Lim, Biochem. Biophys. Res. Commun. 374
(2008) 609–613.[114] I. Sokolov, V. Kalaparthi, M. Kreshchuk, M.E. Dokukin, Ultramicroscopy 121
(2012) 16–24.
Related Documents