Methane Emissions from Gas Residential Meter Set Andres Beltran, Stephen Ramos January 2021 The contents of this presentation are confidential and are intended solely for addressee. Any reproduction or dissemination of this transmission is prohibited.

Welcome message from author
This document is posted to help you gain knowledge. Please leave a comment to let me know what you think about it! Share it to your friends and learn new things together.
Transcript
Methane Emissions from Gas
Residential Meter Set
Andres Beltran, Stephen Ramos
January 2021
The contents of this presentation are confidential and are intended solely for
addressee. Any reproduction or dissemination of this transmission is prohibited.
Current Reporting
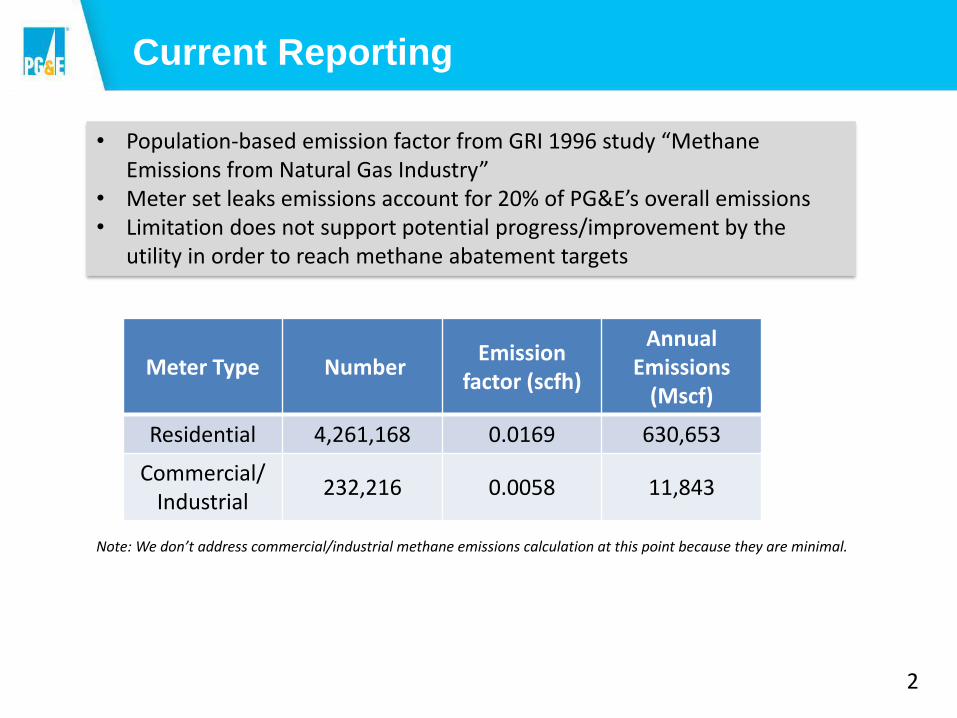
• Population-based emission factor from GRI 1996 study “Methane Emissions from Natural Gas Industry”
• Meter set leaks emissions account for 20% of PG&E’s overall emissions• Limitation does not support potential progress/improvement by the
utility in order to reach methane abatement targets
Meter Type NumberEmission
factor (scfh)
Annual Emissions
(Mscf)
Residential 4,261,168 0.0169 630,653
Commercial/ Industrial
232,216 0.0058 11,843
Note: We don’t address commercial/industrial methane emissions calculation at this point because they are minimal.
2

GTI – Bubble Size Classification
Classification Description Thresholds (scfh)
Mean Emission Rate (scfh)
ASoap solution is blown off the facility providing no opportunity for bubbles to form and “hold”
> 4 9.5
B Soap solution can hold a cluster of bubbles >0.1 to < 4 0.53
CSoap solution forms a cluster of small bubbles >0.014 to
<0.10.041
D Soap solution creates foam with few or no visible bubbles <0.014 0.0032
Notes: 1) Classifications and description per PG&E procedure TD-4110P-01 JA-012) Thresholds were determined using GTI’s lab experiment data based on behavior of soap bubbles
• GTI completed project 7.17.d Methodology to Estimate Flow Rate of Above Ground Leaks Using a Soap Test in July 2019
• Based on GTI’s study, various classification bins (A, B, C, and D) were created with their associated emission ranges
• The mean leak rate of each category can be used as the representative flow rate• The calculated flow rate is calculated using the simulated lognormal distribution
3

Bigger leaksSmaller leaks
D B
GTI - Residential Meter Thresholds
Source: GTI 7.17.a Estimate Flow Rate Using Soap Test
C A
Representative flow rates:
Soap is blown-off
4
PG&E New Leak Grading and Response
• PG&E Procedure TD-4110P-09 “Leak Grading and Response” was published in December 2019 and made into effect in February 2020. The update includes bubble size classifications.
• TD-4110P-09 standard evaluates non gradable meter set leaks that are above the shutoff valve with a soap test and bubble size classification.
• However, the standard evaluates a meter set leak below the shutoff valve differently.• A soap test is performed on meter set leaks below the shutoff valve, but leak
survey grades the leak based on location of leak and size of bubbles.
• To calculate total meter set emissions, PG&E will evaluate all above ground leaks related to the meter set.
5
2020 Survey Year
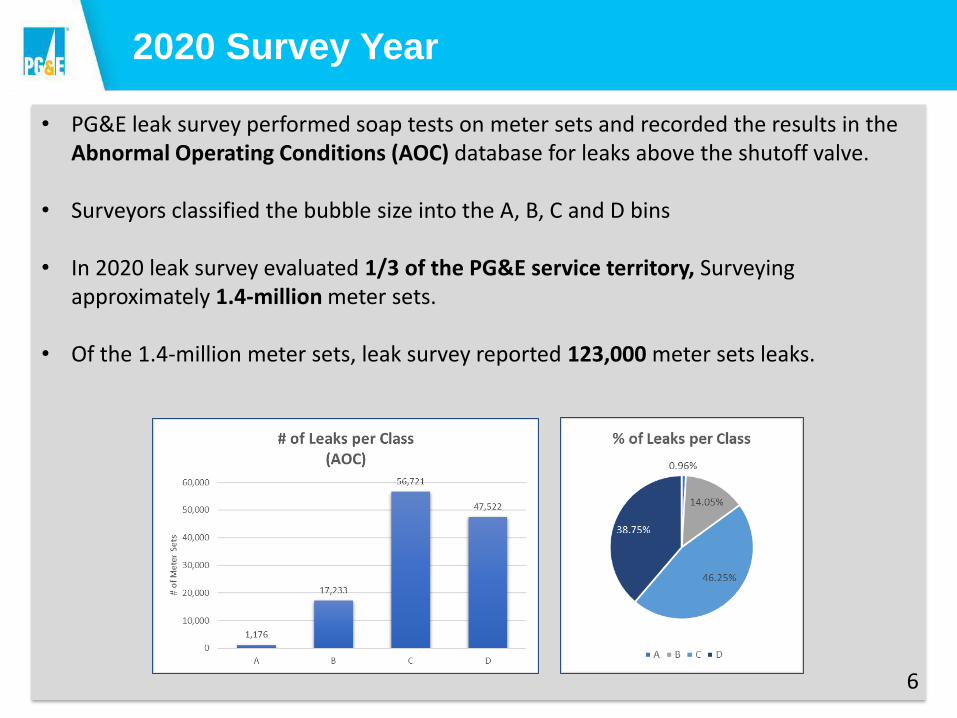
• PG&E leak survey performed soap tests on meter sets and recorded the results in the Abnormal Operating Conditions (AOC) database for leaks above the shutoff valve.
• Surveyors classified the bubble size into the A, B, C and D bins
• In 2020 leak survey evaluated 1/3 of the PG&E service territory, Surveying approximately 1.4-million meter sets.
• Of the 1.4-million meter sets, leak survey reported 123,000 meter sets leaks.
6
Repair Tracking
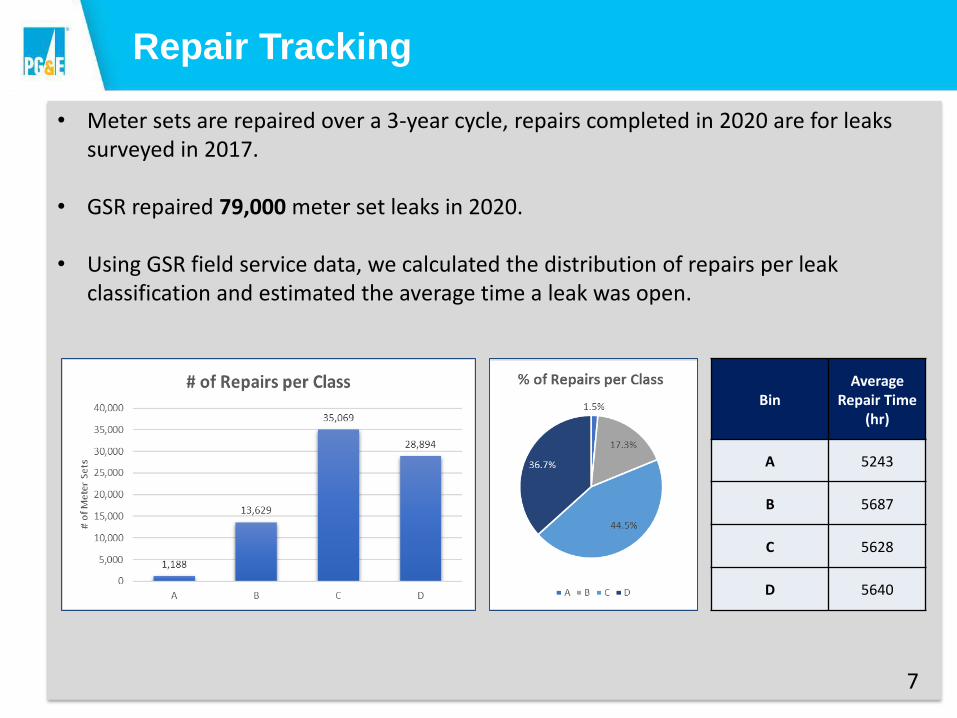
• Meter sets are repaired over a 3-year cycle, repairs completed in 2020 are for leaks surveyed in 2017.
• GSR repaired 79,000 meter set leaks in 2020.
• Using GSR field service data, we calculated the distribution of repairs per leak classification and estimated the average time a leak was open.
7
BinAverage
Repair Time (hr)
A 5243
B 5687
C 5628
D 5640
Tracking Open Leaks
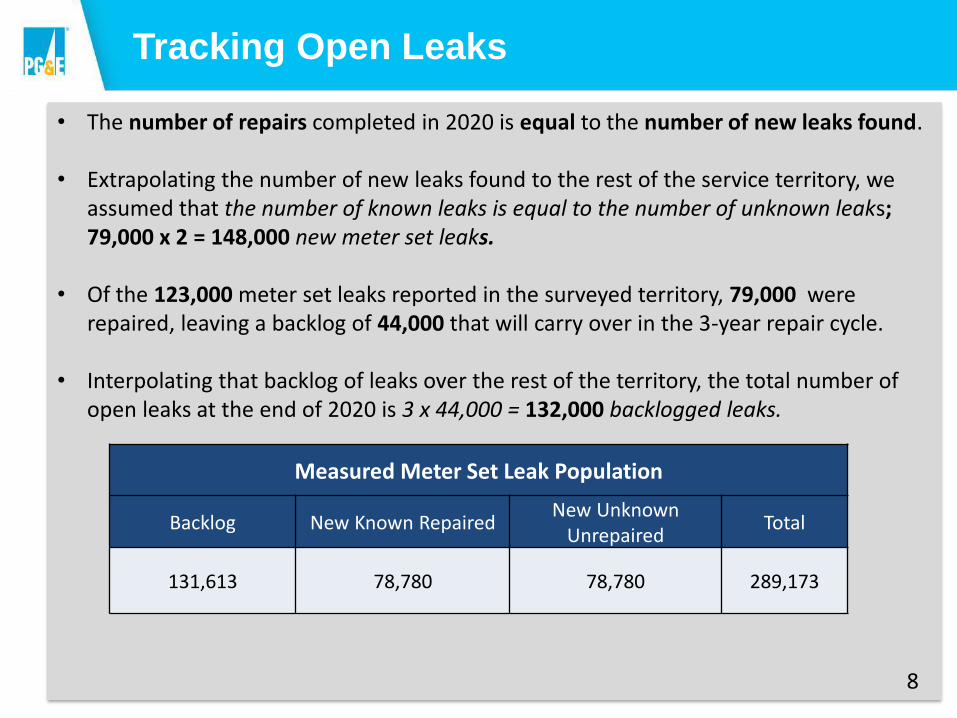
• The number of repairs completed in 2020 is equal to the number of new leaks found.
• Extrapolating the number of new leaks found to the rest of the service territory, we assumed that the number of known leaks is equal to the number of unknown leaks; 79,000 x 2 = 148,000 new meter set leaks.
• Of the 123,000 meter set leaks reported in the surveyed territory, 79,000 were repaired, leaving a backlog of 44,000 that will carry over in the 3-year repair cycle.
• Interpolating that backlog of leaks over the rest of the territory, the total number of open leaks at the end of 2020 is 3 x 44,000 = 132,000 backlogged leaks.
8
Measured Meter Set Leak Population
Backlog New Known RepairedNew Unknown
UnrepairedTotal
131,613 78,780 78,780 289,173
Total Number of Classified MSL Leaks
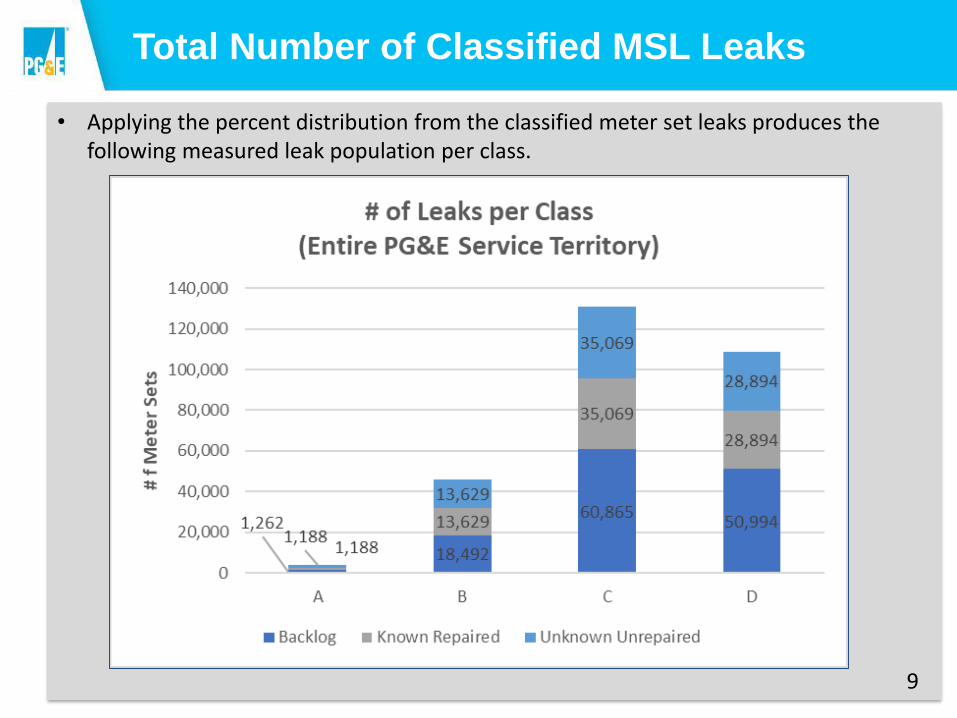
• Applying the percent distribution from the classified meter set leaks produces the following measured leak population per class.
9

No Bubble Leaks
• Based on the CARB Quantifying Methane Emissions from Natural Gas Residential Customer Meters in California study, PG&E will count emissions on meter sets that do not display a bubble indication.
• CARB evaluated 166 leaking meter sets:• 77 were classified as having bubbles 89 displayed no bubbles
• Of total number of leak indications, 54% displayed no bubbles, 46% displayed a bubble indication. PG&E will apply the percentage of no bubble indications in the CARB study to the total number of open meter set leaks.
• Of the 4.2 million residential meter sets in the PG&E service territory, 15% of the meter sets are leaking. CARB estimates that 25% of meter sets are leaking, our calculation is close to that estimation.
10
Class% of Total Leak
Indication
# of Leak
Indications
Total Leak
Count
% of Meter
sets with
Leak
Indications
Bubbles 46% 289,173628,637 14.7%
No Bubbles 54% 339,464
OTD Uncertainty Study
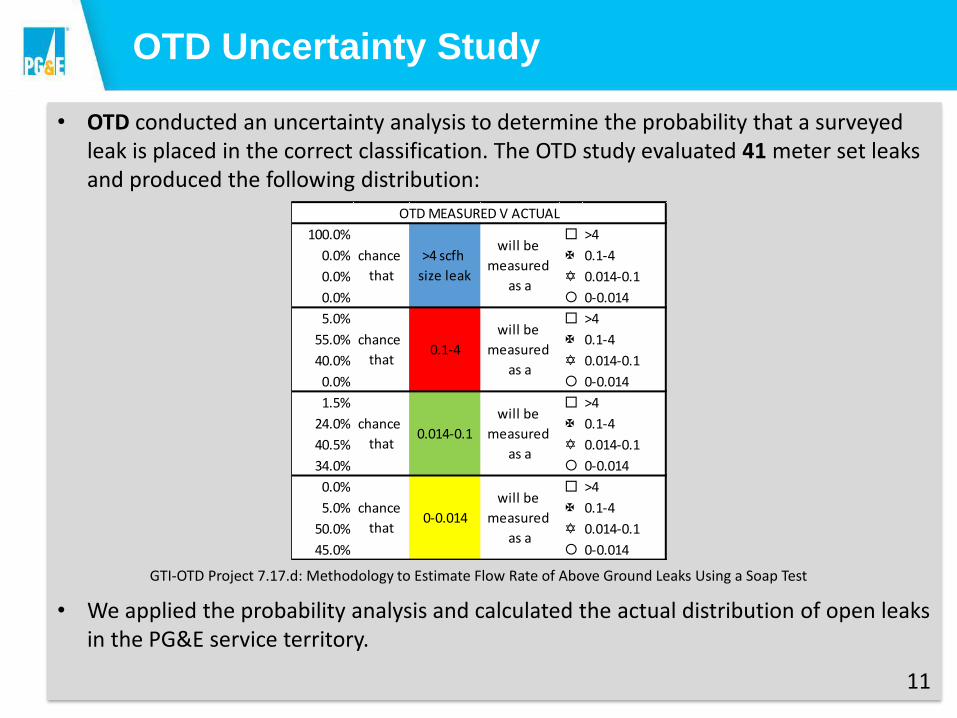
• OTD conducted an uncertainty analysis to determine the probability that a surveyed leak is placed in the correct classification. The OTD study evaluated 41 meter set leaks and produced the following distribution:
• We applied the probability analysis and calculated the actual distribution of open leaks in the PG&E service territory.
11
GTI-OTD Project 7.17.d: Methodology to Estimate Flow Rate of Above Ground Leaks Using a Soap Test
100.0% >4
0.0% X 0.1-4
0.0% Y 0.014-0.1
0.0% 0-0.014
5.0% >4
55.0% X 0.1-4
40.0% Y 0.014-0.1
0.0% 0-0.014
1.5% >4
24.0% X 0.1-4
40.5% Y 0.014-0.1
34.0% 0-0.014
0.0% >4
5.0% X 0.1-4
50.0% Y 0.014-0.1
45.0% 0-0.014
chance
that 0.1-4
will be
measured
as a
OTD MEASURED V ACTUAL
chance
that
>4 scfh
size leak
will be
measured
as a
chance
that 0.014-0.1
will be
measured
as a
chance
that 0-0.014
will be
measured
as a
Uncertainty Analysis Application
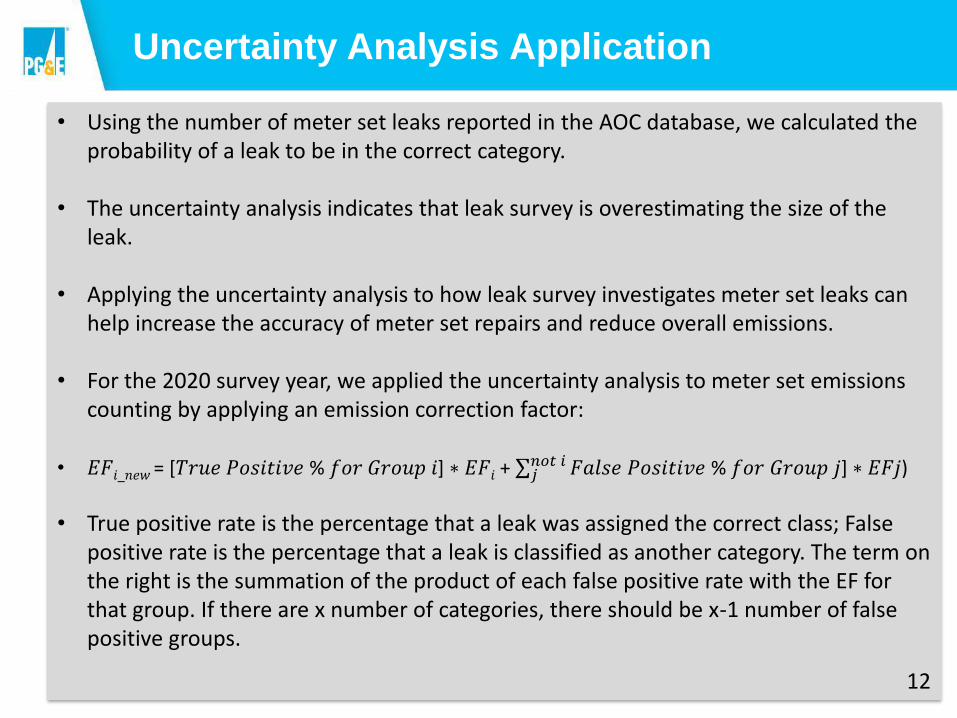
• Using the number of meter set leaks reported in the AOC database, we calculated the probability of a leak to be in the correct category.
• The uncertainty analysis indicates that leak survey is overestimating the size of the leak.
• Applying the uncertainty analysis to how leak survey investigates meter set leaks can help increase the accuracy of meter set repairs and reduce overall emissions.
• For the 2020 survey year, we applied the uncertainty analysis to meter set emissions counting by applying an emission correction factor:
• 𝐸𝐹𝑖_𝑛𝑒𝑤 = [𝑇𝑟𝑢𝑒 𝑃𝑜𝑠𝑖𝑡𝑖𝑣𝑒 % 𝑓𝑜𝑟 𝐺𝑟𝑜𝑢𝑝 𝑖] ∗ 𝐸𝐹𝑖 + σ𝑗𝑛𝑜𝑡 𝑖 𝐹𝑎𝑙𝑠𝑒 𝑃𝑜𝑠𝑖𝑡𝑖𝑣𝑒 % 𝑓𝑜𝑟 𝐺𝑟𝑜𝑢𝑝 𝑗] ∗ 𝐸𝐹𝑗)
• True positive rate is the percentage that a leak was assigned the correct class; False positive rate is the percentage that a leak is classified as another category. The term on the right is the summation of the product of each false positive rate with the EF for that group. If there are x number of categories, there should be x-1 number of false positive groups.
12
New Emission Factors
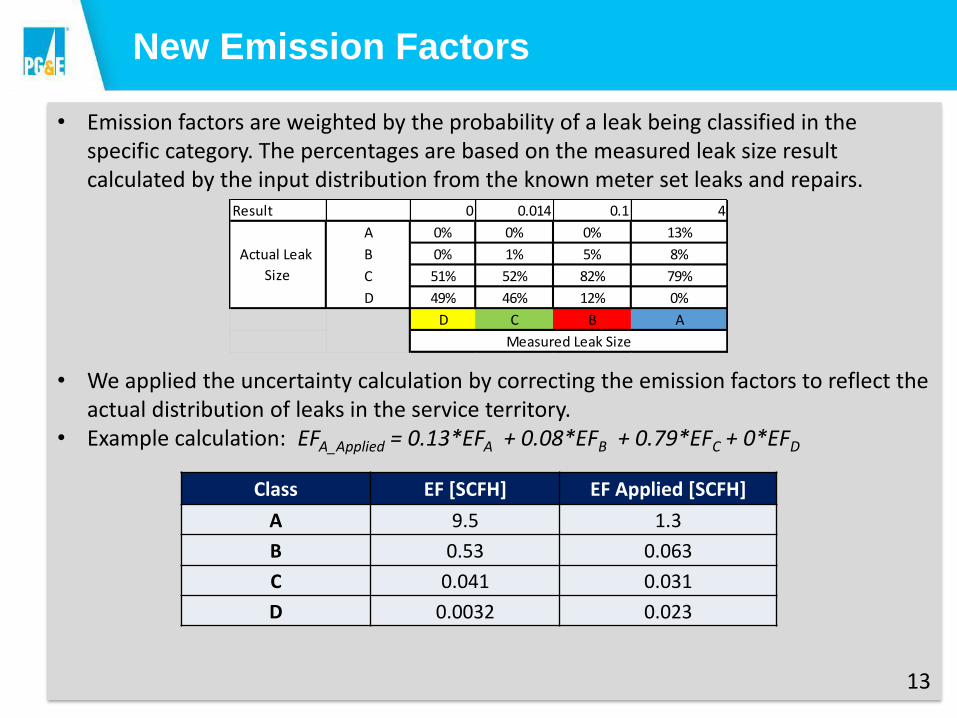
• Emission factors are weighted by the probability of a leak being classified in the specific category. The percentages are based on the measured leak size result calculated by the input distribution from the known meter set leaks and repairs.
• We applied the uncertainty calculation by correcting the emission factors to reflect the actual distribution of leaks in the service territory.
• Example calculation: EFA_Applied = 0.13*EFA + 0.08*EFB + 0.79*EFC + 0*EFD
13
Class EF [SCFH] EF Applied [SCFH]
A 9.5 1.3
B 0.53 0.063
C 0.041 0.031
D 0.0032 0.023
Result 0 0.014 0.1 4
A 0% 0% 0% 13%
B 0% 1% 5% 8%
C 51% 52% 82% 79%
D 49% 46% 12% 0%
D C B A
Actual Leak
Size
Measured Leak Size
Meter Set Emissions Calculation
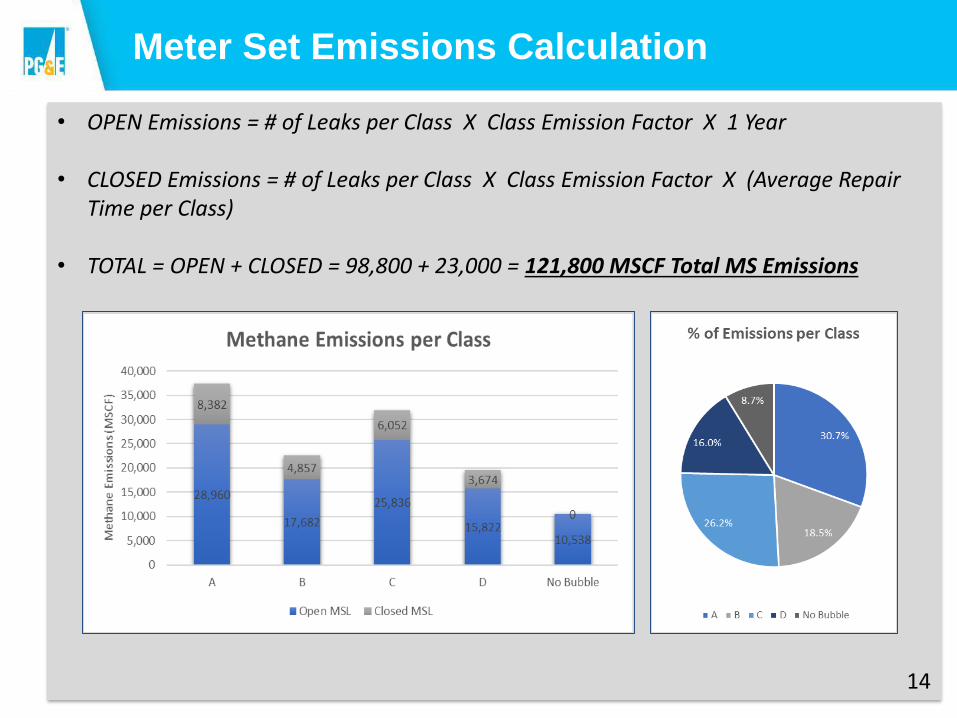
• OPEN Emissions = # of Leaks per Class X Class Emission Factor X 1 Year
• CLOSED Emissions = # of Leaks per Class X Class Emission Factor X (Average Repair Time per Class)
• TOTAL = OPEN + CLOSED = 98,800 + 23,000 = 121,800 MSCF Total MS Emissions
14

Riser Leak Population
• PG&E evaluated leaks below the shut off valve that are above ground and add those fugitive emissions to the total meter set emissions count.
• These leaks are related to the riser, they are surveyed with a soap test, graded based on the location and size of the bubble and are recorded in SAP.
• In 2020, leak survey found and repaired 3,200 new known riser leaks, applying a similar methodology from the meter sets, the number of unknown unrepaired risers' leaks is equal to 3,200 new unknown unrepaired riser leaks
• PG&E reported 4,200 backlogged leaks, M&C targeted these riser leaks and repaired the entire backlog. The leak population is listed below:
15
Riser Leak Population
Backlog RepairedNew Known
RepairedNew Unknown
UnrepairedTotal
4,222 3,176 3,176 10,574
Riser Leaks Emissions
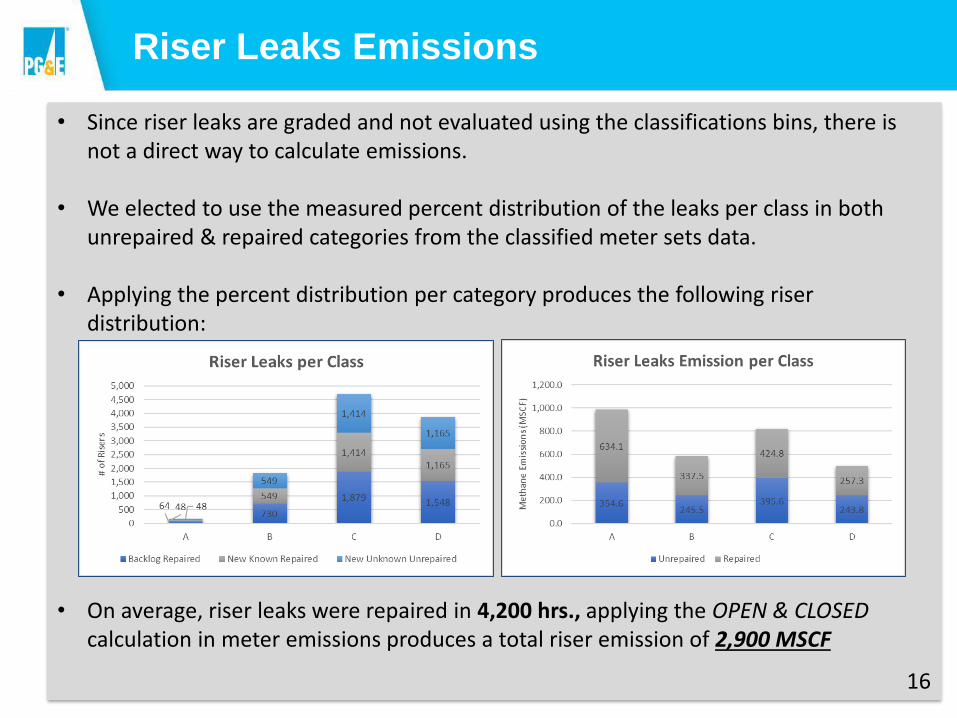
• Since riser leaks are graded and not evaluated using the classifications bins, there is not a direct way to calculate emissions.
• We elected to use the measured percent distribution of the leaks per class in both unrepaired & repaired categories from the classified meter sets data.
• Applying the percent distribution per category produces the following riser distribution:
• On average, riser leaks were repaired in 4,200 hrs., applying the OPEN & CLOSED calculation in meter emissions produces a total riser emission of 2,900 MSCF
16
Total Emissions = Meter Set Leaks + Riser Leaks
PG&E 2020 AG MS Emissions = 124,700 MSCF

READ AND DELETE
For best results with this template, use PowerPoint 2003
Thank you!
Andres Beltran, Stephen Ramos
[email protected], [email protected]
18
Related Documents