Pergamon Chemosphere, Vol. 35, No, 9, pp. 2059-2082, 1997 © 1997 Elsevier Science Ltd All rights reserved. Printed in Great Britain 0045-6535/97 $17.00+0.00 PII: S0045-6535(97)00231-2 METHANE AND NITROUS OXIDE FLUXES IN GRASSLANDS IN WESTERN PUERTO RICO A.R. Mosier" and J.A. Delgado USDA/ARS, P.O. Box E, Fort Collins, CO 80522, USA (Received in USA 25 February 1997; accepted 24 April 1997) ABSTRACT Changes in land use and agricultural practices in tropical soils are thought to make major contributions to the global soil source of nitrous oxide (N20) and sink for atmospheric methane (CI-h). The variety of measurements of these gas fluxes in tropical systems are, however, limited. From November 1992 until February 1995 we conducted weekly CH 4 and N20 flux measurements within three grassland locations in western Puerto Rico that had not been cultivated for at least 25 years. Sites were located in either Vertisol, Ultisol or Oxisol soils that are typical of soils in the tropics. Plots within each site included non-fertilized controls and plots where fertilizer was applied at recommended rates (300 kg N ha ~ y~ quarterly) for forage production in the region. During the measurement period, CI~ uptake rates averaged 5.8 ttg CH4-C m "2hr"1with no significant differences across sites. These uptake rates were generally 10-fold lower than those reported for tropical forests. Fertilizer addition had a small negative affect on CH4 uptake in the Vertisol, tended to enhance CH4 uptake in the Ultisol and significantly decreased CH4 uptake in the Oxisol. Nitrous oxide fluxes averaged 16.9 ttg N m 2 hr~ from unfertilized sites, with no significant differences across sites. These background emission rates were typically higher than those in temperate grasslands. In fertilized soils, N20 emissions averaged about 46 AtgN m 2 hr"] in the Ultisol and Oxisol and 130 ttg N m "2hr~ from the Vertisol, about 0.8 and 3.3% of the N applied. Fluxes from fertilized sites were within the range of emission rates observed for fertilized temperate grasslands. © 1997 Elsevier ScienceLtd Key Words: tropics, CH~, N20, greenhouse gases 1. INTRODUCTION The soil-atmosphere exchange of nitrous oxide (N20) and methane (CH4) influences the radiative properties of the troposphere and CH 4 is involved in the oxidant balance as well (IPCC, 1996). Tropical soil systems are considered to have a dominant role in the atmospheric balance of both trace gases (Keller and Matson, 1994; Matson and Vitousek, 1987; Potter et al., 1996a & b). The conversion of tropical forests to agricultural use generates important perturbations to the soil-atmosphere exchange of these trace gases. Conversion of tropical forest to grasslands initially increases N20 emissions (Keller and Reiners, 1994; Matson and Vitousok, 1987). Through continued use as pastures or secondary succession back to forest, N20 emissions decline to below native forest rates (Keller and Reiners, 1994; Keller et al., 1993) after about 20 years. Tropical forest soils are typically net consumers of atmospheric CH4. However, conversion of forests to grasslands can decrease this soil CH4 sink because of soil compaction by cattle grazing at the location (Keller et al., 1993; Steudler et al., 1996). 2059

Welcome message from author
This document is posted to help you gain knowledge. Please leave a comment to let me know what you think about it! Share it to your friends and learn new things together.
Transcript
Pergamon Chemosphere, Vol. 35, No, 9, pp. 2059-2082, 1997 © 1997 Elsevier Science Ltd
All rights reserved. Printed in Great Britain 0045-6535/97 $17.00+0.00
PII: S0045-6535(97)00231-2
METHANE AND NITROUS OXIDE FLUXES IN GRASSLANDS IN WESTERN PUERTO RICO
A.R. Mosier" and J.A. Delgado
USDA/ARS, P.O. Box E, Fort Collins, CO 80522, USA
(Received in USA 25 February 1997; accepted 24 April 1997)
ABSTRACT
Changes in land use and agricultural practices in tropical soils are thought to make major contributions to the global soil source of nitrous oxide (N20) and sink for atmospheric methane (CI-h). The variety of measurements of these gas fluxes in tropical systems are, however, limited. From November 1992 until February 1995 we conducted weekly CH 4 and N20 flux measurements within three grassland locations in western Puerto Rico that had not been cultivated for at least 25 years. Sites were located in either Vertisol, Ultisol or Oxisol soils that are typical of soils in the tropics. Plots within each site included non-fertilized controls and plots where fertilizer was applied at recommended rates (300 kg N ha ~ y~ quarterly) for forage production in the region. During the measurement period, CI~ uptake rates averaged 5.8 ttg CH4-C m "2 hr "1 with no significant differences across sites. These uptake rates were generally 10-fold lower than those reported for tropical forests. Fertilizer addition had a small negative affect on CH4 uptake in the Vertisol, tended to enhance CH4 uptake in the Ultisol and significantly decreased CH4 uptake in the Oxisol. Nitrous oxide fluxes averaged 16.9 ttg N m 2 hr ~ from unfertilized sites, with no significant differences across sites. These background emission rates were typically higher than those in temperate grasslands. In fertilized soils, N20 emissions averaged about 46 Atg N m 2 hr "] in the Ultisol and Oxisol and 130 ttg N m "2 hr ~ from the Vertisol, about 0.8 and 3.3% of the N applied. Fluxes from fertilized sites were within the range of emission rates observed for fertilized temperate grasslands. © 1997 Elsevier Science Ltd
Key Words: tropics, CH~, N20, greenhouse gases
1. INTRODUCTION
The soil-atmosphere exchange of nitrous oxide (N20) and methane (CH4) influences the radiative
properties of the troposphere and C H 4 is involved in the oxidant balance as well (IPCC, 1996). Tropical soil
systems are considered to have a dominant role in the atmospheric balance of both trace gases (Keller and Matson,
1994; Matson and Vitousek, 1987; Potter et al., 1996a & b). The conversion of tropical forests to agricultural use
generates important perturbations to the soil-atmosphere exchange of these trace gases. Conversion of tropical
forest to grasslands initially increases N20 emissions (Keller and Reiners, 1994; Matson and Vitousok, 1987).
Through continued use as pastures or secondary succession back to forest, N20 emissions decline to below native
forest rates (Keller and Reiners, 1994; Keller et al., 1993) after about 20 years. Tropical forest soils are typically
net consumers of atmospheric CH4. However, conversion of forests to grasslands can decrease this soil CH4 sink
because of soil compaction by cattle grazing at the location (Keller et al., 1993; Steudler et al., 1996).
2059
2060
Following conversion of forests to agricultural systems, N20 emissions typically increase with increased
cultivation and N-fertilization (Matson et al., 1996; Veldkamp and Keller, 1996). The impact of intensification
and N fertilization on CH4 consumption in aerobic tropical soils is not well documented (Keller et al., 1990; 1993).
An example of conversion of tropical forests to agricultural use exists on the island of Puerto Rico. Most of the
forested part of Puerto Rico were converted to intensive agriculture 100-300 years ago (Birdsey and Weaver,
1982). About 50 years ago much of the intensive agriculture was discontinued and many areas reverted to
Unmanaged grasslands (Lugo et al., 1986). Other areas of these grasslands are now fertilized to improve forage
production for cattle.
In July, 1992 we established field locations in three different soils that are prevalent in the tropics to
quantif3' CH4 and N20 fluxes in established mixed-grasslands and to measure the impact of fertilization on the
soil-atmosphere exchange of CH4 and N20 in these systems.
2. MATERIALS AND METHODS
Field sites were established in late July, 1992 in grasslands on the USDA/ARS research stations near
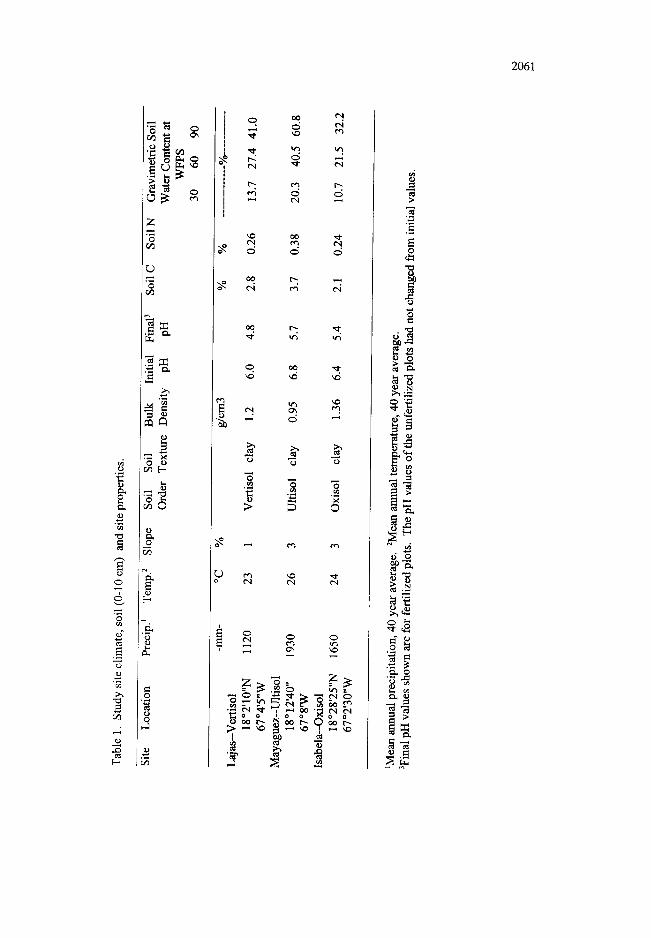
Isabela and Mayaguez and in the Puerto Rican Agricultural Experimental Station near Lajas. See Table 1 for
exact location and site characteristics. These are mixed grass sites where the dominant grasses are Guinea grass
(Panicum maximum) at Isabela and Mayaguez and about 50% Yerba huracan grass (Andropogum pertusus) and
about 30% Arrocillo grass (Paspalum paniculatum) at Lajas. These sites had not been cultivated during the past
25 years. The soils at the three sites were Oxisol [Coto clay (very fine, kalonitic, isohyperthermie Typic
Hapludox)], Isabela; Ultisol [Humatus clay (clayey, mixed, isohyperthermic, Typic Haplohumult)], Mayaguez;
and Vertisol [Fraternidad clay (fine, montmorillonitic, isohyperthermic, Typic Haplustert)], Lajas. At each
location 12, 7 m by 6 m plots were established within a 36 m by 14 m area with fertilizer treatment and
unfertilized control plots assigned randomly. At three month intervals, beginning 27 July, 1992, fertilized plots
were amcnded with a surface application 500 kg ha t of 15-5-10 mixed fertilizer which contained 60 kg ha-t of
ammonium sulfate-N and 15 kg ha t of ammonium phosphate-N with each fertilization.
2.1. Gas Flux Measurements
Chamber anchors to establish each gas sampling location were installed in July, 1992 within each fertilized
and control plot at each site. The permanently placed anchors were made from 20.3 cm diameter PVC pipe which
was driven 8 cm into the soil (Mosier et al., 1991; 1996). The inside top 1 cm of the anchor, which is above the
soil surface, had been milled to allow fitting a eharnber into the anchor.
Each week the soil-atmosphere exchange of CH4 and N20 within each site Was measured by fitting a 7.5
cm.high, closed, vented chamber (Hutchinson and Mosier, 1981) onto the anchor. We provided an additional seal
around the anchor-chamber joint with a 3 era wide rubber ring cut from a truck tire inner tube. Gas samples from
inside the chamber were taken with 35-ml polypropylene syringes fitted with nylon stopcocks, 0, 15, and 30
2061
o
o.
o o
o
o
F~
z
0 0~
(,3
o r ~
o ~
¢)
6~
[ -
¢L
o
o o
0 O~
o
o
I 0o l o c~ ¢,i
i
l ~ ~5 ¢5 I e,I
i
¢N e~ ¢xl o cs ~5
O0 t'~
o. 0o ~.
o
> ~ o
z ~ ; z ~
~ , ' ° ~ , ~ ,
o
2062
minutes after installing the chambers. Gas samples were taken to the laboratory in Mayaguez and analyzed for
N20 and CH4 concentration by gas chromatography. Gas flux measurements and calculations were performed as
described in Mosier et al., (1991; 1996). Gas fluxes were usually measured weekly from November, 1992 until
the second week of February, 1995, and are reported herein for the three sites.
2.2. Ancillary Measurements
On each sampling day, soils were collected from three plots within each treatment at depths of 0-10, 10-20,
and 20-30 cm. Soils were returned to the laboratory and individually analyzed for gravimetric, soil water content
and less frequently extracted with 2 M KC1 to determine nitrate and NI-14 + content. Soil temperature at 5 cm was
measured at each sampling time at each plot using a hand held digital thermometer. The mean of initial and final
air temperature was used in gas flux calculations. Daily minimum and maximum temperatures and precipitation
data were collected at each site. The grass within plots at each location was harvested from the plots monthly by
rotary mower. Soils were collected from each plot at the start of the study and at the end of the study at depths of
0-10, 10-20, and 20-30 cm, air dried, sieved and a portion was ground and transported to Fvrt Collins, CO for total
N and C analyses by an automated C/N combustion analyzer (Burke et al., 1990). Only i~fitial total N and C
values for soils from each site are reported in Table 1 as no significant differences between initial and final
measurements were found. Dally weather, including temperature and precipitation, was recorded at each location.
Soil pH was measured using aqueous saturated paste. Soil bulk density was measured by the core method (Blake
and Hartge, 1982) at a time when soil moisture conditions (about 50% soil water filled pore space (WFPS))
permitted limited compaction. We use a single value for bulk density of the Vertisol, realizing that this soil bulk
density varies with moisture content (Blake and Hartge, 1982), to facilitate discussions.
2.3. Statistical Analyses
Statistical analyses were performed using SAS analysis of variance GLM procedures (SAS Inst., 1991).
Distributions were checked for normality using the Shapiro-Wilk statistic. If the normality assumption was not
met, then treatments were separated using the Wilcoxon test, otherwise the LSD mean procedure was used to test
for N fertilizer effects within a site. The procedure of paired comparisons was used to compare control plots and
fertilized plots within and between sites. Similarily paired comparisons were done when testing for annual
variation in control plots at a specific site and annual variation of the fertilized plots at a specific site.
2.4. Laboratory incubations
In mid-April, 1994, soil samples were collected from unfertilized plots at each field site and returned to the
laboratory and sieved to pass through a 5 mm sieve. One hundred g of field moist soil was put into one quart
(about 950 ml total volume) cauning jars. Sufficient water to bring the soil WFPS to 70-80% was added with or
without 100 mg/kg dry soil of KNO3-N. The jars were sealed with rubber gasketed lids that had been fitted with a
rubber septum to permit sampling the gases within the jar. Jars were or were not injected with 10 ml of acetylene
(four replicates of each treatment) and incubated for 24 hours in the shade outside the laboratory where air
temperatures ranged between 25 and 32 ° C. Field 5-cm depth soil temperatures, taken midmoming, ranged
between 24 and 30 ° C during April. After 24-h the headspace gas from each jar was analyzed for N20 content by
2063
gas chromatography. Nitrous oxide concentration in the gas phase was adjusted for N20 dissolved in the aqueous
phase (Tiedje, 1982) so that numbers presented represent total N~O production.
3. RESULTS AND DISCUSSION
3.i. Nitrous Oxide
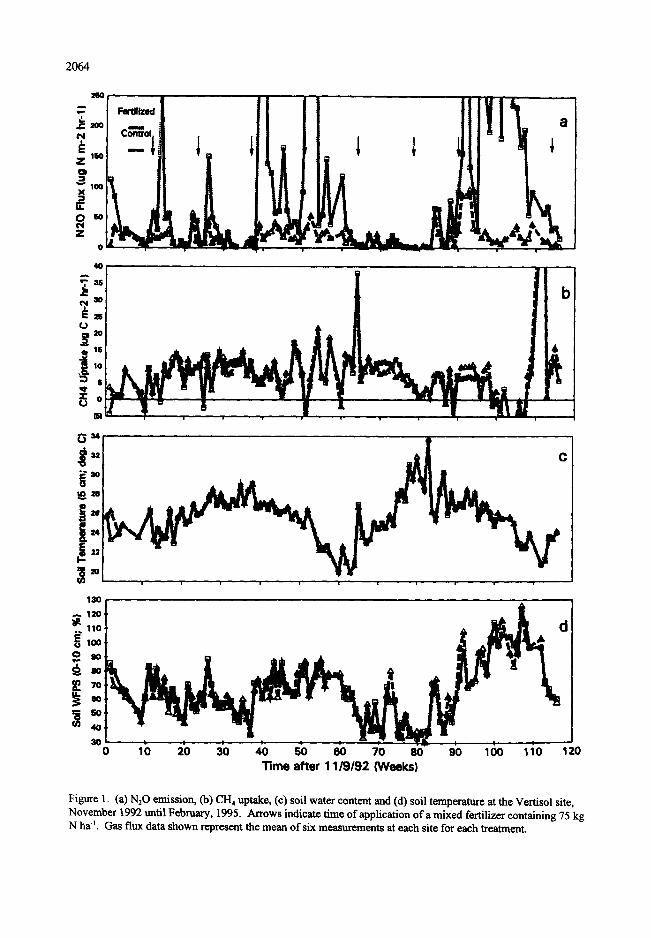
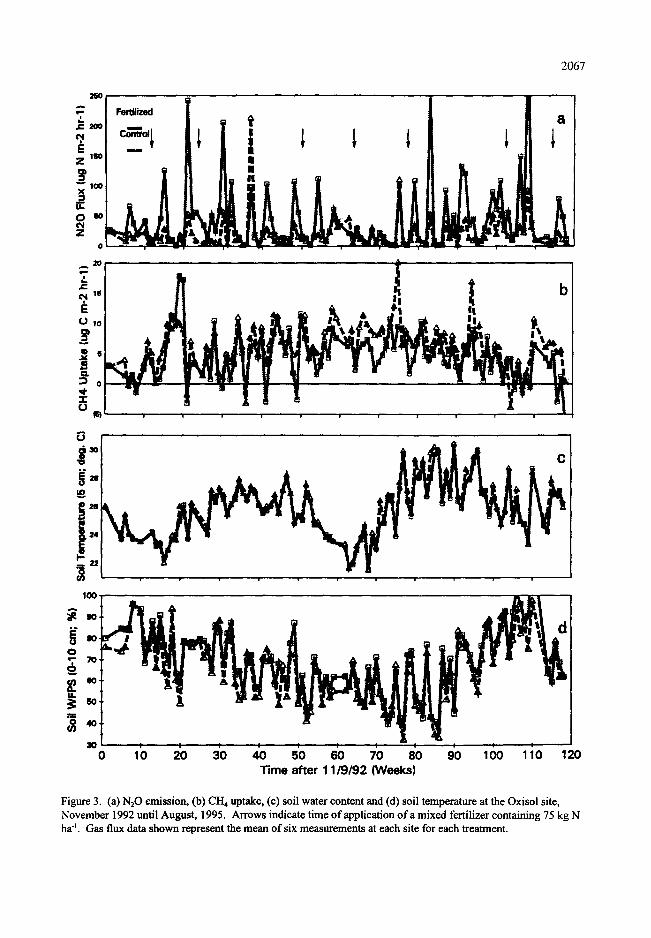
Vertisol. Nitrous oxide emissions from the unfertilized plots averaged 16.3 lag N m 2 hr" over the 28
month observation period (Table 2). Peak emission typically occurred with increased soil water content following
Table 2. Mean N20 emission and CH4 uptake rates over the November 1992 - February 1995
measurement period.
Site N20 CH4 Uptake
Fertilized Control Fertilized Control
. . . . . . . . . . . I~g N m 2 lw ~ . . . . . . . . . . . . . . . . . . . . . lag C m 2 hr l . . . . . . . . . .
Vertisol 130 a I (a) 2 16.3 a (b) 6.3 a (a) 6.7 a (a)
Ultisol 43.8 b (a) 15.8 a (b) 5.8 a (a) 4.5 b (a)
Oxisol 45.8 b (a) 18.8 a (b) 4.3 b (a) 6.0 a (b)
qn each column mean flux values of each trace gas at each site followed by different letters are
significantly different (P = 0.05).
2In each row within N20 or CH4 letters within parenthesis that are different indicate a difference
in mean N20 or CH4 flux between fertilized and unfertilized plots within each site.
drier periods (Figure 1). Maximum flux, 104 ~g m "2 hr "1, was observed at week 92 which corresponded to a rain
event following a 20-week relatively dry period. Over the observation period, N20 emissions from the fertilized
plots were significantly higher (P < 0.05) than control plots and averaged 130 gg m "2 hr "~. Emission peaks
corresponded to precipitation events following the quarterly fertilizations. Maximum fluxes of 2100 ~g m 2 hr ~
occurred at week 102 during a period of precipitation, high soil water content, during which fertilizer was applied.
Conditions of high soil water content, 70-80% WFPS, soil temperatures always above 20 ° C and high soil mineral
N content accentuate N20 emissions (Keller and Reiners, 1994; Linn and Doran, 1984). During weeks 60-82
when soil WFPS were frequently below 40% N20 emissions were very low, even following fertilization. Only
soil ammonium and WFPS (0-10 cm) were significantly positively correlated to N20 emissions from both
2064
1SO
' a .1~ =0o i N c~ol .
Z 1SO
X 100
O so
Z 0
40
~" b i
t , :
~ l I, ~ ; ; • . q l u
"I " " V
12o
~ 11o d
7O t
0 10 20 30 40 50 60 70 80 90 I O0 110 120 l ' i m e a f t e r 1 1 / 9 / 9 2 ( W e e k s )
Figure 1. (a) N20 emission, (b) CH4 uptake, (c) soil water content and (d) soil temperature at the Vertisol site, November 1992 until February, 1995. Arrows indicate time of application of a mixed fortilizer containing 75 kg N haL Gas flux data shown represent the mean of six measurements at each site for each treatment.
2065
fertilized (r = 0.51, P = 0.0001; r -- 0.43, P = 0.045) and unfertilized (r = 0.55, P --- 0.0001; r = 0.39, P = 0.063)
plots.
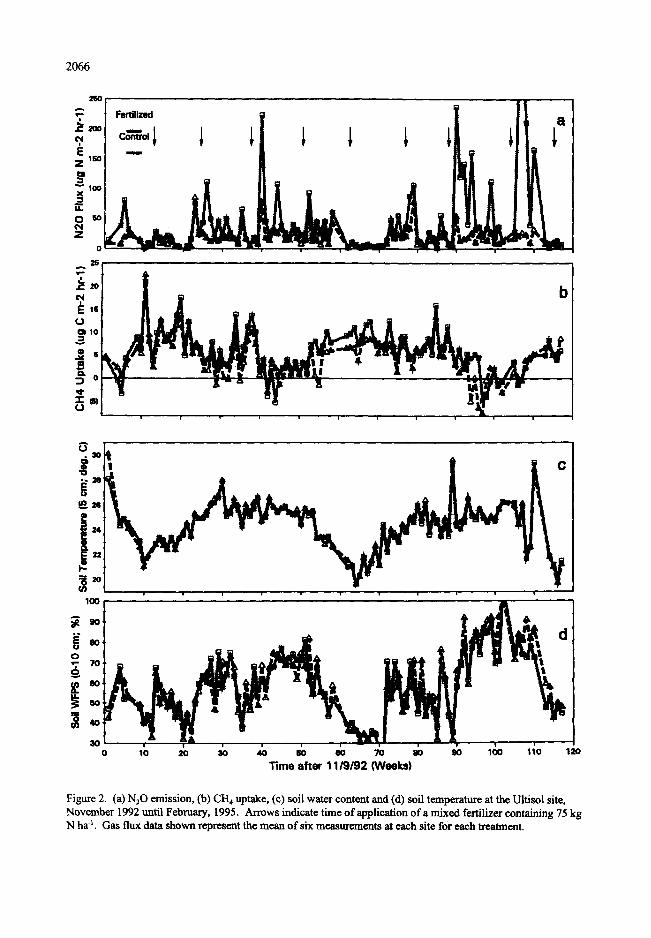
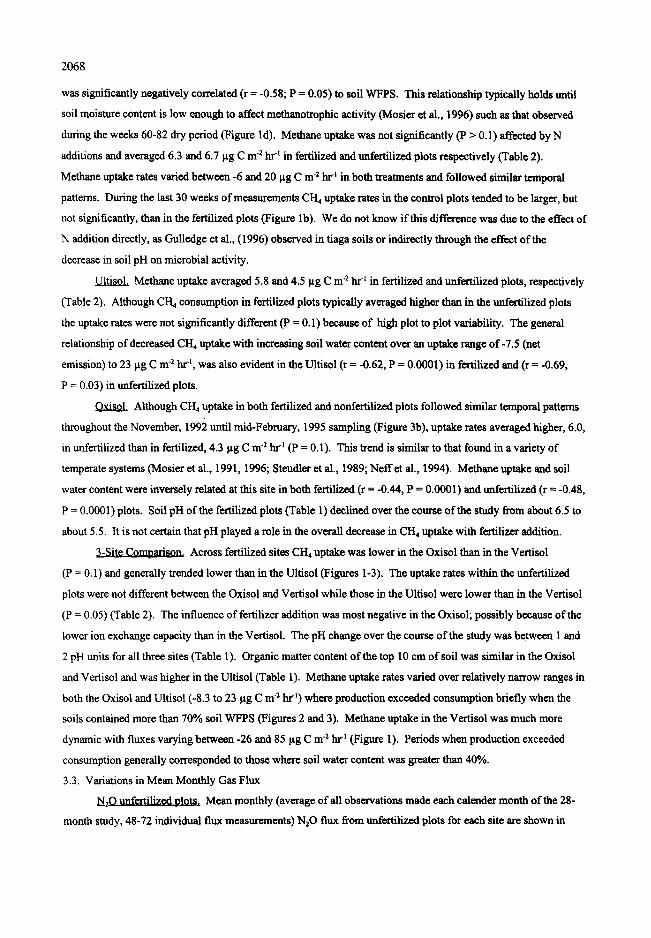
Ultisol. Over the observation period, N20 emissions in the Ultisol were significantly higher in fertilized
plots, averaging 15.8 and 44 lag N m 2 hr" 1 in unfertilized and fertilized plots, respectively. Peak emissions
following rain events were about 85 lag N m "2 hr" t (Figure 2) compared 200 to 400 lag N m -2 hr ~ for fertilized plots
Emissions were very low during weeks 60-72 while soil WFPS remained below 40%. The remainder of the time
soil water varied between 40 and 100% WFPS and N20 emission patterns follow these trends, along with the
fertilization sequences in the fertilized plots. Soil WFPS and N20 emissions were significantly correlated in both
fertilized (r = 0.62, P = 0.0001) and unfertilized plots (r = 0.46, P = 0.0001). Nitrous oxide emissions were also
significantly correlated to soil ammonium concentrations in fertilized (r = 0.51, P = 0.014) and unfertilized
(r = 0.39, P = .076) plots.
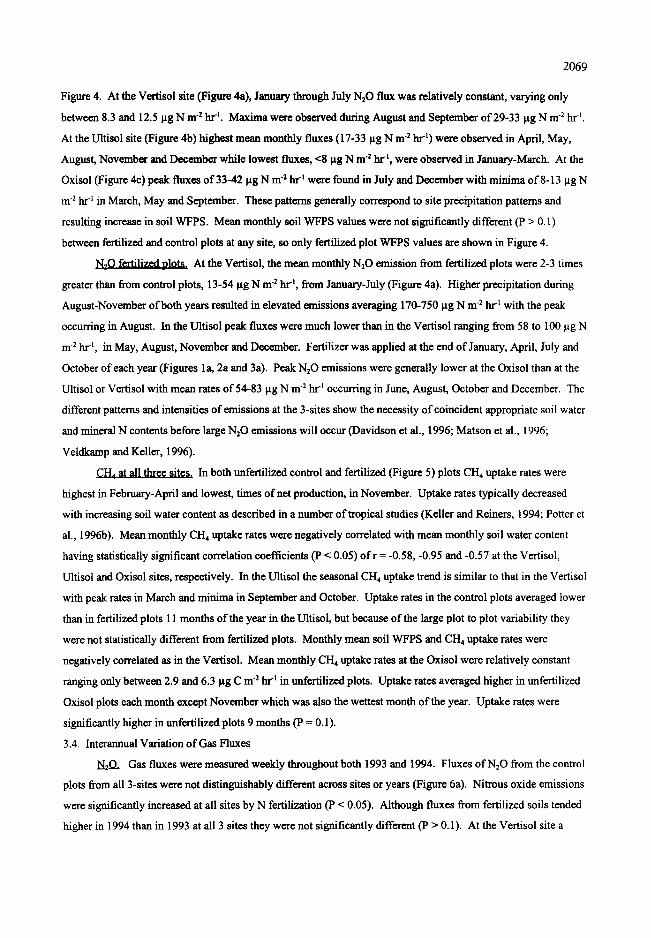
Qxisol. During the November, 1992 to February, 1995 measurement period 1'420 fluxes averaged 18.8 and
45.8 lag N m "2 hr ~ in unfertilized and fertilized plots respectively and were significantly higher (P < 0.05) in
fertilized plots. Emissions were very low during weeks 55-72 when soil WFPS was generally below 60%.
Following precipitation events N20 emissions generally peaked at 15-25 lag N m 2 hr ~ in unfertilized plots and 50-
80 lag N m 2 hr ~ in fertilized plots. Nitrous oxide fluxes were significantly positively correlated only to soil water
content in both fertilized (r = 0.39, P = .0001) and unfertilized (r = 0.44, P = .0001) plots.
~ 1 9 2 ~ / 9 1 I ] I ~ t ~ The general patterns of N20 emissions were similar in all three soils, with peaks
following precipitation events and minima occurring when soils were dry (Figures 1-3). In fertilized plots the
timing of N additions and precipitation events enhanced N20 flux as has been observed in a variety of systems
(Davidson etal., 1996; Matson et al., 1996; Veldkamp and Keller, 1996). Because of fertilization events occurring
during times when soil water contents were relatively low or during wetter periods there was no simple correlation
between soil NO3"content and N20 emissions as Keller and Reiners (1994) observed in Costa Riean
forest/grassland systems. Emissions from the unfertilized soils were not significantly different (P = 0.5) among
the three sites even though total N content of the soil is about 1.5 times higher in the Ultisol than the other two
soils (Table 1). Average emissions at the fertilized Ultisol and Oxisol sites were similar (Table 2) but were about
3-times higher from the Vertisol (F < 0,05). It is not clear if the shrink-swell character of the Vertisol continually
provided more available organic material thereby promoting increased denitrification or due to these
characteristics, when precipitation decreased oxygen diffusion thereby increasing NzO production. Even though
the soils were all clay texture the Oxisol drained much more rapidly than did the Vertisol and oxygen depleted
conditions were expected to be less frequent. Nitrous oxide emissions were significantly correlated with soil
WFPS at all three sites.
3.2. Methane
Vertisoi. Methane consumption rates typically decreased with increase in soil WFPS because soil water
affects the effective diffnsivity of the soil, as has been described in a variety of ecosystems (Born et al., 1990;
Doerr et al., 1993; Keller and Reiners, 1994; Potter et al., 1996a; Stendler et al., 1996) (Figure 1). Methane uptake
2066
2 ~ "
O so
Z 0
2 S
-' ii
U t
~,,30 ~ z l C
2e
22
~ .
1 0 0 . . . . . . . . . . .
3 o lo 2o 3o 40 so eo ~o ao so loo 11o 12o
Time after 11/9/92 (Weeks)
Figure 2. (a) N20 emission, (b) CH4 uptake, (c) soil water content and (d) soil temperature at the Ultisol site, November 1992 until February, 1995, Arrows indicate time of application of a mixed fertilizer containing 75 kg N ha q. Gas flux data shown represent the mean of six measurements at each site for each treatment,
2067
"i a°,,, C
24
22
1 0 0 ¸
o~
70
30 0 10 20 30 40 50 60 70 80 90 100 110 120
Time after 11/9/92 (Weeks)
Figure 3. (a) N20 emission, Co) CH4 uptake, (c) soil water content and (d) soil temperature at the Oxisol site, November 1992 until August, 1995. Arrows indicate time of application of a mixed fertilizer containing 75 kg N ha -~. Gas flux data shown represent the mean of six measurements at each site for each treatment.
2068
was significantly negatively correlated (r = -0.58; P = 0.05) to soil WFPS. This relationship typically holds until
soil moisture content is low enough to affect methanotrophic activity (Mosier et al., 1996) such as that observed
during the weeks 60-82 dry period (Figure ld). Methane uptake was not significantly (P > 0.1) affected by N
additions and averaged 6.3 and 6.7 pg C m 2 lw I in fertilized and unfertilized plots respectively (Table 2).
Methane uptake rates varied between -6 and 20 pg C m 2 hr 4 in both treatments and followed similar temporal
patterns. During the last 30 weeks of measurements CH+ uptake rates in the control plots tended to be larger, but
not significantly, than in the fertilized plots (Figure lb). We do not know if this difference was due to the effect of
N addition directly, as Gulledge et al., (1996) observed in tiaga soils or indirectly through the effect of the
decrease in soil pH on microbial activity.
Ultisol. Methane uptake averaged 5.8 and 4.5 pg C m "2 hr "~ in fertilized and unfertilized plots, respectively
(Table 2). Although CI~ consumption in fertilized plots typically averaged higher than in the unfertilized plots
the uptake rates were not significantly different (P = 0.1) because of high plot to plot variability. The general
relationship of decreased CI-h uptake with increasing soil water content over an uptake range of-7.5 (net
emission) to 23 pg C m "z hr "~, was also evident in the Ultisol (r = -0.62, P = 0.0001) in fertilized and (r = -0.69,
P = 0.03) in unfertilized plots.
Oxisol. Although CH4 uptake in both fertilized and nonfertilized plots followed similar temporal patterns
throughout the November, 199½ until mid-February, 1995 sampling (Figure 3b), uptake rates averaged higher, 6.0,
in unfertilized than in fertilized, 4.3 pg C m 2 hr ~ (P = 0.1). This trend is similar to that found in a variety of
temperate systems (Mosier et al., 1991, 1996; Stendler et al., 1989; Neffot al., 1994). Methane uptake and soil
water content were inversely related at this site in both fertilized (r = -0.44, P = 0.0001) and unfertilized (r = -0.48,
P = 0.0001) plots. Soil pH of the fertilized plots (Table 1) declined over the course of the study from about 6.5 to
about 5.5. It is not certain that pH played a role in the overall decrease in CH4 uptake with fertilizer addition.
3-Site Comnarison. Across fertilized sites CH+ uptake was lower in the Oxisol than in the Vertisol
(P = 0.1) and generally trended lower than in the Ultisol (Figures 1-3). The uptake rates within the unfertilized
plots were not different between the Oxisol and Vertisol while those in the Ultisol were lower than in the Vertisol
(P = 0.05) (Table 2). The influence of fertilizer addition was most negative in the Oxisol; possibly because of the
lower ion exchange capacity than in the Vertisol. The pH change over the course of the study was between 1 and
2 pH units for all three sites (Table 1). Organic matter content of the top 10 cm of soil was similar in the Oxisol
and Vertisol and was higher in the Ultisol (Table 1). Methane uptake rates varied over relatively narrow ranges in
both the Oxisol and Ultisol (-8.3 to 23 pg C m z hr l ) where production exceeded consumption briefly when the
soils contained more than 70% soil WFPS (Figures 2 and 3). Methane uptake in the Vertisol was much more
dynamic with fluxes varying between -26 and 85 pg C m -2 hr t (Figure 1). Periods when production exceeded
consumption generally corresponded to those where soil water content was greater than 40%.
3.3. Variations in Mean Monthly Gas Flux
N20 unfertilized plots. Mean monthly (average of all observations made each calender month of the 28-
month study, 48-72 individual flux measurements) N20 flux from unfertilized plots for each site are shown in
2069
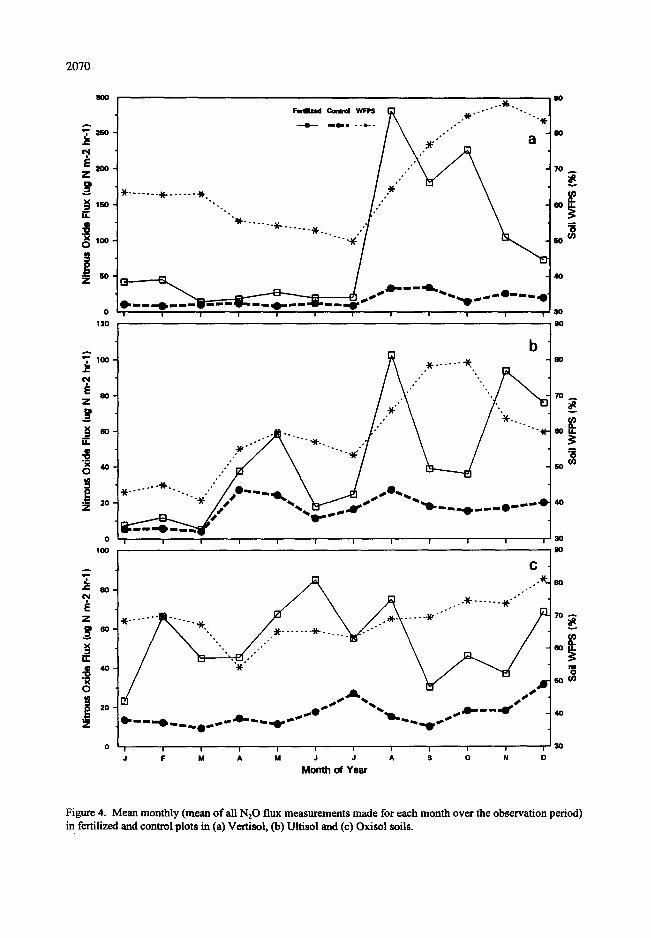
Figure 4. At the Vertisol site (Figure 4a), January through July N20 flux was relatively constant, varying only
between 8.3 and 12.5 lag N m 2 hr 1. Maxima were observed during August and September of 29-33 lag N m -2 hr -~ .
At the Ultisol site (Figure 4b) highest mean monthly fluxes (17-33 lag N m 2 hr t ) were observed in April, May,
August, November and December while lowest fluxes, <8 lag N m "2 In.t, were observed in January-March. At the
Oxisol (Figure 4e) peak fluxes of 33-42 lag N m "2 hr "~ were found in July and December with minima of 8-13 lag N
m 2 hr ~ in March, May and September. These patterns generally correspond to site precipitation patterns and
resulting increase in soil WFPS. Mean monthly soil WFPS values were not significantly different (P > 0.1)
between fertilized and control plots at any site, so only fertilized plot WFPS values are shown in Figure 4.
N_,O fertilized plots. At the Vertisol, the mean monthly N20 emission from fertilized plots were 2-3 times
greater than from control plots, 13-54 lag N m 2 b-r ~, from January-July (Figure 4a). Higher precipitation during
August-November of both years resulted in elevated emissions averaging 170-750 lag N m 2 hr l with the peak
occurring in August. In the Ultisol peak fluxes were much lower than in the Vertisol ranging from 58 to 100 lag N
m -2 hr -~, in May, August, November and December. Fertilizer was applied at the end of January, April, July and
October of each year (Figures la, 2a and 3a). Peak N20 emissions were generally lower at the Oxisol than at the
Ultisol or Vertisol with mean rates of 54-83 lag N m 2 hr "~ occurring in June, August, October and December. The
different patterns and intensities of emissions at the 3-sites show the necessity of coincident appropriate soil water
and mineral N contents before large N20 emissions will occur (Davidson et al., 1996; Matson et al., 1996;
Veldkamp and Keller, 1996).
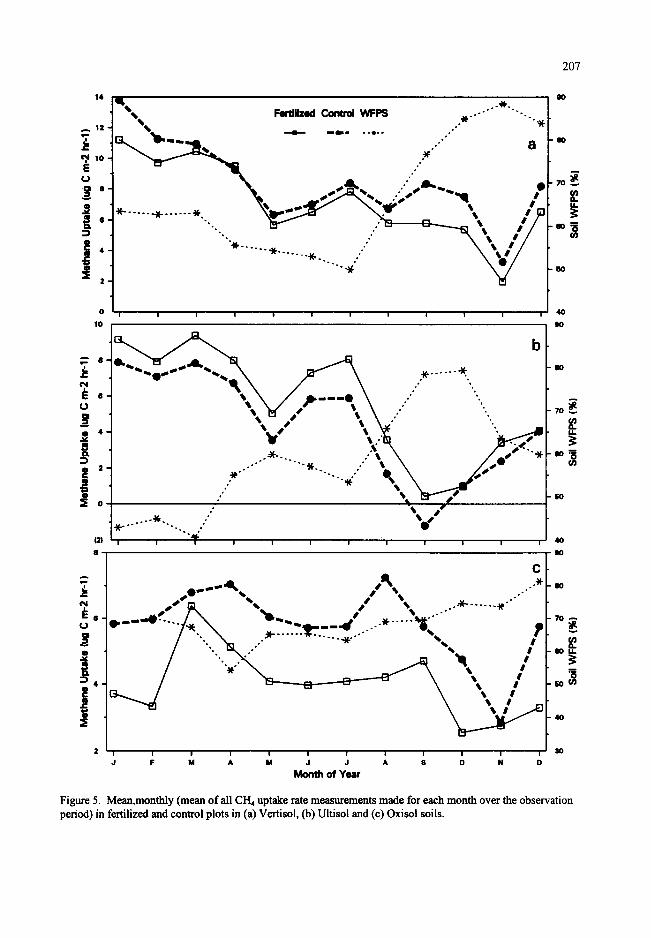
In both unfertilized control and fertilized (Figure 5) plots CH4 uptake rates were
highest in February-April and lowest, times of net production, in November. Uptake rates typically decreased
with increasing soil water content as described in a number of tropical studies (Keller and Reiners, 1994; Potter et
al., 1996b). Mean monthly CH4 uptake rates were negatively correlated with mean monthly soil water content
having statistically significant correlation coefficients (P < 0.05) o f r = -0.58, -0.95 and -0.57 at the Vertisol,
Ultisol and Oxisol sites, respectively. In the Ultisol the seasonal CH4 uptake trend is similarto that in the Vertisol
with peak rates in March and minima in September and October. Uptake rates in the control plots averaged lower
than in fertilized plots 11 months of the year in the Ultisol, but because of the large plot to plot variability they
were not statistically different from fertilized plots. Monthly mean soil WFPS and CH4 uptake rates were
negatively correlated as in the Vertisol. Mean monthly CH4 uptake rates at the Oxisol were relatively constant
ranging only between 2.9 and 6.3 lag C m 2 h r t in unfertilized plots. Uptake rates averaged higher in unfertilized
Oxisol plots each month except November which was also the wettest month of the year. Uptake rates were
significantly higher in unfertilized plots 9 months (P = 0.1).
3.4. Interannual Variation of Gas Fluxes
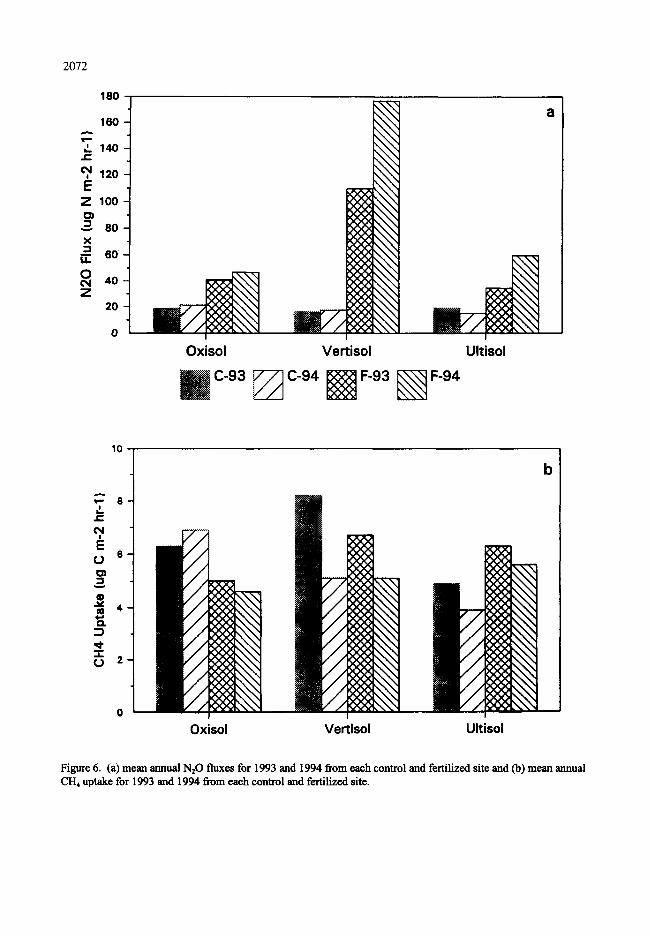
N20. Gas fluxes were measured weekly throughout both 1993 and 1994. Fluxes of N20 from the control
plots from all 3-sites were not distinguishably different across sites or years (Figure 6a). Nitrous oxide emissions
were significantly inereasod at all sites by N fertilization (P < 0.05). Although fluxes from fertilized soils tended
higher in 1994 than in 1993 at all 3 sites they were not significantly different (P > 0.1). At the Vertisol site a
2070
A
z
i 60
O
1 2 0
F e r t i t z ~ C e m e l W l ~ S ~ ~ . . . " " . . .
I I m e a n - - ~ t - - " ° , ' ° ".t~.
" ' ~ . . . . . . . -Ye '
I u I u I I u ! u u u
0O
4 0
3 0
8 0
_ b
z
,o / / .,,..... - . . . . . . . . . _ . , , . . . . .
0 u I I I I I I I l ! I 1 0 0
Z --.tt" ~ ~ . . . . ~ . . . .
X o°
n"
i ,,~,,IL~ ss S'll 2o , , , . . O " %.Q,. , , , . 4 ) ' ' ' ' 0 ~ 2 e " " " "O ' -- .,.... O,., -" " ' O ' " " " O ' ' . . . , , . , 0 , , .
O I I u u I i ~ i I I I I
J F M X M J J A $ O N
Month of Year
8 0
70 A
60
40
30
80
80
70
(10LI .
eo~
40
30
Figure 4. Mean monthly (mean of all N20 flUX measurements made for each month over the observation period) in fertilized and control plots in (a) Vertiso], (b) Ultisol and (c) Oxisol soils.
1 4
207
flO
I \ - " I • - . .
1 0 •
~, ,~, . . .~. . . . . , - . , , t ":
= .1 -... ~ ....-~ o - . . . ~ \ / / . . ~
,t" * ...... . ....... . . .... \ X I /
i , t ..... .. ~ / . i i i i i i i i i i i
: \ A : . . _ . \ " ...... : ii °°° "*, o \ v , , ' - , -,, \ .... .....
I . , . '" "")k.. ,." %
. . . ~ , , - % j /
I I " ' ~ I I I l i I I I 4 0
s (3
I .,.--.. ,,, -i • .=. =- . '4P Iw .~ .~. - - , . / ~ . . . . . "~LK" i
o 7 " . . . . . I'~\ "--" " " "- r / i , . . \ ~. . . . . . . I r : ' , . . . - .~ . . . - - '" %
\ i _
2 I I | I I I I I I I i I
J F M A M J J A S 0 N O
Month of Year
Figure 5. Mean.monthly (mean of all CH 4 uptake rate measurements made for each month over the observation period) in fcrtilize, d and control plots in (a) Vortisol, (b) Ultisol and (c) Oxisol soils.
2072
180,
t - -
r-
E Z
X _= 14.
0 04 Z
160
140
120
100
80
80
40
20
0
Oxisol Vertisol ~ C-93 ~7~ C-94 ~ F-93 ~ F-94
Ultisol
a
I 0
• "- 8 L
O4
-I- 0 2
Vertisol Oxisol Ultisol
b
Figure 6. (a) mean annual N20 fluxes for 1993 and 1994 from each control and fertilized site and (b) mean annual CH4 uptake for 1993 and 1994 from each control and fertilized site.
2073
prolonged dry period between weeks 60 and 82 was followed by several extended periods of high flux from week
90 through 105 (Figure la) during a time of frequent rain. Both the Ultisol and Oxisol sites experienced a
prolonged dry period beginning at about week 60 (Figures 2 and 3) which lasted about 12 weeks in Ultisol and 14
weeks in the Oxisol. Rainfall was about normal at the Vertisol site during both 1993 and 1994 (Table I), was
about normal at the Ultisol in 1993 but lower, 1440 ram, in 1994. At the Oxisol site precipitation was much lower
than the 40 year average (Table 1) in both years with 970 and 1090 mm recorded at the site during 1993 and 1994,
respectively.
CH,. Methane uptake rates averaged lower in 1994 than in 1993 in all fertilized sites, with the annual rates
significantly lower (P = 0.1) only in the Vertisol soil (Figure 6b). At the Vertisol the general relationship of
increased N20 emissions where CH~ uptake rates decreased we found similar to those observed in temperate
grassland sites (Mosier et al., 1996).
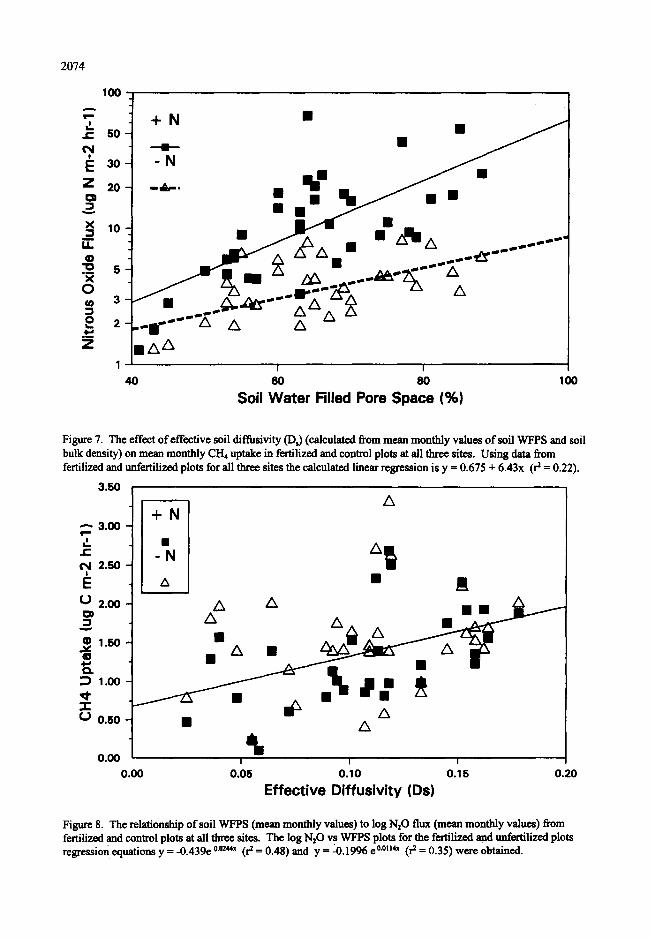
3.5. Methane
Water effects. The temporal patterns of CH4 uptake follow the general patterns of soil moisture content,
expressed either gravimetrically or as WFPS. These results are generally consistent with those reported by Keller
and Reiners (1994) in tropical Costa Pica and in variety of other systems (see Mosier et al., 1996 for a
comprehensive reference lisO. Keller and Reiners (1994) demonstrated the applicability of the concept of
effective diffusivity of CH4 in the soil limiting CH~ consumption. Potter et al., (1996a) also use soil diffusivity as
the basic controller of soil CH4 consumption in their global model. To compare our observations in grasslands in
Puerto Rico to those of Keller and Reiners (1994) we plotted mean monthly CH4 uptake rate against effective
diffusivity (Ds) as they described. Using a molecular diffusion coefficient for CH4 in air of-0.216 cm ~ s 1 at 25 ° C
(Potter et al., 1996a) we calculated mean monthly D s values fi'om site soil bulk densities and mean monthly
gravimetric soil water contents. Plotting CH4 uptake rate against effective diffusivity (Figure 7) we found the
general relationship, that CH4 uptake rates declined with decreasing effective diffusivity, where CH4 uptake =
0.675 + 6.43 Ds. Looking at each site individually, correlation coefficients ranged from -0.95 in the Ultisol to a
low of-0.30 in the unfertilized Vertisol. Two differing factors influence these relationships. First, during wet
periods, the net soil-atmosphere exchange of CH4 is a balance between production and consumption (Keller and
Reiners, 1994). The second is that during dry periods, CH4 consumption is not limited by diffusion but rather by a
moisture limitation on methanotrophic activity (Striegl, 1993; Mosier et al., 1996). Both processes are particularly
noticeable at Lajas in the Vertisol where both production during wet periods and slowed consumption during dry
periods were clearly observed (Figure lb).
Effects of added N. A wide variety of soil microbial CH4 oxidation responses to ammonium addition have
been observed. Goldman et al., (1995) found an enhancement, no effect was observed in several systems CMosier
et al., 1991; Gulledge et al., 1996; Whalen et al., 1991) and significant inhibition was observed in a variety of
ecosystems (Steudler et al., 1989; Mosier et al., 1991; Neffet al., 1994). In a semiarid grassland the difference
between soils response to N additions was attributed to differing soil N turnover rates (Mosier et al., 1991). We
observed two of the three responses at the three sites in Puerto Rico (Table 2). Fertilization tended to decrease
2074
+ N • • 5O
• I
,T °.~' . . . . .,--°
"" z x
o
1AA I I
40 60 80 100 Soil Water Filled Pore Space (%)
Figure 7. The effvct of effective soil diffusivity (Dr) (calculatvd from mean monthly values of soil WFPS and soil bulk density) on mean monthly CH4 uptake in fvrfilized and control plots at all th r~ sites. Using data from fertilized and unfc~ilized plots for all thrve sites the calculated linear regression is y -- 0.675 + 6.43x (r 2 = 0.22).
3.50
~ 3.oo ~ A
~ 2.so • Jl
~ 2 . 0 0
~1..~ A
O 0.50 • A A
o.0o I I I
o.oo o.o5 o.io o.i 5 o.2o Effective DiffusiviW (Ds)
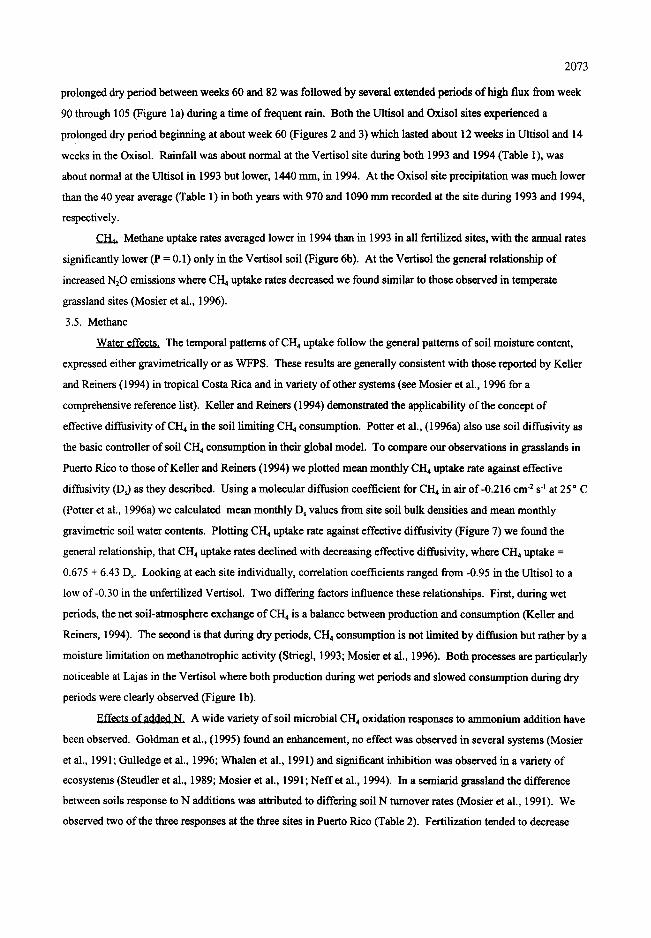
Figure 8. The relationship of soil WFPS (mean monthly values) to log N20 flux (mean monthly values) from fertilized and control plots at all three sites. The log N20 vs WFPS plots for the fertilized and unfvrtilized plots regression equations y = -0.439e 0.0z~x (r 2 ffi 0.48) and y ffi '0.1996 ¢0.0u4x (r 2 = 0.35) wer¢ obtained.
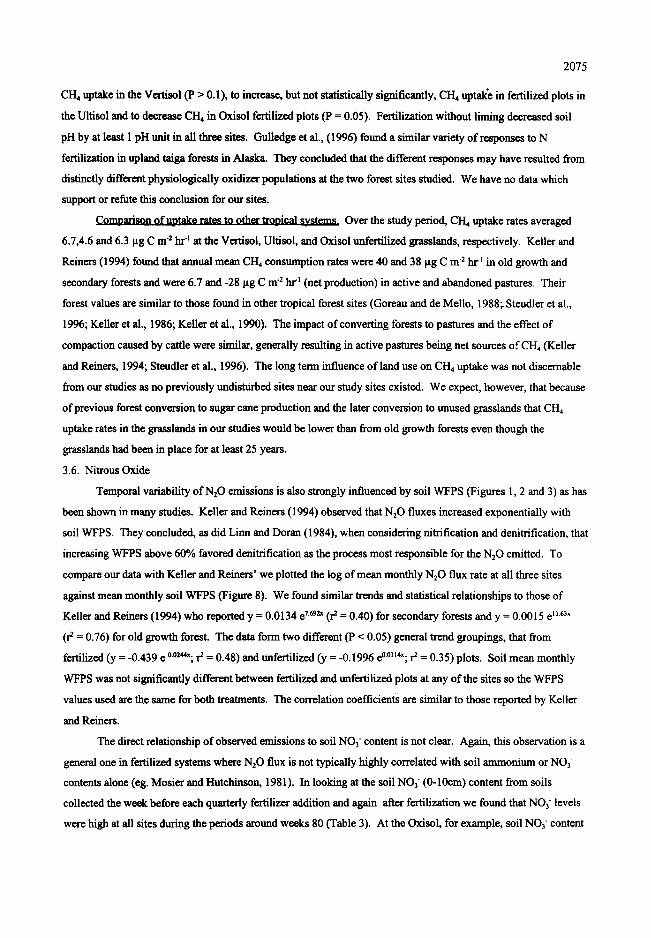
2075
CH4 uptake in the Vertisol (P > 0.1), to increase, but not statistically significantly, CH4 uptake in fertilized plots in
the Ultisol and to decrease CH4 in Oxisol fertilized plots (P = 0.05). Fertilization without liming decreased soil
pH by at least 1 pH unit in all three sites. Gulledge et al., (1996) found a similar variety of responses to N
fertilization in upland taiga forests in Alaska. They concluded that the different responses may have resulted from
distinctly different physiologically oxidizer populations at the two forest sites studied. We have no data which
support or refute this conclusion for our sites.
Comnarison of ut~take rates to other tronieal systems. Over the study period, CI-I4 uptake rates averaged
6.7,4.6 and 6.3 pg C m 2 hr 1 at the Vertisol, Ultisol, and Oxisol unfertilized grasslands, respectively. Keller and
Reiners (1994) found that annual mean CH4 consumption rates were 40 and 38 pg C m 2 hr ~ in old growth and
secondary forests and were 6.7 and -28 pg C m "2 hr "t (net production) in active and abandoned pastures. Their
forest values are similar to those found in other tropical forest sites (Goreau and de Mello, 1988;. Steudler et al.,
1996; Keller et al., 1986; Keller et al., 1990). The impact of converting forests to pastures and the effect of
compaction caused by cattle were similar, generally resulting in active pastures being net sources of CH4 (Keller
and Reiners, 1994; Steudler et al., 1996). The long term influence of land use on CH4 uptake was not discemable
from our studies as no previously undisturbed sites near our study sites existed. We expect, however, that because
of previous forest conversion to sugar cane production and the later conversion to unused grasslands that CH4
uptake rates in the grasslands in our studies would be lower than from old growth forests even though the
grasslands had been in place for at least 25 years.
3.6. Nitrous Oxide
Temporal variability of N~O emissions is also strongly influenced by soil WFPS (Figures 1, 2 and 3) as has
been shown in many studies. Keller and Reiners (1994) observed that NzO fluxes increased exponentially with
soil WFPS. They concluded, as did Lima and Doran (1984), when considering nitrification and denitrification, that
increasing WFPS above 60% favored denitrification as the process most responsible for the NzO emitted. To
compare our data with Keller and Reiners' we plotted the log of mean monthly N20 flux rate at all three sites
against mean monthly soil WFPS (Figure 8). We found similar trends and statistical relationships to those of
Keller and Reiners (1994) who reported y = 0.0134 e 769~ (r z = 0.40) for secondary forests and y = 0.0015 e H-63x
(r 2 = 0.76) for old growth forest. The data form two different (P < 0.05) general trend groupings, that from
fertilized (y = -0.439 e 0.0~; r 2 = 0.48) and unfertilized (y = -0.1996 e°'°H4x; r z = 0.35) plots. Soil mean monthly
WFPS was not significantly different between fertilized and unfertilized plots at any of the sites so the WFPS
values used are the same for both treatments. The correlation coefficients are similar to those reported by Keller
and Reiners.
The direct relationship of observed emissions to soil NO3 content is not clear. Again, this observation is a
general one in fertilized systems where N20 flux is not typically highly correlated with soil ammonium or NO3-
contents alone (eg. Mosier and Hutchinson, 1981). In looking at the soil NO3 (0-10era) content from soils
collected the week before each quarterly fertilizer addition and again after fertilization we found that NO3 levels
were high at all sites during the periods around weeks 80 (Table 3). At the Oxisol, for example, soil NO3 content
2076
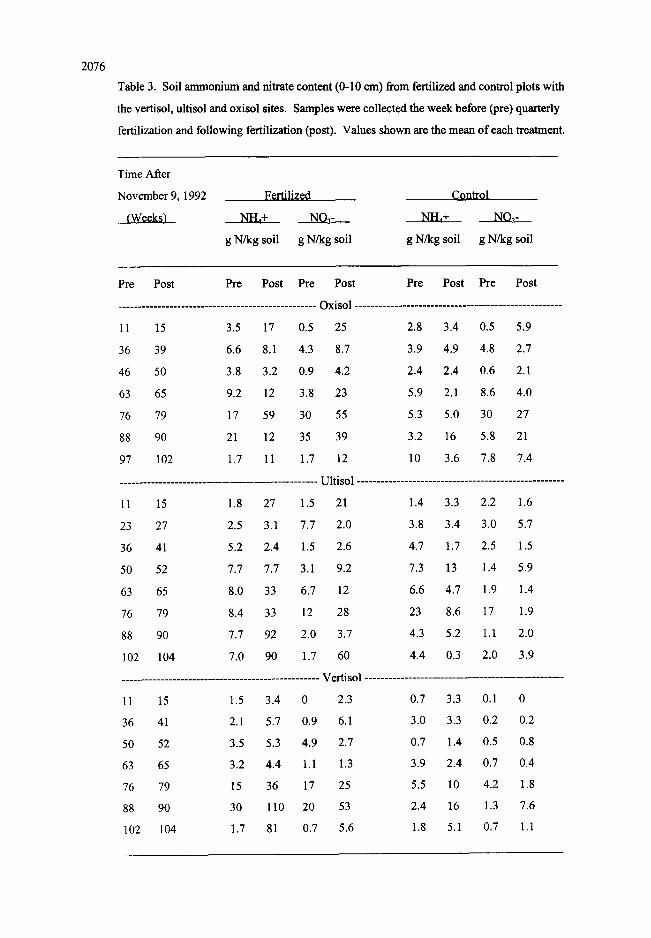
Table 3. Soil ammonium and nitrate content (0-10 em) from fertilized and control plots with
the vertisol, ultisol and oxisol sites. Samples were collected the week before (pre) quarterly
fertilization and following fertilization (post). Values shown are the mean of each treatment.
Time After
November 9, 1992
(Weeks)
Fertilized Control
NHA+ NO 3- NH,+ NO3:._
g N/kg soil g N/kg soil g N/kg soil g N/kg soil
Pre Post Pre Post Pre Post Pre Post Pre Post
. . . . . . . . . . . . . . . . . . . . . . . . . . . . . . . . . . . . . . . . . . . . . . . . . . Oxisol . . . . . . . . . . . . . . . . . . . . . . . . . . . . . . . . . . . . . . . . . . . . . . . . . . . .
11 15 3.5 17 0.5 25 2.8 3.4 0.5 5.9
36 39 6.6 8.1 4.3 8.7 3.9 4.9 4.8 2.7
46 50 3.8 3.2 0.9 4.2 2.4 2.4 0.6 2.1
63 65 9.2 12 3.8 23 5.9 2.1 8.6 4.0
76 79 17 59 30 55 5.3 5.0 30 27
88 90 21 12 35 39 3.2 16 5.8 21
97 102 1.7 11 1.7 12 10 3.6 7.8 7.4
. . . . . . . . . . . . . . . . . . . . . . . . . . . . . . . . . . . . . . . . . . . . . . . . . . Ultisol . . . . . . . . . . . . . . . . . . . . . . . . . . . . . . . . . . . . . . . . . . . . . . . . . . . .
11 15 1.8 27 1.5 21 1.4 3.3 2.2 1.6
23 27 2.5 3.1 7.7 2.0 3.8 3.4 3.0 5.7
36 41 5.2 2.4 1.5 2.6 4.7 1.7 2.5 1.5
50 52 7.7 7.7 3.1 9.2 7.3 13 1.4 5.9
63 65 8.0 33 6.7 12 6.6 4.7 1.9 1.4
76 79 8.4 33 12 28 23 8.6 17 1.9
88 90 7.7 92 2.0 3.7 4.3 5.2 1.1 2.0
102 104 7.0 90 1.7 60 4.4 0.3 2.0 3.9
. . . . . . . . . . . . . . . . . . . . . . . . . . . . . . . . . . . . . . . . . . . . . . . . . . Vertisol . . . . . . . . . . . . . . . . . . . . . . . . . . . . . . . . . . . . . . . . . . . . . . . . . .
11 15 1.5 3.4 0 2.3 0.7 3.3 0.1 0
36 41 2.1 5.7 0.9 6.1 3.0 3.3 0.2 0.2
50 52 3.5 5.3 4.9 2.7 0.7 1.4 0.5 0.8
63 65 3.2 4.4 1.1 1.3 3.9 2.4 0.7 0.4
76 79 15 36 17 25 5.5 10 4.2 1.8
88 90 30 110 20 53 2.4 16 1.3 7.6
102 104 1.7 81 0.7 5.6 1.8 5.1 0.7 1.1
2077
in fertilized plots averaged 30 g/kg before fertilization and 55 g/kg after fertilization and 29 and 27 g/kg in
unfertilized plots at the same time. During this period N20 emissions from the site were very low. When rains
began, later in the year, N20 emissions increased and soil NO3 contents above 10g/kg were rarely observed, even
in the fertilized soils.
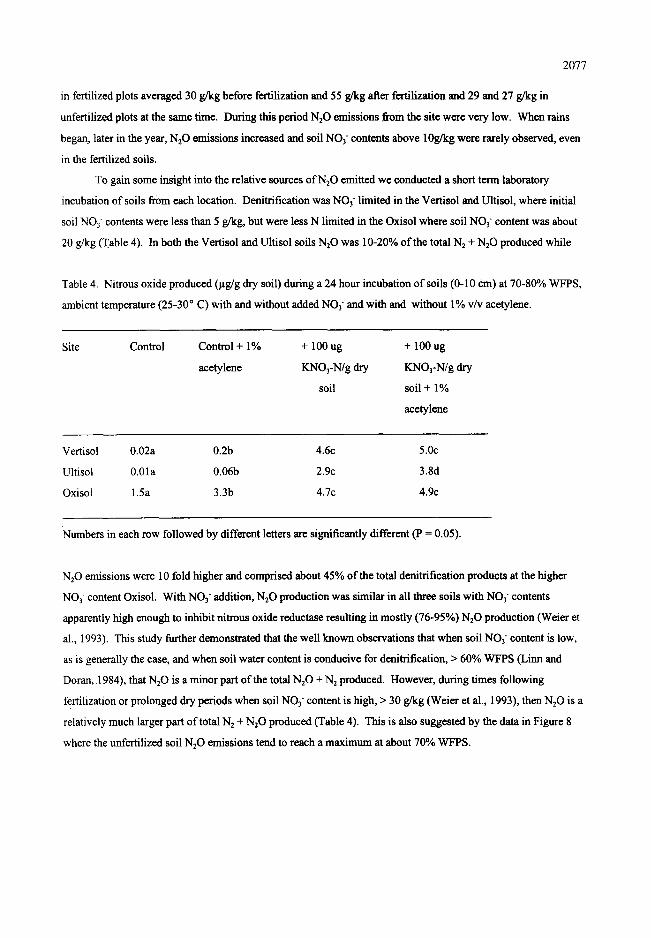
To gain some insight into the relative sources of N20 emitted we conducted a short term laboratory
incubation of soils from each location. Denitrification was NO3 limited in the Vertisol and Ultisol, where initial
soil NO3 contents were less than 5 g/kg, but were less N limited in the Oxisol where soil NO3 content was about
20 g/kg (Table 4). In both the Vertisol and Ultisol soils N20 was 10-20% of the total 1'42 + N20 produced while
Table 4. Nitrous oxide produced 01g/g dry soil) during a 24 hour incubation of soils (0-10 em) at 70-80% WFPS,
ambient temperature (25-30 ° C) with and without added NO3 and with and without 1% v/v acetylene.
Site Control Control + 1% + 100 ug + 100 ug
acetylene KNO3-N/g dry KNO3-N/g dry
soil soil + 1%
acetylene
Vertisol 0.02a 0.2b 4.6c 5.0c
Ultisol 0.01a 0.06b 2.9c 3.8d
Oxisol 1.5a 3.3b 4.7c 4.9c
Numbers in each row followed by different letters are significantly different (P = 0.05).
NzO emissions were 10 fold higher and comprised about 45% of the total denitrification products at the higher
NO3- content Oxisol. With NO3 addition, I',120 production was similar in all three soils with NO3 contents
apparently high enough to inhibit nitrous oxide reductase resulting in mostly (76-95%) 1',120 production (Weier et
al., 1993). This study further demonstrated that the well known observations that when soil NO3 content is low,
as is generally the case, and when soil water content is conducive for denitrification, > 60% WFPS (Linn and
Doran, 1984), that NzO is a minor part of the total N20 + Ne produced. However, during times following
fertilization or prolonged dry periods when soil NO3 content is high, > 30 g/kg (Weier et al., 1993), then N20 is a
relativelymuch larger part of total Nz + N20 produced (Table 4). This is also suggested by the data in Figure 8
where the unfertilized soil NzO emissions tend to reach a maximum at about 70% WFPS.
2078
Comoarison to other Ironical studies. Nitrous oxide fluxes have been measured in several tropical forest
sites in Central and South America. Wet season flux averages ranged between 19 and 43 }xg-N n'i -2 hr -j (Keller et
al., 1993; Keller et al., 1986; Matson et al., 1990) and dry season fluxes averaged between 5 and 23 ~tg N m 2 hr ~
(Livingston et al., 1988; Keller et al., 1993; Goreau and de Mello, 1988). Conversion of tropical forest to pasture
increased NzO emissions initially, as shown by forest wet season emissions of 19 and pasture wet season
emissions of 103 Ixg N m 2 hr" (Matson et al., 1990) and annual forest emissions of 22 compared to annual pasture
emissions of 65 I~g N m 2 hr" (Luizao et al., 1989). Keller et al., (1993) and Keller and Reiners (1994) showed
that these elevated N20 emissions continue for about 10 years following forest conversion to pasture and thereafter
decline to below those from native forests.
There is limited data concerning the effect of N fertilization in tropical agricultural systems on N20
emissions. Matson et al. (1996) found that N20 emissions were 0.03 to 1.1% of urea N applied to irrigated and
rainfed sugar cane in Hawaii. Their measurements were focused to about a week around fertilizer application
events. They found that fertilizer placement influenced N20 emission with higher N20 emissions resulting from
subsurface placement, probably due to increased denitrification (Matson et al., 1996). Veldkamp and Keller
(1996) measured N20 and NO emissions monthly from fertilized banana plantations in Costa Rica, They found
greater mean N20 emissions from a surface fertilized Andisol soil, 314 Ixg N m 2 hr ~, compared to 93 ~tg N m 2 hr ~
from an Inceptisol soil (2.9 and 1.3% of fertilizer N applied).
The mean weekly N20 emission rates from unfertilized plots over the 28 months of our study of 17 ~tg N
m -2 hr ' were similar to those observed in the Costa Rican pastures, 10 to 18 ~tg N m 2 hr ' , and considerably lower
than the 43 to 67 ktg N m 2 hr ~ from the secondary and old growth forests (Keller and Reiners, 1994). Emissions
from fertilized grasslands in our studies, 130, 46 and 44 ~tg N m -2 hr" from Vertisol, Ultisol and Oxisol,
respectively, were much lower, than from the banana plantation Andisol soils. Emissions from the Ultisol and
Oxisol were only about half that of the Costa Rican Ineeptisol while fluxes from the Vertisol averaged roughly
half those from the Costa Rican Andisol and about 1.4 times those from the Inceptisol.
Converting mean weekly flux rates to annual emissions, we estimate that total annual emissions averaged
1.6 and 4.0, 1.4 and 11.4, and 1.4 and 3.8 kg N ha-' y-' from the Oxisol, Vertisol and Ultisol unfertilized and
fertilized sites respectively. The increase in N20 emissions relative to fertilizer addition was 0.8, 3.3 and 0.8% of
fertilizer N applied in the Oxisol, Vertisol, and Ultisol, respectively. The effect of N fertilization on N20
emissions in these tropical grasslands were well within the range of N20 emissions from fertilized temperate
grasslands (Allen et al., 1996). Nitrous oxide emission rates of 5 to 16% of N applied were reported from
fertilized grasslands in Wyoming, USA (Delgado et al., 1996) and The Netherlands (de Klein and van Logtestijn,
1994). In other temperate grasslands, surface application of ammonium nitrate or urea in Scotland resulted in N20
emissions of 1.1 to 1.4% of N applied (McTaggart et al., 1994) and 0.2 to 1% of urea N applied in a study in Japan
(Minami et al., 1993). These observed emissions fall close to the range of 1.25 ~: 1% of N applied estimate
(Bouwman, 1996) used in assessing options to mitigate N20 emissions in the recent IPCC publication (Cole et al.,
1996). These results clearly show that care must be taken in assessing regional and global N20 emissions and that
2079
one cannot assume that N20 emissions will be higher from tropical than from temperate systems. Even though
temperature averages higher throughout the year in the tropics N substrate limitations and timing of precipitation
events my lead to fzequent low denitrification rates and also periods during wet seasons when N20/N~ ratios are
very low, similar to conditions in grasslands in England (Ryden, 1981).
ACKNOWLEDGMENTS
We thank Margarita Licha and Julio Colon for their dedication and skilled teclmical assistance in
performing the day to day data collection and operations of this study. We also thank Dr. Antonio Sotomayor and
the staff of the USDA/ARS Tropical Agricultural Research Station for their help throughout the course of the
project. We are grateful to Mr. Roy Vick of the USDA Natural Resources Conservation Service for performing
the soil classification analyses at each of our study sites, and the Puerto Rican Agricultural Experimental Station at
Lajas for use of the field site and to the staff for their assistance throughout the studies. In addition we owe our
thanks to Dr. Ron Foiler who helped initiate these studies and to our technical staffin Ft. Collins, Mary Smith,
Larry Tisue, Susan Crookall and Ashley Fenno who provided considerable help with this work.
REFERENCES
Allen, A.G., S.C. Jarvis, D.M. Headon (1996), Nitrous oxide emissions fromexcreta return by livestock on grazed grasslands in the U.K, Soil Biol. Biochem, 2& 597-607.
Birdsey, R.A., and F.L. Weaver (1982), The forest resources of Puerto Rico, USDA For. Ser. Res. Bul, SO-85, 59p.
Blake, G.R., and K.H. Hartge (1982), Bulk Density, Methods of Soil Analysis, Part I. Physical and Minerological Methods, A. K.lute, Editor, American Society of Agronomy, Madison, WI. 363-382.
Born, M., H. Doerr, I. Levin (1990), Methane consumption in aerated soils of the temperate zone, Tellus, Ser. B 42 B:2-8.
Bouwman, A.F (1996), Direct emissions of nitrous oxide from agricultural soils, Nutrient Cycling in Agroecosystems, 46, 53-70.
Burke, I.e., A.R. Mosier, L.K. Porter, W.A. O'Deen (1990), Diffusion of soil extracts for nitrogen and nitrogen-15 analyses by automated combustion/mass spectrometry, Soil Sei. Soc. Am. d,, 54, 1190-I 192.
Cole, C.V. et al., (1996), Agricultural options for mitigation of greenhouse gas emissions, Climate Change 1995. Impacts, Adaptations, and Mitigation of Climate Change, R.T. Watson et al., Editors, Cambridge University Press. Cambridge, 745-771.
2080
Davidso n, E.A., P.A. Matson, P.D. Brooks (1996), Nitrous oxide emission controls and inorganic nitrogen dynamics in fertilized tropical agricultural soils, SoilSci. Soc. Am. J, 60, 1145-1152.
Delgado, J.A., A.R. Mosier, R.H. FoileR, R.F. FoileR. D.G. Westfall, L.Klemedtsson, J. Vermenlen (1996), Effects of N management on N20 and CH4 fluxes and inN, Nutrient Cycling in Agroecosystems, 46, 127-134.
Doerr, H., L. Katruff, I. Levin (1993), Soil texture parameterization of the methane uptake in aerated soils, Chemosphere, 26, 697-713.
Goldman, M.B., P.M. Groffman, R.V. Pouyat, M.J. McDonnell, S.A. Pickett (1995), CH4 uptake and N availability in forest soils along an urban to rural gradient, SoilBiol. Biochem, 27, 281-286.
Goreau, T.J., and W.Z. de Mello (1988), Tropical deforestation: Some effects on atmospheric chemistry, Ambio, 17, 275-281.
Gulledge, J., A.P. Doyle, J.P. Schimel (1996), Different NH4+-irdfibition patterns of soil CH4 consumption: A result of distinct CH~-oxidizer populations across sites? Soil Biol. Biochem, (ln Press).
Hutchinson, G.L., and A.R. Mosier (1981), Improved soil cover method for field measurement of nitrous oxide fluxes, Soil Sci. Soc. Am. J, 45, 311-316.
IPCC (1996), Climate Change 1995, The Science of Climate Change, J.T. Houghton et al., Editors, Cambridge University Press, Cambridge 572 p.
Keller, M., and P.M. Matson (1994), Biosphere-atmosphere exchange of trace gases in the tropics: Evaluating the effects of land use change, Global Atmospheric-Biospheric Chemistry, R.G. Prinn Editor. Plenum Press, New York, 103-117.
Keller, M., and W.A. Reiners (1994), Soil-atmosphere exchange of nitrous oxide, nitric oxide, and methane under secondary succession of pasture to forest in the Atlantic lowlands of Costa Riea, Global Biogeochem. Cycles, 8, 399-409.
Keller, M., El Veldkamp, A.M. Weitz, W.A. Reiners (1993), Effect of pasture age on soil trace-gas emissions from a deforested area of Costa Rica, Nature, 365, 244-246.
Keller, M., W.A. Kaplan, S.C. Wofsy (1986), Emissions ofN~O, C H 4 and CO~ from tropical forest soils, J.. Geophys. Res, 91, 11791-11802.
Keller, M., M.E. Mitre, R.F. Stallard (1990), Consumption of atmospheric methane in oils of Central Panama: Effects of agricultural development, Global Biogeochem. Cycles., 4, 21-27.
'de Klein, C.A.M., and R.S.P. van Logtestijn (1994), Denitrification and N20 emission from urine-affected grassland soil, Plant and Soil, 163, 235-242.
Linn, D.M., and J.W, Doran (1984), Effect of water-filled pore space on carbon dioxide and nitrous oxide production in tilled and non-tilled soils, Soil Sci. Soc. Am. J,, 48, 1267-1272.
Livingston, G.P., P.M. Vitousek, P.A. Matson (1988), Nitrous oxide flux and nitrogen transformations across a landscape gradient in Amazonia, J. Geophys. Res, 93, 1593-1599.
Lugo, A.E., M.J. Sanchez, S. Brown (1986), Land use and organic carbon content of some subtropical soils, Plant and Soil, 96, 185-196.
2081
Luizao, F., P. Matson, G. Livingston, R. Luizao, P. Vitousek (1989), Nitrous oxide flux following tropical land clearing, Global Biogeochem. Cycles, 3, 281-285.
Matson, P.A., and P.M. Vitousek (1987), Cross-system comparison of nitrous oxide flux in tropical forest ecosystems, Global Biogeochem. Cycles, 1, 163-170.
Matson, P.A., P.M. Vitonsek, G.P. Livingston, N.A. Swanberg (1990), Sources of variation in nitrous oxide flux from Amazonian ecosystems, £ Geophys. Res, 95, 16789-16798.
Matson, P.A., C. Billow, S. Ha, J. Zaehariassen (1996), Fertilization practices and soil variations control nitrogen oxide emissions from tropical sugar cane, J. Geophys. Res, 101, 18533-18545.
MeTaggart. I., H. Clayton, and K. Smith (1994), Nitrous oxide flux from fertilized grasslands: Strategies for reducing emissions, Proceedings of the Symposium of non-C02 Greenhouse Gases. Maastricht. December 1993, Kluwer, Dordrecht, The Netherlands, 421-426.
Minami, K. J. Goudriaan, E.A. Lantinga, T. Kimura (1993), Significance of grasslands in emission and absorption of greenhouse gases, Proceedings of the XVIl lnternational Grassland Congress, 1231-1238.
Mosier, A.R., W.J. Patton, D.W. Valentine, D.S. Ojima, D.S. Sehimel, J.A. Delgado (1996), CH4 and N20 fluxes in the Colorado shortgrass steppe: I. Impact of landscape and nitrogen addition, Global Biogeochem. Cycles, 10, 387-399.
Mosier, A.R., D. Schimel, D. Valentine, K. Bronson, W.J. Parton (1991), Methane and nitrous oxide fluxes in native, fertilized and cultivated grasslands, Nature, 350, 330-332.
Mosier, A.R., and G.L. Hutchinson (1981), Nitrous oxide emissions from cropped fields, J. Environ. Qua.l, I0, 169-173.
Neff, J.C., W.D. Bowman, E.A. Holland, M.C. Fisk, S.K. Sehmidt (1994), Fluxes of nitrous oxide and methane from nitrogen-amended soils in a Colorado alpine ecosystem, Biogeochemistry, 27, 23-33.
Potter, C.S., P.A. Matson, P.M. Vitousek, E.A. Davidson (1996a), Process modeling of controls on nitrogen trace gas emissions from soils worldwide, J. Geophys. Res, 101, 1361-1377.
Potter, C.S., E.A. Davidson, L.V. Verehot (1996b), Estimation of global biogeoehemieal controls and seasonality in soil methane consumption, Chemosphere, 32, 2219-2246.
Ryden, J.C. (1981), N20 exchange between a grassland soil and the atmosphere, Nature, 292, 235-237.
SAS Inst. (Statistical Analysis System) (1991), SAS/STAT Users Guide, Version 6.03, 3rd ed. Cary, N.C.
Steudler, P.A., J.M. Melillo, B.J. Feigl, C. Neill, M.C. Piccolo, C.C. Cerri (1996), Consequence of forest-to- pasture conversion on CH4 fluxes in the Brazilian Amazon basin, £ Geophys. Res, 101, 18547-18554.
Steudler, P.A., R.D. Boweden, J.M. MeliUo, J.D. Aber (1989), Influence of nitrogen fertilization on methane uptake in temperate forest soils, Nature, 341, 314-316.
Striegl, R.G. (1993), Diffusional limits to the consumption of atmospheric methane by soils, Chemosphere, 26, 715-720.
Tiedje, J.M. (1982), Denitrifieation, Methods of soil analysis, Agron. Monogr. 9. Part 2.2nd ed. A.L. Page et al., Editors ASA and SSSA, Madison WI, 1011-1024

2082
Veldkamp, E., and M. Keller (1996), Nitrogen oxide emissions from a banana plantation in the humid tropics, J. Geophys. Res, (In Press).
Weier, K.L., J.W. Doran, J.F. Power, D.T. Waiters (1993), Denitrification and the dinitrogen/nitrous oxide ratio as a affected by soil water, available carbon, and NO3", Soil Sci. Soc. Am. J, 57, 66-72.
Whalen, S.C.W.S. Reeburgh, V.A. Barber (1992), Oxidation of methane in boreal forest soils: A comparison of seven measures, Biogeochemistry, 16, 181-211.
Whalen, S.C., W.S. Reeburgh, K.S. Kizer (1991), Methane consumption and emission by taiga, Global Biogeochemical Cycles, 5, 261-273.
Related Documents