10-1 LEAD & ZINC Indian Minerals Yearbook 2019 (Part- II :Metals and Alloys) 58 th Edition LEAD & ZINC (ADVANCE RELEASE) GOVERNMENT OF INDIA MINISTRY OF MINES INDIAN BUREAU OF MINES Indira Bhavan, Civil Lines, NAGPUR – 440 001 PHONE/FAX NO. (0 712) 25654 71 PBX : (0712) 2562649, 2560544, 2560648 E-MAIL : [email protected] Website: www.ibm.gov.in October, 2020

Welcome message from author
This document is posted to help you gain knowledge. Please leave a comment to let me know what you think about it! Share it to your friends and learn new things together.
Transcript
10-1
LEAD & ZINC
Indian Minerals Yearbook 2019 (Part- II :Metals and Alloys)
58th Edition
LEAD & ZINC
(ADVANCE RELEASE)
GOVERNMENT OF INDIA MINISTRY OF MINES
INDIAN BUREAU OF MINES
Indira Bhavan, Civil Lines, NAGPUR – 440 001
PHONE/FAX NO. (0712) 2565471
PBX : (0712) 2562649, 2560544, 2560648 E-MAIL : [email protected]
Website: www.ibm.gov.in
October, 2020
10-2
LEAD & ZINC
10 Lead & Zinc
L ead is a soft , heavy, toxic and highly
malleable metal. It is bluish white when freshly
cut, but tarnishes to dull grey when exposed. Both
lead & zinc are found to occur together in ore along
with other metals like silver and cadmium. Zinc is a
silvery blue-grey metal with a relatively low melting
and boiling point.
The largest single use of lead worldwide today
is in the manufacture of lead-acid storage batteries
which is about 74%, while the single largest use for
zinc is in the Galvanising Industry which is about
50%.
Zinc is the forth most widely used metal across
the globe, trailing only steel, aluminium and copper.
The country has the self-sufficiency in respect of
zinc. In contrast, there is short supply of lead vis-a-
vis the demand in the country.
The ever increasing demand for lead especially
from Lead Acid Battery Sector is met by the thriving
market of lead scrap recycling. Government of India
has enacted Battery Management and Handling Rule
(BMHR), 2002, which will further increase the
availability of scrap from the Organised Sector. It is
estimated that 56% of refined lead produced
worldwide is from recycled material. Producing lead
through this route requires around one-third of the
energy needed to extract it from its ores. Recovery
of secondary zinc and lead is economically more
attractive because of certain advantages. Besides,
lower energy consumption, it also entails low capital
cost, less environmental hazards and high metal
contents.
HZL is the only producer of primary lead and
primary zinc in 2018-19 due to shutdown of the
operation of Edayar Zinc Limited (EZL) . EZL is in
the process of arriving at a settlement with the banks.
The banks have taken over physical possession of
the secured assets of EZL on 23rd July 2019. The
consortium of banks led by Punjab National Bank
have taken physical possession of the mortgaged
assets and has conducted auctions for sale of the
mortgaged properties.
RESERVES/ RESOURCES
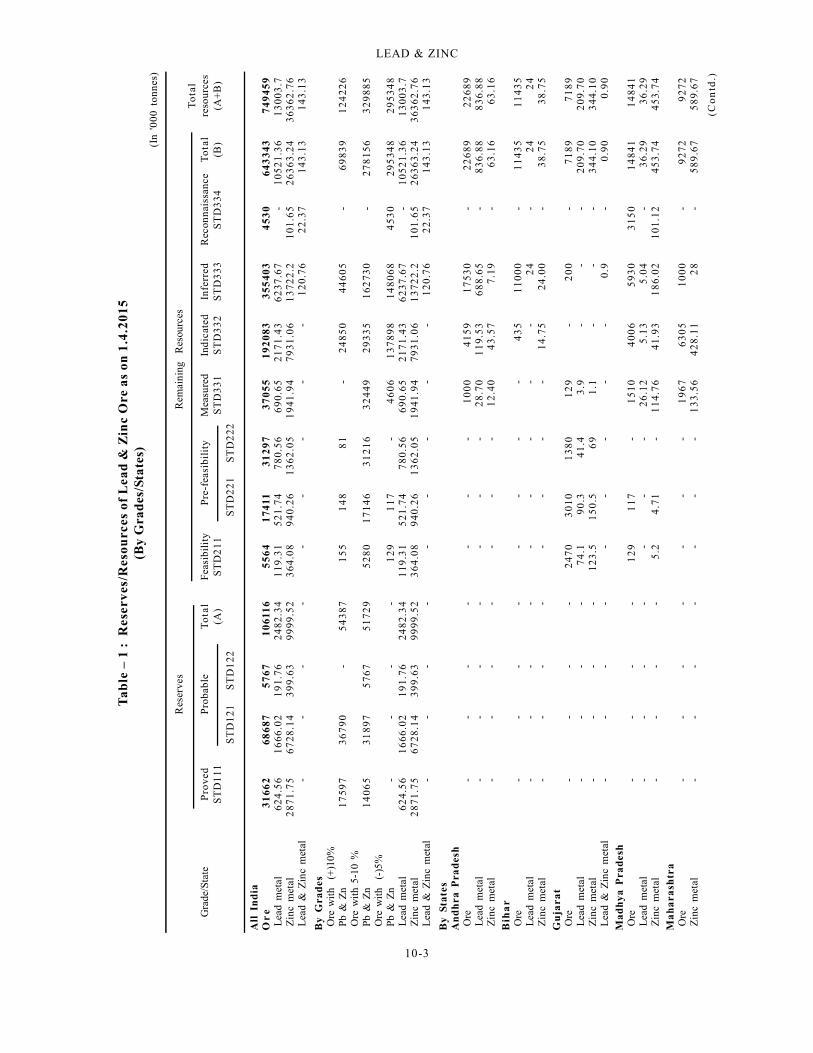
The total resreves/resources of lead and zinc
ore as on 1.4.2015 as per NMI data base based on
UNFC system have been estimated at 749.46 million
tonnes. Of these, 106.12 million tonnes (14.16%)
fall under 'Reserves' category while balance 643.34
million tonnes (85.84%) are classified as 'Remaining
Resources'.
The reserves/resources of ore containing + 10%
Pb & Zn were estimated at 124.23 million tonnes
(16.57%), ore containing 5 to 10% Pb & Zn were
329.88 million tonnes (44%) and ore containing less
than 5% Pb & Zn were 295.35 million tonnes
(39.41%).
The total metal content in reserves/ resources
of lead is 13 million tonnes and that of zinc is 36.36
million tonnes and for lead & zinc metal is 0.14
million tonnes. In terms of reserves, 2.48 million
tonnes of lead metal and 9.99 million tonnes of zinc
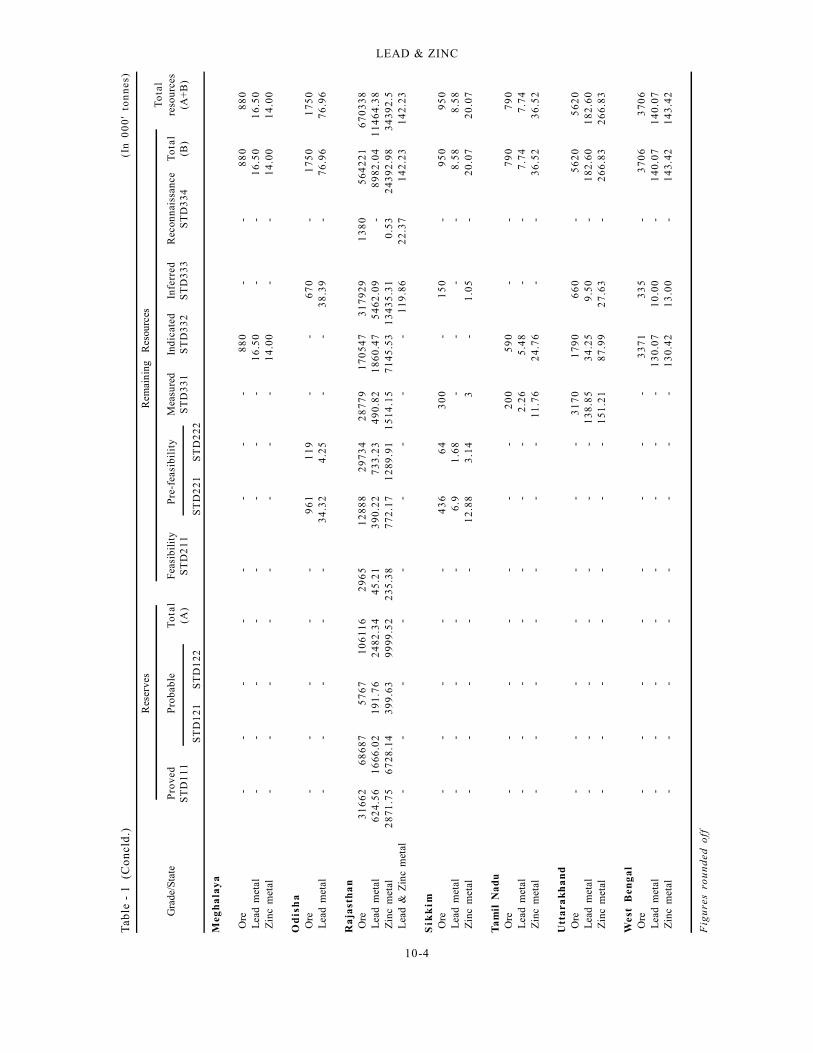
metal have been estimated. Rajasthan is endowed
with the largest reserves/ resources of lead-zinc ore
amounting to 670.34 million tonnes (89.44%),
followed by Andhra Pradesh 22.69 million tonnes
(3.03%), Madhya Pradesh 14.84 million tonnes
(1.98%), Bihar 11.43 million tonnes (1.52%) and
Maharashtra 9.27 million tonnes (1.24%). Resources
are also established in Gujarat, Meghalaya, Odisha,
Sikkim, Tamil Nadu, Uttarakhand and West Bengal
(Table-1).
EXPLORATION &DEVELOPMENT
The Exploration & Development details, if any,
are shown in the review on Explorat ion &
Development in "General Reviews".
10-3
LEAD & ZINC
All
In
dia
Or
e3
16
62
68
68
75
76
71
061
16
55
64
174
113
12
97
37
05
51
92
08
33
55
40
34
53
06
43
34
37
49
45
9 L
ead
met
al6
24
.56
16
66.0
21
91.
76
24
82
.34
11
9.3
15
21
.74
78
0.5
66
90.
65
21
71
.43
62
37.6
7-
10
52
1.3
61
300
3.7
Zin
c m
etal
28
71
.75
67
28.1
43
99.
63
99
99
.52
36
4.0
89
40
.26
13
62
.05
19
41.9
47
93
1.0
61
372
2.2
10
1.6
52
63
63
.24
36
36
2.7
6 L
ead
& Z
inc
met
al-
--
--
--
--
12
0.7
62
2.3
71
43
.13
14
3.1
3
By
Gra
des
Ore
wit
h (
+)1
0% P
b &
Zn
17
59
73
67
90
-5
43
87
15
51
48
81
-2
48
50
44
60
5-
69
83
91
24
22
6 O
re w
ith
5-10
% P
b &
Zn
14
06
53
18
97
57
67
51
72
95
28
01
71
46
31
21
63
24
49
29
33
51
62
73
0-
27
81
56
32
98
85
Ore
wit
h (
-)5%
Pb
& Z
n-
--
-1
29
11
7-
46
06
13
78
98
14
80
68
45
30
29
53
48
29
53
48
Lea
d m
etal
62
4.5
61
666
.02
19
1.7
62
48
2.3
41
19
.31
52
1.7
47
80.
56
69
0.6
52
17
1.4
36
237
.67
-1
05
21
.36
13
003
.7 Z
inc
met
al2
87
1.7
56
728
.14
39
9.6
39
99
9.5
23
64
.08
94
0.2
61
36
2.0
51
941
.94
79
31
.06
13
722
.21
01.
65
26
36
3.2
43
63
62
.76
Lea
d &
Zin
c m
etal
--
--
--
--
-1
20.
76
22
.37
14
3.1
31
43
.13
By
Sta
tes
An
dh
ra P
rad
esh
Ore
--
--
--
-1
00
04
15
91
75
30
-2
26
89
22
68
9 L
ead
met
al-
--
--
--
28
.70
11
9.5
36
88.
65
-8
36
.88
83
6.8
8 Z
inc
met
al-
--
--
--
12
.40
43
.57
7.1
9-
63
.16
63
.16
Bih
ar
Ore
--
--
--
--
43
51
10
00
-1
14
35
11
43
5 L
ead
met
al-
--
--
--
--
24
-2
42
4 Z
inc
met
al-
--
--
--
-1
4.7
52
4.0
0-
38
.75
38
.75
Gu
jara
t O
re-
--
-2
47
03
01
01
38
01
29
-2
00
-7
18
97
18
9 L
ead
met
al-
--
-7
4.1
90
.34
1.4
3.9
--
-2
09
.70
20
9.7
0 Z
inc
met
al-
--
-1
23
.51
50
.56
91
.1-
--
34
4.1
03
44
.10
Lea
d &
Zin
c m
etal
--
--
--
--
-0
.9-
0.9
00
.90
Mad
hya
Pra
des
h O
re-
--
-1
29
11
7-
15
10
40
06
59
30
31
50
14
84
11
48
41
Lea
d m
etal
--
--
--
-2
6.1
25
.13
5.0
4-
36
.29
36
.29
Zin
c m
etal
--
--
5.2
4.7
1-
11
4.7
64
1.9
31
86.
02
10
1.1
24
53
.74
45
3.7
4
Ma
ha
rash
tra
Ore
--
--
--
-1
96
76
30
51
00
0-
92
72
92
72
Zin
c m
etal
--
--
--
-1
33.
56
42
8.1
12
8-
58
9.6
75
89
.67
Tab
le –
1 :
Res
erv
es/R
esou
rces
of
Lea
d &
Zin
c O
re a
s on
1.4
.20
15(B
y G
rad
es/S
tate
s)(I
n '0
00 t
onne
s)
Res
erve
sR
emai
ning
R
esou
rces
To
tal
Gra
de/S
tate
Pro
ved
Pro
babl
eT
ota
lF
easi
bili
tyP
re-f
easi
bili
tyM
easu
red
Indi
cate
dIn
ferr
edR
econ
nais
sanc
eT
ota
lre
sour
ces
ST
D1
11(A
)S
TD
211
ST
D3
31
ST
D3
32
ST
D3
33S
TD
334
(B)
(A+
B)
ST
D1
21S
TD
122
ST
D2
21S
TD
222
(Co
ntd
.)
10-4
LEAD & ZINC
Meg
ha
lay
a
Ore
--
--
--
--
88
0-
-8
80
88
0 L
ead
met
al-
--
--
--
-1
6.5
0-
-1
6.5
01
6.5
0 Z
inc
met
al-
--
--
--
-1
4.0
0-
-1
4.0
01
4.0
0
Od
ish
a O
re-
--
--
96
11
19
--
67
0-
17
50
17
50
Lea
d m
etal
--
--
-3
4.3
24
.25
--
38
.39
-7
6.9
67
6.9
6
Ra
jast
ha
n O
re3
16
62
68
68
75
76
71
06
11
62
96
51
28
88
29
73
42
87
79
17
05
47
31
79
29
13
80
56
42
21
67
03
38
Lea
d m
etal
62
4.5
61
666
.02
19
1.7
62
482
.34
45
.21
39
0.2
27
33
.23
49
0.8
21
86
0.4
75
46
2.0
9-
89
82.0
41
14
64
.38
Zin
c m
etal
28
71.7
56
728
.14
39
9.6
39
999
.52
23
5.3
87
72
.17
12
89.9
11
514
.15
71
45
.53
13
43
5.3
10
.53
243
92
.98
34
392
.5 L
ead
& Z
inc
met
al-
--
--
--
--
11
9.8
62
2.3
71
42.
23
14
2.2
3
Sik
kim
Ore
--
--
-4
36
64
30
0-
15
0-
95
09
50
Lea
d m
etal
--
--
-6
.91
.68
--
--
8.5
88
.58
Zin
c m
etal
--
--
-1
2.8
83
.14
3-
1.0
5-
20
.07
20
.07
Ta
mil
Nad
u O
re-
--
--
--
20
05
90
--
79
07
90
Lea
d m
etal
--
--
--
-2
.26
5.4
8-
-7
.74
7.7
4 Z
inc
met
al-
--
--
--
11
.76
24
.76
--
36
.52
36
.52
Utt
ara
kh
an
d O
re-
--
--
--
31
70
17
90
66
0-
56
20
56
20
Lea
d m
etal
--
--
--
-1
38
.85
34
.25
9.5
0-
18
2.6
01
82
.60
Zin
c m
etal
--
--
--
-1
51
.21
87
.99
27
.63
-2
66.
83
26
6.8
3
Wes
t B
eng
al
Ore
--
--
--
--
33
71
33
5-
37
06
37
06
Lea
d m
etal
--
--
--
--
13
0.0
71
0.0
0-
14
0.0
71
40
.07
Zin
c m
etal
--
--
--
--
13
0.4
21
3.0
0-
14
3.4
21
43
.42
Fig
ure
s ro
un
ded
off
Res
erve
sR
emai
ning
R
esou
rces
To
tal
Gra
de/S
tate
Pro
ved
Pro
babl
eT
ota
lF
easi
bili
tyP
re-f
easi
bili
tyM
easu
red
Indi
cate
dIn
ferr
edR
econ
nais
sanc
eT
ota
lre
sour
ces
ST
D1
11(A
)S
TD
211
ST
D3
31
ST
D3
32
ST
D3
33S
TD
334
(B)
(A+
B)
ST
D1
21S
TD
122
ST
D2
21S
TD
222
Tab
le -
1 (
Co
ncl
d.)
(In
00
0'
ton
nes
)
10-5
LEAD & ZINC
PRODUCTION & STOCKS
Lead & Zinc Ores and ConcentratesThe entire output of lead & zinc ore and
concentrates in 2017-18 and 2018-19 was reportedby mines owned by Hindustan Zinc Ltd, a PrivateSector company.
The production of lead and zinc oreat 13.75 million tonnes in 2018-19 increased by 9%as compared to that in the previous year. The metalcontent of lead and zinc in the ore produced in 2018-19 works out to 2,65,651 tonnes and 8,10,805 tonnesrespectively as against the corresponding figures2,28,733 & 8,34,689 tonnes in the preceding year(Tables-2 & 3).
During the year 2018-19, 14.19 million tonnesof lead & zinc ore was treated as against 12.92 milliontonnes in 2017-18 (Table-4).
The production of lead concentrates in 2018-19 at3,58,370 tonnes increased by 17% as compared to theprevious year. Entire production of lead concentrateswas reported from Rajasthan (Tables-5 & 6).
T he p ro duc t ion o f z inc conce nt r a t e sdecreased to 14,57,171 tonnes in 2018-19 from15 ,39 ,6 57 tonnes in 2 017 -18 . T he en t i r eproduction of zinc concentrates was reported from
Rajasthan (Tables - 7 & 8).
Grade AnalysisAll India average metal content of ore
treated during 2018-19 worked out to be 7.74% (1.89%Pb and 5 .85% Zn) as against 8.40%(1.78% Pb and 6.62% Zn) in 2017-18. The metalcontent of ore treated at Rampura Agucha mine inBhilwara district Rajasthan was the highest at 11.60%(1.49% Pb & 10.11% Zn). The lead concentratesproduced during 2018-19 was of grade 57.78% Pb asagainst 56.73% Pb in 2017-18. Metal content of zinc
concentrates produced in Rajasthan worked out to50% Zn in 2018-19 as against 50.18% Zn in theprevious year.Stock
Mine-head closing stocks of lead concentratesin 2018-19 were 6,684 tonnes as against 34,259tonnes in 2017-18. The entire quantity of thestocks at the end of the year was held in Rajasthan(Table-9).
Mine-head closing stocks of zinc concentratesin 2018-19 were 23,272 tonnes as against 27,052tonnes in 2017-18. The entire quantity of the stockswas held in Rajasthan (Table-10).
EmploymentThe average daily labour employed in lead
and zinc mines during the year 2018-19 under reviewwas 10,551 as against 8,056 in 2017-18.
Lead and Zinc MetalsThe production of primary lead during 2018-19
increased by 17.58% to 1,97,839 tonnes from 1,68,245tonnes during the previous year. The entire output ofprimary lead was from Chanderiya and Dariba smeltersof Hindustan Zinc Ltd.
T he p ro duc t ion o f z inc ingot me ta l a t6,96,283 tonnes in 2018-19 decreased by 12% from7,91,461 tonnes in the previous year. HindustanZinc Ltd, contributed 100% of the total output.(Tables - 11 to 14).
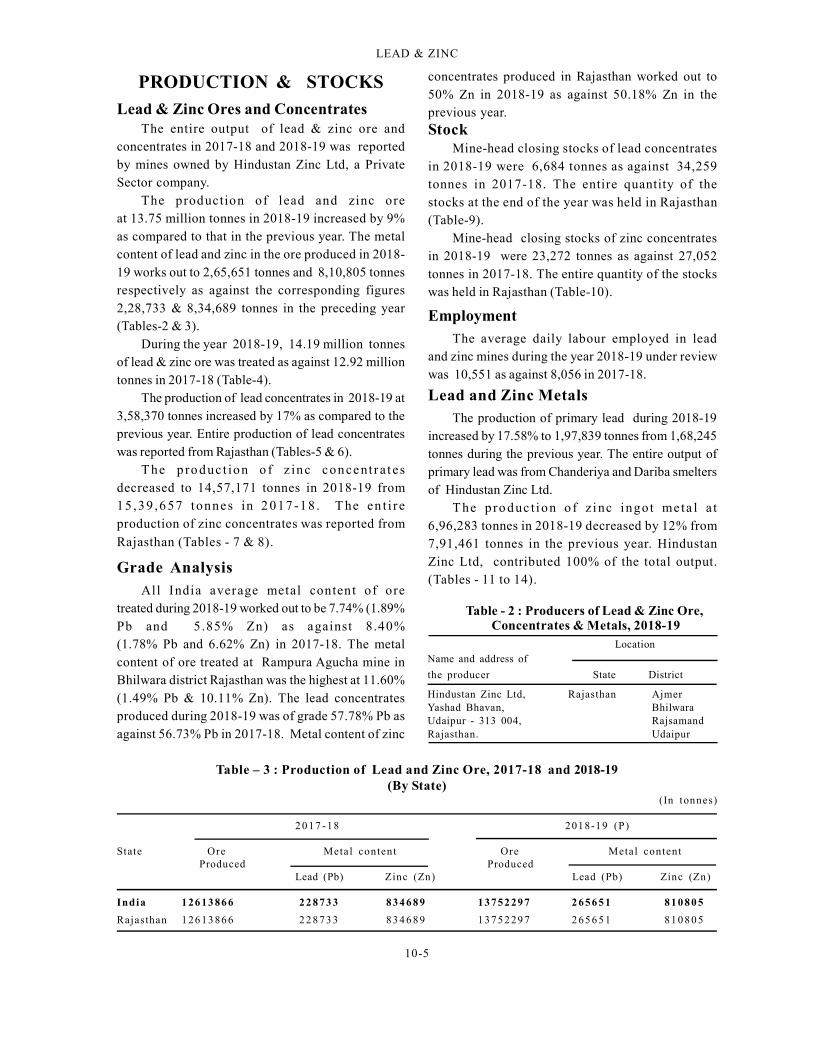
Table - 2 : Producers of Lead & Zinc Ore, Concentrates & Metals, 2018-19
LocationName and address of
the producer State District
Hindustan Zinc Ltd, Rajasthan AjmerYashad Bhavan, BhilwaraUdaipur - 313 004, RajsamandRajasthan. Udaipur
Table – 3 : Production of Lead and Zinc Ore, 2017-18 and 2018-19(By State)
(In tonnes)
2 0 17 -18 2018-19 (P)
State Ore Metal content Ore Metal contentProduced Produced
Lead (Pb) Zinc (Zn) Lead (Pb) Zinc (Zn)
India 1 26 13 86 6 2 2 8 73 3 83 4 6 8 9 13752 29 7 2 65 6 5 1 81 0 8 0 5
Rajasthan 1 26 13 86 6 2 2 8 73 3 83 4 6 8 9 13752 29 7 2 65 6 5 1 81 0 8 0 5
10-6
LEAD & ZINC
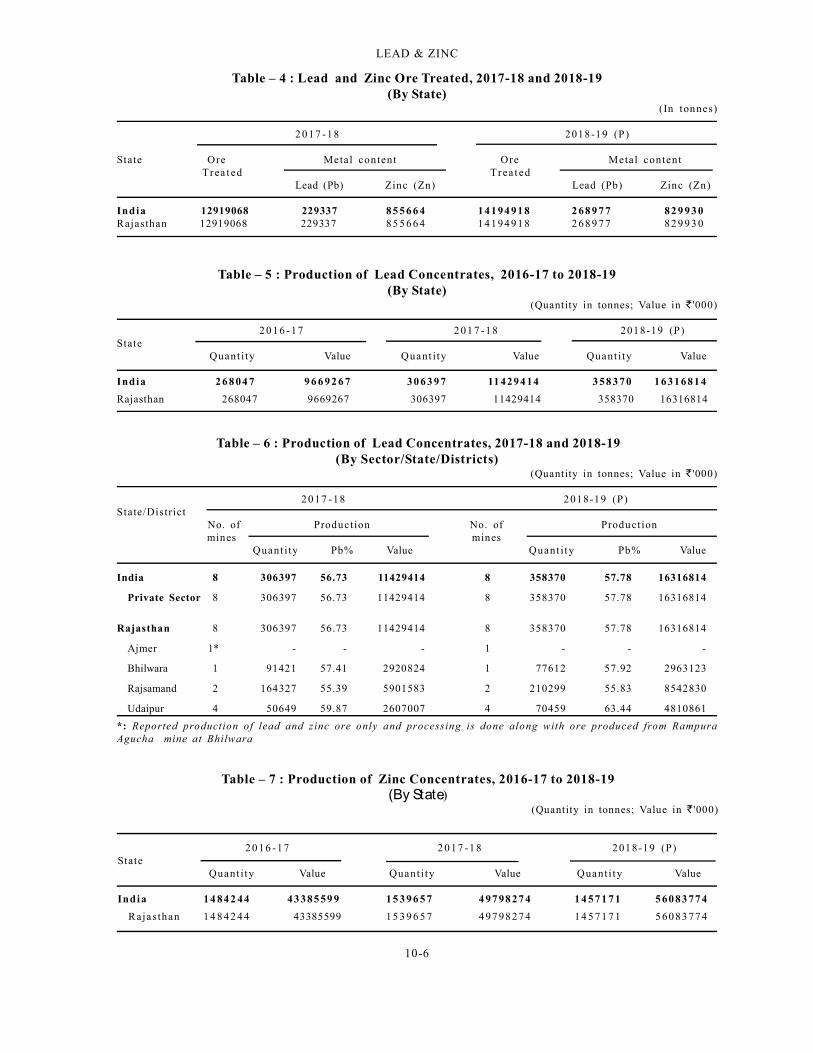
Table – 4 : Lead and Zinc Ore Treated, 2017-18 and 2018-19(By State)
(In tonnes)
2 0 17 -18 2018-19 (P)
State Ore Metal content Ore Metal contentTrea t ed Trea t ed
Lead (Pb) Zinc (Zn) Lead (Pb) Zinc (Zn)
India 12919068 229337 85 5 6 6 4 14194 91 8 2 68 9 7 7 82 9 9 3 0Rajasthan 12919068 229337 85 5 6 6 4 1 419491 8 2 68 9 7 7 82 9 9 3 0
Table – 5 : Production of Lead Concentrates, 2016-17 to 2018-19(By State)
(Quantity in tonnes; Value in '000)
2 0 16 -17 2 01 7 -1 8 2018-19 (P)State
Quant i ty Value Quant i ty Value Quant i ty Value
India 2 6 8 04 7 9 6 6 9 2 6 7 30 6 3 9 7 11 4294 14 3 58 3 7 0 1 631681 4
Rajasthan 268047 9669267 306397 11429414 358370 16316814
Table – 7 : Production of Zinc Concentrates, 2016-17 to 2018-19(By State)
(Quantity in tonnes; Value in '000)
2 0 16 -17 2 0 17 -1 8 2018-19 (P)State
Quant i ty Value Quant i ty Value Quant i ty Value
India 14 84 2 44 43385 59 9 1 5 3 9 6 5 7 4 97 98 27 4 1 4 5 7 1 7 1 5 60 83 77 4
Rajasthan 1 4 8 4 2 4 4 43385599 1 5 3 9 6 5 7 4 97 98 27 4 1 4 5 7 1 7 1 5 60 83 77 4
Table – 6 : Production of Lead Concentrates, 2017-18 and 2018-19(By Sector/State/Districts)
(Quantity in tonnes; Value in '000)
2 0 17 -18 2018-19 (P)State/District
No. of Production No. of Product ionmines mines
Quant i ty Pb% Value Quant i ty Pb% Value
India 8 306397 56.73 11429414 8 358370 57.78 16316814
Private Sector 8 306397 56.73 11429414 8 358370 57.78 16316814
Rajasthan 8 306397 56.73 11429414 8 358370 57.78 16316814
Ajmer 1* - - - 1 - - -
Bhilwara 1 91421 57.41 2920824 1 77612 57.92 2963123
Rajsamand 2 164327 55.39 5901583 2 210299 55.83 8542830
Udaipur 4 50649 59.87 2607007 4 70459 63.44 4810861
*: Reported production of lead and zinc ore only and processing is done along with ore produced from RampuraAgucha mine at Bhilwara
10-7
LEAD & ZINC
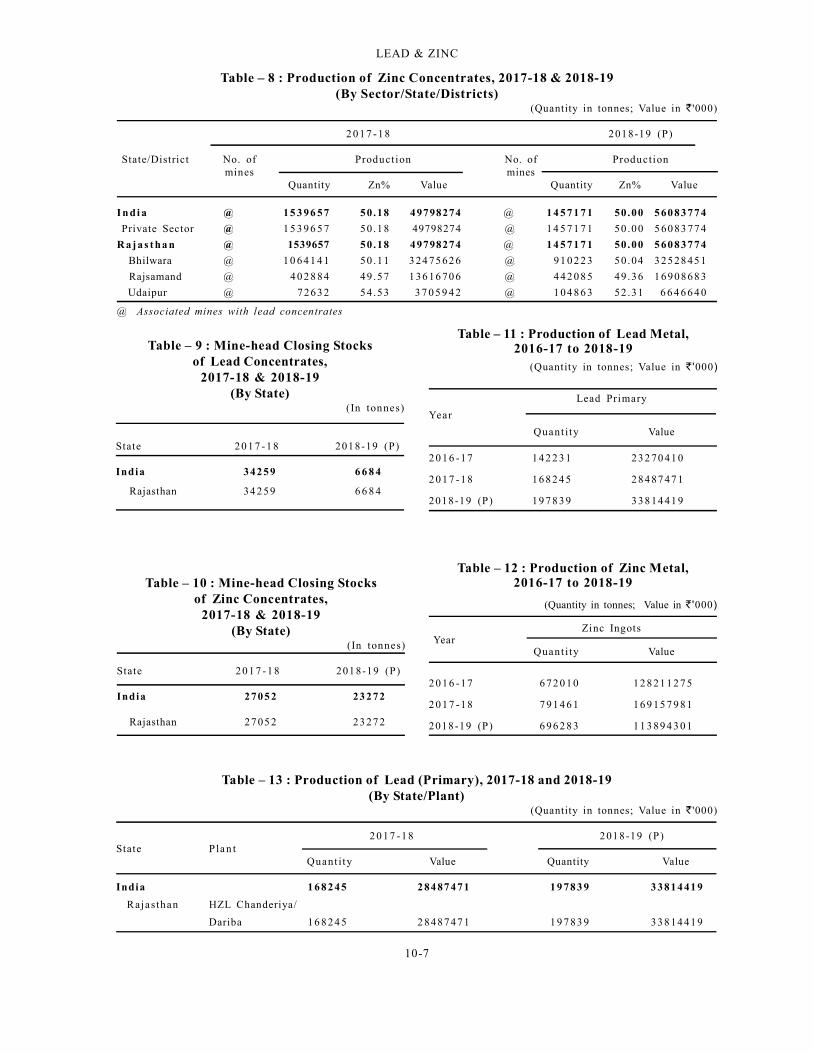
Table – 12 : Production of Zinc Metal,2016-17 to 2018-19
(Quantity in tonnes; Value in '000)
Zinc Ingots Year
Quant i ty Value
2 0 16 -17 6 72 0 1 0 12 8 21 1 2 7 5
2 0 17 -18 7 91 4 6 1 16 9 15 7 9 8 1
2018-19 (P) 6 96 2 8 3 11 3 89 4 3 0 1
Table – 8 : Production of Zinc Concentrates, 2017-18 & 2018-19(By Sector/State/Districts)
(Quantity in tonnes; Value in '000)
2 0 17 -18 2018-19 (P)
State/District No. of Production No. of Productionmines mines
Quantity Zn% Value Quantity Zn% Value
I n di a @ 15 3 96 57 50.18 49798274 @ 1 4 5 7 1 7 1 50.00 5 60 8377 4
Private Sector @ 1 5 3 9 6 5 7 50.18 49798274 @ 1 4 5 7 1 7 1 50 .00 5 60 83 77 4
R a j a s t ha n @ 1539657 50.18 49798274 @ 1 4 5 7 1 7 1 50.00 5 60 8377 4
Bhilwara @ 1 0 64 1 4 1 50 .11 3 24 75 62 6 @ 91 0 2 2 3 50.04 3 25 28 45 1
Rajsamand @ 4 0 2 8 84 49.57 1 36 16 70 6 @ 4 42 0 8 5 49.36 1 690868 3
Udaipur @ 72632 54.53 3 7 0 5 9 4 2 @ 1 04 8 6 3 52.31 6 6 4 6 6 4 0
@ Associated mines with lead concentrates
Table – 9 : Mine-head Closing Stocksof Lead Concentrates,
2017-18 & 2018-19(By State)
(In tonnes)
State 20 1 7 -1 8 2018-19 (P)
India 3425 9 6 6 8 4
Rajasthan 34 259 6 6 8 4
Table – 10 : Mine-head Closing Stocksof Zinc Concentrates,
2017-18 & 2018-19(By State)
(In tonnes)
State 20 1 7 -1 8 2018-19 (P)
India 2705 2 23 272
Rajasthan 27 05 2 23 27 2
Table – 11 : Production of Lead Metal,2016-17 to 2018-19
(Quantity in tonnes; Value in '000)
Lead Primary
Year
Quant i ty Value
2 0 16 -17 14 2 2 3 1 232 70 41 0
2 0 17 -18 16 8 2 4 5 284 87 47 1
2018-19 (P) 19 7 8 3 9 338 14 41 9
Table – 13 : Production of Lead (Primary), 2017-18 and 2018-19(By State/Plant)
(Quantity in tonnes; Value in '000)
2 0 17 -18 2018-19 (P)State P la n t
Quant i ty Value Quantity Value
India 1 6 8 2 45 2 84 87 471 1 9 78 3 9 3 3814 41 9
Rajasthan HZL Chanderiya/
Dariba 16 8 2 4 5 2 848747 1 1 9 7 83 9 338 14 41 9
10-8
LEAD & ZINC
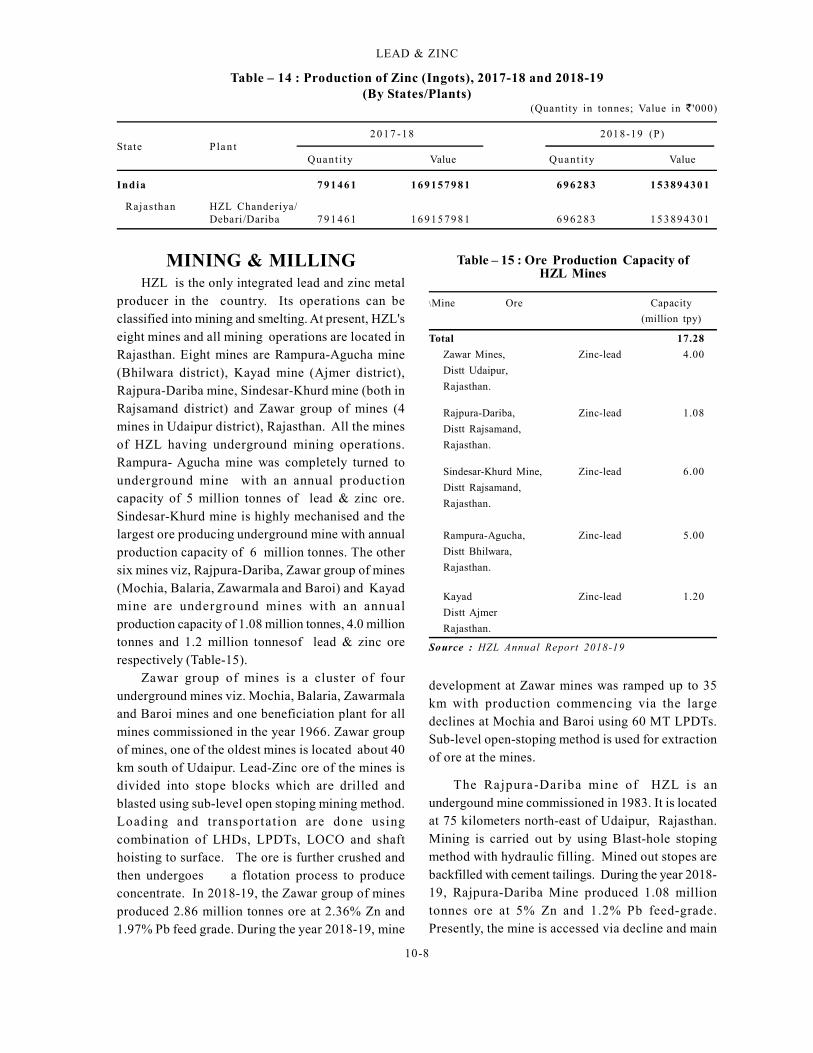
MINING & MILLINGHZL is the only integrated lead and zinc metal
producer in the country. Its operations can beclassified into mining and smelting. At present, HZL'seight mines and all mining operations are located inRajasthan. Eight mines are Rampura-Agucha mine(Bhilwara district), Kayad mine (Ajmer district),Rajpura-Dariba mine, Sindesar-Khurd mine (both inRajsamand district) and Zawar group of mines (4mines in Udaipur district), Rajasthan. All the minesof HZL having underground mining operations.Rampura- Agucha mine was completely turned tounderground mine with an annual productioncapacity of 5 million tonnes of lead & zinc ore.Sindesar-Khurd mine is highly mechanised and thelargest ore producing underground mine with annualproduction capacity of 6 million tonnes. The othersix mines viz, Rajpura-Dariba, Zawar group of mines(Mochia, Balaria, Zawarmala and Baroi) and Kayadmine are underground mines with an annualproduction capacity of 1.08 million tonnes, 4.0 milliontonnes and 1.2 million tonnesof lead & zinc orerespectively (Table-15).
Zawar group of mines is a cluster of fourunderground mines viz. Mochia, Balaria, Zawarmalaand Baroi mines and one beneficiation plant for allmines commissioned in the year 1966. Zawar groupof mines, one of the oldest mines is located about 40km south of Udaipur. Lead-Zinc ore of the mines isdivided into stope blocks which are drilled andblasted using sub-level open stoping mining method.Loading and transportation are done usingcombination of LHDs, LPDTs, LOCO and shafthoisting to surface. The ore is further crushed andthen undergoes a flotation process to produceconcentrate. In 2018-19, the Zawar group of minesproduced 2.86 million tonnes ore at 2.36% Zn and1.97% Pb feed grade. During the year 2018-19, mine
Table – 15 : Ore Production Capacity ofHZL Mines
\Mine Ore Capacity
(million tpy)
Total 17.28
Zawar Mines, Zinc-lead 4.00
Distt Udaipur,
Rajasthan.
Rajpura-Dariba, Zinc-lead 1.08
Distt Rajsamand,
Rajasthan.
Sindesar-Khurd Mine, Zinc-lead 6.00
Distt Rajsamand,
Rajasthan.
Rampura-Agucha, Zinc-lead 5.00
Distt Bhilwara,
Rajasthan.
Kayad Zinc-lead 1.20
Distt Ajmer
Rajasthan.
Source : HZL Annual Report 2018-19
Table – 14 : Production of Zinc (Ingots), 2017-18 and 2018-19(By States/Plants)
(Quantity in tonnes; Value in '000)
2 0 17 -18 2018-19 (P)State P la n t
Quant i ty Value Quant i ty Value
India 7 9 1 46 1 1 6 9157 9 8 1 6 9 6 28 3 1 5 389 43 0 1
Rajasthan HZL Chanderiya/Debari/Dariba 7 9 1 4 61 1 6 9 15 79 8 1 6 9 6 2 83 1 5 3 89 4 30 1
development at Zawar mines was ramped up to 35km with production commencing via the largedeclines at Mochia and Baroi using 60 MT LPDTs.Sub-level open-stoping method is used for extractionof ore at the mines.
The Rajpura-Dariba mine of HZL is anundergound mine commissioned in 1983. It is locatedat 75 kilometers north-east of Udaipur, Rajasthan.Mining is carried out by using Blast-hole stopingmethod with hydraulic filling. Mined out stopes arebackfilled with cement tailings. During the year 2018-19, Rajpura-Dariba Mine produced 1.08 milliontonnes ore at 5% Zn and 1.2% Pb feed-grade.Presently, the mine is accessed via decline and main
10-9
LEAD & ZINC
shaft. As RDM orebody also allows for multipleproduction centres, the mine is poised to produce atthe capacity of 2 million tonnes per annum of ore infuture with new level of mechanisation & automation.Mine has achieved highest truck filling hours andexploration drilling resulting in its readiness forexpansion.
Rampura-Agucha mine is located at 230 km northof Udaipur in Bhilwara district, Rajasthan and it wascommissioned in 1991. It has high zinc-lead reservegrades averaging 15.4%. In 2018-19, the productionof ore was carried out by underground mining. Until2017-18 the production of ore from the mine was bysurface mining and the mine has been fullytransformed into an underground mine. Twoventilation shafts (North and South) each withdiameter of 7.5 m and 450 m depth are in operation.The main hoisting shaft of 7.5 m diameter has beensunk and furnished to its final depth of 950 m andwinders, skip loading & surface conveyors have beeninstalled, while off-shaft development activities tocommision underground crushing and conveyingsystem are under progress. Paste-Fill plant has beenestablished in the mine area. Underhand stopingmethod has been adopted which will use mine tailingsto fill stopes after ore extraction.
Sindesar-Khurd mine is located at 6 km NNE ofRajpura-Dariba mine and 82 km north-east ofUdaipur. It is an underground mine, commissionedin 2006. The average reserve grade of Sindesar- KhurdMine is 7% with its silver-rich lead-zinc deposit. Themine lies on the same geological belt as the Rajpura-Dariba mine. During the year 2018-19, Sindesar-Khurd mine produced 5.3 million tonnes ore at 3.75%Zn and 2.4% Pb grade. It produces high silver contentore at 128 g/tonne. During the year 2018-19, anunderground shaft having capacity of 3.75 milliontonnes was commisioned with skip & waste hoistingsystem. The mine consists of multiple standalonedeposits or auxiliary lenses, which gives threestandalone production centres at present. Theproduction is carried out from the main lens whichhas an annual capacity of 3.5 million tonnes & twoauxiliary lens SKA2 and SKA6, are functioning at2.5 million tonnes capacity per annum. In 2018-19,the mine received environment clearance to produce6.0 million tonnes of ore and 6.5 million tonnes of ore
beneficiation. Two existing beneficiation plants atthe mine are operating at 4.7 million tonnes perannum, while in the year 2018-19, third beneficiationplant of 1.5 mill ion tonnes per annum wascommissioned. Thus, the total beneficiation capacityis 6.2 million tonnes per annum.
Kayad mine is a newly developed undergroundmine near Ajmer, Rajasthan. It was commissioned in2014 having small but high-grade ore at 6.3% Pb &Zn ore deposit. In Kayad mine, 21 tonnes capacityof LHD and 65 tonnes capacity of LPDT are used toproduce 1.2 million tonnes of ore per annum. Themine has access through a single decline from surfaceportal to the top of the orebody and split in twodeclines 75 meters below surface.
Longitudinal Long-hole Open stoping methodis used for the steeper and thinner portion of orebody and Transverse Long-hole Open Stopingmethod for flatty dipping and thick portion of theore body. In the year 2018-19, the Kayad mineproduced 1.2 million tonnes ore as same as in theprevious year at average feed grade of 8.2 % Zn and1.1% Pb. The ore from Kayad mine is treated atRampura Agucha’s beneficiation plant.
SMELTINGPrimary lead was produced entirely by HZL
which operated smelter at Chanderiya and Daribahaving capacity of 85,000 tonnes and 1,20,000 tonnesper annum of lead metal, respectively. Thus, thesmelting capacity for lead (primary) in the countrypresently is 2,05,000 tonnes per annum. Company-wise smelting capacity of lead and zinc smelters isfurnished in Table-16.
The smelting capacity of HZL for zinc isdistributed between three smelters at Debari (88,000tonnes), Chanderiya (5,58,000 tonnes) and Dariba(2,34,000 tonnes). Edayar Zinc Ltd's plant atBinanipuram (Aluva), Kerala has capacity of 38,000tonnes per annum. Thus, the smelting capacity forzinc in the country is 9,18,000 tonnes per annum.EZL produced zinc from imported concentrates butsince the Company has been declared as sick unit, itdid not operate its plant. Besides lead & zinccapacities, HZL has capacities to produce 800 tonnesper annum of s ilver. HZL is India 's la rgestmanufacturer of sulphuric acid which is by-product
10-10
LEAD & ZINC
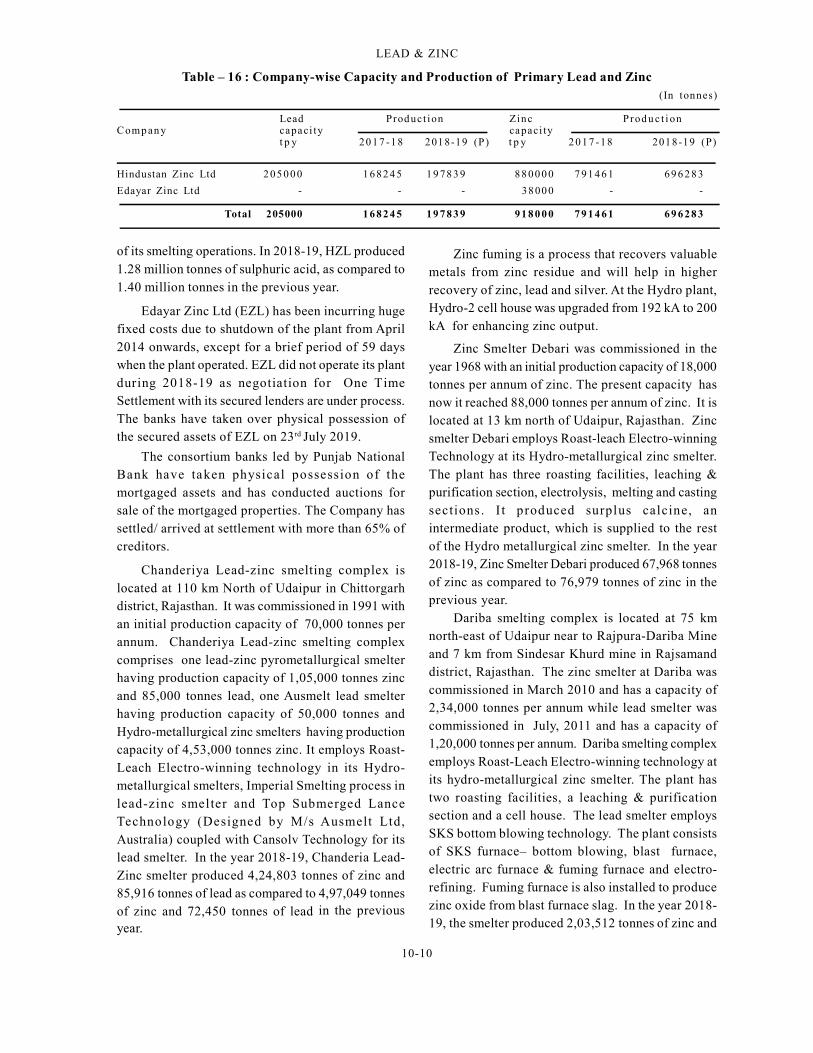
Table – 16 : Company-wise Capacity and Production of Primary Lead and Zinc(In tonnes)
Lead Product ion Zinc Prod u c t i onComp an y capaci ty capaci ty
t p y 20 1 7 -1 8 2018-19 (P) t p y 2 0 1 7 -18 2018-19 (P)
Hindustan Zinc Ltd 2 05 0 0 0 1 68 2 4 5 1 9 78 3 9 8 8 00 0 0 7 91 4 6 1 69 6 2 8 3
Edayar Zinc Ltd - - - 38 00 0 - -
Total 205000 1 6 8 2 4 5 19 7 8 3 9 91 8 0 0 0 7 9 1 4 61 6 9 6 28 3
of its smelting operations. In 2018-19, HZL produced1.28 million tonnes of sulphuric acid, as compared to1.40 million tonnes in the previous year.
Edayar Zinc Ltd (EZL) has been incurring hugefixed costs due to shutdown of the plant from April2014 onwards, except for a brief period of 59 dayswhen the plant operated. EZL did not operate its plantduring 2018-19 as negotiation for One TimeSettlement with its secured lenders are under process.The banks have taken over physical possession ofthe secured assets of EZL on 23rd July 2019.
The consortium banks led by Punjab NationalBank have taken physical possession of themortgaged assets and has conducted auctions forsale of the mortgaged properties. The Company hassettled/ arrived at settlement with more than 65% ofcreditors.
Chanderiya Lead-zinc smelting complex islocated at 110 km North of Udaipur in Chittorgarhdistrict, Rajasthan. It was commissioned in 1991 withan initial production capacity of 70,000 tonnes perannum. Chanderiya Lead-zinc smelting complexcomprises one lead-zinc pyrometallurgical smelterhaving production capacity of 1,05,000 tonnes zincand 85,000 tonnes lead, one Ausmelt lead smelterhaving production capacity of 50,000 tonnes andHydro-metallurgical zinc smelters having productioncapacity of 4,53,000 tonnes zinc. It employs Roast-Leach Electro-winning technology in its Hydro-metallurgical smelters, Imperial Smelting process inlead-zinc smelter and Top Submerged LanceTechnology (Designed by M/s Ausmelt Ltd,Australia) coupled with Cansolv Technology for itslead smelter. In the year 2018-19, Chanderia Lead-Zinc smelter produced 4,24,803 tonnes of zinc and85,916 tonnes of lead as compared to 4,97,049 tonnesof zinc and 72,450 tonnes of lead in the previousyear.
Zinc fuming is a process that recovers valuablemetals from zinc residue and will help in higherrecovery of zinc, lead and silver. At the Hydro plant,Hydro-2 cell house was upgraded from 192 kA to 200kA for enhancing zinc output.
Zinc Smelter Debari was commissioned in theyear 1968 with an initial production capacity of 18,000tonnes per annum of zinc. The present capacity hasnow it reached 88,000 tonnes per annum of zinc. It islocated at 13 km north of Udaipur, Rajasthan. Zincsmelter Debari employs Roast-leach Electro-winningTechnology at its Hydro-metallurgical zinc smelter.The plant has three roasting facilities, leaching &purification section, electrolysis, melting and castingsections . I t produced surplus calcine, anintermediate product, which is supplied to the restof the Hydro metallurgical zinc smelter. In the year2018-19, Zinc Smelter Debari produced 67,968 tonnesof zinc as compared to 76,979 tonnes of zinc in theprevious year.
Dariba smelting complex is located at 75 kmnorth-east of Udaipur near to Rajpura-Dariba Mineand 7 km from Sindesar Khurd mine in Rajsamanddistrict, Rajasthan. The zinc smelter at Dariba wascommissioned in March 2010 and has a capacity of2,34,000 tonnes per annum while lead smelter wascommissioned in July, 2011 and has a capacity of1,20,000 tonnes per annum. Dariba smelting complexemploys Roast-Leach Electro-winning technology atits hydro-metallurgical zinc smelter. The plant hastwo roasting facilities, a leaching & purificationsection and a cell house. The lead smelter employsSKS bottom blowing technology. The plant consistsof SKS furnace– bottom blowing, blast furnace,electric arc furnace & fuming furnace and electro-refining. Fuming furnace is also installed to producezinc oxide from blast furnace slag. In the year 2018-19, the smelter produced 2,03,512 tonnes of zinc and
10-11
LEAD & ZINC
1,11,922 tonnes of lead metal as compared to 2,17,433tonnes of zinc and 95,797 tonnes of lead metal in theprevious year. Dariba Smelting Complex lead plantsteam was utilised in Dariba Smelting ComplexCaptive Power Plant (CPP) for reducing the auxiliarysteam consumption. In 2018-19, Dariba SmeltingComplex produced 4,77,217 tonnes of sulphuric acidas comapred to that of 5,12,945 tonnes in the previousyear.
The product range of HZL constitutes twogrades, namely, Special High Grade (SHG) zinccontaining 99.995% Zn (min.) and Prime Western(PW) containing 98.65% Zn (min.). Both theseproducts are available in the form of slabs weighing25 kg, SHG Jumbo weighing 1,000 kgand PW Jumbo weighing 600 kg. Lead is available asHZL Grade containing 99.99% Pb (min.) in the formof slab weighing 24 kg. In October 2016, a new zincalloy value-added product, HZDA or Hindustan ZincDie-cast Alloy was added to the Company's portfoliofrom Chanderiya Lead-Zinc Smelter.
POLLUTION CONTROL &ENVIRONMENTAL
MANAGEMENT EFFORTS
The standard for Emission or Discharge ofEnvironment Pollutant from lead & zinc smelting isprescribed in Schedule-I of the Environment(Protection) Rules, 1986. The standards forParticulate Matter Emission in concentrator for lead& zinc smelter is 150 mg per normal cubic metre andthe standard for emission of oxides of sulphur insmelter & convertor is that off-gases must be utilisedfor sulphuric acid manufacture. The limit of sulphurdioxide emission from stock shall not exceed 4 kg pertonne of concentrate (one hundred percent acidproduced).
At underground mines, the tailings generatedafter beneficiation is uti lised to backfi ll theunderground mined stopes and the remaining tailingsis stored in tailing dam at various mines location.During the process of recovery of metal at smelters,waste is generated. The waste contains toxic element,i.e., waste water effluent sludge, smelter slag leachresidues, suspended particulate matter (SPM), SO
2,
NOx and toxic metal fumes which are harmful at low
exposure generated during the production of lead &zinc metal.
Smelting and mining operations of HZL areworking on zero discharge principle and the Companyis committed for efficient utilisation of wastegenerated at its mines and smelter. The Companyhas adopted Fumer technology to reduce jarositegeneration, which is known to be successful in fewChinese and Korean Zinc Plants.
During the year 2018-19, the enviorment expensesof HZL was ̀ 69 crore. Hindustan Zinc Limited runs a25 MLD STP in Udaipur for treating municipal sewage.The enhancement of capacity of STP to 45 MLD andestablishment of another STP of 15 MLD capacity isin progress. This STP is a unique PPP initiative ofthe Company and is counted among the bestfunctioning STPs in the country.
HZL is using internal waste for paste filling ofstopes in mines. Remote operations and autonomousfleet in mines keep people away from risk. Some otherinitiatives in pipeline include ventilation on demandin mines to reduce energy consumption and use ofadvance flotation & ore retreatment technology toincrease ore-to-metal ratio which is aimed at reducigwaste and increasing output.
The sewage treatment plants at Debari andChanderiya smelters were operated continuously andthe recovered water was reutilised in the smelter andfor plantation in the colony. Over the years, theCompany has been voluntarily filing CarbonDisclosure Project (CDP) responses as a proactivestep towards reporting carbon foot print emissions.
HZL has entered into a charter onCorporate Responsibil ity for EnvironmentalProtection (CREP) with MoEF, Central PollutionControl Board (CPCB) and State Pollution ControlBoards (SPCBs) for achieving a quantum jumpin its environmental performance in the coming years.
Many of the secondary lead producing unitshave operated in the unorganised sector and theycreate major pollution by emission of lead vapourand SO
X. The small-scale units generally do not
control process parameters, such as, smeltingtemperature, charge to fuel ratio, leakages in thebody, etc. As per the National Ambient Air Qualitystandards, the permissible concentration of lead inambient air is 0.50 µg/m3 while the permissible limit
for SOx is 50 µg/m3 .
10-12
LEAD & ZINC
RECYCLING OF LEAD & ZINCLead
The storage battery scrap is the main source ofsecondary lead production. Lead is one of thehighest recycled metals. Lead is very easy to recycle.It can be re-melted any number of times, and providedenough processes to remove impurities areperformed, the final product (termed secondary lead)is indistinguishable from primary lead produced fromore. The amount of lead recycled is about 75% of thetotal lead production in India. More than 80% of leadconsumed in the country goes for manufacturing oflead batteries.
Government of India has enacted BatteryManagement and Handling Rules (BMHR), 2002 toorganise the recycling of lead acid batteries and tomake available raw material to the lead reproducers.In 2010, the Ministry of Environment and Forest alsoissued amendments making battery dealers andimporters of new lead batteries to register with therespective state regulartory bodies and to fileperiodic returns every six months on collenction ofused lead batteries. In September, 2010, CentralPollution Control Board also shifted the registrationscheme for lead recycling, as a decentralisation moveto the state regulatory boards. In 2010, 355 eco-friendly lead recycling units had registered withCPCB for processing used lead batteries which isnow more than 550 units in India.
Lead when used as metal in batteries,cable sheathing and sheathing for containingradiation is fully recyclable and it does not lose itsproperties. There is indeed a thriving industry thatrecycles lead in the country. However, due to thehealth risk involved in lead recycling the CentralPollution Control Board issues licences to the lead-reprocessors to ensure adherence to environmentalnorms.
ZincThe largest consumer of zinc is the Galvanising
Industry. The zinc once used for galvanising as wellas for brass making is not recoverable. Hence, thequantum of zinc recycling is comparatively small ascompared to lead recycling. The secondary zinc wasrecovered from pure zinc scrap in the form of sheetcutting, zinc roofings, old zinc anodes and alloyscontaining zinc as a major constituent.
CONSUMPTIONConsumption of lead and zinc in various
industries is not available readily. However, itis known that lead and zinc are consumed in the formof metals as well as in the form of compounds andoxides.
LeadThe Battery Industry consumes about 80% of
lead and remaining 20% is consumed in pigments &compounds, rolled & extruded products, alloys, cablesheathing and other industries.
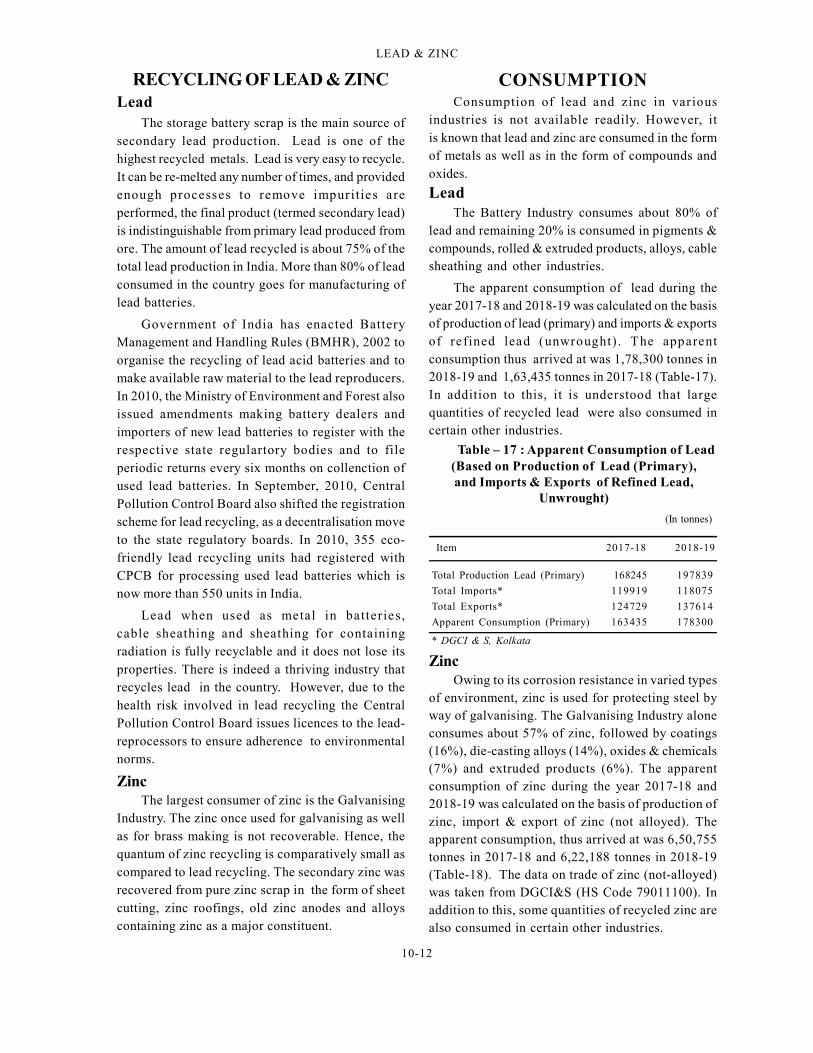
The apparent consumption of lead during theyear 2017-18 and 2018-19 was calculated on the basisof production of lead (primary) and imports & exportsof refined lead (unwrought) . The apparentconsumption thus arrived at was 1,78,300 tonnes in2018-19 and 1,63,435 tonnes in 2017-18 (Table-17).In addition to this, it is understood that largequantities of recycled lead were also consumed incertain other industries.
ZincOwing to its corrosion resistance in varied types
of environment, zinc is used for protecting steel byway of galvanising. The Galvanising Industry aloneconsumes about 57% of zinc, followed by coatings(16%), die-casting alloys (14%), oxides & chemicals(7%) and extruded products (6%). The apparentconsumption of zinc during the year 2017-18 and2018-19 was calculated on the basis of production ofzinc, import & export of zinc (not alloyed). Theapparent consumption, thus arrived at was 6,50,755tonnes in 2017-18 and 6,22,188 tonnes in 2018-19(Table-18). The data on trade of zinc (not-alloyed)was taken from DGCI&S (HS Code 79011100). Inaddition to this, some quantities of recycled zinc arealso consumed in certain other industries.
Table – 17 : Apparent Consumption of Lead(Based on Production of Lead (Primary),and Imports & Exports of Refined Lead,
Unwrought)
(In tonnes)
Item 2017-18 2018-19
Total Production Lead (Primary) 168245 197839
Total Imports* 119919 118075
Total Exports* 124729 137614
Apparent Consumption (Primary) 163435 178300
* DGCI & S, Kolkata

10-13
LEAD & ZINC
SUBSTITUTES &
TECHNICAL POSSIBILITIES
LeadBattery replacements include batteries
of nickel-zinc, zinc lithium chloride, sulphideor nickel lithium hydride. The large-scale commercialuse of any of these four possible substitutes was sofar precluded by cost and operating problems.Polyethylene and other materials work as substitute
in some cable applications.
In construction applications, in p lace ofgalvanised sheets, copper and aluminium arealternatives. In corrosive chemical environment,
stainless steel, titanium, plastics and cements aresubstitutes. Tin, glass, plastics and aluminium arealternatives in tubes and containers; iron & steel orbismuth in shots for ammunition; and tin in solder.In Electronic Industry, there has been a move towardslead-free solders with varying compositions of tin,
bismuth, silver and copper.
Environmental concerns for lead are limiting theuses, particularly in gasoline, where its use as ananti-knocking agent was phased out by theintroduction of catalytic converters. Storage batteries
for industrial load levelling, mains powermanagement and electric vehicles have growingmarkets. The continued search for weight reductionis reducing the amount of lead per battery, and
battery lives are being extended. Possible newdevelopments include the use of lead as an anti-oxidant in asphalt, as a shielding material in nuclearwaste, in protection of buildings against radon gasesand as a sound buffer. Environmental legislation willinhibit the growth of new uses and possibly eliminate
lead from many existing uses. The Organisation forEconomic Cooperation & Development (OECD) isactively examining possible restrictions on uses oflead. New techniques to recover lead fromconcentrates and from scrap are being developedand are bound to become more important in future.
Recycling of lead and zinc through environmentallysafe processes needs to be encouraged as thegrowing use of lead and zinc in railway electrificationas well as in road transport vehicles have createdshortage of these metals in the country.
Zinc
Aluminium, magnesium and plastic compete in
some die-casting applications. Ceramic and plasticcoatings, electroplated cadmium & aluminium andspecia l s t ee l compete in some galvanis ingapplications. Aluminium, magnesium and titaniumcan replace zinc in chemicals and pigments.Zirconium is an alternative in ceramic and enamel
applications. New alloys, e.g. superplastic alloysof zinc and aluminium could be developed. Manyelements are substitutes for zinc in chemical,electronic and pigment uses.
WORLD REVIEW
Lead
The world's reserves of lead were estimatedat 90 million tonnes in terms of lead content.
Australia possesses 40% of the world's reservesfollowed by China (20%), Russia & Peru (7% each),
Mexico & USA (6% each), etc. (Table- 19).
Zinc
The world's reserves of zinc were estimated at250 million tonnes of zinc content. Australia accountsfor 27% of world's zinc reserves, followed by China
(18%), Russia & Mexico (9% each), Peru (8%),Kazakhstan (5% ), USA (4%), etc. (Table-20).
Table – 18 : Apparent Consumption of Zinc(Based on Production of Zinc (Ingots) and
Imports & Exports of Zinc (not alloyed)
(In tonnes)
Item 2 0 17 -1 8 2018-19
Total Product ion Zinc 791461 6 96 2 8 3
Tota l Impor t s* 1 17 3 2 2 1 1 10 1 3
Tota l Export s* 2 58 0 2 8 1 8 51 0 8
Apparent Consumption 6 50 7 5 5 6 2 21 8 8
*DGCI&S, Kolkata
10-14
LEAD & ZINC
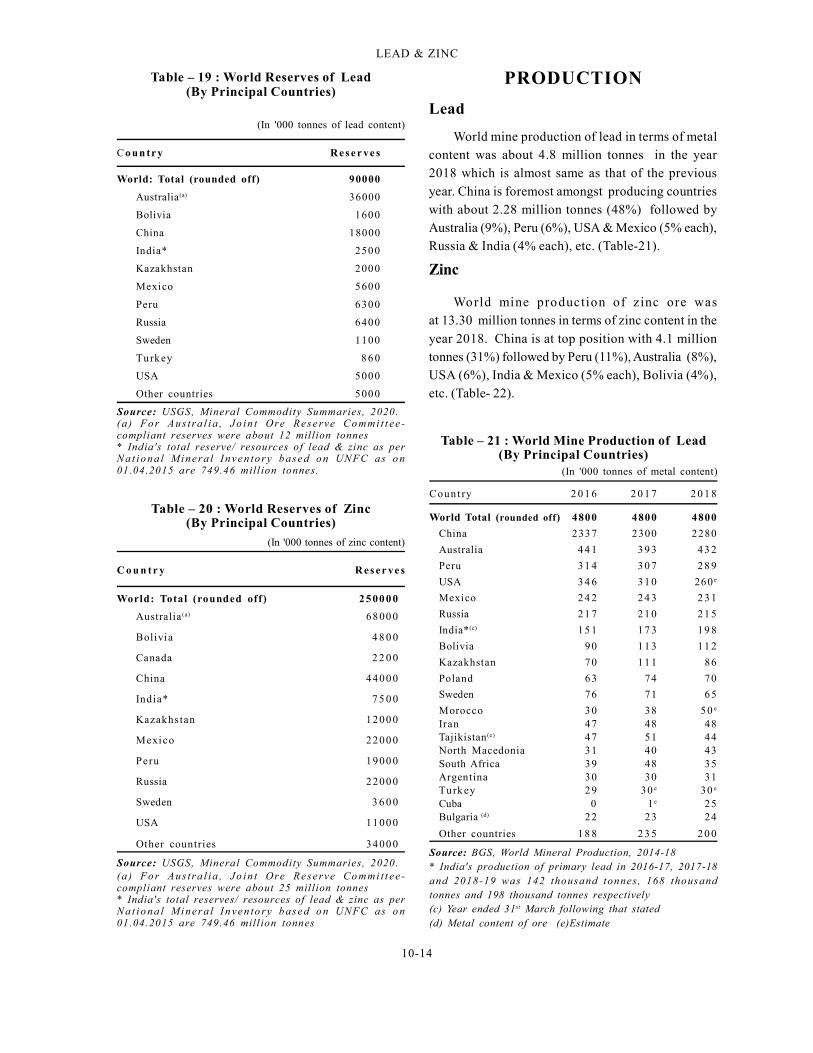
Table – 19 : World Reserves of Lead(By Principal Countries)
(In '000 tonnes of lead content)
C o un tr y R e s e r ve s
World: Total (rounded off) 90000
Australia(a) 36000
Bolivia 1600
China 18000
India* 2500
Kazakhstan 2000
Mexico 5600
Peru 6300
Russia 6400
Sweden 1100
Turkey 8 6 0
USA 5000
Other countries 5000
Source: USGS, Mineral Commodity Summaries, 2020.(a ) Fo r Au s t ra l i a , J o in t Ore Re se rve Co mmi t t ee -compliant reserves were about 12 million tonnes* India's total reserve/ resources of lead & zinc as perNa t i o na l M i ne ra l In ve n to ry b ase d o n UNFC as o n01.04.2015 are 749.46 mill ion tonnes.
Table – 20 : World Reserves of Zinc(By Principal Countries)
(In '000 tonnes of zinc content)
C o u n t r y R e s e r ve s
World: Total (rounded off ) 2 5 00 0 0
Australia (a) 68 00 0
Bolivia 4 8 0 0
Canada 2 2 0 0
China 4400 0
India* 7 5 0 0
Kazakhs tan 1200 0
Mexico 2200 0
Peru 1900 0
Russia 2200 0
Sweden 3 6 0 0
USA 1100 0
Other countries 3400 0
Source: USGS, Mineral Commodity Summaries, 2020.(a ) Fo r Au s t ra l i a , J o in t Ore Re se rve Co mmi t t ee -compliant reserves were about 25 million tonnes* India's total reserves/ resources of lead & zinc as perNa t i o na l M i ne ra l In ve n to ry b ase d o n UNFC as o n01.04.2015 are 749.46 mill ion tonnes
PRODUCTION
Lead
World mine production of lead in terms of metalcontent was about 4.8 million tonnes in the year2018 which is almost same as that of the previous
year. China is foremost amongst producing countrieswith about 2.28 million tonnes (48%) followed byAustralia (9%), Peru (6%), USA & Mexico (5% each),Russia & India (4% each), etc. (Table-21).
Zinc
World mine production of zinc ore wasat 13.30 million tonnes in terms of zinc content in the
year 2018. China is at top position with 4.1 milliontonnes (31%) followed by Peru (11%), Australia (8%),USA (6%), India & Mexico (5% each), Bolivia (4%),etc. (Table- 22).
Table – 21 : World Mine Production of Lead(By Principal Countries)
(In '000 tonnes of metal content)
Coun t ry 2 0 1 6 2 0 1 7 2 0 1 8
World Total (rounded off) 4800 4800 4800
China 2337 2300 2280
Australia 4 4 1 3 9 3 4 3 2
Peru 3 1 4 3 0 7 2 8 9
USA 3 4 6 3 1 0 260 e
Mexico 2 4 2 2 4 3 2 3 1
Russia 2 1 7 2 1 0 2 1 5
India*(c) 1 5 1 1 7 3 19 8
Bolivia 90 1 1 3 1 1 2
Kazakhstan 70 1 1 1 86
Poland 63 74 70
Sweden 76 71 65
Morocco 30 38 50 e
Iran 47 48 48Tajikistan (e) 47 51 44North Macedonia 31 40 43South Africa 39 48 35Argentina 30 30 31Turkey 29 30 e 30 e
Cuba 0 1 e 25Bulgaria (d) 22 23 24
Other countries 1 8 8 2 3 5 2 0 0
Source: BGS, World Mineral Production, 2014-18* India's production of primary lead in 2016-17, 2017-18and 2018-19 was 142 thousand tonnes, 168 thousandtonnes and 198 thousand tonnes respectively(c) Year ended 31st March following that stated(d) Metal content of ore (e)Estimate
10-15
LEAD & ZINC
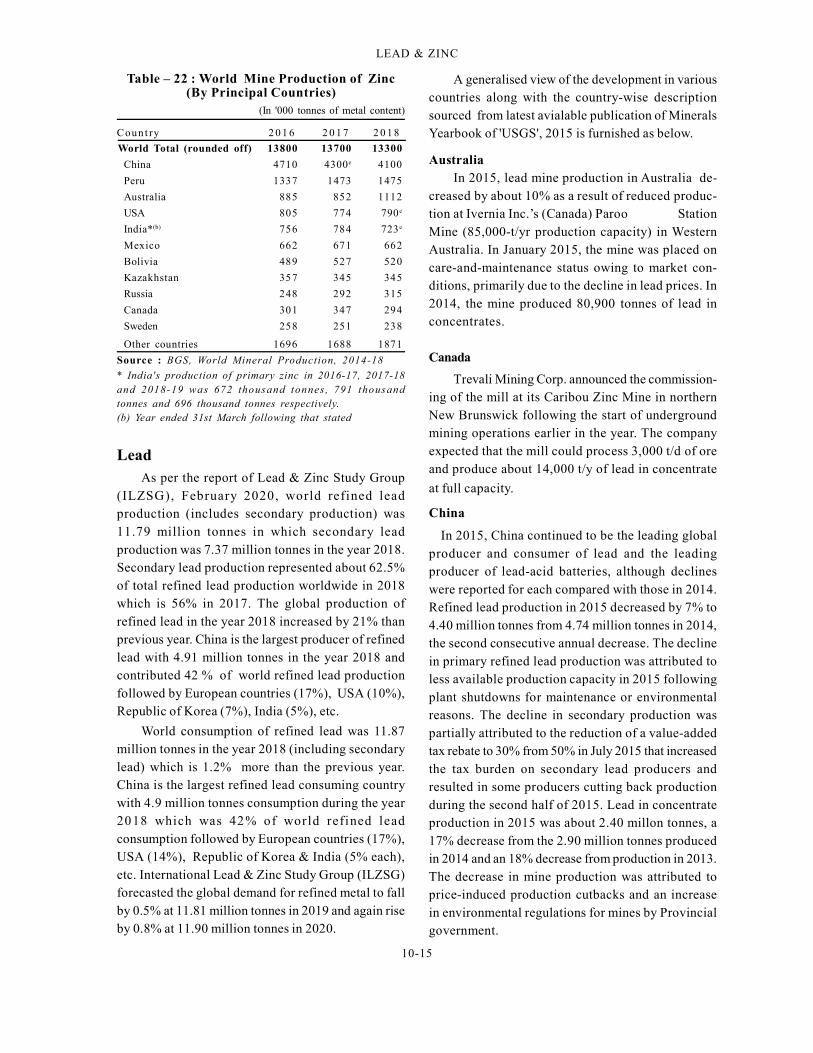
LeadAs per the report of Lead & Zinc Study Group
(ILZSG), February 2020, world refined leadproduction (includes secondary production) was11.79 million tonnes in which secondary leadproduction was 7.37 million tonnes in the year 2018.Secondary lead production represented about 62.5%of total refined lead production worldwide in 2018which is 56% in 2017. The global production ofrefined lead in the year 2018 increased by 21% thanprevious year. China is the largest producer of refinedlead with 4.91 million tonnes in the year 2018 andcontributed 42 % of world refined lead productionfollowed by European countries (17%), USA (10%),Republic of Korea (7%), India (5%), etc.
World consumption of refined lead was 11.87million tonnes in the year 2018 (including secondarylead) which is 1.2% more than the previous year.China is the largest refined lead consuming countrywith 4.9 million tonnes consumption during the year2018 which was 42% of world refined leadconsumption followed by European countries (17%),USA (14%), Republic of Korea & India (5% each),etc. International Lead & Zinc Study Group (ILZSG)forecasted the global demand for refined metal to fallby 0.5% at 11.81 million tonnes in 2019 and again riseby 0.8% at 11.90 million tonnes in 2020.
A generalised view of the development in variouscountries along with the country-wise descriptionsourced from latest avialable publication of MineralsYearbook of 'USGS', 2015 is furnished as below.
AustraliaIn 2015, lead mine production in Australia de-
creased by about 10% as a result of reduced produc-tion at Ivernia Inc.’s (Canada) Paroo StationMine (85,000-t/yr production capacity) in WesternAustralia. In January 2015, the mine was placed oncare-and-maintenance status owing to market con-ditions, primarily due to the decline in lead prices. In2014, the mine produced 80,900 tonnes of lead inconcentrates.
Canada
Trevali Mining Corp. announced the commission-ing of the mill at its Caribou Zinc Mine in northernNew Brunswick following the start of undergroundmining operations earlier in the year. The companyexpected that the mill could process 3,000 t/d of oreand produce about 14,000 t/y of lead in concentrate
at full capacity.
China
In 2015, China continued to be the leading globalproducer and consumer of lead and the leadingproducer of lead-acid batteries, although declineswere reported for each compared with those in 2014.Refined lead production in 2015 decreased by 7% to4.40 million tonnes from 4.74 million tonnes in 2014,the second consecutive annual decrease. The declinein primary refined lead production was attributed toless available production capacity in 2015 followingplant shutdowns for maintenance or environmentalreasons. The decline in secondary production waspartially attributed to the reduction of a value-addedtax rebate to 30% from 50% in July 2015 that increasedthe tax burden on secondary lead producers andresulted in some producers cutting back productionduring the second half of 2015. Lead in concentrateproduction in 2015 was about 2.40 millon tonnes, a17% decrease from the 2.90 million tonnes producedin 2014 and an 18% decrease from production in 2013.The decrease in mine production was attributed toprice-induced production cutbacks and an increasein environmental regulations for mines by Provincialgovernment.
Table – 22 : World Mine Production of Zinc(By Principal Countries)
(In '000 tonnes of metal content)
Coun t ry 2 0 1 6 2 0 1 7 2 0 1 8
Source : BGS, World Mineral Production, 2014-18
* India's production of primary zinc in 2016-17, 2017-18and 2018-19 was 672 thousand tonnes, 791 thousandtonnes and 696 thousand tonnes respectively.(b) Year ended 31st March following that stated
World Total (rounded off) 13800 13700 13300
China 4710 4300e 4100
Peru 1337 1473 1475
Australia 885 852 1112
USA 805 774 790e
India*(b) 756 784 723e
Mexico 662 671 662
Bolivia 489 527 520
Kazakhstan 357 345 345
Russia 248 292 315
Canada 301 347 294
Sweden 258 251 238
Other countries 1696 1688 1871
10-16
LEAD & ZINC
According to the ILZSG, consumption of lead inChina decreased by 6% to 4.41 million tonnes in 2015from 4.71 million tonnes in 2014. The decline indomestic lead consumption was attributed to aslowdown in sales of electric bikes in 2015, as wasthe case in 2014, which accounted for about 30% of
annual lead consumption.
Zinc
As per Lead & Zinc Study Group (ILZSG), worldrefined zinc production was 13.17 million tonnes inthe year 2018 which decreased by 2.4% from that ofthe previous year.
China was the largest producer of refined zincwith 5.67 million tonnes in the year 2018 whichcontributed 43% of world refined zinc productionfollowed by Republic of Korea (7%), India (6%),European countries (5%), Canada (5%), Japan &Australia (4% each), etc.
The world consumption of refined zinc was 13.69million tonnes in the year 2018 which is 2% less thanthe previous year. China was the largest refined zincconsuming country with 6.52 million tonnes in 2018which accounted for 48% of world consumptionfollowed by European countries (18%), USA (6%),India (5%) and Republic of Korea (4%), etc.
ILZSG forecasts that world demand for refinedzinc metal is expected to decrease by 0.1% at 13.67million tonnes in 2019 and again rise by 0.9% at 13.80million tonnes in 2020.
To give a generalised view of the developmentin various countries, the country-wise descriptionsourced from latest available publication of MineralsYearbook of 'USGS', 2017 is furnished below.
Australia
Zinc mine production in Australia decreased by5% in 2017 as compared with that of 2016 mainly asresult of several mine closures. Three mines openedin Australia in 2017 and therefore it is expected thatproduction would in 2018. During the second quar-ter of 2017, Auctus Minerals Pty. Ltd, restarted the20,000 tonnes per annum Mungana zinc mine inNorthern Queensland. In September, 2017, Red RiverResources Ltd restarted production at 21,000 tonnesper year from Thalang zinc-copper-lead mine inQueensland. The mine was placed on care-and-main-
tenance status in 2012 and reopened after the pro-cessing plant was refurbished. Minerals and MetalsGroup opened Dugald River zinc mine in Northe west-ern Queensland and commercial production was ex-pected to commence in 2018 at 1,70,000 tonnes peryear.
Canada
Zinc mine production in Canada was 3,44,000tonnes in 2017, 7% more than that in 2016. Produc-tion increased in 2017 owing mostly to an increase inzinc production at Trevali Mining Corp.'s CaribouMine. In October 2017, Coeur Mining Inc. acquiredthe Silvertip silver-zinc- lead mine in British Colum-bia and production was expected to commence inthe first quarter of 2018. Zinc smelter production inCanada was 6,08,000 tonnes in 2017, 12 % less thanthat in 2016. Smelter production decreased mainly asa result of the 9-month strike at Noranda IncomeFund's zinc refinery in Salaberry-de-Valleyfield, Que-bec. The strike was initiated by workers union onFebruary 12, 2017 and ended after unionized workersvoted in favour of a new collective bargaining agree-ment on November 25, 2017. During the strike, thefacility operated at a partial production level, al-
though the reduced rate was not disclosed.
China
Zinc mine production in China decreased by8% in 2017 from that of 2016 to 4.4 million tonnes.According to Beij ing Antaike InformationDevelopment Co. Ltd, decreased production wasattributed to the closure of mines owing to increasedenvironmental protection measures, lower thanexpected production from new mines and a decreasein ore grades. As a result of the decrease in mineproduction, China's net imports of zinc in concentrateincreased by 22% in 2017 to about 2.4 million tonnes.About 60% of China's zinc concentrate imports(gross weight) were sourced from Australia, Peru andRussia.
Zinc metal production in China decreased slightlyin 2017 from that of 2016 to 6.14 million tonnes.Despite the slight production decrease, two smeltersof 1,00,000 tonnes per year capacity opened in China,i.e., Hualian Zinc and Indium Co.'s Hulian zinc smelterin Yunnan Province and Huili Lead and Zinc Co.'sHuili zinc smelter in Sichuan Province. Antaike
10-17
LEAD & ZINC
attributed the decrease in zin smelter production torefinery maintenance, a shortage of zinc concentratesand stricter environmental regulations.
China's net imports of refined zinc increased by67% in 2017 to about 0.66 million tonnes. Increasedimports were attributed to the tight domestic supply.About 66% of China's refined zinc imports weresourced from Australia, Kazakhstan and Spain.
China’s zinc consumption increased in 2017 fromthat of 2016. ILZSG reported a 4% increase in zinc
consumption in 2017 as against 9% increase in 2016.
Cuba
In 2017, construction was completed on theCastellanos lead and zinc mine near Santa Lucia, Pinardel Rio. This was the first new mining project in Cubain more than 20 years. The mine, operated by EmpresaMinera del Caribe, was expected to commencecommercial production during the first half of 2018.Trafigura reported that the mine was expected toramp up through out the year and produce 1,00,000tonnes of zinc concentrate when it reached full
capacity.
PeruZinc mine production in Peru increased by 10%
in 2017 from that of 2016 as a result of increasedproduction at the Antamina copper-zinc mine andthe opening of two mines. Zinc production nearlydoubled at Antamina in 2017 to 3,72,100 tonnesprimarily as a result of increased processing ofcopper-zinc ores and significantly higher zinc gradesand recoveries. Copper and zinc production atAntamina can vary significantly from year to yearowing to the geology of the deposit and the
proportion of copper to copper-zinc ore produced.In 2017, a new mine and a capacity expansion
opened in Peru. In January, Compania de MinasBuenaventura S.A.A. commisioned the 10,000 tonnesper year Tambomayo Mine near Chilcaymarca,Arequipa. In May 2017, Shougang Group Co. Ltdadded 30,000 tonnes per year of capaci ty byreprocessing the tailings at the Marcona Mine nearSan Juan de Marcona. The Company also plannedto produce copper and iron.
Thailand
Zinc mine production ceased in Thailand in 2017after closure of Padaeng Industry Public Co. Ltd.'s
Mae Sod Mine in 2016. The mine closed owing to thedepletion of reserves and ceased operations by theend of 2017. In 2017, zinc metal productiondecreased by 73% from that of 2016. PadaengIndustry's smelter in Tak Province processed theremaining zinc concentrate from Mae Sod in 2017and operations at the plant ceased in the secondquarter of 2017. The refinery had a production
capacity of 1,05,000 tonnes per year.
FOREIGN TRADELead
Exports
Exports of lead from the country are in the formof ore & concentrates, lead and alloys & scrap, leadwaste & scrap, lead unrefined , refined leadunwrought, pig lead, lead & alloys worked and others.
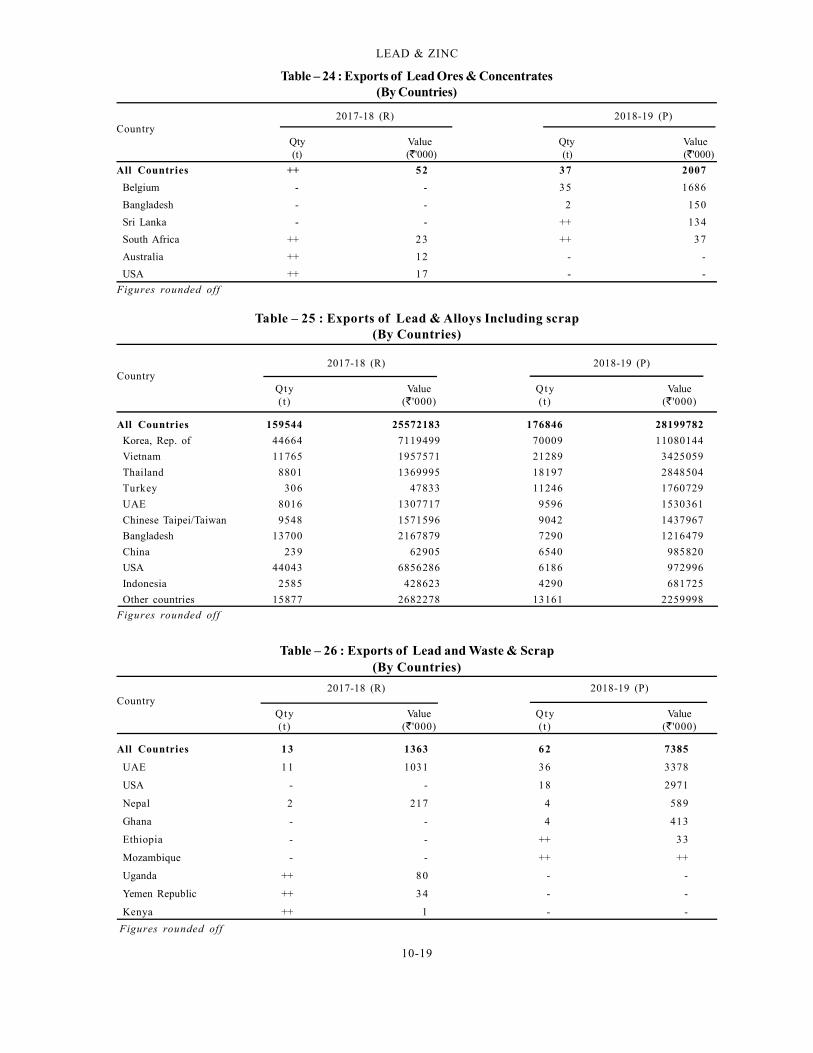
Exports of lead ores and concentrates were37 tonnes in 2018-19 as compared to negligible in2017-18.
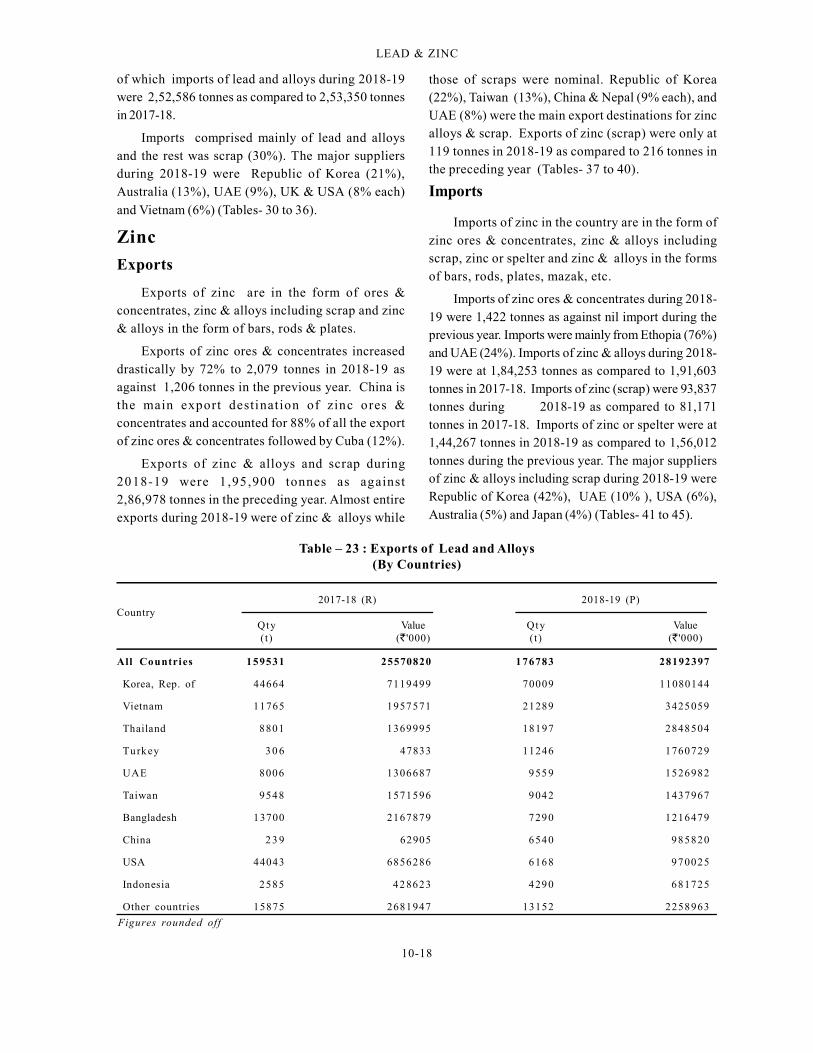
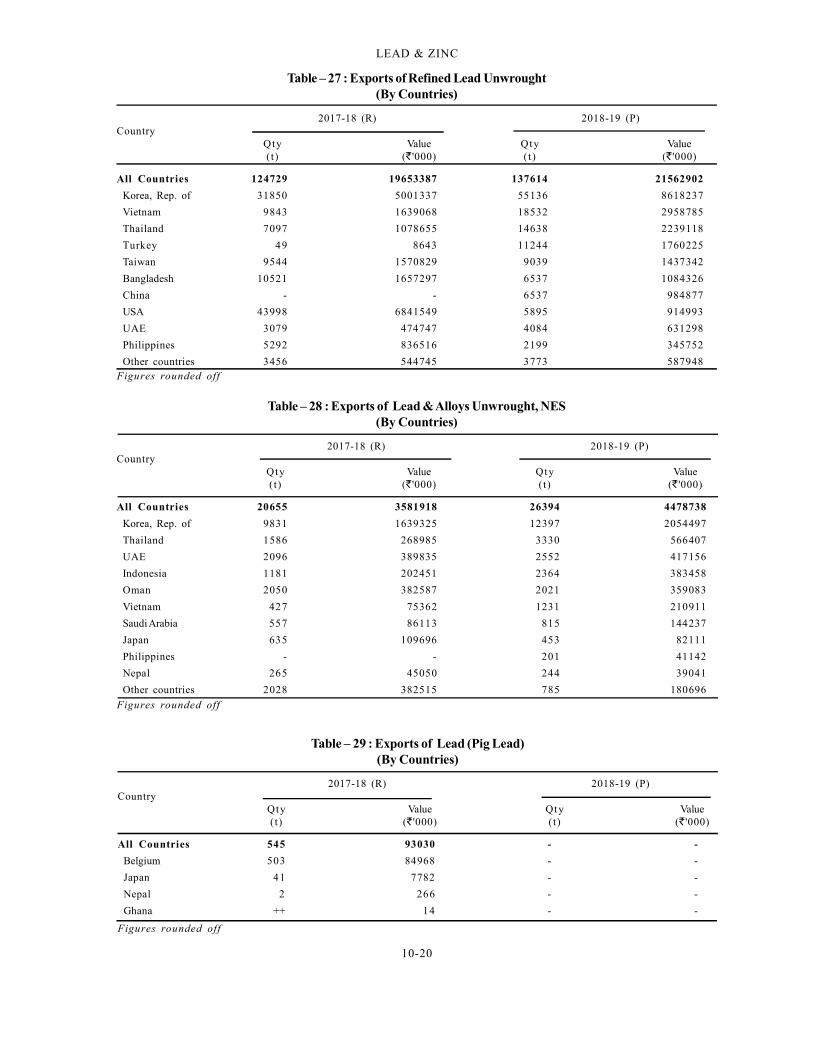
Exports of lead and alloys including scrapincreased to 1,76,846 tonnes during 2018-19 ascompared to 1,59,543 tonnes in the preceding year.Export of lead and alloys also increased by 11%to 1,76,783 tonnes in 2018-19 as compared to1,59,531 tonnes in the previous year. Export ofrefined lead, unwrought also increased by 10% to1,37,614 tonnes in 2018-19 as compared to 1,24,729tonnes in the previous year. Republic of Korea with40% followed by Vietnam (13%) and Thailand (11%)were the major export destinations for refined lead,unwrought (Tables- 23 to 29).
Imports
Imports of lead in India are in the form of leadores & concentrates, lead & alloys including scrap,refined lead/ unwrought, pig lead, refined lead &alloys (bars, rods, plates, etc.), lead unrefined etc.
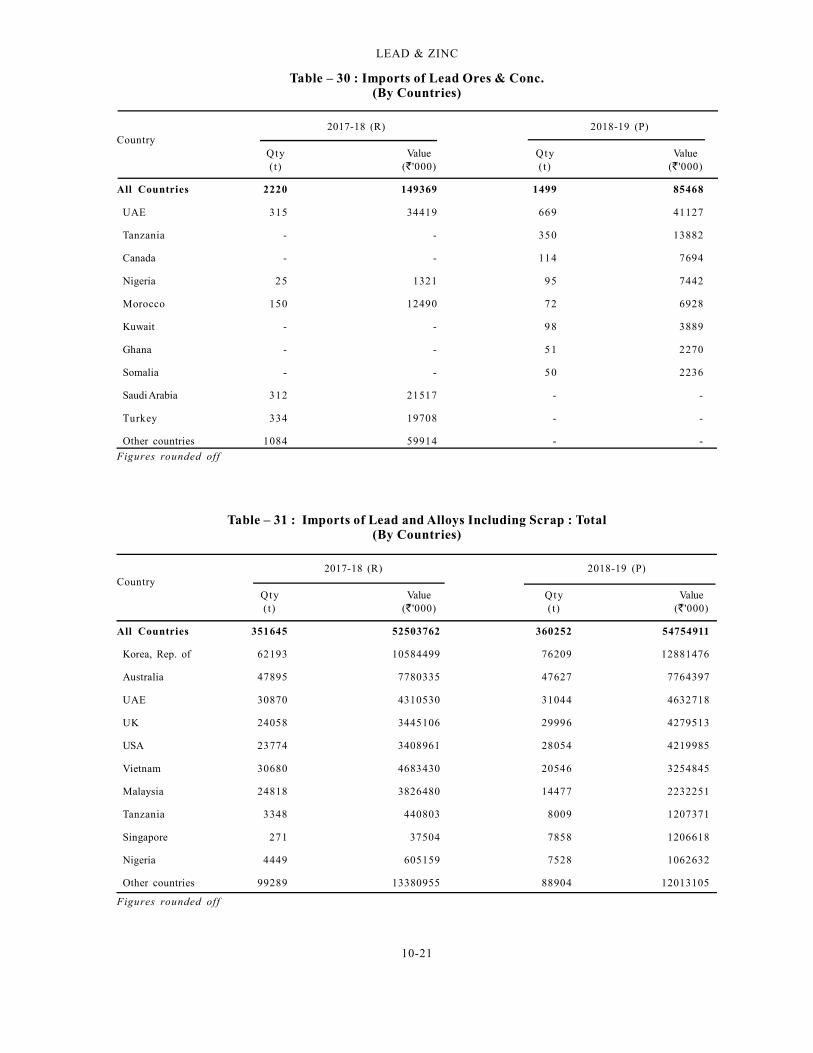
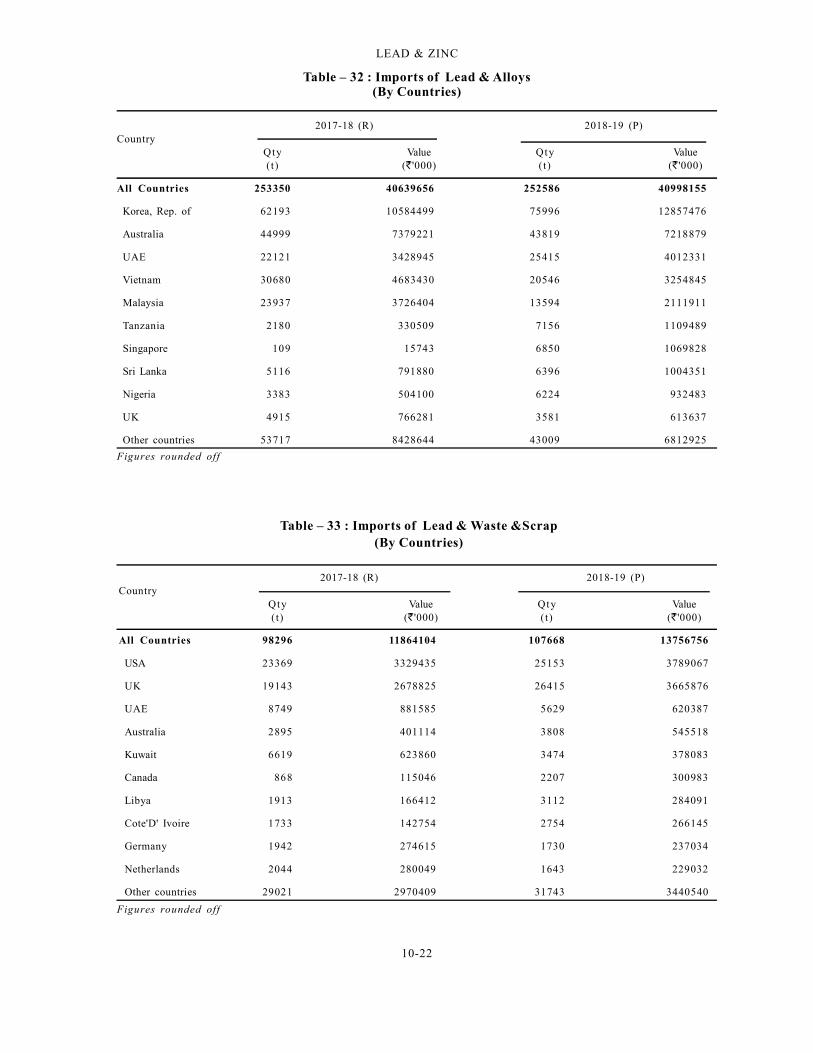
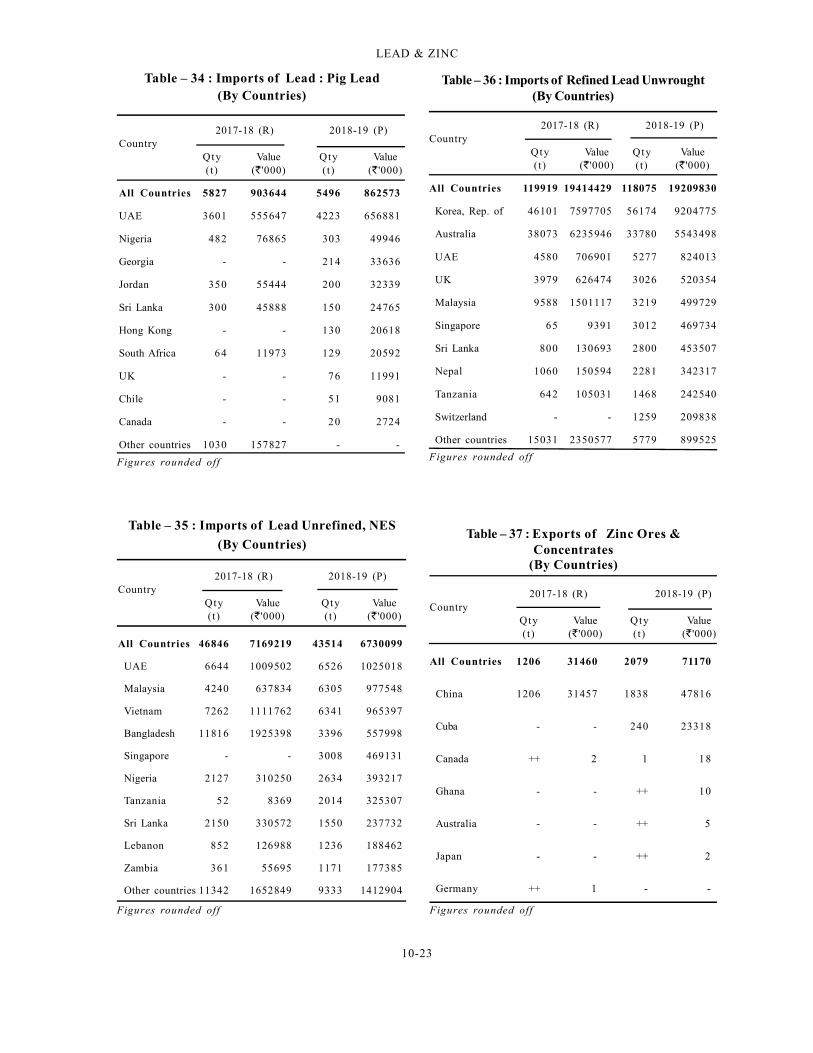
Imports of lead ores & concentrates decreaseddrastically by 32% to 1,499 tonnes in 2018-19 ascompared to 2,220 tonnes in 2017-18. Imports weremainly from UAE (45%), Tanzania (23%), Canada (8%)and Nigeria (6%). The total imports of lead & alloysincluding scrap during 2018-19 was at 3,60,252 tonnesas compared to 3,51,645 tonnes during 2017-18, out
10-18
LEAD & ZINC
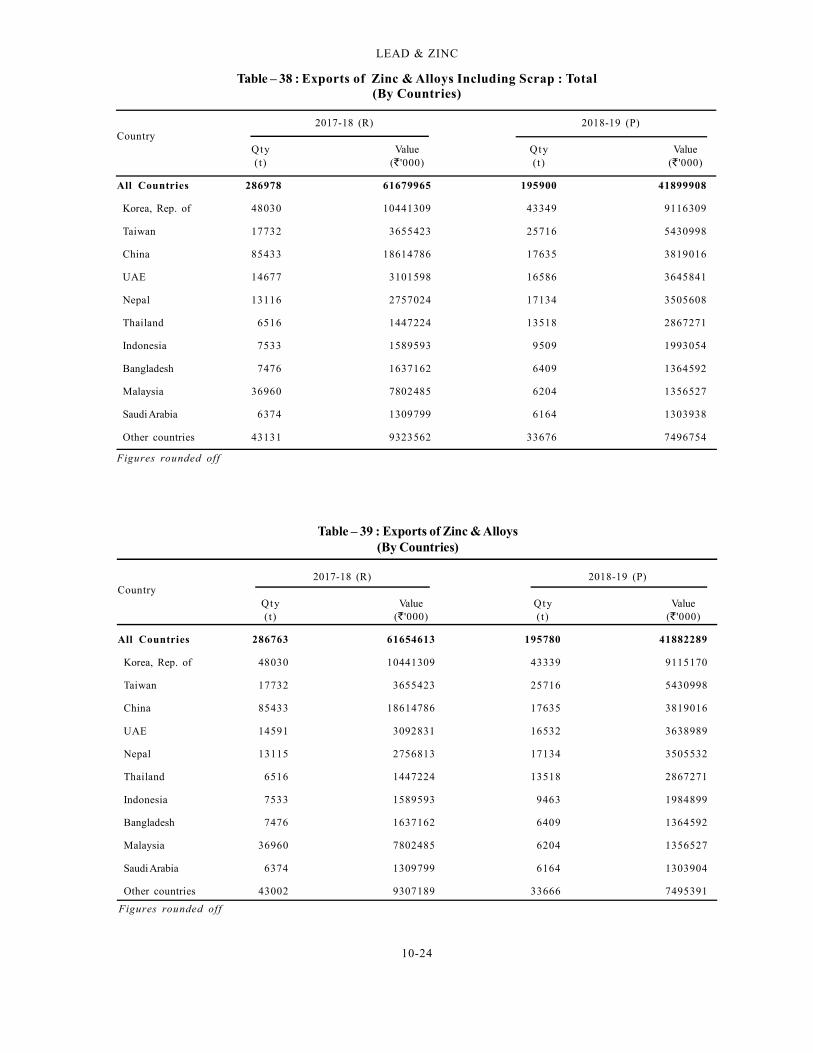
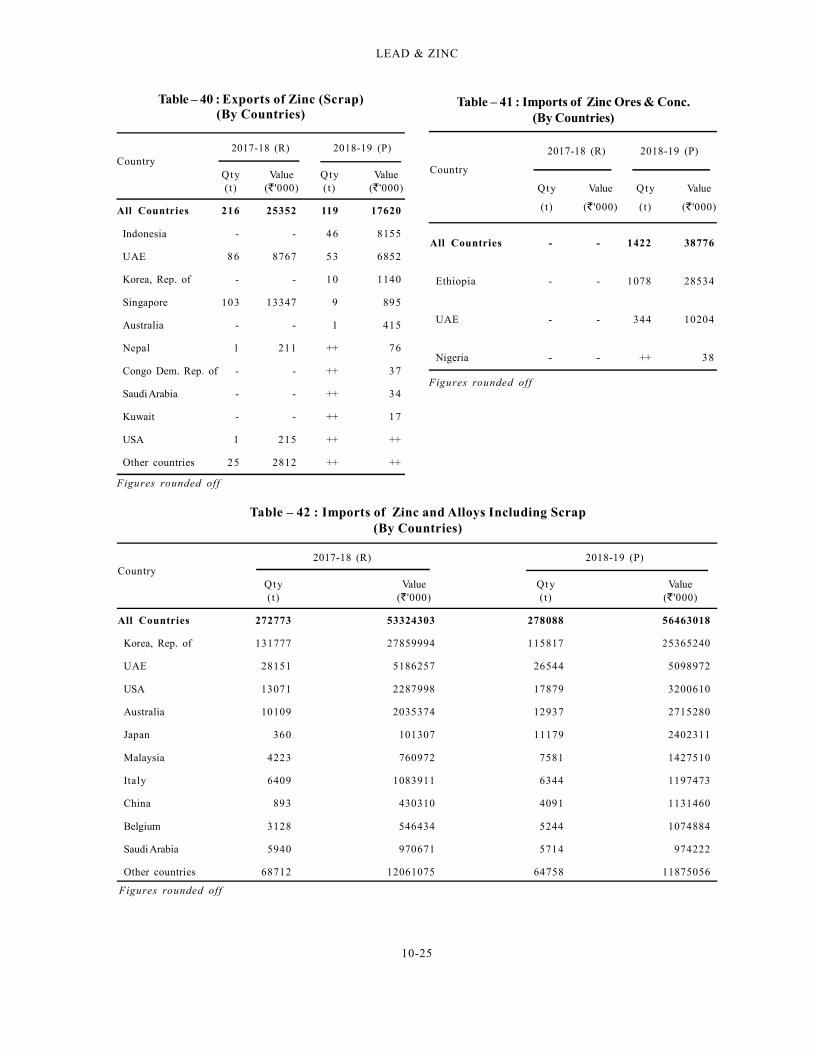
those of scraps were nominal. Republic of Korea(22%), Taiwan (13%), China & Nepal (9% each), andUAE (8%) were the main export destinations for zincalloys & scrap. Exports of zinc (scrap) were only at119 tonnes in 2018-19 as compared to 216 tonnes inthe preceding year (Tables- 37 to 40).
Imports
Imports of zinc in the country are in the form ofzinc ores & concentrates, zinc & alloys includingscrap, zinc or spelter and zinc & alloys in the formsof bars, rods, plates, mazak, etc.
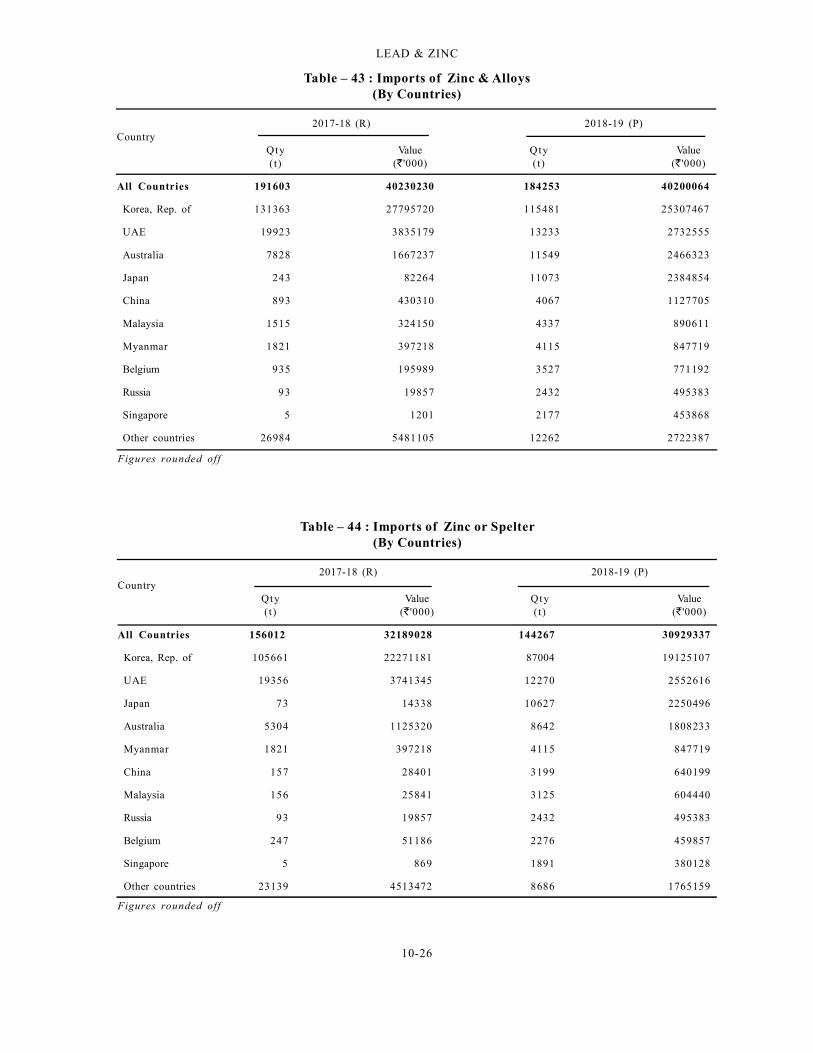
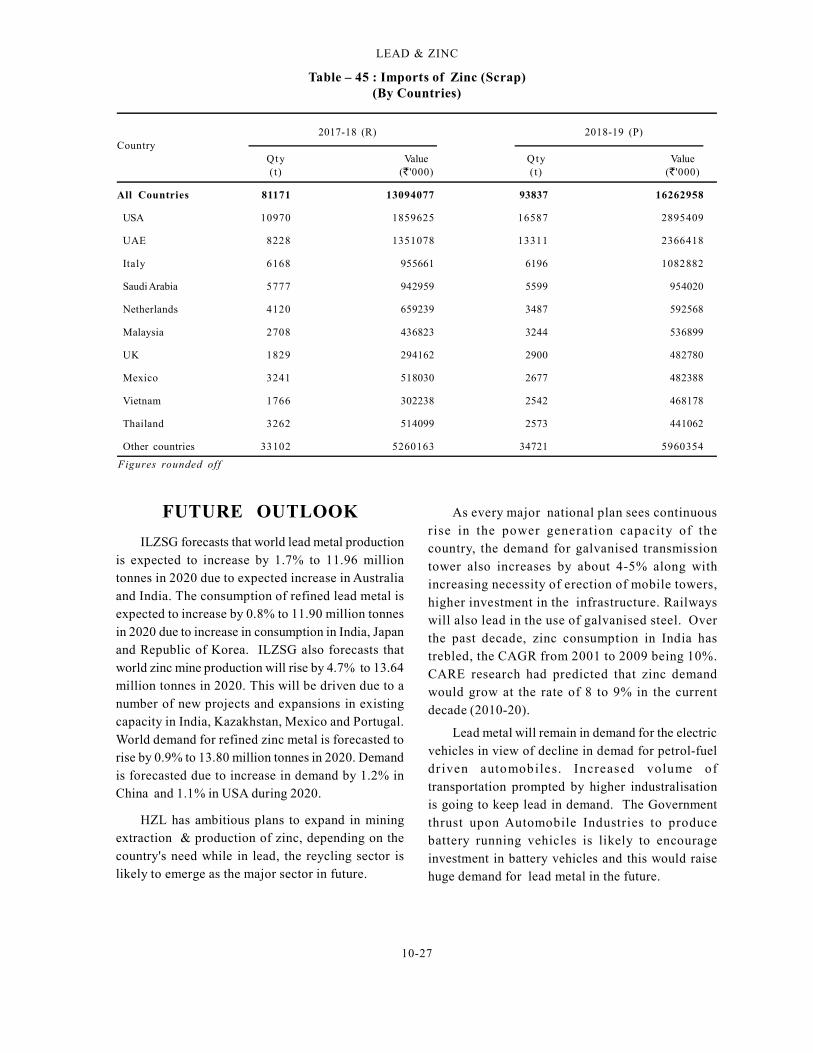
Imports of zinc ores & concentrates during 2018-19 were 1,422 tonnes as against nil import during theprevious year. Imports were mainly from Ethopia (76%)and UAE (24%). Imports of zinc & alloys during 2018-19 were at 1,84,253 tonnes as compared to 1,91,603tonnes in 2017-18. Imports of zinc (scrap) were 93,837tonnes during 2018-19 as compared to 81,171tonnes in 2017-18. Imports of zinc or spelter were at1,44,267 tonnes in 2018-19 as compared to 1,56,012tonnes during the previous year. The major suppliersof zinc & alloys including scrap during 2018-19 wereRepublic of Korea (42%), UAE (10% ), USA (6%),Australia (5%) and Japan (4%) (Tables- 41 to 45).
of which imports of lead and alloys during 2018-19were 2,52,586 tonnes as compared to 2,53,350 tonnesin 2017-18.
Imports comprised mainly of lead and alloysand the rest was scrap (30%). The major suppliersduring 2018-19 were Republic of Korea (21%),Australia (13%), UAE (9%), UK & USA (8% each)
and Vietnam (6%) (Tables- 30 to 36).
Zinc
Exports
Exports of zinc are in the form of ores &concentrates, zinc & alloys including scrap and zinc& alloys in the form of bars, rods & plates.
Exports of zinc ores & concentrates increaseddrastically by 72% to 2,079 tonnes in 2018-19 asagainst 1,206 tonnes in the previous year. China isthe main export destination of zinc ores &concentrates and accounted for 88% of all the exportof zinc ores & concentrates followed by Cuba (12%).
Exports of zinc & alloys and scrap during2018-19 were 1 ,95,900 tonnes as against2,86,978 tonnes in the preceding year. Almost entireexports during 2018-19 were of zinc & alloys while
Table – 23 : Exports of Lead and Alloys(By Countries)
2017-18 (R) 2018-19 (P)Country
Qty Value Qty Value(t) ( '000) (t ) ( '000)
All Countries 159531 25570820 176783 28192397
Korea, Rep. of 44664 7119499 70009 11080144
Vietnam 11765 1957571 21289 3425059
Thailand 8801 1369995 18197 2848504
Turkey 3 0 6 47833 11246 1760729
UAE 8006 1306687 9559 1526982
Taiwan 9548 1571596 9042 1437967
Bangladesh 13700 2167879 7290 1216479
China 2 3 9 62905 6540 985820
USA 44043 6856286 6168 970025
Indonesia 2585 428623 4290 681725
Other countries 15875 2681947 13152 2258963
Figures rounded off
10-19
LEAD & ZINC
Table – 24 : Exports of Lead Ores & Concentrates(By Countries)
2017-18 (R) 2018-19 (P)Country
Qty Value Qty Value (t) ( '000) (t) ( '000)
All Countries ++ 52 37 2007
Belgium - - 35 1686
Bangladesh - - 2 150
Sri Lanka - - ++ 134
South Africa ++ 23 ++ 37
Australia ++ 12 - -
USA ++ 17 - -
Figures rounded off
Table – 25 : Exports of Lead & Alloys Including scrap(By Countries)
2017-18 (R) 2018-19 (P)Country
Qty Value Qty Value(t) ( '000) (t) ( '000)
All Countries 159544 25572183 176846 28199782
Korea, Rep. of 44664 7119499 70009 11080144
Vietnam 11765 1957571 21289 3425059
Thailand 8801 1369995 18197 2848504
Turkey 306 47833 11246 1760729
UAE 8016 1307717 9596 1530361
Chinese Taipei/Taiwan 9548 1571596 9042 1437967
Bangladesh 13700 2167879 7290 1216479
China 239 62905 6540 985820
USA 44043 6856286 6186 972996
Indonesia 2585 428623 4290 681725
Other countries 15877 2682278 13161 2259998
Figures rounded off
Table – 26 : Exports of Lead and Waste & Scrap(By Countries)
2017-18 (R) 2018-19 (P)Country
Qty Value Qty Value(t) ( '000) (t) ( '000)
All Countries 13 1363 62 7385
UAE 11 1031 36 3378
USA - - 18 2971
Nepal 2 217 4 589
Ghana - - 4 413
Ethiopia - - ++ 33
Mozambique - - ++ ++
Uganda ++ 80 - -
Yemen Republic ++ 34 - -
Kenya ++ 1 - -
Figures rounded off
10-20
LEAD & ZINC
Table – 28 : Exports of Lead & Alloys Unwrought, NES(By Countries)
2017-18 (R) 2018-19 (P)Country
Qty Value Qty Value(t) ( '000) (t) ( '000)
All Countries 20655 3581918 26394 4478738
Korea, Rep. of 9831 1639325 12397 2054497
Thailand 1586 268985 3330 566407
UAE 2096 389835 2552 417156
Indonesia 1181 202451 2364 383458
Oman 2050 382587 2021 359083
Vietnam 427 75362 1231 210911
Saudi Arabia 557 86113 815 144237
Japan 635 109696 453 82111
Philippines - - 201 41142
Nepal 265 45050 244 39041
Other countries 2028 382515 785 180696
Figures rounded off
Table – 29 : Exports of Lead (Pig Lead)(By Countries)
2017-18 (R) 2018-19 (P)Country
Qty Value Qty Value(t) ( '000) (t) ( '000)
All Countries 545 93030 - -
Belgium 503 84968 - -
Japan 41 7782 - -
Nepal 2 266 - -
Ghana ++ 14 - -
Figures rounded off
Table – 27 : Exports of Refined Lead Unwrought(By Countries)
2017-18 (R) 2018-19 (P)Country
Qty Value Qty Value(t) ( '000) (t ) ( '000)
All Countries 124729 19653387 137614 21562902
Korea, Rep. of 31850 5001337 55136 8618237
Vietnam 9843 1639068 18532 2958785
Thailand 7097 1078655 14638 2239118
Turkey 49 8643 11244 1760225
Taiwan 9544 1570829 9039 1437342
Bangladesh 10521 1657297 6537 1084326
China - - 6537 984877
USA 43998 6841549 5895 914993
UAE 3079 474747 4084 631298
Philippines 5292 836516 2199 345752
Other countries 3456 544745 3773 587948Figures rounded off
10-21
LEAD & ZINC
Table – 30 : Imports of Lead Ores & Conc.(By Countries)
2017-18 (R) 2018-19 (P)Country
Qty Value Qty Value(t) ( '000) (t) ( '000)
All Countries 2220 149369 1499 85468
UAE 315 34419 669 41127
Tanzania - - 350 13882
Canada - - 114 7694
Nigeria 25 1321 95 7442
Morocco 150 12490 72 6928
Kuwait - - 98 3889
Ghana - - 51 2270
Somalia - - 50 2236
Saudi Arabia 312 21517 - -
Turkey 334 19708 - -
Other countries 1084 59914 - -
Figures rounded off
Table – 31 : Imports of Lead and Alloys Including Scrap : Total(By Countries)
2017-18 (R) 2018-19 (P)Country
Qty Value Qty Value(t) ( '000) (t) ( '000)
All Countries 351645 52503762 360252 54754911
Korea, Rep. of 62193 10584499 76209 12881476
Australia 47895 7780335 47627 7764397
UAE 30870 4310530 31044 4632718
UK 24058 3445106 29996 4279513
USA 23774 3408961 28054 4219985
Vietnam 30680 4683430 20546 3254845
Malaysia 24818 3826480 14477 2232251
Tanzania 3348 440803 8009 1207371
Singapore 271 37504 7858 1206618
Nigeria 4449 605159 7528 1062632
Other countries 99289 13380955 88904 12013105
Figures rounded off
10-22
LEAD & ZINC
Table – 32 : Imports of Lead & Alloys(By Countries)
2017-18 (R) 2018-19 (P)Country
Qty Value Qty Value(t) ( '000) (t) ( '000)
All Countries 253350 40639656 252586 40998155
Korea, Rep. of 62193 10584499 75996 12857476
Australia 44999 7379221 43819 7218879
UAE 22121 3428945 25415 4012331
Vietnam 30680 4683430 20546 3254845
Malaysia 23937 3726404 13594 2111911
Tanzania 2180 330509 7156 1109489
Singapore 109 15743 6850 1069828
Sri Lanka 5116 791880 6396 1004351
Nigeria 3383 504100 6224 932483
UK 4915 766281 3581 613637
Other countries 53717 8428644 43009 6812925
Figures rounded off
Table – 33 : Imports of Lead & Waste &Scrap(By Countries)
2017-18 (R) 2018-19 (P)Country
Qty Value Qty Value(t) ( '000) (t) ( '000)
All Countries 98296 11864104 107668 13756756
USA 23369 3329435 25153 3789067
UK 19143 2678825 26415 3665876
UAE 8749 881585 5629 620387
Australia 2895 401114 3808 545518
Kuwait 6619 623860 3474 378083
Canada 868 115046 2207 300983
Libya 1913 166412 3112 284091
Cote'D' Ivoire 1733 142754 2754 266145
Germany 1942 274615 1730 237034
Netherlands 2044 280049 1643 229032
Other countries 29021 2970409 31743 3440540
Figures rounded off
10-23
LEAD & ZINC
Table – 34 : Imports of Lead : Pig Lead(By Countries)
2017-18 (R) 2018-19 (P)Country
Qty Value Qty Value(t) ( '000) (t) ( '000)
All Countries 5827 903644 5496 862573
UAE 3601 555647 4223 656881
Nigeria 482 76865 303 49946
Georgia - - 214 33636
Jordan 350 55444 200 32339
Sri Lanka 300 45888 150 24765
Hong Kong - - 130 20618
South Africa 64 11973 129 20592
UK - - 76 11991
Chile - - 51 9081
Canada - - 20 2724
Other countries 1030 157827 - -
Figures rounded off
Table – 35 : Imports of Lead Unrefined, NES
(By Countries)
2017-18 (R) 2018-19 (P)Country
Qty Value Qty Value(t) ( '000) (t) ( '000)
All Countries 46846 7169219 43514 6730099
UAE 6644 1009502 6526 1025018
Malaysia 4240 637834 6305 977548
Vietnam 7262 1111762 6341 965397
Bangladesh 11816 1925398 3396 557998
Singapore - - 3008 469131
Nigeria 2127 310250 2634 393217
Tanzania 52 8369 2014 325307
Sri Lanka 2150 330572 1550 237732
Lebanon 852 126988 1236 188462
Zambia 361 55695 1171 177385
Other countries 11342 1652849 9333 1412904
Figures rounded off
Table – 36 : Imports of Refined Lead Unwrought(By Countries)
2017-18 (R) 2018-19 (P)Country
Qty Value Qty Value(t) ( '000) (t) ( '000)
All Countries 119919 19414429 118075 19209830
Korea, Rep. of 46101 7597705 56174 9204775
Australia 38073 6235946 33780 5543498
UAE 4580 706901 5277 824013
UK 3979 626474 3026 520354
Malaysia 9588 1501117 3219 499729
Singapore 65 9391 3012 469734
Sri Lanka 800 130693 2800 453507
Nepal 1060 150594 2281 342317
Tanzania 642 105031 1468 242540
Switzerland - - 1259 209838
Other countries 15031 2350577 5779 899525
Figures rounded off
Table – 37 : Exports of Zinc Ores &Concentrates
(By Countries)
2017-18 (R) 2018-19 (P)Country
Qty Value Qty Value(t) ( '000) (t) ( '000)
All Countries 1206 31460 2079 71170
China 1206 31457 1838 47816
Cuba - - 240 23318
Canada ++ 2 1 18
Ghana - - ++ 10
Australia - - ++ 5
Japan - - ++ 2
Germany ++ 1 - -
Figures rounded off
10-24
LEAD & ZINC
Table – 38 : Exports of Zinc & Alloys Including Scrap : Total(By Countries)
2017-18 (R) 2018-19 (P)Country
Qty Value Qty Value(t) ( '000) (t) ( '000)
All Countries 286978 61679965 195900 41899908
Korea, Rep. of 48030 10441309 43349 9116309
Taiwan 17732 3655423 25716 5430998
China 85433 18614786 17635 3819016
UAE 14677 3101598 16586 3645841
Nepal 13116 2757024 17134 3505608
Thailand 6516 1447224 13518 2867271
Indonesia 7533 1589593 9509 1993054
Bangladesh 7476 1637162 6409 1364592
Malaysia 36960 7802485 6204 1356527
Saudi Arabia 6374 1309799 6164 1303938
Other countries 43131 9323562 33676 7496754
Figures rounded off
Table – 39 : Exports of Zinc & Alloys(By Countries)
2017-18 (R) 2018-19 (P)Country
Qty Value Qty Value(t) ( '000) (t) ( '000)
All Countries 286763 61654613 195780 41882289
Korea, Rep. of 48030 10441309 43339 9115170
Taiwan 17732 3655423 25716 5430998
China 85433 18614786 17635 3819016
UAE 14591 3092831 16532 3638989
Nepal 13115 2756813 17134 3505532
Thailand 6516 1447224 13518 2867271
Indonesia 7533 1589593 9463 1984899
Bangladesh 7476 1637162 6409 1364592
Malaysia 36960 7802485 6204 1356527
Saudi Arabia 6374 1309799 6164 1303904
Other countries 43002 9307189 33666 7495391
Figures rounded off
10-25
LEAD & ZINC
Table – 40 : Exports of Zinc (Scrap)(By Countries)
2017-18 (R) 2018-19 (P)Country
Qty Value Qty Value(t) ( '000) (t) ( '000)
All Countries 216 25352 119 17620
Indonesia - - 46 8155
UAE 86 8767 53 6852
Korea, Rep. of - - 10 1140
Singapore 103 13347 9 895
Australia - - 1 415
Nepal 1 211 ++ 76
Congo Dem. Rep. of - - ++ 37
Saudi Arabia - - ++ 34
Kuwait - - ++ 17
USA 1 215 ++ ++
Other countries 25 2812 ++ ++
Figures rounded off
Table – 42 : Imports of Zinc and Alloys Including Scrap(By Countries)
2017-18 (R) 2018-19 (P)Country
Qty Value Qty Value(t) ( '000) (t) ( '000)
All Countries 272773 53324303 278088 56463018
Korea, Rep. of 131777 27859994 115817 25365240
UAE 28151 5186257 26544 5098972
USA 13071 2287998 17879 3200610
Australia 10109 2035374 12937 2715280
Japan 360 101307 11179 2402311
Malaysia 4223 760972 7581 1427510
Italy 6409 1083911 6344 1197473
China 893 430310 4091 1131460
Belgium 3128 546434 5244 1074884
Saudi Arabia 5940 970671 5714 974222
Other countries 68712 12061075 64758 11875056
Figures rounded off
Table – 41 : Imports of Zinc Ores & Conc.(By Countries)
2017-18 (R) 2018-19 (P)
Country
Qty Value Qty Value
(t) ( '000) (t) ( '000)
All Countries - - 1422 38776
Ethiopia - - 1078 28534
UAE - - 344 10204
Nigeria - - ++ 38
Figures rounded off
10-26
LEAD & ZINC
Table – 43 : Imports of Zinc & Alloys(By Countries)
2017-18 (R) 2018-19 (P)Country
Qty Value Qty Value(t) ( '000) (t) ( '000)
All Countries 191603 40230230 184253 40200064
Korea, Rep. of 131363 27795720 115481 25307467
UAE 19923 3835179 13233 2732555
Australia 7828 1667237 11549 2466323
Japan 243 82264 11073 2384854
China 893 430310 4067 1127705
Malaysia 1515 324150 4337 890611
Myanmar 1821 397218 4115 847719
Belgium 935 195989 3527 771192
Russia 93 19857 2432 495383
Singapore 5 1201 2177 453868
Other countries 26984 5481105 12262 2722387
Figures rounded off
Table – 44 : Imports of Zinc or Spelter(By Countries)
2017-18 (R) 2018-19 (P)Country
Qty Value Qty Value(t) ( '000) (t) ( '000)
All Countries 156012 32189028 144267 30929337
Korea, Rep. of 105661 22271181 87004 19125107
UAE 19356 3741345 12270 2552616
Japan 73 14338 10627 2250496
Australia 5304 1125320 8642 1808233
Myanmar 1821 397218 4115 847719
China 157 28401 3199 640199
Malaysia 156 25841 3125 604440
Russia 93 19857 2432 495383
Belgium 247 51186 2276 459857
Singapore 5 869 1891 380128
Other countries 23139 4513472 8686 1765159
Figures rounded off
10-27
LEAD & ZINC
FUTURE OUTLOOK
ILZSG forecasts that world lead metal productionis expected to increase by 1.7% to 11.96 milliontonnes in 2020 due to expected increase in Australiaand India. The consumption of refined lead metal isexpected to increase by 0.8% to 11.90 million tonnesin 2020 due to increase in consumption in India, Japanand Republic of Korea. ILZSG also forecasts thatworld zinc mine production will rise by 4.7% to 13.64million tonnes in 2020. This will be driven due to anumber of new projects and expansions in existingcapacity in India, Kazakhstan, Mexico and Portugal.World demand for refined zinc metal is forecasted torise by 0.9% to 13.80 million tonnes in 2020. Demandis forecasted due to increase in demand by 1.2% inChina and 1.1% in USA during 2020.
HZL has ambitious plans to expand in miningextraction & production of zinc, depending on thecountry's need while in lead, the reycling sector islikely to emerge as the major sector in future.
Table – 45 : Imports of Zinc (Scrap)(By Countries)
2017-18 (R) 2018-19 (P)Country
Qty Value Qty Value(t) ( '000) (t) ( '000)
All Countries 81171 13094077 93837 16262958
USA 10970 1859625 16587 2895409
UAE 8228 1351078 13311 2366418
Italy 6168 955661 6196 1082882
Saudi Arabia 5777 942959 5599 954020
Netherlands 4120 659239 3487 592568
Malaysia 2708 436823 3244 536899
UK 1829 294162 2900 482780
Mexico 3241 518030 2677 482388
Vietnam 1766 302238 2542 468178
Thailand 3262 514099 2573 441062
Other countries 33102 5260163 34721 5960354
Figures rounded off
As every major national plan sees continuousrise in the power generation capacity of thecountry, the demand for galvanised transmissiontower also increases by about 4-5% along withincreasing necessity of erection of mobile towers,higher investment in the infrastructure. Railwayswill also lead in the use of galvanised steel. Overthe past decade, zinc consumption in India hastrebled, the CAGR from 2001 to 2009 being 10%.CARE research had predicted that zinc demandwould grow at the rate of 8 to 9% in the currentdecade (2010-20).
Lead metal will remain in demand for the electricvehicles in view of decline in demad for petrol-fueldr iven automobiles. Increased volume oftransportation prompted by higher industralisationis going to keep lead in demand. The Governmentthrust upon Automobile Industries to producebattery running vehicles is likely to encourageinvestment in battery vehicles and this would raisehuge demand for lead metal in the future.
Related Documents


