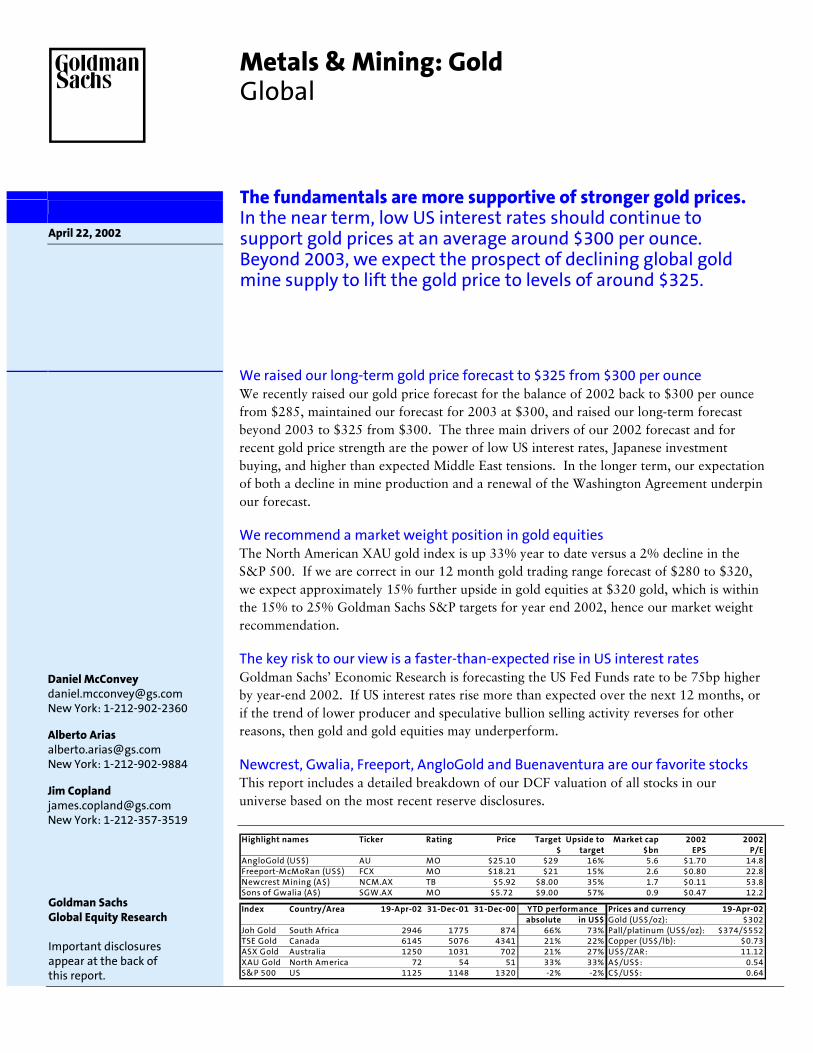
April 22, 2002 Metals & Mining: Gold Global The fundamentals are more supportive of stronger gold prices. In the near term, low US interest rates should continue to support gold prices at an average around $300 per ounce. Beyond 2003, we expect the prospect of declining global gold mine supply to lift the gold price to levels of around $325. Highlight names Ticker Rating Price Target Upside to Market cap 2002 2002 $ target $bn EPS P/E AngloGold (US$) AU MO $25.10 $29 16% 5.6 $1.70 14.8 Freeport-McMoRan (US$) FCX MO $18.21 $21 15% 2.6 $0.80 22.8 Newcrest Mining (A$) NCM.AX TB $5.92 $8.00 35% 1.7 $0.11 53.8 Sons of Gwalia (A$) SGW.AX MO $5.72 $9.00 57% 0.9 $0.47 12.2 Index Country/Area 19-Apr-02 31-Dec-01 31-Dec-00 Prices and currency 19-Apr-02 absolute in US$ Gold (US$/oz): $302 Joh Gold South Africa 2946 1775 874 66% 73% Pall/platinum (US$/oz): $374/$552 TSE Gold Canada 6145 5076 4341 21% 22% Copper (US$/lb): $0.73 ASX Gold Australia 1250 1031 702 21% 27% US$/ZAR: 11.12 XAU Gold North America 72 54 51 33% 33% A$/US$: 0.54 S&P 500 US 1125 1148 1320 -2% -2% C$/US$: 0.64 YTD performance Daniel McConvey [email protected] New York: 1-212-902-2360 Alberto Arias [email protected] New York: 1-212-902-9884 Jim Copland [email protected] New York: 1-212-357-3519 Goldman Sachs Global Equity Research Important disclosures appear at the back of this report. We raised our long-term gold price forecast to $325 from $300 per ounce We recently raised our gold price forecast for the balance of 2002 back to $300 per ounce from $285, maintained our forecast for 2003 at $300, and raised our long-term forecast beyond 2003 to $325 from $300. The three main drivers of our 2002 forecast and for recent gold price strength are the power of low US interest rates, Japanese investment buying, and higher than expected Middle East tensions. In the longer term, our expectation of both a decline in mine production and a renewal of the Washington Agreement underpin our forecast. We recommend a market weight position in gold equities The North American XAU gold index is up 33% year to date versus a 2% decline in the S&P 500. If we are correct in our 12 month gold trading range forecast of $280 to $320, we expect approximately 15% further upside in gold equities at $320 gold, which is within the 15% to 25% Goldman Sachs S&P targets for year end 2002, hence our market weight recommendation. The key risk to our view is a faster-than-expected rise in US interest rates Goldman Sachs Economic Research is forecasting the US Fed Funds rate to be 75bp higher by year-end 2002. If US interest rates rise more than expected over the next 12 months, or if the trend of lower producer and speculative bullion selling activity reverses for other reasons, then gold and gold equities may underperform. Newcrest, Gwalia, Freeport, AngloGold and Buenaventura are our favorite stocks This report includes a detailed breakdown of our DCF valuation of all stocks in our universe based on the most recent reserve disclosures.

Welcome message from author
This document is posted to help you gain knowledge. Please leave a comment to let me know what you think about it! Share it to your friends and learn new things together.
Transcript
April 22, 2002
Metals & Mining: Gold Global
The fundamentals are more supportive of stronger gold prices. In the near term, low US interest rates should continue to support gold prices at an average around $300 per ounce. Beyond 2003, we expect the prospect of declining global gold mine supply to lift the gold price to levels of around $325.
Highlight names Ticker Rating Price Target Upside to Market cap 2002 2002$ target $bn EPS P/E
AngloGold (US$) AU MO $25.10 $29 16% 5.6 $1.70 14.8Freeport-McMoRan (US$) FCX MO $18.21 $21 15% 2.6 $0.80 22.8Newcrest Mining (A$) NCM.AX TB $5.92 $8.00 35% 1.7 $0.11 53.8Sons of Gwalia (A$) SGW.AX MO $5.72 $9.00 57% 0.9 $0.47 12.2
Index Country/Area 19-Apr-02 31-Dec-01 31-Dec-00 Prices and currency 19-Apr-02absolute in US$ Gold (US$/oz): $302
Joh Gold South Africa 2946 1775 874 66% 73% Pall/platinum (US$/oz): $374/$552TSE Gold Canada 6145 5076 4341 21% 22% Copper (US$/lb): $0.73ASX Gold Australia 1250 1031 702 21% 27% US$/ZAR: 11.12XAU Gold North America 72 54 51 33% 33% A$/US$: 0.54S&P 500 US 1125 1148 1320 -2% -2% C$/US$: 0.64
YTD performance
Daniel McConvey [email protected] New York: 1-212-902-2360
Alberto Arias [email protected] New York: 1-212-902-9884
Jim Copland [email protected] New York: 1-212-357-3519
Goldman Sachs Global Equity Research Important disclosures appear at the back of this report.
We raised our long-term gold price forecast to $325 from $300 per ounce We recently raised our gold price forecast for the balance of 2002 back to $300 per ounce from $285, maintained our forecast for 2003 at $300, and raised our long-term forecast beyond 2003 to $325 from $300. The three main drivers of our 2002 forecast and for recent gold price strength are the power of low US interest rates, Japanese investment buying, and higher than expected Middle East tensions. In the longer term, our expectation of both a decline in mine production and a renewal of the Washington Agreement underpin our forecast.
We recommend a market weight position in gold equities The North American XAU gold index is up 33% year to date versus a 2% decline in the S&P 500. If we are correct in our 12 month gold trading range forecast of $280 to $320, we expect approximately 15% further upside in gold equities at $320 gold, which is within the 15% to 25% Goldman Sachs S&P targets for year end 2002, hence our market weight recommendation.
The key risk to our view is a faster-than-expected rise in US interest rates Goldman Sachs� Economic Research is forecasting the US Fed Funds rate to be 75bp higher by year-end 2002. If US interest rates rise more than expected over the next 12 months, or if the trend of lower producer and speculative bullion selling activity reverses for other reasons, then gold and gold equities may underperform.
Newcrest, Gwalia, Freeport, AngloGold and Buenaventura are our favorite stocks This report includes a detailed breakdown of our DCF valuation of all stocks in our universe based on the most recent reserve disclosures.

Metals & Mining: Gold Global
Goldman Sachs Global Equity Research
Table of contents
1 Overview: Low US interest rates have improved gold�s outlook
3 The gold supply/demand fundamentals behind our forecast
5 A discussion of some key positives for the gold price 8 The key risks for the gold price 10 The risk we are not bullish enough
11 Sector overview: around 15% further upside for gold equities
13 Valuations: DCF is our preferred valuation methodology 13 DCF valuation 15 Earnings-based valuations 16 Dividends, EV/EBITDA and other valuation metrics 18 Comparison of our companies� hedge positions
20 Risk-reward analysis and qualitative comparison of our universe
27 Company snapshots
28 Barrick Gold Corp.30 Newmont Mining Corp32 Placer Dome Inc.34 Freeport-McMoRan Copper & Gold36 AngloGold Ltd.38 Compañía de Minas Buenaventura40 Ashanti Goldfields Co. Ltd.42 Stillwater Mining Company
44 Teck Cominco Ltd.46 Kinross Gold Corp.48 TVX Gold Inc.50 Echo Bay Mines Ltd.52 Lihir Gold Ltd.54 Newcrest Mining Limited56 Sons of Gwalia Limited
58 Company mine-by-mine valuations
77 Appendix I: A look at gold during key periods in its history 77 A comparison between the late 1970s� and today�s investment demand in
Japan 78 The Gulf War in 1990 78 The long-term capital management crisis in 1998 79 September 11, 2001
81 Appendix II: DCF is our preferred valuation method
The prices in this report are based on the market close of April 19, 2002.
Global Metals & Mining: Gold
Goldman Sachs Global Equity Research 1
Overview: Low US interest rates have improved gold�s outlook
Near term: we forecast an average price of $300 for the rest of 2002 and for 2003
We believe that current gold prices of around $300 are mainly supported by low interest rates. We had underestimated the strength of low interest rates in supporting the gold price. Low rates reduce producer, investor and central banker motivation to sell gold. The reduction in interest rates over 2001 squeezed forward gold sale premiums over spot prices to near 1% from about 5% less than two years ago. In our judgment, this process will continue as long as interest rates stay low. Goldman Sachs is forecasting a 75bp increase in the Federal Funds rate by year-end 2002. In our view, this would not be enough to stop the trend of reduced producer hedging activity and reduced speculative appetite to sell forward the metal at near-$300 gold prices. We believe that roughly a 200bp increase in the federal funds rate or $325 gold prices may be required to entice materially higher levels of hedging.
Longer term: we forecast an average gold price of $325 per ounce beyond 2003
Our expectation of declining mine supply is a key factor in our more positive longer-term outlook for the gold price. In 2001 we estimate gold production from mines was around 2,590 tonnes. Over the course of the next decade we forecast that annual global gold mine production will decline by around 500 to 600 tonnes to just over 2,000 tonnes. Our forecast is based on a bottom-up analysis of the mines operated by companies in our universe, together with Brook Hunt forecast data for the balance of global mine production. The reasons for the decline include the trends towards shorter reserve lives, falling exploration expenditure, unsustainably high mining versus reserve grades, and the limited incremental future gains in efficiency provided by advances in technology. Second, by 2004 we believe that the gold price may benefit from a more focused marketing effort, the seeds of which are now in place. Third, a weaker US dollar would likely be positive for demand because it makes gold less expensive in the currencies of key overseas gold consumers such as India and European countries.
If our gold price outlook is correct, we expect around 15% upside for gold equities
We are recommending a market-weight position in gold stocks for around 15% upside. Our forecast per-ounce gold price range for the next 12 months is $280 to $320 and our one-year target prices are based approximately on a $320 gold price. Historically, each $1 move in the gold price equates generally to a 1% move for the gold equities. This would suggest upside in 2002 of 15% in gold stocks, which represents an XAU of around 82. Our forecast upside for gold equities is within the upside range of the Goldman Sachs US Portfolio Strategy Group�s year-end S&P 500 target of 1300-1425 (approximately 15%-20% upside from current levels).
Based on our revised outlook for the sector, we see the most upside with a one-year outlook for the following stocks in our universe: Australia�s Newcrest Mining, rated TB with a target of A$8, Australia�s Sons of Gwalia, rated MO with a target of A$9.00, Freeport-McMoRan, rated MO with a target of $21, and AngloGold, rated MO with a target of $29.
Metals & Mining: Gold Global
2 Goldman Sachs Global Equity Research
Key risks to our forecast
The key risks include the possibility of higher interest rates, a weak global economy and some renewed talk of central bank sales. (1) Higher interest rates would likely favor producer hedging and speculative selling. (2) A weaker global economy would not help jewelry demand, which currently represents 75% of the market. On the other hand, we believe that gold has been a beneficiary of a jittery general equity market. If confidence in both the economy and the market returned, �defensive� investments like gold equities may lose some attraction for investors. (3) Finally, the market has always been sensitive to official announcements of plans to sell gold.
Investors who do not see further upside for the gold price should be taking some profits at current prices. North American gold stocks are trading stocks at sub-$325/oz gold prices, in our view. At current gold prices and with currently low forward sale premiums for hedgers, there is limited ability for this industry to generate meaningful returns per shareholder dollar invested.
Global Metals & Mining: Gold
Goldman Sachs Global Equity Research 3
The gold supply/demand fundamentals behind our forecast
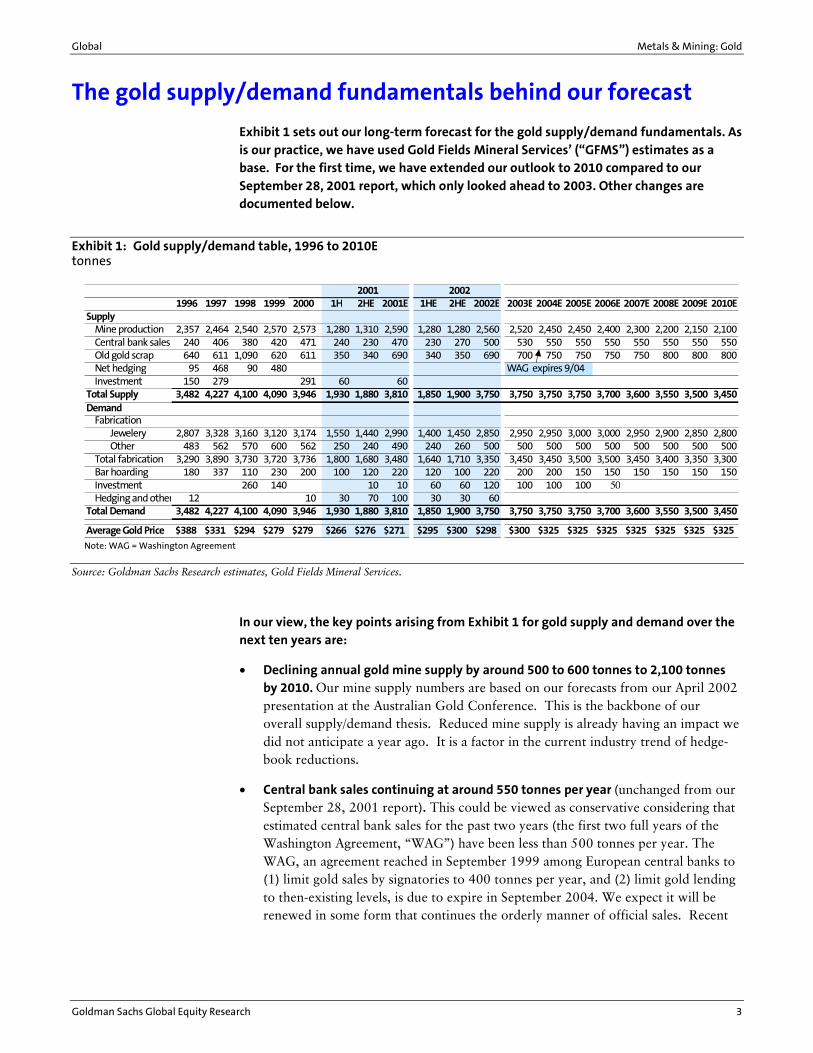
Exhibit 1 sets out our long-term forecast for the gold supply/demand fundamentals. As is our practice, we have used Gold Fields Mineral Services� (�GFMS�) estimates as a base. For the first time, we have extended our outlook to 2010 compared to our September 28, 2001 report, which only looked ahead to 2003. Other changes are documented below.
Exhibit 1: Gold supply/demand table, 1996 to 2010E tonnes
2001 20021996 1997 1998 1999 2000 1H 2HE 2001E 1HE 2HE 2002E 2003E 2004E 2005E 2006E 2007E 2008E 2009E 2010E
SupplyMine production 2,357 2,464 2,540 2,570 2,573 1,280 1,310 2,590 1,280 1,280 2,560 2,520 2,450 2,450 2,400 2,300 2,200 2,150 2,100Central bank sales 240 406 380 420 471 240 230 470 230 270 500 530 550 550 550 550 550 550 550Old gold scrap 640 611 1,090 620 611 350 340 690 340 350 690 700 750 750 750 750 800 800 800Net hedging 95 468 90 480 WAG expires 9/04Investment 150 279 291 60 60
Total Supply 3,482 4,227 4,100 4,090 3,946 1,930 1,880 3,810 1,850 1,900 3,750 3,750 3,750 3,750 3,700 3,600 3,550 3,500 3,450Demand
FabricationJewelery 2,807 3,328 3,160 3,120 3,174 1,550 1,440 2,990 1,400 1,450 2,850 2,950 2,950 3,000 3,000 2,950 2,900 2,850 2,800Other 483 562 570 600 562 250 240 490 240 260 500 500 500 500 500 500 500 500 500
Total fabrication 3,290 3,890 3,730 3,720 3,736 1,800 1,680 3,480 1,640 1,710 3,350 3,450 3,450 3,500 3,500 3,450 3,400 3,350 3,300Bar hoarding 180 337 110 230 200 100 120 220 120 100 220 200 200 150 150 150 150 150 150Investment 260 140 10 10 60 60 120 100 100 100 50Hedging and other 12 10 30 70 100 30 30 60
Total Demand 3,482 4,227 4,100 4,090 3,946 1,930 1,880 3,810 1,850 1,900 3,750 3,750 3,750 3,750 3,700 3,600 3,550 3,500 3,450
Average Gold Price $388 $331 $294 $279 $279 $266 $276 $271 $295 $300 $298 $300 $325 $325 $325 $325 $325 $325 $325 Note: WAG = Washington Agreement
Source: Goldman Sachs Research estimates, Gold Fields Mineral Services.
In our view, the key points arising from Exhibit 1 for gold supply and demand over the next ten years are:
• Declining annual gold mine supply by around 500 to 600 tonnes to 2,100 tonnes by 2010. Our mine supply numbers are based on our forecasts from our April 2002 presentation at the Australian Gold Conference. This is the backbone of our overall supply/demand thesis. Reduced mine supply is already having an impact we did not anticipate a year ago. It is a factor in the current industry trend of hedge-book reductions.
• Central bank sales continuing at around 550 tonnes per year (unchanged from our September 28, 2001 report). This could be viewed as conservative considering that estimated central bank sales for the past two years (the first two full years of the Washington Agreement, �WAG�) have been less than 500 tonnes per year. The WAG, an agreement reached in September 1999 among European central banks to (1) limit gold sales by signatories to 400 tonnes per year, and (2) limit gold lending to then-existing levels, is due to expire in September 2004. We expect it will be renewed in some form that continues the orderly manner of official sales. Recent
Metals & Mining: Gold Global
4 Goldman Sachs Global Equity Research
statements by the German Bundesbank that it is considering gold sales are factored into our long-term view.
• We are forecasting no new net hedging from 2003. We changed our forecast hedging from net supply of 50 tonnes per year in 2001 to 2003 to net demand of 100 tonnes in 2001, 60 tonnes in 2002 and zero thereafter. Hedging can be a source of net supply or net demand to the market. As shown in Exhibit 1, significant levels of gold hedging net supply to the market from 1996 to 1999 put pressure on gold prices. In our view, the turn around in gold prices from 2H2001 was aided by the reduction in producer hedging levels, which was motivated by the decline in the gold forward premiums.
• Our forecast is not bullish on growth in jewelry demand. Since 1997, jewelry demand, which constitutes around 75% of overall gold demand, has been falling despite a drop in the US$ gold price. Demand growth appears stalled without major renewed global GDP growth or favorable spending pattern changes. We are forecasting relatively flat jewelry demand to 2006 at 3,000 tonnes per year, with a modest decline to 2,800 tonnes by 2010. We have lowered our forecast for jewelry demand in 2002 by 200 tonnes to 2,850 tonnes, and in 2003 by 150 tonnes to 2,950 tonnes.
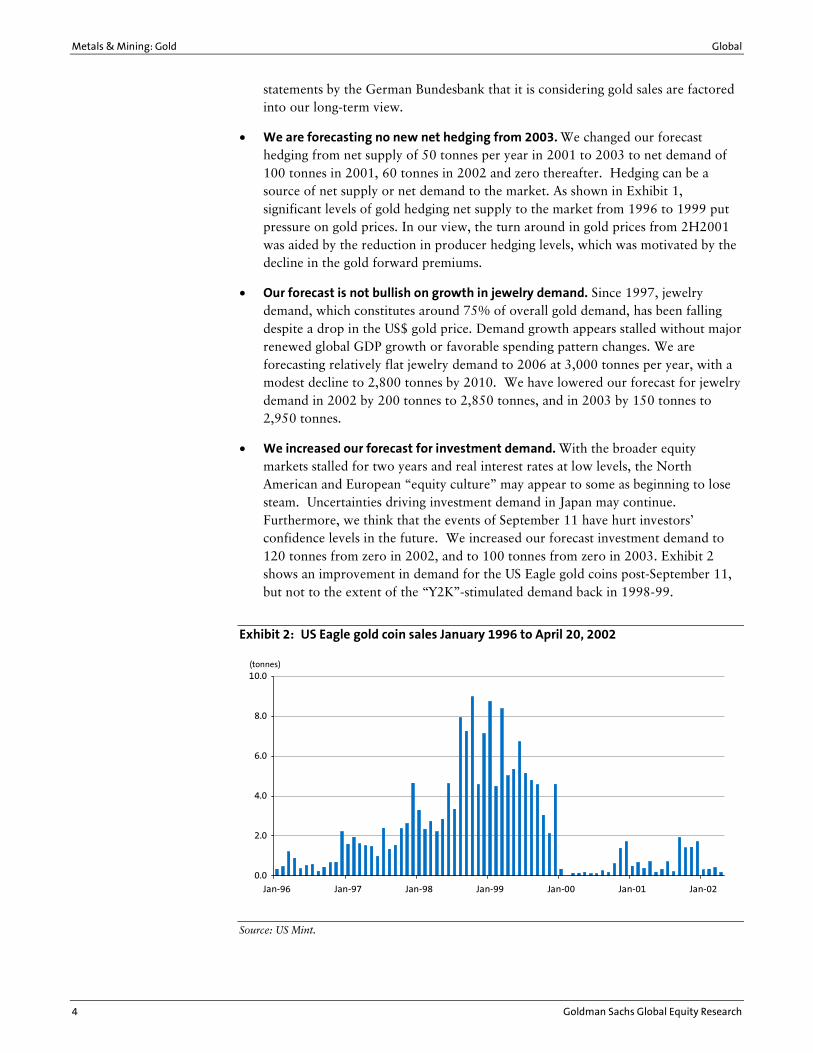
• We increased our forecast for investment demand. With the broader equity markets stalled for two years and real interest rates at low levels, the North American and European �equity culture� may appear to some as beginning to lose steam. Uncertainties driving investment demand in Japan may continue. Furthermore, we think that the events of September 11 have hurt investors� confidence levels in the future. We increased our forecast investment demand to 120 tonnes from zero in 2002, and to 100 tonnes from zero in 2003. Exhibit 2 shows an improvement in demand for the US Eagle gold coins post-September 11, but not to the extent of the �Y2K�-stimulated demand back in 1998-99.
Exhibit 2: US Eagle gold coin sales January 1996 to April 20, 2002
Source: US Mint.
0.0
2.0
4.0
6.0
8.0
10.0
Jan-96 Jan-97 Jan-98 Jan-99 Jan-00 Jan-01 Jan-02
(tonnes)
Global Metals & Mining: Gold
Goldman Sachs Global Equity Research 5
A discussion of some key positives for the gold price
Interest rates
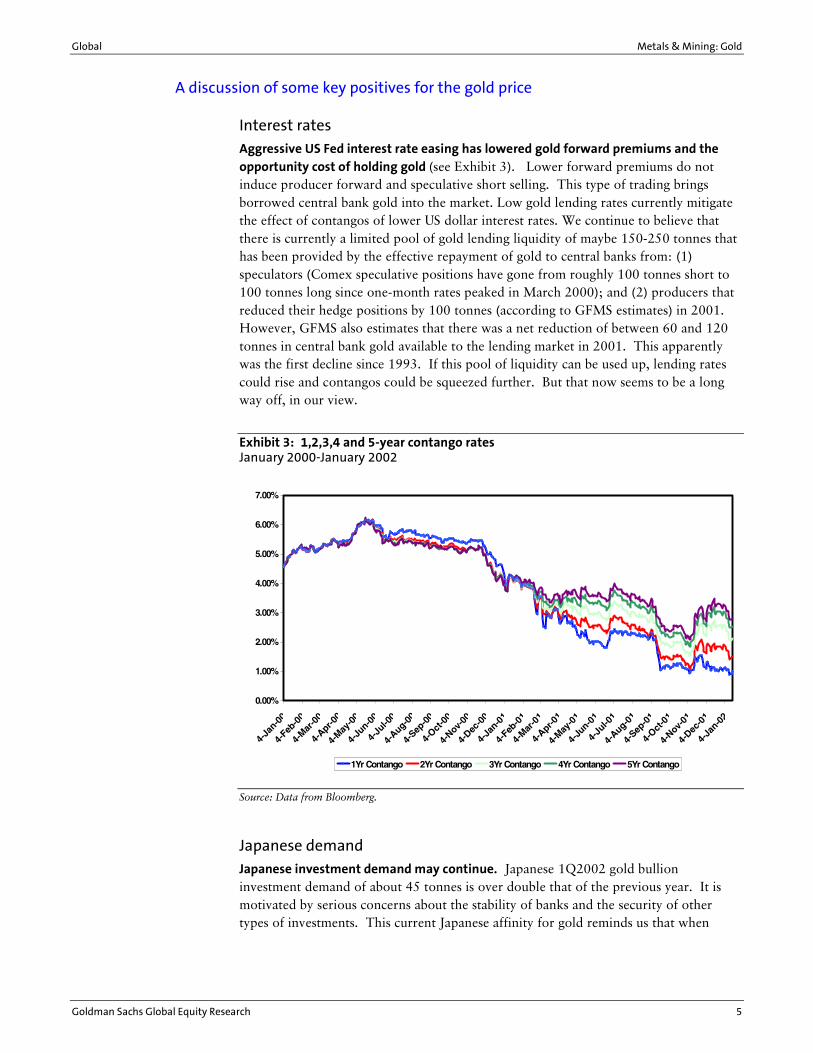
Aggressive US Fed interest rate easing has lowered gold forward premiums and the opportunity cost of holding gold (see Exhibit 3). Lower forward premiums do not induce producer forward and speculative short selling. This type of trading brings borrowed central bank gold into the market. Low gold lending rates currently mitigate the effect of contangos of lower US dollar interest rates. We continue to believe that there is currently a limited pool of gold lending liquidity of maybe 150-250 tonnes that has been provided by the effective repayment of gold to central banks from: (1) speculators (Comex speculative positions have gone from roughly 100 tonnes short to 100 tonnes long since one-month rates peaked in March 2000); and (2) producers that reduced their hedge positions by 100 tonnes (according to GFMS estimates) in 2001. However, GFMS also estimates that there was a net reduction of between 60 and 120 tonnes in central bank gold available to the lending market in 2001. This apparently was the first decline since 1993. If this pool of liquidity can be used up, lending rates could rise and contangos could be squeezed further. But that now seems to be a long way off, in our view.
Exhibit 3: 1,2,3,4 and 5-year contango rates January 2000-January 2002
0.00%
1.00%
2.00%
3.00%
4.00%
5.00%
6.00%
7.00%
4-Ja
n-00
4-Feb
-00
4-Mar
-00
4-Apr-0
0
4-May
-00
4-Ju
n-00
4-Ju
l-00
4-Aug-0
0
4-Sep
-00
4-Oct
-00
4-Nov-
00
4-Dec
-00
4-Ja
n-01
4-Feb
-01
4-Mar
-01
4-Apr-0
1
4-May
-01
4-Ju
n-01
4-Ju
l-01
4-Aug-0
1
4-Sep
-01
4-Oct
-01
4-Nov-
01
4-Dec
-01
4-Ja
n-02
1Yr Contango 2Yr Contango 3Yr Contango 4Yr Contango 5Yr Contango
Source: Data from Bloomberg.
Japanese demand
Japanese investment demand may continue. Japanese 1Q2002 gold bullion investment demand of about 45 tonnes is over double that of the previous year. It is motivated by serious concerns about the stability of banks and the security of other types of investments. This current Japanese affinity for gold reminds us that when
Metals & Mining: Gold Global
6 Goldman Sachs Global Equity Research
systemic fears concerning currency and wealth preservation occur, gold can be a major beneficiary.
Middle East tensions
Middle East tensions have historically been supportive of gold investment demand. We believe that current Middle East tensions have two supportive impacts on the gold market. First, outside the region, it is a supporting factor for investment demand for those worried about international political uncertainty and oil price increases. Second, inside the region, we would not be surprised to see some relative gains for gold investment versus US dollar investment due to possible fears of US government asset freezes if the violence in the region escalates.
Mine supply
We are forecasting that mine supply will fall significantly over the course of this decade. This remains the key fundamental reason why we are bullish on gold bullion prices in the longer term. At $275 to $325 gold prices, our base-case forecast is that mine supply will fall by an average of more than 50 tonnes per year (around 2% per annum) beginning in 2003. Historical graphs of Canadian, US, Australian and South African gold production suggest that, once mine supply starts falling, it falls consistently. We think that the lag between the time of materially higher gold prices and an increase in mine production is about four to six years. In addition, finding, permitting, and financing new mines is growing more, not less, difficult, especially for small and mid-sized producers. While $325 gold prices would improve margins, they are hardly the $400+ levels that supported the massive development of US and Australian deposits from 1986 to 1996. Also, the current 2-3% contangos do not add the profit juice that the 7% forward premiums used to add.
Lower confidence in the US dollar
We believe that a weaker US dollar would likely be a positive for the gold price. For the past 20 years, especially in the 1980s when hedging was less of a factor in the market, there has been a strong inverse correlation between the trade-weighted US dollar and the gold price. Gold is denominated in US dollars. The effect of a strong US dollar relative to the currencies of gold-consuming regions like India and Europe is a higher gold price in the local currency, which all things being equal, is a negative for demand. Conversely, a weakening US dollar may help stimulate demand in those countries.
Looser US fiscal policy may undermine confidence in the US dollar relative to gold. Our views on this front have not materially changed although this is offset by the fact that confidence in US political power and leadership has increased since September 11. The US and western world governments have done an excellent job of keeping markets running and helping to restore confidence in the economy since September 11. However, the lowering of the Fed funds rate to below 2% is something that the Federal Reserve probably did not foresee at the start of 2001. There is a concern that if sub-2% rates and fiscal stimulus measures cannot restore the economy, we may be in a new economic paradigm. Conversely, there is also a possibility, albeit seemingly remote at present, that the economy becomes over-stimulated and inflationary concerns resurface.
Global Metals & Mining: Gold
Goldman Sachs Global Equity Research 7
Given its arguably overly hawkish moves in the summer of 2000 and the depths of the current economic slowdown, the Fed may be unlikely to move quickly to raise interest rates in any medium term economic rebound.
The US-led campaign against terrorism may lead, in the long term, to a more stable world. However, in the medium term there are a lot of uncertainties. There is a motive for those in countries that may find themselves as possible targets of US actions to own assets that cannot be frozen or controlled by the US government.
The acquisition of hedged producers by non-hedgers
Less overall producer hedging is helped by the recent acquisition of hedged producers by non-hedged producers and by other factors. Newmont�s acquisition of Normandy is the most notable transaction in this regard. We think that this is a key factor in the partial unwinding we think is underway of a portion of the 3,000-tonne combined global producer hedge position that has been built up over the past 15-20 years.
Consistency of central bank sales
We continue to feel comfortable with our 550 tonnes-per-year estimate of net central bank sales and wonder if it could be less. Beyond 2004, when the initial term of the WAG expires, the level of European sales would be affected by confidence in currency and in the price of gold. There is risk that selling by WAG signatories may be more than 400 tonnes per annum after 2004. The Bundesbank�s comments on Bloomberg TV in February suggested that Germany will be a seller after 2004. If Germany does sell, we would not be surprised if another of Europe�s large official holders followed.
However, it is important to remember that before the WAG was signed in September 1999, the Swiss and the British had publicly stated their plans to sell over 1,600 tonnes of official gold over the ensuing five years (a rate of over 300 tonnes per year). Both will have completed their selling programs by September 2004. The implication is that if Germany, France and Italy decide not to sell after 2004, the 400 tonne sales quota could actually decrease. We do not expect France to be a seller over the next five years. What the EMU members decide to do with their gold in 2004 will, we think, be largely a function of the gold price and the public�s confidence in money. We do not believe that there will be any early renewal of the WAG. There are too many parties to agree and only the pressure of the final deadline will likely be enough to bring the parties to agreement. In addition, an early agreement would, by definition, remove the flexibility the parties have if circumstances materially change between the timing of such an early agreement and September 2004.
GFMS-reported estimated and forecast official gold sales for 2000 and 2001 are 471 tonnes and 468 tonnes, respectively, and GFMS is forecasting only 231 tonnes in 1H2002. We are surprised by the low estimated level of sales outside of Europe that these estimates imply. We expect those levels to increase. However, these figures support our December 1999 view that the WAG would relax, rather than intensify pressure on central banks outside of Europe to sell gold. As a result of the agreement, there was less concern that a snowballing of official selling would take place.
Metals & Mining: Gold Global
8 Goldman Sachs Global Equity Research
GFMS suggested, in its January 2002 publication, that there has been some central bank buying since September 11. It believes that some official institutions are reassessing their reserve mix in light of feeling potentially threatened by the US government in its zeal to fight the war against terrorism. Our first reaction is that this is temporary but it is possible that it could become a trend.
Consolidation and gold marketing
Consolidation should marginally help reduce mine supply. Consolidation will likely mean less production as the motivation to grow production eases as a company enlarges.
Consolidation may also aid demand through larger marketing efforts. An industry �Gold Marketing Initiative� is closer to a reality. If executed, we believe that higher gold prices are likely. This initiative, spearheaded by Barrick and employing the services of McKinsey and Company consultants, has concluded that if the industry funded the initiative with up to $150 million annually, gold prices could increase by $40 per ounce. We believe these projections are possible. Consolidation in the industry will mean fewer free-riders in any such initiative and thus more willingness of the large producers to fund such a project.
The key risks for the gold price
Medium-term gold forward premium rates are poised to rise with interest rates. This would increase producer propensity to hedge. The Goldman Sachs Economics Group has raised its US GDP growth numbers and is now is forecasting that the Fed Funds Rate will rise by 75bp by year-end 2002. Previously, the group did not see an increase until 2Q2003. It appears interest rates have bottomed and are about to rise and, with it, contangos. We would not be surprised see one- to two-year contango levels nearing 3% within a year�s time.
The global slowdown is negatively impacting jewelry demand. Jewelry demand accounts for around 75% of current gold demand. Jewelry demand does best in periods of rapidly increasing wealth. The US recession looks now to have been short-lived, partly as a result of the 40-year low in the Fed Funds Rate, and rebounding consumer confidence. However, global growth over the next couple of years may be anemic and another downturn is possible. This would not be supportive of higher jewelry demand.
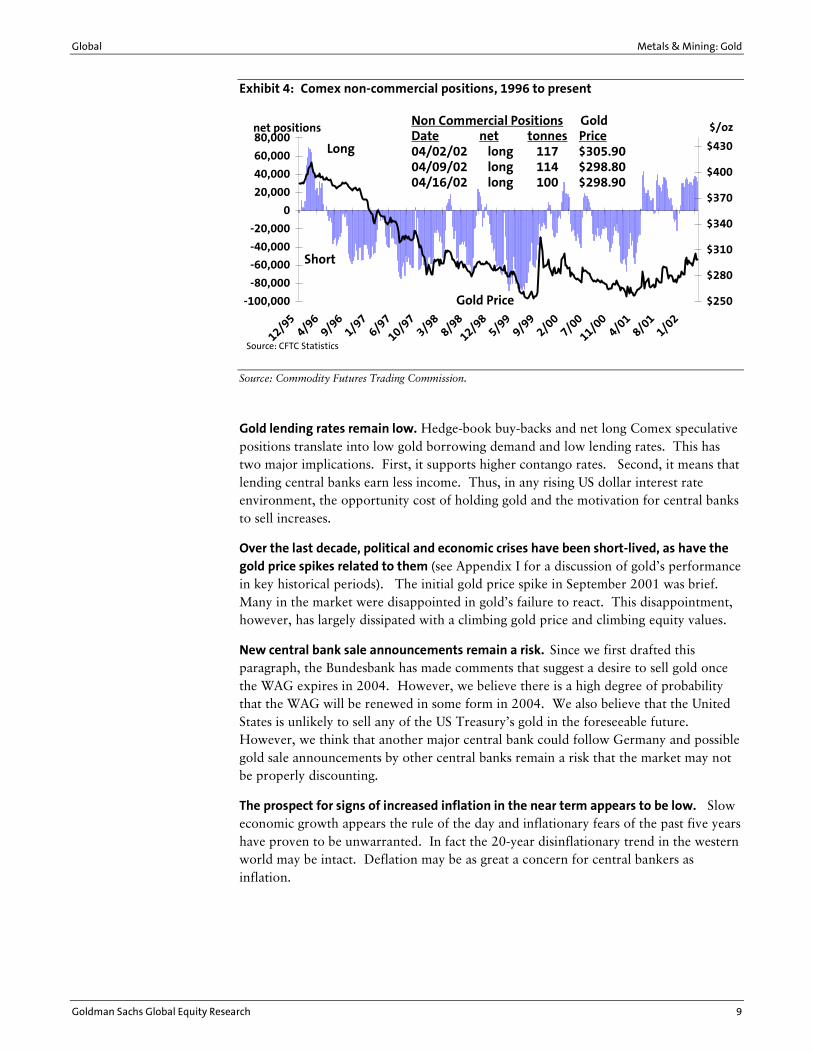
Speculative positions on the Comex are again long as they were in early September. As illustrated Exhibit 4 with the net Comex positions at 100 tonnes long as of April 16, 2002. Should higher interest rates return and/or major bearish news to the gold market occur, these positions could again move significantly to the short side. A 200-tonne swing in these positions amounts to 5% of annual gold supply and we believe could move the gold price $10-$20.
Global Metals & Mining: Gold
Goldman Sachs Global Equity Research 9
Exhibit 4: Comex non-commercial positions, 1996 to present
-100,000
-80,000
-60,000
-40,000
-20,000
0
20,000
40,000
60,000
80,000
12/954/9
69/96
1/976/9
7
10/97
3/988/9
8
12/985/99
9/99
2/00
7/00
11/00
4/01
8/011/02
net positions
$250
$280
$310
$340
$370
$400
$430
$/ozNon Commercial Positions Gold Date net tonnes Price04/02/02 long 117 $305.9004/09/02 long 114 $298.8004/16/02 long 100 $298.90
Short
Long
Gold Price
Source: CFTC Statistics
Source: Commodity Futures Trading Commission.
Gold lending rates remain low. Hedge-book buy-backs and net long Comex speculative positions translate into low gold borrowing demand and low lending rates. This has two major implications. First, it supports higher contango rates. Second, it means that lending central banks earn less income. Thus, in any rising US dollar interest rate environment, the opportunity cost of holding gold and the motivation for central banks to sell increases.
Over the last decade, political and economic crises have been short-lived, as have the gold price spikes related to them (see Appendix I for a discussion of gold�s performance in key historical periods). The initial gold price spike in September 2001 was brief. Many in the market were disappointed in gold�s failure to react. This disappointment, however, has largely dissipated with a climbing gold price and climbing equity values.
New central bank sale announcements remain a risk. Since we first drafted this paragraph, the Bundesbank has made comments that suggest a desire to sell gold once the WAG expires in 2004. However, we believe there is a high degree of probability that the WAG will be renewed in some form in 2004. We also believe that the United States is unlikely to sell any of the US Treasury�s gold in the foreseeable future. However, we think that another major central bank could follow Germany and possible gold sale announcements by other central banks remain a risk that the market may not be properly discounting.
The prospect for signs of increased inflation in the near term appears to be low. Slow economic growth appears the rule of the day and inflationary fears of the past five years have proven to be unwarranted. In fact the 20-year disinflationary trend in the western world may be intact. Deflation may be as great a concern for central bankers as inflation.
Metals & Mining: Gold Global
10 Goldman Sachs Global Equity Research
The risk we are not bullish enough
The chances for an investment-led run-up in the gold price have increased, in our view. We believe that the recent S&P downgrade of Japanese government debt, Japanese investment buying due to security of investment fears, low interest rates, and increased political uncertainty have increased the chances for an investment-led run-up in the gold price to levels higher than we are forecasting. Any significant official buying, albeit still unlikely, could materially improve gold market sentiment. In such a scenario, gold equities could materially outperform the market. Producers leveraged to the gold price would likely continue to be the best performers. In such a scenario, highly hedged companies such as Newcrest and Sons of Gwalia could materially underperform other gold equities.
Declining mine supply may also be risk to the upside. We believe that, in the long term (over the course of this decade), gold prices will rise in excess of our $325 forecast due mainly to more limited mine supply. This could be accelerated by stronger than expected investment demand (Japan being a prime candidate) or news of central bank purchases.
Global Metals & Mining: Gold
Goldman Sachs Global Equity Research 11
Sector overview: around 15% further upside for gold equities
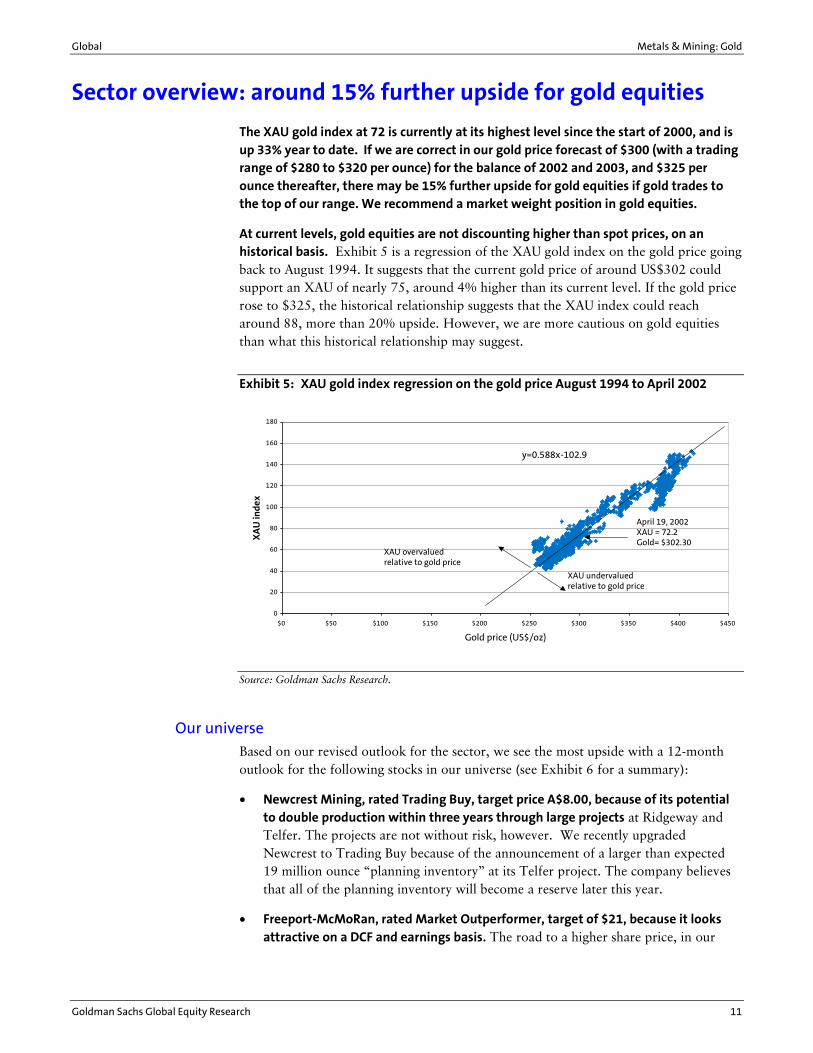
The XAU gold index at 72 is currently at its highest level since the start of 2000, and is up 33% year to date. If we are correct in our gold price forecast of $300 (with a trading range of $280 to $320 per ounce) for the balance of 2002 and 2003, and $325 per ounce thereafter, there may be 15% further upside for gold equities if gold trades to the top of our range. We recommend a market weight position in gold equities.
At current levels, gold equities are not discounting higher than spot prices, on an historical basis. Exhibit 5 is a regression of the XAU gold index on the gold price going back to August 1994. It suggests that the current gold price of around US$302 could support an XAU of nearly 75, around 4% higher than its current level. If the gold price rose to $325, the historical relationship suggests that the XAU index could reach around 88, more than 20% upside. However, we are more cautious on gold equities than what this historical relationship may suggest.
Exhibit 5: XAU gold index regression on the gold price August 1994 to April 2002
0
20
40
60
80
100
120
140
160
180
$0 $50 $100 $150 $200 $250 $300 $350 $400 $450
Gold price (US$/oz)
XA
U in
dex
y=0.588x-102.9
XAU overvaluedrelative to gold price
XAU undervaluedrelative to gold price
April 19, 2002XAU = 72.2Gold= $302.30
Source: Goldman Sachs Research.
Our universe
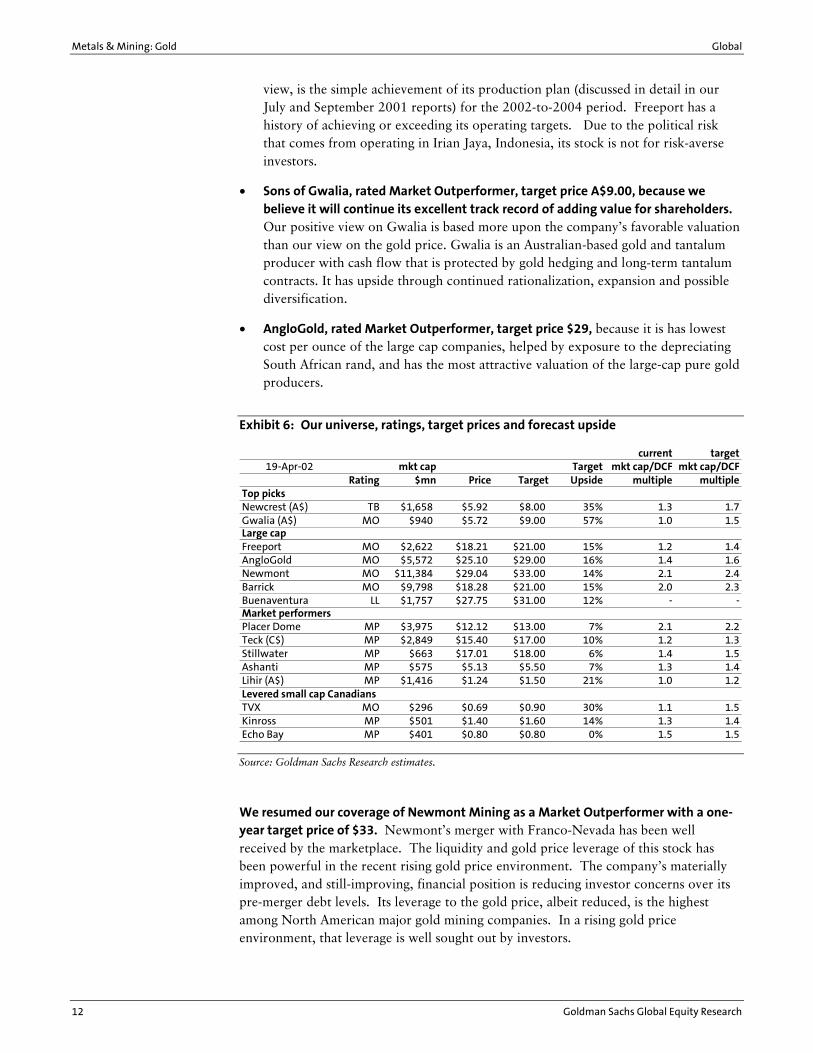
Based on our revised outlook for the sector, we see the most upside with a 12-month outlook for the following stocks in our universe (see Exhibit 6 for a summary):
• Newcrest Mining, rated Trading Buy, target price A$8.00, because of its potential to double production within three years through large projects at Ridgeway and Telfer. The projects are not without risk, however. We recently upgraded Newcrest to Trading Buy because of the announcement of a larger than expected 19 million ounce �planning inventory� at its Telfer project. The company believes that all of the planning inventory will become a reserve later this year.
• Freeport-McMoRan, rated Market Outperformer, target of $21, because it looks attractive on a DCF and earnings basis. The road to a higher share price, in our
Metals & Mining: Gold Global
12 Goldman Sachs Global Equity Research
view, is the simple achievement of its production plan (discussed in detail in our July and September 2001 reports) for the 2002-to-2004 period. Freeport has a history of achieving or exceeding its operating targets. Due to the political risk that comes from operating in Irian Jaya, Indonesia, its stock is not for risk-averse investors.
• Sons of Gwalia, rated Market Outperformer, target price A$9.00, because we believe it will continue its excellent track record of adding value for shareholders. Our positive view on Gwalia is based more upon the company�s favorable valuation than our view on the gold price. Gwalia is an Australian-based gold and tantalum producer with cash flow that is protected by gold hedging and long-term tantalum contracts. It has upside through continued rationalization, expansion and possible diversification.
• AngloGold, rated Market Outperformer, target price $29, because it is has lowest cost per ounce of the large cap companies, helped by exposure to the depreciating South African rand, and has the most attractive valuation of the large-cap pure gold producers.
Exhibit 6: Our universe, ratings, target prices and forecast upside
current target19-Apr-02 mkt cap Target mkt cap/DCF mkt cap/DCF
Rating $mn Price Target Upside multiple multipleTop picksNewcrest (A$) TB $1,658 $5.92 $8.00 35% 1.3 1.7Gwalia (A$) MO $940 $5.72 $9.00 57% 1.0 1.5Large capFreeport MO $2,622 $18.21 $21.00 15% 1.2 1.4AngloGold MO $5,572 $25.10 $29.00 16% 1.4 1.6Newmont MO $11,384 $29.04 $33.00 14% 2.1 2.4Barrick MO $9,798 $18.28 $21.00 15% 2.0 2.3Buenaventura LL $1,757 $27.75 $31.00 12% - -Market performersPlacer Dome MP $3,975 $12.12 $13.00 7% 2.1 2.2Teck (C$) MP $2,849 $15.40 $17.00 10% 1.2 1.3Stillwater MP $663 $17.01 $18.00 6% 1.4 1.5Ashanti MP $575 $5.13 $5.50 7% 1.3 1.4Lihir (A$) MP $1,416 $1.24 $1.50 21% 1.0 1.2Levered small cap CanadiansTVX MO $296 $0.69 $0.90 30% 1.1 1.5Kinross MP $501 $1.40 $1.60 14% 1.3 1.4Echo Bay MP $401 $0.80 $0.80 0% 1.5 1.5
Source: Goldman Sachs Research estimates.
We resumed our coverage of Newmont Mining as a Market Outperformer with a one-year target price of $33. Newmont�s merger with Franco-Nevada has been well received by the marketplace. The liquidity and gold price leverage of this stock has been powerful in the recent rising gold price environment. The company�s materially improved, and still-improving, financial position is reducing investor concerns over its pre-merger debt levels. Its leverage to the gold price, albeit reduced, is the highest among North American major gold mining companies. In a rising gold price environment, that leverage is well sought out by investors.
Global Metals & Mining: Gold
Goldman Sachs Global Equity Research 13
Valuations: DCF is our preferred valuation methodology
Below we examine various commonly used valuations for companies in our universe. Our preferred valuation methodology is discounted cash flow (DCF). We also look at earnings and cash flow based valuations and EV/EBITDA, and market cap per recoverable reserve ounce.
DCF valuation
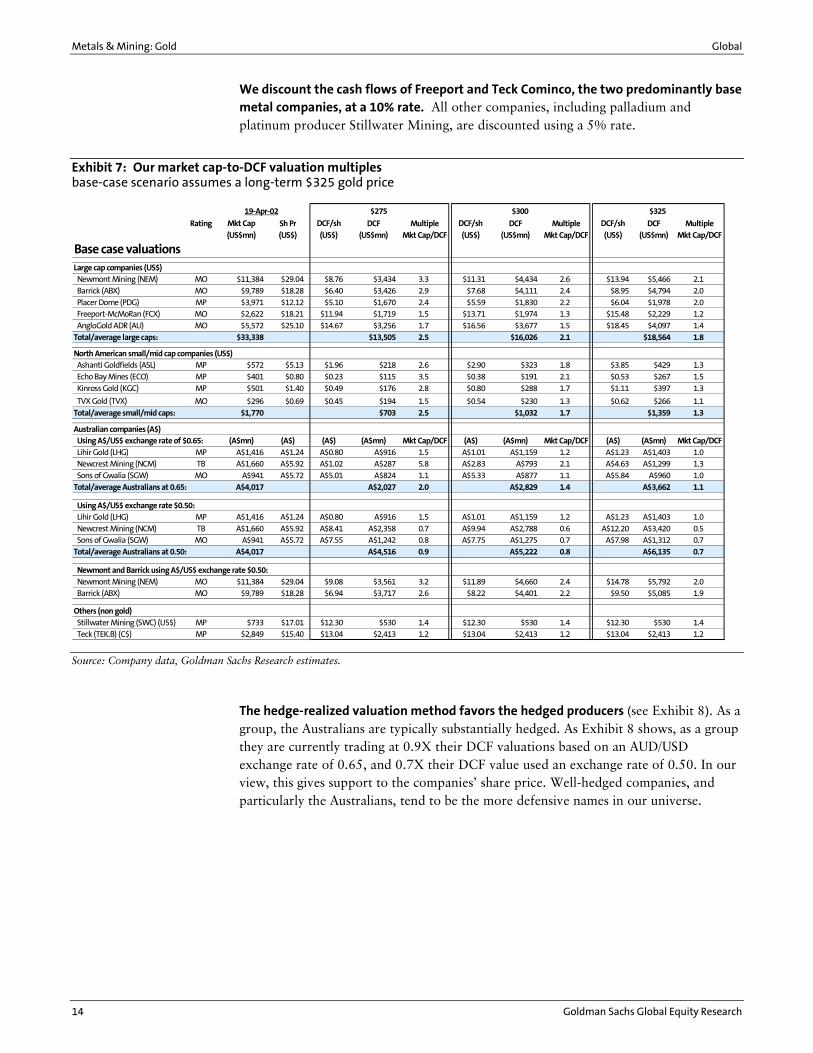
We are introducing a cleaner format for looking at the DCF valuations of our gold companies. This applies for both our �base case� valuation table (Exhibit 7), which uses the marked-to-market value of companies� hedge books, and our �hedge-realized� valuation table (Exhibit 8), which assumes the companies will deliver into their hedge contracts and realize the prices embedded in their books. Our base-case assumptions are a long-term US$ gold price of $325 per ounce, a 5% discount rate and an AUD/USD exchange rate of 0.65.
We have divided the gold companies into three tiers:
• Large caps, each with a market cap of over US$2 billion. These are companies that tend to trade at a higher premium because of their critical mass and quality. Exhibit 7 shows that on average, companies in this group are trading at 1.8X their DCF value. Barrick and Newmont, both approximately $10 billion companies, tend to trade at a significant premium to their peers. As a result of Barrick�s acquisition of Homestake and Newmont�s acquisition of Normandy, Barrick and Newmont now have material exposure to the Australian dollar. Accordingly, we have included (at the bottom of Exhibit 7) sensitivities for Barrick and Newmont at an exchange rate of AUD/USD of 0.50, which is closer to the spot price. Exhibit 7 also shows that Freeport and AngloGold are trading at significant discounts to the group. Although these stocks typically trade at a discount to Barrick and Newmont, largely due to considerations of political risk in Indonesia and South Africa respectively, in our view they represent the best value in this group at current levels.
• Small- to mid-cap North Americans, with market caps below US$1 billion. This group typically trades at lower premium than the large caps, currently trading at 1.3X their DCF value (we include Ghana-based Ashanti in this group because it is a small- to mid-cap company and is most liquid on the New York Stock Exchange). Except for Ashanti, these companies (Kinross, Echo Bay and TVX) are effectively unhedged. This, together with the fact that they also tend to have a higher cost structure per ounce because they are smaller producers, tends to mean their valuations look relatively more attractive at higher gold prices. The flip-side is they tend to look less attractive at lower gold prices, and are less liquid than the large caps.
• The Australians. As with the smaller cap North Americans, the Australians historically trade a discount to the large caps. Their valuations are sensitive to movements in the AUD/USD exchange rate, and accordingly we have included DCF sensitivities at 0.65 and 0.50. As Exhibit 7 shows, valuations are more favorable at the lower exchange rate. The standout name by valuation in this group is Newcrest. Sons of Gwalia also looks attractive, in our view.
Metals & Mining: Gold Global
14 Goldman Sachs Global Equity Research
We discount the cash flows of Freeport and Teck Cominco, the two predominantly base metal companies, at a 10% rate. All other companies, including palladium and platinum producer Stillwater Mining, are discounted using a 5% rate.
Exhibit 7: Our market cap-to-DCF valuation multiples base-case scenario assumes a long-term $325 gold price
Rating Mkt Cap Sh Pr DCF/sh DCF Multiple DCF/sh DCF Multiple DCF/sh DCF Multiple(US$mn) (US$) (US$) (US$mn) Mkt Cap/DCF (US$) (US$mn) Mkt Cap/DCF (US$) (US$mn) Mkt Cap/DCF
Base case valuationsLarge cap companies (US$) Newmont Mining (NEM) MO $11,384 $29.04 $8.76 $3,434 3.3 $11.31 $4,434 2.6 $13.94 $5,466 2.1 Barrick (ABX) MO $9,789 $18.28 $6.40 $3,426 2.9 $7.68 $4,111 2.4 $8.95 $4,794 2.0 Placer Dome (PDG) MP $3,971 $12.12 $5.10 $1,670 2.4 $5.59 $1,830 2.2 $6.04 $1,978 2.0 Freeport-McMoRan (FCX) MO $2,622 $18.21 $11.94 $1,719 1.5 $13.71 $1,974 1.3 $15.48 $2,229 1.2 AngloGold ADR (AU) MO $5,572 $25.10 $14.67 $3,256 1.7 $16.56 $3,677 1.5 $18.45 $4,097 1.4Total/average large caps: $33,338 $13,505 2.5 $16,026 2.1 $18,564 1.8
North American small/mid cap companies (US$) Ashanti Goldfields (ASL) MP $572 $5.13 $1.96 $218 2.6 $2.90 $323 1.8 $3.85 $429 1.3 Echo Bay Mines (ECO) MP $401 $0.80 $0.23 $115 3.5 $0.38 $191 2.1 $0.53 $267 1.5 Kinross Gold (KGC) MP $501 $1.40 $0.49 $176 2.8 $0.80 $288 1.7 $1.11 $397 1.3
TVX Gold (TVX) MO $296 $0.69 $0.45 $194 1.5 $0.54 $230 1.3 $0.62 $266 1.1Total/average small/mid caps: $1,770 $703 2.5 $1,032 1.7 $1,359 1.3
Australian companies (A$) Using A$/US$ exchange rate of $0.65: (A$mn) (A$) (A$) (A$mn) Mkt Cap/DCF (A$) (A$mn) Mkt Cap/DCF (A$) (A$mn) Mkt Cap/DCF Lihir Gold (LHG) MP A$1,416 A$1.24 A$0.80 A$916 1.5 A$1.01 A$1,159 1.2 A$1.23 A$1,403 1.0 Newcrest Mining (NCM) TB A$1,660 A$5.92 A$1.02 A$287 5.8 A$2.83 A$793 2.1 A$4.63 A$1,299 1.3 Sons of Gwalia (SGW) MO A$941 A$5.72 A$5.01 A$824 1.1 A$5.33 A$877 1.1 A$5.84 A$960 1.0Total/average Australians at 0.65: A$4,017 A$2,027 2.0 A$2,829 1.4 A$3,662 1.1
Using A$/US$ exchange rate $0.50: Lihir Gold (LHG) MP A$1,416 A$1.24 A$0.80 A$916 1.5 A$1.01 A$1,159 1.2 A$1.23 A$1,403 1.0 Newcrest Mining (NCM) TB A$1,660 A$5.92 A$8.41 A$2,358 0.7 A$9.94 A$2,788 0.6 A$12.20 A$3,420 0.5 Sons of Gwalia (SGW) MO A$941 A$5.72 A$7.55 A$1,242 0.8 A$7.75 A$1,275 0.7 A$7.98 A$1,312 0.7Total/average Australians at 0.50: A$4,017 A$4,516 0.9 A$5,222 0.8 A$6,135 0.7
Newmont and Barrick using A$/US$ exchange rate $0.50: Newmont Mining (NEM) MO $11,384 $29.04 $9.08 $3,561 3.2 $11.89 $4,660 2.4 $14.78 $5,792 2.0 Barrick (ABX) MO $9,789 $18.28 $6.94 $3,717 2.6 $8.22 $4,401 2.2 $9.50 $5,085 1.9
Others (non gold) Stillwater Mining (SWC) (US$) MP $733 $17.01 $12.30 $530 1.4 $12.30 $530 1.4 $12.30 $530 1.4 Teck (TEK.B) (C$) MP $2,849 $15.40 $13.04 $2,413 1.2 $13.04 $2,413 1.2 $13.04 $2,413 1.2
19-Apr-02 $300 $325$275
Source: Company data, Goldman Sachs Research estimates.
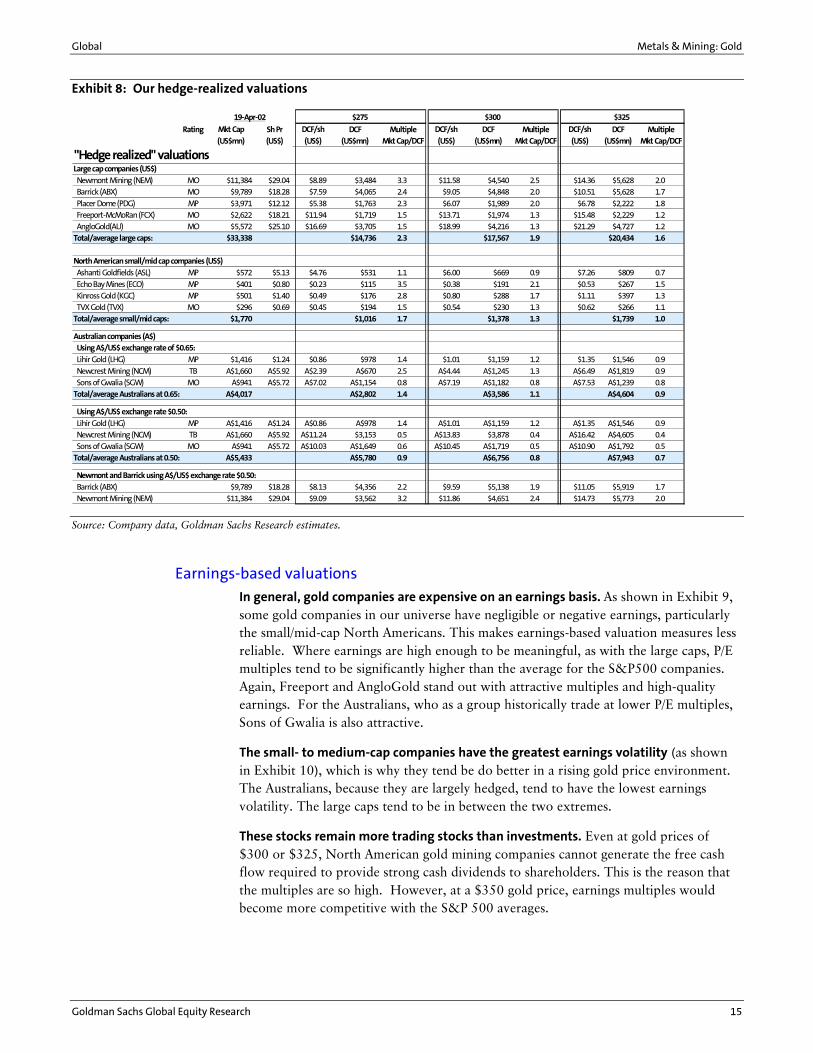
The hedge-realized valuation method favors the hedged producers (see Exhibit 8). As a group, the Australians are typically substantially hedged. As Exhibit 8 shows, as a group they are currently trading at 0.9X their DCF valuations based on an AUD/USD exchange rate of 0.65, and 0.7X their DCF value used an exchange rate of 0.50. In our view, this gives support to the companies� share price. Well-hedged companies, and particularly the Australians, tend to be the more defensive names in our universe.
Global Metals & Mining: Gold
Goldman Sachs Global Equity Research 15
Exhibit 8: Our hedge-realized valuations
Rating Mkt Cap Sh Pr DCF/sh DCF Multiple DCF/sh DCF Multiple DCF/sh DCF Multiple(US$mn) (US$) (US$) (US$mn) Mkt Cap/DCF (US$) (US$mn) Mkt Cap/DCF (US$) (US$mn) Mkt Cap/DCF
"Hedge realized" valuationsLarge cap companies (US$) Newmont Mining (NEM) MO $11,384 $29.04 $8.89 $3,484 3.3 $11.58 $4,540 2.5 $14.36 $5,628 2.0 Barrick (ABX) MO $9,789 $18.28 $7.59 $4,065 2.4 $9.05 $4,848 2.0 $10.51 $5,628 1.7 Placer Dome (PDG) MP $3,971 $12.12 $5.38 $1,763 2.3 $6.07 $1,989 2.0 $6.78 $2,222 1.8 Freeport-McMoRan (FCX) MO $2,622 $18.21 $11.94 $1,719 1.5 $13.71 $1,974 1.3 $15.48 $2,229 1.2 AngloGold(AU) MO $5,572 $25.10 $16.69 $3,705 1.5 $18.99 $4,216 1.3 $21.29 $4,727 1.2Total/average large caps: $33,338 $14,736 2.3 $17,567 1.9 $20,434 1.6
North American small/mid cap companies (US$) Ashanti Goldfields (ASL) MP $572 $5.13 $4.76 $531 1.1 $6.00 $669 0.9 $7.26 $809 0.7 Echo Bay Mines (ECO) MP $401 $0.80 $0.23 $115 3.5 $0.38 $191 2.1 $0.53 $267 1.5 Kinross Gold (KGC) MP $501 $1.40 $0.49 $176 2.8 $0.80 $288 1.7 $1.11 $397 1.3 TVX Gold (TVX) MO $296 $0.69 $0.45 $194 1.5 $0.54 $230 1.3 $0.62 $266 1.1Total/average small/mid caps: $1,770 $1,016 1.7 $1,378 1.3 $1,739 1.0
Australian companies (A$) Using A$/US$ exchange rate of $0.65: Lihir Gold (LHG) MP $1,416 $1.24 $0.86 $978 1.4 $1.01 $1,159 1.2 $1.35 $1,546 0.9 Newcrest Mining (NCM) TB A$1,660 A$5.92 A$2.39 A$670 2.5 A$4.44 A$1,245 1.3 A$6.49 A$1,819 0.9 Sons of Gwalia (SGW) MO A$941 A$5.72 A$7.02 A$1,154 0.8 A$7.19 A$1,182 0.8 A$7.53 A$1,239 0.8Total/average Australians at 0.65: A$4,017 A$2,802 1.4 A$3,586 1.1 A$4,604 0.9
Using A$/US$ exchange rate $0.50: Lihir Gold (LHG) MP A$1,416 A$1.24 A$0.86 A$978 1.4 A$1.01 A$1,159 1.2 A$1.35 A$1,546 0.9 Newcrest Mining (NCM) TB A$1,660 A$5.92 A$11.24 $3,153 0.5 A$13.83 $3,878 0.4 A$16.42 A$4,605 0.4 Sons of Gwalia (SGW) MO A$941 A$5.72 A$10.03 A$1,649 0.6 A$10.45 A$1,719 0.5 A$10.90 A$1,792 0.5Total/average Australians at 0.50: A$5,433 A$5,780 0.9 A$6,756 0.8 A$7,943 0.7
Newmont and Barrick using A$/US$ exchange rate $0.50: Barrick (ABX) $9,789 $18.28 $8.13 $4,356 2.2 $9.59 $5,138 1.9 $11.05 $5,919 1.7 Newmont Mining (NEM) $11,384 $29.04 $9.09 $3,562 3.2 $11.86 $4,651 2.4 $14.73 $5,773 2.0
$275 $300 $32519-Apr-02
Source: Company data, Goldman Sachs Research estimates.
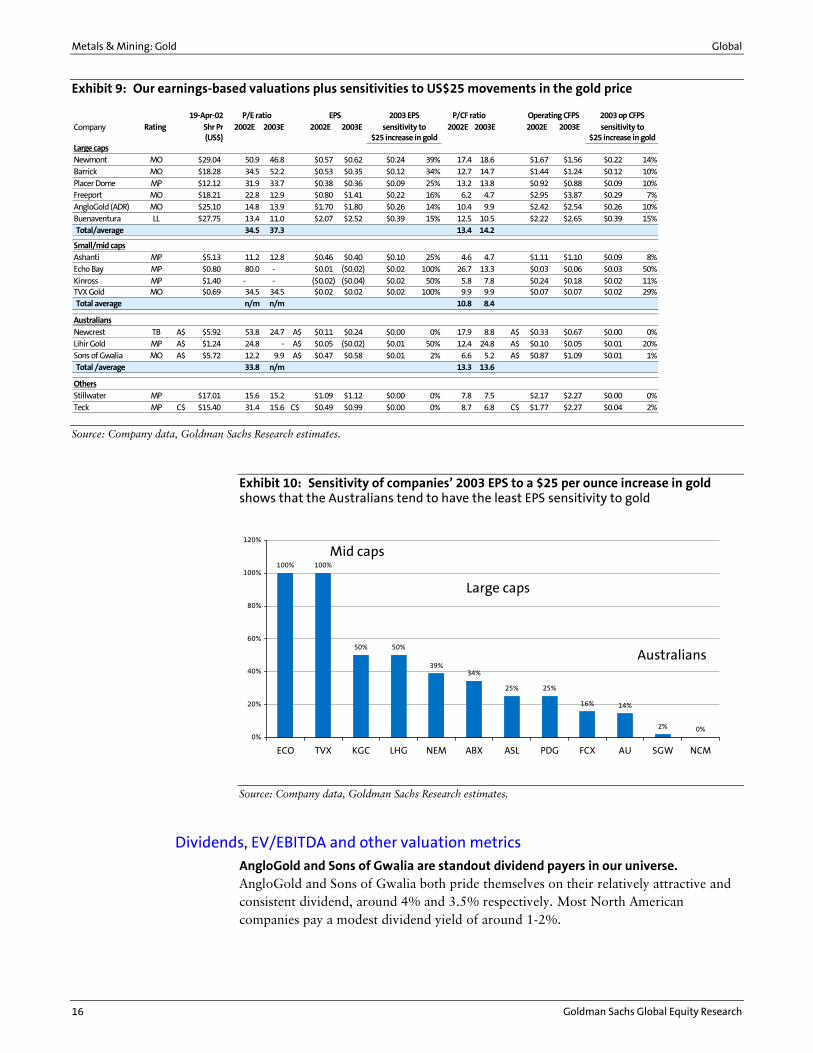
Earnings-based valuations
In general, gold companies are expensive on an earnings basis. As shown in Exhibit 9, some gold companies in our universe have negligible or negative earnings, particularly the small/mid-cap North Americans. This makes earnings-based valuation measures less reliable. Where earnings are high enough to be meaningful, as with the large caps, P/E multiples tend to be significantly higher than the average for the S&P500 companies. Again, Freeport and AngloGold stand out with attractive multiples and high-quality earnings. For the Australians, who as a group historically trade at lower P/E multiples, Sons of Gwalia is also attractive.
The small- to medium-cap companies have the greatest earnings volatility (as shown in Exhibit 10), which is why they tend be do better in a rising gold price environment. The Australians, because they are largely hedged, tend to have the lowest earnings volatility. The large caps tend to be in between the two extremes.
These stocks remain more trading stocks than investments. Even at gold prices of $300 or $325, North American gold mining companies cannot generate the free cash flow required to provide strong cash dividends to shareholders. This is the reason that the multiples are so high. However, at a $350 gold price, earnings multiples would become more competitive with the S&P 500 averages.
Metals & Mining: Gold Global
16 Goldman Sachs Global Equity Research
Exhibit 9: Our earnings-based valuations plus sensitivities to US$25 movements in the gold price
Company Rating Shr Pr 2002E 2003E 2002E 2003E 2002E 2003E 2002E 2003E(US$)
Large capsNewmont MO $29.04 50.9 46.8 $0.57 $0.62 $0.24 39% 17.4 18.6 $1.67 $1.56 $0.22 14%Barrick MO $18.28 34.5 52.2 $0.53 $0.35 $0.12 34% 12.7 14.7 $1.44 $1.24 $0.12 10%Placer Dome MP $12.12 31.9 33.7 $0.38 $0.36 $0.09 25% 13.2 13.8 $0.92 $0.88 $0.09 10%Freeport MO $18.21 22.8 12.9 $0.80 $1.41 $0.22 16% 6.2 4.7 $2.95 $3.87 $0.29 7%AngloGold (ADR) MO $25.10 14.8 13.9 $1.70 $1.80 $0.26 14% 10.4 9.9 $2.42 $2.54 $0.26 10%Buenaventura LL $27.75 13.4 11.0 $2.07 $2.52 $0.39 15% 12.5 10.5 $2.22 $2.65 $0.39 15%Total/average 34.5 37.3 13.4 14.2
Small/mid capsAshanti MP $5.13 11.2 12.8 $0.46 $0.40 $0.10 25% 4.6 4.7 $1.11 $1.10 $0.09 8%Echo Bay MP $0.80 80.0 - $0.01 ($0.02) $0.02 100% 26.7 13.3 $0.03 $0.06 $0.03 50%Kinross MP $1.40 - - ($0.02) ($0.04) $0.02 50% 5.8 7.8 $0.24 $0.18 $0.02 11%TVX Gold MO $0.69 34.5 34.5 $0.02 $0.02 $0.02 100% 9.9 9.9 $0.07 $0.07 $0.02 29%Total average n/m n/m 10.8 8.4
Australians
Newcrest TB A$ $5.92 53.8 24.7 A$ $0.11 $0.24 $0.00 0% 17.9 8.8 A$ $0.33 $0.67 $0.00 0%Lihir Gold MP A$ $1.24 24.8 - A$ $0.05 ($0.02) $0.01 50% 12.4 24.8 A$ $0.10 $0.05 $0.01 20%Sons of Gwalia MO A$ $5.72 12.2 9.9 A$ $0.47 $0.58 $0.01 2% 6.6 5.2 A$ $0.87 $1.09 $0.01 1%Total /average 33.8 n/m 13.3 13.6
OthersStillwater MP $17.01 15.6 15.2 $1.09 $1.12 $0.00 0% 7.8 7.5 $2.17 $2.27 $0.00 0%Teck MP C$ $15.40 31.4 15.6 C$ $0.49 $0.99 $0.00 0% 8.7 6.8 C$ $1.77 $2.27 $0.04 2%
2003 op CFPSsensitivity to
$25 increase in goldsensitivity to
$25 increase in gold
Operating CFPS19-Apr-02 P/E ratio EPS P/CF ratio2003 EPS
Source: Company data, Goldman Sachs Research estimates.
Exhibit 10: Sensitivity of companies� 2003 EPS to a $25 per ounce increase in gold shows that the Australians tend to have the least EPS sensitivity to gold
100% 100%
50% 50%
39%34%
25% 25%
16% 14%
2% 0%0%
20%
40%
60%
80%
100%
120%
ECO TVX KGC LHG NEM ABX ASL PDG FCX AU SGW NCM
Mid caps
Large caps
Australians
Source: Company data, Goldman Sachs Research estimates.
Dividends, EV/EBITDA and other valuation metrics
AngloGold and Sons of Gwalia are standout dividend payers in our universe. AngloGold and Sons of Gwalia both pride themselves on their relatively attractive and consistent dividend, around 4% and 3.5% respectively. Most North American companies pay a modest dividend yield of around 1-2%.

Global Metals & Mining: Gold
Goldman Sachs Global Equity Research 17
Exhibit 11 shows our EV/EBITDA estimates for 2002 and 2003. In this table we have added Montana-based platinum-group metals (PGM) producer Stillwater and Canadian base-metal producer Teck Cominco.
Exhibit 11: Enterprise value to EBITDA
19-Apr-02 Share Shares Mkt Cap Net debt EVPrice o'standing $mn $mn $mn 2002E 2003E 2002E 2003E
Large caps (US$)Newmont $29.04 392 11,384 1,670 13,054 834 810 15.7 16.1Barrick $18.28 536 9,798 70 9,868 851 721 11.6 13.7Placer Dome $12.12 328 3,975 405 4,380 432 409 10.1 10.7Freeport $18.21 144 2,622 2,300 4,922 793 945 6.2 5.2AngloGold $25.10 222 5,572 492 6,064 594 679 10.2 8.9Buenaventura $27.75 63 1,757 47 1,804 221 240 8.2 7.5Total/average 35,108 4,984 40,092 3725 3804 10.8 10.5
Small/mid caps (US$)Ashanti $5.13 112 575 324 899 203 182 4.4 4.9Echo Bay $0.80 502 401 9 410 45 26 9.1 15.8Kinross $1.40 358 501 128 629 81 67 7.8 9.4TVX $0.69 429 296 (100) 196 28 29 7.0 6.8Stillwater $17.01 43 733 180 913 102 111 9.0 8.2Total/average 2,506 541 3,047 459 415 6.6 7.3
Australians (A$)Lihir $1.24 1142 1,416 10 1,426 133 59 10.7 24.2Newcrest $5.92 280 1,658 472 2,130 148 217 14.4 9.8Sons of Gwalia $5.72 164 940 280 1,220 166 230 7.4 5.3Total/average 4,014 762 4,776 447 506 10.7 9.4
Teck-Cominco (C$) $15.40 185 2,849 900 3,749 489 615 7.7 6.1
EV/EBITDAEBITDA
Source: Company data, Goldman Sachs Research estimates.
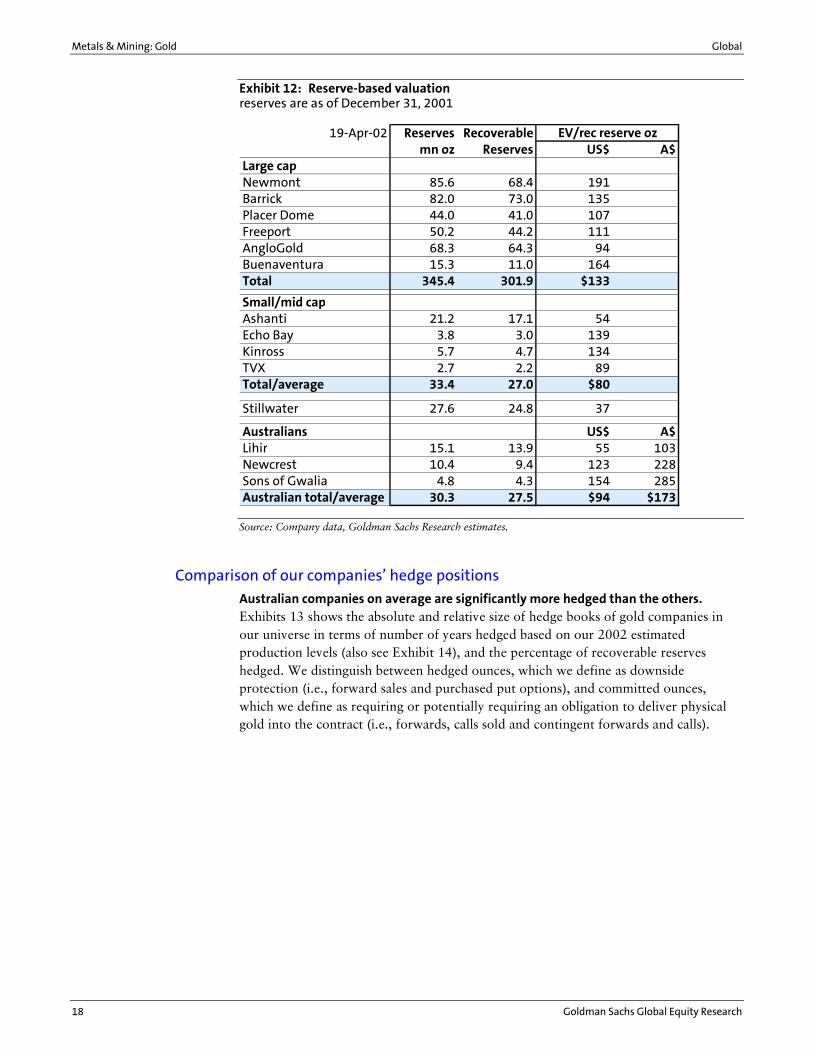
Large-cap companies trade at roughly US$133 of EV to recoverable reserve ounce. As shown in Exhibit 12, the large cap companies� reserves tend to be more highly valued than the rest, and Freeport and AngloGold again stand out based on this valuation metric. However, EV to reserves does not distinguish between developed ounces and undeveloped ounces, or the different quality of reserve ounces. For this reason, we treat this more cautiously than DCF or other cash- or earnings-based methods. Barrick�s relative attractiveness to Newmont largely relates to the fact that Barrick�s Pascua and Veladero projects are undeveloped. Note also that the values for Freeport and Sons of Gwalia are conservative and not strictly comparable because the market is also valuing non-gold assets in their share price.
Metals & Mining: Gold Global
18 Goldman Sachs Global Equity Research
Exhibit 12: Reserve-based valuation reserves are as of December 31, 2001
19-Apr-02 Reserves Recoverablemn oz Reserves US$ A$
Large capNewmont 85.6 68.4 191Barrick 82.0 73.0 135Placer Dome 44.0 41.0 107Freeport 50.2 44.2 111AngloGold 68.3 64.3 94Buenaventura 15.3 11.0 164Total 345.4 301.9 $133
Small/mid capAshanti 21.2 17.1 54Echo Bay 3.8 3.0 139Kinross 5.7 4.7 134TVX 2.7 2.2 89Total/average 33.4 27.0 $80
Stillwater 27.6 24.8 37
Australians US$ A$Lihir 15.1 13.9 55 103Newcrest 10.4 9.4 123 228Sons of Gwalia 4.8 4.3 154 285Australian total/average 30.3 27.5 $94 $173
EV/rec reserve oz
Source: Company data, Goldman Sachs Research estimates.
Comparison of our companies� hedge positions
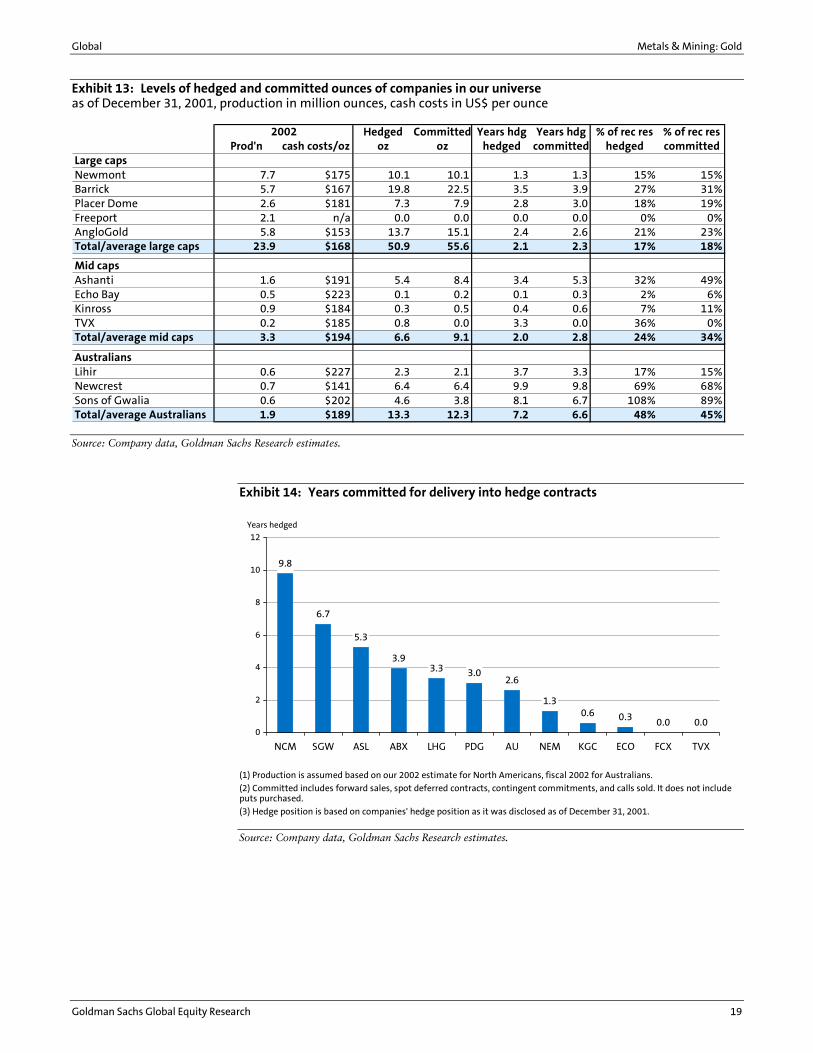
Australian companies on average are significantly more hedged than the others. Exhibits 13 shows the absolute and relative size of hedge books of gold companies in our universe in terms of number of years hedged based on our 2002 estimated production levels (also see Exhibit 14), and the percentage of recoverable reserves hedged. We distinguish between hedged ounces, which we define as downside protection (i.e., forward sales and purchased put options), and committed ounces, which we define as requiring or potentially requiring an obligation to deliver physical gold into the contract (i.e., forwards, calls sold and contingent forwards and calls).
Global Metals & Mining: Gold
Goldman Sachs Global Equity Research 19
Exhibit 13: Levels of hedged and committed ounces of companies in our universe as of December 31, 2001, production in million ounces, cash costs in US$ per ounce
Hedged Committed Years hdg Years hdg % of rec res % of rec resProd'n cash costs/oz oz oz hedged committed hedged committed
Large capsNewmont 7.7 $175 10.1 10.1 1.3 1.3 15% 15%Barrick 5.7 $167 19.8 22.5 3.5 3.9 27% 31%Placer Dome 2.6 $181 7.3 7.9 2.8 3.0 18% 19%Freeport 2.1 n/a 0.0 0.0 0.0 0.0 0% 0%AngloGold 5.8 $153 13.7 15.1 2.4 2.6 21% 23%Total/average large caps 23.9 $168 50.9 55.6 2.1 2.3 17% 18%
Mid capsAshanti 1.6 $191 5.4 8.4 3.4 5.3 32% 49%Echo Bay 0.5 $223 0.1 0.2 0.1 0.3 2% 6%Kinross 0.9 $184 0.3 0.5 0.4 0.6 7% 11%TVX 0.2 $185 0.8 0.0 3.3 0.0 36% 0%Total/average mid caps 3.3 $194 6.6 9.1 2.0 2.8 24% 34%
AustraliansLihir 0.6 $227 2.3 2.1 3.7 3.3 17% 15%Newcrest 0.7 $141 6.4 6.4 9.9 9.8 69% 68%Sons of Gwalia 0.6 $202 4.6 3.8 8.1 6.7 108% 89%Total/average Australians 1.9 $189 13.3 12.3 7.2 6.6 48% 45%
2002
Source: Company data, Goldman Sachs Research estimates.
Exhibit 14: Years committed for delivery into hedge contracts
9.8
6.7
5.3
3.93.3 3.0
2.6
1.30.6 0.3 0.0 0.0
0
2
4
6
8
10
12
NCM SGW ASL ABX LHG PDG AU NEM KGC ECO FCX TVX
Years hedged
(1) Production is assumed based on our 2002 estimate for North Americans, fiscal 2002 for Australians.
(2) Committed includes forward sales, spot deferred contracts, contingent commitments, and calls sold. It does not include puts purchased.
(3) Hedge position is based on companies' hedge position as it was disclosed as of December 31, 2001.
Source: Company data, Goldman Sachs Research estimates.

Metals & Mining: Gold Global
20 Goldman Sachs Global Equity Research
Risk-reward analysis and qualitative comparison of our universe
Exhibits 15 and 16 are our risk-reward analyses that we introduced in our Industry Navigator in October 2001. The key points that flow from our risk reward analysis are as follows:
• In our view, Freeport-McMoRan and AngloGold appear to offer the most attractive balance of financial risk with potential return among the large-cap names. However, given the near 50% and 20% respective outperformance of Freeport and AngloGold against the XAU since October 17, 2001 when we published our Industry Navigator, the rewards do not look as compelling as they did then.
• Barrick appears the lowest-risk stock for long-term investors. Our valuation for Barrick includes Pascua and Veladero, but it does not factor in any potential synergies in developing the district as a single entity. Placer Dome is also relatively low risk.
• Newmont, post the Normandy and Franco-Nevada acquisitions, is lower risk, but remains the most-leveraged large-cap pure gold stock. The more leveraged and more risky small-cap names Kinross and Echo Bay also have less liquidity.
• Newcrest Mining is potentially the highest-return stock in our universe (see Exhibit 16).

Global Metals & Mining: Gold
Goldman Sachs Global Equity Research 21
Exhibit 15: Risk/reward analysis of our North American firms, based on our marked-to-market valuation method
ABX ($350)NEM ($350)PDG ($350)
FCX ($350)AU ($350)
ASL ($350)
KGC ($350)ECO ($350)
TVX ($350)ABX ($400)
NEM ($400)PDG ($400)
FCX ($400)AU ($400)
KGC ($400)
ECO ($400)TVX ($400)
ABX ($300) NEM ($300)PDG ($300)
FCX ($300)AU ($300)
ASL ($300)
KGC ($300) ECO ($300)
TVX ($300)
ASL ($400)
0.0
0.5
1.0
1.5
2.0
2.5
0.0 0.2 0.4 0.6 0.8 1.0 1.2 1.4 1.6
Risk (Net debt to 10 yr free cash flow at $275 gold, adjusted for credit rating)
Retu
rn (1
/min
e D
CF
mu
ltip
le @
5%
dis
cou
nt
rate
)
Increasing risk at lower gold prices
Increasing returns at higher gold prices
Notes:
�Return� is measured by the inverse of our estimated market cap-to-mine DCF multiple (using the marked-to-market method based on gold prices of $300, $350, and $400).
�Risk� is measured by net debt divided by free cash flow over 10 years at a long-term $275 gold price. The ratio is then adjusted by moving all companies except Barrick, Placer Dome and Newmont 0.2 units to the right to reflect investment grade credit ratings of BBB or better. Ashanti has been moved 0.4 units to the right to discount its limited financial flexibility.
Freeport�s DCF is run at 10% and includes G&A. All other companies exclude G&A and use a 5% discount rate except DCFs for copper mine components, which employ a 10% rate.
Source: Company data, Goldman Sachs Research estimates.
Exhibits 15 and 16 are risk/reward analyses of our companies. The X-axis plots risk, which we equate with the companies� ability to pay down debt at low ($275 per ounce) gold prices. We have used net debt divided by our estimate of the companies� free cash flow generation over the next ten years. We then adjusted this number by favoring large North American companies: Barrick, Placer and Newmont have investment grade credit ratings of �BBB� or better. We have moved all other companies to the right (i.e., increasing the risk factor) by an arbitrary increment of 0.2 units, and Ashanti by an additional 0.2 unit increment to reflect its current financial constraints. The Y-axis plots return, which we equate with the relative attractiveness of the companies� market cap-to-DCF multiple based upon gold prices of $300, $350, and $400. The greater the vertical jump per $25 increase in gold price assumption, generally, the more leverage the company has to the gold price.
Metals & Mining: Gold Global
22 Goldman Sachs Global Equity Research
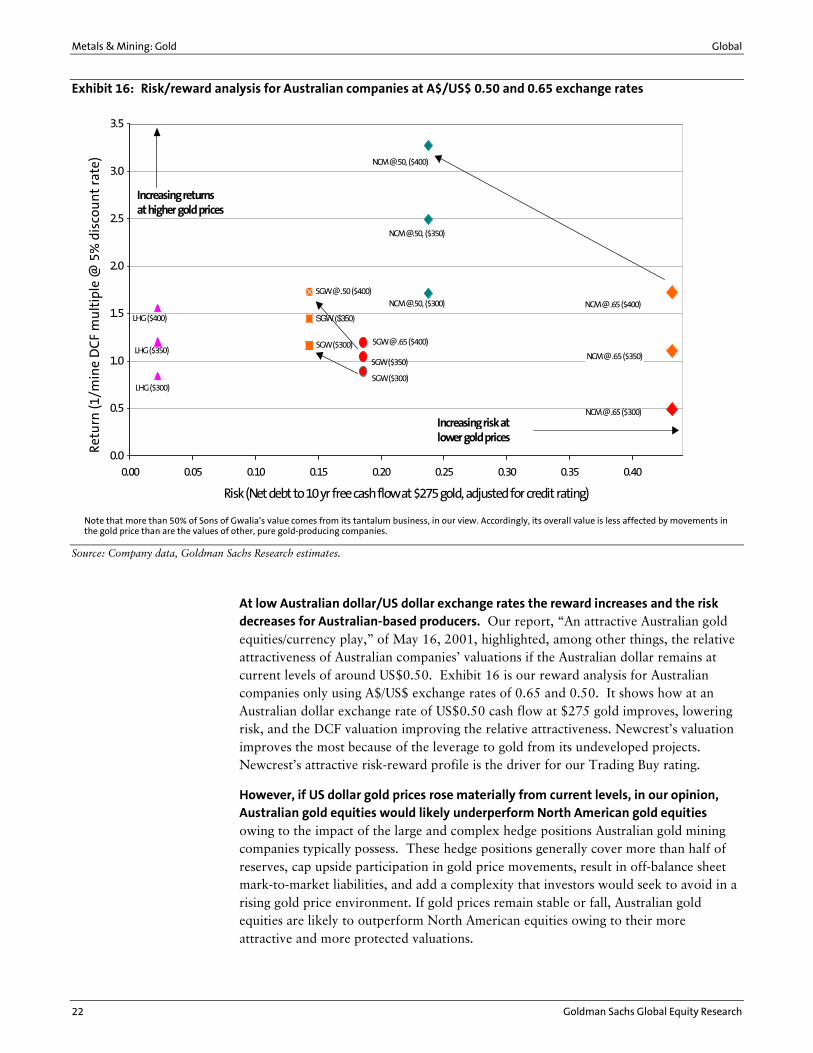
Exhibit 16: Risk/reward analysis for Australian companies at A$/US$ 0.50 and 0.65 exchange rates
NCM @ .65 ($350)
NCM @ .65 ($400)
NCM @ .65 ($300)
NCM @.50, ($300)
NCM @.50, ($350)
NCM @.50, ($400)
SGW @ .65 ($400)
SGW ($350)
SGW ($300)
SGW @ .50 ($400)
SGW($350)
SGW ($300)
LHG ($400)
LHG ($350)
LHG ($300)
0.0
0.5
1.0
1.5
2.0
2.5
3.0
3.5
0.00 0.05 0.10 0.15 0.20 0.25 0.30 0.35 0.40
Risk (Net debt to 10 yr free cash flow at $275 gold, adjusted for credit rating)
Ret
urn
(1/m
ine
DC
F m
ult
iple
@ 5
% d
isco
un
t ra
te)
Increasing risk at lower gold prices
Increasing returns at higher gold prices
Note that more than 50% of Sons of Gwalia�s value comes from its tantalum business, in our view. Accordingly, its overall value is less affected by movements in the gold price than are the values of other, pure gold-producing companies.
Source: Company data, Goldman Sachs Research estimates.
At low Australian dollar/US dollar exchange rates the reward increases and the risk decreases for Australian-based producers. Our report, �An attractive Australian gold equities/currency play,� of May 16, 2001, highlighted, among other things, the relative attractiveness of Australian companies� valuations if the Australian dollar remains at current levels of around US$0.50. Exhibit 16 is our reward analysis for Australian companies only using A$/US$ exchange rates of 0.65 and 0.50. It shows how at an Australian dollar exchange rate of US$0.50 cash flow at $275 gold improves, lowering risk, and the DCF valuation improving the relative attractiveness. Newcrest�s valuation improves the most because of the leverage to gold from its undeveloped projects. Newcrest�s attractive risk-reward profile is the driver for our Trading Buy rating.
However, if US dollar gold prices rose materially from current levels, in our opinion, Australian gold equities would likely underperform North American gold equities owing to the impact of the large and complex hedge positions Australian gold mining companies typically possess. These hedge positions generally cover more than half of reserves, cap upside participation in gold price movements, result in off-balance sheet mark-to-market liabilities, and add a complexity that investors would seek to avoid in a rising gold price environment. If gold prices remain stable or fall, Australian gold equities are likely to outperform North American equities owing to their more attractive and more protected valuations.
Global Metals & Mining: Gold
Goldman Sachs Global Equity Research 23
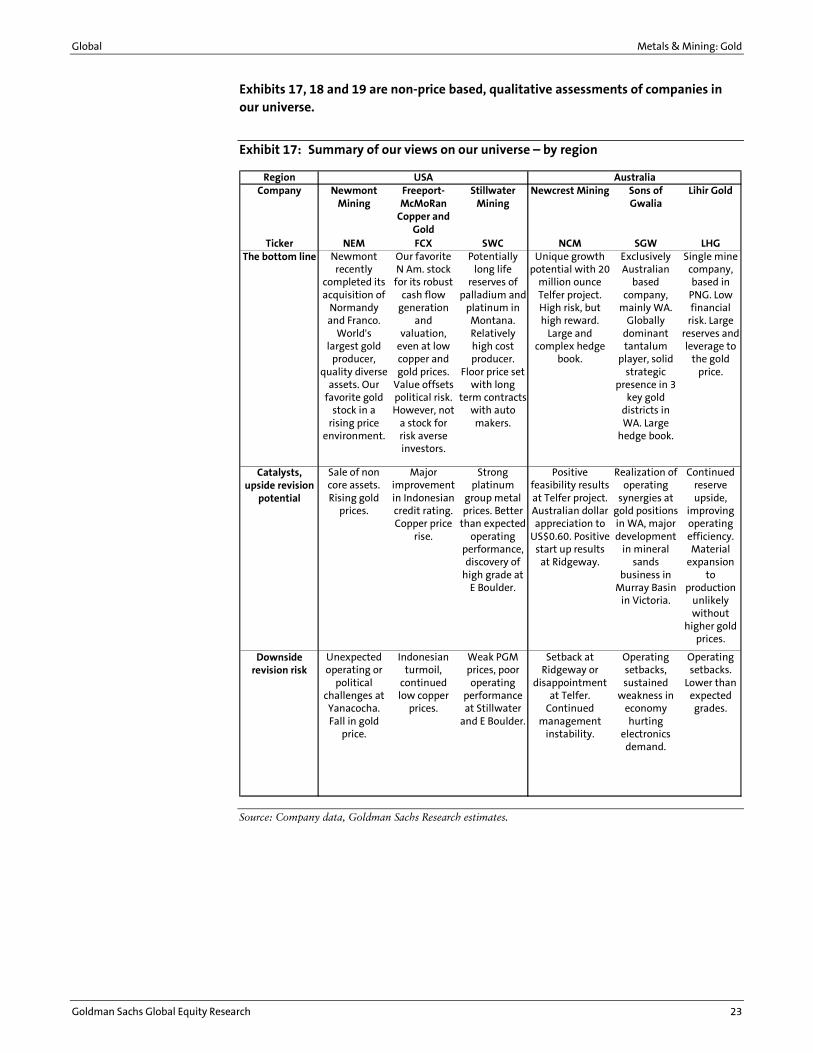
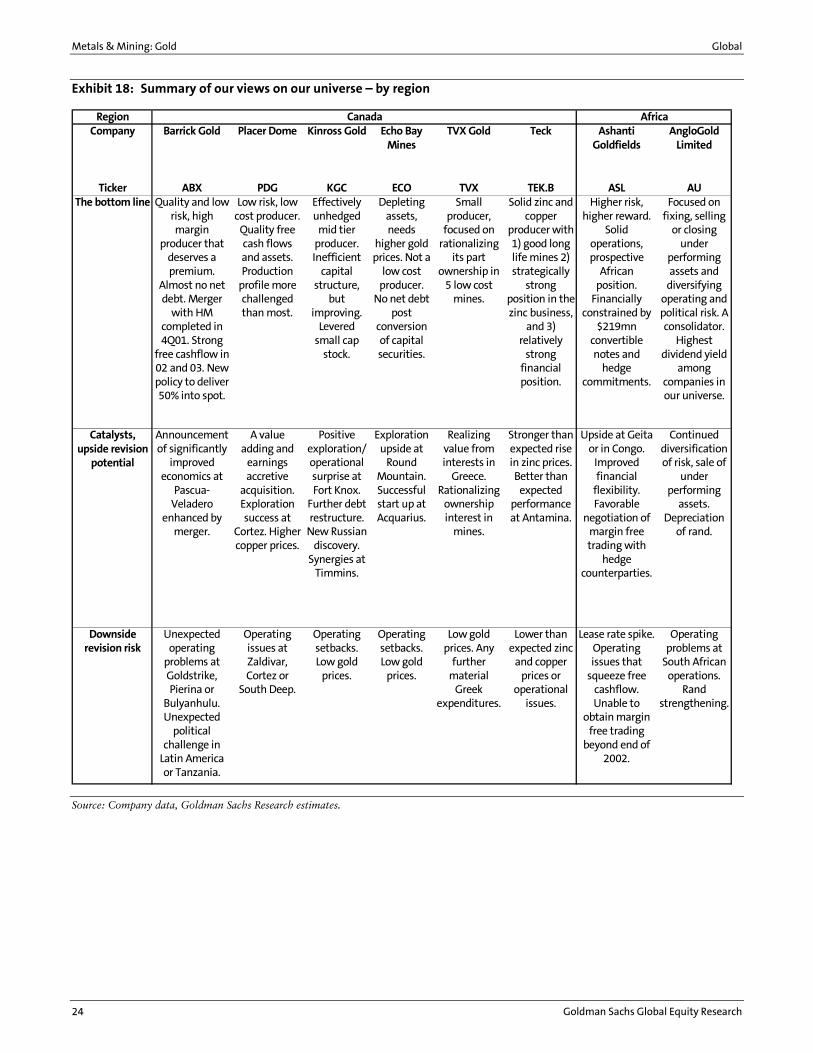
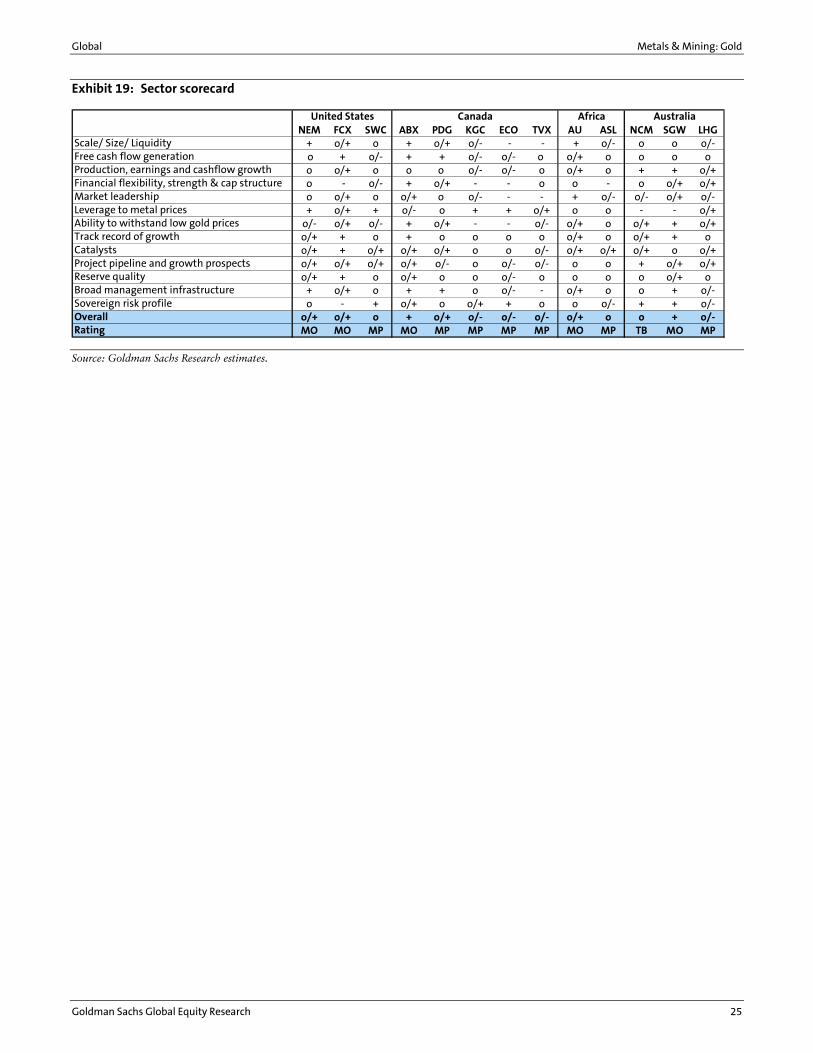
Exhibits 17, 18 and 19 are non-price based, qualitative assessments of companies in our universe.
Exhibit 17: Summary of our views on our universe � by region
RegionCompany Newmont
MiningFreeport-McMoRan
Copper and Gold
Stillwater Mining
Newcrest Mining Sons of Gwalia
Lihir Gold
Ticker NEM FCX SWC NCM SGW LHGThe bottom line Newmont
recently completed its acquisition of
Normandy and Franco.
World's largest gold
producer, quality diverse
assets. Our favorite gold
stock in a rising price
environment.
Our favorite N Am. stock
for its robust cash flow
generation and
valuation, even at low copper and gold prices.
Value offsets political risk. However, not
a stock for risk averse investors.
Potentially long life
reserves of palladium and
platinum in Montana. Relatively high cost producer.
Floor price set with long
term contracts with auto makers.
Unique growth potential with 20
million ounce Telfer project. High risk, but high reward.
Large and complex hedge
book.
Exclusively Australian
based company,
mainly WA. Globally
dominant tantalum
player, solid strategic
presence in 3 key gold
districts in WA. Large
hedge book.
Single mine company, based in
PNG. Low financial
risk. Large reserves and leverage to
the gold price.
Catalysts, upside revision
potential
Sale of non core assets. Rising gold
prices.
Major improvement in Indonesian credit rating. Copper price
rise.
Strong platinum
group metal prices. Better
than expected operating
performance, discovery of
high grade at E Boulder.
Positive feasibility results at Telfer project. Australian dollar appreciation to
US$0.60. Positive start up results
at Ridgeway.
Realization of operating
synergies at gold positions in WA, major development
in mineral sands
business in Murray Basin
in Victoria.
Continued reserve upside,
improving operating efficiency. Material
expansion to
production unlikely without
higher gold prices.
Downside revision risk
Unexpected operating or
political challenges at Yanacocha. Fall in gold
price.
Indonesian turmoil,
continued low copper
prices.
Weak PGM prices, poor operating
performance at Stillwater
and E Boulder.
Setback at Ridgeway or
disappointment at Telfer.
Continued management
instability.
Operating setbacks, sustained
weakness in economy hurting
electronics demand.
Operating setbacks.
Lower than expected grades.
AustraliaUSA
Source: Company data, Goldman Sachs Research estimates.
Metals & Mining: Gold Global
24 Goldman Sachs Global Equity Research
Exhibit 18: Summary of our views on our universe � by region
RegionCompany Barrick Gold Placer Dome Kinross Gold Echo Bay
MinesTVX Gold Teck Ashanti
GoldfieldsAngloGold
Limited
Ticker ABX PDG KGC ECO TVX TEK.B ASL AUThe bottom line Quality and low
risk, high margin
producer that deserves a premium.
Almost no net debt. Merger
with HM completed in 4Q01. Strong
free cashflow in 02 and 03. New policy to deliver 50% into spot.
Low risk, low cost producer.
Quality free cash flows and assets. Production
profile more challenged than most.
Effectively unhedged
mid tier producer. Inefficient
capital structure,
but improving.
Levered small cap
stock.
Depleting assets, needs
higher gold prices. Not a
low cost producer.
No net debt post
conversion of capital securities.
Small producer,
focused on rationalizing
its part ownership in
5 low cost mines.
Solid zinc and copper
producer with 1) good long life mines 2) strategically
strong position in the zinc business,
and 3) relatively
strong financial position.
Higher risk, higher reward.
Solid operations, prospective
African position.
Financially constrained by
$219mn convertible notes and
hedge commitments.
Focused on fixing, selling
or closing under
performing assets and
diversifying operating and political risk. A consolidator.
Highest dividend yield
among companies in our universe.
Catalysts, upside revision
potential
Announcement of significantly
improved economics at
Pascua-Veladero
enhanced by merger.
A value adding and
earnings accretive
acquisition. Exploration success at
Cortez. Higher copper prices.
Positive exploration/operational surprise at Fort Knox.
Further debt restructure.
New Russian discovery.
Synergies at Timmins.
Exploration upside at
Round Mountain. Successful start up at Acquarius.
Realizing value from interests in
Greece. Rationalizing
ownership interest in
mines.
Stronger than expected rise in zinc prices. Better than
expected performance at Antamina.
Upside at Geita or in Congo.
Improved financial
flexibility. Favorable
negotiation of margin free trading with
hedge counterparties.
Continued diversification of risk, sale of
under performing
assets. Depreciation
of rand.
Downside revision risk
Unexpected operating
problems at Goldstrike, Pierina or
Bulyanhulu. Unexpected
political challenge in
Latin America or Tanzania.
Operating issues at Zaldivar, Cortez or
South Deep.
Operating setbacks. Low gold
prices.
Operating setbacks. Low gold
prices.
Low gold prices. Any
further material
Greek expenditures.
Lower than expected zinc
and copper prices or
operational issues.
Lease rate spike. Operating issues that
squeeze free cashflow. Unable to
obtain margin free trading
beyond end of 2002.
Operating problems at
South African operations.
Rand strengthening.
AfricaCanada
Source: Company data, Goldman Sachs Research estimates.
Global Metals & Mining: Gold
Goldman Sachs Global Equity Research 25
Exhibit 19: Sector scorecard
NEM FCX SWC ABX PDG KGC ECO TVX AU ASL NCM SGW LHGScale/ Size/ Liquidity + o/+ o + o/+ o/- - - + o/- o o o/-Free cash flow generation o + o/- + + o/- o/- o o/+ o o o oProduction, earnings and cashflow growth o o/+ o o o o/- o/- o o/+ o + + o/+Financial flexibility, strength & cap structure o - o/- + o/+ - - o o - o o/+ o/+Market leadership o o/+ o o/+ o o/- - - + o/- o/- o/+ o/-Leverage to metal prices + o/+ + o/- o + + o/+ o o - - o/+Ability to withstand low gold prices o/- o/+ o/- + o/+ - - o/- o/+ o o/+ + o/+Track record of growth o/+ + o + o o o o o/+ o o/+ + oCatalysts o/+ + o/+ o/+ o/+ o o o/- o/+ o/+ o/+ o o/+Project pipeline and growth prospects o/+ o/+ o/+ o/+ o/- o o/- o/- o o + o/+ o/+Reserve quality o/+ + o o/+ o o o/- o o o o o/+ oBroad management infrastructure + o/+ o + + o o/- - o/+ o o + o/-Sovereign risk profile o - + o/+ o o/+ + o o o/- + + o/-Overall o/+ o/+ o + o/+ o/- o/- o/- o/+ o o + o/-Rating MO MO MP MO MP MP MP MP MO MP TB MO MP
United States Canada Africa Australia
Source: Goldman Sachs Research estimates.
Metals & Mining: Gold Global
26 Goldman Sachs Global Equity Research
Global Metals & Mining: Gold
Goldman Sachs Global Equity Research 27
28 Barrick Gold Corp.
30 Newmont Mining Corp
32 Placer Dome Inc.
34 Freeport-McMoRan Copper & Gold
36 AngloGold Ltd.
38 Compañía de Minas Buenaventura
40 Ashanti Goldfields Co. Ltd.
42 Stillwater Mining Company
44 Teck Cominco Ltd.
46 Kinross Gold Corp.
48 TVX Gold Inc.
50 Echo Bay Mines Ltd.
51 Lihir Gold Ltd.
53 Newcrest Mining Limited
55 Sons of Gwalia Limited
Com
pan
y snapsh
ots
Metals & Mining: Gold Global
28 Goldman Sachs Global Equity Research
Barrick Gold Corp. (ABX): Metals & Mining: Precious
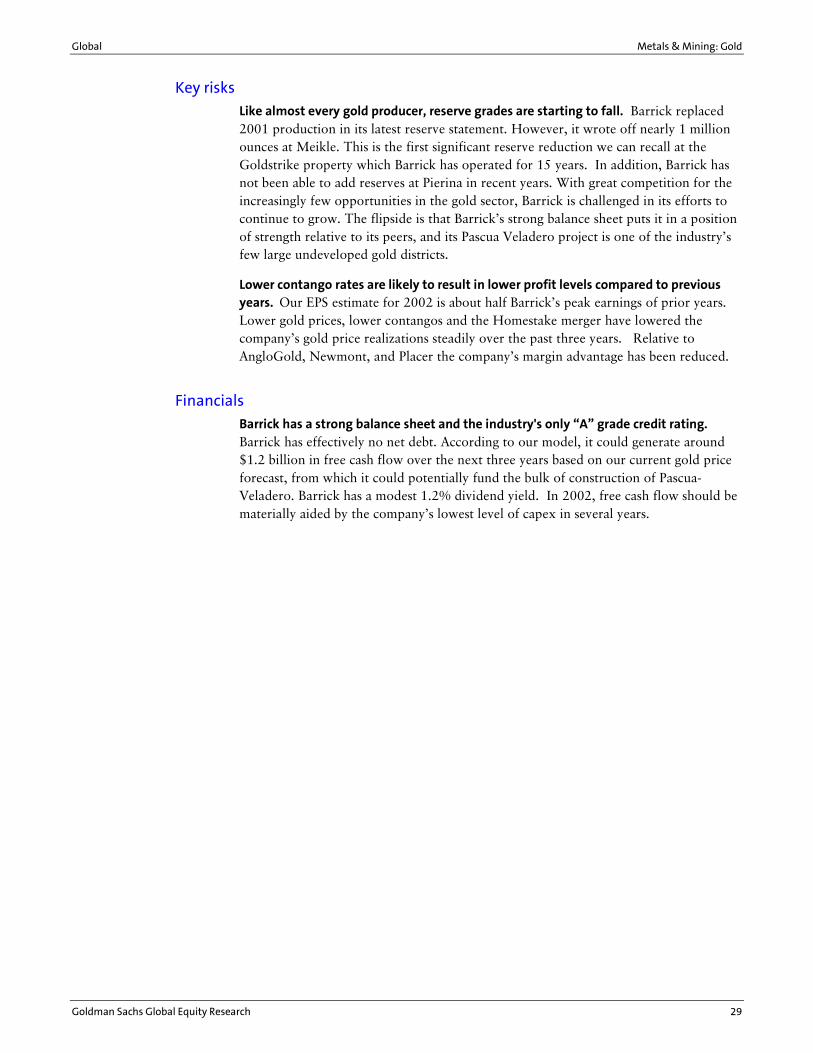
Company data Stock data Price performance 1M 3M 12M Price performance chart Market Outperformer 52-week range $19.07-$14.06 Absolute 2% 9% 15%
Mid-Cap Value Yield 1.2% Rel to Toronto Composite 2% 5% 18%
Price: $18.28
Toronto Composite: Priced at market close of April 19, 2002Canada Capitalization Forecasts/valuation 12/2002E 12/2003E
Market cap $9,798mn EPS $0.53 $0.35
Latest net debt/(cash) $70mn P/E 34.5 52.2
Free float � ROE 6.7% 5.6%
Derivatives � EV/EBITDA 11.6 13.7
Shares outstanding 536mn M A M J J A S O N D J F
14
15
16
17
18
19
0.0
0.1
0.2
0.3
0.4
Absolute Price Performance (Left Axis)Relative to Index (Right Axis)
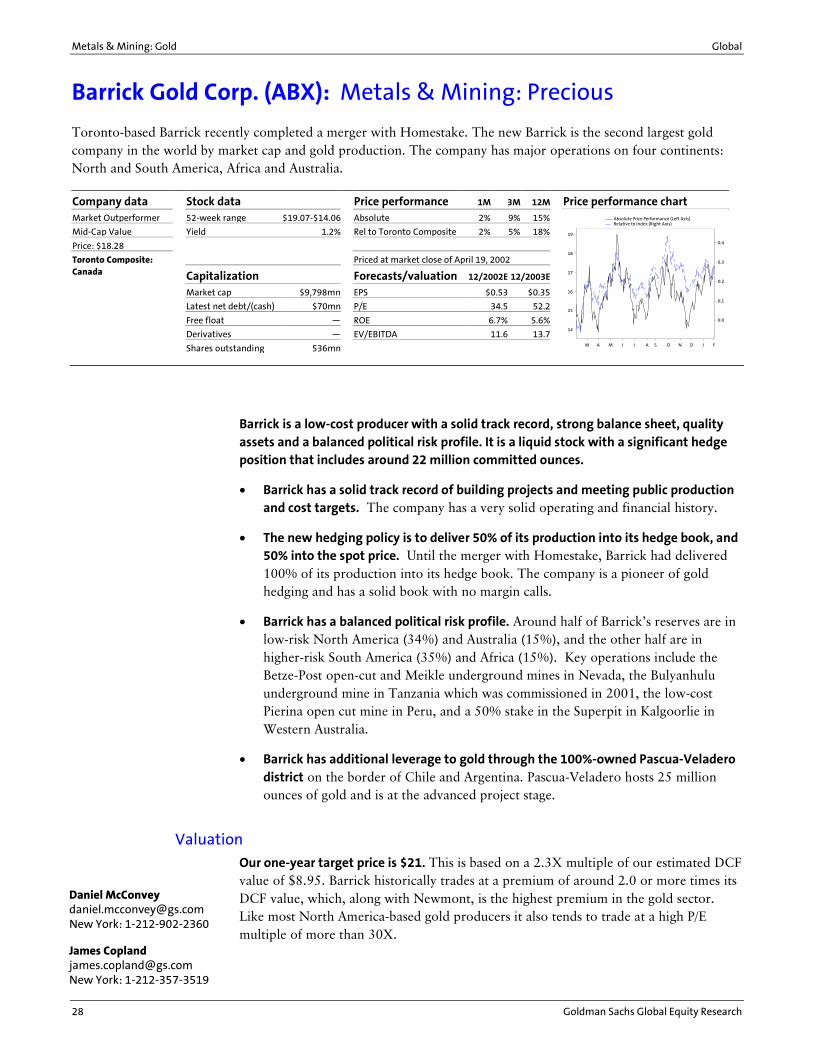
Barrick is a low-cost producer with a solid track record, strong balance sheet, quality assets and a balanced political risk profile. It is a liquid stock with a significant hedge position that includes around 22 million committed ounces.
• Barrick has a solid track record of building projects and meeting public production and cost targets. The company has a very solid operating and financial history.
• The new hedging policy is to deliver 50% of its production into its hedge book, and 50% into the spot price. Until the merger with Homestake, Barrick had delivered 100% of its production into its hedge book. The company is a pioneer of gold hedging and has a solid book with no margin calls.
• Barrick has a balanced political risk profile. Around half of Barrick�s reserves are in low-risk North America (34%) and Australia (15%), and the other half are in higher-risk South America (35%) and Africa (15%). Key operations include the Betze-Post open-cut and Meikle underground mines in Nevada, the Bulyanhulu underground mine in Tanzania which was commissioned in 2001, the low-cost Pierina open cut mine in Peru, and a 50% stake in the Superpit in Kalgoorlie in Western Australia.
• Barrick has additional leverage to gold through the 100%-owned Pascua-Veladero district on the border of Chile and Argentina. Pascua-Veladero hosts 25 million ounces of gold and is at the advanced project stage.
Valuation
Our one-year target price is $21. This is based on a 2.3X multiple of our estimated DCF value of $8.95. Barrick historically trades at a premium of around 2.0 or more times its DCF value, which, along with Newmont, is the highest premium in the gold sector. Like most North America-based gold producers it also tends to trade at a high P/E multiple of more than 30X.
Toronto-based Barrick recently completed a merger with Homestake. The new Barrick is the second largest gold company in the world by market cap and gold production. The company has major operations on four continents: North and South America, Africa and Australia.
Daniel McConvey [email protected] New York: 1-212-902-2360
James Copland [email protected] New York: 1-212-357-3519
Global Metals & Mining: Gold
Goldman Sachs Global Equity Research 29
Key risks
Like almost every gold producer, reserve grades are starting to fall. Barrick replaced 2001 production in its latest reserve statement. However, it wrote off nearly 1 million ounces at Meikle. This is the first significant reserve reduction we can recall at the Goldstrike property which Barrick has operated for 15 years. In addition, Barrick has not been able to add reserves at Pierina in recent years. With great competition for the increasingly few opportunities in the gold sector, Barrick is challenged in its efforts to continue to grow. The flipside is that Barrick�s strong balance sheet puts it in a position of strength relative to its peers, and its Pascua Veladero project is one of the industry�s few large undeveloped gold districts.
Lower contango rates are likely to result in lower profit levels compared to previous years. Our EPS estimate for 2002 is about half Barrick�s peak earnings of prior years. Lower gold prices, lower contangos and the Homestake merger have lowered the company�s gold price realizations steadily over the past three years. Relative to AngloGold, Newmont, and Placer the company�s margin advantage has been reduced.
Financials
Barrick has a strong balance sheet and the industry's only �A� grade credit rating. Barrick has effectively no net debt. According to our model, it could generate around $1.2 billion in free cash flow over the next three years based on our current gold price forecast, from which it could potentially fund the bulk of construction of Pascua-Veladero. Barrick has a modest 1.2% dividend yield. In 2002, free cash flow should be materially aided by the company�s lowest level of capex in several years.

Metals & Mining: Gold Global
30 Goldman Sachs Global Equity Research
Newmont Mining Corp: Metals & Mining: Precious
Company data Stock data Price performance 1M 3M 12M Price performance chart Market Outperformer 52-week range $29.07-$16.77 Absolute 18% 44% 69%
Mid-Cap Value Yield 0.4% Rel to S&P 500 22% 44% 79%
Price: $29.04 Rel to Russell Index 15% 35% 60%
S&P 500: 1,125.17 Priced at market close of April 19, 2002.United States Capitalization Forecasts/valuation 12/2002E 12/2003E
Market cap $11,384mn EPS $0.57 $0.62
Latest net debt/(cash) $1,670mn P/E 50.9 46.8
Free float � EV/EBITDA 15.7 16.1
Derivatives �
Shares outstanding 392mn M J J A S O N D J F M A
18
20
22
24
26
28
0.0
0.1
0.2
0.3
0.4
0.5
0.6
0.7
0.8
Absolute Price Performance (Left Axis)Relative to Index (Right Axis)
Newmont is the most levered to gold price movements among large-cap North American gold stocks and is the most-liquid of the major gold companies in our universe. It tends to be an outperforming gold stock in rising gold price environments, and an underperforming stock in falling ones.
• Newmont emerges from its three-way merger with Franco-Nevada and Australia�s Normandy Mining as the world�s largest-cap, most-liquid gold stock and with a reduced sovereign risk profile. All else being equal, it will likely be the gold stock of choice for investors seeking gold price leverage to the gold price (see Exhibit 10 for a comparison of EPS sensitivity to the gold-price). For each $25 change in the gold price Newmont�s estimated 2003 EPS move by 39%, according to our estimates.
• Newmont�s balance sheet is materially enhanced as a result of the merger even after spending over $400 million in consideration to Normandy shareholders and an estimated $90 million in acquisition costs. We estimate that by year-end 2003, if the company completes planned asset divestitures for this year and more that we believe may follow, the �New Newmont� could have close to the same $1.1 billion in net debt that the �Old Newmont� had as of September 30, 2001. With 2 million ounces of acquired gold production, some base metal income, and about $60 million of free cash flow from royalties, debt reduction seems assured. Debt reduction could be further accelerated by divestitures of more non-core gold and non-gold assets. S&P changed its outlook for Newmont�s debt (rated �BBB�) to stable from negative earlier in 2002.
• Newmont is the world�s largest gold producer. The company�s key assets include several mines and an extensive land position in Nevada, a 51.3% stake in Minera Yanacocha in Peru, possibly the world�s most exciting reserve and production growth story of late, and a 56.25% interest in the Batu Hijau copper gold mine in Indonesia.
Following the acquisition of Australia�s largest producer Normandy, and Canadian royalty company Franco Nevada, Denver-based Newmont materially improved its balance sheet and became the world�s largest in terms of gold production, reserves and market cap. Its major gold operations are in North America, Peru, Australia and Indonesia.
Daniel McConvey [email protected] New York: 1-212-902-2360
James Copland [email protected] New York: 1-212-357-3519
Global Metals & Mining: Gold
Goldman Sachs Global Equity Research 31
Valuation
Our one-year target price of $33 is based on a 2.4X multiple of our base-case mine DCF at a $325 gold price of $13.94 per share. Our target price is equal about 35X our 2004 earnings estimate. Our earnings estimates are based on a $300 gold price for the rest of 2002, $300 for 2003 and $325 beyond. They are also based upon a $0.65 Australian dollar after 2002. Our per-pound copper price forecasts for the remainder of 2002, 2003 and 2004 are $0.72, $0.80 and $0.85 respectively. Each $0.10 per pound change in copper prices impacts earnings by about $0.03 per share, which is about half of the pre-merger leverage.
Key risks
Newmont�s leverage to the gold price leaves it more exposed than more hedged companies if gold prices go down. Newmont shareholders have benefited handsomely from recent gold price strength. The post-merger Newmont is not as levered to the gold price. However, it is still the most levered among North American major gold producers and it thus has the most to lose in terms of earnings and cash flows if gold prices revert to sub-$280 per ounce levels.
Like almost all major gold producers, Newmont has a declining production profile. Newmont�s production is not as challenged as, say, that of Placer Dome. However, it is still on a decline, by around 1 million ounces to a forecast 6.6 million ounces by 2008.
Financials
Adjusting for recent asset sales, we estimate that Newmont�s net debt is currently about US$1.7 billion. We estimate that the company�s free cash flow generation (i.e. after dividend payments) will rise from over $100 million in 2002 and 2003 to about $500 million in 2005 based on our $325 gold price forecast for 2004 and beyond. Newmont management is focused on reducing its net debt to total capitalization ratio from its current level of around 24% to less than 20% within a year, to less than 10% in the longer term.
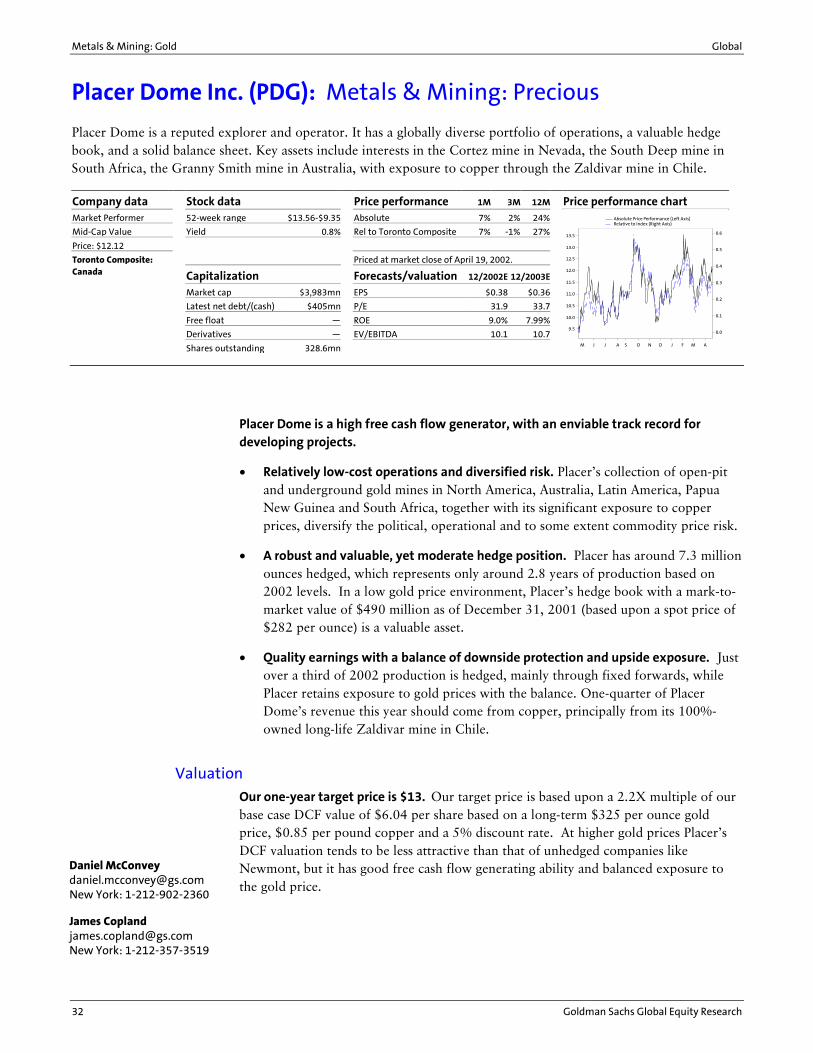
Metals & Mining: Gold Global
32 Goldman Sachs Global Equity Research
Placer Dome Inc. (PDG): Metals & Mining: Precious
Company data Stock data Price performance 1M 3M 12M Price performance chart Market Performer 52-week range $13.56-$9.35 Absolute 7% 2% 24%
Mid-Cap Value Yield 0.8% Rel to Toronto Composite 7% -1% 27%
Price: $12.12
Toronto Composite: Priced at market close of April 19, 2002.Canada Capitalization Forecasts/valuation 12/2002E 12/2003E
Market cap $3,983mn EPS $0.38 $0.36
Latest net debt/(cash) $405mn P/E 31.9 33.7
Free float � ROE 9.0% 7.99%
Derivatives � EV/EBITDA 10.1 10.7
Shares outstanding 328.6mn M J J A S O N D J F M A
9.5
10.0
10.5
11.0
11.5
12.0
12.5
13.0
13.5
0.0
0.1
0.2
0.3
0.4
0.5
0.6
Absolute Price Performance (Left Axis)Relative to Index (Right Axis)
Placer Dome is a high free cash flow generator, with an enviable track record for developing projects.
• Relatively low-cost operations and diversified risk. Placer�s collection of open-pit and underground gold mines in North America, Australia, Latin America, Papua New Guinea and South Africa, together with its significant exposure to copper prices, diversify the political, operational and to some extent commodity price risk.
• A robust and valuable, yet moderate hedge position. Placer has around 7.3 million ounces hedged, which represents only around 2.8 years of production based on 2002 levels. In a low gold price environment, Placer�s hedge book with a mark-to-market value of $490 million as of December 31, 2001 (based upon a spot price of $282 per ounce) is a valuable asset.
• Quality earnings with a balance of downside protection and upside exposure. Just over a third of 2002 production is hedged, mainly through fixed forwards, while Placer retains exposure to gold prices with the balance. One-quarter of Placer Dome�s revenue this year should come from copper, principally from its 100%-owned long-life Zaldivar mine in Chile.
Valuation
Our one-year target price is $13. Our target price is based upon a 2.2X multiple of our base case DCF value of $6.04 per share based on a long-term $325 per ounce gold price, $0.85 per pound copper and a 5% discount rate. At higher gold prices Placer�s DCF valuation tends to be less attractive than that of unhedged companies like Newmont, but it has good free cash flow generating ability and balanced exposure to the gold price.
Placer Dome is a reputed explorer and operator. It has a globally diverse portfolio of operations, a valuable hedge book, and a solid balance sheet. Key assets include interests in the Cortez mine in Nevada, the South Deep mine in South Africa, the Granny Smith mine in Australia, with exposure to copper through the Zaldivar mine in Chile.
Daniel McConvey [email protected] New York: 1-212-902-2360
James Copland [email protected] New York: 1-212-357-3519
Global Metals & Mining: Gold
Goldman Sachs Global Equity Research 33
Key risks
Placer has a declining production profile that is more pronounced that that of its competitors. Based on its current operating assets, Placer�s annual production will decline to around 2.1 million ounces by 2005 then drop off to around 1.3 million ounces by 2010, according to our model. Following the writedown of reserves at its Las Cristinas property in Venezuela, and the Getchell property last year, Placer now has no reserves at non-operating properties.
Financials
Placer has US$400 million in net debt and a relatively low net debt-to-net debt plus equity ratio of 23% as of December 31, 2001. Placer�s comfortable debt level and its solid cash flow generating ability, underpinned by its hedge book, ensure that it maintains financial flexibility even in a low gold price environment. As with all gold producers, Placer is focused on achieving competitive rates of return on capital.
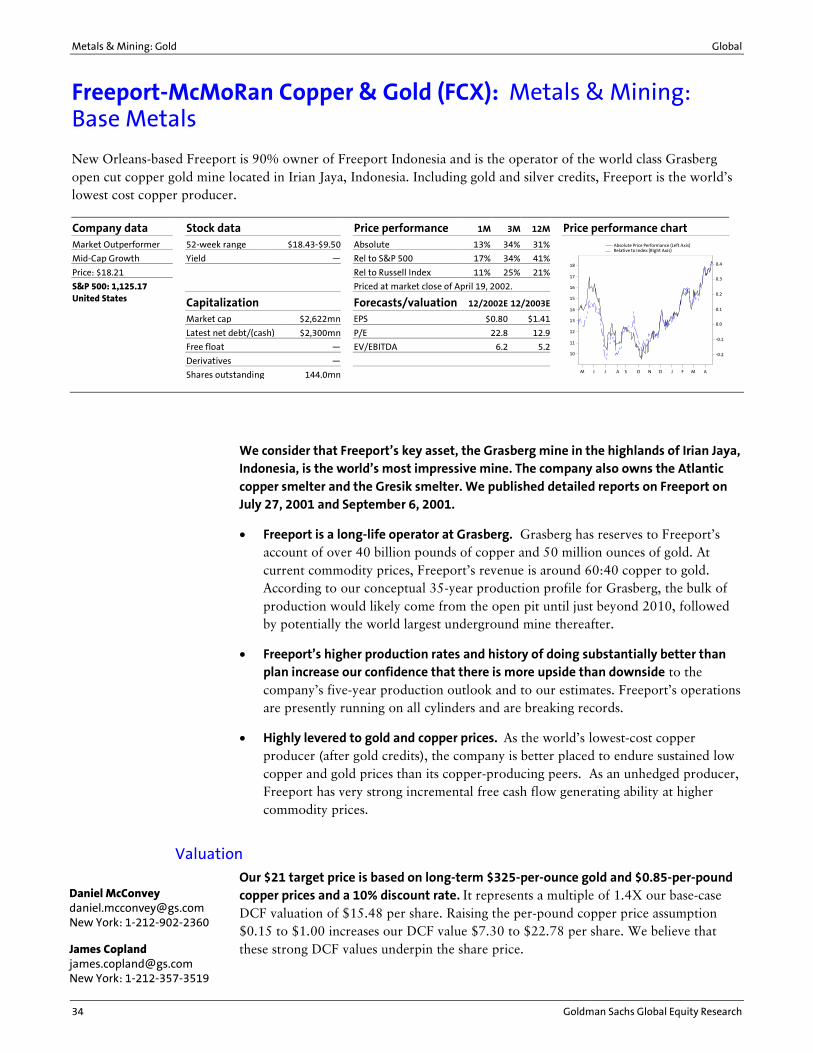
Metals & Mining: Gold Global
34 Goldman Sachs Global Equity Research
Freeport-McMoRan Copper & Gold (FCX): Metals & Mining: Base Metals
Company data Stock data Price performance 1M 3M 12M Price performance chart Market Outperformer 52-week range $18.43-$9.50 Absolute 13% 34% 31%
Mid-Cap Growth Yield � Rel to S&P 500 17% 34% 41%
Price: $18.21 Rel to Russell Index 11% 25% 21%
S&P 500: 1,125.17 Priced at market close of April 19, 2002.United States Capitalization Forecasts/valuation 12/2002E 12/2003E
Market cap $2,622mn EPS $0.80 $1.41
Latest net debt/(cash) $2,300mn P/E 22.8 12.9
Free float � EV/EBITDA 6.2 5.2
Derivatives �
Shares outstanding 144.0mn M J J A S O N D J F M A
10
11
12
13
14
15
16
17
18
-0.2
-0.1
0.0
0.1
0.2
0.3
0.4
Absolute Price Performance (Left Axis)Relative to Index (Right Axis)
We consider that Freeport�s key asset, the Grasberg mine in the highlands of Irian Jaya, Indonesia, is the world�s most impressive mine. The company also owns the Atlantic copper smelter and the Gresik smelter. We published detailed reports on Freeport on July 27, 2001 and September 6, 2001.
• Freeport is a long-life operator at Grasberg. Grasberg has reserves to Freeport�s account of over 40 billion pounds of copper and 50 million ounces of gold. At current commodity prices, Freeport�s revenue is around 60:40 copper to gold. According to our conceptual 35-year production profile for Grasberg, the bulk of production would likely come from the open pit until just beyond 2010, followed by potentially the world largest underground mine thereafter.
• Freeport�s higher production rates and history of doing substantially better than plan increase our confidence that there is more upside than downside to the company�s five-year production outlook and to our estimates. Freeport�s operations are presently running on all cylinders and are breaking records.
• Highly levered to gold and copper prices. As the world�s lowest-cost copper producer (after gold credits), the company is better placed to endure sustained low copper and gold prices than its copper-producing peers. As an unhedged producer, Freeport has very strong incremental free cash flow generating ability at higher commodity prices.
Valuation
Our $21 target price is based on long-term $325-per-ounce gold and $0.85-per-pound copper prices and a 10% discount rate. It represents a multiple of 1.4X our base-case DCF valuation of $15.48 per share. Raising the per-pound copper price assumption $0.15 to $1.00 increases our DCF value $7.30 to $22.78 per share. We believe that these strong DCF values underpin the share price.
New Orleans-based Freeport is 90% owner of Freeport Indonesia and is the operator of the world class Grasberg open cut copper gold mine located in Irian Jaya, Indonesia. Including gold and silver credits, Freeport is the world�s lowest cost copper producer.
Daniel McConvey [email protected] New York: 1-212-902-2360
James Copland [email protected] New York: 1-212-357-3519
Global Metals & Mining: Gold
Goldman Sachs Global Equity Research 35
Key risks
Indonesian political risk. On July 23, 2001, the Indonesian Parliament stripped Abdurrahman Wahid of the Presidency and voted in Megawati Sukarnoputri as President. Megawati became the third new President since May 1998, when President Suharto resigned. The independence granted to East Timor, the lack of a strong government, greater freedom of expression, and economic hardships stemming from the East Asian crisis of 1998 have all added major fuel to independence movements in Indonesian provinces. These include Aceh, in the far west of Indonesia, and Irian Jaya, to the far east of the country where Freeport�s mine is located. Elsewhere in Indonesia, there has been violence between religious and racial groups. Megawati is a strong advocate of the need to keep the country unified, and the hope is that the new government, with a more united Parliament, will offer greater national stability. Our view is that Indonesia will likely get through this rough historical period and that the country will remain unified. However, there is clearly significant risk that strife could continue.
A weaker or slower than expected global economic recovery may be negative for copper prices.
Financials
Although Freeport�s approximately $2.3 billion debt is substantial, the company has very strong free cash flow-generating potential. After annual capex of around $150 million and dividend payments of $80 million, our model indicates that Freeport can still generate over $350 million per year in free cash flow over the next decade, based upon $300 per ounce and $0.85 per pound gold and copper prices, respectively.
Recent common share reclassification may provide a small positive medium term impetus. Freeport recently announced plans to reclassify its A (ticker FCXA) and B (Ticker FCX) common shares into a single class of common stock on a one-for-one basis. If approved by the majority of each class of shareholders, this should provide a small positive medium-term impetus to the share price given the resulting improvements in capital structure simplicity and the share liquidity. The Class B common shares have greater per-share board electing power and greater liquidity, and we would expect these shares to continue to trade at a very small premium until the shareholder vote, which is likely to be in May 2002.
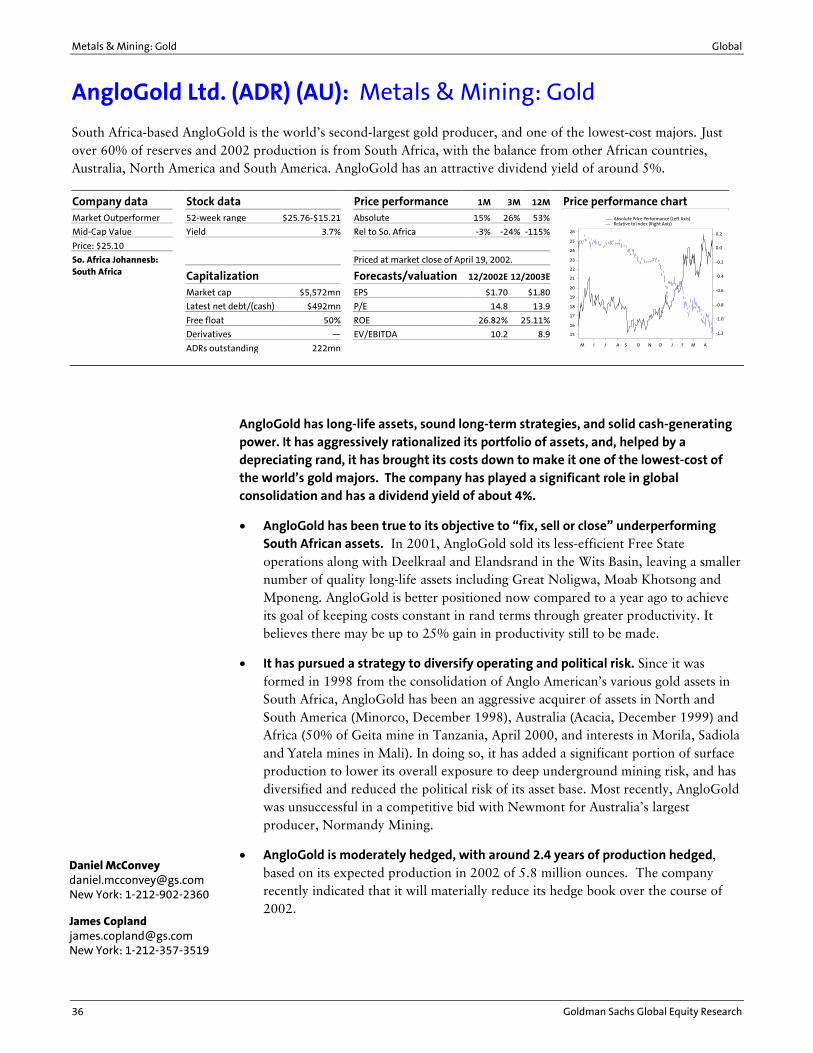
Metals & Mining: Gold Global
36 Goldman Sachs Global Equity Research
AngloGold Ltd. (ADR) (AU): Metals & Mining: Gold
Company data Stock data Price performance 1M 3M 12M Price performance chart Market Outperformer 52-week range $25.76-$15.21 Absolute 15% 26% 53%
Mid-Cap Value Yield 3.7% Rel to So. Africa -3% -24% -115%
Price: $25.10
So. Africa Johannesb: Priced at market close of April 19, 2002.South Africa Capitalization Forecasts/valuation 12/2002E 12/2003E
Market cap $5,572mn EPS $1.70 $1.80
Latest net debt/(cash) $492mn P/E 14.8 13.9
Free float 50% ROE 26.82% 25.11%
Derivatives � EV/EBITDA 10.2 8.9
ADRs outstanding 222mn M J J A S O N D J F M A
15
16
17
18
19
20
21
22
23
24
25
26
-1.2
-1.0
-0.8
-0.6
-0.4
-0.2
0.0
0.2
Absolute Price Performance (Left Axis)Relative to Index (Right Axis)
AngloGold has long-life assets, sound long-term strategies, and solid cash-generating power. It has aggressively rationalized its portfolio of assets, and, helped by a depreciating rand, it has brought its costs down to make it one of the lowest-cost of the world�s gold majors. The company has played a significant role in global consolidation and has a dividend yield of about 4%.
• AngloGold has been true to its objective to �fix, sell or close� underperforming South African assets. In 2001, AngloGold sold its less-efficient Free State operations along with Deelkraal and Elandsrand in the Wits Basin, leaving a smaller number of quality long-life assets including Great Noligwa, Moab Khotsong and Mponeng. AngloGold is better positioned now compared to a year ago to achieve its goal of keeping costs constant in rand terms through greater productivity. It believes there may be up to 25% gain in productivity still to be made.
• It has pursued a strategy to diversify operating and political risk. Since it was formed in 1998 from the consolidation of Anglo American�s various gold assets in South Africa, AngloGold has been an aggressive acquirer of assets in North and South America (Minorco, December 1998), Australia (Acacia, December 1999) and Africa (50% of Geita mine in Tanzania, April 2000, and interests in Morila, Sadiola and Yatela mines in Mali). In doing so, it has added a significant portion of surface production to lower its overall exposure to deep underground mining risk, and has diversified and reduced the political risk of its asset base. Most recently, AngloGold was unsuccessful in a competitive bid with Newmont for Australia�s largest producer, Normandy Mining.
• AngloGold is moderately hedged, with around 2.4 years of production hedged, based on its expected production in 2002 of 5.8 million ounces. The company recently indicated that it will materially reduce its hedge book over the course of 2002.
South Africa-based AngloGold is the world�s second-largest gold producer, and one of the lowest-cost majors. Just over 60% of reserves and 2002 production is from South Africa, with the balance from other African countries, Australia, North America and South America. AngloGold has an attractive dividend yield of around 5%.
Daniel McConvey [email protected] New York: 1-212-902-2360
James Copland [email protected] New York: 1-212-357-3519
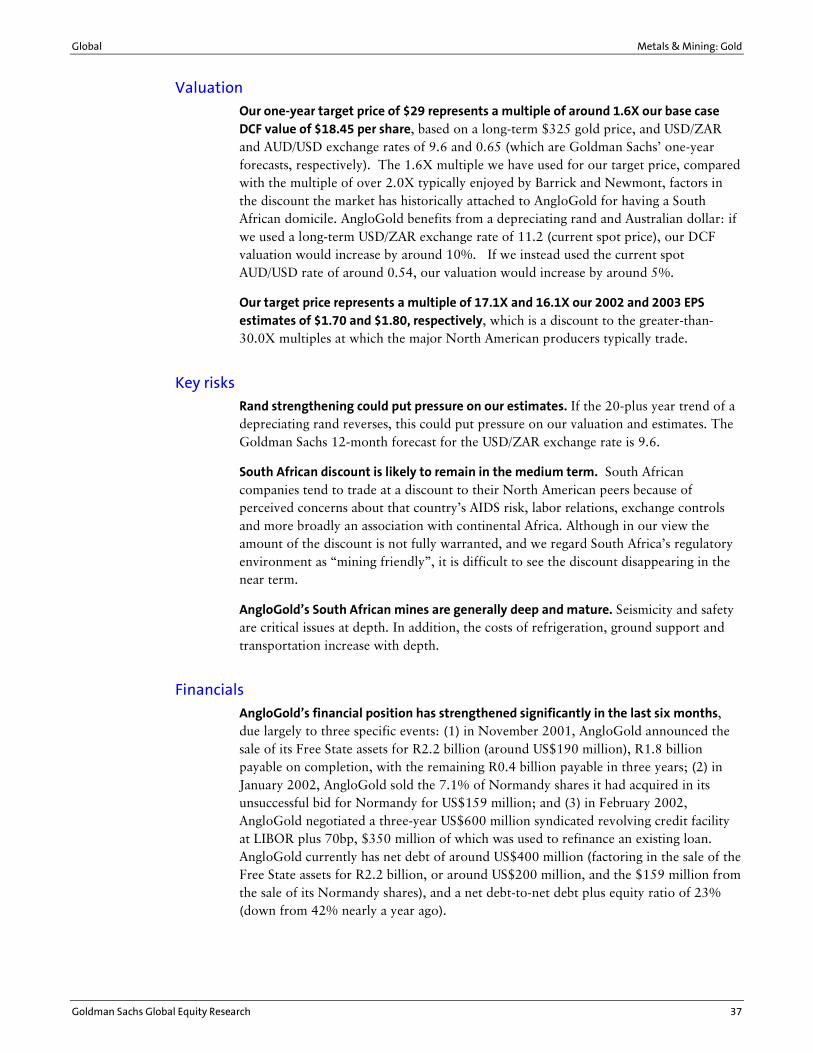
Global Metals & Mining: Gold
Goldman Sachs Global Equity Research 37
Valuation
Our one-year target price of $29 represents a multiple of around 1.6X our base case DCF value of $18.45 per share, based on a long-term $325 gold price, and USD/ZAR and AUD/USD exchange rates of 9.6 and 0.65 (which are Goldman Sachs� one-year forecasts, respectively). The 1.6X multiple we have used for our target price, compared with the multiple of over 2.0X typically enjoyed by Barrick and Newmont, factors in the discount the market has historically attached to AngloGold for having a South African domicile. AngloGold benefits from a depreciating rand and Australian dollar: if we used a long-term USD/ZAR exchange rate of 11.2 (current spot price), our DCF valuation would increase by around 10%. If we instead used the current spot AUD/USD rate of around 0.54, our valuation would increase by around 5%.
Our target price represents a multiple of 17.1X and 16.1X our 2002 and 2003 EPS estimates of $1.70 and $1.80, respectively, which is a discount to the greater-than-30.0X multiples at which the major North American producers typically trade.
Key risks
Rand strengthening could put pressure on our estimates. If the 20-plus year trend of a depreciating rand reverses, this could put pressure on our valuation and estimates. The Goldman Sachs 12-month forecast for the USD/ZAR exchange rate is 9.6.
South African discount is likely to remain in the medium term. South African companies tend to trade at a discount to their North American peers because of perceived concerns about that country�s AIDS risk, labor relations, exchange controls and more broadly an association with continental Africa. Although in our view the amount of the discount is not fully warranted, and we regard South Africa�s regulatory environment as �mining friendly�, it is difficult to see the discount disappearing in the near term.
AngloGold�s South African mines are generally deep and mature. Seismicity and safety are critical issues at depth. In addition, the costs of refrigeration, ground support and transportation increase with depth.
Financials
AngloGold�s financial position has strengthened significantly in the last six months, due largely to three specific events: (1) in November 2001, AngloGold announced the sale of its Free State assets for R2.2 billion (around US$190 million), R1.8 billion payable on completion, with the remaining R0.4 billion payable in three years; (2) in January 2002, AngloGold sold the 7.1% of Normandy shares it had acquired in its unsuccessful bid for Normandy for US$159 million; and (3) in February 2002, AngloGold negotiated a three-year US$600 million syndicated revolving credit facility at LIBOR plus 70bp, $350 million of which was used to refinance an existing loan. AngloGold currently has net debt of around US$400 million (factoring in the sale of the Free State assets for R2.2 billion, or around US$200 million, and the $159 million from the sale of its Normandy shares), and a net debt-to-net debt plus equity ratio of 23% (down from 42% nearly a year ago).
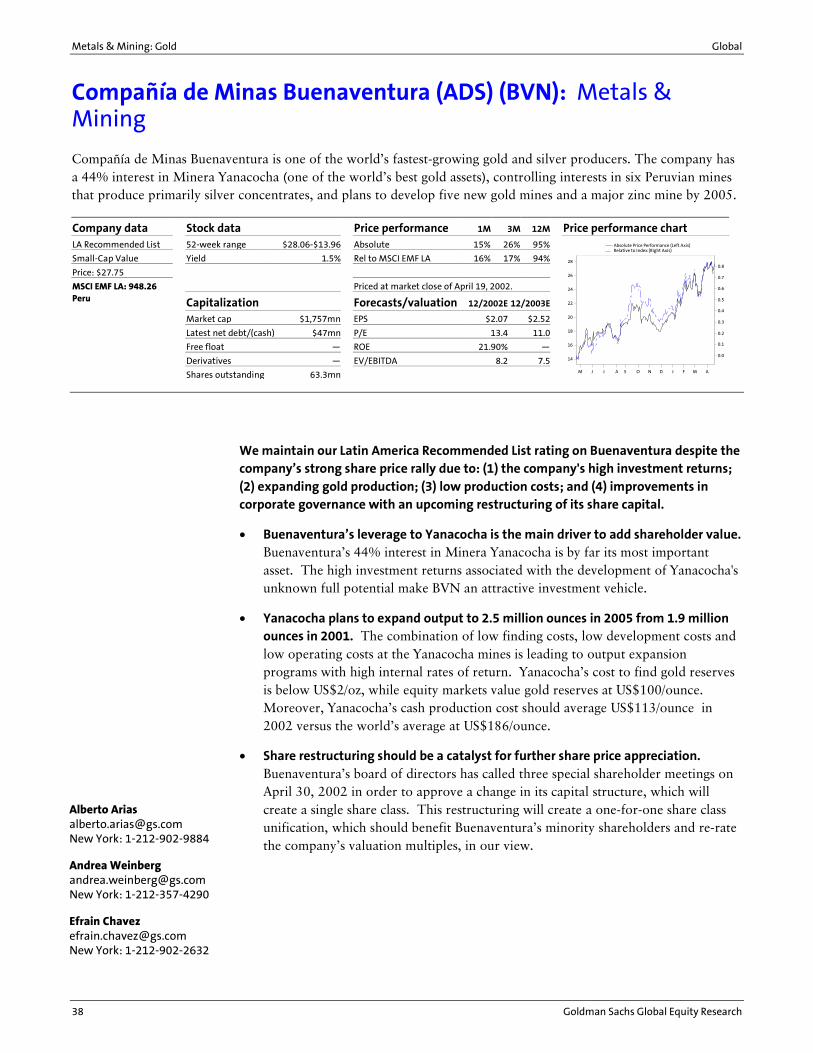
Metals & Mining: Gold Global
38 Goldman Sachs Global Equity Research
Compañía de Minas Buenaventura (ADS) (BVN): Metals & Mining
Company data Stock data Price performance 1M 3M 12M Price performance chart LA Recommended List 52-week range $28.06-$13.96 Absolute 15% 26% 95%
Small-Cap Value Yield 1.5% Rel to MSCI EMF LA 16% 17% 94%
Price: $27.75
MSCI EMF LA: 948.26 Priced at market close of April 19, 2002.Peru Capitalization Forecasts/valuation 12/2002E 12/2003E
Market cap $1,757mn EPS $2.07 $2.52
Latest net debt/(cash) $47mn P/E 13.4 11.0
Free float � ROE 21.90% �
Derivatives � EV/EBITDA 8.2 7.5
Shares outstanding 63.3mn M J J A S O N D J F M A
14
16
18
20
22
24
26
28
0.0
0.1
0.2
0.3
0.4
0.5
0.6
0.7
0.8
Absolute Price Performance (Left Axis)Relative to Index (Right Axis)
We maintain our Latin America Recommended List rating on Buenaventura despite the company�s strong share price rally due to: (1) the company's high investment returns; (2) expanding gold production; (3) low production costs; and (4) improvements in corporate governance with an upcoming restructuring of its share capital.
• Buenaventura�s leverage to Yanacocha is the main driver to add shareholder value. Buenaventura�s 44% interest in Minera Yanacocha is by far its most important asset. The high investment returns associated with the development of Yanacocha's unknown full potential make BVN an attractive investment vehicle.
• Yanacocha plans to expand output to 2.5 million ounces in 2005 from 1.9 million ounces in 2001. The combination of low finding costs, low development costs and low operating costs at the Yanacocha mines is leading to output expansion programs with high internal rates of return. Yanacocha�s cost to find gold reserves is below US$2/oz, while equity markets value gold reserves at US$100/ounce. Moreover, Yanacocha�s cash production cost should average US$113/ounce in 2002 versus the world�s average at US$186/ounce.
• Share restructuring should be a catalyst for further share price appreciation. Buenaventura�s board of directors has called three special shareholder meetings on April 30, 2002 in order to approve a change in its capital structure, which will create a single share class. This restructuring will create a one-for-one share class unification, which should benefit Buenaventura�s minority shareholders and re-rate the company�s valuation multiples, in our view.
Compañía de Minas Buenaventura is one of the world�s fastest-growing gold and silver producers. The company has a 44% interest in Minera Yanacocha (one of the world�s best gold assets), controlling interests in six Peruvian mines that produce primarily silver concentrates, and plans to develop five new gold mines and a major zinc mine by 2005.
Alberto Arias [email protected] New York: 1-212-902-9884
Andrea Weinberg [email protected] New York: 1-212-357-4290
Efrain Chavez [email protected] New York: 1-212-902-2632
Global Metals & Mining: Gold
Goldman Sachs Global Equity Research 39
Valuation
Buenaventura is trading at a discount to the valuation parameters of its global gold mining peers based on our 2002 and 2003 estimates, a characteristic that is attractive to investors in light of Buenaventura�s superior growth prospects. Our target price for Buenaventura represents an EV/EBITDA multiple of 9.1X and 8.4X our 2002 and 2003 estimates, respectively.
Key risks
Poor operating results at some small Buenaventura silver and zinc mines. The company�s smaller zinc and silver mines have substantially lower investment returns than its gold assets. However, the performance of Buenaventura�s non-Yanacocha assets has improved materially over the past two years.
Peru�s political environment. All of Buenaventura�s assets are in Peru. This country has had periods of political uncertainty over the past two years. However, political risks have declined after the election of Alejandro Toledo.
Financials
Buenaventura has around $47 million in net debt. We expect Buenaventura�s EBITDA to increase 52.0% in 2002 and 8.6% in 2003 due to output growth and lower costs at Yanacocha, as well as cost reductions at Buenaventura-operated medium-sized silver mines.
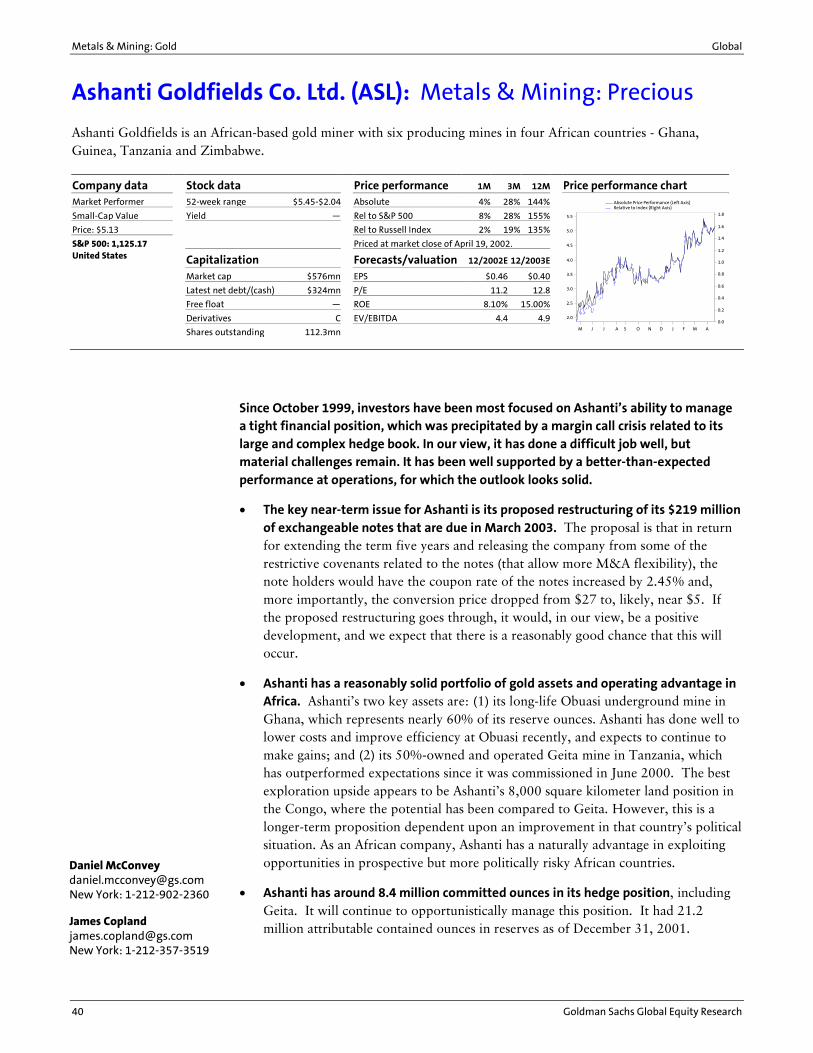
Metals & Mining: Gold Global
40 Goldman Sachs Global Equity Research
Ashanti Goldfields Co. Ltd. (ASL): Metals & Mining: Precious
Company data Stock data Price performance 1M 3M 12M Price performance chart Market Performer 52-week range $5.45-$2.04 Absolute 4% 28% 144%
Small-Cap Value Yield � Rel to S&P 500 8% 28% 155%
Price: $5.13 Rel to Russell Index 2% 19% 135%
S&P 500: 1,125.17 Priced at market close of April 19, 2002.United States Capitalization Forecasts/valuation 12/2002E 12/2003E
Market cap $576mn EPS $0.46 $0.40
Latest net debt/(cash) $324mn P/E 11.2 12.8
Free float � ROE 8.10% 15.00%
Derivatives C EV/EBITDA 4.4 4.9
Shares outstanding 112.3mn M J J A S O N D J F M A
2.0
2.5
3.0
3.5
4.0
4.5
5.0
5.5
0.0
0.2
0.4
0.6
0.8
1.0
1.2
1.4
1.6
1.8
Absolute Price Performance (Left Axis)Relative to Index (Right Axis)
Since October 1999, investors have been most focused on Ashanti�s ability to manage a tight financial position, which was precipitated by a margin call crisis related to its large and complex hedge book. In our view, it has done a difficult job well, but material challenges remain. It has been well supported by a better-than-expected performance at operations, for which the outlook looks solid.
• The key near-term issue for Ashanti is its proposed restructuring of its $219 million of exchangeable notes that are due in March 2003. The proposal is that in return for extending the term five years and releasing the company from some of the restrictive covenants related to the notes (that allow more M&A flexibility), the note holders would have the coupon rate of the notes increased by 2.45% and, more importantly, the conversion price dropped from $27 to, likely, near $5. If the proposed restructuring goes through, it would, in our view, be a positive development, and we expect that there is a reasonably good chance that this will occur.
• Ashanti has a reasonably solid portfolio of gold assets and operating advantage in Africa. Ashanti�s two key assets are: (1) its long-life Obuasi underground mine in Ghana, which represents nearly 60% of its reserve ounces. Ashanti has done well to lower costs and improve efficiency at Obuasi recently, and expects to continue to make gains; and (2) its 50%-owned and operated Geita mine in Tanzania, which has outperformed expectations since it was commissioned in June 2000. The best exploration upside appears to be Ashanti�s 8,000 square kilometer land position in the Congo, where the potential has been compared to Geita. However, this is a longer-term proposition dependent upon an improvement in that country�s political situation. As an African company, Ashanti has a naturally advantage in exploiting opportunities in prospective but more politically risky African countries.
• Ashanti has around 8.4 million committed ounces in its hedge position, including Geita. It will continue to opportunistically manage this position. It had 21.2 million attributable contained ounces in reserves as of December 31, 2001.
Ashanti Goldfields is an African-based gold miner with six producing mines in four African countries - Ghana, Guinea, Tanzania and Zimbabwe.
Daniel McConvey [email protected] New York: 1-212-902-2360
James Copland [email protected] New York: 1-212-357-3519
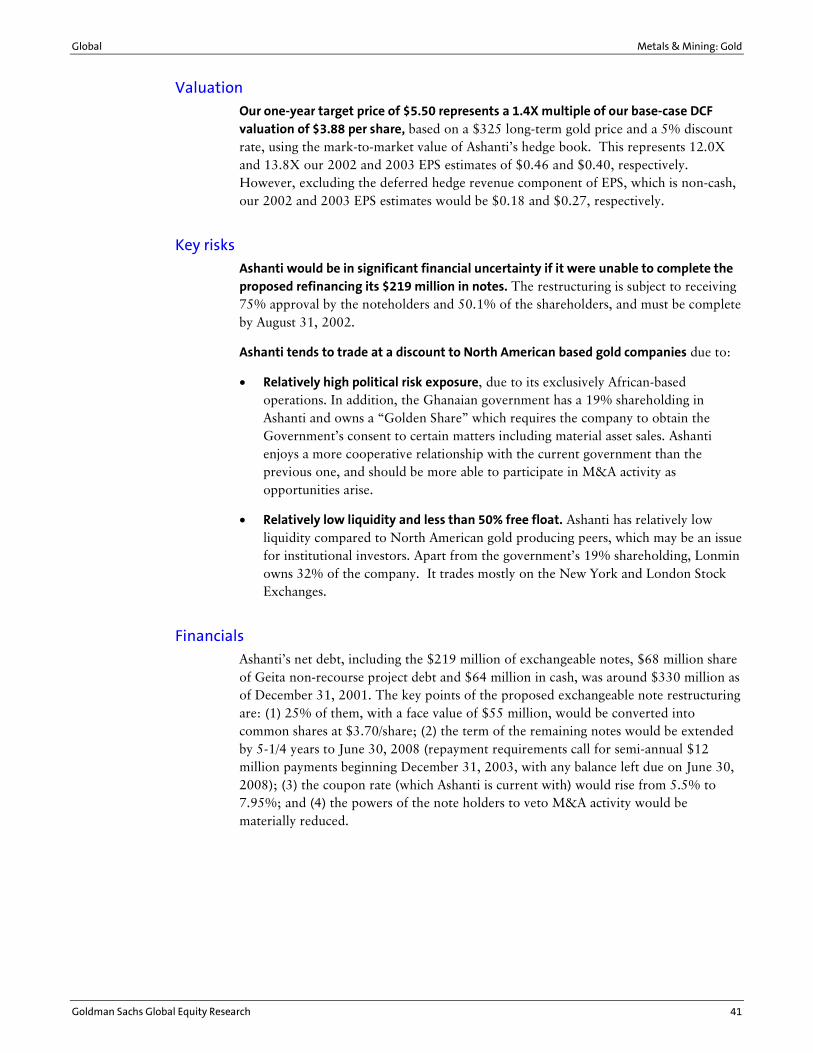
Global Metals & Mining: Gold
Goldman Sachs Global Equity Research 41
Valuation
Our one-year target price of $5.50 represents a 1.4X multiple of our base-case DCF valuation of $3.88 per share, based on a $325 long-term gold price and a 5% discount rate, using the mark-to-market value of Ashanti�s hedge book. This represents 12.0X and 13.8X our 2002 and 2003 EPS estimates of $0.46 and $0.40, respectively. However, excluding the deferred hedge revenue component of EPS, which is non-cash, our 2002 and 2003 EPS estimates would be $0.18 and $0.27, respectively.
Key risks
Ashanti would be in significant financial uncertainty if it were unable to complete the proposed refinancing its $219 million in notes. The restructuring is subject to receiving 75% approval by the noteholders and 50.1% of the shareholders, and must be complete by August 31, 2002.
Ashanti tends to trade at a discount to North American based gold companies due to:
• Relatively high political risk exposure, due to its exclusively African-based operations. In addition, the Ghanaian government has a 19% shareholding in Ashanti and owns a �Golden Share� which requires the company to obtain the Government�s consent to certain matters including material asset sales. Ashanti enjoys a more cooperative relationship with the current government than the previous one, and should be more able to participate in M&A activity as opportunities arise.
• Relatively low liquidity and less than 50% free float. Ashanti has relatively low liquidity compared to North American gold producing peers, which may be an issue for institutional investors. Apart from the government�s 19% shareholding, Lonmin owns 32% of the company. It trades mostly on the New York and London Stock Exchanges.
Financials
Ashanti�s net debt, including the $219 million of exchangeable notes, $68 million share of Geita non-recourse project debt and $64 million in cash, was around $330 million as of December 31, 2001. The key points of the proposed exchangeable note restructuring are: (1) 25% of them, with a face value of $55 million, would be converted into common shares at $3.70/share; (2) the term of the remaining notes would be extended by 5-1/4 years to June 30, 2008 (repayment requirements call for semi-annual $12 million payments beginning December 31, 2003, with any balance left due on June 30, 2008); (3) the coupon rate (which Ashanti is current with) would rise from 5.5% to 7.95%; and (4) the powers of the note holders to veto M&A activity would be materially reduced.
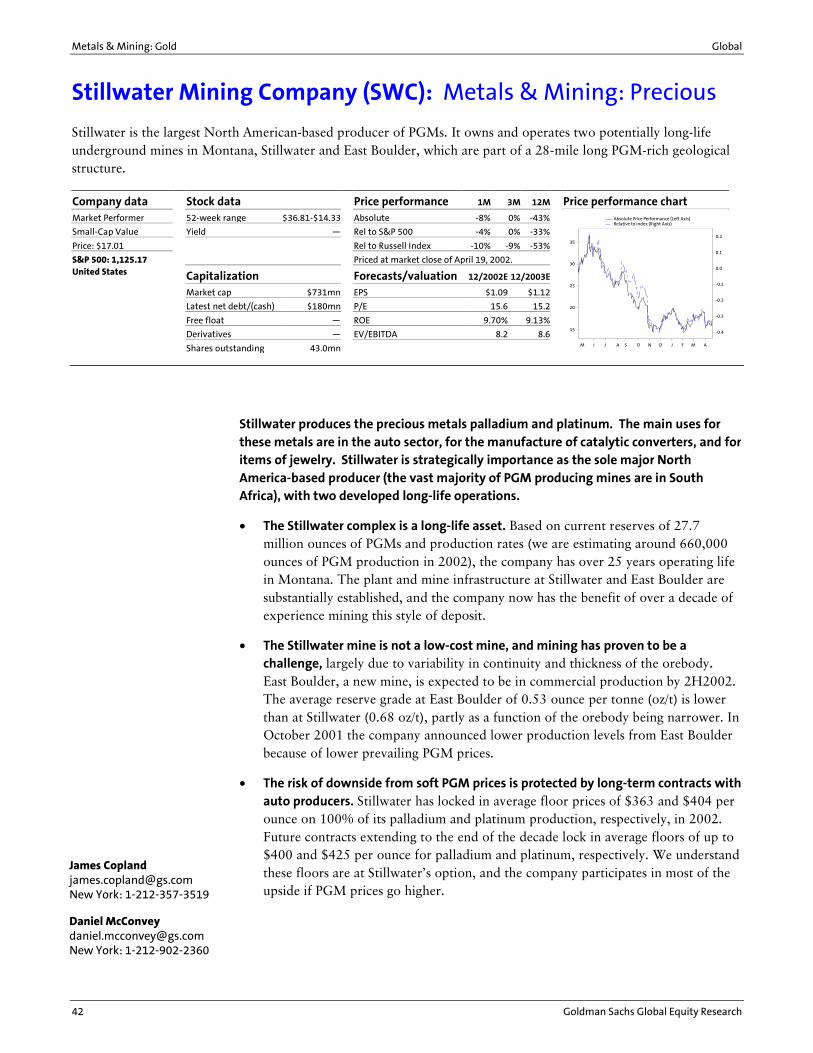
Metals & Mining: Gold Global
42 Goldman Sachs Global Equity Research
Stillwater Mining Company (SWC): Metals & Mining: Precious
Company data Stock data Price performance 1M 3M 12M Price performance chart Market Performer 52-week range $36.81-$14.33 Absolute -8% 0% -43%
Small-Cap Value Yield � Rel to S&P 500 -4% 0% -33%
Price: $17.01 Rel to Russell Index -10% -9% -53%
S&P 500: 1,125.17 Priced at market close of April 19, 2002.United States Capitalization Forecasts/valuation 12/2002E 12/2003E
Market cap $731mn EPS $1.09 $1.12
Latest net debt/(cash) $180mn P/E 15.6 15.2
Free float � ROE 9.70% 9.13%
Derivatives � EV/EBITDA 8.2 8.6
Shares outstanding 43.0mn M J J A S O N D J F M A
15
20
25
30
35
-0.4
-0.3
-0.2
-0.1
0.0
0.1
0.2
Absolute Price Performance (Left Axis)Relative to Index (Right Axis)
Stillwater produces the precious metals palladium and platinum. The main uses for these metals are in the auto sector, for the manufacture of catalytic converters, and for items of jewelry. Stillwater is strategically importance as the sole major North America-based producer (the vast majority of PGM producing mines are in South Africa), with two developed long-life operations.
• The Stillwater complex is a long-life asset. Based on current reserves of 27.7 million ounces of PGMs and production rates (we are estimating around 660,000 ounces of PGM production in 2002), the company has over 25 years operating life in Montana. The plant and mine infrastructure at Stillwater and East Boulder are substantially established, and the company now has the benefit of over a decade of experience mining this style of deposit.
• The Stillwater mine is not a low-cost mine, and mining has proven to be a challenge, largely due to variability in continuity and thickness of the orebody. East Boulder, a new mine, is expected to be in commercial production by 2H2002. The average reserve grade at East Boulder of 0.53 ounce per tonne (oz/t) is lower than at Stillwater (0.68 oz/t), partly as a function of the orebody being narrower. In October 2001 the company announced lower production levels from East Boulder because of lower prevailing PGM prices.
• The risk of downside from soft PGM prices is protected by long-term contracts with auto producers. Stillwater has locked in average floor prices of $363 and $404 per ounce on 100% of its palladium and platinum production, respectively, in 2002. Future contracts extending to the end of the decade lock in average floors of up to $400 and $425 per ounce for palladium and platinum, respectively. We understand these floors are at Stillwater�s option, and the company participates in most of the upside if PGM prices go higher.
Stillwater is the largest North American-based producer of PGMs. It owns and operates two potentially long-life underground mines in Montana, Stillwater and East Boulder, which are part of a 28-mile long PGM-rich geological structure.
James Copland [email protected] New York: 1-212-357-3519
Daniel McConvey [email protected] New York: 1-212-902-2360
Global Metals & Mining: Gold
Goldman Sachs Global Equity Research 43
Valuation
Our one-year target price of $18 is based on a 1.4X multiple of our base case DCF value for Stillwater of $12.80 per share. This multiple is roughly equivalent to the multiple at which mid-tier North American gold producers have historically traded. We believe this premium multiple is appropriate because: (1) in our view, Stillwater is currently the stock of choice in a limited field for North American investors seeking relatively liquid exposure to the PGMs; and (2) Stillwater has significant leverage to PGM prices above $400 per ounce. We believe a premium for this leverage is justified. Assuming a $100 per ounce increase in palladium prices to $500 per ounce, we estimate Stillwater�s DCF value to be $23.80 using a 5% discount rate. Our valuation and estimates are based on long-term $400 and $450 per-ounce palladium and platinum prices. Our $18 target price represents P/E multiples of 17.8X and 16.2X our 2002 and 2003 estimates, respectively. This compares favorably with historical P/E multiples of large-cap gold companies in our universe of around 30X, and with the S&P 500 P/E average, which is currently over 20X.
Key risks
The biggest risk to our view is softness in palladium and platinum prices. Despite the long-term contracts described above, if palladium prices decline closer to $300 per ounce or lower, this would likely put pressure on Stillwater�s share price because of probable concerns among investors about the possibility of contracts with auto producers being renegotiated in a low-price environment.
Operating risk is also material and history has shown that the Stillwater complex is challenging to mine. On a number of occasions in recent years, Stillwater has failed to meet its own production and costs forecasts. This has understandably generated negative investor sentiment. Going forward, the market may be somewhat skeptical of the company�s forecasts and less inclined to factor in positive operating upside until any such has been demonstrated.
SEC review of Stillwater�s reserves may cause near-term uncertainty. The SEC has indicated that Stillwater may be required to reclassify probable reserves to mineralized material. Discussions continue. Although this does not change the economics of mining at Stillwater, there may be some uncertainty until the issue is resolved.
Financials
Financial risk has been reduced following Stillwater�s $60 million private placement in February 2002. Post the equity issue, Stillwater�s net debt-to-net debt plus equity ratio fell to around 25% from 34%, and net debt decreased to around $180 million. The proceeds will be used to pay down $25 million of Stillwater�s revolving credit facility (which remains available to draw down) and the balance will be used for general corporate purposes. The company has a further $25 million available under its credit facility, but this is subject to it meeting certain operating targets. According to our model Stillwater will generate around $90 million in cash flow in 2002 with capex requirements of $75 million. We expect Stillwater will start to generate around $40 to $50 million per year of free cash flow from 2005 based on a palladium and platinum prices of $400 and $450 per ounce, respectively.

Metals & Mining: Gold Global
44 Goldman Sachs Global Equity Research
Teck Cominco Ltd. (Toronto) (TEK__B.CA): Metals & Mining: Precious
Company data Stock data Price performance 1M 3M 12M Price performance chart Market Performer 52-week range C$17.69-C$9.90 Absolute 2% 17% -4%
Small-Cap Value Yield 1.3% Rel to Toronto Composite 3% 14% -1%
Price: C$15.40
Toronto Composite: Priced at market close of April 19, 2002.Canada Capitalization Forecasts/valuation 12/2002E 12/2003E
Market cap C$2,841mn EPS C$0.49 C$0.99
Latest net debt/(cash) C$900mn P/E 31.4 15.6
Free float � ROE 3.90% �
Derivatives C EV/EBITDA 7.7 6.1
Shares outstanding 184.5mn M J J A S O N D J F M A
10
11
12
13
14
15
16
17
18
-0.25
-0.20
-0.15
-0.10
-0.05
0.00
0.05
0.10
Absolute Price Performance (Left Axis)Relative to Index (Right Axis)
Our estimates suggest that Teck Cominco will generate consistent and solid earnings going forward. It has a strong and strategic position in the zinc business with the newly expanded Red Dog mine, the Trail Smelter Complex and the Cajamarquilla zinc refinery. Management is disciplined about return on capital objectives. The company�s future earnings growth is based on assets that are already built and the longevity of its reserve and asset base sticks out in our universe.
• We expect solid earnings growth. Based on our per-pound zinc and copper price forecasts for 2002, 2003, and 2004 of $0.40 and $0.72, $0.44 and $0.80, and $0.45 and $0.85, respectively, we estimate that Teck Cominco�s per-share earnings will grow from C$0.49 in 2002 to C$1.34 in 2004. The earnings power and quality of this company are, in our universe, matched only by Freeport-McMoRan Copper and Gold, which has significantly higher political risk and debt but is not hampered by a multiple voting-share structure.
• In our view, Teck Cominco�s demonstration of capital discipline has been impressive in recent years. Former Cominco CEO David Thompson nurtured a discipline at Cominco of investing only in zinc projects capable of generating a 10% rate of return at a $0.45/lb zinc price, which is at the low end of its historical average. That discipline has paid dividends, in our view, and is now being applied at Teck Cominco, where Thompson has assumed the CEO role following the July 2001 merger of Teck and Cominco.
• We are optimistic that Teck Cominco�s new 22.5% owned Antamina zinc/copper mine in Peru may turn out to be a better-than-expected performer. The mine has known metallurgical challenges. However, throughput rates, metallurgical recoveries, and metal output to date have been at, or in excess of, targets.
Teck Cominco is one of the world�s largest zinc producers. Its Red Dog mine in Alaska has the world�s largest zinc reserves. Its Trail, British Columbia and Cajamarquilla, Peru metallurgical facilities account for significant percentages of the world�s zinc and lead output, respectively. Other key assets include 64% of Highland Valley Copper in British Columbia,and 22.5% of Peru�s Antamina.
Daniel McConvey [email protected] New York: 1-212-902-2360
Alberto Arias [email protected] New York: 1-212-902-9884
Don Newman [email protected] New York: 1-212-902-2907
Global Metals & Mining: Gold
Goldman Sachs Global Equity Research 45
Valuation
Our one-year price target is C$17. Teck Cominco�s valuation relative to other metals stocks is attractive. At current C$15 share prices, Teck trades at about 1.1X its DCF value, calculated using a 10% discount rate and long-term zinc and copper prices of $0.45 and $0.85, respectively. This includes a charge for G&A. Only our DCF estimates for Freeport use these same parameters. In contrast, our gold company cash flows are discounted using a 5% discount rate with no charges for G&A. Accordingly, not only is the 1.1 multiple low on an absolute basis relative to our gold stock universe, it is especially low once the higher discount rate is factored in. Using long-term per-pound zinc and copper prices of $0.50 and $0.90 respectively, Teck Cominco�s DCF value is C$16.50. We have used this upper-end estimate for our revised target price, as we believe that current market bullishness concerning commodities is, rightly or wrongly, discounting higher price assumptions in equities.
Key risks
The new Antamina mine represents almost C$4 or 30% of our net C$13.40 base-case DCF value for Teck Cominco. We are encouraged with the progress of that project. However, as a new project in a developing country and with metallurgical complexities, the inherent risk in our valuation is higher than it would be for an established project.
We understand that CEO David Thompson is in his early 60s and we would not be surprised to see him to retire in the next three years. As noted above, Thompson was the leader of Cominco�s capital discipline policy making. We consider that he is an impressive, hands-on return-focused company leader who stands out in our universe. We think Chairman Norman Keevil and President Steven Dean are well thought of in the market, but we judge that Thompson�s retirement will be a loss.
We are not optimistic that the multiple-voting share structure for Teck Cominco will be unwound in the medium term. In our view, investors, especially US investors, discount companies controlled by a multiple-voting share structures like that of Teck Cominco�s. The ideal time to unlock the company�s multiple-voting share structure would seem to have been during last summer�s buyout of the minority interest in Cominco because such a move may have likely lowered the premium Teck would have had to pay the shares of Cominco it did not own. A �coattails� provision was put through that entitles both Class B and Class A shareholders to participate equally in any future company sale. This improved the value of B shares, in our view. However, control of the company remains with the Class A shareholders, who have been controlled by the Keevil family for 30 years. The fact that a full unwinding of the Class A shares was not done at that time makes us skeptical about the possibility of this occurring in the next few years.
Financials
Teck Cominco has a strong financial position. As of December 31, 2001, Teck Cominco had net debt of around C$900 million and a net debt-to-net debt plus equity ratio of 26%. This is actually less than David Thompson�s ideal operating leverage targets. We estimate that the company will consistently generate over C$300 million of free cash flow before dividends after 2003 from its existing asset base.
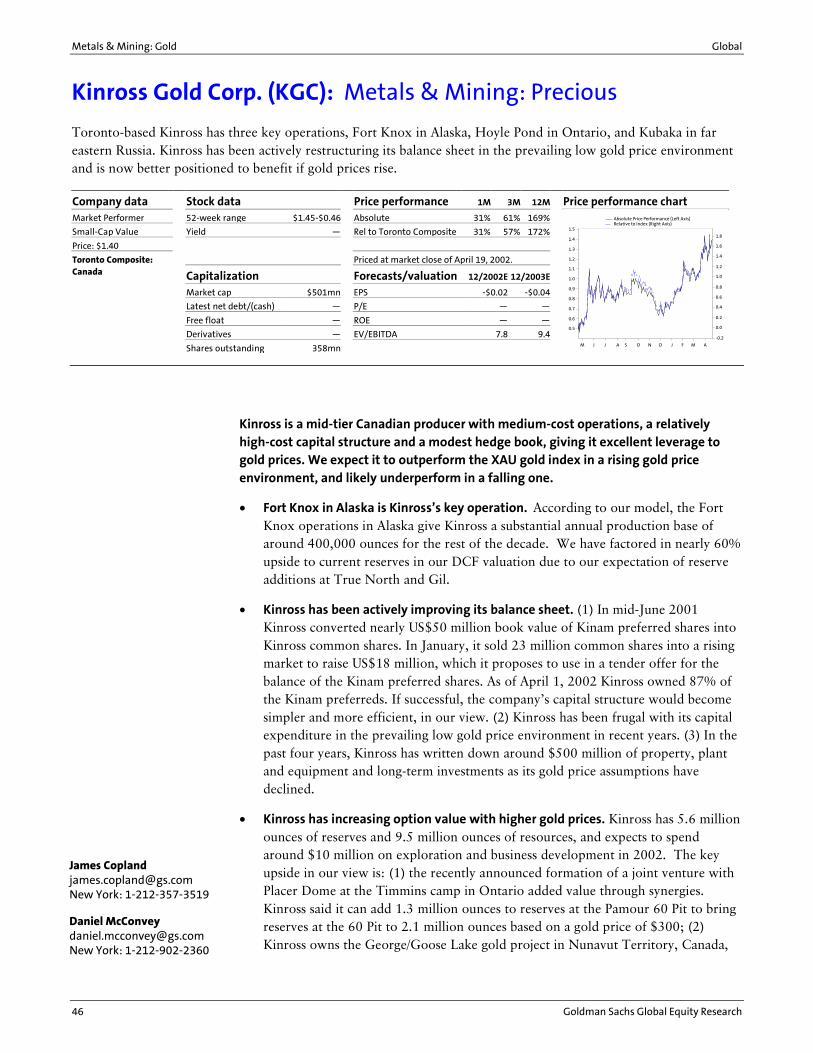
Metals & Mining: Gold Global
46 Goldman Sachs Global Equity Research
Kinross Gold Corp. (KGC): Metals & Mining: Precious
Company data Stock data Price performance 1M 3M 12M Price performance chart Market Performer 52-week range $1.45-$0.46 Absolute 31% 61% 169%
Small-Cap Value Yield � Rel to Toronto Composite 31% 57% 172%
Price: $1.40
Toronto Composite: Priced at market close of April 19, 2002.Canada Capitalization Forecasts/valuation 12/2002E 12/2003E
Market cap $501mn EPS -$0.02 -$0.04
Latest net debt/(cash) � P/E � �
Free float � ROE � �
Derivatives � EV/EBITDA 7.8 9.4
Shares outstanding 358mn M J J A S O N D J F M A
0.5
0.6
0.7
0.8
0.9
1.0
1.1
1.2
1.3
1.4
1.5
-0.2
0.0
0.2
0.4
0.6
0.8
1.0
1.2
1.4
1.6
1.8
Absolute Price Performance (Left Axis)Relative to Index (Right Axis)
Kinross is a mid-tier Canadian producer with medium-cost operations, a relatively high-cost capital structure and a modest hedge book, giving it excellent leverage to gold prices. We expect it to outperform the XAU gold index in a rising gold price environment, and likely underperform in a falling one.
• Fort Knox in Alaska is Kinross�s key operation. According to our model, the Fort Knox operations in Alaska give Kinross a substantial annual production base of around 400,000 ounces for the rest of the decade. We have factored in nearly 60% upside to current reserves in our DCF valuation due to our expectation of reserve additions at True North and Gil.
• Kinross has been actively improving its balance sheet. (1) In mid-June 2001 Kinross converted nearly US$50 million book value of Kinam preferred shares into Kinross common shares. In January, it sold 23 million common shares into a rising market to raise US$18 million, which it proposes to use in a tender offer for the balance of the Kinam preferred shares. As of April 1, 2002 Kinross owned 87% of the Kinam preferreds. If successful, the company�s capital structure would become simpler and more efficient, in our view. (2) Kinross has been frugal with its capital expenditure in the prevailing low gold price environment in recent years. (3) In the past four years, Kinross has written down around $500 million of property, plant and equipment and long-term investments as its gold price assumptions have declined.
• Kinross has increasing option value with higher gold prices. Kinross has 5.6 million ounces of reserves and 9.5 million ounces of resources, and expects to spend around $10 million on exploration and business development in 2002. The key upside in our view is: (1) the recently announced formation of a joint venture with Placer Dome at the Timmins camp in Ontario added value through synergies. Kinross said it can add 1.3 million ounces to reserves at the Pamour 60 Pit to bring reserves at the 60 Pit to 2.1 million ounces based on a gold price of $300; (2) Kinross owns the George/Goose Lake gold project in Nunavut Territory, Canada,
Toronto-based Kinross has three key operations, Fort Knox in Alaska, Hoyle Pond in Ontario, and Kubaka in far eastern Russia. Kinross has been actively restructuring its balance sheet in the prevailing low gold price environment and is now better positioned to benefit if gold prices rise.
James Copland [email protected] New York: 1-212-357-3519
Daniel McConvey [email protected] New York: 1-212-902-2360
Global Metals & Mining: Gold
Goldman Sachs Global Equity Research 47
where Echo Bay�s Acquarius project is located. The economics of the projects may be improved as a combined venture; and (3) Birkachan, a high-grade, open pittable prospect around 35km north of Kubaka which has the potential to extend that mine�s operating life. More generally, Kinross�s ability to operate successfully in Russia may be of strategic value in unlocking future opportunities in that country where the development of its large gold resources has been hampered by political risk.
• Kinross recently acquired an 11.4% shareholding in Echo Bay, through the conversion of its holding of Echo Bay capital securities into common shares.
Valuation
Our one-year target price for Kinross is $1.60 based on a 1.4X multiple of its DCF value of $1.11 per share at $325 gold using a 5% discount rate. We are estimating negative EPS of $0.02 in 2002 and negative $0.04 in 2003.
Key risks
Kinross faces the challenge of a declining production profile. Kinross produced just under 1 million gold equivalent ounces in 1999, and just under 950,000 ounces in 2001. We are forecasting production of 875,000 ounces in 2002. The recently announced Porcupine Joint Venture with Placer Dome, which we have not yet incorporated into our earnings model, may help address the potential decline in production levels.
Nearly C$200 million of 5.5% convertible debentures mature in December 2006. As of December 31, 2001, these represented an aggregate US$153 million liability, including interest payment accruals, on Kinross�s balance sheet. This is a relatively illiquid debt security, and we understand it is trading at a 20% discount to face value. If converted in full, this would represent significant dilution to shareholders. However, it is not a near-term obligation.
Financials
As of December 31, 2001, Kinross had cash of $81 million, current debt maturities of $33 million, and long-term debt of US$31 million. Assuming Kinross was able to acquire 100% of the Kinam Series B convertible preferred shares, and assuming the face value of the convertible debentures at US$153 million (which in our view is conservative), we estimate Kinross net debt to be around US$140 million, and its net debt-to-net debt plus equity ratio to be around 30%. According to our model, Kinross will generate around $87 million in cash flow in 2002, and has capex commitments of around $30 million.
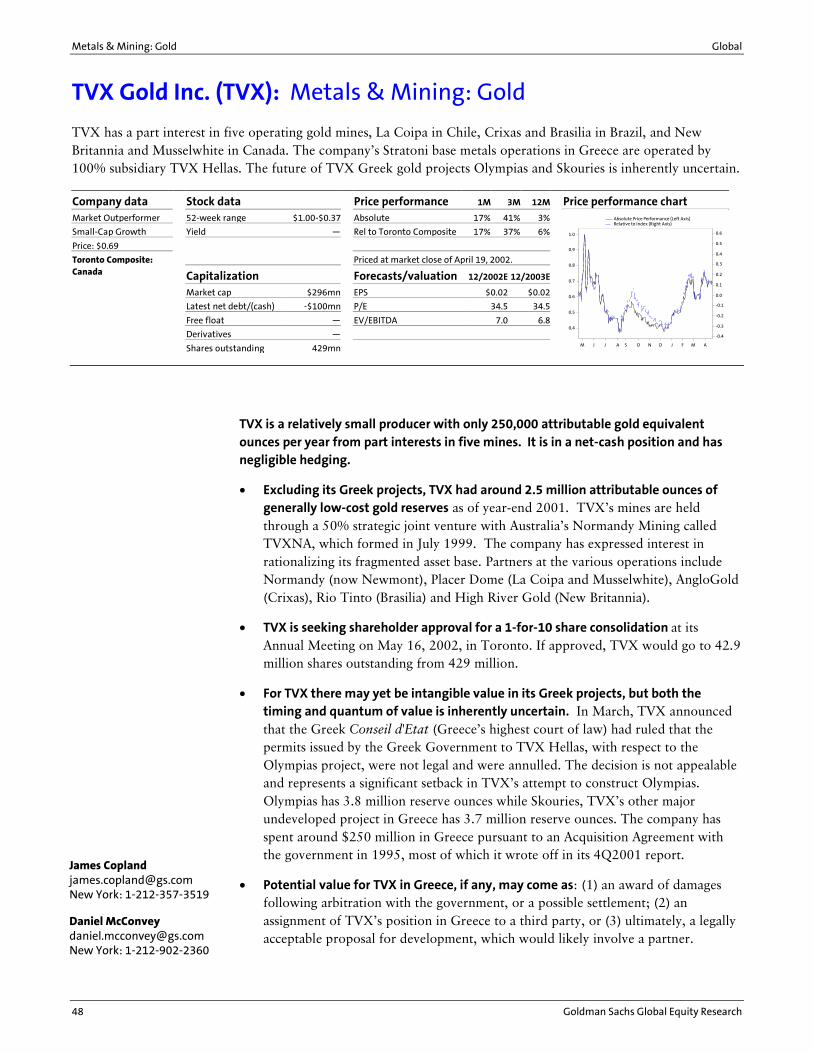
Metals & Mining: Gold Global
48 Goldman Sachs Global Equity Research
TVX Gold Inc. (TVX): Metals & Mining: Gold
Company data Stock data Price performance 1M 3M 12M Price performance chart Market Outperformer 52-week range $1.00-$0.37 Absolute 17% 41% 3%
Small-Cap Growth Yield � Rel to Toronto Composite 17% 37% 6%
Price: $0.69
Toronto Composite: Priced at market close of April 19, 2002.Canada Capitalization Forecasts/valuation 12/2002E 12/2003E
Market cap $296mn EPS $0.02 $0.02
Latest net debt/(cash) -$100mn P/E 34.5 34.5
Free float � EV/EBITDA 7.0 6.8
Derivatives �
Shares outstanding 429mn M J J A S O N D J F M A
0.4
0.5
0.6
0.7
0.8
0.9
1.0
-0.4
-0.3
-0.2
-0.1
0.0
0.1
0.2
0.3
0.4
0.5
0.6
Absolute Price Performance (Left Axis)Relative to Index (Right Axis)
TVX is a relatively small producer with only 250,000 attributable gold equivalent ounces per year from part interests in five mines. It is in a net-cash position and has negligible hedging.
• Excluding its Greek projects, TVX had around 2.5 million attributable ounces of generally low-cost gold reserves as of year-end 2001. TVX�s mines are held through a 50% strategic joint venture with Australia�s Normandy Mining called TVXNA, which formed in July 1999. The company has expressed interest in rationalizing its fragmented asset base. Partners at the various operations include Normandy (now Newmont), Placer Dome (La Coipa and Musselwhite), AngloGold (Crixas), Rio Tinto (Brasilia) and High River Gold (New Britannia).
• TVX is seeking shareholder approval for a 1-for-10 share consolidation at its Annual Meeting on May 16, 2002, in Toronto. If approved, TVX would go to 42.9 million shares outstanding from 429 million.
• For TVX there may yet be intangible value in its Greek projects, but both the timing and quantum of value is inherently uncertain. In March, TVX announced that the Greek Conseil d'Etat (Greece�s highest court of law) had ruled that the permits issued by the Greek Government to TVX Hellas, with respect to the Olympias project, were not legal and were annulled. The decision is not appealable and represents a significant setback in TVX�s attempt to construct Olympias. Olympias has 3.8 million reserve ounces while Skouries, TVX�s other major undeveloped project in Greece has 3.7 million reserve ounces. The company has spent around $250 million in Greece pursuant to an Acquisition Agreement with the government in 1995, most of which it wrote off in its 4Q2001 report.
• Potential value for TVX in Greece, if any, may come as: (1) an award of damages following arbitration with the government, or a possible settlement; (2) an assignment of TVX�s position in Greece to a third party, or (3) ultimately, a legally acceptable proposal for development, which would likely involve a partner.
TVX has a part interest in five operating gold mines, La Coipa in Chile, Crixas and Brasilia in Brazil, and New Britannia and Musselwhite in Canada. The company�s Stratoni base metals operations in Greece are operated by 100% subsidiary TVX Hellas. The future of TVX Greek gold projects Olympias and Skouries is inherently uncertain.
James Copland [email protected] New York: 1-212-357-3519
Daniel McConvey [email protected] New York: 1-212-902-2360
Global Metals & Mining: Gold
Goldman Sachs Global Equity Research 49
Although we think it may achieve some measure of success through one of these alternatives, we prefer to be conservative and factor in zero value for Greece in our DCF valuation.
Valuation
Our target price of $0.90 is based on less than a 1.5X multiple of our base-case value for TVX of $0.62 per share, based on a long-term gold price of $325 and a 5% discount rate. Our target price represents a 45X multiple of our 2002 and 2003 EPS estimates of $0.02 for each year, assuming 429 million shares outstanding. Around $0.01 EPS for each of 2002 and 2003 is non-cash deferred hedge revenue.
Key risks
TVX may be anxious to rebuild investor confidence. Since the start of 1996, when TVX�s share price peaked at an equivalent of $50, it has been in a steady decline to its current level of well below $1.00. The company has made some hard decisions, including the conversion of its $250 million of gold-linked convertible notes to common shares in July 2001. Chief Executive Officer Sean Harvey, who began in February 2001, is faced with the challenge of optimizing a fragmented ownership structure of the company�s gold assets, and to decide on how the company may recover value from Greece. Some factors in the company�s favor are: (1) some major gold players at its shared operations; (2) a cleaner balance sheet; and (3) a more positive gold environment.
Financials
TVX has nearly $100 million of net cash. The company recently completed a C$75 million equity issue to be used for general corporate purposes. We expect it will generate a relatively modest $13 to $14 million of free cash flow to its account in 2002 and 2003.
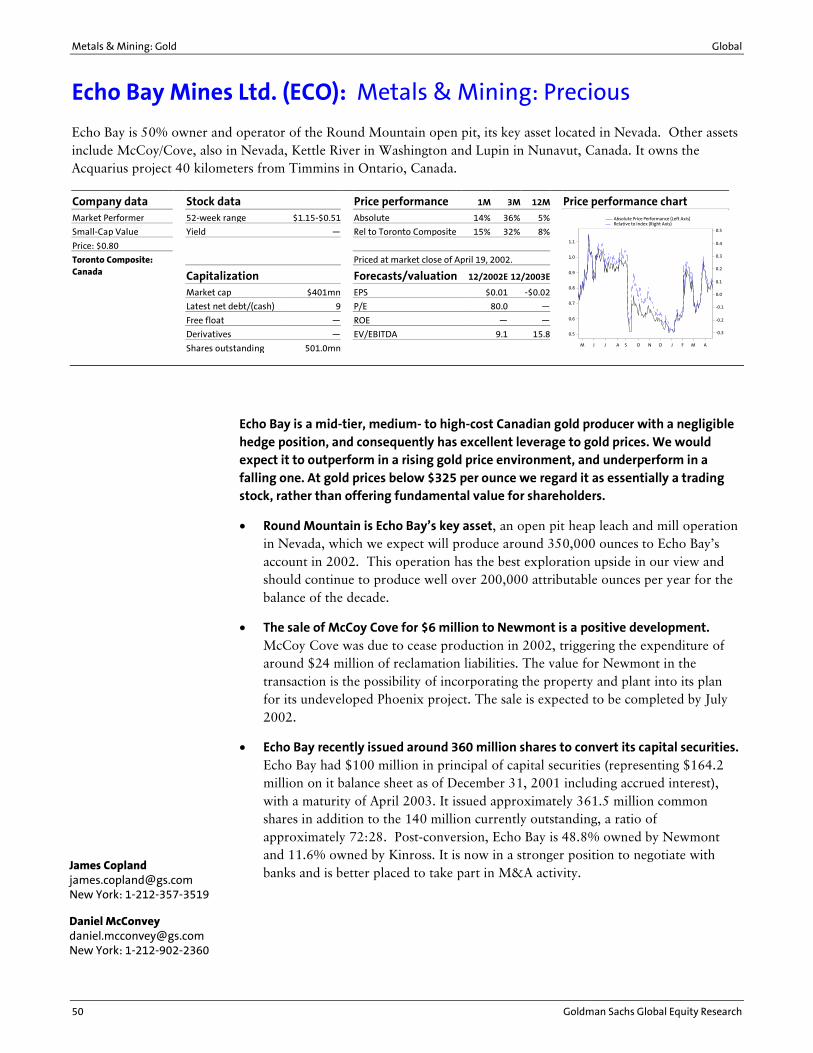
Metals & Mining: Gold Global
50 Goldman Sachs Global Equity Research
Echo Bay Mines Ltd. (ECO): Metals & Mining: Precious
Company data Stock data Price performance 1M 3M 12M Price performance chart Market Performer 52-week range $1.15-$0.51 Absolute 14% 36% 5%
Small-Cap Value Yield � Rel to Toronto Composite 15% 32% 8%
Price: $0.80
Toronto Composite: Priced at market close of April 19, 2002.Canada Capitalization Forecasts/valuation 12/2002E 12/2003E
Market cap $401mn EPS $0.01 -$0.02
Latest net debt/(cash) 9 P/E 80.0 �
Free float � ROE � �
Derivatives � EV/EBITDA 9.1 15.8
Shares outstanding 501.0mn M J J A S O N D J F M A
0.5
0.6
0.7
0.8
0.9
1.0
1.1
-0.3
-0.2
-0.1
0.0
0.1
0.2
0.3
0.4
0.5
Absolute Price Performance (Left Axis)Relative to Index (Right Axis)
Echo Bay is a mid-tier, medium- to high-cost Canadian gold producer with a negligible hedge position, and consequently has excellent leverage to gold prices. We would expect it to outperform in a rising gold price environment, and underperform in a falling one. At gold prices below $325 per ounce we regard it as essentially a trading stock, rather than offering fundamental value for shareholders.
• Round Mountain is Echo Bay�s key asset, an open pit heap leach and mill operation in Nevada, which we expect will produce around 350,000 ounces to Echo Bay�s account in 2002. This operation has the best exploration upside in our view and should continue to produce well over 200,000 attributable ounces per year for the balance of the decade.
• The sale of McCoy Cove for $6 million to Newmont is a positive development. McCoy Cove was due to cease production in 2002, triggering the expenditure of around $24 million of reclamation liabilities. The value for Newmont in the transaction is the possibility of incorporating the property and plant into its plan for its undeveloped Phoenix project. The sale is expected to be completed by July 2002.
• Echo Bay recently issued around 360 million shares to convert its capital securities. Echo Bay had $100 million in principal of capital securities (representing $164.2 million on it balance sheet as of December 31, 2001 including accrued interest), with a maturity of April 2003. It issued approximately 361.5 million common shares in addition to the 140 million currently outstanding, a ratio of approximately 72:28. Post-conversion, Echo Bay is 48.8% owned by Newmont and 11.6% owned by Kinross. It is now in a stronger position to negotiate with banks and is better placed to take part in M&A activity.
Echo Bay is 50% owner and operator of the Round Mountain open pit, its key asset located in Nevada. Other assets include McCoy/Cove, also in Nevada, Kettle River in Washington and Lupin in Nunavut, Canada. It owns the Acquarius project 40 kilometers from Timmins in Ontario, Canada.
James Copland [email protected] New York: 1-212-357-3519
Daniel McConvey [email protected] New York: 1-212-902-2360
Global Metals & Mining: Gold
Goldman Sachs Global Equity Research 51
Valuation
Our one-year target price is $0.80 per share, based on a long-term gold price of $325 per ounce and a 5% discount rate. Our base case DCF value is a 1.5X multiple of our estimated $0.53 per share value. According to our DCF valuation, Echo Bay�s value would increase and decrease in value by 40% for a $25 increase and decrease in the gold price respectively. We are forecasting EPS of $0.01 and -$0.02 in 2002 and 2003, respectively.
Key risks
Echo Bay is challenged by a declining production profile. Kettle River operations will finish in 2002 according to our model, subject to some current exploration, which may add another year or so of production. Lupin has four more years of mine life, with possible upside at depth or from the Ulu prospect, 160 kilometers to the north. The 1.2 million ounce reserve Acquarius project at Timmins would appear to provide the main upside. The company estimates the cost of construction to be around $90 million, for a mine life of seven years at around 190,000 ounces per year with cash operating costs of around $150 per ounce. Subject to financing, we would prefer to see gold prices sustained above $300 per ounce before any go-ahead decision is made on this project.
Financials
As of December 31, 2001, Echo Bay had around $9 million in net debt (excluding the capital securities), and around $14 million in cash and short-term investments. According to our model, Echo Bay will be free cash flow-neutral in 2002. Of our estimated $195 million in revenue for 2002, $30 million is non-cash deferred hedge revenue.

Metals & Mining: Gold Global
52 Goldman Sachs Global Equity Research
Lihir Gold Ltd. (LHG.AX): Metals & Mining: Products
Company data Stock data Price performance 1M 3M 12M Price performance chart Market Performer 52-week range A$1.60-A$0.63 Absolute -11% -6% 97%
Small-Cap Value Yield � Rel to Australia/ASX 200 -10% -6% 94%
Price: A$1.24 Listed ADR (LIHRY)1 $13.40
Australia/ASX 200 In: 11 ADR = 20 shares Priced at market close of April 19, 2002.Australia Capitalization Forecasts/valuation 12/2002E 12/2003E
Market cap A$1,416mn EPS A$0.05 -A$0.02
Latest net debt/(cash) A$10mn P/E 24.8 �
Free float � ROE 7.14% �
Derivatives � EV/EBITDA 10.7 24.2
Shares outstanding 1,142.3mn M J J A S O N D J F M A
0.6
0.7
0.8
0.9
1.0
1.1
1.2
1.3
1.4
1.5
1.6
0.0
0.2
0.4
0.6
0.8
1.0
1.2
1.4
Absolute Price Performance (Left Axis)Relative to Index (Right Axis)
Lihir is the most leveraged of the large Australian gold producers to movements in the gold price due to its relatively modest hedge position and high cost structure. Since the start of 2001, operations have improved, the geological model appears to be more robust and the company has added significantly to reserves.
• Among major Australian based gold stocks Lihir is, by far, more leveraged to the gold price than are its peers. It has around 2.6 million ounces hedged, or around four years of production, which represents less than 20% of contained reserves of 15.1 million ounces.
• The size of Lihir�s reserves (over 20-year life at current mining rates) combined with a growing stability in mining operations make it an increasing attractive asset and, increasingly, a potential beneficiary of consolidation. There are few reserves like it in terms of mine life. While that has always been the case, the clarity that has developed during the past two years concerning the downward direction of mine production by major gold mining companies make Lihir�s qualities in this regard stand out more than in the past.
• Lihir announced a 2.3 million ounce reserve increase at year-end 2001, net of 2001 depletion, and expects more in 2002. The grade of the reserve additions is about 6.4 grams per tonne (gpt). This resulted in an uptick in Lihir�s reserve grade by over 0.2 gpt. We think that chances are good that it will succeed in proving up at least another 2 million ounces of reserves in the Lientz area by year end, although we would not be surprised to see the company�s planned mid year reserve increase announcment delayed by one or two quarters. The company�s understanding of the orebody would seem to have improved markedly.
• However, it is difficult to materially raise Lihir�s DCF at current low gold prices due to both the long life of existing reserves and the capital intensity of any expansion. With a per ounce cash cost of around $200, and about $30 to $40 per ounce of incremental capital, the per-ounce margins on a $300 spot gold price would be
Lihir has one mine, operated by Rio Tinto, on Lihir Island in Papua New Guinea (PNG). The mine has substantial reserves and a potentially long life, but is not low cost. The first gold from Lihir was poured in May 1997. The company is 16%-owned by Rio Tinto.
Daniel McConvey [email protected] New York: 1-212-902-2360
James Copland [email protected] New York: 1-212-357-3519
Global Metals & Mining: Gold
Goldman Sachs Global Equity Research 53
about $50 before tax. Unlike its Australian colleagues to the south, Lihir�s PNG operations are not the beneficiary of a very low Australian dollar. Costs are predominately US$-denominated. Based on a long-term production profile of (say) 700,000 ounces (which is not overly conservative) the DCF of the cash flows would approximate $350 million (700,000 oz x $50/10%) using a 10% hurdle rate, which should be a minimum rate of return for a project expansion in PNG. With this being the case, it may be difficult to justify a major expansion that could cost an approximate US$100 to $200 million, especially when considering that expanding the mining rate, given the history of the last four years, could be major challenge. Accordingly, any addition to Lihir�s mine life tends to go at the back end the NPV spreadsheet and tends to have less than a large impact on DCF value. A higher gold price could change that and one could argue that if forward premiums are included, the economics of expansion may not be so challenged. In the medium term, however, Lihir can likely improve its operations with the facilities it has.
Valuation
Our one-year price target is $1.50 per share, based on our $325 per ounce long-term gold price forecast and a 5% discount rate.
Key risks
All things being equal, the operating challenges at Lihir are greater than at open pits elsewhere. The mine is situated in an active caldera, where the presence of hot geothermal fluids requires additional cost and planning. It is also located close to the ocean, which limits the extent and depth of mining to the north (presently there is a 150 meter buffer between the pit highwall and the water). With more experience, Lihir appears to be overcoming these challenges. However, we do not expect it to become a low-cost operation unless material, new high-grade mineralization is discovered.
Newmont sold its stake in Lihir in March. Newmont�s decision to sell does not add to investor confidence that Lihir will benefit from future M&A activity in the gold sector in the near term. Placer Dome sold out of its indirect interst in Lihir about two years ago.
Financials
At around US$6 million, Lihir has almost no net debt. According to our model Lihir will generate nearly US$40 million in free cash flow in 2002, a year in which it has nearly 80% of its production committed for delivery into its hedge book (which was worth around $60 million on a marked-to-market basis as of December 31, 2001 when gold was around $280 per ounce). For 2005, Lihir currently has less than 50% of production committed to hedge contracts, and lower levels thereafter.
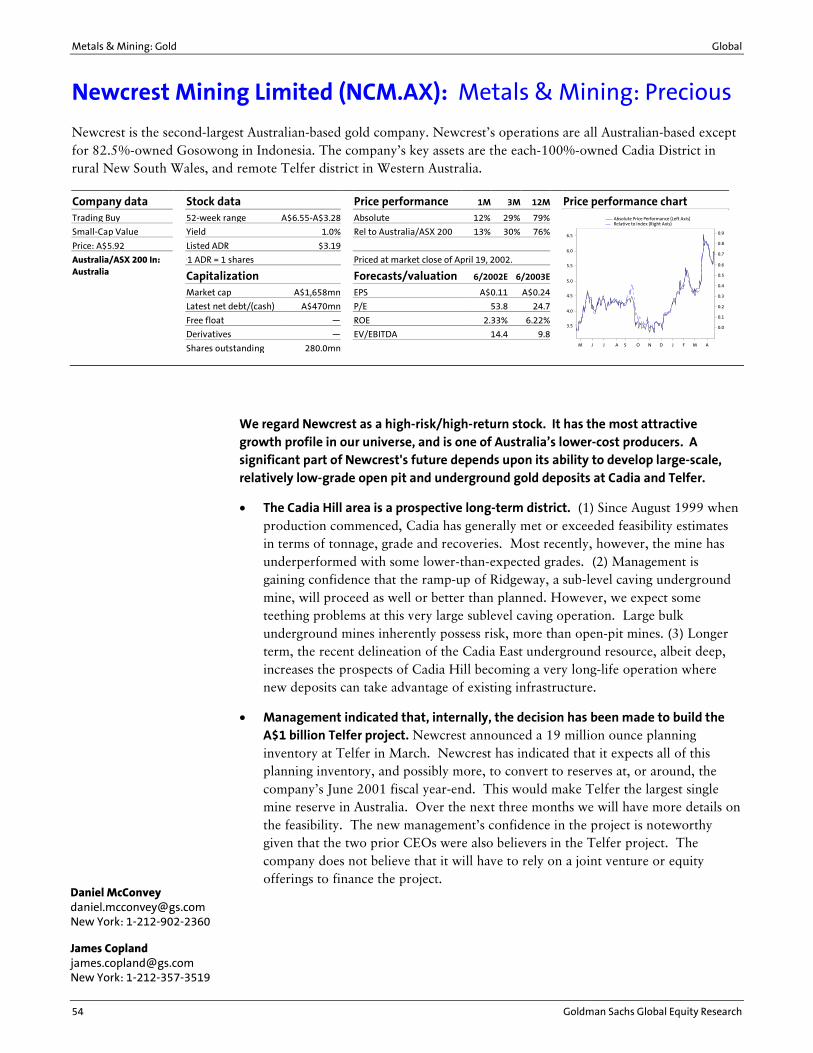
Metals & Mining: Gold Global
54 Goldman Sachs Global Equity Research
Newcrest Mining Limited (NCM.AX): Metals & Mining: Precious
Company data Stock data Price performance 1M 3M 12M Price performance chart Trading Buy 52-week range A$6.55-A$3.28 Absolute 12% 29% 79%
Small-Cap Value Yield 1.0% Rel to Australia/ASX 200 13% 30% 76%
Price: A$5.92 Listed ADR $3.19
Australia/ASX 200 In: 11 ADR = 1 shares Priced at market close of April 19, 2002.Australia Capitalization Forecasts/valuation 6/2002E 6/2003E
Market cap A$1,658mn EPS A$0.11 A$0.24
Latest net debt/(cash) A$470mn P/E 53.8 24.7
Free float � ROE 2.33% 6.22%
Derivatives � EV/EBITDA 14.4 9.8
Shares outstanding 280.0mn M J J A S O N D J F M A
3.5
4.0
4.5
5.0
5.5
6.0
6.5
0.0
0.1
0.2
0.3
0.4
0.5
0.6
0.7
0.8
0.9
Absolute Price Performance (Left Axis)Relative to Index (Right Axis)
We regard Newcrest as a high-risk/high-return stock. It has the most attractive growth profile in our universe, and is one of Australia�s lower-cost producers. A significant part of Newcrest's future depends upon its ability to develop large-scale, relatively low-grade open pit and underground gold deposits at Cadia and Telfer.
• The Cadia Hill area is a prospective long-term district. (1) Since August 1999 when production commenced, Cadia has generally met or exceeded feasibility estimates in terms of tonnage, grade and recoveries. Most recently, however, the mine has underperformed with some lower-than-expected grades. (2) Management is gaining confidence that the ramp-up of Ridgeway, a sub-level caving underground mine, will proceed as well or better than planned. However, we expect some teething problems at this very large sublevel caving operation. Large bulk underground mines inherently possess risk, more than open-pit mines. (3) Longer term, the recent delineation of the Cadia East underground resource, albeit deep, increases the prospects of Cadia Hill becoming a very long-life operation where new deposits can take advantage of existing infrastructure.
• Management indicated that, internally, the decision has been made to build the A$1 billion Telfer project. Newcrest announced a 19 million ounce planning inventory at Telfer in March. Newcrest has indicated that it expects all of this planning inventory, and possibly more, to convert to reserves at, or around, the company�s June 2001 fiscal year-end. This would make Telfer the largest single mine reserve in Australia. Over the next three months we will have more details on the feasibility. The new management�s confidence in the project is noteworthy given that the two prior CEOs were also believers in the Telfer project. The company does not believe that it will have to rely on a joint venture or equity offerings to finance the project.
Newcrest is the second-largest Australian-based gold company. Newcrest�s operations are all Australian-based except for 82.5%-owned Gosowong in Indonesia. The company�s key assets are the each-100%-owned Cadia District in rural New South Wales, and remote Telfer district in Western Australia.
Daniel McConvey [email protected] New York: 1-212-902-2360
James Copland [email protected] New York: 1-212-357-3519
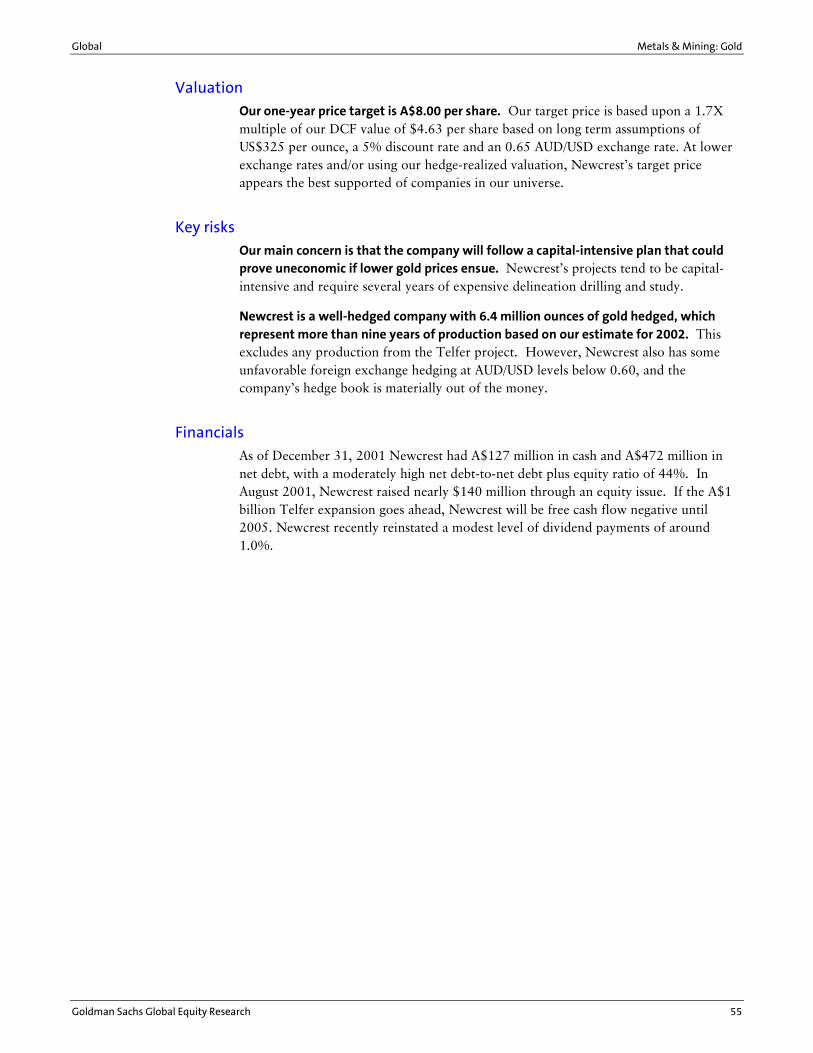
Global Metals & Mining: Gold
Goldman Sachs Global Equity Research 55
Valuation
Our one-year price target is A$8.00 per share. Our target price is based upon a 1.7X multiple of our DCF value of $4.63 per share based on long term assumptions of US$325 per ounce, a 5% discount rate and an 0.65 AUD/USD exchange rate. At lower exchange rates and/or using our hedge-realized valuation, Newcrest�s target price appears the best supported of companies in our universe.
Key risks
Our main concern is that the company will follow a capital-intensive plan that could prove uneconomic if lower gold prices ensue. Newcrest�s projects tend to be capital-intensive and require several years of expensive delineation drilling and study.
Newcrest is a well-hedged company with 6.4 million ounces of gold hedged, which represent more than nine years of production based on our estimate for 2002. This excludes any production from the Telfer project. However, Newcrest also has some unfavorable foreign exchange hedging at AUD/USD levels below 0.60, and the company�s hedge book is materially out of the money.
Financials
As of December 31, 2001 Newcrest had A$127 million in cash and A$472 million in net debt, with a moderately high net debt-to-net debt plus equity ratio of 44%. In August 2001, Newcrest raised nearly $140 million through an equity issue. If the A$1 billion Telfer expansion goes ahead, Newcrest will be free cash flow negative until 2005. Newcrest recently reinstated a modest level of dividend payments of around 1.0%.
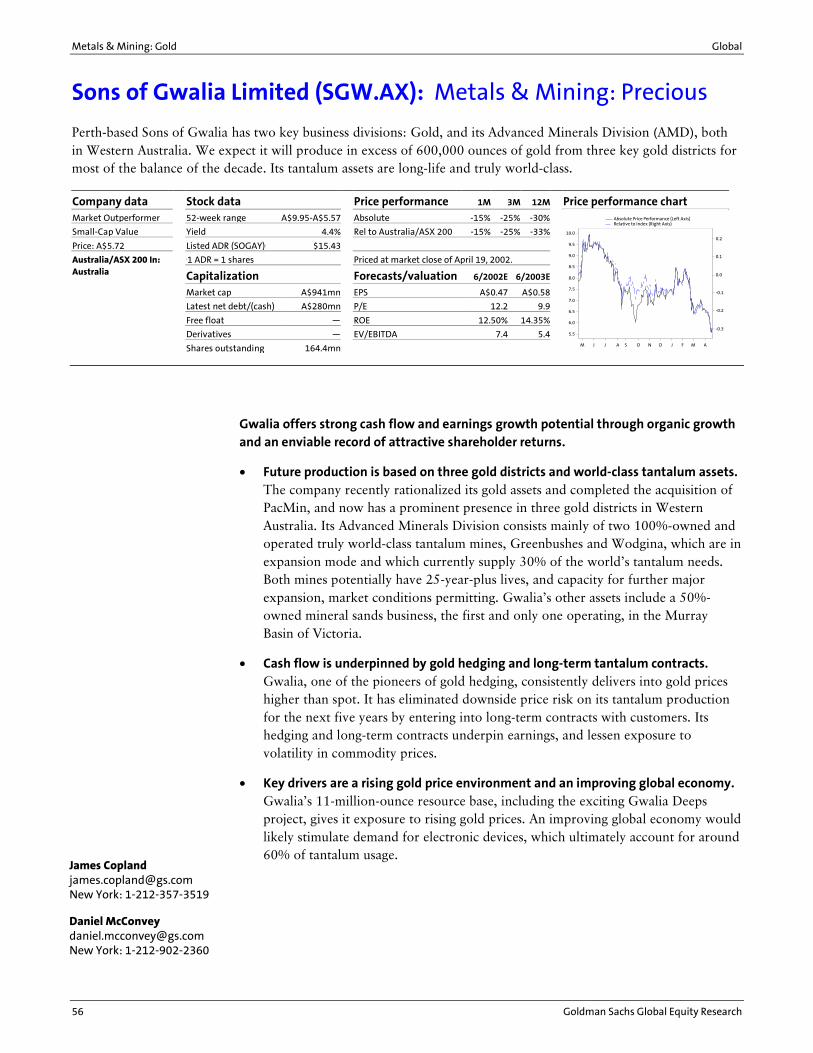
Metals & Mining: Gold Global
56 Goldman Sachs Global Equity Research
Sons of Gwalia Limited (SGW.AX): Metals & Mining: Precious
Company data Stock data Price performance 1M 3M 12M Price performance chart Market Outperformer 52-week range A$9.95-A$5.57 Absolute -15% -25% -30%
Small-Cap Value Yield 4.4% Rel to Australia/ASX 200 -15% -25% -33%
Price: A$5.72 Listed ADR (SOGAY)1 $15.43
Australia/ASX 200 In: 11 ADR = 1 shares Priced at market close of April 19, 2002.Australia Capitalization Forecasts/valuation 6/2002E 6/2003E
Market cap A$941mn EPS A$0.47 A$0.58
Latest net debt/(cash) A$280mn P/E 12.2 9.9
Free float � ROE 12.50% 14.35%
Derivatives � EV/EBITDA 7.4 5.4
Shares outstanding 164.4mn M J J A S O N D J F M A
5.5
6.0
6.5
7.0
7.5
8.0
8.5
9.0
9.5
10.0
-0.3
-0.2
-0.1
0.0
0.1
0.2
Absolute Price Performance (Left Axis)Relative to Index (Right Axis)
Gwalia offers strong cash flow and earnings growth potential through organic growth and an enviable record of attractive shareholder returns.
• Future production is based on three gold districts and world-class tantalum assets. The company recently rationalized its gold assets and completed the acquisition of PacMin, and now has a prominent presence in three gold districts in Western Australia. Its Advanced Minerals Division consists mainly of two 100%-owned and operated truly world-class tantalum mines, Greenbushes and Wodgina, which are in expansion mode and which currently supply 30% of the world�s tantalum needs. Both mines potentially have 25-year-plus lives, and capacity for further major expansion, market conditions permitting. Gwalia�s other assets include a 50%-owned mineral sands business, the first and only one operating, in the Murray Basin of Victoria.
• Cash flow is underpinned by gold hedging and long-term tantalum contracts. Gwalia, one of the pioneers of gold hedging, consistently delivers into gold prices higher than spot. It has eliminated downside price risk on its tantalum production for the next five years by entering into long-term contracts with customers. Its hedging and long-term contracts underpin earnings, and lessen exposure to volatility in commodity prices.
• Key drivers are a rising gold price environment and an improving global economy. Gwalia�s 11-million-ounce resource base, including the exciting Gwalia Deeps project, gives it exposure to rising gold prices. An improving global economy would likely stimulate demand for electronic devices, which ultimately account for around 60% of tantalum usage.
Perth-based Sons of Gwalia has two key business divisions: Gold, and its Advanced Minerals Division (AMD), both in Western Australia. We expect it will produce in excess of 600,000 ounces of gold from three key gold districts for most of the balance of the decade. Its tantalum assets are long-life and truly world-class.
James Copland [email protected] New York: 1-212-357-3519
Daniel McConvey [email protected] New York: 1-212-902-2360
Global Metals & Mining: Gold
Goldman Sachs Global Equity Research 57
Valuation
Our one-year target price of A$9.00 represents a 1.5X premium to our marked-to-market DCF valuation at an exchange rate of A$1/US$0.65, but is a discount to our hedge-realized valuation at an exchange rate of A$1/US$0.50 and price of A$10.45 per share. Our base-case valuation for Sons of Gwalia�s gold assets assumes a long-term gold price of US$325 per ounce, a long-term exchange rate of A$1/US$0.65, and a 5% discount rate. It also incorporates the marked-to-market value of the gold hedge book. For the Advanced Minerals Division, we are assuming a base-case production level of 2.5 million lb per year, a long-term tantalum price of US$70 per lb, and a 10% discount rate.
Key risks
One of the market�s primary concerns, in our view, is the company�s foreign exchange hedge position, which could near US$1.2 billion�around $300 million of which is contingent upon certain A$/US$ rates triggering the additional obligations. We believe that these concerns may be overdone. The exposure is material, but the company recently announced that it had restructured the book to match the timing of hedging commitments with US$ revenue. As with many Australian gold producers, it also has a substantial hedge position, with around 3.3 million ounces of gold reserves committed or potentially committed for delivery into hedging contracts (plus around 500,000 ounces of contingent obligations on its put options). However, Gwalia has no margin calls on either its gold or forex hedge book.
The other key risk is potential weakness in the demand for components used in the manufacture of electronic devices, which is the main use of tantalum. Broadly speaking, a strengthening global economy would likely be positive for tantalum demand.
Financials
Gwalia has been actively restructuring its financial position over the last 18 months, particularly following the PacMin acquisition, which closed in the December 2001 quarter. In December 2001, Gwalia raised A$100 million through an equity issue that enabled it to lower its net debt-to-net debt plus equity ratio to around 32% from 42% and to tidy up its debt structure. It currently has around A$280 million in net debt. The majority of the debt is US-dollar-denominated unsecured private notes, which do not mature until after 2006. According to our model, the company should generate strong free cash flow from its gold and tantalum businesses of around A$150 million per year (before dividends), giving it good financial flexibility. Gwalia pays around a 3.5% dividend yield.
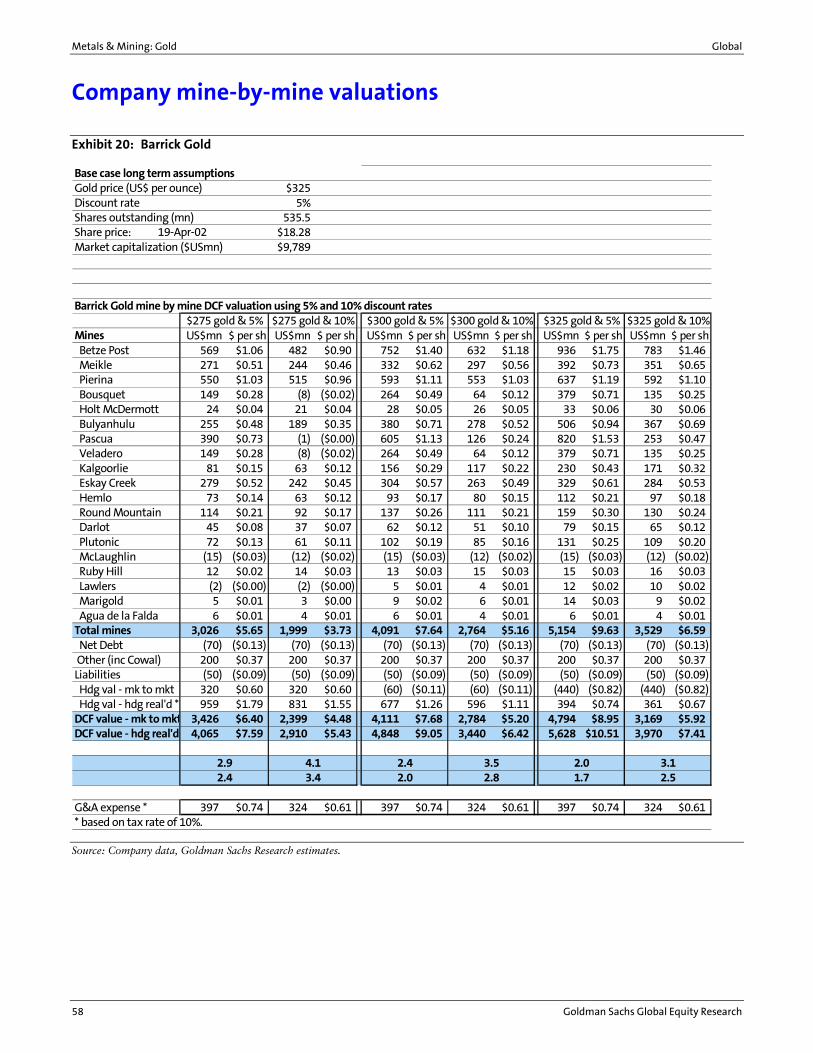
Metals & Mining: Gold Global
58 Goldman Sachs Global Equity Research
Company mine-by-mine valuations
Exhibit 20: Barrick Gold
Base case long term assumptionsGold price (US$ per ounce) $325Discount rate 5%Shares outstanding (mn) 535.5Share price: $18.28Market capitalization ($USmn) $9,789
Barrick Gold mine by mine DCF valuation using 5% and 10% discount rates
Mines US$mn $ per sh US$mn $ per sh US$mn $ per sh US$mn $ per sh US$mn $ per sh US$mn $ per sh Betze Post 569 $1.06 482 $0.90 752 $1.40 632 $1.18 936 $1.75 783 $1.46 Meikle 271 $0.51 244 $0.46 332 $0.62 297 $0.56 392 $0.73 351 $0.65 Pierina 550 $1.03 515 $0.96 593 $1.11 553 $1.03 637 $1.19 592 $1.10 Bousquet 149 $0.28 (8) ($0.02) 264 $0.49 64 $0.12 379 $0.71 135 $0.25 Holt McDermott 24 $0.04 21 $0.04 28 $0.05 26 $0.05 33 $0.06 30 $0.06 Bulyanhulu 255 $0.48 189 $0.35 380 $0.71 278 $0.52 506 $0.94 367 $0.69 Pascua 390 $0.73 (1) ($0.00) 605 $1.13 126 $0.24 820 $1.53 253 $0.47 Veladero 149 $0.28 (8) ($0.02) 264 $0.49 64 $0.12 379 $0.71 135 $0.25 Kalgoorlie 81 $0.15 63 $0.12 156 $0.29 117 $0.22 230 $0.43 171 $0.32 Eskay Creek 279 $0.52 242 $0.45 304 $0.57 263 $0.49 329 $0.61 284 $0.53 Hemlo 73 $0.14 63 $0.12 93 $0.17 80 $0.15 112 $0.21 97 $0.18 Round Mountain 114 $0.21 92 $0.17 137 $0.26 111 $0.21 159 $0.30 130 $0.24 Darlot 45 $0.08 37 $0.07 62 $0.12 51 $0.10 79 $0.15 65 $0.12 Plutonic 72 $0.13 61 $0.11 102 $0.19 85 $0.16 131 $0.25 109 $0.20 McLaughlin (15) ($0.03) (12) ($0.02) (15) ($0.03) (12) ($0.02) (15) ($0.03) (12) ($0.02) Ruby Hill 12 $0.02 14 $0.03 13 $0.03 15 $0.03 15 $0.03 16 $0.03 Lawlers (2) ($0.00) (2) ($0.00) 5 $0.01 4 $0.01 12 $0.02 10 $0.02 Marigold 5 $0.01 3 $0.00 9 $0.02 6 $0.01 14 $0.03 9 $0.02 Agua de la Falda 6 $0.01 4 $0.01 6 $0.01 4 $0.01 6 $0.01 4 $0.01Total mines 3,026 $5.65 1,999 $3.73 4,091 $7.64 2,764 $5.16 5,154 $9.63 3,529 $6.59 Net Debt (70) ($0.13) (70) ($0.13) (70) ($0.13) (70) ($0.13) (70) ($0.13) (70) ($0.13) Other (inc Cowal) 200 $0.37 200 $0.37 200 $0.37 200 $0.37 200 $0.37 200 $0.37Liabilities (50) ($0.09) (50) ($0.09) (50) ($0.09) (50) ($0.09) (50) ($0.09) (50) ($0.09) Hdg val - mk to mkt 320 $0.60 320 $0.60 (60) ($0.11) (60) ($0.11) (440) ($0.82) (440) ($0.82) Hdg val - hdg real'd * 959 $1.79 831 $1.55 677 $1.26 596 $1.11 394 $0.74 361 $0.67DCF value - mk to mkt 3,426 $6.40 2,399 $4.48 4,111 $7.68 2,784 $5.20 4,794 $8.95 3,169 $5.92DCF value - hdg real'd 4,065 $7.59 2,910 $5.43 4,848 $9.05 3,440 $6.42 5,628 $10.51 3,970 $7.41
G&A expense * 397 $0.74 324 $0.61 397 $0.74 324 $0.61 397 $0.74 324 $0.61* based on tax rate of 10%.
$275 gold & 5%
3.4 2.8 2.53.12.4
$325 gold & 10%$325 gold & 5%
2.0
19-Apr-02
1.72.04.1 3.52.9
2.4
$275 gold & 10% $300 gold & 10%$300 gold & 5%
Source: Company data, Goldman Sachs Research estimates.
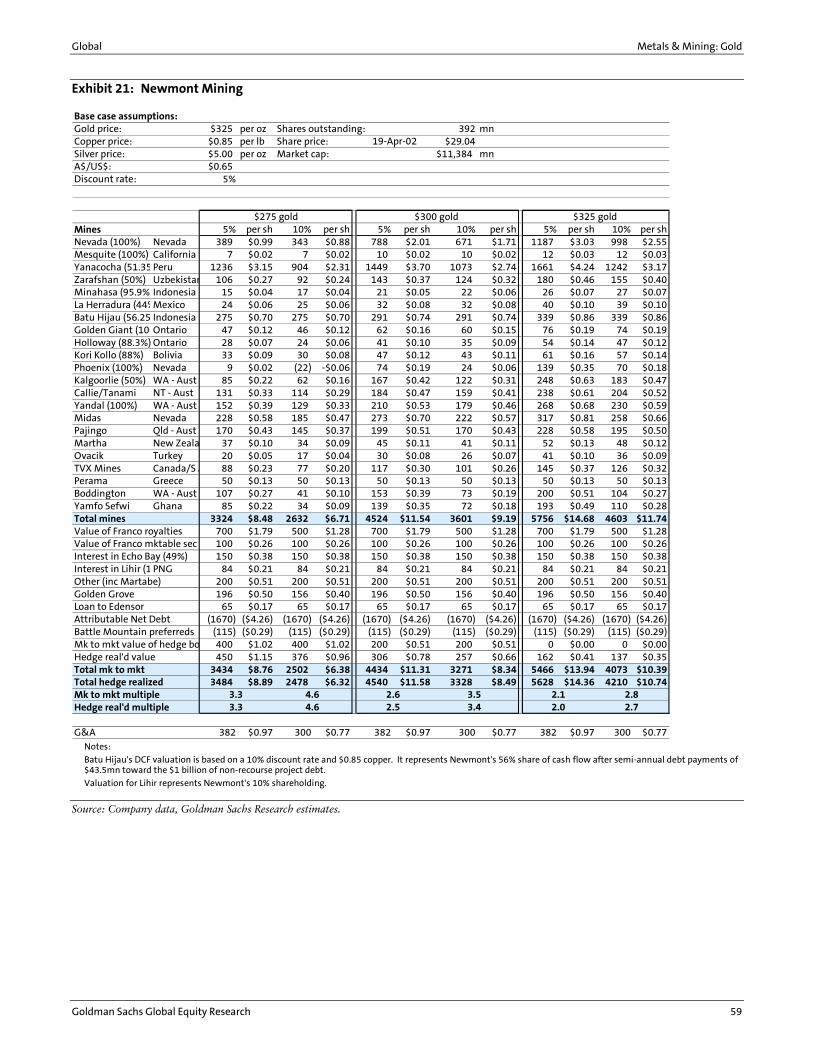
Global Metals & Mining: Gold
Goldman Sachs Global Equity Research 59
Exhibit 21: Newmont Mining
Base case assumptions:Gold price: $325 per oz Shares outstanding: 392 mnCopper price: $0.85 per lb Share price: $29.04Silver price: $5.00 per oz Market cap: $11,384 mnA$/US$: $0.65Discount rate: 5%
Mines 5% per sh 10% per sh 5% per sh 10% per sh 5% per sh 10% per shNevada (100%) Nevada 389 $0.99 343 $0.88 788 $2.01 671 $1.71 1187 $3.03 998 $2.55Mesquite (100%) California 7 $0.02 7 $0.02 10 $0.02 10 $0.02 12 $0.03 12 $0.03Yanacocha (51.35 Peru 1236 $3.15 904 $2.31 1449 $3.70 1073 $2.74 1661 $4.24 1242 $3.17Zarafshan (50%) Uzbekistan 106 $0.27 92 $0.24 143 $0.37 124 $0.32 180 $0.46 155 $0.40Minahasa (95.9%)Indonesia 15 $0.04 17 $0.04 21 $0.05 22 $0.06 26 $0.07 27 $0.07La Herradura (44%Mexico 24 $0.06 25 $0.06 32 $0.08 32 $0.08 40 $0.10 39 $0.10Batu Hijau (56.25 Indonesia 275 $0.70 275 $0.70 291 $0.74 291 $0.74 339 $0.86 339 $0.86Golden Giant (100Ontario 47 $0.12 46 $0.12 62 $0.16 60 $0.15 76 $0.19 74 $0.19Holloway (88.3%) Ontario 28 $0.07 24 $0.06 41 $0.10 35 $0.09 54 $0.14 47 $0.12Kori Kollo (88%) Bolivia 33 $0.09 30 $0.08 47 $0.12 43 $0.11 61 $0.16 57 $0.14Phoenix (100%) Nevada 9 $0.02 (22) -$0.06 74 $0.19 24 $0.06 139 $0.35 70 $0.18Kalgoorlie (50%) WA - Aust 85 $0.22 62 $0.16 167 $0.42 122 $0.31 248 $0.63 183 $0.47Callie/Tanami NT - Aust 131 $0.33 114 $0.29 184 $0.47 159 $0.41 238 $0.61 204 $0.52Yandal (100%) WA - Aust 152 $0.39 129 $0.33 210 $0.53 179 $0.46 268 $0.68 230 $0.59Midas Nevada 228 $0.58 185 $0.47 273 $0.70 222 $0.57 317 $0.81 258 $0.66Pajingo Qld - Aust 170 $0.43 145 $0.37 199 $0.51 170 $0.43 228 $0.58 195 $0.50Martha New Zeala 37 $0.10 34 $0.09 45 $0.11 41 $0.11 52 $0.13 48 $0.12Ovacik Turkey 20 $0.05 17 $0.04 30 $0.08 26 $0.07 41 $0.10 36 $0.09TVX Mines Canada/S A 88 $0.23 77 $0.20 117 $0.30 101 $0.26 145 $0.37 126 $0.32Perama Greece 50 $0.13 50 $0.13 50 $0.13 50 $0.13 50 $0.13 50 $0.13Boddington WA - Aust 107 $0.27 41 $0.10 153 $0.39 73 $0.19 200 $0.51 104 $0.27Yamfo Sefwi Ghana 85 $0.22 34 $0.09 139 $0.35 72 $0.18 193 $0.49 110 $0.28Total mines 3324 $8.48 2632 $6.71 4524 $11.54 3601 $9.19 5756 $14.68 4603 $11.74Value of Franco royalties 700 $1.79 500 $1.28 700 $1.79 500 $1.28 700 $1.79 500 $1.28Value of Franco mktable sec 100 $0.26 100 $0.26 100 $0.26 100 $0.26 100 $0.26 100 $0.26Interest in Echo Bay (49%) 150 $0.38 150 $0.38 150 $0.38 150 $0.38 150 $0.38 150 $0.38Interest in Lihir (1 PNG 84 $0.21 84 $0.21 84 $0.21 84 $0.21 84 $0.21 84 $0.21Other (inc Martabe) 200 $0.51 200 $0.51 200 $0.51 200 $0.51 200 $0.51 200 $0.51Golden Grove 196 $0.50 156 $0.40 196 $0.50 156 $0.40 196 $0.50 156 $0.40Loan to Edensor 65 $0.17 65 $0.17 65 $0.17 65 $0.17 65 $0.17 65 $0.17Attributable Net Debt (1670) ($4.26) (1670) ($4.26) (1670) ($4.26) (1670) ($4.26) (1670) ($4.26) (1670) ($4.26)Battle Mountain preferreds (115) ($0.29) (115) ($0.29) (115) ($0.29) (115) ($0.29) (115) ($0.29) (115) ($0.29)Mk to mkt value of hedge bo 400 $1.02 400 $1.02 200 $0.51 200 $0.51 0 $0.00 0 $0.00Hedge real'd value 450 $1.15 376 $0.96 306 $0.78 257 $0.66 162 $0.41 137 $0.35Total mk to mkt 3434 $8.76 2502 $6.38 4434 $11.31 3271 $8.34 5466 $13.94 4073 $10.39Total hedge realized 3484 $8.89 2478 $6.32 4540 $11.58 3328 $8.49 5628 $14.36 4210 $10.74Mk to mkt multipleHedge real'd multiple
G&A 382 $0.97 300 $0.77 382 $0.97 300 $0.77 382 $0.97 300 $0.77
19-Apr-02
2.0 2.73.3 4.6 2.5 3.4
$300 gold $325 gold $275 gold
2.1 2.83.3 4.6 2.6 3.5
Notes:
Batu Hijau's DCF valuation is based on a 10% discount rate and $0.85 copper. It represents Newmont's 56% share of cash flow after semi-annual debt payments of $43.5mn toward the $1 billion of non-recourse project debt.
Valuation for Lihir represents Newmont's 10% shareholding.
Source: Company data, Goldman Sachs Research estimates.
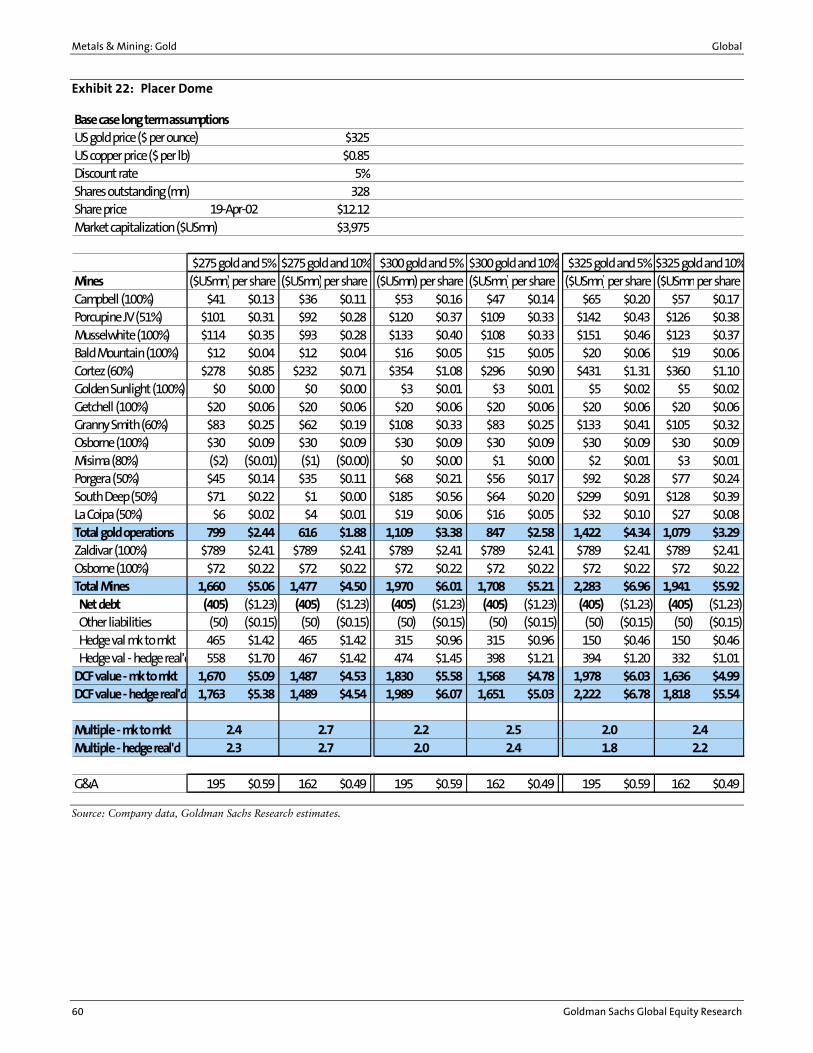
Metals & Mining: Gold Global
60 Goldman Sachs Global Equity Research
Exhibit 22: Placer Dome
Base case long term assumptionsUS gold price ($ per ounce) $325US copper price ($ per lb) $0.85Discount rate 5%Shares outstanding (mn) 328Share price $12.12Market capitalization ($USmn) $3,975
Mines ($USmn)per share ($USmn)per share ($USmn)per share ($USmn)per share ($USmn)per share ($USmnper shareCampbell (100%) $41 $0.13 $36 $0.11 $53 $0.16 $47 $0.14 $65 $0.20 $57 $0.17Porcupine JV (51%) $101 $0.31 $92 $0.28 $120 $0.37 $109 $0.33 $142 $0.43 $126 $0.38Musselwhite (100%) $114 $0.35 $93 $0.28 $133 $0.40 $108 $0.33 $151 $0.46 $123 $0.37Bald Mountain (100%) $12 $0.04 $12 $0.04 $16 $0.05 $15 $0.05 $20 $0.06 $19 $0.06Cortez (60%) $278 $0.85 $232 $0.71 $354 $1.08 $296 $0.90 $431 $1.31 $360 $1.10Golden Sunlight (100%) $0 $0.00 $0 $0.00 $3 $0.01 $3 $0.01 $5 $0.02 $5 $0.02Getchell (100%) $20 $0.06 $20 $0.06 $20 $0.06 $20 $0.06 $20 $0.06 $20 $0.06Granny Smith (60%) $83 $0.25 $62 $0.19 $108 $0.33 $83 $0.25 $133 $0.41 $105 $0.32Osborne (100%) $30 $0.09 $30 $0.09 $30 $0.09 $30 $0.09 $30 $0.09 $30 $0.09Misima (80%) ($2) ($0.01) ($1) ($0.00) $0 $0.00 $1 $0.00 $2 $0.01 $3 $0.01Porgera (50%) $45 $0.14 $35 $0.11 $68 $0.21 $56 $0.17 $92 $0.28 $77 $0.24South Deep (50%) $71 $0.22 $1 $0.00 $185 $0.56 $64 $0.20 $299 $0.91 $128 $0.39La Coipa (50%) $6 $0.02 $4 $0.01 $19 $0.06 $16 $0.05 $32 $0.10 $27 $0.08Total gold operations 799 $2.44 616 $1.88 1,109 $3.38 847 $2.58 1,422 $4.34 1,079 $3.29Zaldivar (100%) $789 $2.41 $789 $2.41 $789 $2.41 $789 $2.41 $789 $2.41 $789 $2.41Osborne (100%) $72 $0.22 $72 $0.22 $72 $0.22 $72 $0.22 $72 $0.22 $72 $0.22Total Mines 1,660 $5.06 1,477 $4.50 1,970 $6.01 1,708 $5.21 2,283 $6.96 1,941 $5.92 Net debt (405) ($1.23) (405) ($1.23) (405) ($1.23) (405) ($1.23) (405) ($1.23) (405) ($1.23) Other liabilities (50) ($0.15) (50) ($0.15) (50) ($0.15) (50) ($0.15) (50) ($0.15) (50) ($0.15) Hedge val mk to mkt 465 $1.42 465 $1.42 315 $0.96 315 $0.96 150 $0.46 150 $0.46 Hedge val - hedge real'd 558 $1.70 467 $1.42 474 $1.45 398 $1.21 394 $1.20 332 $1.01DCF value - mk to mkt 1,670 $5.09 1,487 $4.53 1,830 $5.58 1,568 $4.78 1,978 $6.03 1,636 $4.99DCF value - hedge real'd 1,763 $5.38 1,489 $4.54 1,989 $6.07 1,651 $5.03 2,222 $6.78 1,818 $5.54
Multiple - mk to mktMultiple - hedge real'd
G&A 195 $0.59 162 $0.49 195 $0.59 162 $0.49 195 $0.59 162 $0.49
19-Apr-02
2.42.4 2.7 2.0
$275 gold and 5% $275 gold and 10%
2.3 2.7 2.0 2.4 2.2
$300 gold and 5% $300 gold and 10%
2.2 2.5
$325 gold and 5%
1.8
$325 gold and 10%
Source: Company data, Goldman Sachs Research estimates.
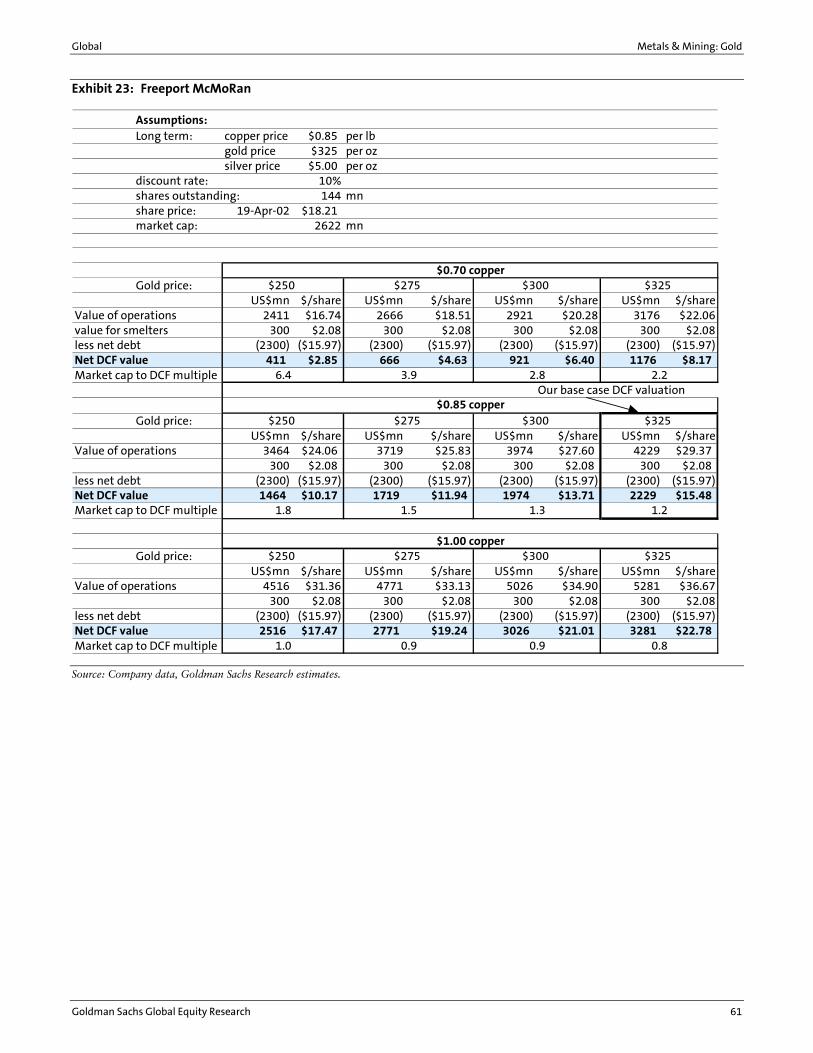
Global Metals & Mining: Gold
Goldman Sachs Global Equity Research 61
Exhibit 23: Freeport McMoRan
Assumptions:Long term: copper price $0.85 per lb
gold price $325 per ozsilver price $5.00 per oz
discount rate: 10%shares outstanding: 144 mnshare price: 19-Apr-02 $18.21market cap: 2622 mn
Gold price:US$mn $/share US$mn $/share US$mn $/share US$mn $/share
Value of operations 2411 $16.74 2666 $18.51 2921 $20.28 3176 $22.06value for smelters 300 $2.08 300 $2.08 300 $2.08 300 $2.08less net debt (2300) ($15.97) (2300) ($15.97) (2300) ($15.97) (2300) ($15.97)Net DCF value 411 $2.85 666 $4.63 921 $6.40 1176 $8.17Market cap to DCF multiple
Our base case DCF valuation
Gold price:US$mn $/share US$mn $/share US$mn $/share US$mn $/share
Value of operations 3464 $24.06 3719 $25.83 3974 $27.60 4229 $29.37300 $2.08 300 $2.08 300 $2.08 300 $2.08
less net debt (2300) ($15.97) (2300) ($15.97) (2300) ($15.97) (2300) ($15.97)Net DCF value 1464 $10.17 1719 $11.94 1974 $13.71 2229 $15.48Market cap to DCF multiple
Gold price:US$mn $/share US$mn $/share US$mn $/share US$mn $/share
Value of operations 4516 $31.36 4771 $33.13 5026 $34.90 5281 $36.67300 $2.08 300 $2.08 300 $2.08 300 $2.08
less net debt (2300) ($15.97) (2300) ($15.97) (2300) ($15.97) (2300) ($15.97)Net DCF value 2516 $17.47 2771 $19.24 3026 $21.01 3281 $22.78Market cap to DCF multiple 1.0 0.9 0.9 0.8
1.8 1.5 1.3 1.2
6.4 3.9 2.8 2.2
$0.70 copper$250 $275 $300 $325
$0.85 copper$250 $275 $300 $325
$1.00 copper$250 $275 $300 $325
Source: Company data, Goldman Sachs Research estimates.
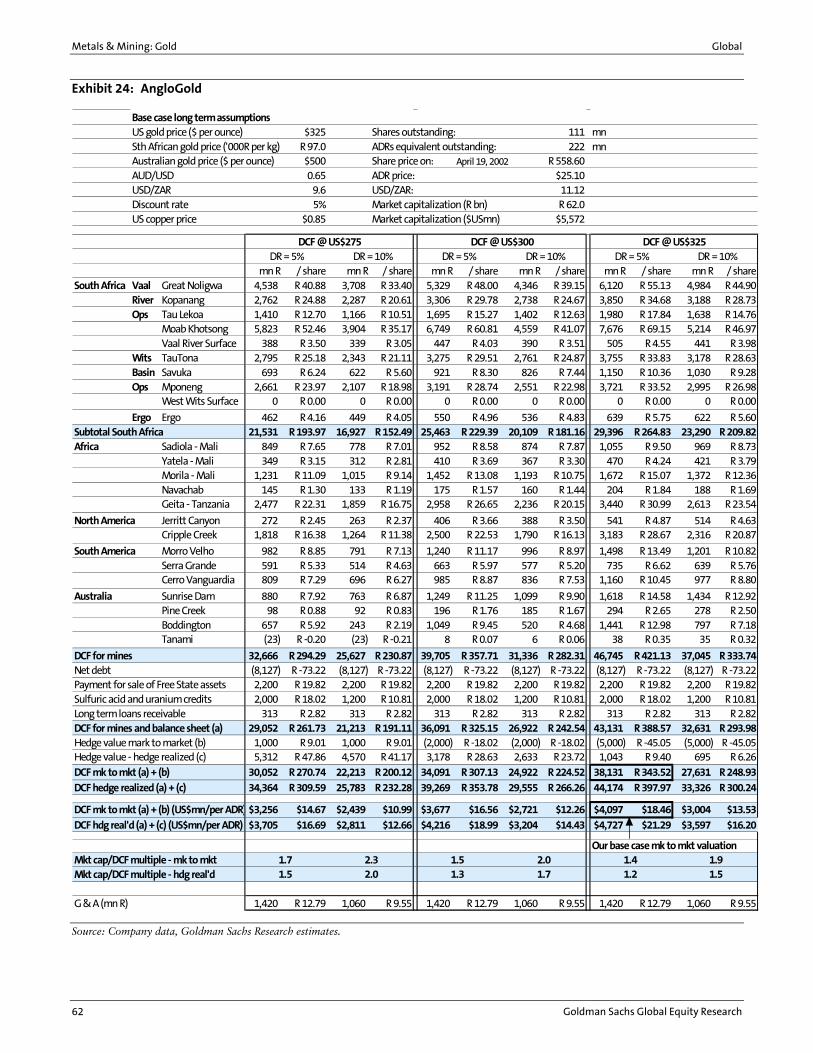
Metals & Mining: Gold Global
62 Goldman Sachs Global Equity Research
Exhibit 24: AngloGold
Base case long term assumptionsUS gold price ($ per ounce) $325 Shares outstanding: 111 mnSth African gold price ('000R per kg) R 97.0 ADRs equivalent outstanding: 222 mnAustralian gold price ($ per ounce) $500 Share price on: R 558.60AUD/USD 0.65 ADR price: $25.10USD/ZAR 9.6 USD/ZAR: 11.12Discount rate 5% Market capitalization (R bn) R 62.0US copper price $0.85 Market capitalization ($USmn) $5,572
mn R / share mn R / share mn R / share mn R / share mn R / share mn R / shareSouth Africa Vaal Great Noligwa 4,538 R 40.88 3,708 R 33.40 5,329 R 48.00 4,346 R 39.15 6,120 R 55.13 4,984 R 44.90
River Kopanang 2,762 R 24.88 2,287 R 20.61 3,306 R 29.78 2,738 R 24.67 3,850 R 34.68 3,188 R 28.73Ops Tau Lekoa 1,410 R 12.70 1,166 R 10.51 1,695 R 15.27 1,402 R 12.63 1,980 R 17.84 1,638 R 14.76
Moab Khotsong 5,823 R 52.46 3,904 R 35.17 6,749 R 60.81 4,559 R 41.07 7,676 R 69.15 5,214 R 46.97Vaal River Surface 388 R 3.50 339 R 3.05 447 R 4.03 390 R 3.51 505 R 4.55 441 R 3.98
Wits TauTona 2,795 R 25.18 2,343 R 21.11 3,275 R 29.51 2,761 R 24.87 3,755 R 33.83 3,178 R 28.63Basin Savuka 693 R 6.24 622 R 5.60 921 R 8.30 826 R 7.44 1,150 R 10.36 1,030 R 9.28Ops Mponeng 2,661 R 23.97 2,107 R 18.98 3,191 R 28.74 2,551 R 22.98 3,721 R 33.52 2,995 R 26.98
West Wits Surface 0 R 0.00 0 R 0.00 0 R 0.00 0 R 0.00 0 R 0.00 0 R 0.00
Ergo Ergo 462 R 4.16 449 R 4.05 550 R 4.96 536 R 4.83 639 R 5.75 622 R 5.60Subtotal South Africa 21,531 R 193.97 16,927 R 152.49 25,463 R 229.39 20,109 R 181.16 29,396 R 264.83 23,290 R 209.82Africa Sadiola - Mali 849 R 7.65 778 R 7.01 952 R 8.58 874 R 7.87 1,055 R 9.50 969 R 8.73
Yatela - Mali 349 R 3.15 312 R 2.81 410 R 3.69 367 R 3.30 470 R 4.24 421 R 3.79Morila - Mali 1,231 R 11.09 1,015 R 9.14 1,452 R 13.08 1,193 R 10.75 1,672 R 15.07 1,372 R 12.36Navachab 145 R 1.30 133 R 1.19 175 R 1.57 160 R 1.44 204 R 1.84 188 R 1.69Geita - Tanzania 2,477 R 22.31 1,859 R 16.75 2,958 R 26.65 2,236 R 20.15 3,440 R 30.99 2,613 R 23.54
North America Jerritt Canyon 272 R 2.45 263 R 2.37 406 R 3.66 388 R 3.50 541 R 4.87 514 R 4.63Cripple Creek 1,818 R 16.38 1,264 R 11.38 2,500 R 22.53 1,790 R 16.13 3,183 R 28.67 2,316 R 20.87
South America Morro Velho 982 R 8.85 791 R 7.13 1,240 R 11.17 996 R 8.97 1,498 R 13.49 1,201 R 10.82Serra Grande 591 R 5.33 514 R 4.63 663 R 5.97 577 R 5.20 735 R 6.62 639 R 5.76Cerro Vanguardia 809 R 7.29 696 R 6.27 985 R 8.87 836 R 7.53 1,160 R 10.45 977 R 8.80
Australia Sunrise Dam 880 R 7.92 763 R 6.87 1,249 R 11.25 1,099 R 9.90 1,618 R 14.58 1,434 R 12.92Pine Creek 98 R 0.88 92 R 0.83 196 R 1.76 185 R 1.67 294 R 2.65 278 R 2.50Boddington 657 R 5.92 243 R 2.19 1,049 R 9.45 520 R 4.68 1,441 R 12.98 797 R 7.18Tanami (23) R -0.20 (23) R -0.21 8 R 0.07 6 R 0.06 38 R 0.35 35 R 0.32
DCF for mines 32,666 R 294.29 25,627 R 230.87 39,705 R 357.71 31,336 R 282.31 46,745 R 421.13 37,045 R 333.74Net debt (8,127) R -73.22 (8,127) R -73.22 (8,127) R -73.22 (8,127) R -73.22 (8,127) R -73.22 (8,127) R -73.22Payment for sale of Free State assets 2,200 R 19.82 2,200 R 19.82 2,200 R 19.82 2,200 R 19.82 2,200 R 19.82 2,200 R 19.82Sulfuric acid and uranium credits 2,000 R 18.02 1,200 R 10.81 2,000 R 18.02 1,200 R 10.81 2,000 R 18.02 1,200 R 10.81Long term loans receivable 313 R 2.82 313 R 2.82 313 R 2.82 313 R 2.82 313 R 2.82 313 R 2.82DCF for mines and balance sheet (a) 29,052 R 261.73 21,213 R 191.11 36,091 R 325.15 26,922 R 242.54 43,131 R 388.57 32,631 R 293.98Hedge value mark to market (b) 1,000 R 9.01 1,000 R 9.01 (2,000) R -18.02 (2,000) R -18.02 (5,000) R -45.05 (5,000) R -45.05Hedge value - hedge realized (c) 5,312 R 47.86 4,570 R 41.17 3,178 R 28.63 2,633 R 23.72 1,043 R 9.40 695 R 6.26DCF mk to mkt (a) + (b) 30,052 R 270.74 22,213 R 200.12 34,091 R 307.13 24,922 R 224.52 38,131 R 343.52 27,631 R 248.93
DCF hedge realized (a) + (c) 34,364 R 309.59 25,783 R 232.28 39,269 R 353.78 29,555 R 266.26 44,174 R 397.97 33,326 R 300.24
DCF mk to mkt (a) + (b) (US$mn/per ADR) $3,256 $14.67 $2,439 $10.99 $3,677 $16.56 $2,721 $12.26 $4,097 $18.46 $3,004 $13.53
DCF hdg real'd (a) + (c) (US$mn/per ADR) $3,705 $16.69 $2,811 $12.66 $4,216 $18.99 $3,204 $14.43 $4,727 $21.29 $3,597 $16.20
Our base case mk to mkt valuationMkt cap/DCF multiple - mk to mktMkt cap/DCF multiple - hdg real'd
G & A (mn R) 1,420 R 12.79 1,060 R 9.55 1,420 R 12.79 1,060 R 9.55 1,420 R 12.79 1,060 R 9.55
1.71.41.2
1.91.5
2.02.01.5
1.51.3
1.7 2.3
DR = 10%DCF @ US$325
DR = 5%DR = 10%DCF @ US$275
DR = 5%
April 19, 2002
DR = 5% DR = 10%DCF @ US$300
Source: Company data, Goldman Sachs Research estimates.
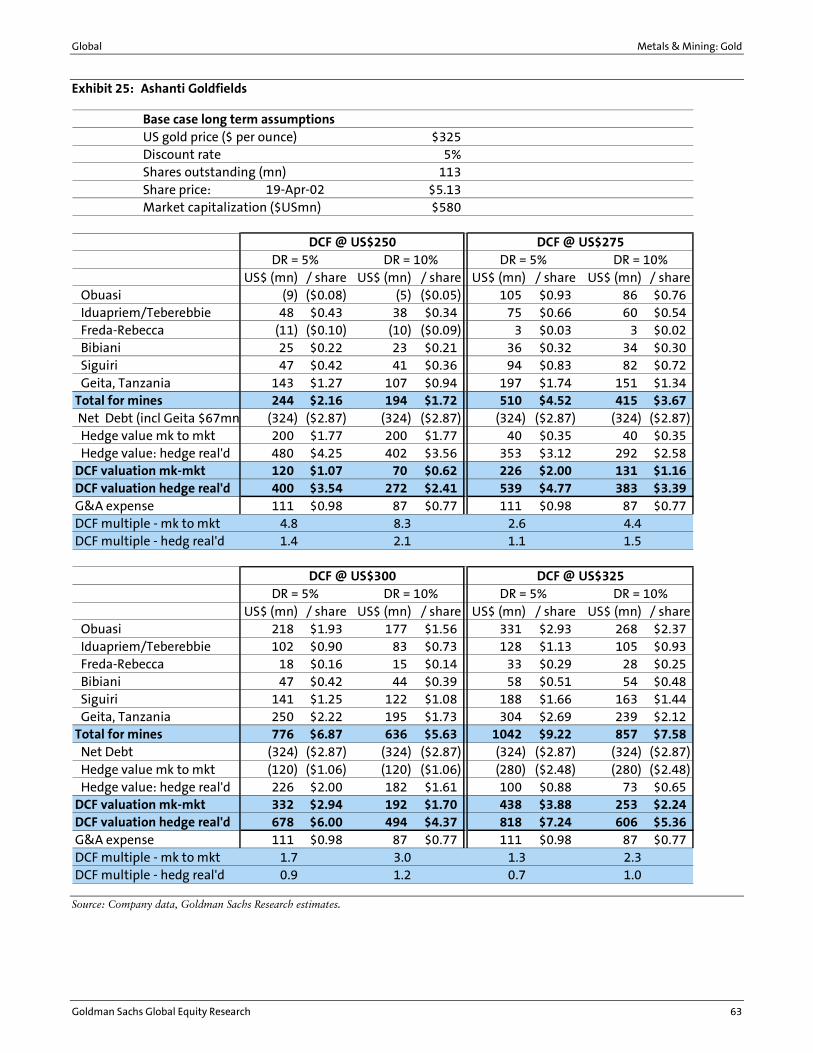
Global Metals & Mining: Gold
Goldman Sachs Global Equity Research 63
Exhibit 25: Ashanti Goldfields
Base case long term assumptionsUS gold price ($ per ounce) $325Discount rate 5%Shares outstanding (mn) 113Share price: $5.13Market capitalization ($USmn) $580
US$ (mn) / share US$ (mn) / share US$ (mn) / share US$ (mn) / share Obuasi (9) ($0.08) (5) ($0.05) 105 $0.93 86 $0.76 Iduapriem/Teberebbie 48 $0.43 38 $0.34 75 $0.66 60 $0.54 Freda-Rebecca (11) ($0.10) (10) ($0.09) 3 $0.03 3 $0.02 Bibiani 25 $0.22 23 $0.21 36 $0.32 34 $0.30 Siguiri 47 $0.42 41 $0.36 94 $0.83 82 $0.72 Geita, Tanzania 143 $1.27 107 $0.94 197 $1.74 151 $1.34Total for mines 244 $2.16 194 $1.72 510 $4.52 415 $3.67 Net Debt (incl Geita $67mn (324) ($2.87) (324) ($2.87) (324) ($2.87) (324) ($2.87) Hedge value mk to mkt 200 $1.77 200 $1.77 40 $0.35 40 $0.35 Hedge value: hedge real'd 480 $4.25 402 $3.56 353 $3.12 292 $2.58DCF valuation mk-mkt 120 $1.07 70 $0.62 226 $2.00 131 $1.16DCF valuation hedge real'd 400 $3.54 272 $2.41 539 $4.77 383 $3.39G&A expense 111 $0.98 87 $0.77 111 $0.98 87 $0.77DCF multiple - mk to mkt 4.8 8.3 2.6 4.4DCF multiple - hedg real'd 1.4 2.1 1.1 1.5
US$ (mn) / share US$ (mn) / share US$ (mn) / share US$ (mn) / share Obuasi 218 $1.93 177 $1.56 331 $2.93 268 $2.37 Iduapriem/Teberebbie 102 $0.90 83 $0.73 128 $1.13 105 $0.93 Freda-Rebecca 18 $0.16 15 $0.14 33 $0.29 28 $0.25 Bibiani 47 $0.42 44 $0.39 58 $0.51 54 $0.48 Siguiri 141 $1.25 122 $1.08 188 $1.66 163 $1.44 Geita, Tanzania 250 $2.22 195 $1.73 304 $2.69 239 $2.12Total for mines 776 $6.87 636 $5.63 1042 $9.22 857 $7.58 Net Debt (324) ($2.87) (324) ($2.87) (324) ($2.87) (324) ($2.87) Hedge value mk to mkt (120) ($1.06) (120) ($1.06) (280) ($2.48) (280) ($2.48) Hedge value: hedge real'd 226 $2.00 182 $1.61 100 $0.88 73 $0.65DCF valuation mk-mkt 332 $2.94 192 $1.70 438 $3.88 253 $2.24DCF valuation hedge real'd 678 $6.00 494 $4.37 818 $7.24 606 $5.36G&A expense 111 $0.98 87 $0.77 111 $0.98 87 $0.77DCF multiple - mk to mkt 1.7 3.0 1.3 2.3DCF multiple - hedg real'd 0.9 1.2 0.7 1.0
DR = 5% DR = 10% DR = 5% DR = 10%
19-Apr-02
DCF @ US$250 DCF @ US$275
DCF @ US$300 DCF @ US$325
DR = 5% DR = 10% DR = 5% DR = 10%
Source: Company data, Goldman Sachs Research estimates.
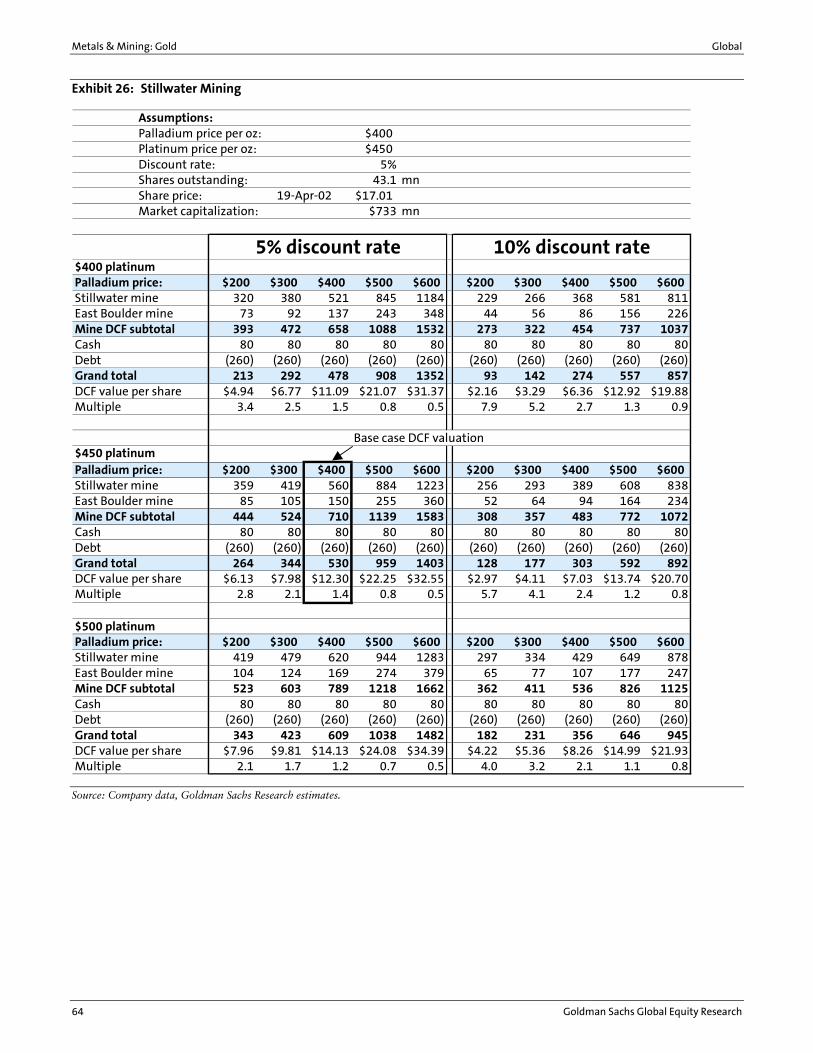
Metals & Mining: Gold Global
64 Goldman Sachs Global Equity Research
Exhibit 26: Stillwater Mining
Assumptions:Palladium price per oz: $400Platinum price per oz: $450Discount rate: 5%Shares outstanding: 43.1 mnShare price: $17.01Market capitalization: $733 mn
$400 platinumPalladium price: $200 $300 $400 $500 $600 $200 $300 $400 $500 $600Stillwater mine 320 380 521 845 1184 229 266 368 581 811East Boulder mine 73 92 137 243 348 44 56 86 156 226Mine DCF subtotal 393 472 658 1088 1532 273 322 454 737 1037Cash 80 80 80 80 80 80 80 80 80 80Debt (260) (260) (260) (260) (260) (260) (260) (260) (260) (260)Grand total 213 292 478 908 1352 93 142 274 557 857DCF value per share $4.94 $6.77 $11.09 $21.07 $31.37 $2.16 $3.29 $6.36 $12.92 $19.88Multiple 3.4 2.5 1.5 0.8 0.5 7.9 5.2 2.7 1.3 0.9
Base case DCF valuation$450 platinumPalladium price: $200 $300 $400 $500 $600 $200 $300 $400 $500 $600Stillwater mine 359 419 560 884 1223 256 293 389 608 838East Boulder mine 85 105 150 255 360 52 64 94 164 234Mine DCF subtotal 444 524 710 1139 1583 308 357 483 772 1072Cash 80 80 80 80 80 80 80 80 80 80Debt (260) (260) (260) (260) (260) (260) (260) (260) (260) (260)Grand total 264 344 530 959 1403 128 177 303 592 892DCF value per share $6.13 $7.98 $12.30 $22.25 $32.55 $2.97 $4.11 $7.03 $13.74 $20.70Multiple 2.8 2.1 1.4 0.8 0.5 5.7 4.1 2.4 1.2 0.8
$500 platinumPalladium price: $200 $300 $400 $500 $600 $200 $300 $400 $500 $600Stillwater mine 419 479 620 944 1283 297 334 429 649 878East Boulder mine 104 124 169 274 379 65 77 107 177 247Mine DCF subtotal 523 603 789 1218 1662 362 411 536 826 1125Cash 80 80 80 80 80 80 80 80 80 80Debt (260) (260) (260) (260) (260) (260) (260) (260) (260) (260)Grand total 343 423 609 1038 1482 182 231 356 646 945DCF value per share $7.96 $9.81 $14.13 $24.08 $34.39 $4.22 $5.36 $8.26 $14.99 $21.93Multiple 2.1 1.7 1.2 0.7 0.5 4.0 3.2 2.1 1.1 0.8
5% discount rate 10% discount rate
19-Apr-02
Source: Company data, Goldman Sachs Research estimates.
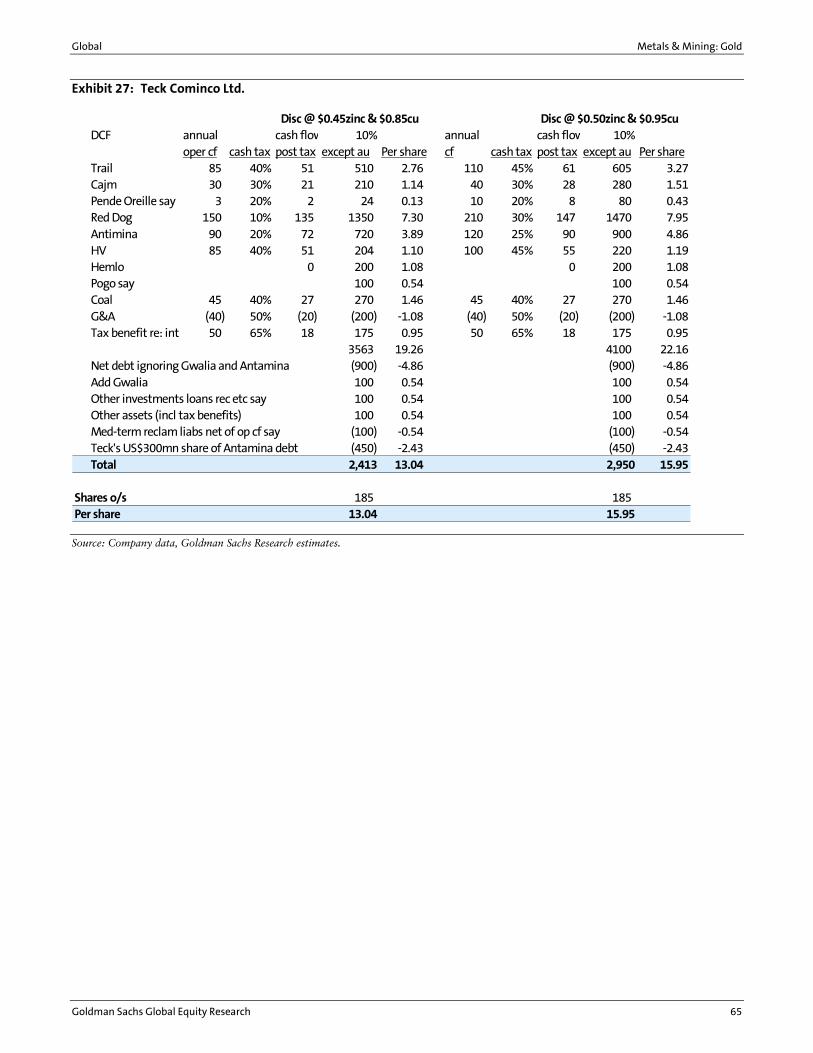
Global Metals & Mining: Gold
Goldman Sachs Global Equity Research 65
Exhibit 27: Teck Cominco Ltd.
Disc @ $0.45zinc & $0.85cu Disc @ $0.50zinc & $0.95cuDCF annual cash flow 10% annual cash flow 10%
oper cf cash tax post tax except au Per share cf cash tax post tax except au Per shareTrail 85 40% 51 510 2.76 110 45% 61 605 3.27Cajm 30 30% 21 210 1.14 40 30% 28 280 1.51Pende Oreille say 3 20% 2 24 0.13 10 20% 8 80 0.43Red Dog 150 10% 135 1350 7.30 210 30% 147 1470 7.95Antimina 90 20% 72 720 3.89 120 25% 90 900 4.86HV 85 40% 51 204 1.10 100 45% 55 220 1.19Hemlo 0 200 1.08 0 200 1.08Pogo say 100 0.54 100 0.54Coal 45 40% 27 270 1.46 45 40% 27 270 1.46G&A (40) 50% (20) (200) -1.08 (40) 50% (20) (200) -1.08Tax benefit re: int 50 65% 18 175 0.95 50 65% 18 175 0.95
3563 19.26 4100 22.16Net debt ignoring Gwalia and Antamina (900) -4.86 (900) -4.86Add Gwalia 100 0.54 100 0.54Other investments loans rec etc say 100 0.54 100 0.54Other assets (incl tax benefits) 100 0.54 100 0.54Med-term reclam liabs net of op cf say (100) -0.54 (100) -0.54Teck's US$300mn share of Antamina debt (450) -2.43 (450) -2.43Total 2,413 13.04 2,950 15.95
Shares o/s 185 185Per share 13.04 15.95
Source: Company data, Goldman Sachs Research estimates.
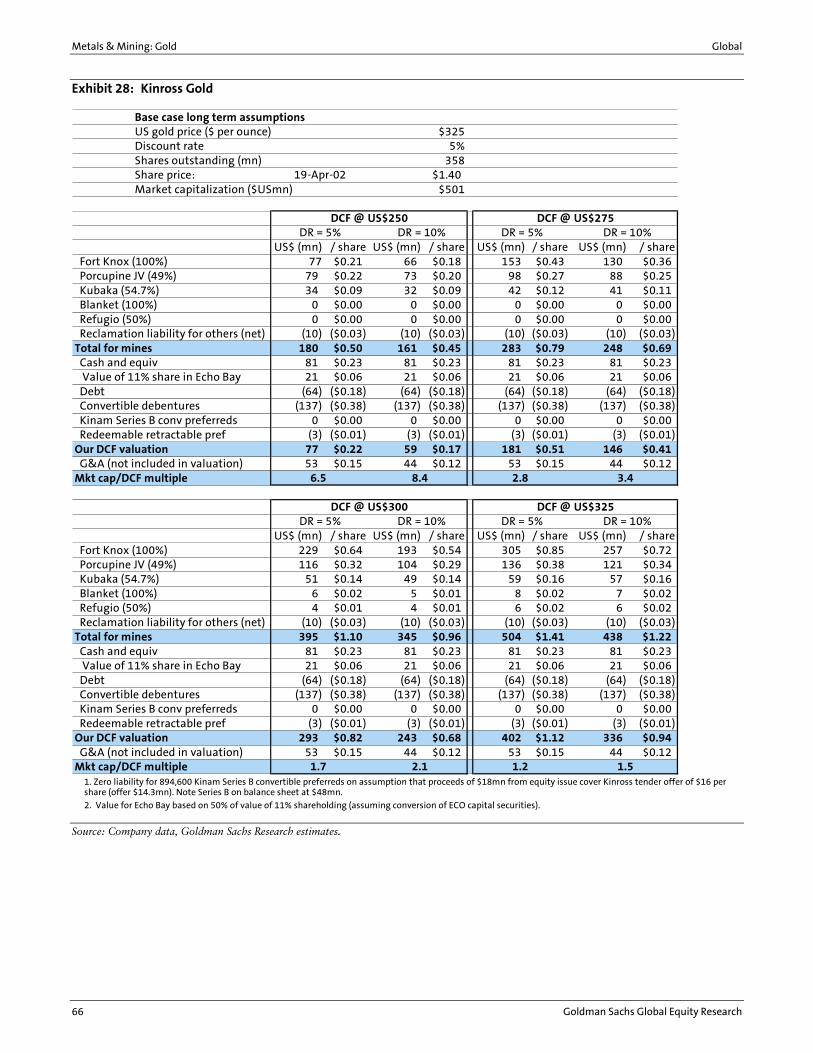
Metals & Mining: Gold Global
66 Goldman Sachs Global Equity Research
Exhibit 28: Kinross Gold
Base case long term assumptionsUS gold price ($ per ounce) $325Discount rate 5%Shares outstanding (mn) 358Share price: $1.40Market capitalization ($USmn) $501
US$ (mn) / share US$ (mn) / share US$ (mn) / share US$ (mn) / share Fort Knox (100%) 77 $0.21 66 $0.18 153 $0.43 130 $0.36 Porcupine JV (49%) 79 $0.22 73 $0.20 98 $0.27 88 $0.25 Kubaka (54.7%) 34 $0.09 32 $0.09 42 $0.12 41 $0.11 Blanket (100%) 0 $0.00 0 $0.00 0 $0.00 0 $0.00 Refugio (50%) 0 $0.00 0 $0.00 0 $0.00 0 $0.00 Reclamation liability for others (net) (10) ($0.03) (10) ($0.03) (10) ($0.03) (10) ($0.03)Total for mines 180 $0.50 161 $0.45 283 $0.79 248 $0.69 Cash and equiv 81 $0.23 81 $0.23 81 $0.23 81 $0.23 Value of 11% share in Echo Bay 21 $0.06 21 $0.06 21 $0.06 21 $0.06 Debt (64) ($0.18) (64) ($0.18) (64) ($0.18) (64) ($0.18) Convertible debentures (137) ($0.38) (137) ($0.38) (137) ($0.38) (137) ($0.38) Kinam Series B conv preferreds 0 $0.00 0 $0.00 0 $0.00 0 $0.00 Redeemable retractable pref (3) ($0.01) (3) ($0.01) (3) ($0.01) (3) ($0.01)Our DCF valuation 77 $0.22 59 $0.17 181 $0.51 146 $0.41 G&A (not included in valuation) 53 $0.15 44 $0.12 53 $0.15 44 $0.12Mkt cap/DCF multiple
US$ (mn) / share US$ (mn) / share US$ (mn) / share US$ (mn) / share Fort Knox (100%) 229 $0.64 193 $0.54 305 $0.85 257 $0.72 Porcupine JV (49%) 116 $0.32 104 $0.29 136 $0.38 121 $0.34 Kubaka (54.7%) 51 $0.14 49 $0.14 59 $0.16 57 $0.16 Blanket (100%) 6 $0.02 5 $0.01 8 $0.02 7 $0.02 Refugio (50%) 4 $0.01 4 $0.01 6 $0.02 6 $0.02 Reclamation liability for others (net) (10) ($0.03) (10) ($0.03) (10) ($0.03) (10) ($0.03)Total for mines 395 $1.10 345 $0.96 504 $1.41 438 $1.22 Cash and equiv 81 $0.23 81 $0.23 81 $0.23 81 $0.23 Value of 11% share in Echo Bay 21 $0.06 21 $0.06 21 $0.06 21 $0.06 Debt (64) ($0.18) (64) ($0.18) (64) ($0.18) (64) ($0.18) Convertible debentures (137) ($0.38) (137) ($0.38) (137) ($0.38) (137) ($0.38) Kinam Series B conv preferreds 0 $0.00 0 $0.00 0 $0.00 0 $0.00 Redeemable retractable pref (3) ($0.01) (3) ($0.01) (3) ($0.01) (3) ($0.01)Our DCF valuation 293 $0.82 243 $0.68 402 $1.12 336 $0.94 G&A (not included in valuation) 53 $0.15 44 $0.12 53 $0.15 44 $0.12Mkt cap/DCF multiple
DR = 10%
DCF @ US$250DR = 5% DR = 10%
DCF @ US$300 DCF @ US$325
DR = 5% DR = 10%
DR = 5% DR = 10%
2.8
DCF @ US$275
19-Apr-02
1.2 1.5
3.4
1.7 2.1
6.5 8.4
DR = 5%
1. Zero liability for 894,600 Kinam Series B convertible preferreds on assumption that proceeds of $18mn from equity issue cover Kinross tender offer of $16 per share (offer $14.3mn). Note Series B on balance sheet at $48mn.
2. Value for Echo Bay based on 50% of value of 11% shareholding (assuming conversion of ECO capital securities).
Source: Company data, Goldman Sachs Research estimates.
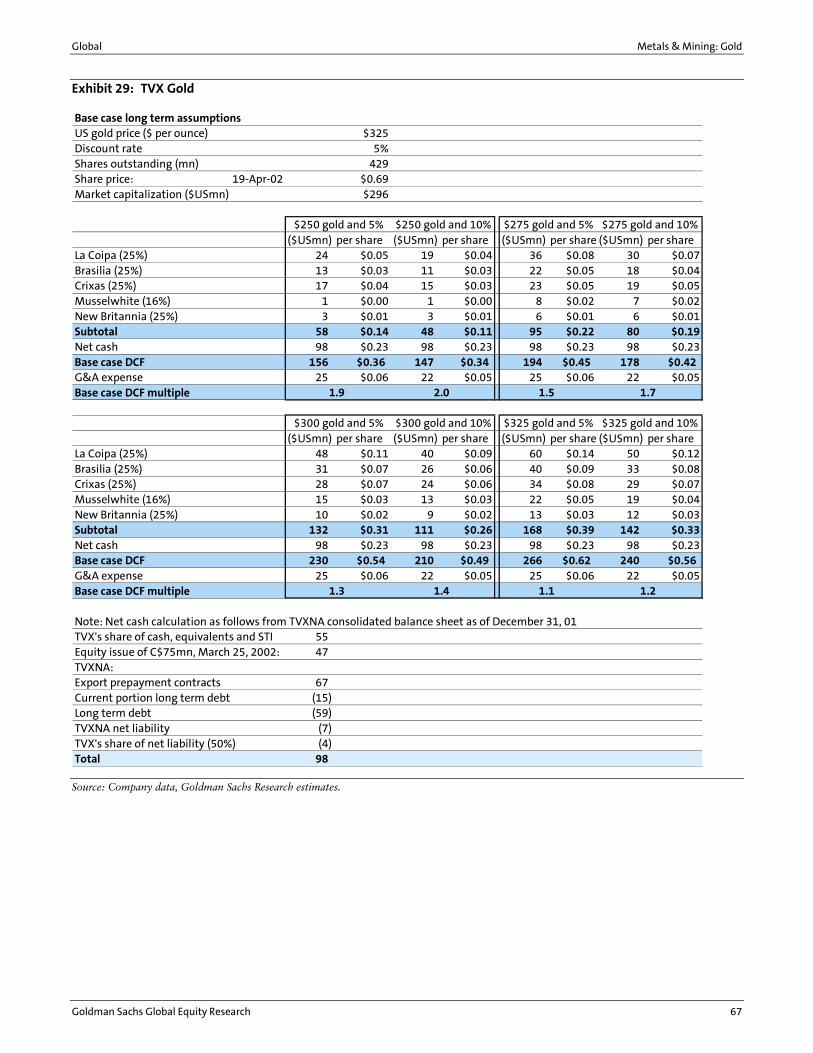
Global Metals & Mining: Gold
Goldman Sachs Global Equity Research 67
Exhibit 29: TVX Gold
Base case long term assumptionsUS gold price ($ per ounce) $325Discount rate 5%Shares outstanding (mn) 429Share price: 19-Apr-02 $0.69Market capitalization ($USmn) $296
($USmn) per share ($USmn) per share ($USmn) per share ($USmn) per shareLa Coipa (25%) 24 $0.05 19 $0.04 36 $0.08 30 $0.07Brasilia (25%) 13 $0.03 11 $0.03 22 $0.05 18 $0.04Crixas (25%) 17 $0.04 15 $0.03 23 $0.05 19 $0.05Musselwhite (16%) 1 $0.00 1 $0.00 8 $0.02 7 $0.02New Britannia (25%) 3 $0.01 3 $0.01 6 $0.01 6 $0.01Subtotal 58 $0.14 48 $0.11 95 $0.22 80 $0.19Net cash 98 $0.23 98 $0.23 98 $0.23 98 $0.23Base case DCF 156 $0.36 147 $0.34 194 $0.45 178 $0.42G&A expense 25 $0.06 22 $0.05 25 $0.06 22 $0.05Base case DCF multiple
($USmn) per share ($USmn) per share ($USmn) per share ($USmn) per shareLa Coipa (25%) 48 $0.11 40 $0.09 60 $0.14 50 $0.12Brasilia (25%) 31 $0.07 26 $0.06 40 $0.09 33 $0.08Crixas (25%) 28 $0.07 24 $0.06 34 $0.08 29 $0.07Musselwhite (16%) 15 $0.03 13 $0.03 22 $0.05 19 $0.04New Britannia (25%) 10 $0.02 9 $0.02 13 $0.03 12 $0.03Subtotal 132 $0.31 111 $0.26 168 $0.39 142 $0.33Net cash 98 $0.23 98 $0.23 98 $0.23 98 $0.23Base case DCF 230 $0.54 210 $0.49 266 $0.62 240 $0.56G&A expense 25 $0.06 22 $0.05 25 $0.06 22 $0.05Base case DCF multiple
Note: Net cash calculation as follows from TVXNA consolidated balance sheet as of December 31, 01TVX's share of cash, equivalents and STI 55Equity issue of C$75mn, March 25, 2002: 47TVXNA: Export prepayment contracts 67Current portion long term debt (15)Long term debt (59)TVXNA net liability (7)TVX's share of net liability (50%) (4)Total 98
1.3 1.4 1.1 1.2
1.9 2.0 1.5 1.7
$250 gold and 5%
$300 gold and 5%
$275 gold and 5% $275 gold and 10%$250 gold and 10%
$325 gold and 5% $325 gold and 10%$300 gold and 10%
Source: Company data, Goldman Sachs Research estimates.
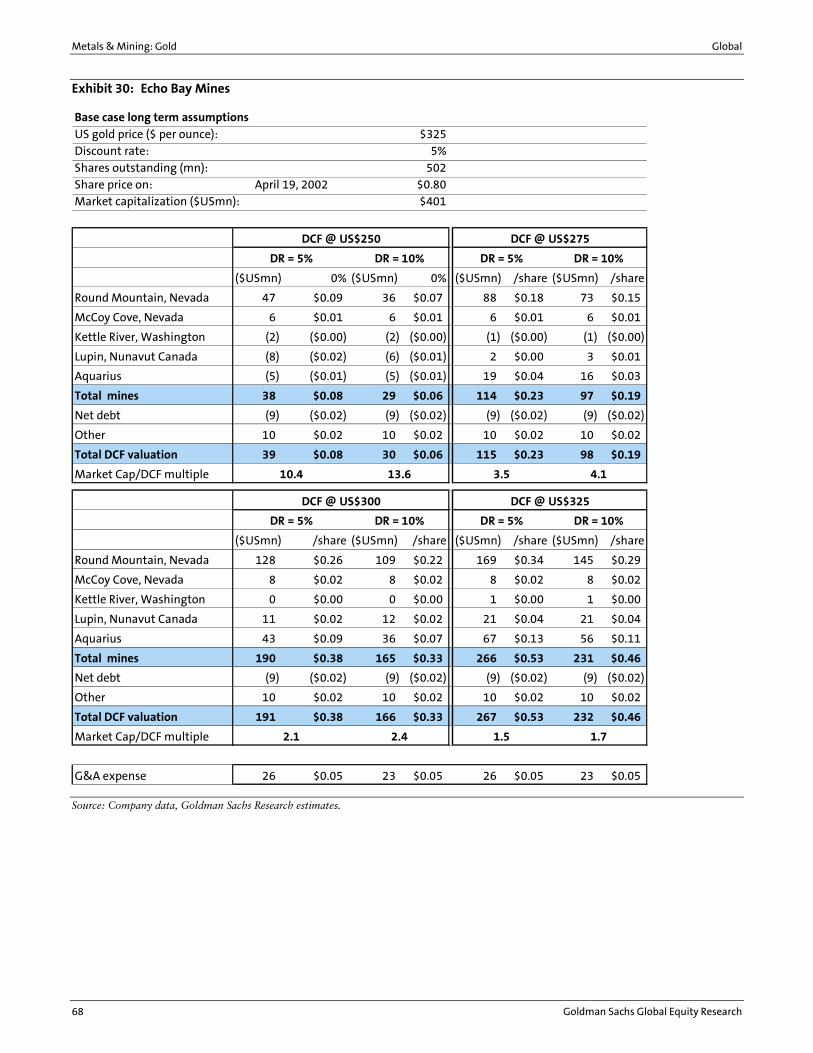
Metals & Mining: Gold Global
68 Goldman Sachs Global Equity Research
Exhibit 30: Echo Bay Mines
Base case long term assumptionsUS gold price ($ per ounce): $325Discount rate: 5%
Shares outstanding (mn): 502Share price on: $0.80Market capitalization ($USmn): $401
($USmn) 0% ($USmn) 0% ($USmn) /share ($USmn) /share
Round Mountain, Nevada 47 $0.09 36 $0.07 88 $0.18 73 $0.15
McCoy Cove, Nevada 6 $0.01 6 $0.01 6 $0.01 6 $0.01
Kettle River, Washington (2) ($0.00) (2) ($0.00) (1) ($0.00) (1) ($0.00)
Lupin, Nunavut Canada (8) ($0.02) (6) ($0.01) 2 $0.00 3 $0.01
Aquarius (5) ($0.01) (5) ($0.01) 19 $0.04 16 $0.03
Total mines 38 $0.08 29 $0.06 114 $0.23 97 $0.19
Net debt (9) ($0.02) (9) ($0.02) (9) ($0.02) (9) ($0.02)
Other 10 $0.02 10 $0.02 10 $0.02 10 $0.02
Total DCF valuation 39 $0.08 30 $0.06 115 $0.23 98 $0.19
Market Cap/DCF multiple
($USmn) /share ($USmn) /share ($USmn) /share ($USmn) /share
Round Mountain, Nevada 128 $0.26 109 $0.22 169 $0.34 145 $0.29
McCoy Cove, Nevada 8 $0.02 8 $0.02 8 $0.02 8 $0.02
Kettle River, Washington 0 $0.00 0 $0.00 1 $0.00 1 $0.00
Lupin, Nunavut Canada 11 $0.02 12 $0.02 21 $0.04 21 $0.04
Aquarius 43 $0.09 36 $0.07 67 $0.13 56 $0.11
Total mines 190 $0.38 165 $0.33 266 $0.53 231 $0.46
Net debt (9) ($0.02) (9) ($0.02) (9) ($0.02) (9) ($0.02)
Other 10 $0.02 10 $0.02 10 $0.02 10 $0.02
Total DCF valuation 191 $0.38 166 $0.33 267 $0.53 232 $0.46
Market Cap/DCF multiple
G&A expense 26 $0.05 23 $0.05 26 $0.05 23 $0.05
April 19, 2002
1.5 1.7
DCF @ US$325
DR = 5% DR = 10%
2.1
DCF @ US$300
2.4
DR = 5% DR = 10%
DCF @ US$250
DR = 5% DR = 10%
10.4 13.6
DCF @ US$275
DR = 5% DR = 10%
3.5 4.1
Source: Company data, Goldman Sachs Research estimates.
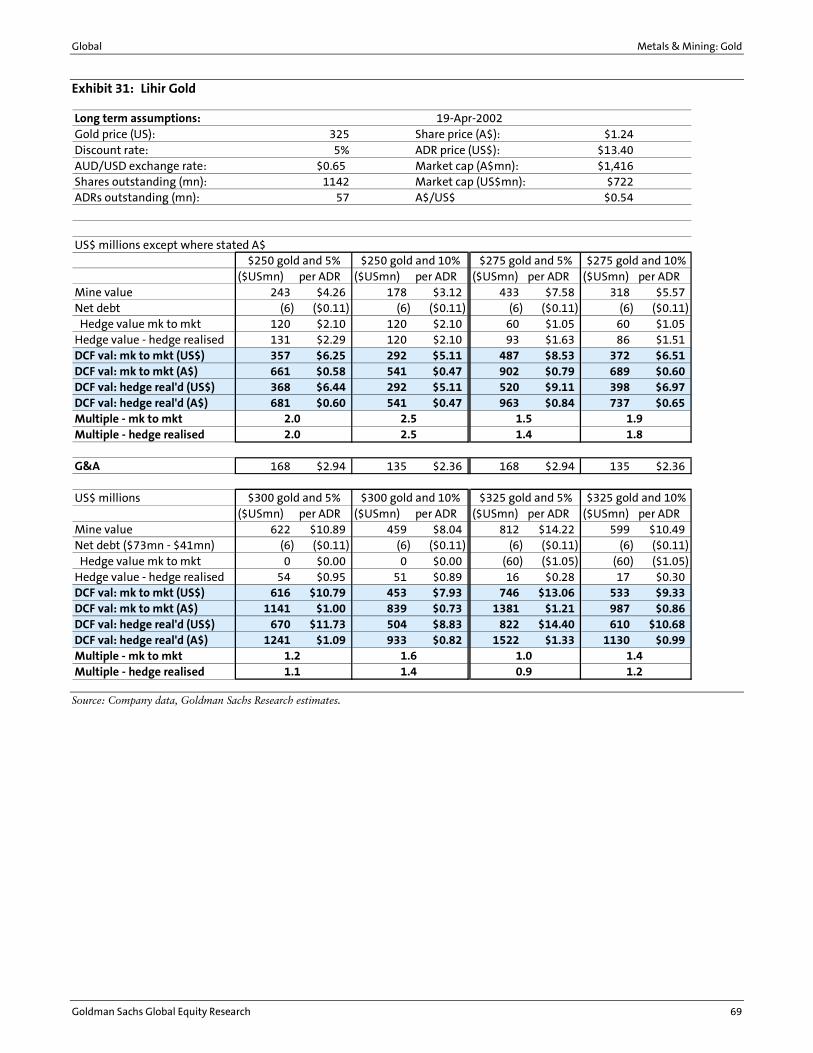
Global Metals & Mining: Gold
Goldman Sachs Global Equity Research 69
Exhibit 31: Lihir Gold
Long term assumptions:Gold price (US): 325 Share price (A$): $1.24Discount rate: 5% ADR price (US$): $13.40AUD/USD exchange rate: $0.65 Market cap (A$mn): $1,416Shares outstanding (mn): 1142 Market cap (US$mn): $722ADRs outstanding (mn): 57 A$/US$ $0.54
US$ millions except where stated A$
($USmn) per ADR ($USmn) per ADR ($USmn) per ADR ($USmn) per ADRMine value 243 $4.26 178 $3.12 433 $7.58 318 $5.57Net debt (6) ($0.11) (6) ($0.11) (6) ($0.11) (6) ($0.11) Hedge value mk to mkt 120 $2.10 120 $2.10 60 $1.05 60 $1.05Hedge value - hedge realised 131 $2.29 120 $2.10 93 $1.63 86 $1.51DCF val: mk to mkt (US$) 357 $6.25 292 $5.11 487 $8.53 372 $6.51DCF val: mk to mkt (A$) 661 $0.58 541 $0.47 902 $0.79 689 $0.60DCF val: hedge real'd (US$) 368 $6.44 292 $5.11 520 $9.11 398 $6.97DCF val: hedge real'd (A$) 681 $0.60 541 $0.47 963 $0.84 737 $0.65Multiple - mk to mktMultiple - hedge realised
G&A 168 $2.94 135 $2.36 168 $2.94 135 $2.36
US$ millions($USmn) per ADR ($USmn) per ADR ($USmn) per ADR ($USmn) per ADR
Mine value 622 $10.89 459 $8.04 812 $14.22 599 $10.49Net debt ($73mn - $41mn) (6) ($0.11) (6) ($0.11) (6) ($0.11) (6) ($0.11) Hedge value mk to mkt 0 $0.00 0 $0.00 (60) ($1.05) (60) ($1.05)Hedge value - hedge realised 54 $0.95 51 $0.89 16 $0.28 17 $0.30DCF val: mk to mkt (US$) 616 $10.79 453 $7.93 746 $13.06 533 $9.33DCF val: mk to mkt (A$) 1141 $1.00 839 $0.73 1381 $1.21 987 $0.86DCF val: hedge real'd (US$) 670 $11.73 504 $8.83 822 $14.40 610 $10.68DCF val: hedge real'd (A$) 1241 $1.09 933 $0.82 1522 $1.33 1130 $0.99Multiple - mk to mktMultiple - hedge realised 0.9 1.2
$300 gold and 5% $300 gold and 10% $325 gold and 5% $325 gold and 10%
1.0 1.41.2 1.61.1 1.4
$250 gold and 5%
2.02.0
$250 gold and 10%
2.52.5
19-Apr-2002
1.4 1.8
$275 gold and 5% $275 gold and 10%
1.5 1.9
Source: Company data, Goldman Sachs Research estimates.
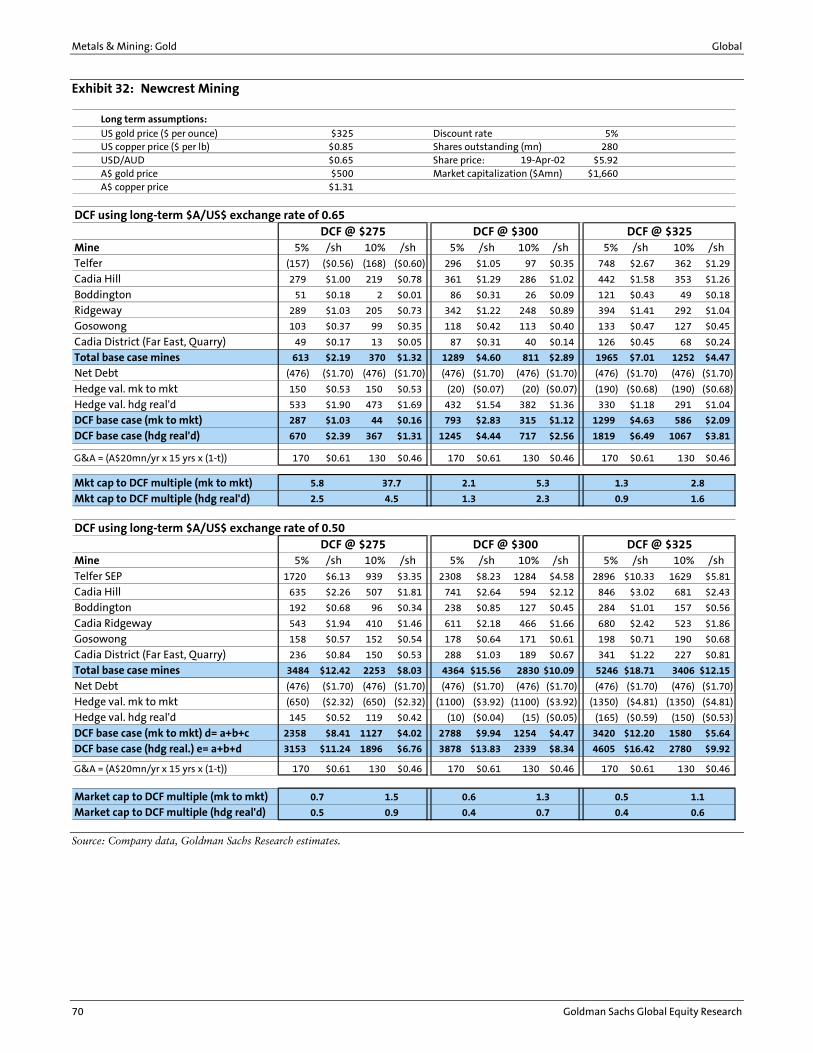
Metals & Mining: Gold Global
70 Goldman Sachs Global Equity Research
Exhibit 32: Newcrest Mining
Long term assumptions:
US gold price ($ per ounce) $325 Discount rate 5%US copper price ($ per lb) $0.85 Shares outstanding (mn) 280USD/AUD $0.65 Share price: $5.92A$ gold price $500 Market capitalization ($Amn) $1,660A$ copper price $1.31
DCF using long-term $A/US$ exchange rate of 0.65
Mine 5% /sh 10% /sh 5% /sh 10% /sh 5% /sh 10% /shTelfer (157) ($0.56) (168) ($0.60) 296 $1.05 97 $0.35 748 $2.67 362 $1.29
Cadia Hill 279 $1.00 219 $0.78 361 $1.29 286 $1.02 442 $1.58 353 $1.26
Boddington 51 $0.18 2 $0.01 86 $0.31 26 $0.09 121 $0.43 49 $0.18
Ridgeway 289 $1.03 205 $0.73 342 $1.22 248 $0.89 394 $1.41 292 $1.04
Gosowong 103 $0.37 99 $0.35 118 $0.42 113 $0.40 133 $0.47 127 $0.45
Cadia District (Far East, Quarry) 49 $0.17 13 $0.05 87 $0.31 40 $0.14 126 $0.45 68 $0.24
Total base case mines 613 $2.19 370 $1.32 1289 $4.60 811 $2.89 1965 $7.01 1252 $4.47
Net Debt (476) ($1.70) (476) ($1.70) (476) ($1.70) (476) ($1.70) (476) ($1.70) (476) ($1.70)
Hedge val. mk to mkt 150 $0.53 150 $0.53 (20) ($0.07) (20) ($0.07) (190) ($0.68) (190) ($0.68)
Hedge val. hdg real'd 533 $1.90 473 $1.69 432 $1.54 382 $1.36 330 $1.18 291 $1.04
DCF base case (mk to mkt) 287 $1.03 44 $0.16 793 $2.83 315 $1.12 1299 $4.63 586 $2.09
DCF base case (hdg real'd) 670 $2.39 367 $1.31 1245 $4.44 717 $2.56 1819 $6.49 1067 $3.81
G&A = (A$20mn/yr x 15 yrs x (1-t)) 170 $0.61 130 $0.46 170 $0.61 130 $0.46 170 $0.61 130 $0.46
Mkt cap to DCF multiple (mk to mkt)
Mkt cap to DCF multiple (hdg real'd)
DCF using long-term $A/US$ exchange rate of 0.50
Mine 5% /sh 10% /sh 5% /sh 10% /sh 5% /sh 10% /sh
Telfer SEP 1720 $6.13 939 $3.35 2308 $8.23 1284 $4.58 2896 $10.33 1629 $5.81
Cadia Hill 635 $2.26 507 $1.81 741 $2.64 594 $2.12 846 $3.02 681 $2.43
Boddington 192 $0.68 96 $0.34 238 $0.85 127 $0.45 284 $1.01 157 $0.56
Cadia Ridgeway 543 $1.94 410 $1.46 611 $2.18 466 $1.66 680 $2.42 523 $1.86
Gosowong 158 $0.57 152 $0.54 178 $0.64 171 $0.61 198 $0.71 190 $0.68
Cadia District (Far East, Quarry) 236 $0.84 150 $0.53 288 $1.03 189 $0.67 341 $1.22 227 $0.81
Total base case mines 3484 $12.42 2253 $8.03 4364 $15.56 2830 $10.09 5246 $18.71 3406 $12.15
Net Debt (476) ($1.70) (476) ($1.70) (476) ($1.70) (476) ($1.70) (476) ($1.70) (476) ($1.70)
Hedge val. mk to mkt (650) ($2.32) (650) ($2.32) (1100) ($3.92) (1100) ($3.92) (1350) ($4.81) (1350) ($4.81)
Hedge val. hdg real'd 145 $0.52 119 $0.42 (10) ($0.04) (15) ($0.05) (165) ($0.59) (150) ($0.53)
DCF base case (mk to mkt) d= a+b+c 2358 $8.41 1127 $4.02 2788 $9.94 1254 $4.47 3420 $12.20 1580 $5.64
DCF base case (hdg real.) e= a+b+d 3153 $11.24 1896 $6.76 3878 $13.83 2339 $8.34 4605 $16.42 2780 $9.92
G&A = (A$20mn/yr x 15 yrs x (1-t)) 170 $0.61 130 $0.46 170 $0.61 130 $0.46 170 $0.61 130 $0.46
Market cap to DCF multiple (mk to mkt)Market cap to DCF multiple (hdg real'd)
0.7
0.5 0.9 0.4
1.5
19-Apr-02
0.4
0.6 1.3
2.1 5.3 1.3
2.3
0.7 0.6
0.9 1.6
1.10.5
2.8
DCF @ $275 DCF @ $300 DCF @ $325
5.8 37.7
2.5 4.5 1.3
DCF @ $275 DCF @ $300 DCF @ $325
Source: Company data, Goldman Sachs Research estimates.
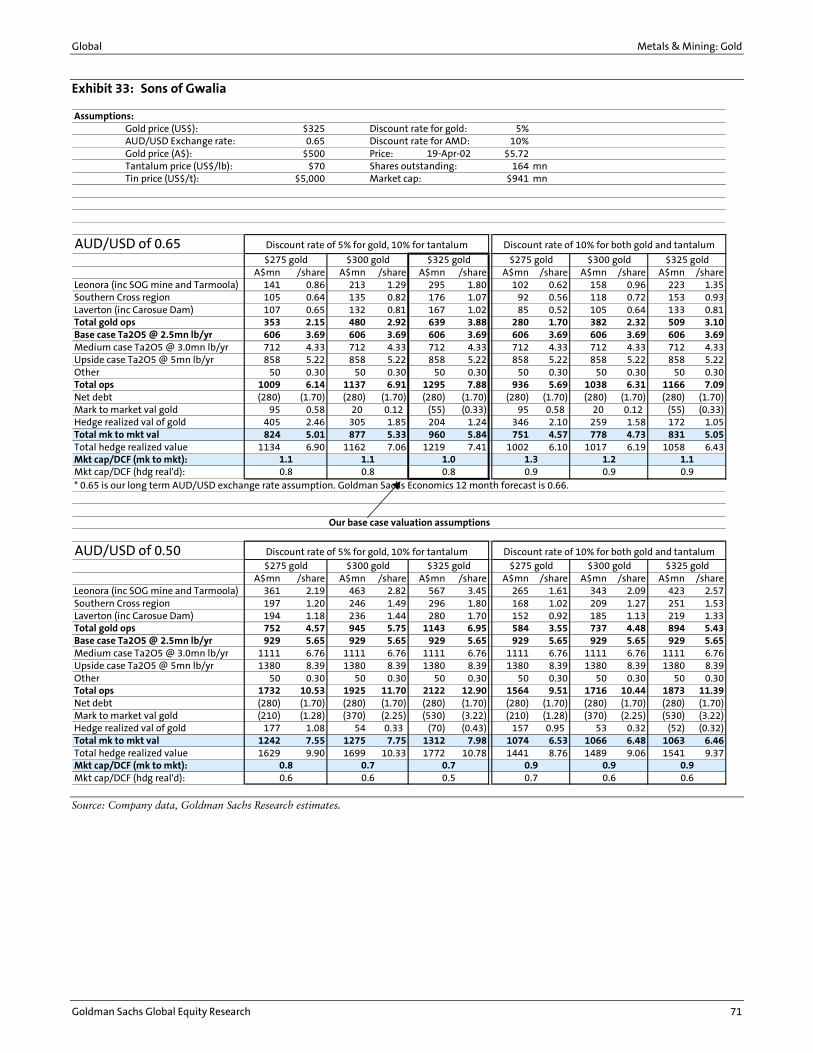
Global Metals & Mining: Gold
Goldman Sachs Global Equity Research 71
Exhibit 33: Sons of Gwalia
Assumptions:Gold price (US$): $325 Discount rate for gold: 5%AUD/USD Exchange rate: 0.65 Discount rate for AMD: 10%Gold price (A$): $500 Price: $5.72Tantalum price (US$/lb): $70 Shares outstanding: 164 mnTin price (US$/t): $5,000 Market cap: $941 mn
AUD/USD of 0.65
A$mn /share A$mn /share A$mn /share A$mn /share A$mn /share A$mn /shareLeonora (inc SOG mine and Tarmoola) 141 0.86 213 1.29 295 1.80 102 0.62 158 0.96 223 1.35Southern Cross region 105 0.64 135 0.82 176 1.07 92 0.56 118 0.72 153 0.93Laverton (inc Carosue Dam) 107 0.65 132 0.81 167 1.02 85 0.52 105 0.64 133 0.81Total gold ops 353 2.15 480 2.92 639 3.88 280 1.70 382 2.32 509 3.10Base case Ta2O5 @ 2.5mn lb/yr 606 3.69 606 3.69 606 3.69 606 3.69 606 3.69 606 3.69Medium case Ta2O5 @ 3.0mn lb/yr 712 4.33 712 4.33 712 4.33 712 4.33 712 4.33 712 4.33Upside case Ta2O5 @ 5mn lb/yr 858 5.22 858 5.22 858 5.22 858 5.22 858 5.22 858 5.22Other 50 0.30 50 0.30 50 0.30 50 0.30 50 0.30 50 0.30Total ops 1009 6.14 1137 6.91 1295 7.88 936 5.69 1038 6.31 1166 7.09Net debt (280) (1.70) (280) (1.70) (280) (1.70) (280) (1.70) (280) (1.70) (280) (1.70)Mark to market val gold 95 0.58 20 0.12 (55) (0.33) 95 0.58 20 0.12 (55) (0.33)Hedge realized val of gold 405 2.46 305 1.85 204 1.24 346 2.10 259 1.58 172 1.05Total mk to mkt val 824 5.01 877 5.33 960 5.84 751 4.57 778 4.73 831 5.05Total hedge realized value 1134 6.90 1162 7.06 1219 7.41 1002 6.10 1017 6.19 1058 6.43Mkt cap/DCF (mk to mkt):Mkt cap/DCF (hdg real'd):* 0.65 is our long term AUD/USD exchange rate assumption. Goldman Sachs Economics 12 month forecast is 0.66.
Our base case valuation assumptions
AUD/USD of 0.50
A$mn /share A$mn /share A$mn /share A$mn /share A$mn /share A$mn /shareLeonora (inc SOG mine and Tarmoola) 361 2.19 463 2.82 567 3.45 265 1.61 343 2.09 423 2.57Southern Cross region 197 1.20 246 1.49 296 1.80 168 1.02 209 1.27 251 1.53Laverton (inc Carosue Dam) 194 1.18 236 1.44 280 1.70 152 0.92 185 1.13 219 1.33Total gold ops 752 4.57 945 5.75 1143 6.95 584 3.55 737 4.48 894 5.43Base case Ta2O5 @ 2.5mn lb/yr 929 5.65 929 5.65 929 5.65 929 5.65 929 5.65 929 5.65Medium case Ta2O5 @ 3.0mn lb/yr 1111 6.76 1111 6.76 1111 6.76 1111 6.76 1111 6.76 1111 6.76Upside case Ta2O5 @ 5mn lb/yr 1380 8.39 1380 8.39 1380 8.39 1380 8.39 1380 8.39 1380 8.39Other 50 0.30 50 0.30 50 0.30 50 0.30 50 0.30 50 0.30Total ops 1732 10.53 1925 11.70 2122 12.90 1564 9.51 1716 10.44 1873 11.39Net debt (280) (1.70) (280) (1.70) (280) (1.70) (280) (1.70) (280) (1.70) (280) (1.70)Mark to market val gold (210) (1.28) (370) (2.25) (530) (3.22) (210) (1.28) (370) (2.25) (530) (3.22)Hedge realized val of gold 177 1.08 54 0.33 (70) (0.43) 157 0.95 53 0.32 (52) (0.32)Total mk to mkt val 1242 7.55 1275 7.75 1312 7.98 1074 6.53 1066 6.48 1063 6.46Total hedge realized value 1629 9.90 1699 10.33 1772 10.78 1441 8.76 1489 9.06 1541 9.37Mkt cap/DCF (mk to mkt):Mkt cap/DCF (hdg real'd):
19-Apr-02
$325 gold$300 gold
$275 gold $300 gold $325 gold $275 gold $300 gold $325 gold
1.2
$275 gold
1.10.90.8
1.30.9 0.9
Discount rate of 5% for gold, 10% for tantalum Discount rate of 10% for both gold and tantalum
1.10.8
1.10.8
1.0
$275 gold $300 gold $325 gold
0.90.7
0.90.6
0.90.6
Discount rate of 10% for both gold and tantalumDiscount rate of 5% for gold, 10% for tantalum
0.60.8 0.7
0.60.70.5
Source: Company data, Goldman Sachs Research estimates.

Metals & Mining: Gold Global
72 Goldman Sachs Global Equity Research
Reconciliation of changes in DCF values for our companies
The following contains a brief description of the changes in DCF valuation for our companies. All of our latest valuations reflect adjustments for: (1) 2001 depletion, (2) new reserve statements, (3) the companies� latest balance sheet position, and (4) other material matters relevant to valuation as set out. Below we briefly discuss the changes to our DCF values in terms of those that increased, those that are neutral, and those that decreased. For consistency, we are comparing valuations based on a long-term assumption of $300 gold.
Exhibit 34: Year-on-year change in DCF value for our companies assuming $300 gold in US$ except Newcest, Lihir and Gwalia which are in A$
Inc/(dec) Inc/(dec) DCF value Inc/(dec)per sh $mn per sh %
Lihir A$0.13 A$148 A$1.01 15%AngloGold $1.33 $417 $16.56 9%Sons of Gwalia A$0.00 A$0 A$5.33 0%Stillwater $0.00 $0 $12.30 0%Freeport-McMoRan ($0.11) ($16) $13.71 -1%Echo Bay ($0.00) ($2) $0.38 -1%Kinross ($0.01) $20 $0.73 -1%Newmont ($0.26) ($99) $11.31 -2%Barrick ($0.60) ($323) $7.68 -7%Ashanti ($0.24) ($27) $2.90 -8%TVX Gold ($0.08) $10 $0.54 -13%Placer Dome ($1.10) ($361) $5.43 -17%Newcrest Mining (A$1.07) A$300 A$2.83 -27%
Source: Company data, Goldman Sachs Research estimates.
Increases to our DCF value
Lihir
We raised our DCF by around A$150 million, or A$0.13 per share to A$1.01 per share. Our DCF is now based on 25 years of mining of 14.5 million contained ounces and 12.9 million ounces of recoverable ounces with an average grade of 4.5 gpt, which is 0.4 grams above the 13.3 million ounces of in pit ore in the current reserves. Our previous DCF estimate was based on gold production of 11.1 million ounces from ore grading 3.86 gpt. We are now assuming that future reserve additions will allow the mine to process, on average, higher-than-current-planned grades.
AngloGold
We raised our DCF valuation by around $420 million ($1.33 per ADR). The increase is mainly attributable to our base-case long-term USD/ZAR exchange rate assumption to 9.6 from 8.0, which raised the value of AngloGold�s current portfolio of South African mines.
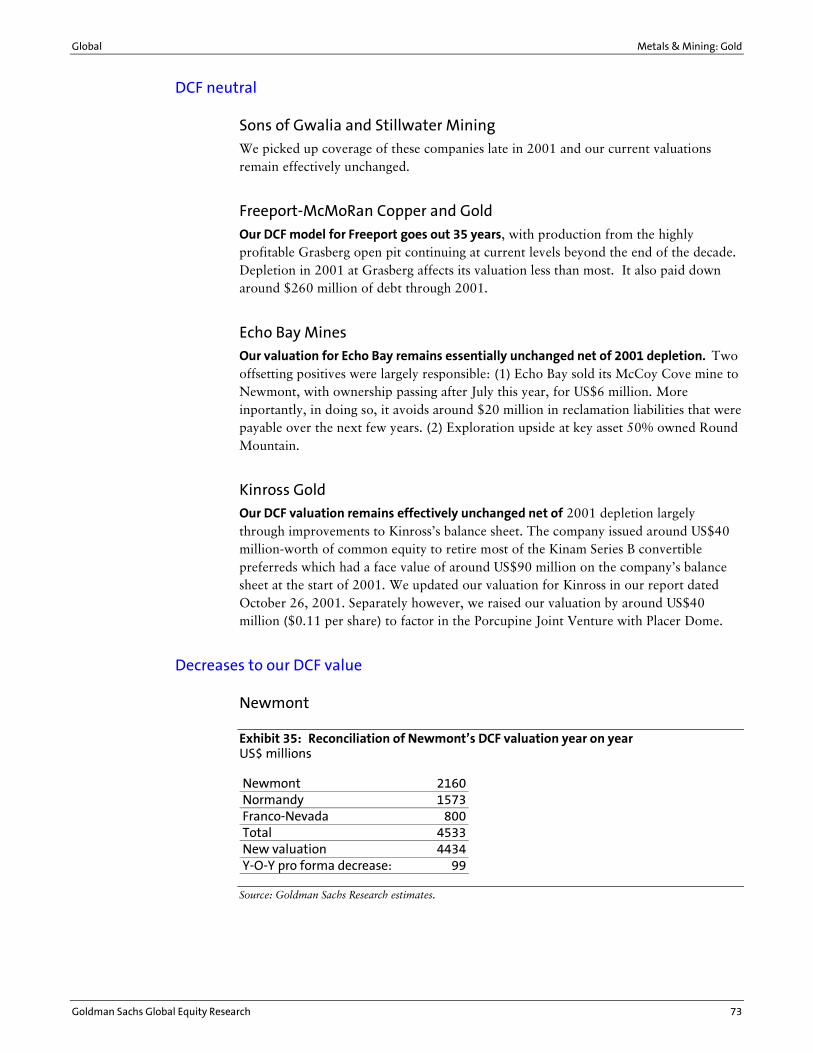
Global Metals & Mining: Gold
Goldman Sachs Global Equity Research 73
DCF neutral
Sons of Gwalia and Stillwater Mining
We picked up coverage of these companies late in 2001 and our current valuations remain effectively unchanged.
Freeport-McMoRan Copper and Gold
Our DCF model for Freeport goes out 35 years, with production from the highly profitable Grasberg open pit continuing at current levels beyond the end of the decade. Depletion in 2001 at Grasberg affects its valuation less than most. It also paid down around $260 million of debt through 2001.
Echo Bay Mines
Our valuation for Echo Bay remains essentially unchanged net of 2001 depletion. Two offsetting positives were largely responsible: (1) Echo Bay sold its McCoy Cove mine to Newmont, with ownership passing after July this year, for US$6 million. More inportantly, in doing so, it avoids around $20 million in reclamation liabilities that were payable over the next few years. (2) Exploration upside at key asset 50% owned Round Mountain.
Kinross Gold
Our DCF valuation remains effectively unchanged net of 2001 depletion largely through improvements to Kinross�s balance sheet. The company issued around US$40 million-worth of common equity to retire most of the Kinam Series B convertible preferreds which had a face value of around US$90 million on the company�s balance sheet at the start of 2001. We updated our valuation for Kinross in our report dated October 26, 2001. Separately however, we raised our valuation by around US$40 million ($0.11 per share) to factor in the Porcupine Joint Venture with Placer Dome.
Decreases to our DCF value
Newmont
Exhibit 35: Reconciliation of Newmont�s DCF valuation year on year US$ millions
Newmont 2160Normandy 1573Franco-Nevada 800Total 4533New valuation 4434Y-O-Y pro forma decrease: 99
Source: Goldman Sachs Research estimates.
Metals & Mining: Gold Global
74 Goldman Sachs Global Equity Research
We lowered our DCF value for Newmont by around $100 million, or $0.26 per share, to $7.51 (Exhibit 35). Key changes were:
• Kalgoorlie (part of the Normandy acquisition), lower by $150 million ($0.38 per share) to $170 million, as set out in Exhibit 35.
• Nevada, lower by $60 million ($0.15 per share) to $670 million, due to depletion.
• Zarafshan, lower by $60 million ($0.15 per share) to $140 million, due mainly to an increase in our estimate of sustaining life of mine capital costs.
The overall decrease is partially offset by increases to around a $200 million aggregate increase in our estimated value for Golden Grove and the Martabe property in Indonesia, and other increases including the Newmont�s stakes in Lihir and Echo Bay.
Barrick Gold
We lowered our DCF value for Barrick by around $320 million, or $0.60 per share, to $7.68. Key changes are:
• Meikle, lower by around $300 million ($0.56 per share) to $332 million ($0.62 per share) due to lower reserves to just below 4 million ounces from 6.45 million ounces, and less upside than we had previously perceived. The 2.5 million ounce difference to reserves included around 700,000 ounces of 2001 depletion. About 1.75 million ounces of reserves were taken off the books, 0.945 million ounces of which related to non-economic mineralization which will likely not return to reserves, and around 0.795 million ounceswhich were downgraded to resources. Barrick expects this latter category of mineralization to return to reserves once further drilling has been done. Going forward, Barrick expects to be able to maintain total cash costs at around $190 to $200 per oz from Meikle.
• Kalgoorlie, lower by around $150 million ($0.28 per share) to $156 million ($0.29 per share). Our current valuation is based on a 20-year mine life and mining of 1.2 million recoverable ounces above current 5.5 million ounce reserves. Key differences are: (1) we have increased our life-of-mine average costs to A$360 per ounce from around A$325 based on our view that the challenges of remnant mining will continue; (2) we have lowered our estimated average annual attributable production to just under 400,000 ounces from around 430,000 ounces as a result of our less-optimistic view of realistic production levels.
• Bulyanhulu, lower by around $100 million ($0.19 per share) to $380 million ($0.71 per share). We raised our estimated life of mine cash costs to around $165 per ounce from around $135 to factor in our expectation that Buly may be more challenging than we initially expected. It is still a high-quality operation with attractive brownfields upside in our view.
• We have added around $200 million ($0.37 per share) to factor in project potential, including the 3 million ounce reserve Cowal project in New South Wales.
Global Metals & Mining: Gold
Goldman Sachs Global Equity Research 75
Ashanti
We lowered our valuation for Ashanti by around $25 million ($0.24 per share). The difference essentially reflects depletion across all of Ashanti�s mines.
TVX Gold
We increased our aggregate valuation for TVX by $10 million to $230 million, but lowered our per-share value by around $0.08 to $0.54 per share. The main reasons were a C$75 million equity issue offset by 2001 depletion.
Placer Dome
We lowered our DCF value for Placer Dome by around $1.10 per share to $5.43 per share. Key changes are:
• Cortez, lower by $148 million ($0.43 per share) to $354 million ($1.08 per share), mainly due to an increase in estimated total cash costs by between $50 to $60 per ounce going forward ($40 of this relates to different accounting for the deferred stripping; however, we have maintained a DD&A charge of around $60 per ounce).
• Porgera, lower by $140 million ($0.43 per share) to $68 million ($0.21 per share) due to lower-than we had previous estimated production levels of 350,000 attributable ounces for the next five years from 390,000 ounces, higher costs, to $220 per ounce from around $190, and a shorter mine life of ten years consistent with current reserves.
• Campbell, lower by $69 million ($0.21 per share) to $53 million ($0.16 per share) due to cutting our expected reserve upside to zero from around 40%, and lowering expected annual production from around 280,000 to 180,000 ounces.
• South Deep, lower by $59 million ($0.18 per share) to $185 million ($0.56 per share), due to lower annual production levels of 350,000 ounces attributable from 375,000 ounces.
Year-on-year overall hedge book changes. Net commitments increased slightly to 7.9 million ounces from 7.7 million ounces. The increase in calls sold (by around 550,000 ounces), and combined forward sales and spot deferreds (by around 450,000 ounces), was partially offset by the purchase of 850,000 call options in 4Q2001 at an average strike price of $437/ounce, which mature throughout 2002.
Placer�s challenge to replace reserves continues. In 2001, Placer replaced around 20% of reserve ounces. Placer replaced around 600,000 ounces out of the 3.1 million contained ounces depleted during 2001, as set out in Exhibit 36. Although this is a challenge common to all gold producers, Placer has no projects in reserves and it faces a harder battle than its peers, in our view.
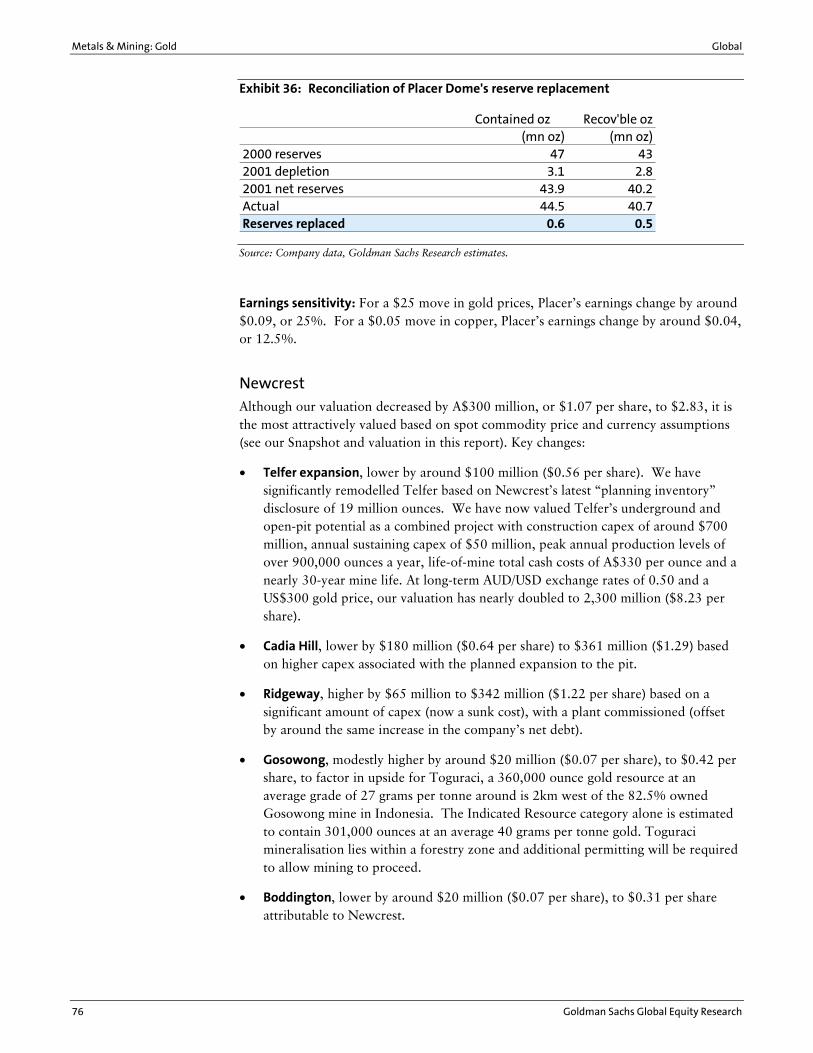
Metals & Mining: Gold Global
76 Goldman Sachs Global Equity Research
Exhibit 36: Reconciliation of Placer Dome's reserve replacement
Contained oz Recov'ble oz(mn oz) (mn oz)
2000 reserves 47 432001 depletion 3.1 2.82001 net reserves 43.9 40.2Actual 44.5 40.7Reserves replaced 0.6 0.5
Source: Company data, Goldman Sachs Research estimates.
Earnings sensitivity: For a $25 move in gold prices, Placer�s earnings change by around $0.09, or 25%. For a $0.05 move in copper, Placer�s earnings change by around $0.04, or 12.5%.
Newcrest
Although our valuation decreased by A$300 million, or $1.07 per share, to $2.83, it is the most attractively valued based on spot commodity price and currency assumptions (see our Snapshot and valuation in this report). Key changes:
• Telfer expansion, lower by around $100 million ($0.56 per share). We have significantly remodelled Telfer based on Newcrest�s latest �planning inventory� disclosure of 19 million ounces. We have now valued Telfer�s underground and open-pit potential as a combined project with construction capex of around $700 million, annual sustaining capex of $50 million, peak annual production levels of over 900,000 ounces a year, life-of-mine total cash costs of A$330 per ounce and a nearly 30-year mine life. At long-term AUD/USD exchange rates of 0.50 and a US$300 gold price, our valuation has nearly doubled to 2,300 million ($8.23 per share).
• Cadia Hill, lower by $180 million ($0.64 per share) to $361 million ($1.29) based on higher capex associated with the planned expansion to the pit.
• Ridgeway, higher by $65 million to $342 million ($1.22 per share) based on a significant amount of capex (now a sunk cost), with a plant commissioned (offset by around the same increase in the company�s net debt).
• Gosowong, modestly higher by around $20 million ($0.07 per share), to $0.42 per share, to factor in upside for Toguraci, a 360,000 ounce gold resource at an average grade of 27 grams per tonne around is 2km west of the 82.5% owned Gosowong mine in Indonesia. The Indicated Resource category alone is estimated to contain 301,000 ounces at an average 40 grams per tonne gold. Toguraci mineralisation lies within a forestry zone and additional permitting will be required to allow mining to proceed.
• Boddington, lower by around $20 million ($0.07 per share), to $0.31 per share attributable to Newcrest.
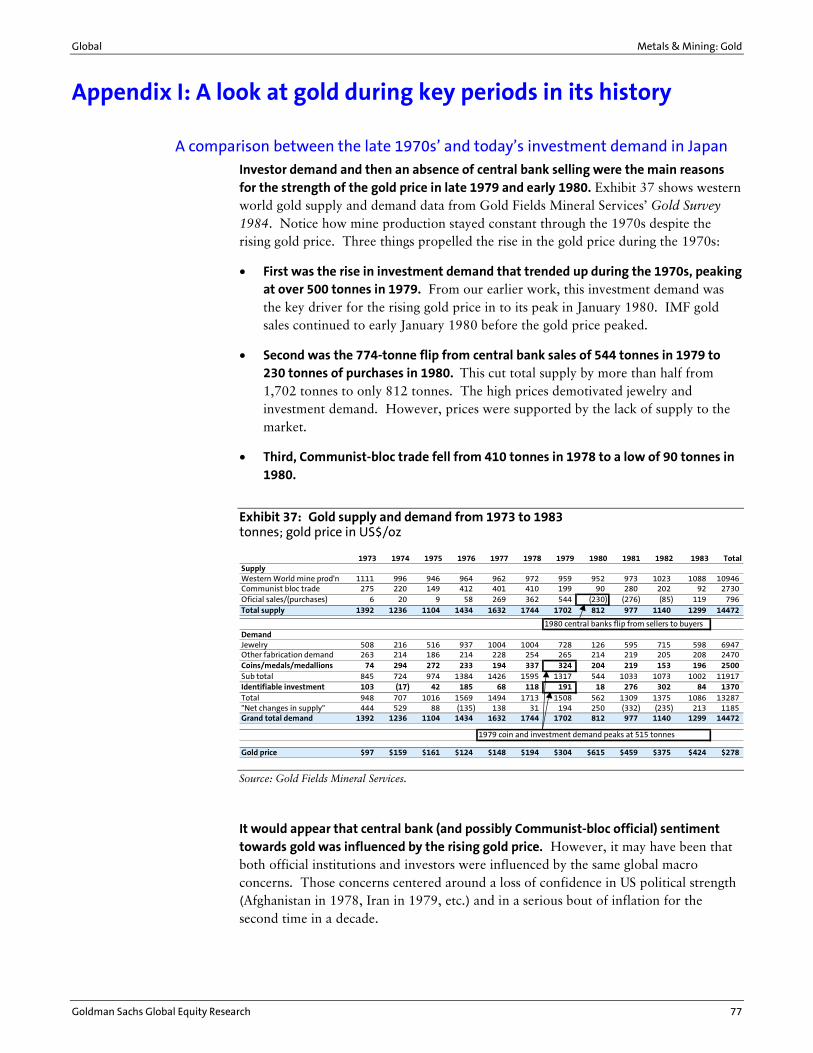
Global Metals & Mining: Gold
Goldman Sachs Global Equity Research 77
Appendix I: A look at gold during key periods in its history
A comparison between the late 1970s� and today�s investment demand in Japan
Investor demand and then an absence of central bank selling were the main reasons for the strength of the gold price in late 1979 and early 1980. Exhibit 37 shows western world gold supply and demand data from Gold Fields Mineral Services� Gold Survey 1984. Notice how mine production stayed constant through the 1970s despite the rising gold price. Three things propelled the rise in the gold price during the 1970s:
• First was the rise in investment demand that trended up during the 1970s, peaking at over 500 tonnes in 1979. From our earlier work, this investment demand was the key driver for the rising gold price in to its peak in January 1980. IMF gold sales continued to early January 1980 before the gold price peaked.
• Second was the 774-tonne flip from central bank sales of 544 tonnes in 1979 to 230 tonnes of purchases in 1980. This cut total supply by more than half from 1,702 tonnes to only 812 tonnes. The high prices demotivated jewelry and investment demand. However, prices were supported by the lack of supply to the market.
• Third, Communist-bloc trade fell from 410 tonnes in 1978 to a low of 90 tonnes in 1980.
Exhibit 37: Gold supply and demand from 1973 to 1983 tonnes; gold price in US$/oz
Source: Gold Fields Mineral Services.
It would appear that central bank (and possibly Communist-bloc official) sentiment towards gold was influenced by the rising gold price. However, it may have been that both official institutions and investors were influenced by the same global macro concerns. Those concerns centered around a loss of confidence in US political strength (Afghanistan in 1978, Iran in 1979, etc.) and in a serious bout of inflation for the second time in a decade.
1973 1974 1975 1976 1977 1978 1979 1980 1981 1982 1983 TotalSupplyWestern World mine prod'n 1111 996 946 964 962 972 959 952 973 1023 1088 10946Communist bloc trade 275 220 149 412 401 410 199 90 280 202 92 2730Oficial sales/(purchases) 6 20 9 58 269 362 544 (230) (276) (85) 119 796Total supply 1392 1236 1104 1434 1632 1744 1702 812 977 1140 1299 14472
1980 central banks flip from sellers to buyersDemandJewelry 508 216 516 937 1004 1004 728 126 595 715 598 6947Other fabrication demand 263 214 186 214 228 254 265 214 219 205 208 2470Coins/medals/medallions 74 294 272 233 194 337 324 204 219 153 196 2500Sub total 845 724 974 1384 1426 1595 1317 544 1033 1073 1002 11917Identifiable investment 103 (17) 42 185 68 118 191 18 276 302 84 1370Total 948 707 1016 1569 1494 1713 1508 562 1309 1375 1086 13287"Net changes in supply" 444 529 88 (135) 138 31 194 250 (332) (235) 213 1185Grand total demand 1392 1236 1104 1434 1632 1744 1702 812 977 1140 1299 14472
1979 coin and investment demand peaks at 515 tonnes
Gold price $97 $159 $161 $124 $148 $194 $304 $615 $459 $375 $424 $278

Metals & Mining: Gold Global
78 Goldman Sachs Global Equity Research
If one were looking for a bullish case for gold, one could argue that investor demand in Japan has picked up for reasons of financial concern. If this escalates it could increase investment demand and hurt central banks� appetite to sell their gold holdings. Like investors, their attraction to gold may increase.
The Gulf War in 1990
Exhibit 38 shows the two-year period from 1990 to 1991. The Gulf War period began in late August 1990 when Iraq invaded Kuwait. In looking back, one remembers the spiking of oil prices and the fear of chemical weapon usage that dominated those times. The allies� initial bombing began in mid-January 1991 and there was a cease-fire at the end of February. The US Federal Reserve began cutting rates aggressively in early 1991 from around 8%. The period marked a spike in oil prices and a recession. Afterwards, the recession and high levels of central bank gold sales in 1992 kept the gold price depressed. However, the low level of interest rates from a series of Fed cuts, higher gold lending rates, and a strong global economy set the stage for a strong revival in gold prices in 1993.
Exhibit 38: The Gulf War in 1990 XAU, gold price, fed funds rate, S&P 500, January 3, 1990-December 30, 1991
0.00
20.00
40.00
60.00
80.00
100.00
120.00
140.00
160.00
3-Jan-9019-Mar-90
5-Jun-9017-Aug-90
1-Nov-9022-Jan-91
9-Apr-9124-Jun-91
9-Sep-9120-Nov-91
290.00
310.00
330.00
350.00
370.00
390.00
410.00
430.00
Fed Funds Rate
Gold Price
XAU
Iraq Invades Kuwait 8/2/90Gold Price: $380.70XAU: 112.81S&P: 351.48
US bombed Iraq 1/16/91Gold Price: $403XAU: 92.50S&P: 316.17
S&P 500
Ceasefire February 1991
S&P bottoms October 11, 1990 at 295.46Gold Price: $388 XAU: 93.18
Source: Compiled by Goldman Sachs Research.
The long-term capital management crisis in 1998
In 1997 there were announcements of possible Swiss and actual Australian gold sales. In 1998 (see Exhibit 39) came the Asian currency crisis, which resulted in massive scrap supply from Southeast Asia (mainly Korea) in early 1998. In August 1998, Russia defaulted on its debt, which sent material vibrations through fixed-income markets that
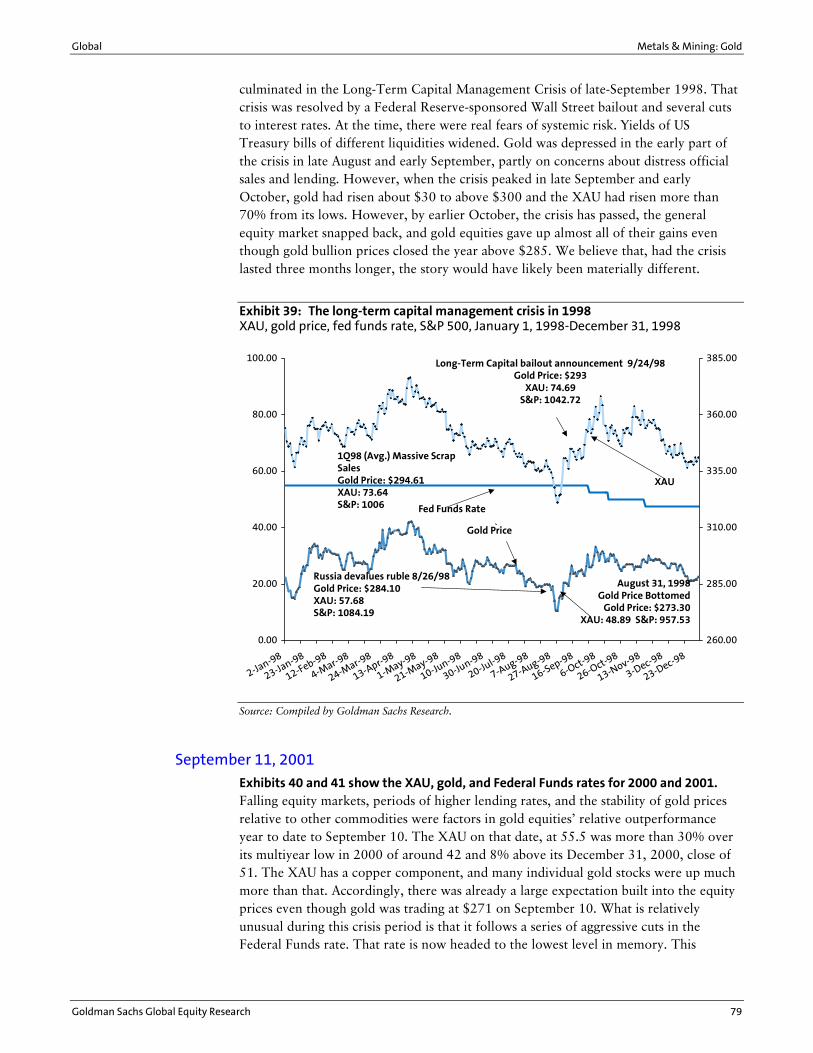
Global Metals & Mining: Gold
Goldman Sachs Global Equity Research 79
culminated in the Long-Term Capital Management Crisis of late-September 1998. That crisis was resolved by a Federal Reserve-sponsored Wall Street bailout and several cuts to interest rates. At the time, there were real fears of systemic risk. Yields of US Treasury bills of different liquidities widened. Gold was depressed in the early part of the crisis in late August and early September, partly on concerns about distress official sales and lending. However, when the crisis peaked in late September and early October, gold had risen about $30 to above $300 and the XAU had risen more than 70% from its lows. However, by earlier October, the crisis has passed, the general equity market snapped back, and gold equities gave up almost all of their gains even though gold bullion prices closed the year above $285. We believe that, had the crisis lasted three months longer, the story would have likely been materially different.
Exhibit 39: The long-term capital management crisis in 1998 XAU, gold price, fed funds rate, S&P 500, January 1, 1998-December 31, 1998
0.00
20.00
40.00
60.00
80.00
100.00
2-Jan-98
23-Jan-98
12-Feb-98
4-Mar-9
8
24-Mar-9
8
13-Apr-98
1-May-98
21-May-98
10-Jun-98
30-Jun-98
20-Jul-9
8
7-Aug-98
27-Aug-98
16-Sep-98
6-Oct-98
26-Oct-98
13-Nov-98
3-Dec-98
23-Dec-98
260.00
285.00
310.00
335.00
360.00
385.00
Fed Funds Rate
XAU
Gold Price`
Long-Term Capital bailout announcement 9/24/98Gold Price: $293
XAU: 74.69S&P: 1042.72
Russia devalues ruble 8/26/98Gold Price: $284.10XAU: 57.68S&P: 1084.19
1Q98 (Avg.) Massive Scrap SalesGold Price: $294.61XAU: 73.64S&P: 1006
August 31, 1998 Gold Price Bottomed
Gold Price: $273.30XAU: 48.89 S&P: 957.53
Source: Compiled by Goldman Sachs Research.
September 11, 2001
Exhibits 40 and 41 show the XAU, gold, and Federal Funds rates for 2000 and 2001. Falling equity markets, periods of higher lending rates, and the stability of gold prices relative to other commodities were factors in gold equities� relative outperformance year to date to September 10. The XAU on that date, at 55.5 was more than 30% over its multiyear low in 2000 of around 42 and 8% above its December 31, 2000, close of 51. The XAU has a copper component, and many individual gold stocks were up much more than that. Accordingly, there was already a large expectation built into the equity prices even though gold was trading at $271 on September 10. What is relatively unusual during this crisis period is that it follows a series of aggressive cuts in the Federal Funds rate. That rate is now headed to the lowest level in memory. This
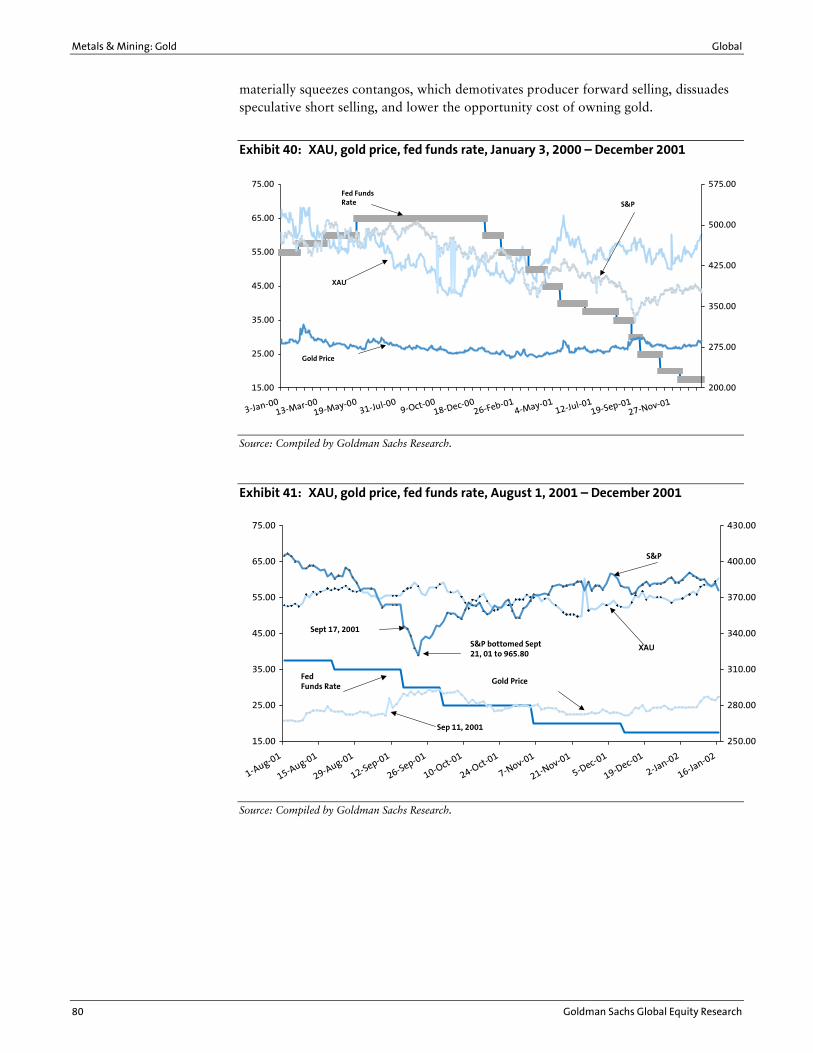
Metals & Mining: Gold Global
80 Goldman Sachs Global Equity Research
materially squeezes contangos, which demotivates producer forward selling, dissuades speculative short selling, and lower the opportunity cost of owning gold.
Exhibit 40: XAU, gold price, fed funds rate, January 3, 2000 � December 2001
15.00
25.00
35.00
45.00
55.00
65.00
75.00
3-Jan-0013-Mar-00
19-May-0031-Jul-00
9-Oct-0018-Dec-00
26-Feb-014-May-01
12-Jul-0119-Sep-01
27-Nov-01
200.00
275.00
350.00
425.00
500.00
575.00Fed Funds Rate
Gold Price
XAU
S&P
Source: Compiled by Goldman Sachs Research.
Exhibit 41: XAU, gold price, fed funds rate, August 1, 2001 � December 2001
15.00
25.00
35.00
45.00
55.00
65.00
75.00
1-Aug-01
15-Aug-01
29-Aug-01
12-Sep-01
26-Sep-01
10-Oct-01
24-Oct-01
7-Nov-01
21-Nov-01
5-Dec-01
19-Dec-01
2-Jan-02
16-Jan-02
250.00
280.00
310.00
340.00
370.00
400.00
430.00
FedFunds Rate
Gold Price
XAU
S&P
S&P bottomed Sept 21, 01 to 965.80
Sept 17, 2001
Sep 11, 2001
Source: Compiled by Goldman Sachs Research.
Global Metals & Mining: Gold
Goldman Sachs Global Equity Research 81
Appendix II: DCF is our preferred valuation method
Discounted cash flow valuation
We calculate DCFs using two different methods: the marked-to-market method and the hedge-realized method. DCF valuation is our preferred valuation tool because of the finite nature of gold company reserves and the capital intensity of the business. We believe the hedge-realized method more accurately estimates future cash returns. For Australian-based companies, our long-term Australian dollar/US dollar exchange rate assumption is 0.65, consistent with Goldman Sachs Economics Research 12-month forecasts. However, we include a valuation at 0.50, which is closer to the current spot exchange rate.
• The marked-to-market method combines the marked-to-market value of the hedge position at a given time with the DCF of the mines based on an assumed spot gold price (see Exhibit 7). This method is easy to apply because the companies regularly disclose the marked-to-market value of their hedge positions. Its advantage is that it makes conceptual sense when comparing hedged producers with non-hedged producers because non-hedgers could theoretically achieve the higher forward prices if they decided to hedge. It also provides, arguably, a reasonable picture of the breakup value of the company provided the hedge book is not large enough to move the market. However, for companies with large hedge books, this is not the case. The big disadvantage of the marked-to-market method is that it does not accurately discount expected future cash flows.
• The hedge-realized method calculates the DCF based on the assumption that the company will realize the prices embedded in its hedge position, and thus ignores the marked-to-market value. Hedge-realized valuations tend to be higher than marked-to-market valuations because they include higher forward prices. In Exhibit 8, we have highlighted those North American companies with significant hedge books whose hedge-realized valuations are consequently higher than their marked-to-market valuation.
Why do gold companies trade at a premium to their DCF value?
It is not uncommon for quality, large-cap, liquid North American gold producers to trade at a multiple of 2.0 or more times their DCF valuation (Exhibit 7). Even smaller gold producers trade at a premium. There are at least two reasons for this, in our view:
• Investors pay a premium for leverage to gold prices. Roughly speaking, in recent years a $1 rise in the gold price has translated into a 1% increase in gold equity prices. Western world investors anticipating an improvement in the gold price tend to buy the equities as opposed to the metal because of the relative ease of purchase (as compared with bullion) and the higher leverage to gold price changes.
• There are limited investment opportunities in the gold sector. The gold sector has a small market capitalization relative to the general market. Gold companies constitute less than 0.2% of the S&P 500 index by market capitalization compared with more than 6% for each of the two leaders, the drugs and computer software

Metals & Mining: Gold Global
82 Goldman Sachs Global Equity Research
sectors. Even comparatively small funds flow into the sector can therefore inflate valuations. Many investment funds managers are prohibited by their charters from buying commodities. Thus, for them, gold equities are often the only vehicle available to invest in gold.
It is debatable whether the logic for an erosion of this premium valuation is greater now than before. The industry has experienced a multi-year period of underperformance relative to the S&P500 index, and it generally lacks the ability to grow business organically given the prospect of declining reserve production and the near dearth of new projects that are robust at $300 gold prices. However, contrarians would argue that recent industry consolidation and a more concerted industry focus on gold marketing should lead to higher gold prices and higher profits. This would be supportive of maintaining this historical valuation premium.

Global Metals & Mining: Gold
Goldman Sachs Global Equity Research
Goldman, Sachs & Co. or an affiliate makes an over-the-counter market in Barrick Gold Corp. convertible preferreds; Compania de Minas Buenaventura (ADS) American Depositary Shares; Echo Bay Mines Ltd. convertible preferreds; Freeport-McMoRan Copper & Gold convertible debentures; Teck Cominco Ltd. (Toronto) convertible debentures. Goldman, Sachs & Co. or an affiliate has rendered significant corporate finance services to the following companies or one of its affiliates within the past 12 months: Echo Bay Mines Ltd., Freeport-McMoRan Copper & Gold, Newmont Mining Corp., and AngloGold Ltd. (ADR). Goldman, Sachs & Co. is associated with a specialist who makes a market in Newmont Mining Corp., Placer Dome Inc., Ashanti Goldfields Co. Ltd., and AngloGold Ltd. (ADR) securities and/or options; and at any given time, the associated specialist may have an inventory position, either "long" or "short", in the securities and/or options. As a result of the associated specialist's function as a market maker, such specialist may be on the opposite side of orders executed on the Floor of the Exchange in the securities and/or options. Goldman, Sachs & Co. or an affiliate may deal as principal in any of the securities mentioned.
Investment ratings Definitions
RL = Recommended List. Expected to provide price gains of at least 10 percentage points greater than the market over the next 6-18 months. LL = Latin America Recommended List. Expected to provide price gains at least 10 percentage points greater than the Latin America MSCI Index over the next 6-18 months. TB = Trading Buy. Expected to provide price gains of at least 20 percentage points sometime in the next 6-9 months. MO = Market Outperformer. Expected to provide price gains of at least 5-10 percentage points greater than the market over the next 6-18 months. MP = Market Performer. Expected to provide price gains similar to the market over the next 6-18 months. MU = Market Underperformer. Expected to provide price gains of at least 5 percentage points less than the market over the next 6-18 months.
Legal/policy ratings and other abbreviations Definitions
NR = Not Rated. The investment rating and target price, if any, have been suspended temporarily. Such suspension is in compliance with applicable regulation(s) and/or Goldman Sachs policies in circumstances when Goldman Sachs is acting in an advisory capacity in a merger or strategic transaction involving this company and in certain other circumstances. NC = Not Covered. This company is not covered by Goldman Sachs. CS = Coverage Suspended. Goldman Sachs has suspended coverage of this company. NA = Not Available. The information is not available for display. NM = Not Meaningful. The information is not meaningful and is therefore excluded. Copyright 2002 The Goldman Sachs Group, Inc. All rights reserved.
This report should not be construed as an offer to sell or the solicitation of an offer to buy any security in any jurisdiction where such an offer or solicitation would be illegal. We are not soliciting any action based on this material. This material is for the general information of clients of The Goldman Sachs Group, Inc. It does not take into account the particular investment objectives, financial situations, or needs of individual clients. Before acting on any advice or recommendation in this material, clients should consider whether it is suitable for their particular circumstances and, if necessary, seek professional advice. Certain transactions, including those involving futures, options, and high-yield securities, give rise to substantial risk and are not suitable for all investors. The material is based on information that we consider reliable, but we do not represent that it is accurate or complete, and it should not be relied on as such. Opinions expressed are our current opinions as of the date appearing on this material only. We endeavor to update on a reasonable basis the information discussed in this material, but regulatory, compliance, or other reasons may prevent us from doing so. We and our affiliates, officers, directors, and employees, including persons involved in the preparation or issuance of this material, may from time to time have "long" or "short" positions in, and buy or sell, the securities, or derivatives (including options) thereof, of companies mentioned herein. No part of this material may be (i) copied, photocopied, or duplicated in any form by any means or (ii) redistributed without The Goldman Sachs Group, Inc.'s prior written consent.
This material has been issued by The Goldman Sachs Group, Inc. and/or one of its affiliates and has been approved by Goldman Sachs International, which is regulated by The Financial Services Authority in connection with its distribution in the United Kingdom and by Goldman Sachs Canada in connection with its distribution in Canada. This material is distributed in the United States by Goldman, Sachs & Co., in Hong Kong by Goldman Sachs (Asia) L.L.C., in Korea by Goldman Sachs (Asia) L.L.C., Seoul Branch, in Japan by Goldman Sachs (Japan) Ltd., in Australia by Goldman Sachs Australia Pty Limited (ACN 092 589 770), and in Singapore by Goldman Sachs (Singapore) Pte. This material is not for distribution in the United Kingdom to private customers, as that term is defined under the rules of The Financial Services Authority; and any investments, including any convertible bonds or derivatives, mentioned in this material will not be made available by us to any such private customer. Goldman Sachs International and its non-US affiliates may, to the extent permitted under applicable law, have acted on or used this research, to the extent that it relates to non-US issuers, prior to or immediately following its publication. Foreign-currency-denominated securities are subject to fluctuations in exchange rates that could have an adverse effect on the value or price of, or income derived from, the investment. In addition, investors in securities such as ADRs, the values of which are influenced by foreign currencies, effectively assume currency risk.
Further information on any of the securities mentioned in this material may be obtained upon request, and for this purpose persons in Italy should contact Goldman Sachs S.I.M. S.p.A. in Milan, or at its London branch office at 133 Fleet Street, persons in Hong Kong should contact Goldman Sachs (Asia) L.L.C. at 2 Queen's Road Central, and persons in Australia should contact Goldman Sachs Australia Pty Limited. Unless governing law permits otherwise, you must contact a Goldman Sachs entity in your home jurisdiction if you want to use our services in effecting a transaction in the securities mentioned in this material.
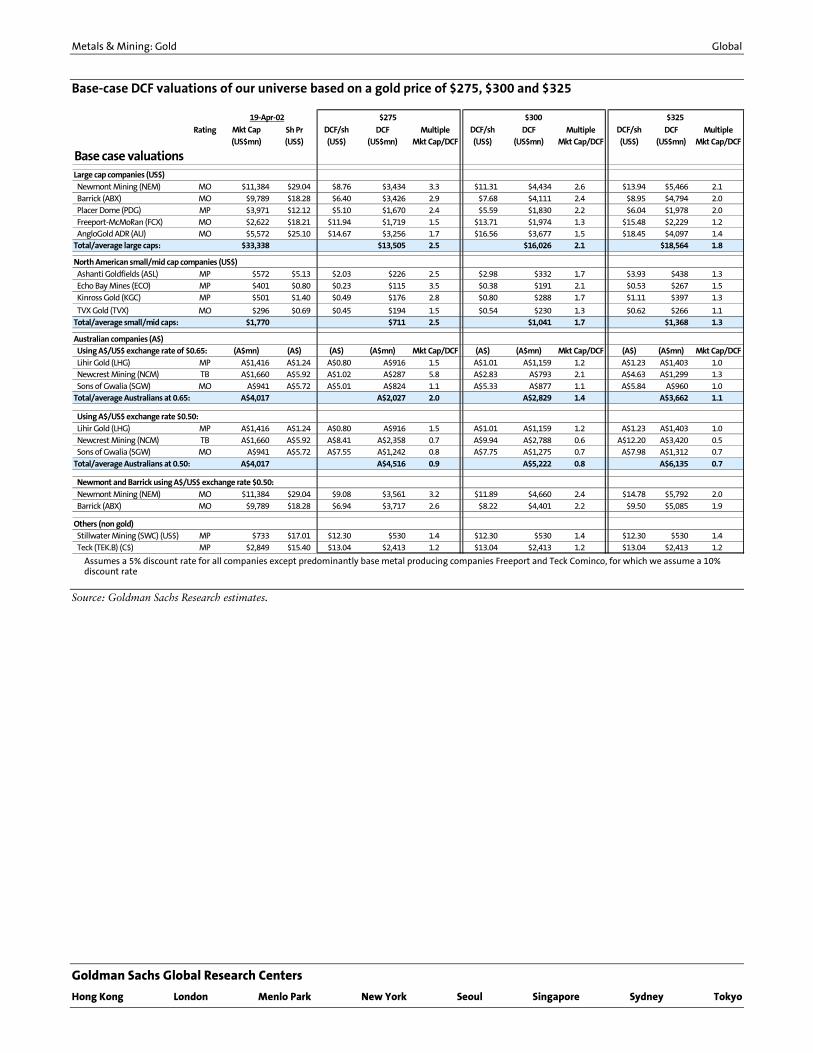
Metals & Mining: Gold Global
Goldman Sachs Global Research Centers
Hong Kong London Menlo Park New York Seoul Singapore Sydney Tokyo
Base-case DCF valuations of our universe based on a gold price of $275, $300 and $325
Rating Mkt Cap Sh Pr DCF/sh DCF Multiple DCF/sh DCF Multiple DCF/sh DCF Multiple(US$mn) (US$) (US$) (US$mn) Mkt Cap/DCF (US$) (US$mn) Mkt Cap/DCF (US$) (US$mn) Mkt Cap/DCF
Base case valuationsLarge cap companies (US$)
Newmont Mining (NEM) MO $11,384 $29.04 $8.76 $3,434 3.3 $11.31 $4,434 2.6 $13.94 $5,466 2.1 Barrick (ABX) MO $9,789 $18.28 $6.40 $3,426 2.9 $7.68 $4,111 2.4 $8.95 $4,794 2.0 Placer Dome (PDG) MP $3,971 $12.12 $5.10 $1,670 2.4 $5.59 $1,830 2.2 $6.04 $1,978 2.0 Freeport-McMoRan (FCX) MO $2,622 $18.21 $11.94 $1,719 1.5 $13.71 $1,974 1.3 $15.48 $2,229 1.2 AngloGold ADR (AU) MO $5,572 $25.10 $14.67 $3,256 1.7 $16.56 $3,677 1.5 $18.45 $4,097 1.4Total/average large caps: $33,338 $13,505 2.5 $16,026 2.1 $18,564 1.8
North American small/mid cap companies (US$)
Ashanti Goldfields (ASL) MP $572 $5.13 $2.03 $226 2.5 $2.98 $332 1.7 $3.93 $438 1.3 Echo Bay Mines (ECO) MP $401 $0.80 $0.23 $115 3.5 $0.38 $191 2.1 $0.53 $267 1.5 Kinross Gold (KGC) MP $501 $1.40 $0.49 $176 2.8 $0.80 $288 1.7 $1.11 $397 1.3
TVX Gold (TVX) MO $296 $0.69 $0.45 $194 1.5 $0.54 $230 1.3 $0.62 $266 1.1Total/average small/mid caps: $1,770 $711 2.5 $1,041 1.7 $1,368 1.3
Australian companies (A$) Using A$/US$ exchange rate of $0.65: (A$mn) (A$) (A$) (A$mn) Mkt Cap/DCF (A$) (A$mn) Mkt Cap/DCF (A$) (A$mn) Mkt Cap/DCF
Lihir Gold (LHG) MP A$1,416 A$1.24 A$0.80 A$916 1.5 A$1.01 A$1,159 1.2 A$1.23 A$1,403 1.0 Newcrest Mining (NCM) TB A$1,660 A$5.92 A$1.02 A$287 5.8 A$2.83 A$793 2.1 A$4.63 A$1,299 1.3 Sons of Gwalia (SGW) MO A$941 A$5.72 A$5.01 A$824 1.1 A$5.33 A$877 1.1 A$5.84 A$960 1.0Total/average Australians at 0.65: A$4,017 A$2,027 2.0 A$2,829 1.4 A$3,662 1.1
Using A$/US$ exchange rate $0.50:
Lihir Gold (LHG) MP A$1,416 A$1.24 A$0.80 A$916 1.5 A$1.01 A$1,159 1.2 A$1.23 A$1,403 1.0 Newcrest Mining (NCM) TB A$1,660 A$5.92 A$8.41 A$2,358 0.7 A$9.94 A$2,788 0.6 A$12.20 A$3,420 0.5 Sons of Gwalia (SGW) MO A$941 A$5.72 A$7.55 A$1,242 0.8 A$7.75 A$1,275 0.7 A$7.98 A$1,312 0.7Total/average Australians at 0.50: A$4,017 A$4,516 0.9 A$5,222 0.8 A$6,135 0.7
Newmont and Barrick using A$/US$ exchange rate $0.50:
Newmont Mining (NEM) MO $11,384 $29.04 $9.08 $3,561 3.2 $11.89 $4,660 2.4 $14.78 $5,792 2.0 Barrick (ABX) MO $9,789 $18.28 $6.94 $3,717 2.6 $8.22 $4,401 2.2 $9.50 $5,085 1.9
Others (non gold) Stillwater Mining (SWC) (US$) MP $733 $17.01 $12.30 $530 1.4 $12.30 $530 1.4 $12.30 $530 1.4 Teck (TEK.B) (C$) MP $2,849 $15.40 $13.04 $2,413 1.2 $13.04 $2,413 1.2 $13.04 $2,413 1.2
19-Apr-02 $300 $325$275
Assumes a 5% discount rate for all companies except predominantly base metal producing companies Freeport and Teck Cominco, for which we assume a 10% discount rate
Source: Goldman Sachs Research estimates.
Related Documents