CEPA Metal Loss Inline Inspection Tool Validation Guidance Document, 1st Edition, Nov. 2014 © 2014 Canadian Energy Pipeline Association Page 1 of 69 aboutpipelines.com Metal Loss Inline Inspection Tool Validation Guidance Document, 1st Edition January2016

Welcome message from author
This document is posted to help you gain knowledge. Please leave a comment to let me know what you think about it! Share it to your friends and learn new things together.
Transcript

CEPA Metal Loss Inline Inspection Tool Validation Guidance Document, 1st Edition, Nov. 2014 © 2014 Canadian Energy Pipeline Association Page 1 of 69
aboutpipelines.com
Metal Loss Inline
Inspection Tool
Validation Guidance
Document, 1st Edition January2016

CEPA Metal Loss Inline Inspection Tool Validation Guidance Document, 1st Edition, Nov. 2014 © 2014 Canadian Energy Pipeline Association Page 2 of 69
Aboutpipelines.com
Notice of Copyright
Copyright ©2014 Canadian Energy Pipeline Association (CEPA). All rights reserved.
Canadian Energy Pipeline Association and the CEPA logo are trademarks and/or registered
trademarks of Canadian Energy Pipeline Association. The trademarks or service marks of all
other products or services mentioned in this document are identified respectively.
Disclaimer of Liability
The Canadian Energy Pipeline Association (CEPA) is a voluntary, non-profit industry
association representing major Canadian transmission pipeline companies. The Metal Loss
Inline Inspection Tool Validation Guidance Document (hereafter referred to as the
“Guidelines”) was prepared to provide common guidelines to enhance industry best practice
and performance.
Use of the Guidelines described herein is wholly voluntary. The Guidelines described are not to
be considered industry standards and no representation as such is made. It is the responsibility
of each pipeline company, or other user of these Guidelines, to implement practices to ensure
the safe operation of assets.
While reasonable efforts have been made by CEPA to assure the accuracy and reliability of the
information contained in these Guidelines, CEPA makes no warranty, representation or
guarantee, express or implied, in conjunction with the publication of these Guidelines as to the
accuracy or reliability of these Guidelines. CEPA expressly disclaims any liability or
responsibility, whether in contract, tort or otherwise and whether based on negligence or
otherwise, for loss or damage of any kind, whether direct or consequential, resulting from the
use of these Guidelines. These Guidelines are set out for informational purposes only.
References to trade names or specific commercial products, commodities, services or
equipment constitutes neither an endorsement nor censure by CEPA of any specific product,
commodity, service or equipment.
The CEPA Metal Loss Inline Inspection Tool Validation Guidelines are intended to be
considered as a whole, and users are cautioned to avoid the use of individual chapters without
regard for the entire Guidelines.
Suite 200, 505-3rd St. SW
Calgary, Alberta T2P 3E6
Tel: 403.221.8777
Fax: 403.221.8760

CEPA Metal Loss Inline Inspection Tool Validation Guidance Document, 1st Edition, Nov. 2014 © 2014 Canadian Energy Pipeline Association Page 3 of 69
Aboutpipelines.com
Table of Contents
Table of Contents .................................................................................................... 3 List of Tables .......................................................................................................... 5 List of Figures ......................................................................................................... 6 1. Introduction .................................................................................................... 7
1.1. Definition of Terms .................................................................................... 7 1.2. Revisions to this Guidance Document ........................................................... 7 1.3. Background and Philosophy ........................................................................ 8 1.4. Harmonization with Other Industry Documents ............................................. 8
2. Scope............................................................................................................. 8 2.1. Practically Assessing ILI Performance ........................................................... 9
3. ILI Acceptance Overview .................................................................................. 9 3.1. Process Overview ...................................................................................... 9 3.2. Components ............................................................................................10
4. Overall Process ...............................................................................................10 4.1. Process Description ...................................................................................10 4.2. Process Flowchart .....................................................................................11
5. Process Verification .........................................................................................14 5.1. Process Overview .....................................................................................14 5.2. (Pre-Run) Tool Selection ............................................................................15 5.3. Inspection System ....................................................................................16 5.4. (Pre-Run) Planning and Preparation ............................................................18 5.5. (Pre-Run) Function Checks ........................................................................20 5.6. (Pre-Run) Mechanical Checks .....................................................................21 5.7. (In the Pipe) Procedure Execution ...............................................................23 5.8. (Post-Run) Mechanical Check .....................................................................24 5.9. (Post-Run) Function Check .........................................................................26 5.10. (Post-Run) Field Data Quality Check .........................................................28 5.11. (Post-Run) Data Analysis Process Check ...................................................29 5.12. (Post-Run) Cumulative Assessment ..........................................................31
6. Validation ......................................................................................................32 6.1. Known Pipeline Features ............................................................................32 6.2. Comparison with Previous ILI .....................................................................34 6.3. Validation from Excavation Data .................................................................36
A1. Scorecard and Guidance Document .....................................................................39 A1.1. Verification Examples .................................................................................50
A2. NACE Table ......................................................................................................53 A3. Matching ..........................................................................................................55
A3.1. Process overview .......................................................................................55 A3.2. Girth Weld Matching ...................................................................................55 A3.3. Matching of identified Anomalies ..................................................................55 A3.4. Calculating Anomaly Depth Change ..............................................................55
A4. Validation using a Previous ILI ............................................................................56 A4.1. Demonstration of Concept ...........................................................................56 A4.2. ILI Error ....................................................................................................57 A4.3. Comparison with Reference Measurements ....................................................58 A4.4. Acceptance Criteria ....................................................................................59
A5. Opportunities for Future Refinement....................................................................65
CEPA Metal Loss Inline Inspection Tool Validation Guidance Document, 1st Edition, Nov. 2014 © 2014 Canadian Energy Pipeline Association Page 4 of 69
Aboutpipelines.com
A5.1. Standardization of ILI Reporting...................................................................65 A5.2. Documentation of Procedures ......................................................................67 A5.3. Refinement of Scorecard .............................................................................67 A5.4. Technology Specific Verification ...................................................................67
A6. Scoring – Verification Process Scorecard Summary ...............................................69

CEPA Metal Loss Inline Inspection Tool Validation Guidance Document, 1st Edition, Nov. 2014 © 2014 Canadian Energy Pipeline Association Page 5 of 69
Aboutpipelines.com
List of Tables Table 1: Verification Procedure Scorecard Parameters as per API 1163 .........................14
Table 2: Pre-Run Tool Selection Scoring ....................................................................15
Table 3: Inspection System Data Check Scoring .........................................................17
Table 4: Pre-Run Planning Scoring ............................................................................18
Table 5: Pre-Run Function Check Scoring ..................................................................20
Table 6: Pre-Run Mechanical Check Scoring ...............................................................22
Table 7: Procedure Execution Scoring .......................................................................23
Table 8: Post-Run Mechanical Check Scoring ..............................................................25
Table 9 Post-Run Function Check Scoring ..................................................................27
Table 10: Post-Run Field Data Check Scoring .............................................................28
Table 11: Post-Run Data Analysis Processes Scoring ...................................................30
Table 12: Post-Run Cumulative Assessment Scoring ...................................................31
Table 13: ILI Validation Parameters ..........................................................................35
Table 14: ILI Validation Parameters ..........................................................................37
Table 16: Guidance for Parameter #1 Pre-Run Tool Selection .......................................39
Table 17: Guidance for Parameter #2 Pre-Run Inspection System Data .........................40
Table 18: Guidance for Parameter #3 Pre-Run Planning ..............................................41
Table 19: Guidance for Parameter #4 Pre-Run Function Checks ...................................42
Table 20: Guidance for Parameter #5 Pre-Run Mechanical Checks ................................43
Table 21 Guidance for Parameter #6 in the pipe Procedure Execution ...........................44
Table 22: Guidance for Parameter #7 Post-Run Mechanical Checks ...............................45
Table 23: Guidance for Parameter #8 Post-Run Function Check ...................................46
Table 24: Guidance for Parameter #9 Post-Run Field Data Check .................................47
Table 25: Guidance for Parameter #10 Post-Run Data Analysis Processes and Quality
Checks ..................................................................................................................48
Table 26: Guidance for Parameter #11 Post-Run Cumulative Assessment ......................49
Table 27: Completed Scorecard Example 1 ................................................................50
Table 28: Completed Scorecard Example 2 ................................................................51
Table 29: Considerations when Dealing with Systematic Bias .......................................60
Table 30: Small Population Case Samples ..................................................................63
Table 31: Key Items to Consider for Future Refinement ...............................................65
Table 32: Summary of Data Provided for Scorecard ....................................................66

CEPA Metal Loss Inline Inspection Tool Validation Guidance Document, 1st Edition, Nov. 2014 © 2014 Canadian Energy Pipeline Association Page 6 of 69
Aboutpipelines.com
Table 33: Verification Process Scorecard Summary .....................................................70
List of Figures Figure 1: Overall Process .........................................................................................11
Figure 2: Verification Check-Point Flowchart ..............................................................12
Figure 3: Validation Procedure .................................................................................13
............................................................................................................................39
Figure 4: Table 1 from NACE SP 102-2010 giving Guidance on Tool Selection for ILI .......54
Figure 5: Illustration of the Validation Process ............................................................56
Figure6: Random Error and Bias Component Contribute to the Error of any ILI
Measurement .........................................................................................................58
CEPA Metal Loss Inline Inspection Tool Validation Guidance Document, 1st Edition, Nov. 2014 © 2014 Canadian Energy Pipeline Association Page 7 of 69
Aboutpipelines.com
1. Introduction The intent of this Guidance Document is to supplement key industry standards such as
API 1163 and industry best practices by providing a methodology to assist CEPA
members with a cost-effective method for validating the results from inline
inspections. In particular, this document is meant to enable an operator to establish a
process to identify if validation excavations are required and assess the value of those
excavations versus employing alternative verification or validation processes to accept
an ILI run that has no actionable anomalies.
This Guidance Document outlines the procedure for the acceptance of an ILI run based
on a Verification and Validation of the run. This Guidance Document shifts the
emphasis of ILI validation from field validation to verification that planning,
preparation, execution, and analysis of the ILI run were correctly done using well-
vetted, industry recognized procedures. The shift to process verification is expected to
provide greater confidence in the resulting ILI run.
Note: This Guidance Document outlines a suggested approach for verification and
validating of the run. Other approaches may be taken at the discretion of the pipeline
operator if other processes are more practical, provided the sections of this document are
followed. In essence, there may be internal practices already in place for a member
company, which are consistent with this document and other existing industry documents
(i.e. NACE SP0102-2010 and API 1163).
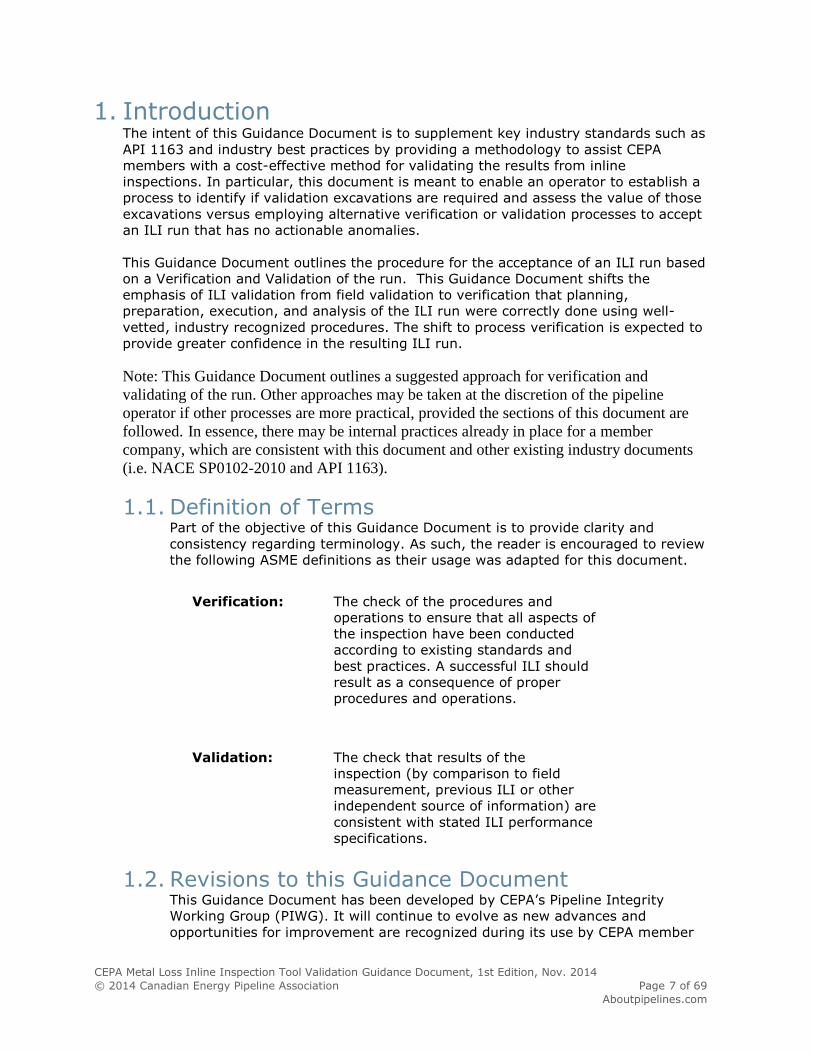
1.1. Definition of Terms Part of the objective of this Guidance Document is to provide clarity and
consistency regarding terminology. As such, the reader is encouraged to review
the following ASME definitions as their usage was adapted for this document.
1.2. Revisions to this Guidance Document This Guidance Document has been developed by CEPA’s Pipeline Integrity
Working Group (PIWG). It will continue to evolve as new advances and
opportunities for improvement are recognized during its use by CEPA member
Verification: The check of the procedures and
operations to ensure that all aspects of
the inspection have been conducted
according to existing standards and
best practices. A successful ILI should
result as a consequence of proper
procedures and operations.
Validation: The check that results of the
inspection (by comparison to field
measurement, previous ILI or other
independent source of information) are
consistent with stated ILI performance
specifications.

CEPA Metal Loss Inline Inspection Tool Validation Guidance Document, 1st Edition, Nov. 2014 © 2014 Canadian Energy Pipeline Association Page 8 of 69
Aboutpipelines.com
companies and from periodic reviews as deemed necessary by CEPA and/or the
PIWG.
1.3. Background and Philosophy The current (2014) regulatory environment in the US and Canada has lead
CEPA to explore the development of a Guidance Document for ILI Tool
Validation. CEPA members seek an alternative to excavations to validate the
results of an ILI run, as in many situations, excavating a limited number of
shallow anomalies is unlikely to yield any real insight into the performance of
the ILI tool.
This Guidance Document provides an alternative to excavations to validate the
results of an ILI run. The procedure in this Guidance Document will assure the
operator and stakeholders of the high quality of the inspection.
There are a number of key benefits of developing a Guidance Document that is
specific to relatively un-corroded lines. Specifically, operators would have
access to a methodology that would allow them to assess and use the results of
in-line inspection more cost effectively. Also, perhaps most importantly, a
consensus-based Guidance Document released by CEPA would provide a
common foundation for discussions with various jurisdictional authorities as
well as in-line inspection tool vendors.
1.4. Harmonization with Other Industry Documents A number of well-vetted industry documents in the area of ILI acceptance
already exist. To the extent possible, this Guidance Document was designed to
remain consistent with, and leverage to the extent possible, any pre-existing
material. The main documents that were referenced in this way are:
NACE Recommended Practice, SP0102-2010 (formerly RP0102)
NACE 35100, Inline Nondestructive Inspection of Pipelines (December
2000)
API Standard, 1163 (Second Edition – April 2013)
2. Scope The purpose of this Guidance Document is to assist the operator in evaluating the
quality of an ILI run and deciding whether the run should be accepted or rejected.
Previously, the acceptance of an ILI run had been based primarily on a Validation
process where the results of the inspection are compared to the results of NDT
measurements in the field. At best, the comparison can only show that the ILI run is
consistent or inconsistent with results collected in the field. The procedure does not
prove that the ILI meets its performance specification, however, the ILI run is
accepted unless evidence to the contrary is found. If the field results are inconsistent
with the ILI performance specification, then the ILI run would be rejected and a rerun
would be required.
This Guidance Document expands the acceptance procedure to include both
Verification and Validation processes.
CEPA Metal Loss Inline Inspection Tool Validation Guidance Document, 1st Edition, Nov. 2014 © 2014 Canadian Energy Pipeline Association Page 9 of 69
Aboutpipelines.com
The Verification process examines all the aspects of tool selection, run preparation,
running of the tool, and analysis of the results to ensure that the procedures followed
should lead to a successful run. Lacking evidence to the contrary, the ILI run is
accepted.
The Validation procedure is similar to the previous acceptance procedure; however,
this Guidance Document relieves the requirement to excavate in some situations. In
these situations, the Validation procedure is believed to more than compensate for not
excavating the pipeline and should improve the confidence in the quality of the ILI
data.
As such, an overall process has been developed for the Verification and Validation of
ILI runs, consistent with existing industry documents (i.e., NACE SP0102-2010 and
API 1163).
2.1. Practically Assessing ILI Performance At best, excavations provide a limited number of comparisons at a few isolated
locations along the pipeline. Furthermore, the cost of obtaining these
comparisons can be prohibitive.
In this Guidance Document it is assumed that the purpose of an ILI run is to
address one or more threats to the integrity of a specific pipeline. Acceptance
of a run means that the operator accepts that the ILI run can be used to
adequately assess the threat(s). If the inspection is rejected, then the threats
to the pipeline (or portions of it) are not adequately addressed by the
inspection. In some cases, rejection of an inspection may require rerunning the
inspection, but in other cases, the threat can be addressed by other means.
In practice, inspection results usually enable the operator to assess risk on most
of a pipeline, but there are often localized areas where the data has been
compromised in some way and the inspection data is less than optimal for the
assessment of risk. At these locations, if the risk due to the threat is great, then
the threat would need to be addressed by some other method.
The procedure developed depends in large part on documentation of the ILI
inspection process. In this way, the acceptance of the ILI data can be conducted
by persons independent of those who were involved in the inspection.
3. ILI Acceptance Overview
3.1. Process Overview This Guidance Document was developed to supplement API 1163 and industry
best practice, with the overall goal to quantify the value of excavations and
have a rigorous approach to ILI acceptance. The definition of an overall ILI
Verification and Validation process was considered critical in the development
of this Guidance Document. As such, the flowchart in Section 4.2 provides a
systematic and consistent process for the Verification and Validation of an ILI
inspection, based on the available information.
CEPA Metal Loss Inline Inspection Tool Validation Guidance Document, 1st Edition, Nov. 2014 © 2014 Canadian Energy Pipeline Association Page 10 of 69
Aboutpipelines.com
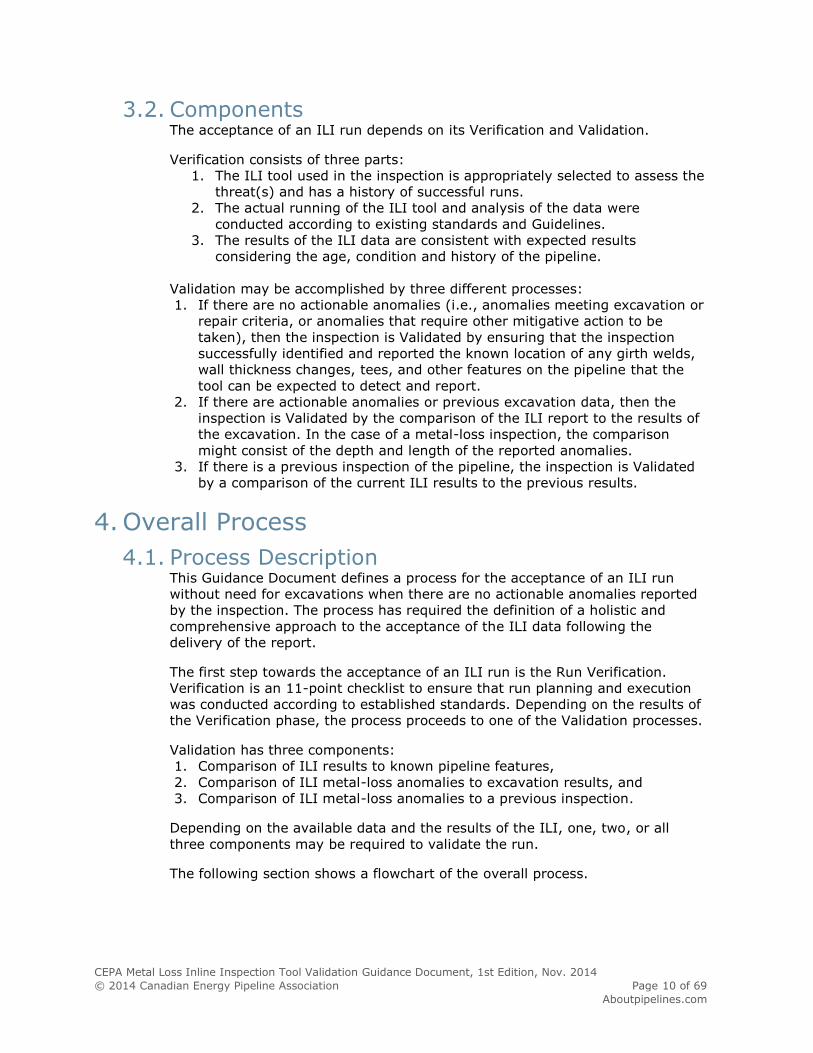
3.2. Components The acceptance of an ILI run depends on its Verification and Validation.
Verification consists of three parts:
1. The ILI tool used in the inspection is appropriately selected to assess the
threat(s) and has a history of successful runs.
2. The actual running of the ILI tool and analysis of the data were
conducted according to existing standards and Guidelines.
3. The results of the ILI data are consistent with expected results
considering the age, condition and history of the pipeline.
Validation may be accomplished by three different processes:
1. If there are no actionable anomalies (i.e., anomalies meeting excavation or
repair criteria, or anomalies that require other mitigative action to be
taken), then the inspection is Validated by ensuring that the inspection
successfully identified and reported the known location of any girth welds,
wall thickness changes, tees, and other features on the pipeline that the
tool can be expected to detect and report.
2. If there are actionable anomalies or previous excavation data, then the
inspection is Validated by the comparison of the ILI report to the results of
the excavation. In the case of a metal-loss inspection, the comparison
might consist of the depth and length of the reported anomalies.
3. If there is a previous inspection of the pipeline, the inspection is Validated
by a comparison of the current ILI results to the previous results.
4. Overall Process
4.1. Process Description This Guidance Document defines a process for the acceptance of an ILI run
without need for excavations when there are no actionable anomalies reported
by the inspection. The process has required the definition of a holistic and
comprehensive approach to the acceptance of the ILI data following the
delivery of the report.
The first step towards the acceptance of an ILI run is the Run Verification.
Verification is an 11-point checklist to ensure that run planning and execution
was conducted according to established standards. Depending on the results of
the Verification phase, the process proceeds to one of the Validation processes.
Validation has three components:
1. Comparison of ILI results to known pipeline features,
2. Comparison of ILI metal-loss anomalies to excavation results, and
3. Comparison of ILI metal-loss anomalies to a previous inspection.
Depending on the available data and the results of the ILI, one, two, or all
three components may be required to validate the run.
The following section shows a flowchart of the overall process.

CEPA Metal Loss Inline Inspection Tool Validation Guidance Document, 1st Edition, Nov. 2014 © 2014 Canadian Energy Pipeline Association Page 11 of 69
Aboutpipelines.com
4.2. Process Flowchart Figure 1 shows the top-level flowchart of the overall process. As discussed
above, the process consists of two steps: Verification and Validation. If the run
fails either the Verification or the Validation, then the run cannot be accepted
to address the threat in question.
Figure 1: Overall Process
4.2.1. Verification Process verification consists of an 11-point check in two parts: part
one is a 10-point check regarding various aspects of the tool then in
part two the final check is a Cumulative Assessment. The checks are:
1. Tool Selection,
2. Historical performance of the inspection system,
3. Planning,
4. Pre-run Function Check,
5. Pre-run Mechanical Check,
6. Procedure execution (e.g., pigging procedure, tool speed, etc.),
7. Post-run Mechanical Check,
8. Post-run Function Check,
9. Field Data Quality Check, and
10. Data analysis processes: quality checks.
The final check is the cumulative assessment.
11. Cumulative Assessment
CEPA Metal Loss Inline Inspection Tool Validation Guidance Document, 1st Edition, Nov. 2014 © 2014 Canadian Energy Pipeline Association Page 12 of 69
Aboutpipelines.com
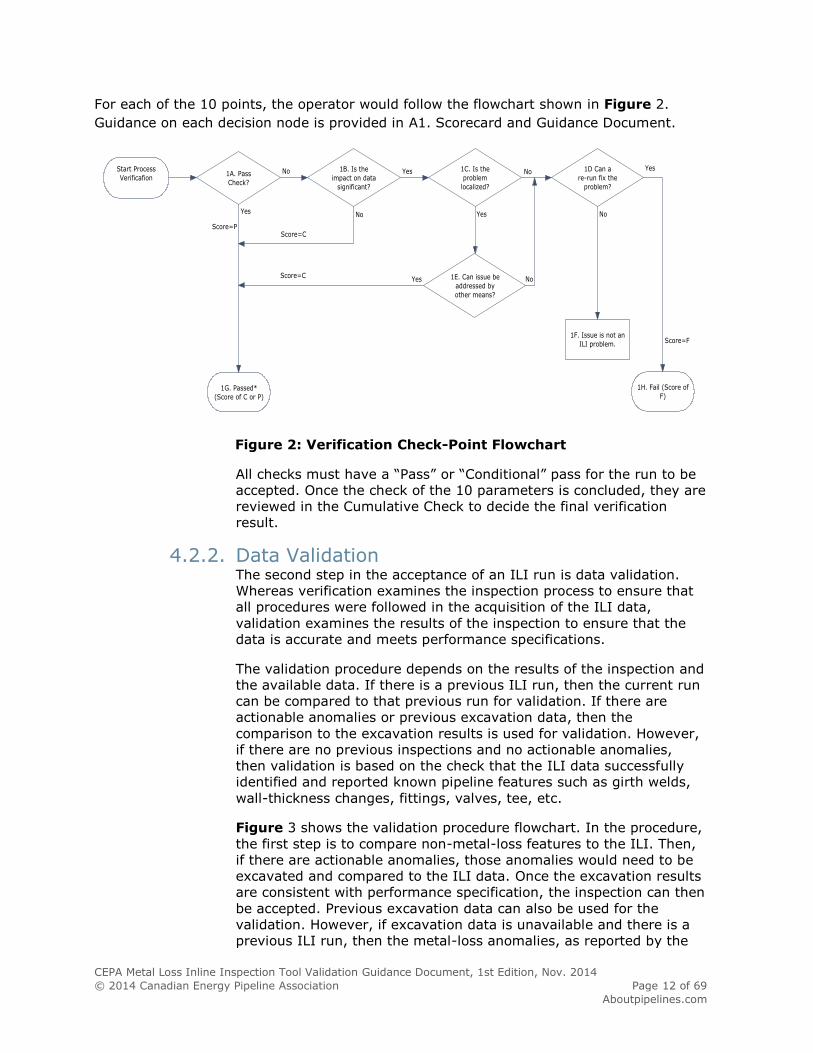
For each of the 10 points, the operator would follow the flowchart shown in Figure 2.
Guidance on each decision node is provided in A1. Scorecard and Guidance Document.
Figure 2: Verification Check-Point Flowchart
All checks must have a “Pass” or “Conditional” pass for the run to be
accepted. Once the check of the 10 parameters is concluded, they are
reviewed in the Cumulative Check to decide the final verification
result.
4.2.2. Data Validation The second step in the acceptance of an ILI run is data validation.
Whereas verification examines the inspection process to ensure that
all procedures were followed in the acquisition of the ILI data,
validation examines the results of the inspection to ensure that the
data is accurate and meets performance specifications.
The validation procedure depends on the results of the inspection and
the available data. If there is a previous ILI run, then the current run
can be compared to that previous run for validation. If there are
actionable anomalies or previous excavation data, then the
comparison to the excavation results is used for validation. However,
if there are no previous inspections and no actionable anomalies,
then validation is based on the check that the ILI data successfully
identified and reported known pipeline features such as girth welds,
wall-thickness changes, fittings, valves, tee, etc.
Figure 3 shows the validation procedure flowchart. In the procedure,
the first step is to compare non-metal-loss features to the ILI. Then,
if there are actionable anomalies, those anomalies would need to be
excavated and compared to the ILI data. Once the excavation results
are consistent with performance specification, the inspection can then
be accepted. Previous excavation data can also be used for the
validation. However, if excavation data is unavailable and there is a
previous ILI run, then the metal-loss anomalies, as reported by the

CEPA Metal Loss Inline Inspection Tool Validation Guidance Document, 1st Edition, Nov. 2014 © 2014 Canadian Energy Pipeline Association Page 13 of 69
Aboutpipelines.com
previous ILI, must be matched and compared to the current ILI to
validate the inspection.
StartValidation
Match known Pipeline feature to
ILI
Pipeline features matching successful
YES
Are there actionable anomalies
YES
Reject ILI run
Is there a previous ILI run on the
line?
No
Excavate anomalies and compare to ILI results
Yes
Are excavation results consistent with performance
Specification?
Compare ILI resultsYes
Are the previous ILI results consistent with performance
specificaiton?
Accept ILI run
YES
Yes NO
No
No
Figure 3: Validation Procedure

CEPA Metal Loss Inline Inspection Tool Validation Guidance Document, 1st Edition, Nov. 2014 © 2014 Canadian Energy Pipeline Association Page 14 of 69
aboutpipelines.com
5. Process Verification
5.1. Process Overview
Process verification is a systematic and consistent approach to ensure that all
proper procedures were undertaken by the operator and ILI vendor prior to,
during, and after the inspection. The fundamental premise of the methodology is
that high-quality ILI data is a consequence of technology, planning, and
execution. The verification process checks ten parameters. Once these ten
parameters have been assessed, a cumulative assessment of all parameters (and
potential deficiencies) is then reviewed cohesively to ensure that results are still
deemed to be tolerable. The ten parameters are shown in Table 1.
Table 1: Verification Procedure Scorecard Parameters as per API 1163 Item Stage API category API Ref Parameter
1 Pre-run In-Line System Selection
5.4 Tool Selection
2 Pre-run System Results Validation
8.2.2 Inspection System Data (other lines)
3 Pre-run In-Line System Selection
5.3, 7.2 Planning
4 Pre-run System Operational Verification
7.3.2 Function Checks
5 Pre-run System Operational Verification
7.3.3 Mechanical Checks
6 In the pipe System Operational Verification
7.4 Procedure Execution (e.g., pigging procedure, tool speed, etc.)
7 Post-run System Operational Verification
7.5.2 Mechanical Checks
8 Post-run System Operational Verification
7.5.2 Function Check
9 Post-run System Operational Verification
7.5.3 Field Data Quality Check
10 Post-run System Results Validation
8.2.2 & Annex C1
Data Analysis Processes: Quality Checks
For each of these checks, the flowchart in Figure 2 is followed to assign a score to
each item. A score “P” or “Pass” indicates that the proper procedure was followed.
“C” or “Conditional pass” indicates that some irregularities were found in the
procedure, but that the effect on the data is not significant or that additional
actions may be required to ensure the conditional pass is resolved or can be
confirmed to be a pass. For example, in an area where the ILI experienced an
overspeed, the operator may use a different specification to assess the
uncertainty of the features in that particular area. Finally, “F” or “Fail” indicates
that the data is compromised in some way such that the run cannot be accepted.
The final Cumulative Check is a review of all the Conditional Passes to ensure that
the overall effect on the data is acceptable.

CEPA Metal Loss Inline Inspection Tool Validation Guidance Document, 1st Edition, Nov. 2014 © 2014 Canadian Energy Pipeline Association Page 15 of 69
Aboutpipelines.com
The following sections discuss each of these parameters in turn. Specifically,
description of the parameter, motivation of the item, scoring, assessing the
significance of the data impact and potential mitigation options are discussed in
detail. An abridged version of the information is available in the actual scorecard
and guidance document in A1. Scorecard and Guidance Document.
5.2. (Pre-Run) Tool Selection
5.2.1. Parameter Description Given the wide array of tools currently available from a number
of different ILI vendors, this check ensures that an appropriate
tool has been selected in light of the expected defect type(s) on
the pipeline. The primary guidance appears in NACE SP 0102
Table 1; see also A2. NACE Table.
In addition to the NACE guidance, the operator must understand
the capabilities and limitations of the specific tool selected for the
inspection and ensure that the goals of the inspection will be
satisfied.
5.2.2. Motivation The purpose of this check is to ensure that the inspection tool is
capable of assessing the specific threat on the pipeline. An
appropriate inspection tool needs to be selected that can detect
the threats present. During the selection process, the operator
and vendors shall consider the tool’s resolution range (standard
vs. high resolution). The operator shall review the tool’s
performance specifications to verify that the tool is capable of
detecting and sizing the anomalies that are deemed a threat on
the pipeline. The vendor’s tool performance specification shall
contain sizing accuracy standards and confidence levels.
The inclusion of this item ensures that an inspection conducted to
address one threat is not also used to assess threats to which it
is not suited. (For example, an MFL tool may have been run to
assess corrosion, but it should not be used to assess potential
SCC.) Also, the inclusion of this item is required to make the
overall procedure objective. A person not previously involved in
the running of the inspection should verify that the tool is
adequate to the job.
5.2.3. Scoring Table 2: Pre-Run Tool Selection Scoring
Score Scoring Description
F Tool not capable of detection or sizing of expected anomaly type(s).
C Tool capable of detecting anomaly types but limited sizing or detection abilities of expected anomaly type(s).
P Best available technology for detecting and sizing expected anomaly type(s) identified and used.
Note: For a comprehensive Verification Process Scorecard Summary, please
refer to Table 33 in A.6.

CEPA Metal Loss Inline Inspection Tool Validation Guidance Document, 1st Edition, Nov. 2014 © 2014 Canadian Energy Pipeline Association Page 16 of 69
Aboutpipelines.com
The scoring of this parameter is expected to be relatively
straightforward. For example, the use of a transverse MFL tool
will identify general corrosion, but its sizing tolerances are
limited. Thus, if the dimensions of a potentially injurious defect
are beyond the performance specification of the transverse MFL
tool, then this parameter would be deemed a “Fail”.
It should be noted that the “Conditional” pass would be
contingent on the operator confirming that the dimensions of
critical defect size(s), for the pipeline in question, are greater
than the minimum detection and sizing thresholds of the tool.
“Pass” would be reported if high resolution MFL technology was
used to detect general pipeline corrosion. This is intended to
recognize that while MFL technology has some limitations, the
operator is using the best available tool to address corrosion
related pipeline integrity concerns.
5.2.4. Options for Dealing with Compromised Data Quality The impact to data, where the optimal technology is not used,
must be addressed on a case-by-case basis. The guiding principle
remains, as stated above: The operator must ensure that the
dimensions of an injurious defect, for the pipeline in question, are
greater than the minimum detection and sizing thresholds of the
tool.
Should a “Fail” score be appropriate for this parameter, the
options are somewhat limited in that some large-scale program
to prove the integrity of the pipeline must be undertaken. For
example, the operator must re-inspect the line with a more
appropriate tool suited to the specific threat or undertake an
alternative set of activities – such as hydrostatic testing, or direct
assessment.
If a “Conditional” score is given, then a record of the location(s)
(whether the location(s) are limited to specific segment(s) or the
whole pipeline) where the quality of the data may be affected
must be recorded and considered again for the Cumulative
Assessment.
5.3. Inspection System
5.3.1. Parameter Description This check ensures that the inspection tool used in the inspection
has a history of successful runs, and that the inspection system is
likely to perform successfully. An operator may decide to run a
untested technology in a pipeline from time to time, but that run
should not be used to assess the threat on the pipeline without
adequate validation. In addition, if the tool has not previously
conducted an inspection in the operator’s pipeline, but has been
CEPA Metal Loss Inline Inspection Tool Validation Guidance Document, 1st Edition, Nov. 2014 © 2014 Canadian Energy Pipeline Association Page 17 of 69
Aboutpipelines.com
tested by the vendor, the vendor shall supply relevant
documentation demonstrating successful performance testing.
5.3.2. Motivation Whereas the emphasis of the Tool Selection check is to ensure
that the technology is capable of detecting and sizing the
anomalies, the motivation of this check is to ensure that the
inspection system is able to deliver quality data as demonstrated
by its history of successful runs.
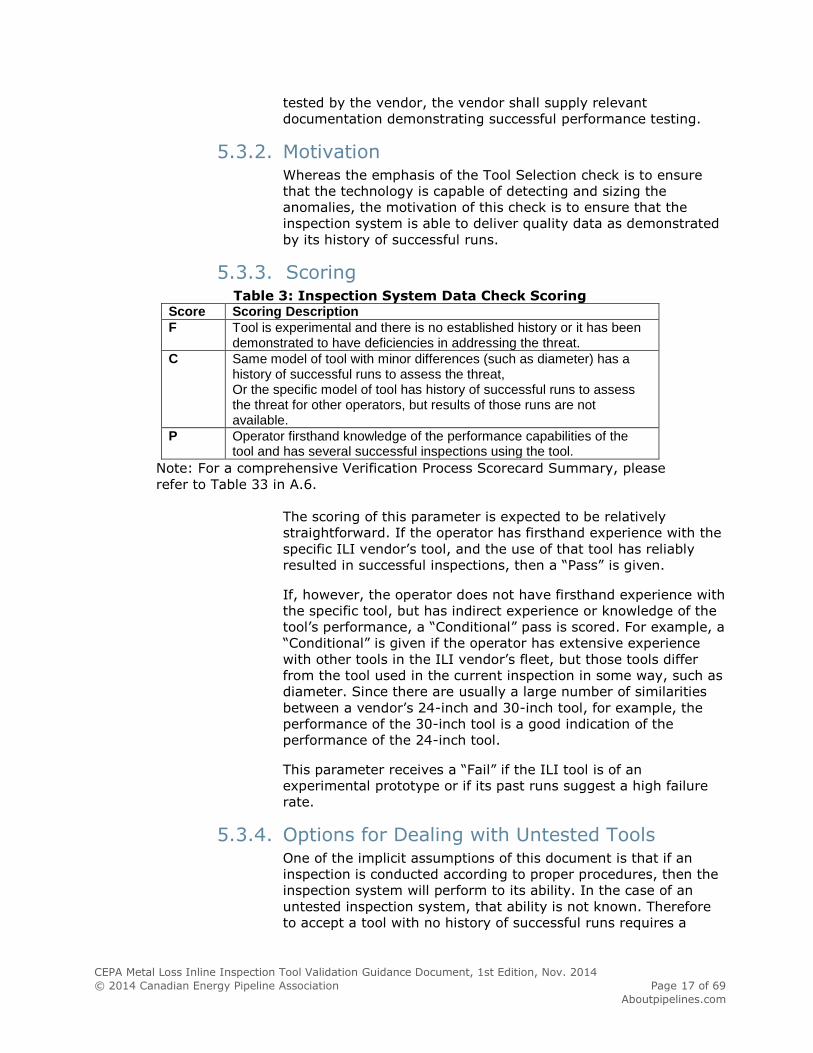
5.3.3. Scoring Table 3: Inspection System Data Check Scoring
Score Scoring Description
F Tool is experimental and there is no established history or it has been demonstrated to have deficiencies in addressing the threat.
C Same model of tool with minor differences (such as diameter) has a history of successful runs to assess the threat, Or the specific model of tool has history of successful runs to assess the threat for other operators, but results of those runs are not available.
P Operator firsthand knowledge of the performance capabilities of the tool and has several successful inspections using the tool.
Note: For a comprehensive Verification Process Scorecard Summary, please
refer to Table 33 in A.6.
The scoring of this parameter is expected to be relatively
straightforward. If the operator has firsthand experience with the
specific ILI vendor’s tool, and the use of that tool has reliably
resulted in successful inspections, then a “Pass” is given.
If, however, the operator does not have firsthand experience with
the specific tool, but has indirect experience or knowledge of the
tool’s performance, a “Conditional” pass is scored. For example, a
“Conditional” is given if the operator has extensive experience
with other tools in the ILI vendor’s fleet, but those tools differ
from the tool used in the current inspection in some way, such as
diameter. Since there are usually a large number of similarities
between a vendor’s 24-inch and 30-inch tool, for example, the
performance of the 30-inch tool is a good indication of the
performance of the 24-inch tool.
This parameter receives a “Fail” if the ILI tool is of an
experimental prototype or if its past runs suggest a high failure
rate.
5.3.4. Options for Dealing with Untested Tools One of the implicit assumptions of this document is that if an
inspection is conducted according to proper procedures, then the
inspection system will perform to its ability. In the case of an
untested inspection system, that ability is not known. Therefore
to accept a tool with no history of successful runs requires a

CEPA Metal Loss Inline Inspection Tool Validation Guidance Document, 1st Edition, Nov. 2014 © 2014 Canadian Energy Pipeline Association Page 18 of 69
Aboutpipelines.com
more rigorous validation process to ensure that the tool is
accurately reporting the severity of the anomalies.
If a “Conditional” score is given, then a record of the location(s)
(whether the location(s) are limited to specific segment(s) or the
whole pipeline) where the quality of the data may be affected
must be recorded and considered again for the Cumulative
Assessment.
5.4. (Pre-Run) Planning and Preparation
5.4.1. Parameter Description This parameter is a check of the group of activities prior to
executing an inline inspection. The user is referred to NACE
SP0102-2010 (Sections 4, 5, and 6) for details of the types of
activities that are typically undertaken as part of pre-run
planning. As part of the planning procedure, the ILI vendor and
operator should work together to ensure a successful run.
Planning should include, but be not limited to: completion of a
pre-run questionnaire supplied by the ILI vendor, pipeline
cleaning, pipeline geometry assessment, launch and receiver
Trap review, assessment of adequate battery life for inspection
tool (e.g. account for 20 – 30% contingency life longer than
estimated run time), development of an inspection procedure,
inspection scheduling, logistics as well as ensuring appropriate
product type, flows and pressures.
Some of these planning activities may be iterative, such as
logistics, inspection procedures and pipeline operating conditions;
therefore, the operator and vendor shall allow for sufficient time
to complete these activities prior to the launch of the inspection
tool.
5.4.2. Motivation The purpose of this item is to ensure that proper procedures were
followed prior to the running of the tool. In many cases, this
parameter may seem moot after the completion of and
apparently successful inspection. However, the success of an
inspection is dependent on planning and preparations prior to the
running of the tool. Ensuring, for example, that cleaning targets
were met prior to the inspection can avoid degradation of the
data quality. Thus proper planning can sometimes make the
difference between optimal inspection results and simply
adequate results.
5.4.3. Scoring Table 4: Pre-Run Planning Scoring
Score Scoring Description
F Key elements of Pipeline ILI Compatibility Assessment and Inspection planning not conducted.
C Majority of elements of Pipeline ILI Compatibility Assessment and

CEPA Metal Loss Inline Inspection Tool Validation Guidance Document, 1st Edition, Nov. 2014 © 2014 Canadian Energy Pipeline Association Page 19 of 69
Aboutpipelines.com
Inspection Scheduling completed but undocumented.
P Elements of Pipeline ILI Compatibility and Inspection Scheduling completed and documented.
Note: For a comprehensive Verification Process Scorecard Summary, please
refer to Table 33 in A.6.
The scoring of this parameter is expected to be highly specific to
each situation and somewhat subjective. That is, simple and
straightforward situations (e.g., MFL run in a dry sweet gas line)
for executing an inline inspection will require significantly less
planning compared to more complex scenarios (e.g., ultrasonic
inspection in a liquid slug in a gas line with multiple off-takes and
interconnections). Operators and vendors should document all
planning including the decision whether to conduct or not conduct
specific activities prior to the run.
It is anticipated that at a minimum, operators will follow industry
best practice documentation and conduct planning activities
around the parameters most critical and relevant to the specific
inspection.
It should be noted this is one of a few parameters where a
“Conditional” pass may be assigned even if, in retrospect,
planning activities are deemed insufficient if it is demonstrated
that the data collected by the inline inspection tool was
unaffected. Thus, a “Fail” would only be assigned in situations
where data degradation exists – directly as a result of inadequate
pre-run planning.
5.4.4. Options for Dealing with Compromised Data
Quality The impact to data, where a lack of planning has been identified
as the root cause, must be addressed on a case-by-case basis
since the range of potential outcomes is large. For example, at
one extreme, insufficient planning may lead to a tool lodged in
the line (requiring a cut-out) at a previously unidentified pipe
restriction. At the other end of the spectrum, insufficient planning
of product flows may result in a short speed excursion of the tool
at launch.
The guiding principle remains, as stated -below: The operator
must ensure that the dimensions of an injurious defect, for the
pipeline in question, are greater than the minimum detection and
sizing thresholds of the tool. If the operators cannot be confident
that an injurious defect would be detected, a range of options
exist depending on the length of the area where data has been
compromised. Short sections of data degradation may be
individually assessed and deemed acceptable on the basis of
other integrity related activities such as other ILI runs,
hydrostatic testing, cathodic protection, coating, soil, pipe
properties (i.e., presence of heavy wall pipe), and direct
assessment.
CEPA Metal Loss Inline Inspection Tool Validation Guidance Document, 1st Edition, Nov. 2014 © 2014 Canadian Energy Pipeline Association Page 20 of 69
Aboutpipelines.com
Should a “Fail” score be appropriate for this parameter (i.e.,
significant data degradation), the options are somewhat limited
in that some large-scale program to prove the integrity of the
pipeline must be undertaken. For example, the operator must
re-inspect the line having remedied the planning deficiency or
undertake an alternative set of activities – such as hydrostatic
testing, or direct assessment.
If a “Conditional” score is given, then a record of the location(s)
(whether the location(s) are limited to specific segment(s) or the
whole pipeline) where the quality of the data may be affected
must be recorded and considered again for the Cumulative
Assessment.
5.5. (Pre-Run) Function Checks
5.5.1. Parameter Description This parameter is a check of the group of activities that an ILI
vendor carries out to ensure the functional integrity of the tool
prior to loading the inspection tool into the launcher barrel. As
such, function checks are expected to be specific to each vendor
and technology used. The function checklist should be provided
by the ILI vendor and the items should be standardized and
identified in advance of the inspection. These include, but are not
limited to appropriate initialization of all components, the
adequacy and availability of the power supply, confirming sensors
are operational, and confirming adequacy, and availability of data
storage.
5.5.2. Motivation The purpose of this item is to ensure that the inspection tool is in
good working condition, which requires that the tools’ mechanical
components perform as designed, prior to the inspection. The
documentation of this check is required by API 1163, and its
documentation is indicative of the ILI vendor’s diligence in
following established Standards and Guidelines.
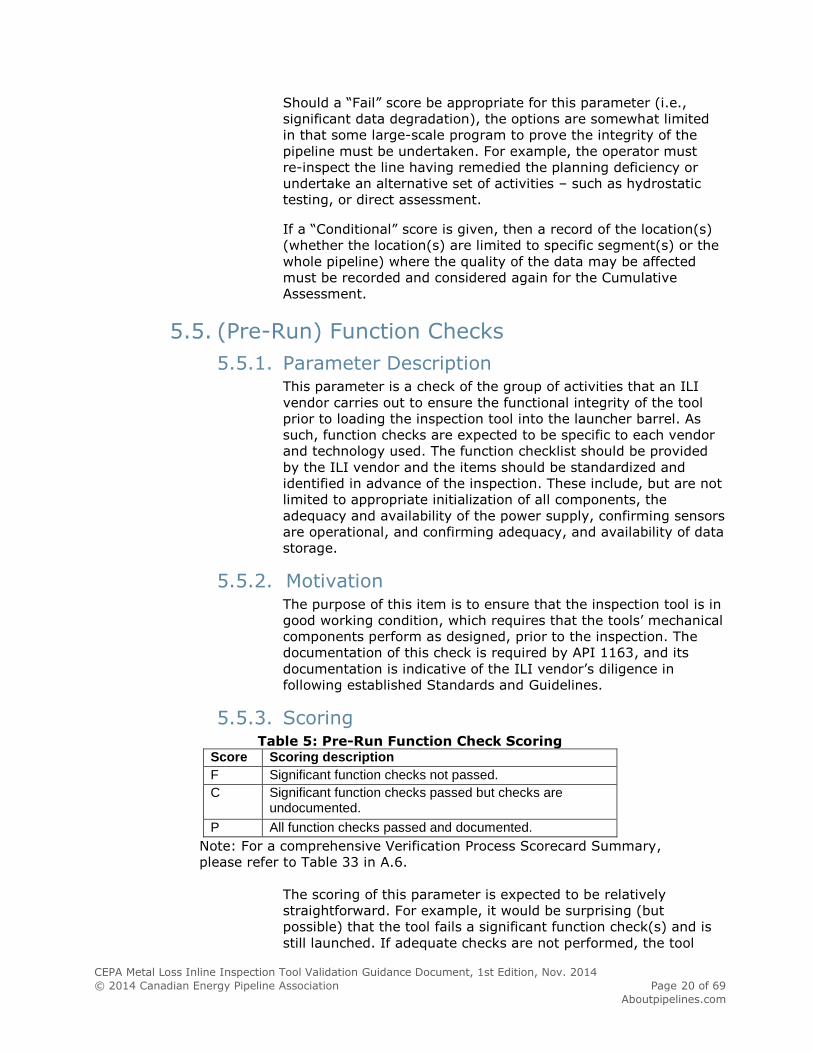
5.5.3. Scoring Table 5: Pre-Run Function Check Scoring
Score Scoring description
F Significant function checks not passed.
C Significant function checks passed but checks are undocumented.
P All function checks passed and documented.
Note: For a comprehensive Verification Process Scorecard Summary,
please refer to Table 33 in A.6.
The scoring of this parameter is expected to be relatively
straightforward. For example, it would be surprising (but
possible) that the tool fails a significant function check(s) and is
still launched. If adequate checks are not performed, the tool

CEPA Metal Loss Inline Inspection Tool Validation Guidance Document, 1st Edition, Nov. 2014 © 2014 Canadian Energy Pipeline Association Page 21 of 69
Aboutpipelines.com
may experience a failure soon after launch. In such a case, the
oversight would result in some significant data degradation, and
the parameter would be deemed a “Fail”. However, in some cases
documentation confirming the function check may be missing. If
the tool passes a documented post-run function check or if the
tool is received and no data degradation has been identified, then
a “Conditional” pass would be assigned. A “Pass” would be
reported if all function checks were passed and documentation to
this effect was readily available.
It should be noted this is one of a few parameters where a
“Conditional” pass may be assigned, even if the function check
was deemed inadequate, provided that it is demonstrated that
the data collected by the inline inspection tool was unaffected.
5.5.4. Options for Dealing with Compromised Data Quality While not expected to happen often, the situations where
function checks are not passed prior to launch are expected to
have a significant impact on the data collected. While the
mitigation options must be addressed on a case-by-case basis,
the operator must ensure that the dimensions of an injurious
defect, for the pipeline in question, are greater than the
minimum detection and sizing thresholds of the tool.
Should a “Fail” score be appropriate for this parameter, the
options are somewhat limited in that some large-scale program
to prove the integrity of the pipeline must be undertaken. For
example, the operator must re-inspect the line or undertake an
alternative set of activities – such as hydrostatic testing, or direct
assessment.
If a “Conditional” score is given, then a record of the location(s)
(whether the location(s) are limited to specific segment(s) or the
whole pipeline) where the quality of the data may be affected
must be recorded and considered again for the Cumulative
Assessment.
5.6. (Pre-Run) Mechanical Checks
5.6.1. Parameter Description This parameter is a check of the group of activities that an ILI
vendor carries out to ensure the mechanical integrity of the tool
prior to loading it into the launcher barrel. As such, pre-run
mechanical checks are expected to be largely visual and specific
to each vendor and technology used. The pre-run mechanical
checklist should be provided by the ILI vendor, standardized, and
identified in advance of the inspection. These include, but are not
limited to: general visual inspection, confirming good pressure
seals around electronic components, ensuring adequate integrity
of cups, and ensuring all wheels are intact and moving
appropriately.

CEPA Metal Loss Inline Inspection Tool Validation Guidance Document, 1st Edition, Nov. 2014 © 2014 Canadian Energy Pipeline Association Page 22 of 69
Aboutpipelines.com
5.6.2. Motivation The purpose of this item is to ensure that the inspection tool is in
good working condition, which requires that the tools’ mechanical
components perform as designed. The documentation of this
check is required by API 1163 and its documentation is indicative
of the ILI vendor’s diligence in following established Standards
and Guidelines.
5.6.3. Scoring Table 6: Pre-Run Mechanical Check Scoring
Score Scoring Description
F Significant mechanical checks not passed.
C Significant mechanical checks passed but checks are undocumented.
P All mechanical checks passed and documented.
Note: For a comprehensive Verification Process Scorecard Summary, please
refer to Table 33 in A.6.
The scoring of this parameter is expected to be relatively
straightforward. For example, it would be surprising (but
possible) that the tool fails a significant mechanical check but is
still launched. If adequate checks are not performed, the tool
may experience a failure soon after launch. In such a case, the
oversight would result in some significant data degradation, and
the parameter would be deemed a “Fail”. However, in some cases
documentation confirming the mechanical check may be missing.
If the tool passes a documented post-run mechanical check or if
the tool is received and no data degradation has been identified,
then a “Conditional” pass would be assigned. A “Pass” would be
reported if all mechanical checks were passed and documented.
It should be noted this is one of a few parameters where a
“Conditional” pass may be assigned even if, in retrospect, the
mechanical check was deemed inadequate if it is demonstrated
that the data collected by the inline inspection tool was
unaffected.
5.6.4. Options for Dealing with Compromised Data Quality While not expected to happen often, the situations where
mechanical checks are not passed prior to launch are expected to
have a significant impact on the data. While the mitigation
options must be addressed on a case-by-case basis, the operator
must ensure that the dimensions of an injurious defect, for the
pipeline in question, are greater than the minimum detection and
sizing thresholds of the tool.
Should a “Fail” score be appropriate for this parameter, the
options are somewhat limited in that some large-scale program
to prove the integrity of the pipeline must be undertaken. For
example, the operator must re-inspect the line or conduct an
CEPA Metal Loss Inline Inspection Tool Validation Guidance Document, 1st Edition, Nov. 2014 © 2014 Canadian Energy Pipeline Association Page 23 of 69
Aboutpipelines.com
alternative set of activities – such as hydrostatic testing, or direct
assessment.
If a “Conditional” score is given, then the location(s) (whether
the location(s) are limited to specific segment(s) or the whole
pipeline) where the quality of the data may be affected must be
recorded and considered again for the Cumulative Assessment.
5.7. (In the Pipe) Procedure Execution
5.7.1. Parameter Description A job specific plan that includes technical requirements,
responsibility, emergency contact, procedures, work site
preparation and mobilization is commonly prepared to support
execution of the inspection. This parameter checks the group of
activities required to execute a successful inline inspection based
on the requirements of the plan. These include, but are not
limited to:
Check the tool run was executed as per the planned pigging
procedure.
Check that the line condition parameters (fluid composition,
flow rate, temperature, and pressure) were in accordance
with the planned procedure.
Check that the line conditions for tool launch were as
expected and did launch proceed as planned.
Check that the line conditions for tool receive were as
expected and did receive proceed as planned.
Check that the tool speed was within the planned range for
the length of the run. (If deviations did occur, were they
planned or expected and assessed in advance?)
Check that the tracking of the tool was according to plan.
5.7.2. Motivation This parameter is designed to ensure that the actual inspection
was conducted in such a way as to ensure high-quality inspection
data. The documentation of this check is indicative of the ILI
vendor’s diligence in following established Standards and
Guidelines.
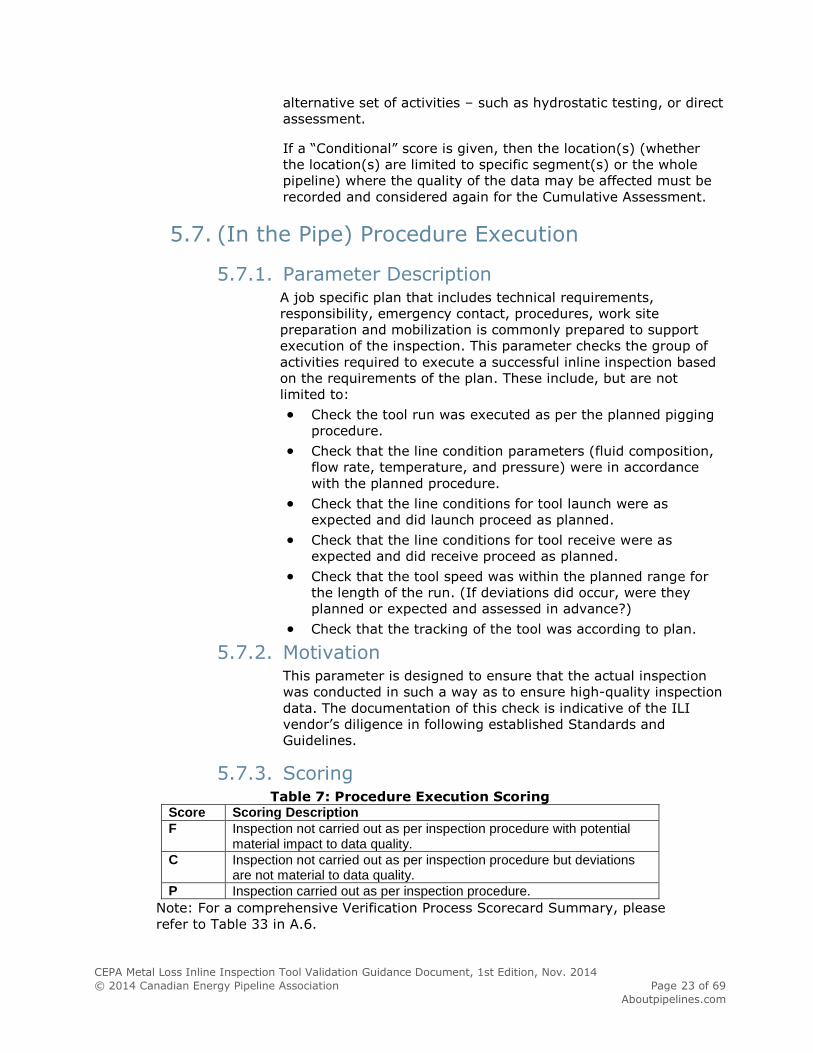
5.7.3. Scoring Table 7: Procedure Execution Scoring
Score Scoring Description
F Inspection not carried out as per inspection procedure with potential material impact to data quality.
C Inspection not carried out as per inspection procedure but deviations are not material to data quality.
P Inspection carried out as per inspection procedure.
Note: For a comprehensive Verification Process Scorecard Summary, please
refer to Table 33 in A.6.

CEPA Metal Loss Inline Inspection Tool Validation Guidance Document, 1st Edition, Nov. 2014 © 2014 Canadian Energy Pipeline Association Page 24 of 69
Aboutpipelines.com
The scoring of this parameter is expected to be relatively
straightforward. For example, if there were deviations from the
planned procedure and significant data impacts resulting (i.e.,
impacts that could not be managed through alternative means),
the parameter would be deemed a “Fail”. However, in some cases
there may have been deviations from the planned procedure but
there was little or no impact to data quality, in these cases, a
“Conditional” pass would be assigned. A “Pass” would be reported
when the inspection procedure was executed as planned and
documentation to this effect was readily available.
5.7.4. Options for Dealing with Compromised Data Quality The impact to data due to deviations from the planned inspection
procedure must be addressed on a case-by-case basis, since the
range of potential outcomes is large. For example, long speed
excursions at wall thickness changes may require restating the
tool performance specification for the entire length of the line.
However, short speed excursions at launch in heavy-wall yard
piping may be deemed tolerable.
The guiding principle remains, as stated above: The operator
must ensure that the dimensions of an injurious defect, for the
pipeline in question, are greater than the minimum detection and
sizing thresholds of the tool. If the operator cannot be confident
that an injurious defect would be detected, a range of options
exist depending on the location and length of the area where
data has been compromised. Short sections of data degradation
may be individually assessed and deemed acceptable on the
basis of other integrity related activities such as other ILI runs,
hydrostatic testing, cathodic protection, coating, soil, pipe
properties (i.e., presence of heavy wall pipe) and direct
assessment.
Should a “Fail” score be appropriate for this parameter (i.e.,
significant data degradation), the options are somewhat limited
in that some large-scale program to prove the integrity of the
pipeline must be undertaken. For example, the operator must
re-inspect the line having remedied the deviation in the
inspection procedure or conduct an alternative set of activities –
such as hydrostatic testing, or direct assessment.
If a “Conditional” score is given, then the location(s) (whether
the location(s) are limited to specific segment(s) or the whole
pipeline) where the quality of the data may be affected must be
recorded and considered again for the Cumulative Assessment.
5.8. (Post-Run) Mechanical Check
5.8.1. Parameter Description This parameter checks the group of activities that an ILI vendor
carries out to ensure the mechanical integrity of the tool upon
CEPA Metal Loss Inline Inspection Tool Validation Guidance Document, 1st Edition, Nov. 2014 © 2014 Canadian Energy Pipeline Association Page 25 of 69
Aboutpipelines.com
receive at the end of the run. As such, post-run mechanical
checks are expected to be largely visual and specific to each
vendor and technology used. The post-run mechanical checklist
should be provided by the ILI vendor, standardized and identified
in advance of the inspection. These include, but are not limited to
assessing: general state of the tool, pressure seals around
electronic components, integrity of cups, tool cleanliness, location
of debris accumulation, tool wear as well as ensuring all parts are
intact and moving appropriately. It is recommended that the
checklist be appended with photographs of the tool and any
damage to mechanical components
5.8.2. Motivation The purpose of this item is to ensure that the inspection tool was
not damaged during the course of the inspection. The
documentation of this check is indicative of the ILI vendor’s
diligence in following established Standards and Guidelines.
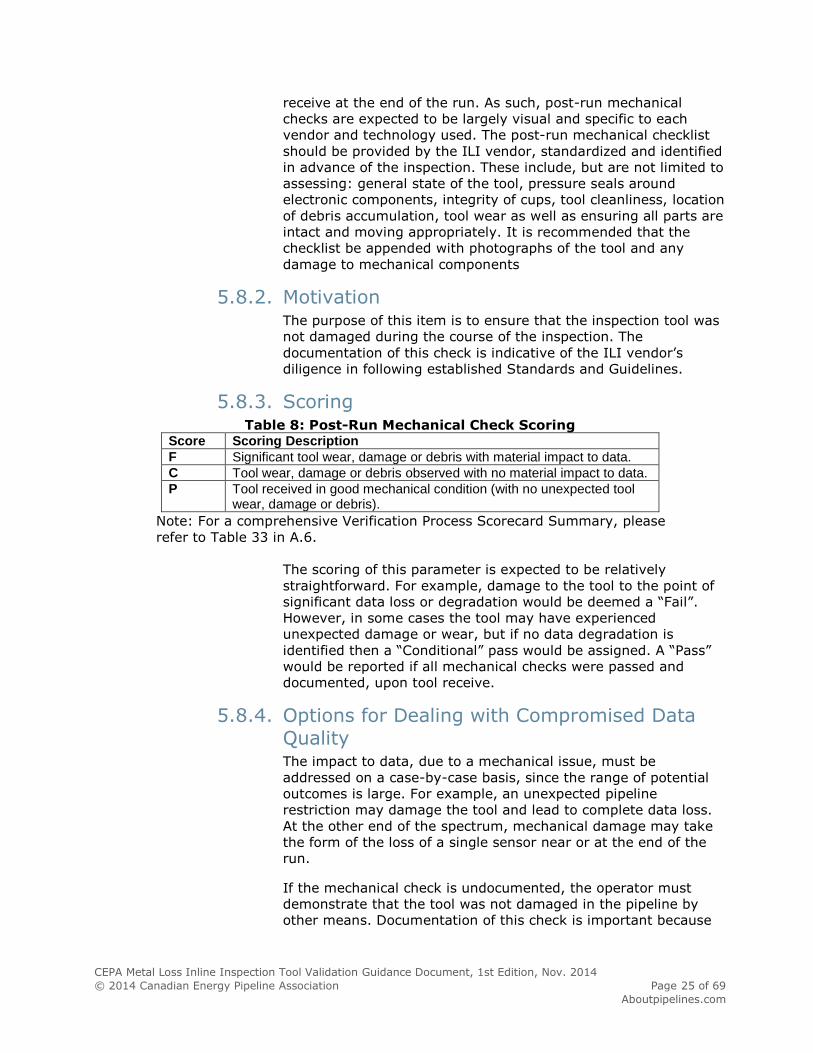
5.8.3. Scoring Table 8: Post-Run Mechanical Check Scoring
Score Scoring Description
F Significant tool wear, damage or debris with material impact to data.
C Tool wear, damage or debris observed with no material impact to data.
P Tool received in good mechanical condition (with no unexpected tool wear, damage or debris).
Note: For a comprehensive Verification Process Scorecard Summary, please
refer to Table 33 in A.6.
The scoring of this parameter is expected to be relatively
straightforward. For example, damage to the tool to the point of
significant data loss or degradation would be deemed a “Fail”.
However, in some cases the tool may have experienced
unexpected damage or wear, but if no data degradation is
identified then a “Conditional” pass would be assigned. A “Pass”
would be reported if all mechanical checks were passed and
documented, upon tool receive.
5.8.4. Options for Dealing with Compromised Data Quality The impact to data, due to a mechanical issue, must be
addressed on a case-by-case basis, since the range of potential
outcomes is large. For example, an unexpected pipeline
restriction may damage the tool and lead to complete data loss.
At the other end of the spectrum, mechanical damage may take
the form of the loss of a single sensor near or at the end of the
run.
If the mechanical check is undocumented, the operator must
demonstrate that the tool was not damaged in the pipeline by
other means. Documentation of this check is important because

CEPA Metal Loss Inline Inspection Tool Validation Guidance Document, 1st Edition, Nov. 2014 © 2014 Canadian Energy Pipeline Association Page 26 of 69
Aboutpipelines.com
the demonstration that the tool was not damaged may be
difficult.
The guiding principle remains, as stated above: The operator
must ensure that the dimensions of an injurious defect, for the
pipeline in question, are greater than the minimum detection and
sizing thresholds of the tool. If the operators cannot be confident
that an injurious defect would be detected, a range of options
exist depending on the location and length of the area where
data has been compromised.
Short sections of data degradation may be individually assessed
and deemed acceptable on the basis of other integrity related
activities such as other ILI runs, hydrostatic testing, cathodic
protection, coating, soil, pipe properties (i.e., presence of heavy
wall pipe) and direct assessment.
Should a “Fail” score be appropriate for this parameter (i.e.,
significant data degradation), the options are somewhat limited
in that some large-scale program to prove the integrity of the
pipeline must be undertaken. For example, the operator must
re-inspect the line having remedied the cause of the mechanical
problem (e.g., additional cleaning runs or removal of a diameter
restriction) or undertake an alternative set of activities – such as
hydrostatic testing, or direct assessment.
If a “Conditional” score is given, then the location(s) (whether
the location(s) are limited to specific segment(s) or the whole
pipeline) where the quality of the data may be affected must be
recorded and considered again for the Cumulative Assessment.
5.9. (Post-Run) Function Check
5.9.1. Parameter Description This parameter is a check of the group of activities that an ILI
vendor carries out to ensure functional integrity of the tool upon
receive at the end of the run. As such, function checks are
expected to be specific to each vendor and technology used. The
function checklist should be provided by the ILI vendor,
standardized, and identified in advance of the inspection. These
checks include, but are not limited to appropriate operation of all
components, the adequacy and availability of the power supply,
confirming sensors are operational, and confirming adequacy and
availability of data storage.
5.9.2. Motivation The purpose of this item is to ensure that the inspection tool did
not experience an internal failure during the course of the
inspection. The documentation of this check is indicative of the
ILI vendor’s diligence in following established Standards and
Guidelines.
CEPA Metal Loss Inline Inspection Tool Validation Guidance Document, 1st Edition, Nov. 2014 © 2014 Canadian Energy Pipeline Association Page 27 of 69
Aboutpipelines.com
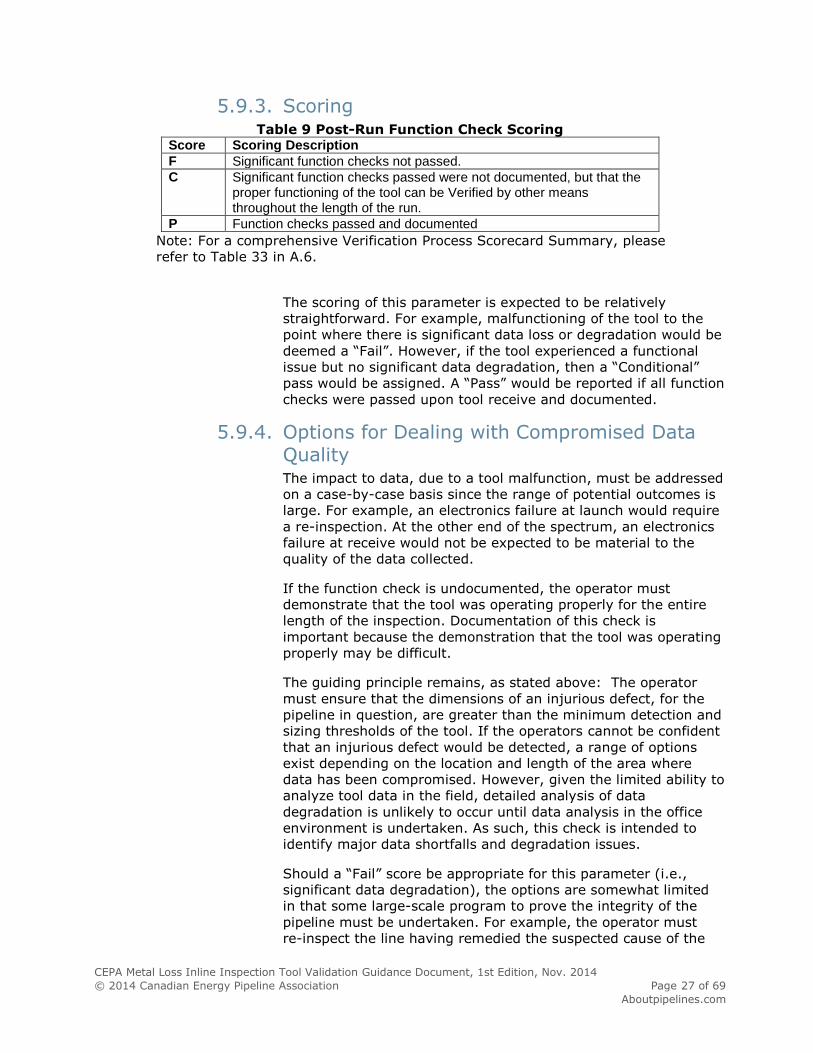
5.9.3. Scoring Table 9 Post-Run Function Check Scoring
Score Scoring Description
F Significant function checks not passed.
C Significant function checks passed were not documented, but that the proper functioning of the tool can be Verified by other means throughout the length of the run.
P Function checks passed and documented
Note: For a comprehensive Verification Process Scorecard Summary, please
refer to Table 33 in A.6.
The scoring of this parameter is expected to be relatively
straightforward. For example, malfunctioning of the tool to the
point where there is significant data loss or degradation would be
deemed a “Fail”. However, if the tool experienced a functional
issue but no significant data degradation, then a “Conditional”
pass would be assigned. A “Pass” would be reported if all function
checks were passed upon tool receive and documented.
5.9.4. Options for Dealing with Compromised Data Quality The impact to data, due to a tool malfunction, must be addressed
on a case-by-case basis since the range of potential outcomes is
large. For example, an electronics failure at launch would require
a re-inspection. At the other end of the spectrum, an electronics
failure at receive would not be expected to be material to the
quality of the data collected.
If the function check is undocumented, the operator must
demonstrate that the tool was operating properly for the entire
length of the inspection. Documentation of this check is
important because the demonstration that the tool was operating
properly may be difficult.
The guiding principle remains, as stated above: The operator
must ensure that the dimensions of an injurious defect, for the
pipeline in question, are greater than the minimum detection and
sizing thresholds of the tool. If the operators cannot be confident
that an injurious defect would be detected, a range of options
exist depending on the location and length of the area where
data has been compromised. However, given the limited ability to
analyze tool data in the field, detailed analysis of data
degradation is unlikely to occur until data analysis in the office
environment is undertaken. As such, this check is intended to
identify major data shortfalls and degradation issues.
Should a “Fail” score be appropriate for this parameter (i.e.,
significant data degradation), the options are somewhat limited
in that some large-scale program to prove the integrity of the
pipeline must be undertaken. For example, the operator must
re-inspect the line having remedied the suspected cause of the
CEPA Metal Loss Inline Inspection Tool Validation Guidance Document, 1st Edition, Nov. 2014 © 2014 Canadian Energy Pipeline Association Page 28 of 69
Aboutpipelines.com
data degradation or undertake an alternative set of activities –
such as hydrostatic testing, or direct assessment.
If a “Conditional” score is given, then the location(s) (whether
the location(s) are limited to specific segment(s) or the whole
pipeline) where the quality of the data may be affected must be
recorded and considered again for the Cumulative Assessment.
5.10. (Post-Run) Field Data Quality Check
5.10.1. Parameter Description This parameter is the group of checks that an ILI vendor carries
out to ensure integrity of the data collected upon receive at the
end of the run. These checks are expected to be specific to each
vendor and technology used. The Field Data checklist should be
provided by the ILI vendor, standardized, and identified in
advance of the inspection. These checks include, but are not
limited to: amount of data collected, length of line inspected, and
circumferential and linear continuity of data.
5.10.2. Motivation The purpose of this item is to ensure that the inspection tool
collected data for the full length of the line. This check is intended
to identify any major data shortfalls and/or degradation issues,
which would prevent the vendor from meeting the performance
specifications. The documentation of this check is indicative of the
ILI vendor’s diligence in following established Standards and
Guidelines.
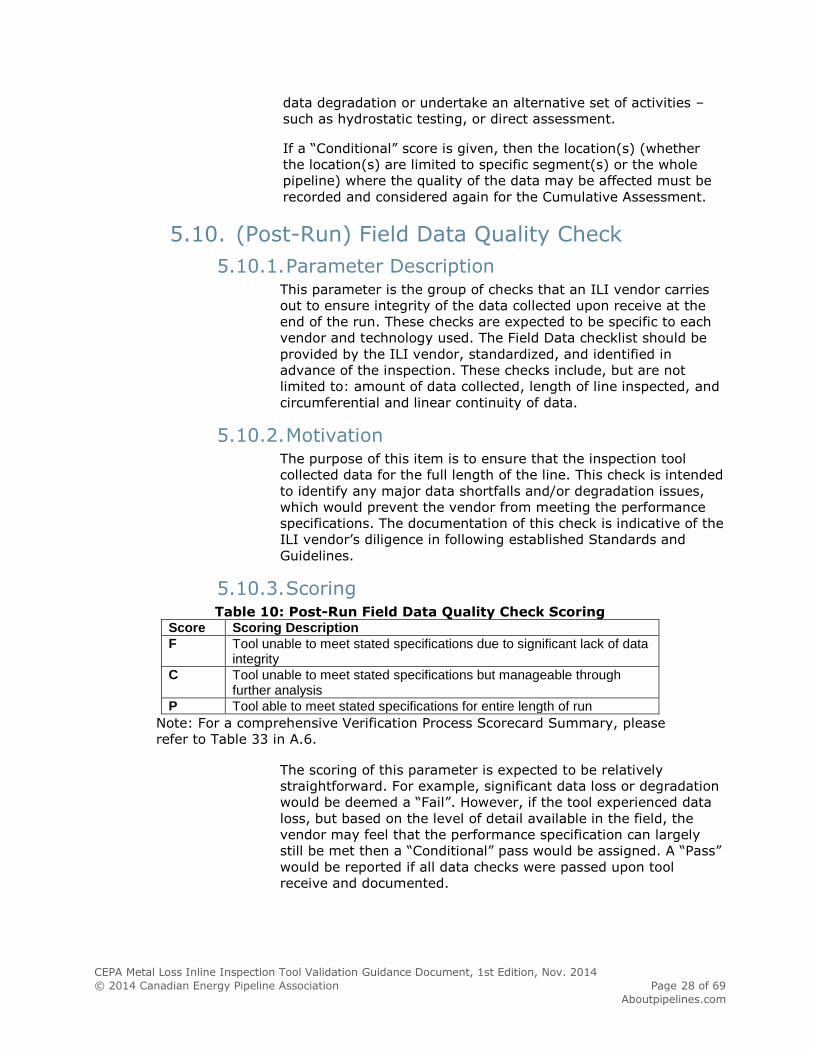
5.10.3. Scoring Table 10: Post-Run Field Data Quality Check Scoring
Score Scoring Description
F Tool unable to meet stated specifications due to significant lack of data integrity
C Tool unable to meet stated specifications but manageable through further analysis
P Tool able to meet stated specifications for entire length of run
Note: For a comprehensive Verification Process Scorecard Summary, please
refer to Table 33 in A.6.
The scoring of this parameter is expected to be relatively
straightforward. For example, significant data loss or degradation
would be deemed a “Fail”. However, if the tool experienced data
loss, but based on the level of detail available in the field, the
vendor may feel that the performance specification can largely
still be met then a “Conditional” pass would be assigned. A “Pass”
would be reported if all data checks were passed upon tool
receive and documented.

CEPA Metal Loss Inline Inspection Tool Validation Guidance Document, 1st Edition, Nov. 2014 © 2014 Canadian Energy Pipeline Association Page 29 of 69
Aboutpipelines.com
5.10.4. Options for Dealing with Compromised Data
Quality Data degradation identified through this parameter must be
addressed on a case-by-case basis since the range of potential
outcomes is large. For example, complete loss of data at launch
would require a re-inspection. At the other end of the spectrum,
the loss of a single sensor half way through the run may not be
deemed material to the quality of the data collected.
The guiding principle remains, as stated above: The operator
must ensure that the dimensions of an injurious defect, for the
pipeline in question, are greater than the minimum detection and
sizing thresholds of the tool. If the operators cannot be confident
that an injurious defect would be detected, a range of options
exist depending on the location and length of the area where data
has been compromised. However, given the limited ability to
analyze tool data in the field, detailed analysis of data
degradation is unlikely to occur until data analysis in the office
environment is undertaken. As such, this check is intended to
identify major data shortfalls and degradation issues.
Should a “Fail” score be appropriate for this parameter (i.e.,
significant data degradation), the options are somewhat limited in
that some large-scale program to prove the integrity of the
pipeline must be undertaken. For example, the operator must re-
inspect the line having remedied the suspected cause of the data
degradation or undertake an alternative set of activities – such as
hydrostatic testing, or direct assessment.
If a “Conditional” score is given, then the location(s) (whether the
location(s) are limited to specific segment(s) or the whole
pipeline) where the quality of the data may be affected must be
recorded and considered again for the Cumulative Assessment.
5.11. (Post-Run) Data Analysis Process Check
5.11.1. Parameter Description This parameter is the group of checks that the data was properly
handled and analyzed by the vendor in the production of the final
report. These checks are specific to each vendor and technology
used.
The data analysis should be discussed and decided jointly by the
operator and ILI vendor. The operator and ILI vendor should
agree on items such as sizing algorithms to use, amount of
manual intervention, filtering of reported anomalies, clustering
rules, burst pressure procedure, etc. In addition, the operator
should also discuss analyst’s qualifications (Level 1, 2, or 3) for
who should perform the analysis.
CEPA Metal Loss Inline Inspection Tool Validation Guidance Document, 1st Edition, Nov. 2014 © 2014 Canadian Energy Pipeline Association Page 30 of 69
Aboutpipelines.com
It is recommended that the above listed requirements be
discussed and agreed upon in the Planning and Preparation stage,
to allow the vendor to properly secure the required resources,
including analysts and software programs, for instance, and to
ensure the tool is capable of performing the scope, before the
inspection.
The Data Analysis checklist should be based on the analysis
procedure provided by the ILI vendor, standardized, and
identified in advance of the analysis. These checks include, but
are not limited to: amount of data collected, continuity of data,
appropriate sensor response(s), sizing algorithms, manual
checking, clustering rules, burst pressure procedure, execution of
data analysis procedures as well as use of appropriate input
parameters (such as pipeline diameter, wall thickness, grade,
etc.).
5.11.2. Motivation This final check is to ensure that the raw data from the inspection
has been properly analyzed by the ILI vendor and that the final
report will satisfy the requirements of the inspection. The
documentation of this check is indicative of the ILI vendor’s
diligence in following established Standards and Guidelines.
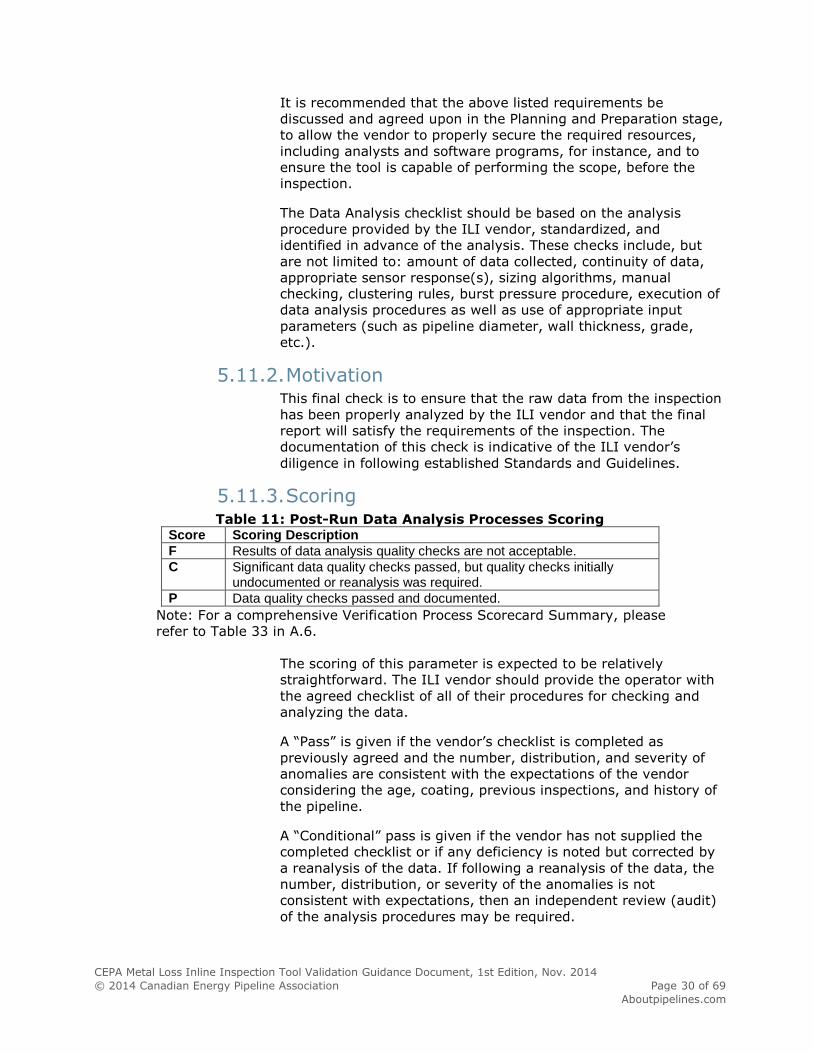
5.11.3. Scoring Table 11: Post-Run Data Analysis Processes Scoring
Score Scoring Description
F Results of data analysis quality checks are not acceptable.
C Significant data quality checks passed, but quality checks initially undocumented or reanalysis was required.
P Data quality checks passed and documented.
Note: For a comprehensive Verification Process Scorecard Summary, please
refer to Table 33 in A.6.
The scoring of this parameter is expected to be relatively
straightforward. The ILI vendor should provide the operator with
the agreed checklist of all of their procedures for checking and
analyzing the data.
A “Pass” is given if the vendor’s checklist is completed as
previously agreed and the number, distribution, and severity of
anomalies are consistent with the expectations of the vendor
considering the age, coating, previous inspections, and history of
the pipeline.
A “Conditional” pass is given if the vendor has not supplied the
completed checklist or if any deficiency is noted but corrected by
a reanalysis of the data. If following a reanalysis of the data, the
number, distribution, or severity of the anomalies is not
consistent with expectations, then an independent review (audit)
of the analysis procedures may be required.

CEPA Metal Loss Inline Inspection Tool Validation Guidance Document, 1st Edition, Nov. 2014 © 2014 Canadian Energy Pipeline Association Page 31 of 69
Aboutpipelines.com
A “Fail” is given for any situation that cannot be corrected by
reanalysis of the data. Such situations may indicate a problem in
the selection, preparation, or running of the tool.
5.11.4. Options for Data Analysis Issues Depending on the issue, the results for this parameter must be
addressed on a case-by-case basis since the potential causes of
the issue are broad ranging. Issues regarding the analysis of the
data are likely to affect the entire inspection. However some
issues may affect only specific locations on the pipeline. In many
cases, reanalysis of the data or an independent audit of the
analysis may be sufficient to address the concern.
Should a “Fail” score be appropriate for this parameter (i.e.,
significant data degradation), the options are somewhat limited in
that some large-scale program to prove the integrity of the
pipeline must be undertaken. For example, the operator must
re-inspect the line having remedied the suspected cause of the
data degradation or undertake an alternative set of activities –
such as hydrostatic testing, or direct assessment.
If a “Conditional” score is given, then the location(s) (whether the
location(s) are limited to specific segment(s) or the whole
pipeline) where the quality of the data may be affected must be
recorded and considered again for the Cumulative Assessment.
5.12. (Post-Run) Cumulative Assessment
5.12.1. Parameter Description This parameter provides a means of assessing all of the
parameters – taken as a whole – to determine whether the tool
performance was acceptable. That is, this parameter is a
mechanism to ensure that (potential) sub-optimal performance
across all parameters does not result in an unacceptable run even
if all parameters taken individually are deemed acceptable (i.e.,
conditional passes). Relevant considerations include, but are not
limited to, the following:
Can data gaps be mitigated effectively using alternative
methods?
Can any data gaps actually be addressed through re-running
the tool or are line conditions such that similar challenges will
remain?
Are any “Conditional” scores cumulative in nature?
Do “Conditional” scores of different parameters affect the
same locations?
5.12.2. Scoring Table 12: Post-Run Cumulative Assessment Scoring
Score Scoring Description

CEPA Metal Loss Inline Inspection Tool Validation Guidance Document, 1st Edition, Nov. 2014 © 2014 Canadian Energy Pipeline Association Page 32 of 69
Aboutpipelines.com
F Cumulative impact of “Conditional” passes deemed to materially impact ILI results.
A Cumulative impact of “Conditional” passes is unclear and may have impacted ILI results.
P The cumulative impact of all “Conditional” passes, if any, deemed to be tolerable.
Note: For a comprehensive Verification Process Scorecard Summary, please
refer to Table 33 in A.6.
Scoring for this final parameter is in fact the scoring of the entire
verification Process. The final score may be either “Fail”, “Pass”,
or “Ambiguous”, depending on whether the “Conditional” passes
of the previous checks are cumulative or not. Degradation is
cumulative if one issue magnifies any pre-existing data
degradation (such as a tool over-speed in a location where the
tool performance is already compromised by debris related sensor
lift off). Conversely, issues are not cumulative if their impact on
data quality is largely independent (such as a run where the tool
over-speeds at launch and experiences debris issues at receive).
If two or more “Conditional” passes of the previous checks affect
the same length of pipe and the degradation are cumulative and
materially impact the results of the ILI, a “Fail” would be
assigned. If the operator can clearly confirm that the impact of
any “Conditional” scores are not cumulative and are manageable,
a “Pass” may be assigned. However, should the results be
ambiguous, due to the specifics of the situation, an “Ambiguous”
score is assigned and further analysis is required to manage the
threat on the pipeline.
6. Validation Validation is the process that compares the data collected and reported by the ILI tool to
some independent reference data to ensure the ILI tool meets its performance
specification. Depending on the available data and the results of the ILI inspection, the
validation procedure may consist of different comparisons. In all cases, the validation
must include a comparison of reported pipeline (non-defect) features such as girth welds
and wall thickness changes to as-built records (or similar record). If there are actionable
anomalies, then they must be excavated and compared to the ILI results. In addition,
previous excavation data can also be another reliable source to validate the ILI run.
External features that have been recoated can be used to validate both Magnetic Flux
Leakage (MFL) and Ultrasonic (UT) inspections and external features under a steel repair
sleeve can be used to validate UT inspection only. Finally, if there is a previous ILI run,
then the reported metal-loss anomalies must be compared to the previous inspection.
6.1. Known Pipeline Features
6.1.1. Description The simplest validation process is the comparison of non-defect
features on the pipeline to the ILI report. The features to be
compared should include but are not limited to:
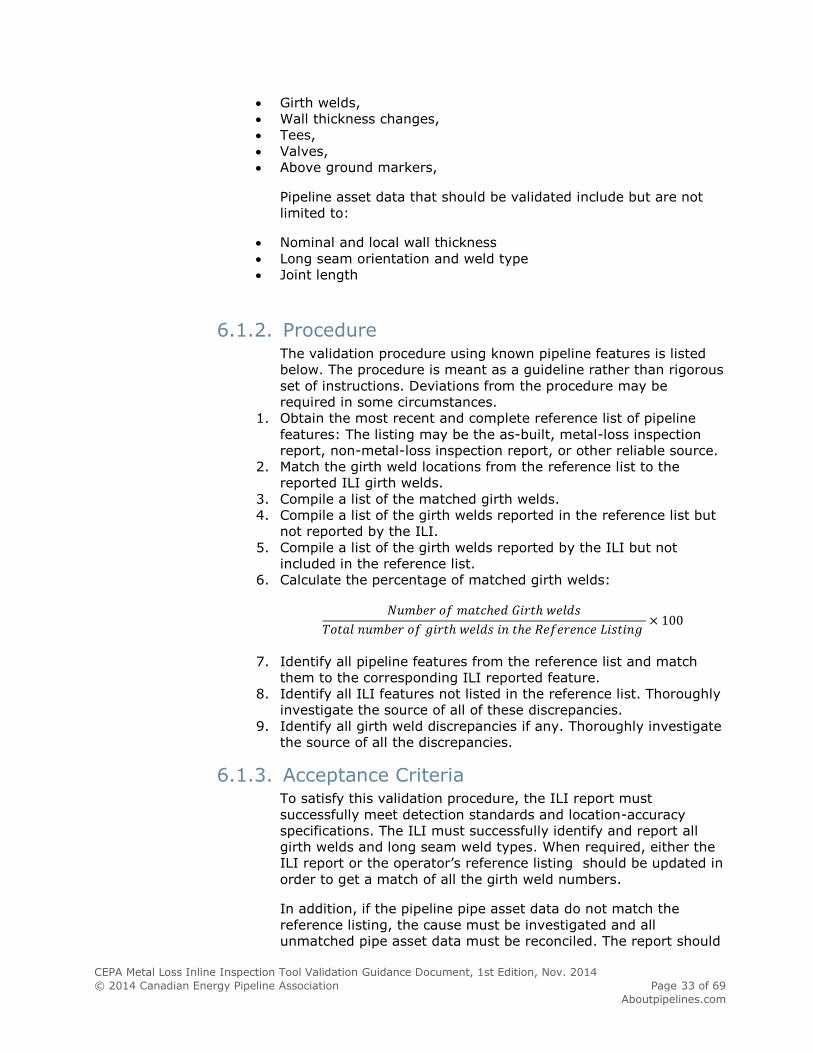
CEPA Metal Loss Inline Inspection Tool Validation Guidance Document, 1st Edition, Nov. 2014 © 2014 Canadian Energy Pipeline Association Page 33 of 69
Aboutpipelines.com
Girth welds,
Wall thickness changes,
Tees,
Valves,
Above ground markers,
Pipeline asset data that should be validated include but are not
limited to:
Nominal and local wall thickness
Long seam orientation and weld type
Joint length
6.1.2. Procedure The validation procedure using known pipeline features is listed
below. The procedure is meant as a guideline rather than rigorous
set of instructions. Deviations from the procedure may be
required in some circumstances.
1. Obtain the most recent and complete reference list of pipeline
features: The listing may be the as-built, metal-loss inspection
report, non-metal-loss inspection report, or other reliable source.
2. Match the girth weld locations from the reference list to the
reported ILI girth welds.
3. Compile a list of the matched girth welds.
4. Compile a list of the girth welds reported in the reference list but
not reported by the ILI.
5. Compile a list of the girth welds reported by the ILI but not
included in the reference list.
6. Calculate the percentage of matched girth welds:
𝑁𝑢𝑚𝑏𝑒𝑟 𝑜𝑓 𝑚𝑎𝑡𝑐ℎ𝑒𝑑 𝐺𝑖𝑟𝑡ℎ 𝑤𝑒𝑙𝑑𝑠
𝑇𝑜𝑡𝑎𝑙 𝑛𝑢𝑚𝑏𝑒𝑟 𝑜𝑓 𝑔𝑖𝑟𝑡ℎ 𝑤𝑒𝑙𝑑𝑠 𝑖𝑛 𝑡ℎ𝑒 𝑅𝑒𝑓𝑒𝑟𝑒𝑛𝑐𝑒 𝐿𝑖𝑠𝑡𝑖𝑛𝑔 × 100
7. Identify all pipeline features from the reference list and match
them to the corresponding ILI reported feature.
8. Identify all ILI features not listed in the reference list. Thoroughly
investigate the source of all of these discrepancies.
9. Identify all girth weld discrepancies if any. Thoroughly investigate
the source of all the discrepancies.
6.1.3. Acceptance Criteria To satisfy this validation procedure, the ILI report must
successfully meet detection standards and location-accuracy
specifications. The ILI must successfully identify and report all
girth welds and long seam weld types. When required, either the
ILI report or the operator’s reference listing should be updated in
order to get a match of all the girth weld numbers.
In addition, if the pipeline pipe asset data do not match the
reference listing, the cause must be investigated and all
unmatched pipe asset data must be reconciled. The report should

CEPA Metal Loss Inline Inspection Tool Validation Guidance Document, 1st Edition, Nov. 2014 © 2014 Canadian Energy Pipeline Association Page 34 of 69
Aboutpipelines.com
only be accepted once all girth weld numbers and pipe asset data
completely match the reference listing. The reported location of
all features must meet location-accuracy specifications to enable
the excavation of any reported feature.
6.1.4. Special Considerations If the ILI report initially fails to meet the above requirements, the
operator must investigate the cause. To meet the acceptance
criteria, the operator may choose to ignore the part of the
inspection in the stations at launch or receive where there are
many short pipe joints. Also, when replaced or rerouted segments
have been identified in the ILI report, the operator should
investigate and validate the information and then assign new
Girth Weld (GW) numbers. If the GW numbers assigned are
different from the GW reported on the ILI report, the operator
should request the ILI vendor to update the ILI report with the
new GW numbers. Finally, any unexplained features reported by
the ILI should be investigated to determine their cause.
6.2. Comparison with Previous ILI
6.2.1. Description The comparison with a previous ILI is likely the most
comprehensive method for validating the results of an ILI
inspection. Unlike excavating the pipeline, a previous ILI enables
the operator to systematically compare all anomalies of the
current inspection to the previous reference inspection.
6.2.2. Validation using a previous ILI consists of two parts: detection and accuracy. By using a previous inspection, the operator can confirm both the detection capabilities and the accuracy of the current inspection. Procedure The validation procedure using previous ILI data is listed below.
The procedure is meant as a guideline rather than rigorous set of
instructions. Deviations from the procedure may be required in
some circumstances. Furthermore, a lengthy interval (e.g. more
than 5 years) between ILI inspections or the use of very different
technologies can make matching difficult if not impossible. If
there is insufficient similarity between the inspections to make
adequate matches, then the current inspection cannot be
validated by the comparison. However, it would not necessarily
lead to the rejection of the ILI run, since the cause of the
discrepancy may be the previous ILI run.
6.2.2.1. Validation Parameters
The ILI validation criterion is based on the assumptions and
calculations in A4. Validation using a Previous ILI. The

CEPA Metal Loss Inline Inspection Tool Validation Guidance Document, 1st Edition, Nov. 2014 © 2014 Canadian Energy Pipeline Association Page 35 of 69
Aboutpipelines.com
validation parameters for a typical run are summarized in
Table 13.
Table 13: ILI Validation Parameters 𝑇 Tolerance to be validated in
the current ILI. This value is 10% if the specified accuracy of the current ILI is ±10% NWT, 80% of the time.
𝑪 Specified confidence level (or certainty) of the current ILI.
This value is 80% if the specified accuracy of the current ILI is ±10% NWT, 80% of the time.
𝑻𝟏 Specified tolerance of the previous ILI inspection.
This value is 10% if the accuracy of the previous ILI is ±10% NWT, 80% of the time.
𝑪𝟏 Specified confidence level (or certainty) of the previous ILI.
This value is 80% if the accuracy of the previous ILI is ±10% NWT, 80% of the time.
𝑻𝒖𝒑𝒑𝒆𝒓 Upper bound of acceptance for the ILI tolerance.
CEPA recommends that this value be 1.1 × 𝑇. Thus in most
cases 𝑇𝑢𝑝𝑝𝑒𝑟 = 11%.
𝟏 − 𝜶 Confidence level for the tolerance validation.
1 − 𝛼 is commonly set at 95%, which makes 𝛼 = 0.05.
𝑵 Minimum matched sample size Based on the above parameters and the calculations in A4.
Validation using a Previous ILI, the minimum sample size is 513 matches.
6.2.2.2. Match ILI Anomalies
Using the procedure outlined in A3. Matching, match the
girth welds and ILI anomalies between the current inspection
and the previous reference inspection.
6.2.2.3. Depth Difference Statistics
For each matched pair of anomalies calculate the apparent
difference in depth:
Δ𝑖 = 𝑑𝑖 − 𝑑𝑟𝑖
Where 𝑑𝑖 is the depth of the 𝑖’th anomaly in the current
inspection;
𝑑𝑟𝑖 is the depth of the 𝑖’th anomaly in the previous
reference inspection; and
Δ𝑖 is the difference in depth of the 𝑖’th anomaly.
Calculate the mean, Δ̅, and standard deviation, 𝑠Δ, of the
difference in depths:
Δ̅̅̅ =1
𝑛∑Δ𝑖
𝑛
𝑖=1
,
And
𝑠Δ = √1
𝑛 − 1∑(Δ𝑖 − Δ̅)2
𝑛
𝑖=1
.
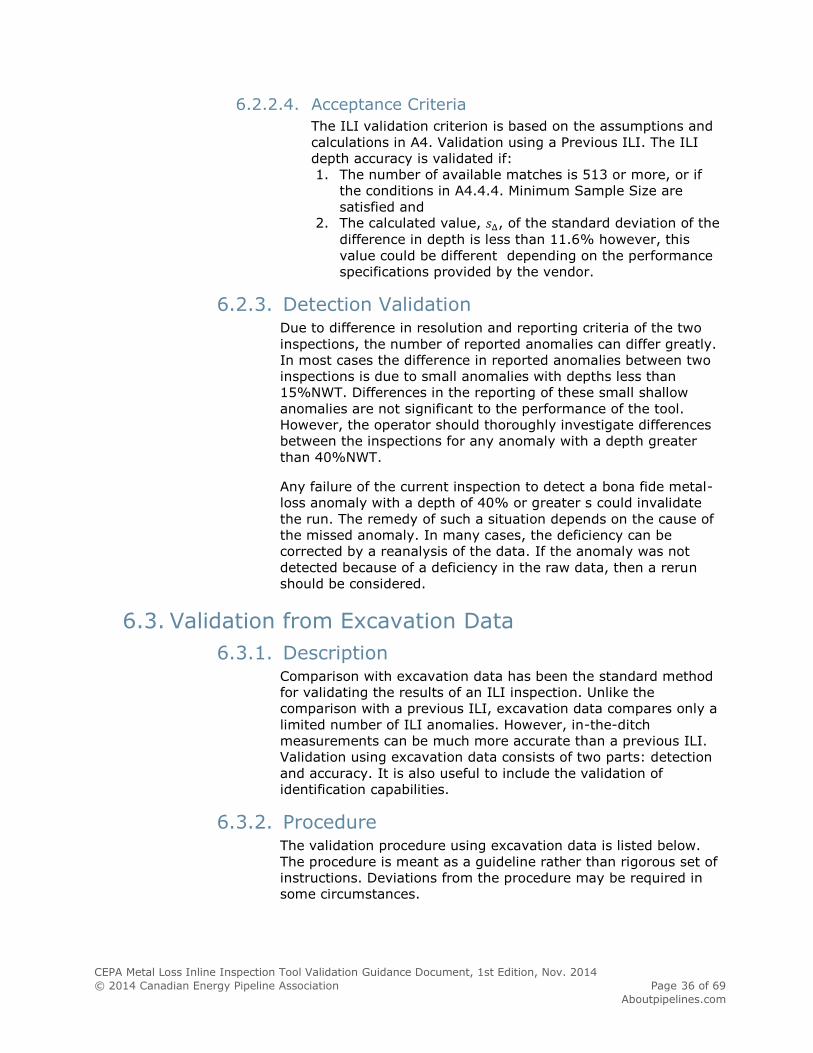
CEPA Metal Loss Inline Inspection Tool Validation Guidance Document, 1st Edition, Nov. 2014 © 2014 Canadian Energy Pipeline Association Page 36 of 69
Aboutpipelines.com
6.2.2.4. Acceptance Criteria
The ILI validation criterion is based on the assumptions and
calculations in A4. Validation using a Previous ILI. The ILI
depth accuracy is validated if:
1. The number of available matches is 513 or more, or if
the conditions in A4.4.4. Minimum Sample Size are
satisfied and 2. The calculated value, 𝑠Δ, of the standard deviation of the
difference in depth is less than 11.6% however, this
value could be different depending on the performance
specifications provided by the vendor.
6.2.3. Detection Validation Due to difference in resolution and reporting criteria of the two
inspections, the number of reported anomalies can differ greatly.
In most cases the difference in reported anomalies between two
inspections is due to small anomalies with depths less than
15%NWT. Differences in the reporting of these small shallow
anomalies are not significant to the performance of the tool.
However, the operator should thoroughly investigate differences
between the inspections for any anomaly with a depth greater
than 40%NWT.
Any failure of the current inspection to detect a bona fide metal-
loss anomaly with a depth of 40% or greater s could invalidate
the run. The remedy of such a situation depends on the cause of
the missed anomaly. In many cases, the deficiency can be
corrected by a reanalysis of the data. If the anomaly was not
detected because of a deficiency in the raw data, then a rerun
should be considered.
6.3. Validation from Excavation Data
6.3.1. Description Comparison with excavation data has been the standard method
for validating the results of an ILI inspection. Unlike the
comparison with a previous ILI, excavation data compares only a
limited number of ILI anomalies. However, in-the-ditch
measurements can be much more accurate than a previous ILI.
Validation using excavation data consists of two parts: detection
and accuracy. It is also useful to include the validation of
identification capabilities.
6.3.2. Procedure The validation procedure using excavation data is listed below.
The procedure is meant as a guideline rather than rigorous set of
instructions. Deviations from the procedure may be required in
some circumstances.
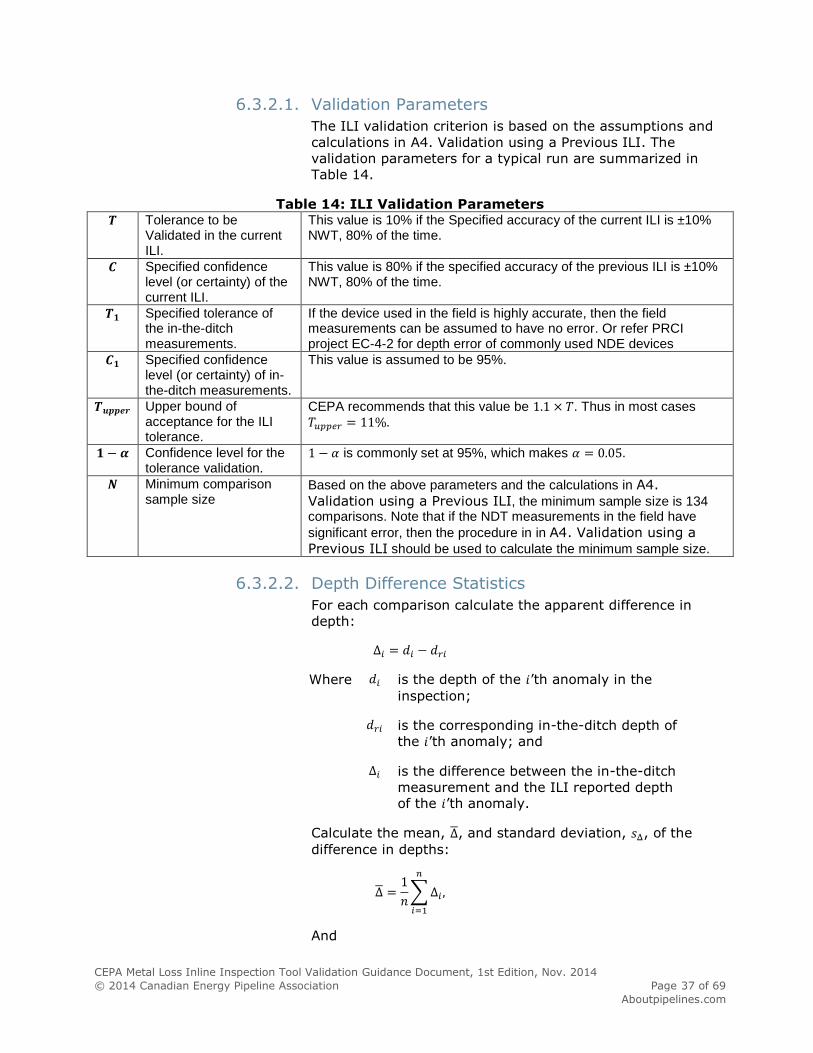
CEPA Metal Loss Inline Inspection Tool Validation Guidance Document, 1st Edition, Nov. 2014 © 2014 Canadian Energy Pipeline Association Page 37 of 69
Aboutpipelines.com
6.3.2.1. Validation Parameters
The ILI validation criterion is based on the assumptions and
calculations in A4. Validation using a Previous ILI. The
validation parameters for a typical run are summarized in
Table 14.
Table 14: ILI Validation Parameters 𝑻 Tolerance to be
Validated in the current ILI.
This value is 10% if the Specified accuracy of the current ILI is ±10% NWT, 80% of the time.
𝑪 Specified confidence level (or certainty) of the current ILI.
This value is 80% if the specified accuracy of the previous ILI is ±10% NWT, 80% of the time.
𝑻𝟏 Specified tolerance of the in-the-ditch measurements.
If the device used in the field is highly accurate, then the field measurements can be assumed to have no error. Or refer PRCI project EC-4-2 for depth error of commonly used NDE devices
𝑪𝟏 Specified confidence level (or certainty) of in-the-ditch measurements.
This value is assumed to be 95%.
𝑻𝒖𝒑𝒑𝒆𝒓 Upper bound of acceptance for the ILI tolerance.
CEPA recommends that this value be 1.1 × 𝑇. Thus in most cases
𝑇𝑢𝑝𝑝𝑒𝑟 = 11%.
𝟏 − 𝜶 Confidence level for the tolerance validation.
1 − 𝛼 is commonly set at 95%, which makes 𝛼 = 0.05.
𝑵 Minimum comparison sample size
Based on the above parameters and the calculations in A4.
Validation using a Previous ILI, the minimum sample size is 134 comparisons. Note that if the NDT measurements in the field have
significant error, then the procedure in in A4. Validation using a
Previous ILI should be used to calculate the minimum sample size.
6.3.2.2. Depth Difference Statistics
For each comparison calculate the apparent difference in
depth:
Δ𝑖 = 𝑑𝑖 − 𝑑𝑟𝑖
Where 𝑑𝑖 is the depth of the 𝑖’th anomaly in the
inspection;
𝑑𝑟𝑖 is the corresponding in-the-ditch depth of
the 𝑖’th anomaly; and
Δ𝑖 is the difference between the in-the-ditch
measurement and the ILI reported depth of the 𝑖’th anomaly.
Calculate the mean, Δ̅, and standard deviation, 𝑠Δ, of the
difference in depths:
Δ̅ =1
𝑛∑ Δ𝑖
𝑛
𝑖=1
,
And

CEPA Metal Loss Inline Inspection Tool Validation Guidance Document, 1st Edition, Nov. 2014 © 2014 Canadian Energy Pipeline Association Page 38 of 69
Aboutpipelines.com
𝑠Δ = √1
𝑛 − 1∑(Δ𝑖 − Δ̅)2
𝑛
𝑖=1
.
6.3.2.3. Acceptance Criteria
The ILI validation criterion is based on the assumptions and
calculations in A4. Validation using a Previous ILI. The ILI
depth accuracy is validated if:
1. The number of available comparisons is 134 or more. 2. The calculated value, 𝑠Δ, of the standard deviation of the
difference in depth is less than 8.6%, however, this
value could be different depending on the performance
specifications provided by the vendor.

CEPA Metal Loss Inline Inspection Tool Validation Guidance Document, 1st Edition, Nov. 2014 © 2014 Canadian Energy Pipeline Association Page 39 of 69
Aboutpipelines.com
A1. Scorecard and Guidance Document
Tables 15 to 27 provide guidance for the completion of the scorecard. Any supporting
documentation would be put on file with the ILI report.
Table 15: Guidance for Parameter #1 Pre-Run Tool Selection Item # 1
Parameter Tool Selection
Stage Pre-run
API Category In-Line System Selection
API 1163 Reference 5.4
Score (F/C/P) “Fail” - Tool not capable of detection or sizing of expected anomaly type(s). “Conditional” - Tool capable of detecting anomaly types but has limited sizing ability. “Pass” – Tool is best available technology for detecting and sizing expected anomaly types(s).
Flowchart Box 1A (Pass Check?)
Use Guidance Document: SP0102-2010 - specifically Table 1. “Pass” if the tool was the tool is the best available technology relative to the purpose of the inspection.
Flowchart Box 1B (Is the impact on data significant?)
“Conditional” if the operator can establish that the integrity of the pipeline is not jeopardized by the use of the specific tool.
Flowchart Box 1C (Is problem localized?)
Go to Box IE if problem is localized: Localized problems in this check are likely due to changes in the pipeline (diameter, wall thickness, etc.) Go to Box 1D is problem is widespread.
Flowchart Box 1D (Can a re-run fix the problem?)
“Fail” if a rerun of a more suited ILI tool would lead to a successful run. If a rerun is unlikely to be successful, then the threat must be address by other means.
Flowchart Box 1E (Can issue be addressed by other means?)
“Conditional” if alternative integrity management tools such as hydrotesting, direct assessment, etc. can adequately address the localized problems. Go to Box 1D of the areas are too numerous or too long to be addressed economically by other means.
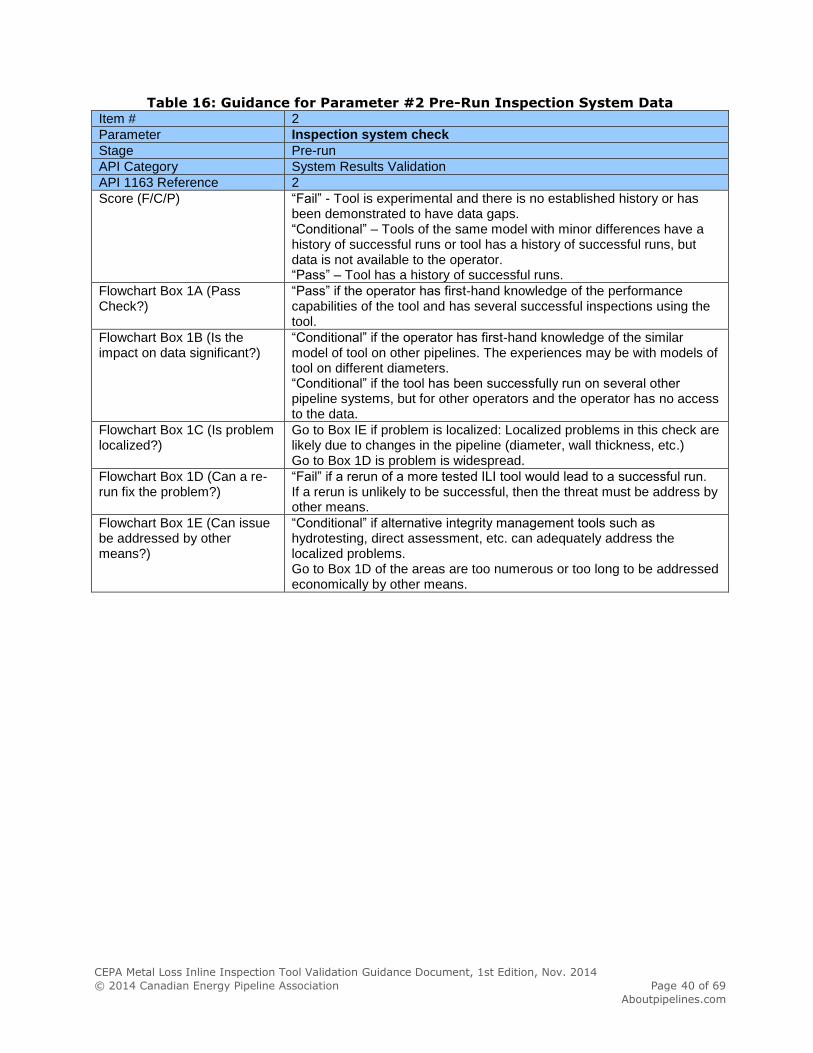
CEPA Metal Loss Inline Inspection Tool Validation Guidance Document, 1st Edition, Nov. 2014 © 2014 Canadian Energy Pipeline Association Page 40 of 69
Aboutpipelines.com
Table 16: Guidance for Parameter #2 Pre-Run Inspection System Data Item # 2
Parameter Inspection system check
Stage Pre-run
API Category System Results Validation
API 1163 Reference 2
Score (F/C/P) “Fail” - Tool is experimental and there is no established history or has been demonstrated to have data gaps. “Conditional” – Tools of the same model with minor differences have a history of successful runs or tool has a history of successful runs, but data is not available to the operator. “Pass” – Tool has a history of successful runs.
Flowchart Box 1A (Pass Check?)
“Pass” if the operator has first-hand knowledge of the performance capabilities of the tool and has several successful inspections using the tool.
Flowchart Box 1B (Is the impact on data significant?)
“Conditional” if the operator has first-hand knowledge of the similar model of tool on other pipelines. The experiences may be with models of tool on different diameters. “Conditional” if the tool has been successfully run on several other pipeline systems, but for other operators and the operator has no access to the data.
Flowchart Box 1C (Is problem localized?)
Go to Box IE if problem is localized: Localized problems in this check are likely due to changes in the pipeline (diameter, wall thickness, etc.) Go to Box 1D is problem is widespread.
Flowchart Box 1D (Can a re-run fix the problem?)
“Fail” if a rerun of a more tested ILI tool would lead to a successful run. If a rerun is unlikely to be successful, then the threat must be address by other means.
Flowchart Box 1E (Can issue be addressed by other means?)
“Conditional” if alternative integrity management tools such as hydrotesting, direct assessment, etc. can adequately address the localized problems. Go to Box 1D of the areas are too numerous or too long to be addressed economically by other means.

CEPA Metal Loss Inline Inspection Tool Validation Guidance Document, 1st Edition, Nov. 2014 © 2014 Canadian Energy Pipeline Association Page 41 of 69
Aboutpipelines.com
Table 17: Guidance for Parameter #3 Pre-Run Planning Item # 3
Parameter Planning
Stage Pre-run
API Category In-Line System Selection
API 1163 Reference 5.3, 7.2
Score (F/C/P) “Fail” - Key elements of Pipeline ILI Compatibility Assessment and Inspection Scheduling not conducted. “Conditional” - Majority of elements of Pipeline ILI Compatibility Assessment and Inspection Scheduling completed but undocumented. “Pass” – All elements of Pipeline ILI Compatibility Assessment and Inspection Scheduling completed and documented.
Flowchart Box 1A (Pass Check?)
Use Guidance Document: SP0102-2010 - specifically sections 4, 5 and 6. “Pass” if the appropriate plan was developed and executed for the expected line conditions.
Flowchart Box 1B (Is the impact on data significant?)
“Conditional” if either the plan was deficient or if the plan was not properly executed, but without affecting the data.
Flowchart Box 1C (Is problem localized?)
Go to Box IE if problem is localized: Localized problems can be caused by event not covered by the plan. Go to Box 1D is problem is widespread.
Flowchart Box 1D (Can a re-run fix the problem?)
“Fail” if the lack of planning in one of the elements described in the RP contributed to compromising data collection. If a rerun is unlikely to be successful, then the threat must be address by other means.
Flowchart Box 1E (Can issue be addressed by other means?)
“Conditional” if alternative integrity management tools such as hydrotesting, direct assessment, etc. can adequately address the localized problems. Go to Box 1D of the areas are too numerous or too long to be addressed economically by other means.
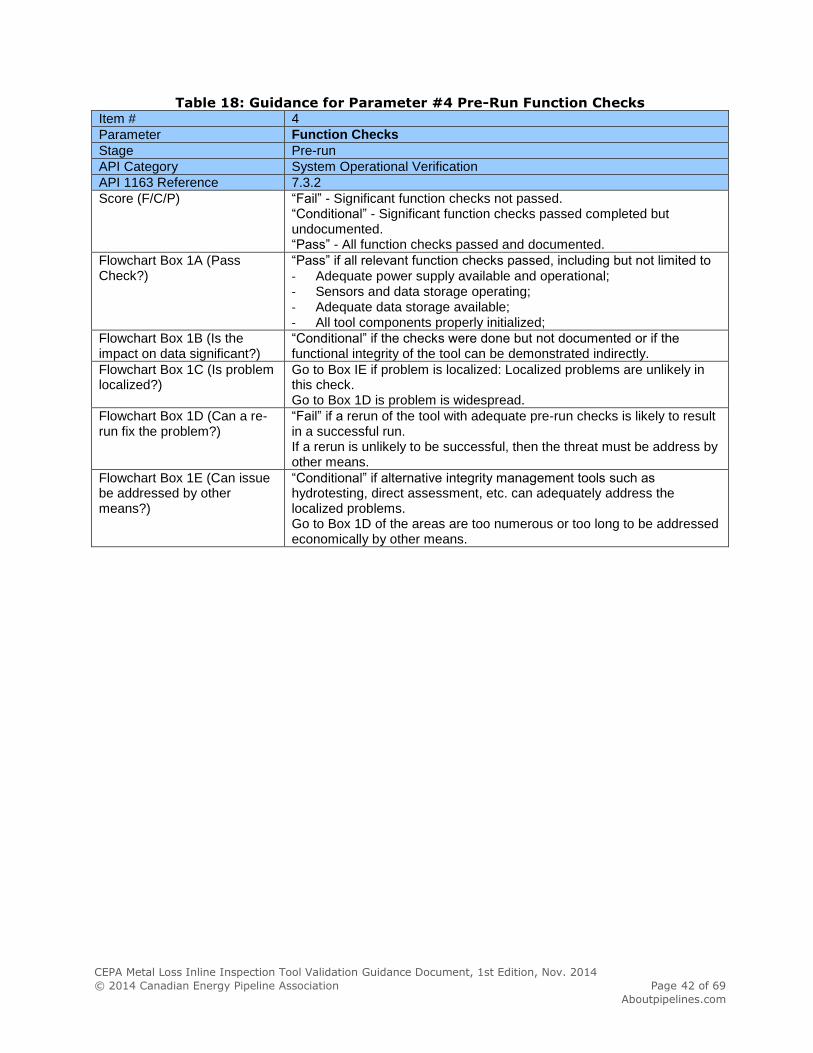
CEPA Metal Loss Inline Inspection Tool Validation Guidance Document, 1st Edition, Nov. 2014 © 2014 Canadian Energy Pipeline Association Page 42 of 69
Aboutpipelines.com
Table 18: Guidance for Parameter #4 Pre-Run Function Checks Item # 4
Parameter Function Checks
Stage Pre-run
API Category System Operational Verification
API 1163 Reference 7.3.2
Score (F/C/P) “Fail” - Significant function checks not passed. “Conditional” - Significant function checks passed completed but undocumented. “Pass” - All function checks passed and documented.
Flowchart Box 1A (Pass Check?)
“Pass” if all relevant function checks passed, including but not limited to
- Adequate power supply available and operational; - Sensors and data storage operating; - Adequate data storage available; - All tool components properly initialized;
Flowchart Box 1B (Is the impact on data significant?)
“Conditional” if the checks were done but not documented or if the functional integrity of the tool can be demonstrated indirectly.
Flowchart Box 1C (Is problem localized?)
Go to Box IE if problem is localized: Localized problems are unlikely in this check. Go to Box 1D is problem is widespread.
Flowchart Box 1D (Can a re-run fix the problem?)
“Fail” if a rerun of the tool with adequate pre-run checks is likely to result in a successful run. If a rerun is unlikely to be successful, then the threat must be address by other means.
Flowchart Box 1E (Can issue be addressed by other means?)
“Conditional” if alternative integrity management tools such as hydrotesting, direct assessment, etc. can adequately address the localized problems. Go to Box 1D of the areas are too numerous or too long to be addressed economically by other means.

CEPA Metal Loss Inline Inspection Tool Validation Guidance Document, 1st Edition, Nov. 2014 © 2014 Canadian Energy Pipeline Association Page 43 of 69
Aboutpipelines.com
Table 19: Guidance for Parameter #5 Pre-Run Mechanical Checks Item # 5
Parameter Mechanical Checks
Stage Pre-run
API Category System Operational Verification
API 1163 Reference 7.3.3
Score (F/C/P) “Fail” - Significant mechanical checks not passed. “Conditional” - Significant mechanical checks completed but undocumented. “Pass” - All mechanical checks passed and documented.
Flowchart Box 1A (Pass Check?)
“Pass” if all relevant mechanical checks passed, including but not limited to: - Visual inspection of tool to ensure it is mechanically sound; - Ensuring electronics are sealed; - Ensuring adequate integrity of cups; - Ensuring all moving parts are functioning as expected;
Flowchart Box 1B (Is the impact on data significant?)
“Conditional” if the checks were done but not documented or if the mechanical integrity of the tool can be demonstrated indirectly.
Flowchart Box 1C (Is problem localized?)
Go to Box IE if problem is localized: Localized problems are unlikely in this check. Go to Box 1D is problem is widespread.
Flowchart Box 1D (Can a re-run fix the problem?)
“Fail” if a rerun of the tool with adequate pre-run checks is likely to result in a successful run. If a rerun is unlikely to be successful, then the threat must be address by other means.
Flowchart Box 1E (Can issue be addressed by other means?)
“Conditional” if alternative integrity management tools such as hydrotesting, direct assessment, etc. can adequately address the localized problems. Go to Box 1D of the areas are too numerous or too long to be addressed economically by other means.

CEPA Metal Loss Inline Inspection Tool Validation Guidance Document, 1st Edition, Nov. 2014 © 2014 Canadian Energy Pipeline Association Page 44 of 69
Aboutpipelines.com
Table 20 Guidance for Parameter #6 in the pipe Procedure Execution Item # 6
Parameter Procedure execution (e.g., pigging procedure/tool speed, etc.)
Stage In the pipe
API Category System Operational Verification
API 1163 Reference 7.4
Score (F/C/P) “Fail” - Inspection not conducted as per inspection procedure with potential material impact to data quality. “Conditional” - Inspection not carried out as per inspection procedure but deviations are not material to data quality. “Pass” - Inspection carried out as per inspection procedure.
Flowchart Box 1A (Pass Check?)
“Pass” – if all relevant checks pass, including but not limited to -Tool run was executed as per the planned pigging procedure; -Line condition (fluid composition, flow rate, temperature, pressure, etc.) was as planned; -Line conditions for tool launch as expected and the launch proceed as planned; -Line conditions for tool receive was as expected and the receive proceed as planned; -Tool speed was within the planned range for the length of the run. -Tool tracking unfold as planned; If deviations did occur, they planned or within expectations.
Flowchart Box 1B (Is the impact on data significant?)
“Conditional” if areas where deviations from the planned procedure are manageable or pose minimal risk to the pipeline.
Flowchart Box 1C (Is problem localized?)
Go to Box IE if problem is localized: Localized problems can be caused by short speed excursions. Go to Box 1D is problem is widespread.
Flowchart Box 1D (Can a re-run fix the problem?)
“Fail” if a rerun of the tool with better planning to address the problem is likely to result in a successful run. If a rerun is unlikely to be successful, then the threat must be address by other means.
Flowchart Box 1E (Can issue be addressed by other means?)
“Conditional” if alternative integrity management tools such as hydrotesting, direct assessment, etc. can adequately address the localized problems. Go to Box 1D of the areas are too numerous or too long to be addressed economically by other means.
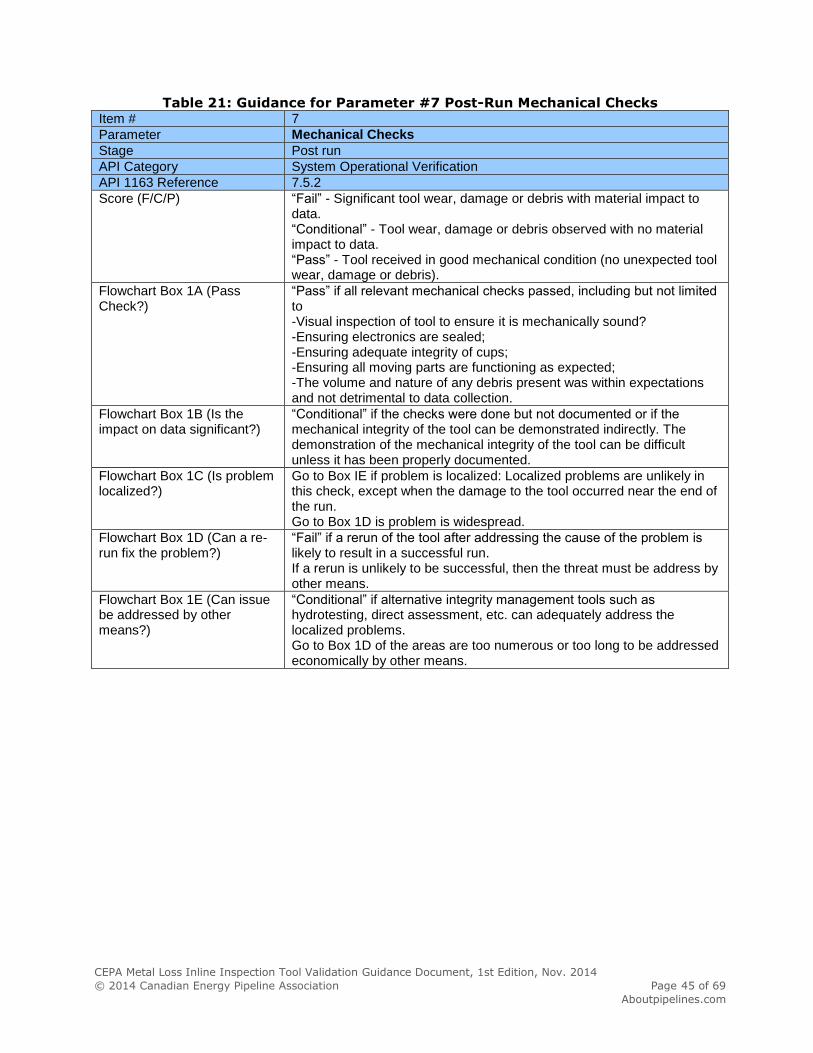
CEPA Metal Loss Inline Inspection Tool Validation Guidance Document, 1st Edition, Nov. 2014 © 2014 Canadian Energy Pipeline Association Page 45 of 69
Aboutpipelines.com
Table 21: Guidance for Parameter #7 Post-Run Mechanical Checks Item # 7
Parameter Mechanical Checks
Stage Post run
API Category System Operational Verification
API 1163 Reference 7.5.2
Score (F/C/P) “Fail” - Significant tool wear, damage or debris with material impact to data. “Conditional” - Tool wear, damage or debris observed with no material impact to data. “Pass” - Tool received in good mechanical condition (no unexpected tool wear, damage or debris).
Flowchart Box 1A (Pass Check?)
“Pass” if all relevant mechanical checks passed, including but not limited to -Visual inspection of tool to ensure it is mechanically sound? -Ensuring electronics are sealed; -Ensuring adequate integrity of cups; -Ensuring all moving parts are functioning as expected; -The volume and nature of any debris present was within expectations and not detrimental to data collection.
Flowchart Box 1B (Is the impact on data significant?)
“Conditional” if the checks were done but not documented or if the mechanical integrity of the tool can be demonstrated indirectly. The demonstration of the mechanical integrity of the tool can be difficult unless it has been properly documented.
Flowchart Box 1C (Is problem localized?)
Go to Box IE if problem is localized: Localized problems are unlikely in this check, except when the damage to the tool occurred near the end of the run. Go to Box 1D is problem is widespread.
Flowchart Box 1D (Can a re-run fix the problem?)
“Fail” if a rerun of the tool after addressing the cause of the problem is likely to result in a successful run. If a rerun is unlikely to be successful, then the threat must be address by other means.
Flowchart Box 1E (Can issue be addressed by other means?)
“Conditional” if alternative integrity management tools such as hydrotesting, direct assessment, etc. can adequately address the localized problems. Go to Box 1D of the areas are too numerous or too long to be addressed economically by other means.

CEPA Metal Loss Inline Inspection Tool Validation Guidance Document, 1st Edition, Nov. 2014 © 2014 Canadian Energy Pipeline Association Page 46 of 69
Aboutpipelines.com
Table 22: Guidance for Parameter #8 Post-Run Function Check Item # 8
Parameter Function Check
Stage Post run
API Category System Operational Verification
API 1163 Reference 7.5.2
Score (F/C/P) “Fail” - Significant function checks not passed. “Conditional” - Significant function checks passed but undocumented. “Pass” - Function checks passed and documented.
Flowchart Box 1A (Pass Check?)
“Pass” if all relevant function checks passed, including but not limited to -Adequate power supply available and operational; -Sensors and data storage operating; -Adequate data storage available; -All tool components functioning as expected.
Flowchart Box 1B (Is the impact on data significant?)
“Conditional” if the checks were done but not documented or if the functional integrity of the tool can be demonstrated indirectly. The demonstration of the functional integrity of the tool can be difficult unless it has been properly documented.
Flowchart Box 1C (Is problem localized?)
Go to Box IE if problem is localized: Localized problems are unlikely in this check, except when the functional failure of the tool occurred near the end of the run. Go to Box 1D is problem is widespread.
Flowchart Box 1D (Can a re-run fix the problem?)
“Fail” if a rerun of the tool with better planning to address the problem is likely to result in a successful run. If a rerun is unlikely to be successful, then the threat must be address by other means.
Flowchart Box 1E (Can issue be addressed by other means?)
“Conditional” if alternative integrity management tools such as hydrotesting, direct assessment, etc. can adequately address the localized problems. Go to Box 1D of the areas are too numerous or too long to be addressed economically by other means.

CEPA Metal Loss Inline Inspection Tool Validation Guidance Document, 1st Edition, Nov. 2014 © 2014 Canadian Energy Pipeline Association Page 47 of 69
Aboutpipelines.com
Table 23: Guidance for Parameter #9 Post-Run Field Data Check Item # 9
Parameter Field Data Check
Stage Post run
API Category System Operational Verification
API 1163 Reference 7.5.3
Score (F/C/P) “Fail” - Tool is unable to meet stated specifications due to significant lack of data integrity. “Conditional” - Tool is unable to meet stated specifications but manageable through further analysis. “Pass” - Tool is able to meet stated specification for entire length of run.
Flowchart Box 1A (Pass Check?)
“Pass” if the data collection met all the basic quality and quantity checks, including but not limited to -Confirmation of continuous data stream for full circumference of pipe; -Basic quality requirements have been met; -The “amount” of data captured in line with expectations;
Flowchart Box 1B (Is the impact on data significant?)
“Conditional” if the checks were done but not documented or if the full data collection by the tool can be demonstrated indirectly.
Flowchart Box 1C (Is problem localized?)
Go to Box IE if problem is localized: Localized problems can be due to short losses of data. Go to Box 1D is problem is widespread.
Flowchart Box 1D (Can a re-run fix the problem?)
“Fail” if a rerun of the tool with better planning to address the problem is likely to result in a successful run. If a rerun is unlikely to be successful, then the threat must be address by other means.
Flowchart Box 1E (Can issue be addressed by other means?)
“Conditional” if alternative integrity management tools such as hydrotesting, direct assessment, etc. can adequately address the localized problems. Go to Box 1D of the areas are too numerous or too long to be addressed economically by other means.

CEPA Metal Loss Inline Inspection Tool Validation Guidance Document, 1st Edition, Nov. 2014 © 2014 Canadian Energy Pipeline Association Page 48 of 69
Aboutpipelines.com
Table 24: Guidance for Parameter #10 Post-Run Data Analysis Processes and
Quality Checks Item # 10
Parameter Data analysis processes: quality checks
Stage Post-run
API Category System Results Validation
API 1163 Reference 8.2.2, Annex C
Score (F/C/P) “Fail” - Results of data analysis quality checks are not acceptable. “Conditional” - Significant data quality checks passed but procedure is undocumented. “Pass” - Data analysis procedures followed; data quality checks passed and documented; the number and severity of anomalies meets expectations.
Flowchart Box 1A (Pass Check?)
“Pass” if data analysis checks are met including but not limited to -Continuous recording of data was for the full pipe circumference; -Sensor response was within expected range(s); -Data analysis processes were executed as per pre-defined procedures; -Analysis was conducted by persons with qualification as agreed; -Automated detection and sizing parameters were used as agreed; -Manual intervention by data analysts was conducted as agreed; -Burst pressure calculations where conducted as agreed; -Correct pipeline parameters (pipe diameter, wall thickness, manufacturer, and grade) were documented and used to undertake the analysis; -The number and type of anomalies reported are consistent with expectations.
Flowchart Box 1B (Is the impact on data significant?)
“Conditional” if the analysis of the data deviated from the planned procedure but that the impact on the data is deemed minimal.
Flowchart Box 1C (Is problem localized?)
Go to Box IE if problem is localized: Localized problems are unlikely in this check or can be corrected by reanalysis of the affected areas. Go to Box 1D is problem is widespread.
Flowchart Box 1D (Can a re-run fix the problem?)
“Fail” if a rerun of the tool is likely to result in a successful run. However, rerunning the tool is unlikely to address problems in the analysis of the data. If a rerun is unlikely to be successful, then the threat must be address by other means.
Flowchart Box 1E (Can issue be addressed by other means?)
“Conditional” if alternative integrity management tools such as hydrotesting, direct assessment, etc. can adequately address the localized problems. Go to Box 1D of the areas are too numerous or too long to be addressed economically by other means.

CEPA Metal Loss Inline Inspection Tool Validation Guidance Document, 1st Edition, Nov. 2014 © 2014 Canadian Energy Pipeline Association Page 49 of 69
Aboutpipelines.com
Table 25: Guidance for Parameter #11 Post-Run Cumulative Assessment Item # 11
Parameter Cumulative Assessment
Stage Post-run
Score (F/A/P) “Fail” - Cumulative impact of "Conditional" passes deemed to materially impact ILI results A - Cumulative impact of "Conditional" passes is unclear and may have impacted ILI results “Pass” - The cumulative impact of all "Conditional" passes, if any, deemed to be tolerable
Flowchart Box 1A (Pass Check?)
“Fail” if the number and nature of any Conditional passes provide a cause for concern on a cumulative basis. Relevant considerations include, but are not limited to -Can data gaps be mitigated effectively using alternative methods? -Can any data gaps actually be addressed through re-running the tool or are line conditions such that similar challenges will remain? -Are any “Conditional” pass issues cumulative in nature? Issues would be considered to be cumulative if one issue magnifies any pre-existing data degradation (such as a tool overspeed in a location where the tool performance is already compromised as a result of debris related sensor lift off). Conversely, issues would not be considered cumulative if their impact on data quality is largely independent (such as a run where the tool overspeeds at launch and experiences debris issues at receive).
Additional Comments:
F = Failing assessment of a parameter that cannot be mitigated
C = Conditional passing score that may be investigated, mitigated, documented, and
deemed tolerable
P = Passing score
A = Ambiguous

CEPA Metal Loss Inline Inspection Tool Validation Guidance Document, 1st Edition, Nov. 2014 © 2014 Canadian Energy Pipeline Association Page 50 of 69
Aboutpipelines.com
A1.1. Verification Examples To illustrate the verification process, this section presents two examples.
A1.1.1. Example 1 The first example is summarized below:
• 100 km NPS 36 run.
• 10 metre over speed at launch.
• Intermittent loss of one sensor (km 1.9 to km 2.0).
• No record of pre-run mechanical and function tests.
• No actionable anomalies; no previous inline inspection.
The completed scorecard is shown in Table 26.
Table 26: Completed Scorecard Example 1 Stage Parameter Score Comment
1 Pre-run Tool selection Pass
2 Pre-run Inspection system Pass
3 Pre-run Planning Pass
4 Pre-run Function check Conditional Pass
-No record -Obtained verbal confirmation -Post run function check passed
5 Pre-run Mechanical check Conditional Pass
-No record -Obtained verbal confirmation -Post run function check passed
6 In pipe Procedure execution
Conditional Pass
-Short over speed (due to line conditions) at launch deemed tolerable since pipe is in station yard and above ground
7 Post- run Mechanical check Pass
8 Post-run Function check Pass
9 Post-run Field data check Pass
10 Post-run Data analysis processes
Conditional Pass
-100 m of data missing (single sensor) -Deepest anomaly non-injurious based on revised tool performance specification
11 Post-run Cumulative assessment
Pass -All “Conditional” scores mitigated -No material cumulative impacts identified
In this example, “Conditional” scores were given for the Pre-run
Function check, Pre-run Mechanical check, Procedure Execution
check and the Post-run Data analysis check.
Although the pre-run checks were undocumented, the post-run
checks were documented, and the tool passed both checks.
Although, the pre-run checks should have been done, the
operator accepted that the condition of the tool as good prior to
the run based on the condition of the tool after the run. The
operator issued a letter to the ILI vendor instructing it to supply
documentation of the pre-run checks on all future runs.

CEPA Metal Loss Inline Inspection Tool Validation Guidance Document, 1st Edition, Nov. 2014 © 2014 Canadian Energy Pipeline Association Page 51 of 69
Aboutpipelines.com
During the running of the tool, a short speed excursion occurred
at the start of the run. The excursion was believed to affect sizing
capabilities of the tool, but would have minimal effect on the
detection capabilities of the tool. Since no metal-loss anomalies
were detected in the area of the speed excursion, the effect on
the data was deemed to be not significant.
In the data analysis process, it was discovered that one sensor
was lost for 100 metres. The loss of one sensor was believed to
affect detection and sizing capabilities of the tool only for metal-
loss anomalies along that sensor’s track. Only very sparse
shallow anomalies were detected in the section of the sensor
loss, and none of the anomalies were in the vicinity of the lost
sensor. The effect on the data was deemed to be not significant.
The final Cumulative Assessment examined the “Conditional”
scores. Since the area of speed excursion and the sensor loss
were along different parts of the pipeline, all aspects of the run
were considered acceptable and none of the issues were
cumulative, the ILI run was accepted.
A1.1.2. Example 2 The second example is:
• 100 km NPS 24 run 1950 asphalt coated line.
• Loss of one sensor bank for last 1 km of inspection.
• All pre-run and post-run tests passed and documented.
• 20 metal loss anomalies reported by ILI tool.
• No actionable anomalies identified; no previous inline
inspection.
The completed scorecard is shown in Table 27.
Table 27: Completed Scorecard Example 2
Stage Parameter Score Comment 1 Pre run Tool selection Pass
2 Pre run Inspection system Conditional -Operator has experience with the 16-inch and 36-inch model of this tool. -The 24-inch model of this tool has been successfully run for several other operating companies, but results of those runs are not available.
3 Pre run Planning Pass
4 Pre run Function check Pass
5 Pre run Mechanical check Pass
6 In pipe Procedure execution Pass
7 Post run Mechanical check Pass
8 Post run Function check Pass
9 Post run Field data check Conditional -Loss of sensor bank for last two km of inspection -Deemed tolerable since section under hydrotest
10 Post run Data analysis processes Conditional -Independent audit identified incorrect threshold set during data analysis process -Data re-analyzed and report re-issued (10,000 metal features identified)
11 Post run Cumulative assessment Pass -All “Conditional” scores mitigated -No material cumulative impacts identified

CEPA Metal Loss Inline Inspection Tool Validation Guidance Document, 1st Edition, Nov. 2014 © 2014 Canadian Energy Pipeline Association Page 52 of 69
Aboutpipelines.com
In Example 2, “Conditional” scores were given for the Inspection
System check, the Post-run Field data check, and the Data
Analysis process check.
Although the operator had no experience with the 24-inch model
of this particular tool, it did have experience with other diameter
models of the same tool (same vendor but different diameter
tools). The operator’s experience with the tools and the vendor
was very good. In addition, the operator received references
from other operators that the 24-inch model of the tool had also
been successfully run for other pipeline systems. The operator, in
this case, deemed that the ILI tool had a sufficient history to be
accepted.
The Field data check revealed that one sensor bank (24 sensors)
failed for two kilometres of the inspection. This loss was deemed
to have a significant impact on the data (node 1B of the
Verification Check-point Flowchart). The deficiency was localized
(node 1C) and was addressed by a hydrostatic test in the
previous year (node 1E). Therefore, despite that the effect on the
data was significant, the integrity concern in the area of the
issues can be addressed by other means. The item was given a
“Conditional” pass.
In the review of the ILI results, it was found that there were no
reported metal-loss anomalies with a depth less than 10% NWT.
Discussions with the ILI vendor’s Manager of Data Analysis, it
was determined that all metal-loss anomalies with a depth less
than 10% NWT were filtered out in error. The operator requested
all anomalies to be included in the report. The vendor added the
shallow anomalies and reissued the report.
The final Cumulative Assessment examined the “Conditional”
scores. Since none of the issues identified in the verification
process were cumulative, the ILI run was accepted.

CEPA Metal Loss Inline Inspection Tool Validation Guidance Document, 1st Edition, Nov. 2014 © 2014 Canadian Energy Pipeline Association Page 53 of 69
aboutpipelines.com
A2. NACE Table

CEPA Metal Loss Inline Inspection Tool Validation Guidance Document, 1st Edition, Nov. 2014 © 2014 Canadian Energy Pipeline Association Page 54 of 69
Aboutpipelines.com
Figure 4: Table 1 from NACE SP 0102-2010 giving Guidance on Tool
Selection for ILI

CEPA Metal Loss Inline Inspection Tool Validation Guidance Document, 1st Edition, Nov. 2014 © 2014 Canadian Energy Pipeline Association Page 55 of 69
aboutpipelines.com
A3. Matching
A3.1. Process overview When validating an ILI inspection using a previous inspection, there are two
ILI run datasets to be compared. Defect matching is done so that defects
from the first run can be compared to the corresponding defect in the
second run. This process involves matching up the girth weld sections,
adjusting the odometer and orientation, and matching the identified
anomalies.
A3.2. Girth Weld Matching Girth welds are very easy to detect with current ILI tools. This means that
the girth weld sections can be matched up from the two ILI runs based on
the length of the sections. Once girth weld sections are matched, the defects
on specific girth weld sections can be matched between runs.
A3.3. Matching of identified Anomalies Once the girth weld sections are matched between the runs, the defects are
matched based on chainage, orientation and depth. Location (as in chainage
and orientation) and size are prioritized over identification (whether the
anomaly is identified as being internal/external on the pipe surface). This
means that external anomalies can be matched to internal anomalies based
on chainage and orientation. This is done because the defect location on the
pipe surface is less certain than the reported chainage and orientation
values.
A3.4. Calculating Anomaly Depth Change With the defects matched between the two runs, it is possible to calculate
the apparent difference in depth of each anomaly. With this information, the
systematic bias and the standard deviation of the difference can be
calculated.
Suppose that we have 𝑛 matched anomalies with depths of 𝑑1, 𝑑2, 𝑑3, … 𝑑𝑛 , as
reported by the current ILI. The depths of the corresponding anomalies in the reference ILI run are 𝑑𝑟1, 𝑑𝑟2, 𝑑𝑟3 … 𝑑𝑟𝑛. The apparent difference in depth
for each anomaly is
Δ𝑖 = 𝑑𝑖 − 𝑑𝑟𝑖
The average difference is
Δ̅ =1
𝑛∑ Δ𝑖
𝑛
𝑖=1
The standard deviation of the difference depth is

CEPA Metal Loss Inline Inspection Tool Validation Guidance Document, 1st Edition, Nov. 2014 © 2014 Canadian Energy Pipeline Association Page 56 of 69
Aboutpipelines.com
𝑠 = √1
𝑛 − 1 ∑(Δ𝑖 − Δ̅)2
𝑛
𝑖=1
A4. Validation using a Previous ILI The validation Process is a check of the results of the ILI data to ensure that it meets
a performance specification. If there is a previous ILI available, then the accuracy of
the ILI depth measurements can be assessed by comparing the depths with the
previous ILI. This Appendix provides the theory and examples of that process.
Although the examples are based on a comparison of the ILI with a previous ILI run,
the theory for comparing the ILI with the results of in-the-ditch depth measurements
is identical.
A4.1. Demonstration of Concept ILI accuracy is typically given in terms of a tolerance and a confidence level.
ILI accuracy is often stated as being “±10% NWT, 80% of the time.” That
accuracy implies that the ILI reported depth values may differ from the true
depth value, but they are clustered in the vicinity about the true value. To
Validate the ILI run, we compare the reported depth values to a set of
reference depth measurements, which may be another ILI. Like the ILI
measurements, the reference measurements have some measurement
errors, and we assume that the reference measurements are clustered in the
vicinity about the true depth values. If the current ILI measurements are
clustered around the reference measurements, then we can conclude that
the ILI measurements are also clustered about the true depth values.
Figure illustrates the comparison of the validation process.
Figure 5: Illustration of the Validation Process
Assumed tolerance, 𝑇𝑟, of
reference measurements
(e.g., ±𝑇𝑟, 80% of time)
Inferred ILI
accuracy
tolerance, ±𝑇
Calculated
difference, ±𝑇Δ,
between ILI and
reference
measurements,
Reference depth
measurements
ILI depth
measurements
True
defect depth

CEPA Metal Loss Inline Inspection Tool Validation Guidance Document, 1st Edition, Nov. 2014 © 2014 Canadian Energy Pipeline Association Page 57 of 69
Aboutpipelines.com
The results of an ILI run are compared to the reference measurements. The
difference between the ILI depths and the reference depths puts an upper
bound on the tolerance, 𝑇, of the ILI tool accuracy.
We assume that we have some reference measurements of the depth of the
metal-loss anomalies from some independent source. Ideally, the reference
measurement should have as little error as possible; however, in practice,
they will have some measurement error associated with them. The measurement error of the reference measurements is ±𝑇𝑟, (𝐶 (%) of the
time). 𝑇𝑟 is the tolerance of the reference measurements and 𝐶𝑟 is the
confidence level or certainty for the tolerance.
If the reference measurements are made in the ditch with a highly accurate
device (such as a laser scanning device), the tolerance should be very small: 𝑇𝑟 ≈ 0. However, if the reference measurements are from a previous ILI,
then the tolerance is likely to be 10% of NWT (𝑇𝑟 = 0.10) and the confidence
level is 80% (𝐶𝑟 = 0.80).
The amount of error, as measured by the standard deviation of the errors, in
a set of measurements is conceptually the “distance” between it and the true
value. The validation process sets an upper bound on the distance between
the ILI measurement and the true depths by estimating the distance
between the ILI measurements and the reference measurement.
A4.2. ILI Error ILI depth measurements are a sum of the true depth plus some error.
𝑑𝐼𝐿𝐼 = 𝑑𝑡 ± 𝐸
The variable ±𝐸 is a random variable with some mean and standard
deviation (the “±” symbol is meant to indicate that the variable is random.
We can separate the error term into a random component and a systematic
bias:
𝑑𝐼𝐿𝐼 = 𝑑𝑡 ± 𝐸𝑟 + 𝑠
Where 𝑑𝐼𝐿𝐼 is the depth measured by the ILI tool;
𝑑𝑡 is the true depth of the anomaly;
𝐸𝑟 is the random error of the ILI tool; and
𝑠 is the systematic (constant) bias.

CEPA Metal Loss Inline Inspection Tool Validation Guidance Document, 1st Edition, Nov. 2014 © 2014 Canadian Energy Pipeline Association Page 58 of 69
Aboutpipelines.com
Figure graphically shows the relationships between random and systematic
components of the error. Both the random and systematic components
contribute to the total ILI error.
Figure 6: Random Error and Bias Component
Contribute to the Error of any ILI Measurement
The random error is different for each metal-loss anomaly and causes the
readings to be scattered about the true value of the depth. Random error
has a mean of zero.
ILI accuracy is typically given in terms of a tolerance and a confidence level.
The specified ILI accuracy of “±10% NWT, 80% of the time” implies that the
standard deviation of ILI error is 7.8%: The 80% confidence level translates to the 𝑧-value of 1.28 for a normal distribution. We then calculate the
standard deviation of the error:
𝜎𝑒𝑟𝑟𝑜𝑟 =𝑇
𝑧
𝜎𝑒𝑟𝑟𝑜𝑟 =10%
1.28= 7.8%
A4.3. Comparison with Reference Measurements Since true depth is unavailable, we compare the ILI measured depth with
some reference depth. Assuming corrosion growth is small compared to the
measurement error, a comparison of the ILI to reference depth can be used
to determine the size of the errors. 𝑑1 = 𝑑𝑡 ± 𝐸𝑟1 + 𝑠1
-30% -20% -10% 0% 10% 20% 30%
Freq
uenc
y
Total ILI error
Bias component
Random component

CEPA Metal Loss Inline Inspection Tool Validation Guidance Document, 1st Edition, Nov. 2014 © 2014 Canadian Energy Pipeline Association Page 59 of 69
Aboutpipelines.com
𝑑2 = 𝑑𝑡 ± 𝐸𝑟2 + 𝑠2
𝑑 = 𝑑2 − 𝑑1 = (±𝐸𝑟1 ± 𝐸𝑟2) + (𝑠2 − 𝑠1)
Note that the plus-minus sign ± indicates a random variable (with mean
zero). If the standard deviation of the random error components, 𝐸𝑟1 and 𝐸𝑟2
are 𝜎𝑟1 and 𝜎𝑟2, then the standard deviation of the sum 𝐸𝑟1 + 𝐸𝑟2 is
±√σ𝑟22 + σ𝑟1
2 . Thus the mean of the Δ𝑑’s is an estimate of the relative
systematic bias as (𝑠2 − 𝑠1), and the standard deviation of the Δ𝑑’s is an
estimate of the random component of the error.
If the reference measurements are from a previous ILI, with an accuracy of ±10% NWT, 80% of the time, then 𝑇𝑟 = 0.10 and 𝐶𝑟 = .80. The standard
deviation, 𝜎𝑟, of the error of the previous ILI is
𝜎𝑟 =𝑇𝑟
𝑧80
=. 10
1.28155= 7.8%
If the specified accuracy of the current ILI is ±10% NWT, 80% of the time, then 𝑇 = 0.10 and 𝐶 = .80. Then we want to demonstrate that the standard
deviation of the current ILI is 𝜎𝐼𝐿𝐼 = 0.078 (7.8%). If the reference
measurements are an ILI, then the standard deviation of the differences, 𝜎Δ,
is given by
𝜎Δ = √𝜎𝑟2 + 𝜎𝐼𝐿𝐼
2 = √(0.078)2 + (0.078)2 = 0.11
Thus we should expect that the standard deviation of the differences
between the current ILI depth measurements and the reference ILI
measurements should be about 0.11 or 11%.
A4.4. Acceptance Criteria The acceptance criterion is the requirements for the acceptance of the ILI
data.
Where 𝐸𝑟1 is the random error component for the previous ILI
measured depth.
𝐸𝑟2 is the random error component for the current ILI
measured depth.
𝑠1 is the systematic bias of the previous ILI measured
depth.
𝑠2 is the systematic bias of the current ILI measured
depth.

CEPA Metal Loss Inline Inspection Tool Validation Guidance Document, 1st Edition, Nov. 2014 © 2014 Canadian Energy Pipeline Association Page 60 of 69
Aboutpipelines.com
A4.4.1. Systematic Bias Criterion This relative bias between two ILI runs does not indicate anything
specifically about either of the ILI runs, but a large relative bias
could indicate that one of the ILI runs does not meet its stated
specification.
To establish how much bias is significant and how one might
adjust for it, consider the following: Assume that the random
component of the error has a normal distribution, then the average of the Δ𝑑’s is the best estimate of the systematic bias, 𝜀𝑠.
Note, however, that the average is only an estimate of the bias:
𝜀𝑠 = Δ𝑑̅̅̅̅ ± 1.96𝜎Δ
√𝑛
Where 1.96𝜎Δ
√𝑛 is the 95% confidence bound of the estimate.
Table 28 outlines the use and significance of the calculated
relative bias.
Table 28: Considerations when Dealing with Systematic Bias Item Description Considerations
1 Usage
Systematic bias can be readily considered when validating an inspection by comparing it to other data sets.
Caution should be used in adjusting for bias when selecting excavations – especially if adjustments result in lower depths.
2 Size of bias Systematic bias may be considered to be significant based on some constant threshold (say 5 - 6% of NWT) and could be associated with tool detection threshold(s).
Alternatively, bias may be viewed in the context of defect depth. That is, if the deepest defect is 10%, a 5% bias may be significant; however, if the deepest defect is 40%, a 5% bias may be less material.
3 Statistical significance
Systematic bias may be considered to be statistically significant based on size of the confidence interval
±1.96σΔd
√n. If Δd̅̅̅̅ > 1.96
σΔd
√n , then the calculated bias is
statistically significant to a 95% confidence level. A calculated bias that is not statistically significant should not be used to adjust the ILI reported depths.
A4.4.2. Random Error Criterion Given an ILI run, we can use the reference measurements to
validate the inspection results. We would like to prove that tolerance, 𝑇, meets the tool specification for the ILI that in
the examples is ±10% NWT, 80% of the time. However, we
cannot statistically prove that the tolerance is exactly 10%;
the best we can do is estimate the tolerance. If the target
tolerance is within the 95% confidence bounds of the
estimate, then we have validated the ILI accuracy.
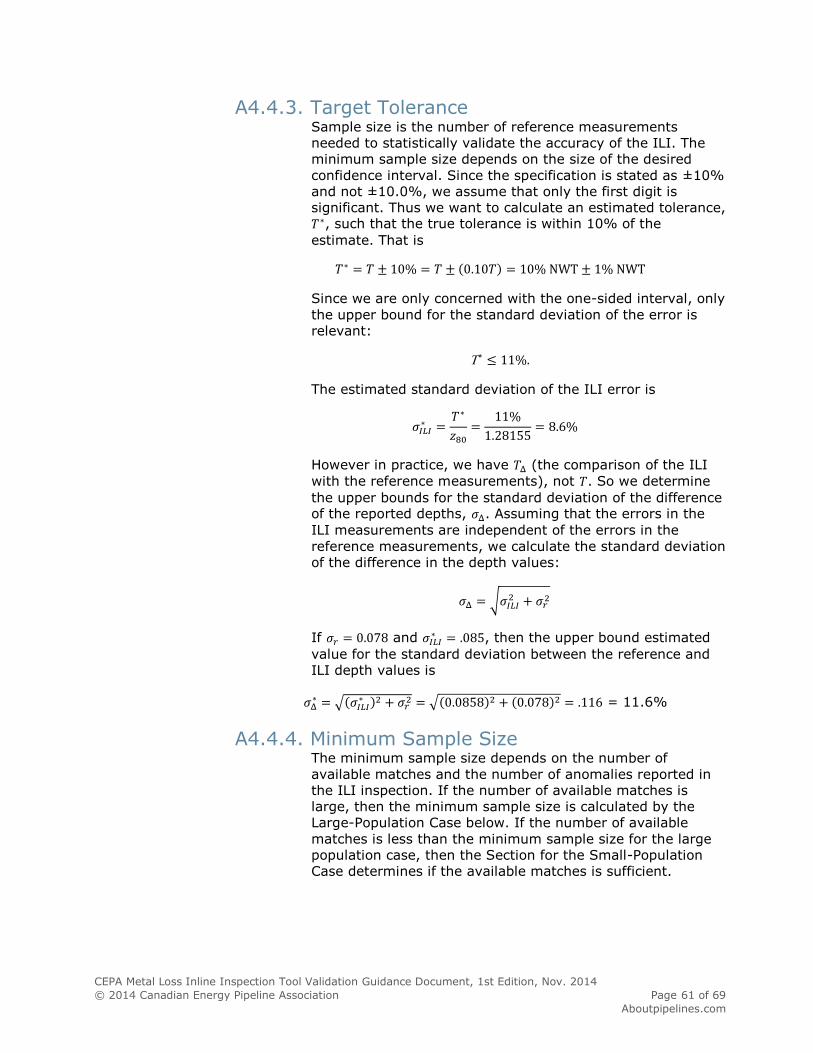
CEPA Metal Loss Inline Inspection Tool Validation Guidance Document, 1st Edition, Nov. 2014 © 2014 Canadian Energy Pipeline Association Page 61 of 69
Aboutpipelines.com
A4.4.3. Target Tolerance Sample size is the number of reference measurements
needed to statistically validate the accuracy of the ILI. The
minimum sample size depends on the size of the desired
confidence interval. Since the specification is stated as ±10%
and not ±10.0%, we assume that only the first digit is
significant. Thus we want to calculate an estimated tolerance, 𝑇∗, such that the true tolerance is within 10% of the
estimate. That is
𝑇∗ = 𝑇 ± 10% = 𝑇 ± (0.10𝑇) = 10% NWT ± 1% NWT
Since we are only concerned with the one-sided interval, only
the upper bound for the standard deviation of the error is
relevant:
∗ ≤ 11%.
The estimated standard deviation of the ILI error is
𝜎𝐼𝐿𝐼∗ =
𝑇∗
𝑧80
=11%
1.28155= 8.6%
However in practice, we have 𝑇Δ (the comparison of the ILI
with the reference measurements), not 𝑇. So we determine
the upper bounds for the standard deviation of the difference of the reported depths, 𝜎Δ. Assuming that the errors in the
ILI measurements are independent of the errors in the
reference measurements, we calculate the standard deviation
of the difference in the depth values:
𝜎Δ = √𝜎𝐼𝐿𝐼2 + 𝜎𝑟
2
If 𝜎𝑟 = 0.078 and 𝜎𝐼𝐿𝐼∗ = .085, then the upper bound estimated
value for the standard deviation between the reference and
ILI depth values is
𝜎Δ∗ = √(𝜎𝐼𝐿𝐼
∗ )2 + 𝜎𝑟2 = √(0.0858)2 + (0.078)2 = .116 = 11.6%
A4.4.4. Minimum Sample Size The minimum sample size depends on the number of
available matches and the number of anomalies reported in
the ILI inspection. If the number of available matches is
large, then the minimum sample size is calculated by the
Large-Population Case below. If the number of available
matches is less than the minimum sample size for the large
population case, then the Section for the Small-Population
Case determines if the available matches is sufficient.

CEPA Metal Loss Inline Inspection Tool Validation Guidance Document, 1st Edition, Nov. 2014 © 2014 Canadian Energy Pipeline Association Page 62 of 69
Aboutpipelines.com
A4.4.4.1. Large Population Case
In the Section IV.4.3, we assume that the
estimate of the tolerance is within ±1% NWT of
the true tolerance: that is the estimated
tolerance is known within a ±1% NWT
confidence interval with a 95% confidence level.
To satisfy that requirement, we need a sample
size of some minimum size.
We have an upper bound for estimate standard deviation, 𝜎Δ
∗ =0.116.
The best estimate of the standard deviation of
the differences between the ILI depth and the
reference depths is
𝑠Δ = √1
𝑛 − 1∑(Δ𝑖 − Δ̅)2
𝑛
𝑖=1
Thus we want
𝑠Δ ≤ 0.116
The Chi-Squared distribution is used for
calculating the confidence interval of an
estimated standard deviation. For a given calculated value of 𝑠 the confidence interval of
the standard deviation is given by
(𝑁 − 1)𝑠Δ2
𝑈;𝑛−12
≤ 𝜎2 ≤ (𝑁 − 1)𝑠Δ
2
𝐿;𝑛−12
Where 𝑁 is sample size;
𝑠Δ2 is the variance of the sample Δ’s;
𝜎2 is variance of the differences in depth if the ILI meets its performance specification 𝜎Δ
2 = (11.04%)2 =
(√7.8%2 + 7.8%2)2; and
𝑈;𝑁−12 and
𝐿;𝑁−12
are the upper and lower 95% confidence bounds of the 𝜒2 distribution with (𝑁 − 1) degrees of freedom.
By rearranging the above inequality and
considering the upper bound limit, we get
(𝑁 − 1)
𝑈;𝑛−12
≤ 𝜎2
𝑠Δ2
Or
𝑠Δ2 ≤
𝜎2
(𝑁 − 1)
𝑈;𝑛−12

CEPA Metal Loss Inline Inspection Tool Validation Guidance Document, 1st Edition, Nov. 2014 © 2014 Canadian Energy Pipeline Association Page 63 of 69
Aboutpipelines.com
If we are comfortable accepting a value for the sample standard deviation, 𝑠, that is ± 10% of
the true standard deviation, 𝜎, and a one-sided
confidence level of 95% (where = 0.10) then
we can solve for 𝑁,
√(𝑁 − 1)
𝑈;𝑁−12
= √11.04
11.60= 0.97.
Solving for the above (iteratively), yields
𝑁 = 513.
So in practice, from a random sample of 513
matches, if the calculated standard deviation of the difference in depth, Δ𝑑, is 11.6% or less,
then we can conclude a Specified accuracy of the
ILI tool of ±10% NWT, 80% of the time is within
the 95% confidence interval of the assessed
tolerance.
A4.4.4.2. Small-Population Case
This section provides guidance if the number of
available matches is less than the minimum
sample size, as calculated in the Large-
population case. Suppose the minimum sample size for the Large-population case is 𝑁. There
are four cases to consider, as shown in Table 29.
Table 29: Small Population Case Samples
Case Population of reported anomalies in the previous reference ILI
Population of reported anomalies in the current ILI
Number of available matches
1 Small (< 1.3𝑁) Small (< 1.3𝑁) Small (< 𝑁)
2 Small (< 1.3𝑁) Large (> 1.3𝑁) Small (< 𝑁)
3 Large (> 1.3𝑁) Small (< 1.3𝑁) Small (< 𝑁)
4 Large (> 1.3𝑁) Large (> 1.3𝑁) Small (< 𝑁)
Case 1: If the number of reported anomalies in
both inspections is small, then the number of
available matches is the population of matches
and those matches are sufficient for the
validation process.
Case 2: If the number of reported anomalies in
the first inspection is small but in the second
inspection is larger, then the number of available
matches is the population of matches and those
matches are sufficient for the validation process.

CEPA Metal Loss Inline Inspection Tool Validation Guidance Document, 1st Edition, Nov. 2014 © 2014 Canadian Energy Pipeline Association Page 64 of 69
Aboutpipelines.com
Case 3: If the number of anomalies in the
previous reference inspection is larger than
current inspection, then some care is required.
The operator must ensure that the current
inspection did not miss a large number of
anomalies. (The operator should revisit the data
analysis verification check to ensure that the
proper procedures were followed in the
preparation of the final report.) The number of
matches is sufficient for the validation process if
when the reference inspection is filtered to
include only anomalies deeper than 20% NWT, a
minimum of 75% of the deeper anomalies in the
reference inspection are matched to the current
inspection.
Case 4: If the number of anomalies in both the
previous reference inspection and the current
inspection are large but only a small number of
matches can be made, then the operator must
ensure that the current inspection did not miss a
large number of anomalies. (The operator should
revisit the Data Analysis Verification check to
ensure that the proper procedures were followed
in the preparation of the final report.) The
number of matches is sufficient for the validation
process if when the reference inspection is
filtered to include only anomalies deeper than
20% NWT, a minimum of 75% of the deeper
anomalies in the reference inspection are
matched to the current inspection.

CEPA Metal Loss Inline Inspection Tool Validation Guidance Document, 1st Edition, Nov. 2014 © 2014 Canadian Energy Pipeline Association Page 65 of 69
Aboutpipelines.com
A5. Opportunities for Future Refinement Table 30 contains a summary of the key considerations for future development of this
procedure.
Table 30: Key Items to Consider for Future Refinement Item No.
Key Consideration Recommendation
1 Standardization of ILI Reporting
Reporting of the activities prior, during, and after the inspection should be standardized. Standardization of the reporting of these activities would result in greater consistency of the verification Process.
2 Documentation of Procedures
Documentation of all checks should be required. Proper documentation is also indicative of the ILI vendor’s diligence in following established Standards and Guidelines.
3 Technology Specific Verification
Separate versions of the scorecard should be developed for MFL and UT inspection tools. Also, separate versions of the scorecard should be developed for liquid and gas pipelines.
4 Refinement of Scorecard ILI vendors and operators should provide standardized reporting and the scorecard should be refined to yield a numeric 0-10 score.
A5.1. Standardization of ILI Reporting The purpose of this Guidance Document is to provide a standard procedure
by which operators may verify and validate ILI runs. The procedure is
intended to be independent of any specific operator, ILI vendor, or ILI
technology. Creating a standard procedure has been hampered by the lack
of standardized reporting by the ILI vendors.
Table 31 shows the variability in the data provided to CEPA for various lines.
The documentation of pre-run cleaning, for example was inconsistent. In
some cases it was documented in the report (as indicated by “yes” in the
table). Sometimes pre-run cleaning was not documented (as indicated by
“no” in the table). Sometimes pre-run cleaning was documented by it saying
it may not have been applicable (as indicated by “Not/App?” in the table).
The significance of the differences is not readily obvious.
An area for future consideration is the potential for reporting of the activities
prior, during, and after the inspection to be standardized. Standardization of
the reporting of these activities would result in greater consistency of the
verification process.

CEPA Metal Loss Inline Inspection Tool Validation Guidance Document, 1st Edition, Nov. 2014 © 2014 Canadian Energy Pipeline Association Page 66 of 69
aboutpipelines.com
Table 31: Summary of Data Provided for Scorecard Line Tool/System
Selection Tool
Setup Speed Debris Funct
-ion Check
Data Check
Excavation Data
Sensors Tool Magnet-ization
Pre-Run Cleaning
Tool Temp.
Company
1-100 no yes yes yes yes no yes yes yes ILI Vendor A
1-100 no yes no yes yes yes no no no ILI Vendor B
1-100 Not/App? yes yes yes yes no yes Not/App? yes ILI Vendor A
1-301 Not/App? yes yes yes yes yes yes Not/App? yes ILI Vendor A
1-301 no yes yes yes yes yes yes yes yes ILI Vendor A
1-350 no yes yes yes no no yes yes yes ILI Vendor A
227 Not/App? yes yes yes yes no yes Not/App? yes ILI Vendor A
227 no yes no yes yes no no no no ILI Vendor C
2-301 Not/App? yes yes yes yes no yes Not/App? yes ILI Vendor A
100 Line
no yes no yes no no no no no ILI Vendor B
100 Line
no no no yes yes no no no no ILI Vendor B
100 Line
no yes no yes yes no no no no ILI Vendor B
350 no yes yes yes no no yes yes yes ILI Vendor A
Note: “Yes” indicates the parameter was mentioned in the report whereas “No” means there was no mention of the
parameter.

CEPA Metal Loss Inline Inspection Tool Validation Guidance Document, 1st Edition, Nov. 2014 © 2014 Canadian Energy Pipeline Association Page 67 of 69
aboutpipelines.com
A5.2. Documentation of Procedures Throughout the verification process, a score of “Pass” requires the
documentation of certain activities either by the operator or the ILI vendor
or both. API 1163 requires that procedures such as the pre-run function
check must be documented. However, none of the ILI reports supplied to
CEPA for this project included any documentation of the function checks.
To make this document usable with the current practice, documentation is
beneficial, but not required. In most of the verification checks, a “Pass”
requires documentation, but a “Conditional” score is possible if the operator
can demonstrate that the checks were done by indirect methods.
Any lack of documentation weakens the verification and validation process.
Without proper documentation of each step, the process is less likely to
withstand an internal or regulatory audit.
An area for development in future versions of this Guidance Document would
be to, in discussions with operators and vendors, include documentation as
part of the standard ILI report. Once full documentation of all processes is
the norm, then the verification and validation processes could be made more
rigorous by requiring documentation.
A5.3. Refinement of Scorecard The initial intention for the scorecard was that it would have less granular
scores than simply “Pass”, “Fail”, or “Ambiguous”. However, as mentioned
above, this Guidance Document is also intended to be independent of any
specific operator, ILI vendor, or ILI technology. As a result, the scorecard
needed to rely on information that was commonly reported by all vendors
and operators. The requirement that the verification and validation
procedure be applicable to the widest possible situations resulted in the
“Pass” or “Fail” scoring.
The verification and validation procedure would benefit from a finer grained
scoring. Such finer grained scoring would enable the procedure to measure
incremental improvement in the acquisition of ILI data and may enable
comparisons of vendors.
For future consideration: If the ILI vendors and operators can provide
standardized reporting, the scorecard could be refined to yield a numeric
0-10 score.
A5.4. Technology Specific Verification The purpose of this document is to provide a standard procedure by which
operators may verify and validate ILI runs. The procedure is intended to be
independent of any specific operator, ILI vendor, or ILI technology. The
broad scope of this document has forced it to be generic in many areas and
precluded it to contain specifics related to a MFL versus UT technology, for
example.

CEPA Metal Loss Inline Inspection Tool Validation Guidance Document, 1st Edition, Sept. 2014 © 2014 Canadian Energy Pipeline Association Page 68 of 69
aboutpipelines.com
In many cases the verification checks need to rely on the ILI vendor to
provide what procedures and checks are required for a specific tool. This
document was unable to include those specifics because they could not be
equally applicable to all vendors and all technologies.
The verification and validation procedure would benefit from a greater
degree of specificity for common technologies. In particular, the process
would benefit from a scorecard that was specific to MFL inspections rather
than generic for all metal-loss inspections. Similarly, a scorecard that is
specific to gas lines and another that is specific to liquid lines would allow a
better verification and validation process.
An area for future consideration would be to develop separate versions of
the scorecard for MFL and UT inspection tools. Also, separate versions of the
scorecard could be developed for liquid and gas pipelines.

CEPA Metal Loss Inline Inspection Tool Validation Guidance Document, 1st Edition, Sept. 2014 © 2014 Canadian Energy Pipeline Association Page 69 of 69
aboutpipelines.com
A6. Scoring – Verification Process Scorecard Summary
Table 33: Verification Process Scorecard Summary
Item Parameter Stage Score
1 Tool Selection Pre-Run F - Tool not capable of detection or sizing of expected anomaly type(s) C - Tool capable of detecting anomaly types but limited sizing or detection abilities of expected anomaly type(s) P - Best available technology for detecting and sizing expected anomaly type(s) identified and used
2 Inspection System
Data
Pre-Run F - Tool is experimental and there is no established history or it has been demonstrated to have deficiencies in addressing the threat C - Same model of tool with minor differences (such as diameter) has a history of successful runs to assess the threat, or the specific model of tool has history of successful runs to assess the threat for other operators, but results of those runs are not available P - Operator firsthand knowledge of the performance capabilities of the tool and has several successful inspections using the tool
3 Planning Pre-Run F - Key elements of Pipeline ILI Compatibility Assessment and Inspection planning not conducted C - Majority of elements of Pipeline ILI Compatibility Assessment and Inspection Scheduling completed but undocumented P - Elements of Pipeline ILI Compatibility and Inspection Scheduling completed and documented
4 Function Checks Pre-Run F - Significant function checks not passed C - Significant function checks passed but checks are undocumented
P - All function checks passed and documented
5 Mechanical Checks Pre-Run F - Significant mechanical checks not passed C - Significant mechanical checks passed but checks are undocumented P - All mechanical checks passed and documented
6 Procedure
Execution (e.g. tool
speed, pigging
procedure, and
etc.)
In the Pipe F - Inspection not carried out as per inspection procedure with potential material impact to data quality C - Inspection not carried out as per inspection procedure but deviations are not material to data quality
P - Inspection carried out as per inspection procedure
7 Mechanical Checks Post-Run F - Significant tool wear, damage or debris with

CEPA Metal Loss Inline Inspection Tool Validation Guidance Document, 1st Edition, Sept. 2014 © 2014 Canadian Energy Pipeline Association Page 70 of 69
aboutpipelines.com
Item Parameter Stage Score material impact to data C - Tool wear, damage or debris observed with no material impact to data P - Tool received in good mechanical condition (with no unexpected tool wear, damage or debris)
8 Function Check Post-Run F - Significant function checks not passed
C - Significant function checks passed were not documented, but that the proper functioning of the tool can be Verified by other means throughout the length of the run P - Function checks passed and documented
9 Field Data Quality
Check
Post-Run F - Tool unable to meet stated specifications due to significant lack of data integrity C - Tool unable to meet stated specifications but manageable through further analysis
P - Tool able to meet stated specifications for entire length of run
10 Data Analysis
Process – Quality
Check
Post-Run F - Results of data analysis quality checks are not acceptable A - Significant data quality checks passed, but quality checks initially undocumented or reanalysis was required P - Data quality checks passed and documented
Related Documents