Full length article Metacognition and system usability: Incorporating metacognitive research paradigm into usability testing * Rakefet Ackerman * , Avi Parush, Fareda Nassar, Avraham Shtub Faculty of Industrial Engineering and Management, TechnioneIsrael Institute of Technology, Haifa, Israel article info Article history: Received 30 August 2014 Received in revised form 19 July 2015 Accepted 20 July 2015 Available online 11 August 2015 Keywords: Usability testing Summative testing Perceived usability Cognitive processes Metacognition Confidence abstract There is an agreement that perceived usability is important beyond actual effectiveness of software systems. Perceived usability is often obtained by self-reports provided after system use. Aiming to improve summative usability testing, we propose a methodology to enhance in-depth testing of users' performance and perceived usability at the task level. The metacognitive research approach allows detailed analysis of cognitive processes. Adapting its methodologies, we propose the Metacognitive Usability Profile (MUP) which includes a comprehensive set of measures based on collecting confidence in the success of each particular task and triangulating it with objective measures. We demonstrate using the MUP by comparing two versions of a project management system. Based on a task analysis we allocated tasks that differ between the versions and let participants (N ¼ 100) use both versions. Although no difference was found between the versions in system-level perceived usability, the detailed task-level analysis exposed many differences. In particular, overconfidence was associated with low performance, which suggests that user interfaces better avoid illusions of knowing. Overall, the study demonstrates how the MUP exposes challenges users face. This, in turn, allows choosing the better task implementation among the examined options and to focus attempts for usability improvement. © 2015 Elsevier Ltd. All rights reserved. 1. Introduction An important part of the quality assessment of software sys- tems, is assessing their usability. According to Nielsen (1993), us- ability consists of learnability, efficiency, memorability, low error rate or easy error recovery, and satisfaction. This conceptualization combines objective and subjective aspects of success in using the examined system (see Albert & Tullis, 2013; for a review). The present study contributes to utilizing this combination in usability tests by adapting methods from the metacognitive research domain. This domain combines objective and subjective measures of cognitive performance in contexts such as learning and problem solving. Perceived usability is central in the subjective aspect of usability and can influence users' decision regarding purchase and extent of system's use (see Hertzum, 2010 for a review). Self-reports are generally considered as good approximations of perceived usability which can be obtained, among others, by having users respond to questionnaires after interacting with the system. Post-interaction self-reports can be system-oriented and/or task-specific. A very popular perceived usability scale which is system-oriented is the ten-item System Usability Scale (SUS; Brooke, 1996). Its strength is in providing a single score that allows comparing perceived us- ability across diverse systems (see Bangor, Kortum, & Miller, 2008 for a review). While the SUS is still much in use, there have been further developments in the evaluation of perceived usability (J. R. Lewis, 2015a, b). Those include primarily questionnaires that are shorter such as the Usability Metric for User Experience (Bosley, 2013; Finstad, 2010; J. R. Lewis, Utesch, & Maher, 2015) and ques- tionnaires that consider the emotional and experiential aspects of usability, such as the Emotional Metric Outcome Questionnaire (Borsci, Federici, Bacci, Gnaldi, & Bartolucci, 2015; J. R. Lewis & Mayes, 2014). Nevertheless, since most developments in assessing system-oriented subjective usability relate to the SUS, we used it in this study as a benchmark reflecting system-oriented perceived usability. * This research was partially supported by the Israeli Science Foundation research grant number 563/09: Designing Visualization for Expert Training in Project Management. * Corresponding author. Faculty of Industrial Engineering and Management, Technion, Technion City, Haifa, 3200003, Israel. E-mail address: [email protected] (R. Ackerman). Contents lists available at ScienceDirect Computers in Human Behavior journal homepage: www.elsevier.com/locate/comphumbeh http://dx.doi.org/10.1016/j.chb.2015.07.041 0747-5632/© 2015 Elsevier Ltd. All rights reserved. Computers in Human Behavior 54 (2016) 101e113

Welcome message from author
This document is posted to help you gain knowledge. Please leave a comment to let me know what you think about it! Share it to your friends and learn new things together.
Transcript

lable at ScienceDirect
Computers in Human Behavior 54 (2016) 101e113
Contents lists avai
Computers in Human Behavior
journal homepage: www.elsevier .com/locate/comphumbeh
Full length article
Metacognition and system usability: Incorporating metacognitiveresearch paradigm into usability testing*
Rakefet Ackerman*, Avi Parush, Fareda Nassar, Avraham ShtubFaculty of Industrial Engineering and Management, TechnioneIsrael Institute of Technology, Haifa, Israel
a r t i c l e i n f o
Article history:Received 30 August 2014Received in revised form19 July 2015Accepted 20 July 2015Available online 11 August 2015
Keywords:Usability testingSummative testingPerceived usabilityCognitive processesMetacognitionConfidence
* This research was partially supported by the Israelgrant number 563/09: Designing Visualization forManagement.* Corresponding author. Faculty of Industrial En
Technion, Technion City, Haifa, 3200003, Israel.E-mail address: [email protected] (R. Ack
http://dx.doi.org/10.1016/j.chb.2015.07.0410747-5632/© 2015 Elsevier Ltd. All rights reserved.
a b s t r a c t
There is an agreement that perceived usability is important beyond actual effectiveness of softwaresystems. Perceived usability is often obtained by self-reports provided after system use. Aiming toimprove summative usability testing, we propose a methodology to enhance in-depth testing of users'performance and perceived usability at the task level. The metacognitive research approach allowsdetailed analysis of cognitive processes. Adapting its methodologies, we propose the MetacognitiveUsability Profile (MUP) which includes a comprehensive set of measures based on collecting confidencein the success of each particular task and triangulating it with objective measures. We demonstrate usingthe MUP by comparing two versions of a project management system. Based on a task analysis weallocated tasks that differ between the versions and let participants (N ¼ 100) use both versions.Although no difference was found between the versions in system-level perceived usability, the detailedtask-level analysis exposed many differences. In particular, overconfidence was associated with lowperformance, which suggests that user interfaces better avoid illusions of knowing. Overall, the studydemonstrates how the MUP exposes challenges users face. This, in turn, allows choosing the better taskimplementation among the examined options and to focus attempts for usability improvement.
© 2015 Elsevier Ltd. All rights reserved.
1. Introduction
An important part of the quality assessment of software sys-tems, is assessing their usability. According to Nielsen (1993), us-ability consists of learnability, efficiency, memorability, low errorrate or easy error recovery, and satisfaction. This conceptualizationcombines objective and subjective aspects of success in using theexamined system (see Albert & Tullis, 2013; for a review). Thepresent study contributes to utilizing this combination in usabilitytests by adapting methods from the metacognitive researchdomain. This domain combines objective and subjective measuresof cognitive performance in contexts such as learning and problemsolving.
Perceived usability is central in the subjective aspect of usabilityand can influence users' decision regarding purchase and extent of
i Science Foundation researchExpert Training in Project
gineering and Management,
erman).
system's use (see Hertzum, 2010 for a review). Self-reports aregenerally considered as good approximations of perceived usabilitywhich can be obtained, among others, by having users respond toquestionnaires after interacting with the system. Post-interactionself-reports can be system-oriented and/or task-specific. A verypopular perceived usability scale which is system-oriented is theten-item System Usability Scale (SUS; Brooke, 1996). Its strength isin providing a single score that allows comparing perceived us-ability across diverse systems (see Bangor, Kortum, & Miller, 2008for a review). While the SUS is still much in use, there have beenfurther developments in the evaluation of perceived usability (J. R.Lewis, 2015a, b). Those include primarily questionnaires that areshorter such as the Usability Metric for User Experience (Bosley,2013; Finstad, 2010; J. R. Lewis, Utesch, & Maher, 2015) and ques-tionnaires that consider the emotional and experiential aspects ofusability, such as the Emotional Metric Outcome Questionnaire(Borsci, Federici, Bacci, Gnaldi, & Bartolucci, 2015; J. R. Lewis &Mayes, 2014). Nevertheless, since most developments in assessingsystem-oriented subjective usability relate to the SUS, we used it inthis study as a benchmark reflecting system-oriented perceivedusability.
R. Ackerman et al. / Computers in Human Behavior 54 (2016) 101e113102
Two challenges are readily apparent with such system-orientedself-reports. First, retrospective assessments of usability may bebiased toward the most recent (or salient) experiences and, thus,not be representative of the overall experience with the system(Hassenzahl & Sandweg, 2004). Second, when used as part ofsummative usability testing, they do not necessarily reflect us-ability at the task level. For example, Callan and Kortum (2014)showed that task-specific SUS scores were significantly higherthan system-oriented SUS scores for the same system. As a result,system-oriented perceived usability can be limited in guiding de-signers in improving usability of a given system. For focusingimprovement attempts on task-level issues, a more fine-tunedmethodology is required.
Summative usability testing typically takes place when theproduct design and development are complete or close tocompletion. Yet, there is still a need for the summative testing tosupport procurement decisions, guide the development of help andsupport systems, and to guide revisions and updates of the product.For these purposes, there is a need for in-depth informationregarding the nature and source of the usability problems in muchmore detailed level (H/egh & Jensen, 2008).
Task-specific subjective measures, such as the After ScenarioQuestionnaire for Computer Usability (J. R. Lewis, 1991) or One-question Post-task questionnaires (Sauro & Dumas, 2009), pro-vide focused usability scores (Sauro& Dumas, 2009; Sauro& Lewis,2009). However, correlations between task-specific objectivemeasures, such as response time, and subjective measures, such aspost-task or post-test satisfaction, are often low or inconsistent(Hornbæk & Law, 2007).
Methodologies from cognitive psychology research have beenadapted to the usability testing domain aimed at extractingdetailed task-specific information. These methodologies are rele-vant because while interacting with a system, people read, reason,solve problems, etc., which are all complex cognitive processesstudied extensively. Of particular relevance for combining objectiveand subjective usability measures are the cognitive think aloud andwalkthrough techniques which are often used for inferring sys-tem's usability based on user's cognitive processes during its use(e.g., Nielsen, 1993).
Think aloud is a well-known technique in cognitive psychologyin which the participants are asked to verbalize their ongoingthinking during task performance (see Ericsson & Simon, 1993).This method is used in the context of usability tests to uncoverthinking processes and subjective experience that cannot beexamined behaviorally (e.g., McDonald, Zhao, & Edwards, 2013).Cognitive walkthrough is a step-by-step process whereby usersevaluate aspects related to perceived usability and understandingwhile using the system (C. Lewis, Polson, Wharton, & Rieman,1990). However, empirical studies that examined the effect ofthinking aloud and cognitive walkthrough on the outcomes of us-ability tests imply that those techniques can be disruptive to taskperformance as reflected by objective measures (e.g., Hertzum,Hansen, & Andersen, 2009; Hertzum & Holmegaard, 2013; see J.R. Lewis, 2014; for a review).
Taken together, findings of research so far imply there is still aneed for a methodology that focuses on exposing the cognitiveprocesses involved while using systems, and yet can reflect bothobjective and subjective aspects at the task level. Applying themetacognitive paradigm to usability testing can provide the bene-fits of using a non-disruptive technique and yet be task-specific. Asoutlined below, recent humanecomputer interaction studies haveanalyzed metacognitive aspects of learning texts on screen versuson paper and provided insights regarding media effects on cogni-tive processing (e.g., Lauterman & Ackerman, 2014). In the presentstudy, we extend this work by adapting the metacognitive
paradigm as an innovative task-specific usability scorecard thattaps into the cognitive processes taking place during interactionwith software tools. We suggest that this detailed analysis cansupport choice among implementation variations and guide furtherdesign iterations even in summative testing.
1.1. Metacognition
The metacognitive approach puts forward the centrality ofsubjective judgment of confidence in the success of performingcognitive tasks (see Bjork, Dunlosky, & Kornell, 2013; for a review).The importance of the extent people feel confident in performingtasks is well acknowledged in the usability literature. Some studiesrefer to users' confidence by inferring it from self-report of assessedsuccess level (e.g., Cassidy, Jones, McMain, Shen, & Vieira, 2014),while others ask about confidence explicitly (e.g., Jones et al., 2008).However, the metacognitive approach goes beyond comparingconfidence levels among conditions or people, by analysis of re-lationships between confidence, actual success rate, and responsetime across several tasks. This is because a central notion in thisliterature is that people use their judgment regarding each subtask(e.g., question) for deciding whether to invest more time or moveon to the next subtask. Unreliable judgments mislead the invest-ment of time and effort, which, in turn, could degrade performance(e.g., Metcalfe & Finn, 2008; Thiede, Anderson, & Therriault, 2003).
There are two common measures for judgment accuracy, cali-bration and resolution, which tap orthogonal aspects of it. Cali-bration bias (or absolute accuracy) reflects deviations of individuals'judgments from their actual chance for success when averagingseveral task items. For example, when participants answer a set ofquestions that each of them is accompanied by a confidence ratingon a 0e100% scale, a positive bias score represents overconfidence(e.g., average confidence of 80% with average success rate of 70%),and a negative bias score represents under-confidence. Overall,people tend to be overconfident (Dunning, Heath, & Suls, 2004;Metcalfe, 1998). Overconfidence is problematic (Dunlosky &Rawson, 2012) because when users think that they perform thetask adequately while in fact they perform it poorly, this illusionwill prevent them from acting to improve their performance (e.g.,open the user manual). Of course, having frustrated users, whohave low confidence in their ability to succeed in performing taskswith the system, is not desirable as well. Thus, we would like tostress that user interfaces (UIs) which facilitate reliable confidenceacross the various tasks have an advantage over those leading toillusion of success, despite the immediate satisfaction that maycome with it.
Resolution (or relative accuracy) reflects the extent in whichjudgments discriminate between successful and unsuccessful tasks.It is measured by correlating judgments and success across taskswithin participant (e.g., Metcalfe & Finn, 2008). Perfect resolution(correlation of 1 within the range �1 to þ1) is achieved whenhigher judgments are assigned for all the successful tasks than tothe tasks in which the participant was less successful. One can behighly overconfident, but still have perfect resolution, and viceversa. For example, let us assume that a given participant provided90% confidence rating whenever performing a task correctly, and85% for all wrong responses. This participant shows perfect reso-lution, since confidence ratings discriminate perfectly between thecorrect and wrong responses. However, if the actual success rateover the entire task was 60%, then this participant showed a pro-nounced calibration bias, in the form of overconfidence.
Another aspect of interest is the association between responsetime, on the one hand, and actual chance for success and subjectiveconfidence, on the other. In the context of metacognitive theory,this analysis is used for studying the underlying heuristic cues that

R. Ackerman et al. / Computers in Human Behavior 54 (2016) 101e113 103
inform confidence judgments (e.g., Ackerman& Koriat, 2011; Kelley& Lindsay, 1993) and the stopping rule people adapt for their effortinvestment (Ackerman, 2014). In the context of eyewitness testi-mony, when asked a question to be answered based onmemory forevent's details, the combination of response time and confidence isused to predict the chance of an information piece to be correct(e.g., Sauerland, Sagana, & Sporer, 2012). The common finding inthese bodies of literature is a negative correlation betweenresponse time and both confidence and actual chance for findingthe correct answer. This is because the easy questions are answeredquickly with high confidence and high chance for success, while themore challenging questions still have lower chance for success evenafter lengthy thinking, and respondents acknowledge it (Ackerman,2014; Koriat, Ma'ayan, & Nussinson, 2006).
Possible reasons for quick responses in task performancemay be(a) the task is simple and requires only a few quick steps (b) the taskis perceived as easy while it is in fact more complicated, or (c) theparticipant has no clue what to do and how to address the task andthus gives it up quickly. We suggest that associating response timewith success rate and confidence in the context of usability testsmay introduce a unique contribution. Wewould expect to find highconfidence which is reliable in case a, overconfidence in case b, andlow and reliable confidence in case c. On the other hand, peoplemay invest a lot of effort trying to perform a task which they do notfind how to perform. After lengthy thinking, people tend to give upand move on to the next task, when possible (Ackerman, 2014).Confidence ratings allow also the distinction between slow re-sponses which stem from failure to find how to address the ques-tion while acknowledging it, and an effortful thought course whichthe participant believes to be successful (reliably or not).
1.2. Metacognitive Usability Profile (MUP)
We propose the Metacognitive Usability Profile (MUP) as amethodology for in depth comparison of two or more UIs intendedfor performing similar detailed tasks. We see the MUP methodol-ogy as particularly appropriate when analyzing complex systemsthat require high-order cognitive processing to be performedaccurately and efficiently. Importantly, like the tasks used in themetacognitive research, the examined tasks should bewell-definedso to allow assessing performance, rather than being flexible (e.g.,graphical design) and/or involve opinion (e.g., beauty assessment).However, success should not be readily apparent (e.g., having theentire picture in a jigsaw puzzle versus having several pieces forwhich the proper place could not be found). This ambiguity in tasksuccess is required for allowing participants to assess their ownchance for success and express it in terms of confidence ratings(0e100%) with variability (not only 0 or 100% like in the jigsawpuzzle example). The experimenters may assess objective successin each task either in terms of dichotomy (0-failure or 100-success)or by a continuous percentage-based (0e100%) grade. This sym-metry between the subjective self-assessment of confidence andobjective assessment of performance allows associating them ineach particular task and across tasks.
In the present study, we demonstrate using the MUP method-ology and its beneficial outcomes by comparing two UIs of a projectmanagement tool (see details below). In this example, projectmanagement could be broken into tasks such as hiring and firingworkers, using a particular resource (e.g., building materials), orassessing the monetary balance in a midpoint of the project. Such asystem satisfies all the above detailed criteria for fitting the MUP.
For analyzing the usability of the selected tasks and comparing itbetween the UIs, the MUP includes traditional usability measures,such as performance, response time, and perceived task difficulty,as well as novel measures for this context, as detailed below. The
combinedmeasure set allows the derivation of a usability scorecard(e.g., Albert & Tullis, 2013) which provides a comprehensive task-specific picture of the differences between the UIs, pointing tothe relative strengths and weaknesses of each one of them.
The measures that comprise the MUP were derived from theMetacognitive Learning Regulation Profile (MLRP) suggested byAckerman and Goldsmith (2011) for comparing learning environ-ments. Ackerman and Goldsmith compared learning texts pre-sented on the computer screen to learning the same texts frompaper by comparing a set of measures comprised of direct (e.g.,success rate) and indirect (calculated) measures (e.g., over-confidence). Importantly, unlike previous studies which attributedscreen inferiority in learning outcomes to technological disadvan-tages (e.g. navigation within the document, markup tools, screenglare), they found that learning efficiency per se did not differ be-tween the media, while the metacognitive processes were inferioron screen. The participants were consistently more overconfidenton screen than on paper, and regulated their efforts less effectively(see also Ackerman & Lauterman, 2012; Lauterman & Ackerman,2014).
The MUP adapts from the MLRP the direct measures of successrate, response time, and confidence (replaces predicting learningoutcome at test). It also adapts the indirect measures of efficiency(points gained per minute of work), calibration bias (over-confidence), and resolution. On top of these, we added to the MUPthe perceived task difficulty, which is particularly relevant for us-ability tests. We also included in the MUP time-success and time-econfidence relationships, which reflect the recent development inmetacognitive research which differentiates quick and slow re-sponses, as explained above.
In summary, considering usability under the umbrella of themetacognitive paradigm could provide UI designers with consid-erable added value in assessing task performance and cognitiveaspects and their relation to perceived usability. In particular, wesuggest that the MUP allows exposing specific usability problemsbeyond what is exposed by system-oriented questionnaires such asthe SUS. This in turn can facilitate allocating candidate tasks forusability improvement by adding unique information to thecurrently known task-specific methods.
1.3. The present study
In the present study, we used the SUS as well as the proposedMUP's comprehensive set of measures for comparing the usabilityof two versions of a project management system. These two ver-sions have exactly the same functionality and share the same serverprogram. Thus, any difference that may be found should beattributed to the UI design.
We started the analysis by choosing the set of tasks to beexamined in both UI versions. We focused on tasks done duringordinary project management and applied task analysis for iden-tifying tasks that are likely to expose differences between theversions. This was done by watching and interviewing participantssampled from the target populationworking with both UI versions.The collected information guided the choice of nine focused tasksdivided into two task sets; each of them was expected to be easierin one version compared with the other.
Each task was a basis for a question participants had to answerby performing this task in the system (see example below). Theexamination was done by collecting confidence in each answer, inaddition to success, response time, and perceived task difficulty.After performing the nine tasks, the 10th task was to perform awhole project management run. Participants rated their confi-dence and perceived task difficulty for the whole run, as for othertasks. Finally, immediately after performing the whole project

R. Ackerman et al. / Computers in Human Behavior 54 (2016) 101e113104
run, participants rated their global experience with the UI bythe SUS.
Previous studies pointed to differences in usability generated byusers' knowledgeability in the target domain (e.g., Sauer, Seibel, &Rüttinger, 2010). Thus, in the present study, the participants werestudents before and after taking the project management course,although none of them had experience with actual project man-agement nor with project management systems.
The MUP was used to examine which UI version and task setgenerated better and more efficient task performance and morereliable confidence judgments. In addition, we compared theoutcome of SUS to the results of the analysis by MUP.
2. Method
2.1. Participants
One hundred Engineering students participated in the study (45females; Mage ¼ 26.1, SD ¼ 2.7; 87 for course credit and the rest forpayment). Forty nine participants graduated the Project Manage-ment course at the Faculty of Industrial Engineering and Manage-ment of the TechnioneIsrael Institute of Technology.
2.2. Materials
2.2.1. The compared user interfacesProject management is a complicated engineering area that is
characterized by requiring taking into account large variety ofconstraints (Davidovitch, Parush, & Shtub, 2006). The two UI ver-sions were two front sides of one project-management system,Project Team Builder (PTB; see Shtub, 2013). They were designed torepresent the various project components in a visual-spatial form,making the information easily accessible. The PTB is used to providestudents in an academic Project Management course with hands-on experience of managing projects in a dynamic stochastic envi-ronment, which takes into account unexpected events, like absenceof a worker with critical skills.
The input of the PTB is a project scenario, which includes tasksthat compose the project with precedence relations among them,cost, target date, and the number of workers required in eachperiod and their expertise. Different scenarios describe differentprojects. Users' aim is to plan the project and to execute it in theshortest time and lowest budget possible.
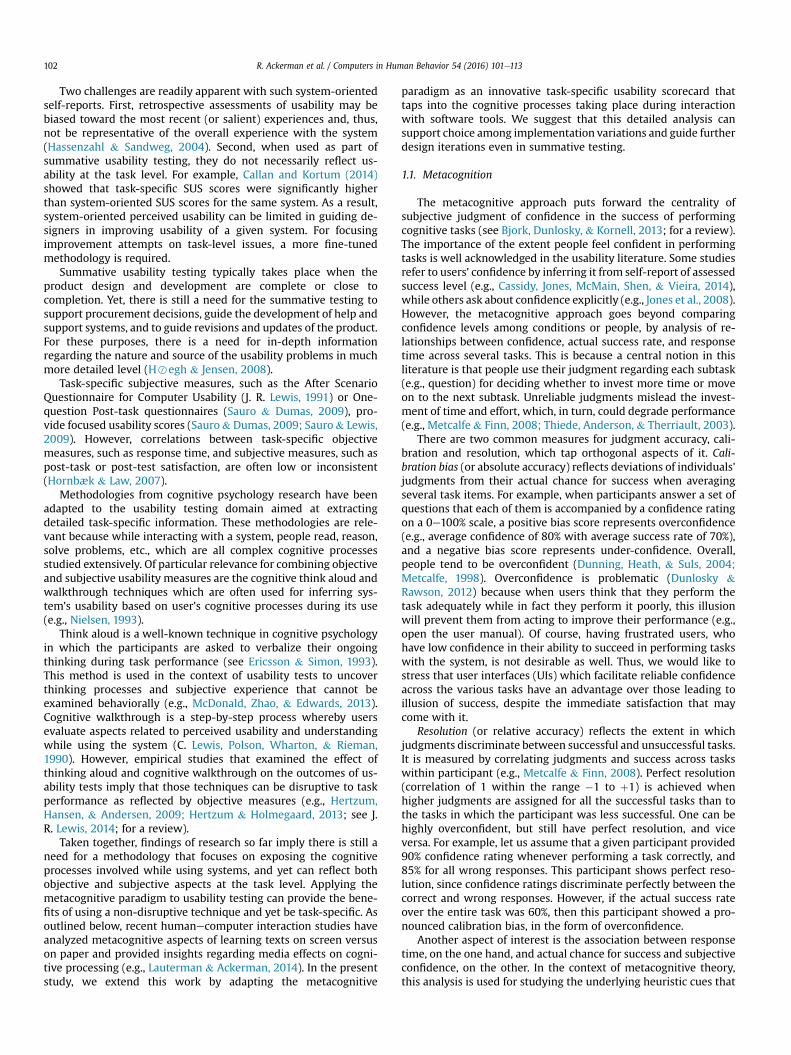
The main difference between the two UI versions is that in oneversion, PTB1, all the information is presented simultaneously onthe screen (see Fig.1). This allows the toolbar to be short (see Fig. 2).In the other version, PTB2, the information regarding the variousproject components (tasks, costs, and resources) is presented inseparated panels. For example, Fig. 3 presents the tasks in theproject. In order to view cost or resources, a dedicated panel shouldbe opened. In the toolbar, the commands and panel activationbuttons appear side by side (see Fig. 4). This version allows spaciouspresentation of each information type, but requires the users tointegrate the information in their memory.
2.2.2. Experimental materialsBesides the two UI versions, there were instructions regarding
the experiment and regarding basic project management termi-nology common to both versions. Participants' work was guidedby a form which included a page for filling in personal details andthe task questions. Each question represented a task chosen bythe task analysis and up to two questions appeared on each page.Each question appeared with a space for an answer, a scale forrating confidence (0e100%), and a Likert scale for rating perceivedtask difficulty (1 e Very easy and 7 e Very difficult). See a
question example with a demonstration how the scales were usedin Fig. 5.
The nine tasks included Set1 (4 tasks), expected to be easier inPTB1, and Set2 (5 tasks), expected to be easier in PTB2. The tasks ofthe two sets were mixed, with their order determined by real-lifeflow of implementing a project simulation run (e.g., firing aworker is possible only after recruitment). The order of the tasks inthe questionnaire is detailed in the Appendix, with the reason forexpecting a particular challenge in either of the two UI versions.
Unlike the first nine tasks, which involved a particular step inthe cycle of project management, the 10th task involved a contin-uous project management based on a given project scenario. Itinvolved performing a task-sequence similar to real-life projectmanagement. The participants had control over project's durationand cost by hiring and firing personnel while planning the re-sources and taking into account the stochastic characteristics of thescenario (e.g., sick leave of a critical worker or an unplanned delayin performing a task). Performance in this task was measured bythe remaining cash at the end of the project (the larger is better)and the estimated duration of the project (the shorter the better).
The final form was the SUS questionnaire including ten ques-tions adapted from Brooke (1996). The experimental session wasguided by a checklist detailing the entire procedure, including atable for documenting response time per question.
2.3. Procedure
The experiment was conducted with each participant sepa-rately. At the beginning of the session, all pages were placed upsidedown next to the participant, pre-arranged according to their orderof use throughout the experiment. With each step, the participantturned over the relevant page. The participant first read the in-structions booklet, and then performed the nine specific tasks andthe project simulation with the first version and first project sce-nario. Response times were captured by the experimenter (in sec-onds) in the above mentioned table, by using a stop watch. Theparticipant then filled in the SUS regarding the first version.Immediately after that, the participant moved on to the secondversion, for which the entire procedure repeated with a differentscenario. Counterbalancing took place allowing all four possiblepairing between the two UI versions and the two scenarios acrossparticipants. The procedure did not allow skipping a question orgetting back to a previous one. In a case of failure to perform a task,the participant was encouraged to answer the question to the bestof his/her knowledge, and convey the perceived low chance forsuccess by the confidence scale. A session took about two hours perparticipant.
3. Results
3.1. Control variables
Compensation type and the scenario used for the projectsimulation had no effect on the results. As well-acknowledged inliterature, despite no difference in success rates, t < 1, males pro-vided higher confidence ratings (M ¼ 83.2, SD ¼ 11.0) than females(M ¼ 74.3, SD ¼ 15.4), t(98) ¼ 3.40, p ¼ .001, were more over-confident (Mmales ¼ 10.4, SD ¼ 12.0; Mfemales ¼ 2.3, SD ¼ 14.1),t(98) ¼ 3.07, p ¼ .003, and provided marginally lower perceivedtask difficulty ratings (Mmales ¼ 2.9, SD ¼ 0.8; Mfemales ¼ 3.2,SD ¼ 0.8), t(98) ¼ 1.96, p ¼ .053. Importantly, there were nointeraction effects between gender and the UI version. Thus, theanalyses reported below were conducted across genders.
Notably, no difference was found in their SUS scores betweenparticipants who graduated a project management course
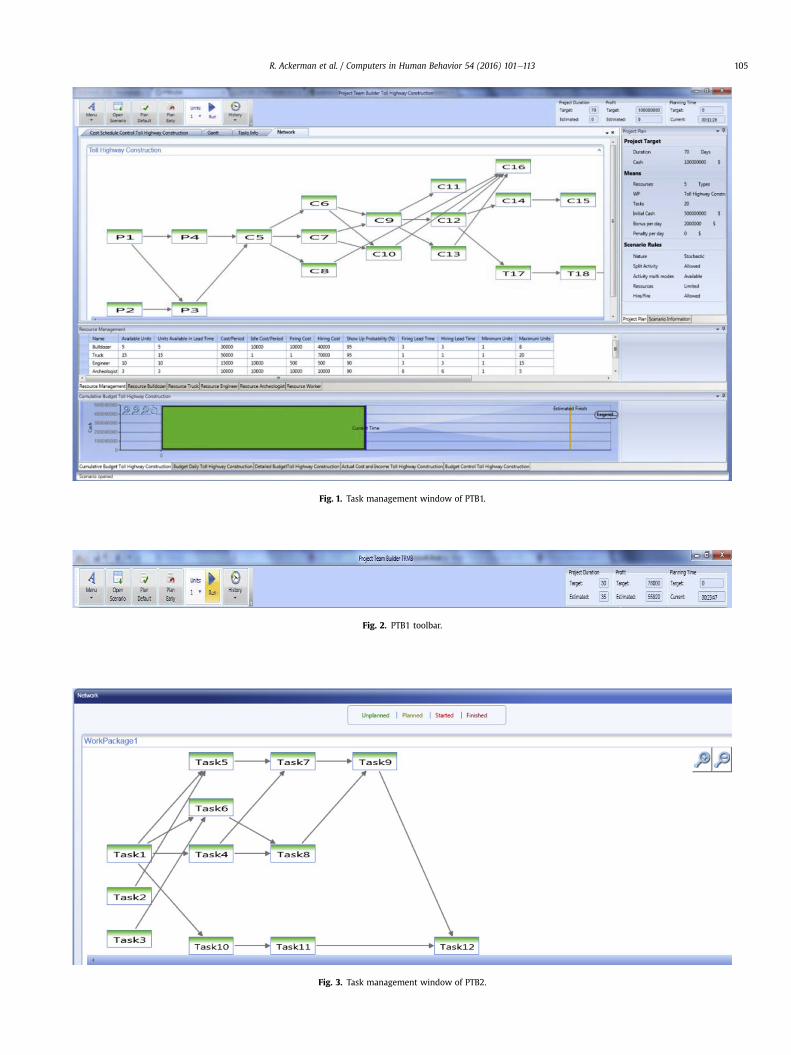
Fig. 1. Task management window of PTB1.
Fig. 2. PTB1 toolbar.
Fig. 3. Task management window of PTB2.
R. Ackerman et al. / Computers in Human Behavior 54 (2016) 101e113 105

Fig. 4. PTB2 toolbar.
Fig. 5. An example of a task and the accompanied questions.
R. Ackerman et al. / Computers in Human Behavior 54 (2016) 101e113106
(knowledgeable) and those who did not take the course yet(novices). In addition, there was no interaction effect with theversion, both Fs < 1. Thus, the two UI versions were perceived bythe participants sub-groups as equally usable (according to theSUS score), regardless of their familiarity with project manage-ment concepts.
Nevertheless, the detailed analysis revealed that the moreknowledgeable participants had higher success rates relative tonovices (Mknowledgeable ¼ 76.1, SD ¼ 12.7; Mnovice ¼ 69.0, SD ¼ 15.8),t(98) ¼ 2.45, p ¼ .016. They were also more confident in their an-swers (Mknowledgeable ¼ 84.3, SD ¼ 11.1; Mnovice ¼ 74.5, SD ¼ 14.5),t(98) ¼ 3.79, p < .0001, and were faster to respond(Mknowledgeable ¼ 77.7, SD ¼ 20.5; Mnovice ¼ 96.7, SD ¼ 26.4),t(98) ¼ 4.02, p < .0001. As a result, the knowledgeable participantswere more efficient (Mknowledgeable ¼ 7.0, SD ¼ 2.4; Mnovice ¼ 5.2,SD ¼ 2.1), t(98) ¼ 4.07, p < .0001, but their overconfidence wasequivalent to that of the novices, t ¼ 1. No interaction effects withwere found the version. Thus, the analyses reported below wereconducted across all participants.
3.2. Comparing the user interfaces
The SUS and the performance of the continuous project man-agement (10th task), represent the system-level measures often
Table 1Means (SD) and ANOVA resultsa when comparing the two user interface versions, PTB1
Measure
System Usability Scale (SUS)Continuous project management (10th task): Success rate, cash amount at the end of
confidence, and perceived task difficultyContinuous project management (10th task): Project duration (in weeks)
a Effect sizes of were measured by h2p (partial eta-squared) with .01, .06, and .14 represe2011). ANOVA was used here for allowing comparison of effect sizes with the following
collected and analyzed in usability tests. The means (and SD) andresults of Analysis of Variance (ANOVA) comparing the two ver-sions in these measures are presented in Table 1. The two versionswere equivalent by the SUS and by most of the measures regardingthe continuous project management task. The only differencefound was the longer project duration with PTB1 than with PTB2.This finding reflects an advantage for PTB2.
A schematic representation of the MUP regarding performanceof the first nine tasks is presented in Fig. 6. The figure provides acomparison between the two UI versions, while the detailedANOVAs are presented in Table 2. In Fig. 6, the MUP of each UIversion is represented by a line, blue with circles for PTB1 and redwith squares for PTB2. Y-axis represents the comparison result,such that the higher is better (for response time the scale wasreversed). MUP components for which it is clear what values areaccounted to be better (e.g., higher success rate, quicker perfor-mance) are represented on the X-axis. Other components (time-success rate and timeeconfidence relationships) are not repre-sented in the figure, but discussed below. Significant differences(p < .05) are marked by a large distance between the points, nodifference is represented by touching points, and a small distancerepresents a marginally significant difference, ps � .08. Panel Apresents the results across the nine tasks. Panel B and Panel Cseparate the results by task set.
and PTB2, by global measures.
PTB1 PTB2 F (1,99) h2p
57.9 (20.8) 56.2 (18.7) <1 .00the project, time to perform the task, Most
measuresMostmeasures
<1 .00
37.3 (4.1) 36.1 (3.3) 7.76** .07
nting small, medium, and large, respectively (based on Cohen, 1988; see Richardson,analyses, which were in a 2� 2 design.

Fig. 6. Metacognitive Usability Profile (MUP). The better UI version, PTB1 or PTB2, by each component overall (Panel A) and when examined by task set (Panel B and Panel C).
R. Ackerman et al. / Computers in Human Behavior 54 (2016) 101e113 107
The schematic view in Panel A of Fig. 6 suggests that the twoversions are equivalent for three measures, PTB1 is better in onemeasure, PTB2 is better in two measures, and there is one marginaladvantage for PTB2. Thus, overall there is some advantage for PTB2,although not a consistent one. The more detailed pictures seen inPanel B and Panel C provide strong support in the task analysiswhich guided the selection of tasks for Set1 and Set2 for exposingdifferences between the versions. In fact, differences between theversions and/or interaction effects with the task set were found inall MUP measures.
Table 2 presents the means (and SD) and ANOVA results of thecombined effects of Version (PTB1 vs. PTB2) and Set (Set1 vs. Set2) on the various measures. Panel B and Panel C of Fig. 6 sum-marize the results and represent graphically the MUP per task set.
The ANOVA results were the basis for drawing Panel B and Panel Cof Fig. 6. The main effect of the set is not reported, because thesets were not designed to be equivalent, and differences, wherefound, may be misleading. Our focus is on allocation usabilityproblems by pointing to the tasks in which the two versionsdiffer.
We now demonstrate the insights that can be drawn from thisdetailed analysis. In this analysis, we emphasize the usability im-plications the MUP components expose.
3.2.1. Overview of MUP componentsPanel B and Panel C of Fig. 6 draw attention to the lower line in
each panel. These lines point to features, those included in theincompatible set for each version, that call for usability

Table 2Means (SD) and ANOVA results when comparing the two user interface versions, PTB1 and PTB2, across the nine tasks and in division for the two task sets, Set1 and Set2.Significance marks under PTB2 refer to the difference from PTB1 in the parallel tasks.
PTB1 PTB2 Version maineffect
Interaction
Set1 Set2 Set1 Set2 F (1,99) h2p F (1,99) h2p
Direct measuresSuccess rate 75.7 (21.8) 67.5 (23.7) 64.8*** (24.5) 83.0*** (18.7) 1.48 .02 53.18*** .35Response time (sec.) 100.9 (44.1) 55.9 (31.5) 125.7*** (52.0) 54.7 (31.5) 5.65* .05 23.0*** .19Perceived task difficulty 3.1 (1.1) 3.1 (1.1) 3.4**(1.1) 2.4***(1.1) 3.15 .03 78.44*** .44Confidence 79.2 (18.7) 76.5 (19.3) 76.4 (13.5) 85.3*** (14.9) 4.96* .05 64.33*** .39Derived measuresEfficiency (points gained per min.) 10.7 (5.5) 25.1 (18.9) 7.6***(4.6) 30.6* (19.1) <1 .00 12.1*** .11Overconfidence 3.6 (20.6) 8.9a (24.3) 11.7a*** (21.7) 2.4** (17.9) <1 .00 18.8*** .16Resolution .47a (.69) .22a (.86) .63a(.68) .47a**(.64) 7.36** .07 <1 .01Timeesuccess relationship �.34a (.78) .22a (.84) �.51a (.79) .05* (.72) 6.46** .06 <1 .01Timeeconfidence relationship �.65a (.67) .42a (.90) �.60a (.74) .06** (.85) 3.51 .03 8.66** .08
*p < .05, **p � .01, ***p � .001.a Significantly larger than zero.
R. Ackerman et al. / Computers in Human Behavior 54 (2016) 101e113108
improvement. Components inwhich the two lines are equivalent oreven switched for a particular set in a particular component (con-fidence and resolution in Set1 and response time in Set2) shouldalso be analyzed with care, for understanding how come theversion that supports this set better in other components loses itsadvantage in these.
3.2.2. Success rate, response time, and efficiencyThe relationship between success rate and response time allows
considering efficiency. For this purpose, we referred to success rateas points, verymuch like in school tests (70% correct is accounted as70 gained points). Dividing the gained points by the invested mi-nutes generated a measure of efficiency, representing the pointsgained per minute of work.
Despite the overall equivalence between the versions, theANOVA which took the task set into account revealed a stronginteraction effect on efficiency. While performing Set1 tasks inPTB1 was faster and more successful than in PTB2, when facingSet2, although the success rate was better in PTB2, response timewas equivalent between the two versions (see Panel B and Panel Cof Fig. 6). This finding points to an advantage for PTB1 over PTB2,and should guide re-design of these features.
The fact that success rates and efficiency were better in thecompatible version for each task set support the task analysis thatled to the choice in these nine tasks for the purpose of demon-strating using theMUP. It highlights that theMUP is sensitive to theusability differences for which UI designers are sensitive too. Thatis, it suggests that if these tasks would have chosen by other criteria(e.g., the most recent development in the system), the MUP wouldallow exposing usability differences between the versions.
3.2.3. Perceived task difficulty and confidenceOne may expect perceived task difficulty and confidence to be
two expressions for the same experience. The results show asimilar, but not identical, pattern of results. In both measures,PTB2 reflected subjectively easier (or marginally easier) perfor-mance of the tasks across the two sets (see Panel A of Fig. 6).Delving into the combined (interaction) effect of version and seton perceived task difficulty and on confidence showed that thedifference between the versions in Set1 was significant forperceived task difficulty, while for confidence the ratings wereequivalent. For Set2 the two measures showed similar advantagefor PTB2. Future studies are called for delving into the meaningparticipants attach to the two measures, and the differential cuesthat underlie each of them.
3.2.4. Confidence, success rate, and overconfidenceAn important finding that the metacognitive analysis highlights
is that differences between the versions in confidence and actualsuccess rates show distinctive patterns. For example, the higherconfidence in PTB 2 (depicted as “better” in the MUP) was notassociated with an expected corresponding higher success rates(see panel A in Fig. 6). Another example is the equivalence inconfidence ratings for the two versions regarding Set1, while per-formance was in fact better in PTB1.
These discrepancies sometimes result in differences in over-confidence (see Panel B and Panel C, but not in Panel A, of Fig. 6).This depends on the variance of success rates and confidence. Thelargest overconfidence bias was foundwith PTB2 for Set1, reflectingthat the incompatibility of Set 1 of tasks to PTB 2 (as was expectedby our task analysis) was not expressed by the participants. In bothversions, the participants werewell calibrated (overconfidence wasnot significantly larger than zero) for the compatible sets andoverconfident for the incompatible ones. This is a demonstration ofthe classic hard-easy effect in the metacognitive literature, bywhich overconfidence is typically larger for the harder tasks thanfor the easier ones (Juslin, Winman, & Olsson, 2000).
3.2.5. Resolution e differentiation between correct and wrongresponses
The hard-easy effect stems from the smaller differences inconfidence ratings between the sets compared with larger differ-ences in success rates. This finding is important because it mayreflect users' difficulty in differentiating between correct andwrong responses. Such a possibility, as will be discussed later, hasimplications for usability analysis.
As explained above, resolution measures exactly this aspect.Success is a dichotomydan answer is either correct orwrongdand confidence is a continuous measure (0e100%). Thus,following Nelson (1984), resolution is typically measured by thea-parametric Gamma correlation (see Masson & Rotello, 2009; fora recent discussion about pros and cons of gamma). Calculatingsuch within-participant gamma correlation requires at least sixitems per participant, and the more is better. In addition, thisstatistic measure removes from the analysis cases in which thereis no variability in either correctness or confidence ratings. In thepresent study there were only four or five items in each set. Thus,we could not use gamma correlations for analyzing resolution perset.
Comparing the two versions across the sets by gamma correla-tion for the participants who showed variability in both measures
R. Ackerman et al. / Computers in Human Behavior 54 (2016) 101e113 109
for both versions, revealed marginally weaker resolution in PTB1(M ¼ .35, SD ¼ .64) than in PTB2 (M ¼ .50, SD ¼ .54), t(82) ¼ 1.77,p ¼ .08. Thus, PTB1 supported somewhat less reliable discrimina-tion between the correct and wrong responses. Importantly, forboth versions the resolution was significantly larger than zero,ps < .0001. It means that the confidence ratings were higher for thecorrect answers than for the wrong answers. This resolves thedoubt rose above, regarding the sensitivity of confidence ratings tosuccess in the tasks.
Delving into resolution differences at the level of the two tasksets was done by approximation to gamma correlation. We splitthe data of each participant into correct and wrong responses, andcalculated the mean confidence for each. In line with the proce-dure of gamma correlation, a positive confidence difference wasmarked as fit (1), and a negative difference was marked as unfit(�1). In addition, we marked as fit (1) cases in which all answerswere correct and all confidence ratings were 100%. Other caseswere marked as reflecting no discrimination (0). This measureallows including in the analysis the data of all participants. Res-olution means (and SDs) per version and set are presented inTable 2. As can be seen, participants' resolution was reliable(significantly larger than zero) by this measure as well. Overall,resolution was significantly weaker in PTB1 than in PTB2. Inter-estingly, while it was significantly weaker for PTB1 whencomparing the versions for task Set2, which is in line with theother measures with incompatible task set, it also tended to beweaker in PTB1 when considering its compatible set, Set1,t(99) ¼ 1.74, p ¼ .08. This should call attention of the designersthat PTB1 did not facilitate as reliable resolution as was achievedby PTB2.
3.2.6. Time-success rate and timeeconfidence relationshipsAs explained above, our purpose of analyzing the relationships
between time, on the one hand, and success rate and confidence, onthe other, is to examine the differences between quick and slowresponses. Like resolution, time-success rate and timeeconfidencerelationships are also calculated by within-participant correlation(or hierarchal linear regression; HLM; see Ackerman & Zalmanov,2012). The gamma correlation between time and success rate wasweaker for PTB1 (M ¼ .02, SD ¼ .51) than for PTB2 (M ¼ �.35,SD ¼ .46), t(85) ¼ 5.11, p < .0001. In PTB1 there was in fact nocorrelation between them, t < 1 for the difference from zero, whilefor PTB2 it was significantly negative, p < .0001. For confidence, thePearson correlationwas alsoweaker with PTB1 (M¼�.10, SD¼ .36)than with PTB2 (M ¼ �.39, SD ¼ .34), t(94) ¼ 6.07, p < .0001, buthere both correlations were significantly negative, p < .005 andp < .0001, respectively, as commonly found in the metacognitiveliterature.
In order to analyze the data by task sets, as done for resolution,we computed a median split of answering time for each participantin each combination of version and task set. We then compared themean success rate and confidence for the short and long answeringtime (for similar analyses, see Koriat, Ackerman, Adiv, Lockl, &Schneider, 2014). The means of time, success rate, and confidenceper version and set are presented in Fig. 7. Differences reportedabove in success rates, response time, confidence, and over-confidence can be seen visually in the figure. Two interestingcontributions of this presentation should be highlighted. Watchingthe left panel reveals that the main source for version differences inSet.1 stems from the lengthy tasks, while the differences betweenthem in Set.2 stems from the quickly provided responses. As for thetime-based slopes, it shows generally high correspondence be-tween time-success and time-confidence slopes and reveals thatthe desirable state of high success rates and reliable confidence for
quick and for slow responses was found only for Set.2 in PTB.2. Suchin-depth examination can guide future usability analysis andimprovements.
Analysis of the slopes tells whether the participants benefitfrom investing longer in the task, or should give up as soon as theyrealize that the task is challenging, as they cannot improve muchby investing more efforts. In order to compare the slopes, wemarked by 1 cases in which lower success rate was found in theshort answering time than in the longer answering time, repre-senting a positive time-success slope. Higher success rate in theshort time was marked as �1, representing a negative slope. Othercases were marked as 0. The same was done for timeeconfidencerelationship. The means (and SD) of the time-success rate andtimeeconfidence relationships and the results of the ANOVA onthese values are presented in Table 2. The main effect of time-esuccess relationship was significant, reflecting the differencebetween the versions reported based on gamma correlation.However, the division by task sets reveals that the relationship wasnegative for Set1 but not for Set2, in both versions. The differencebetween the versions in timeeconfidence relationship wasmarginally significant, p ¼ .064 (see Table 2). The analysis by setshowed a similar pattern to that of success rate, but stronger (seetime-success rate and timeeconfidence relationship line inTable 2). The negative and positive relationships were stronger, andthe case of no relationship was equivalent. It means that with Set1,in order to work efficiently participants should skip answers theycannot provide quickly, while with Set2 they can benefit frominvesting more effort. With this insight the designers shouldanalyze the tasks and examine the source for this difference,aiming to allow participants to benefit from efforts with Set1 aswell.
Notably, as can be seen in Table 2, with PTB1 the strength oftimeeconfidence relationships had weaker correspondence withthe timeesuccess relationship (larger difference between the setsin the former than in the latter). This reflects lower reliability of theconfidence ratings and may be the underlying reason for theweaker resolution with PTB 1 compared with PTB2.
3.3. Examples of usability problems uncovered by the MUP
The present study is focused on introducing the MUP method-ology. Below we provide three examples of how using the MUPuniquely uncovered usability problems.
In Task 1, the participants were asked about the expectedproject duration. In PTB1, the main screen includes the targetproject duration. Many participants provided the target durationas the answer for the first task (success rate was 53%), rather thanthe expected project duration. They responded relatively quickly(55 s) and were quite confident in their answer (83%). As a result,overconfidence in this task was particularly high (30%). In PTB2, incontrast, no information regarding project duration is displayedon the main page. This led to longer search for the answer (73 s),but to higher success rates (73%). Confidence ratings (81%) weremore in line with performance (with less overconfidence of 8%).Importantly, confidence ratings were equivalent in the two UIs,reflecting that participants were unaware of this pronouncedusability difference between the UIs. This case demonstrates asituation in which one UI generates an illusion of knowing, whilethe other UI supports better performance and more reliablejudgment.
The second example for a usability problem can be derived fromFig. 7. In the right panel, it is clear that the quick tasks were thesource for the difference between the versions in Set2. This pre-sentation allows focusing the analysis on these quick tasks. Looking
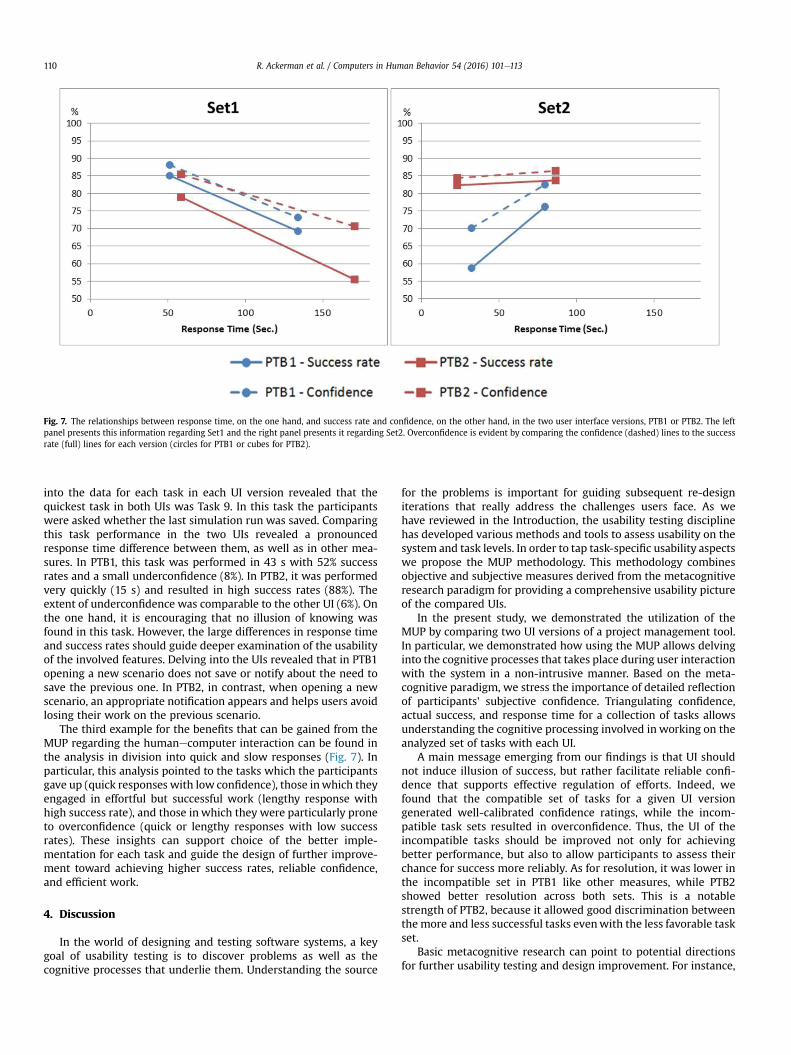
Fig. 7. The relationships between response time, on the one hand, and success rate and confidence, on the other hand, in the two user interface versions, PTB1 or PTB2. The leftpanel presents this information regarding Set1 and the right panel presents it regarding Set2. Overconfidence is evident by comparing the confidence (dashed) lines to the successrate (full) lines for each version (circles for PTB1 or cubes for PTB2).
R. Ackerman et al. / Computers in Human Behavior 54 (2016) 101e113110
into the data for each task in each UI version revealed that thequickest task in both UIs was Task 9. In this task the participantswere asked whether the last simulation run was saved. Comparingthis task performance in the two UIs revealed a pronouncedresponse time difference between them, as well as in other mea-sures. In PTB1, this task was performed in 43 s with 52% successrates and a small underconfidence (8%). In PTB2, it was performedvery quickly (15 s) and resulted in high success rates (88%). Theextent of underconfidence was comparable to the other UI (6%). Onthe one hand, it is encouraging that no illusion of knowing wasfound in this task. However, the large differences in response timeand success rates should guide deeper examination of the usabilityof the involved features. Delving into the UIs revealed that in PTB1opening a new scenario does not save or notify about the need tosave the previous one. In PTB2, in contrast, when opening a newscenario, an appropriate notification appears and helps users avoidlosing their work on the previous scenario.
The third example for the benefits that can be gained from theMUP regarding the humanecomputer interaction can be found inthe analysis in division into quick and slow responses (Fig. 7). Inparticular, this analysis pointed to the tasks which the participantsgave up (quick responses with low confidence), those inwhich theyengaged in effortful but successful work (lengthy response withhigh success rate), and those in which they were particularly proneto overconfidence (quick or lengthy responses with low successrates). These insights can support choice of the better imple-mentation for each task and guide the design of further improve-ment toward achieving higher success rates, reliable confidence,and efficient work.
4. Discussion
In the world of designing and testing software systems, a keygoal of usability testing is to discover problems as well as thecognitive processes that underlie them. Understanding the source
for the problems is important for guiding subsequent re-designiterations that really address the challenges users face. As wehave reviewed in the Introduction, the usability testing disciplinehas developed various methods and tools to assess usability on thesystem and task levels. In order to tap task-specific usability aspectswe propose the MUP methodology. This methodology combinesobjective and subjective measures derived from the metacognitiveresearch paradigm for providing a comprehensive usability pictureof the compared UIs.
In the present study, we demonstrated the utilization of theMUP by comparing two UI versions of a project management tool.In particular, we demonstrated how using the MUP allows delvinginto the cognitive processes that takes place during user interactionwith the system in a non-intrusive manner. Based on the meta-cognitive paradigm, we stress the importance of detailed reflectionof participants' subjective confidence. Triangulating confidence,actual success, and response time for a collection of tasks allowsunderstanding the cognitive processing involved in working on theanalyzed set of tasks with each UI.
A main message emerging from our findings is that UI shouldnot induce illusion of success, but rather facilitate reliable confi-dence that supports effective regulation of efforts. Indeed, wefound that the compatible set of tasks for a given UI versiongenerated well-calibrated confidence ratings, while the incom-patible task sets resulted in overconfidence. Thus, the UI of theincompatible tasks should be improved not only for achievingbetter performance, but also to allow participants to assess theirchance for success more reliably. As for resolution, it was lower inthe incompatible set in PTB1 like other measures, while PTB2showed better resolution across both sets. This is a notablestrength of PTB2, because it allowed good discrimination betweenthe more and less successful tasks evenwith the less favorable taskset.
Basic metacognitive research can point to potential directionsfor further usability testing and design improvement. For instance,

R. Ackerman et al. / Computers in Human Behavior 54 (2016) 101e113 111
hypercorrection is the counterintuitive but robust phenomena thatpeople succeed more in correcting errors in which they are highlyconfident (Butterfield & Metcalfe, 2001). Recent findings suggestthat this is the case when the respondents are familiar with thecorrect answer, but chose to provide another answer retrieved frommemory (Metcalfe & Finn, 2011). These findings imply that inadvanced stages, in which the users have knowledge about usingthe system but nevertheless err in using it with high confidence,these errors are relatively easier to correct.
Another relevant well-established principle in the meta-cognitive literature is the “desirable difficulties” (Bjork, 1994;Bjork et al., 2013). The idea is that when learning is perceived aseasy, people do not invest the effort required for maximizing theirperformance, while when they face a challenge, they engage in thetask more and this enhances performance and improves judgmentreliability. Indeed, a consistent finding with text learning tasks isthat requiring in-depth processing (e.g., writing keywords sum-marizing the text's essence) improves both learning outcomes andresolution (e.g., Thiede et al., 2003). Recently, calibration was alsofound to improve by the same strategies (Lauterman & Ackerman,2014). In addition, knowing in advance the challenge involved inthe expected test (memory of details vs. inference), allowslearners to adjust their learning and judgments accordingly(Thiede, Wiley, & Griffin, 2011). Similarly, problem solvers canassess more reliably their success in an open-ended test format,which requires them to construct the solution, than in a multiple-choice test format, which allows them to use elimination of so-lution options (Mitchum & Kelley, 2010). These findings suggestthat encouraging engagement in the task, may improve bothperformance and judgment reliability. Of course, in UI design, asin learning design, the principle of “desirable difficulties” shouldbe implemented with care and after extensive testing, becausewhile facing a challenge can be beneficial, difficulty may alsohinder users' motivation to use the system (e.g., Yue, Castel, &Bjork, 2013).
Metacognitive aspects of individual differences may be of in-terest for UI designers as well. It is well established that the lesssuccessful people are more prone to overconfidence than thosewho are more successful (e.g., Dunlosky& Rawson, 2012; Dunninget al., 2004). In the present study, no overconfidence differencewas found between the novices and more knowledgeable partic-ipants and there was good calibration for the compatible set ineach version (see overconfidence line in Table 2). These findingsmay be interpreted as suggesting on strength of the examined UIsand the selected tasks, because they did not implant illusion ofknowing in the users, not even in novices, despite the challengingtasks (mean success rates of 60e85%). However, if the same tasksare used for examining experts and novices, the issue of pronenessof the weaker participants to overconfidence should be taken intoaccount, as it may harm success, efficiency, regulatory decisions,etc.
As clearly evident, the task analysis done in preparation for thisstudy was successful in exposing differences between the two UIs,pointing to strengths and weaknesses in both. The commonapproach to A/B testing is obviously to have participants performtypical tasks. By having our selected task set divided into twosubsets of tasks, each more appropriate for one of the UIs, weincreased the sensitivity of the test and found differences thatwould not be uncovered otherwise. We recognize that such anapproach worked well in this study. However, one may wonderhow such an approach can generalize to other usability tests.Specifically, should there be such specific task analysis in any
usability testing? The choice of test tasks is critical in usabilityevaluation, as was shown before by several studies (Cockton &Woolrych, 2001; Hertzum & Jacobsen, 2003; Lindgaard &Chattratichart, 2007). Our findings also highlight task choice as acrucial step that affects the findings and directions for improve-ment. Although using the most typical tasks does fit the MUPmethodology as well, our study suggests that usability researchersshould consider also differentiating tasks by their suitability todifferent UIs for exposing important usability strengths andweaknesses.
However, we waived two considerations that testers imple-menting the MUP should take into account. First, we used only4e5 tasks in each set. The reason for this low number of tasks waspractical, rather than theoretical. We wanted to have a within-participant comparison between the two UIs and thus a sessiontook about two hours. We demonstrated how insights regardingrelationships among the various measures can be obtained evenwith this number of tasks (see above resolution, time-success rate,and timeeconfidence relationships). However, using more taskswould allow straightforward within-participant by correlationsand regressions, which is more in line with the metacognitiveliterature (e.g., Ackerman & Zalmanov, 2012; Metcalfe & Finn,2008) and would also increase the statistical power of othermeasures. This can be achieved by a between-participant designor by inviting participants for more than one meeting. Second, wedid not make the two sets comparable in any aspect. This pre-cluded comparing the sets in the various ANOVAs. By this choicewe demonstrate degrees of freedom in the design of the usabilitytest. However, cases that allow making comparable sets mayexpose differences between the interfaces that we could notdetect.
Another crucial step is the selection of target population. Wechose novice and more knowledgeable undergraduate studentsbecause the tested systems accompany academic courses. However,these systems allow also real-life project management. For exam-ining their commercial value, usability testing by experiencedproject managers is clearly called for. This requires redoing the taskanalysis with a sample from the target population, and changingthe task sets used for the comparison accordingly. The tasks shouldnot be too easy or too hard for the target population, because thiswill generate ceiling or floor effects, respectively, either objectively(success rates) or subjectively (confidence). Both types of variabilityare required for finding differences and thus points forimprovement.
In summary, the system-level measures regarding the fullproject management task (task 10) and the SUS questionnairesshowed similar usability between the two compared UIs. In thisstudy, we suggested additional measures that can be collectedeasily, without disrupting users in their interaction with the sys-tem, for drawing more fine-tuned usability conclusions. Based oninsights from the metacognitive approach, we propose the MUP asa comprehensive methodology for comparison among similarsystems. As demonstrated in this study, the MUP is highly sensi-tive to the possibly that some functions are more effective andsome are less effective within a given UI. Thus, the detailedanalysis allows allocating in each UI the functions that workbetter. The deep understanding of strengths and weakness in theexisting UIs is a powerful basis for designing the next version ofthe system and for developing other systems. Moreover, under-standing the challenges involved in using a chosen UI may guideappropriate focus in user training programs and in guidelines forsupport personnel.

Appendix. Tasks
The list of the nine tasks used to examine the compared user interfaces in the order they were employed. The table lists for each task the preferable version and the usabilityissue in the less preferable version.
Task Preferableversion
Usability issue in the less preferable version
1. What is the estimated duration of theproject?
PTB.2 Misleading duration display
2. Does the estimated duration meetthe end time requirement?
PTB.2 Misleading duration display
3. For each of the following five tasks,list the preceding tasks. (five projecttask identifiers were listed)
PTB.2 Scroll is required for examining the entire network
4. How much money will you have atthe end of week 23 of the project?
PTB.1 The information is absent from themain screen and the design of the icon leading to this information is confusing
5. How many employees of each type(e.g., engineers, mechanics) arerequired for starting the project?
PTB.1 The information regarding employees and their division between tasks is hidden
Type___________________________
Number_______________
6. How many employees are requiredfor each of the tasks to be performedat the initial phase of the project?
PTB.1 Same as in task 5
Task_____________________
Employee Type1____________
Type2_______________
Type3____________
7. Hire employees as you suggested inTask 5
PTB.1 The information is not visible in the main screen. In addition, the icon leading to this option and the pop-upwindow are not clear
8. Open a new scenario named LRMBlocated on the Desktop
PTB.1 The icon is hidden behind the software logo and its design is not clear
9. Was the last simulation run saved? PTB.2 While opening a new scenario there is no warning message that the current run will be lost
R. Ackerman et al. / Computers in Human Behavior 54 (2016) 101e113112
References
Ackerman, R. (2014). The diminishing criterion model for metacognitive regulationof time investment. Journal of Experimental Psychology: General, 143(3),1349e1368.
Ackerman, R., & Goldsmith, M. (2011). Metacognitive regulation of text learning: onscreen versus on paper. Journal of Experimental Psychology: Applied, 17(1),18e32.
Ackerman, R., & Koriat, A. (2011). Response latency as a predictor of the accuracy ofchildren's reports. Journal of Experimental Psychology: Applied, 17(4), 406e417.
Ackerman, R., & Lauterman, T. (2012). Taking reading comprehension exams onscreen or on paper? A metacognitive analysis of learning texts under timepressure. Computers in Human Behavior, 28, 1816e1828.
Ackerman, R., & Zalmanov, H. (2012). The persistence of the fluencyeconfidenceassociation in problem solving. Psychonomic Bulletin & Review, 19(6), 1189e1192.
Albert, W., & Tullis, T. (2013).Measuring the user experience: collecting, analyzing, andpresenting usability metrics (2nd ed.). Waltham, MA: Morgan Kaufmann.
Bangor, A., Kortum, P. T., & Miller, J. T. (2008). An empirical evaluation of the systemusability scale. International Journal of HumaneComputer Interaction, 24(6),574e594.
Bjork, R. A. (1994). Memory and metamemory considerations in the training ofhuman beings. In J. Metcalfe, & A. P. Shimamura (Eds.), Metacognition: Knowingabout knowing (pp. 185e205). Cambridge, MA: MIT Press.
Bjork, R. A., Dunlosky, J., & Kornell, N. (2013). Self-regulated learning: beliefs,techniques, and illusions. Annual Review of Psychology, 64, 417e444.
Borsci, S., Federici, S., Bacci, S., Gnaldi, M., & Bartolucci, F. (2015). Assessing usersatisfaction in the era of user experience: comparison of the SUS, UMUX andUMUX-LITE as a function of product experience. International Journal of Human-Computer Interaction, 31, 484e495.
Bosley, J. J. (2013). Creating a short ‘usability metric for user experience’(UMUX)scale. Interacting with Computers, 25, 317e319.
Brooke, J. (1996). SUS e a quick and dirty usability scale. In P. W. Jordan, B. Thomas,B. A. Weerdmeester, & I. L. McClelland (Eds.), Usability evaluation in industry (pp.189e194). London: Taylor & Francis.
Butterfield, B., & Metcalfe, J. (2001). Errors committed with high confidence arehypercorrected. Journal of Experimental Psychology: Learning, Memory, andCognition, 27(6), 1491e1494.
Callan, A., & Kortum, P. (2014). The relationship between task-level and test-levelsystem usability scale scores. Paper presented at the Proceedings of the Hu-man Factors and Ergonomics Society 58th Annual Meeting.
Cassidy, E. D., Jones, G., McMain, L., Shen, L., & Vieira, S. (2014). Student searchingwith EBSCO discovery: a usability study. Journal of Electronic Resources Librari-anship, 26(1), 17e35.
Cockton, G., & Woolrych, A. (2001). Understanding inspection methods: lessonsfrom an assessment of heuristic evaluation. In A. Blandford, J. Vanderdonckt, &P. D. Gray (Eds.), People and computers XVdinteraction without frontiers (pp.171e191). London: Springer.
Cohen, J. E. (1988). Statistical power analysis for the behavioral sciences. Hillsdale, NJ:Lawrence Erlbaum Associates, Inc.
Davidovitch, L., Parush, A., & Shtub, A. (2006). Simulation-based learning in engi-neering education: performance and transfer in learning project management.Journal of Engineering Education, 95(4), 289e299.
Dunlosky, J., & Rawson, K. A. (2012). Overconfidence produces underachievement:inaccurate self evaluations undermine students' learning and retention.Learning and Instruction, 22(4), 271e280.
Dunning, D., Heath, C., & Suls, J. M. (2004). Flawed self-assessment: implications forhealth, education, and the workplace. Psychological Science in the Public Interest,5(3), 69e106.
Ericsson, K. A., & Simon, H. A. (1993). Protocol analysis: Verbal reports as data.Cambridge, MA: MIT Press.
Finstad, K. (2010). The usability metric for user experience. Interacting with Com-puters, 22(5), 323e327.
Hassenzahl, M., & Sandweg, N. (2004). From mental effort to perceived usability:transforming experiences into summary assessments. In CHI 2004 extendedabstracts on human factors in computing systems (pp. 1283e1286). New York:ACM Press.
Hertzum, M. (2010). Images of usability. International Journal of HumaneComputerInteraction, 26(6), 567e600.
Hertzum, M., Hansen, K. D., & Andersen, H. H. K. (2009). Scrutinising usabilityevaluation: does thinking aloud affect behaviour and mental workload?Behaviour & Information Technology, 28(2), 165e181.
Hertzum, M., & Holmegaard, K. D. (2013). Thinking aloud in the presence of in-terruptions and time constraints. International Journal of HumaneComputerInteraction, 29(5), 351e364.
Hertzum, M., & Jacobsen, N. E. (2003). The evaluator effect: a chilling fact aboutusability evaluation methods. International Journal of HumaneComputer Inter-action, 15(1), 183e204.
Hornbæk, K., & Law, E. L. (2007). Meta-analysis of correlations among usabilitymeasures. In Proceedings of the SIGCHI conference on human factors in computingsystems (pp. 617e626). New York, NY: ACM Press.
H/egh, R. T., & Jensen, J. J. (2008). A case study of three software projects: cansoftware developers anticipate the usability problems in their software?Behaviour & Information Technology, 27(4), 307e312.
Jones, M., Jones, S., Bradley, G., Warren, N., Bainbridge, D., & Holmes, G. (2008).ONTRACK: dynamically adapting music playback to support navigation. Per-sonal and Ubiquitous Computing, 12(7), 513e525.
R. Ackerman et al. / Computers in Human Behavior 54 (2016) 101e113 113
Juslin, P., Winman, A., & Olsson, H. (2000). Naive empiricism and dogmatism inconfidence research: a critical examination of the hardeeasy effect. Psycho-logical Review, 107(2), 384e396.
Kelley, C. M., & Lindsay, D. S. (1993). Remembering mistaken for knowing: ease ofretrieval as a basis for confidence in answers to general knowledge questions.Journal of Memory and Language, 32, 1e24.
Koriat, A., Ackerman, R., Adiv, S., Lockl, K., & Schneider, W. (2014). The effects ofgoal-driven and data-driven regulation on metacognitive monitoring duringlearning: a developmental perspective. Journal of Experimental Psychology:General, 143(1), 386e403.
Koriat, A., Ma'ayan, H., & Nussinson, R. (2006). The intricate relationships betweenmonitoring and control in metacognition: lessons for the cause-and-effectrelation between subjective experience and behavior. Journal of ExperimentalPsychology: General, 135(1), 36e68.
Lauterman, T., & Ackerman, R. (2014). Overcoming screen inferiority in learning andcalibration. Computers in Human Behavior, 35, 455e463.
Lewis, J. R. (1991). Psychometric evaluation of an after-scenario questionnaire forcomputer usability studies: the ASQ. ACM SIGCHI Bulletin, 23(1), 78e81.
Lewis, J. R. (2014). Usability: lessons learned… and yet to be learned. InternationalJournal of HumaneComputer Interaction, 30, 663e684.
Lewis, J. R. (2015a). Introduction to the special issue on usability and user experi-ence: methodological evolution. International Journal of HumaneComputerInteraction, 31.
Lewis, J. R. (2015b). Introduction to the special issue on usability and user experi-ence: psychometrics. International Journal of HumaneComputer Interaction, 31,481e483.
Lewis, J. R., & Mayes, D. K. (2014). Development and psychometric evaluation of theemotional metric outcomes (EMO) questionnaire. International Journal ofHumaneComputer Interaction, 30(9), 685e702.
Lewis, C., Polson, P. G., Wharton, C., & Rieman, J. (1990). Testing a walkthroughmethodology for theory-based design of walk-up-and-use interfaces. In Pro-ceedings of the ACM CHI '90 Conference (pp. 235e242). New York, NY: ACM Press.
Lewis, J. R., Utesch, B. S., & Maher, D. E. (2015). Measuring perceived usability: theSUS, UMUX-LITE, and AltUsability. International Journal of HumaneComputerInteraction, 31, 496e505.
Lindgaard, G., & Chattratichart, J. (2007). Usability testing: What have we overlooked?(Paper presented at the Proceedings of the SIGCHI Conference on Human Fac-tors in Computing Systems).
Masson, M. E. J., & Rotello, C. M. (2009). Sources of bias in the GoodmaneKruskalgamma coefficient measure of association: implications for studies of meta-cognitive processes. Journal of Experimental Psychology: Learning, Memory, andCognition, 35(2), 509e527.
McDonald, S., Zhao, T., & Edwards, H. M. (2013). Dual verbal elicitation: the com-plementary use of concurrent and retrospective reporting within a usabilitytest. International Journal of HumaneComputer Interaction, 29(10), 647e660.
Metcalfe, J. (1998). Cognitive optimism: self-deception or memory-basedprocessing heuristics? Personality and Social Psychology Review, 2(2), 100e110.
Metcalfe, J., & Finn, B. (2008). Evidence that judgments of learning are causallyrelated to study choice. Psychonomic Bulletin & Review, 15(1), 174e179.
Metcalfe, J., & Finn, B. (2011). People's hypercorrection of high-confidence errors:did they know it all along? Journal of Experimental Psychology: Learning, Mem-ory, and Cognition, 37(2), 437e448.
Mitchum, A. L., & Kelley, C. M. (2010). Solve the problem first: constructive solutionstrategies can influence the accuracy of retrospective confidence judgments.Journal of Experimental Psychology: Learning, Memory, and Cognition, 36(3),699e710.
Nelson, T. O. (1984). A comparison of current measures of the accuracy of feeling-of-knowing predictions. Psychological Bulletin, 95(1), 109e133.
Nielsen, J. (1993). Usability engineering. Boston, MA: Academic Press.Richardson, J. T. E. (2011). Eta squared and partial eta squared as measures of
effect size in educational research. Educational Research Review, 6(2),135e147.
Sauerland, M., Sagana, A., & Sporer, S. L. (2012). Assessing nonchoosers' eyewitnessidentification accuracy from photographic showups by using confidence andresponse times. Law and Human Behavior, 36(5), 394e403.
Sauer, J., Seibel, K., & Rüttinger, B. (2010). The influence of user expertise andprototype fidelity in usability tests. Applied Ergonomics, 41(1), 130e140.
Sauro, J., & Dumas, J. S. (2009). Comparison of three one-question, post-task us-ability questionnaires. In Proceedings of the SIGCHI conference on human factorsin computing systems (pp. 1599e1608). New York, NY: ACM Press.
Sauro, J., & Lewis, J. R. (2009). Correlations among prototypical usability metrics:evidence for the construct of usability. In Proceedings of the SIGCHI conference onhuman factors in computing systems (pp. 1609e1618). New York, NY: ACM Press.
Shtub, A. (2013). Simulation based training (SBT)ethe next generation of projectmanagement training. PM World Journal, II(11), 1e11.
Thiede, K. W., Anderson, M. C. M., & Therriault, D. (2003). Accuracy of metacognitivemonitoring affects learning of texts. Journal of Educational Psychology, 95(1),66e73.
Thiede, K. W., Wiley, J., & Griffin, T. D. (2011). Test expectancy affects meta-comprehension accuracy. British Journal of Educational Psychology, 81(2),264e273.
Yue, C. L., Castel, A. D., & Bjork, R. A. (2013). When disfluency isdand is notdadesirable difficulty: the influence of typeface clarity on metacognitive judg-ments and memory. Memory & Cognition, 41(2), 229e241.
Related Documents