Metabotyping of Biofluids Reveals Stress-Based Differences in Gut Permeability in Healthy Individuals Serge Rezzi, †,# Franc ¸ois-Pierre Martin, †,# Carmen Alonso, ‡ Mar Guilarte, ‡ Marı ´a Vicario, ‡ Laura Ramos, ‡ Cristina Martı ´nez, ‡ Beatriz Lobo, ‡ Esteban Saperas, ‡ Juan Ramo ´n Malagelada, ‡ Javier Santos, ‡ and Sunil Kochhar* ,† Bioanalytical Science Department, Metabonomics & Biomarkers Group, Nestle ´ Research Center, Lausanne, Switzerland, and Digestive Diseases Research Unit, Institut de Recerca, Department of Gastroenterology; Hospital Universitari Vall d’Hebron, Universitat Auto `noma de Barcelona, Department of Medicine, Barcelona, Spain Received June 15, 2009 Life stress promotes gut dysfunction, but underlying biochemical events are not well-understood. In the present study, we describe the metabolic events associated with background stress and its potential influence on the response to novel incoming stress stimulus in healthy subjects. A 15 min cold pain test was carried out in healthy men and women stratified according to low (LS; n ) 21) and moderate background stress (MS; n ) 9) during jejunal segmental perfusion. Cold pain induced a stronger psychological response in MS compared to LS subjects, but similar increases in heart rate and blood pressure. Urine and plasma were analyzed using 1 H NMR-based metabonomics. Basal stress levels were imprinted in the metabolic profiles indicating different energy and lipid homeostasis. Cold pain increased gut permeability, as determined by mannitol and xylose levels, the response being greater in LS subjects. Moreover, the rate of plasma clearance of mannitol and xylose was dependent on background stress level and gender. In addition, cold pain modulated the levels of circulating ketone bodies, Krebs’s cycle intermediates, glucose, and the glucogenic alanine and lactate, which brings further evidence of an alteration of energy homeostasis. Therefore, unravelling life stress with metabonomics may provide a system biology basis for the clinical management and therapeutic surveillance of gut health and disorders. Keywords: Chemometrics • Cold water stress • Gut permeability • Metabolomics • Metabonomics • NMR • OPLS • Life stress Introduction The pandemy of functional digestive diseases and their heterogeneous clinical manifestations, coupled with our in- complete understanding on their pathogenesis, explains the current lack of therapeutic tools providing long-standing clinical remission and the progressive burden on healthcare systems. 1,2 Such limitations have promoted research initiatives aimed at deciphering the mechanisms involved in their origin. Particular attention has been paid to the pathogenesis of the irritable bowel syndrome (IBS), the most common functional disorder diagnosed by gastroenterologists, affecting 10-25% of people worldwide. 1,2 As a consequence, recent findings reveal that a prominent feature in the intestine of certain IBS subgroups, the presence of mucosal inflammation and immune activation, may be linked to IBS symptoms, 3-5 challenging the traditional assumption on its strict nonorganic nature. The development of mucosal inflammation and immune activation in IBS is reckoned as multifactorial, and seemingly implicates complex interactions of genetic, biological, socio- cultural and environmental determinants. 6-9 Among them, the role of psychosocial stress as a key factor in the pathophysiology of IBS requires further insight. Although disputed, epidemio- logical evidence suggests that life stress is related to the onset, persistence, severity, and prognosis of IBS. 10-13 Moreover, growing empirical and clinical observations provide additional and valuable support for stress, either physical or psychological, as an important IBS determinant. 14,15 A plausible pathophysi- ological connection between stress and IBS may reside in ability of stress to disturb the functional homeostasis inherent to the gut epithelial barrier. This equilibrium requires the preservation of its nutitional role and physical tightness, to maintain adequate energy supply and restrict the access of luminal contents to the internal milieu. 16,17 Intuitively, the breakdown of barrier’s surveillance and executive activities might facilitate unfettered penetration of food and bacterial antigens across, to stimulate disruptive immunological responses that, unless * To whom correspondence should be addressed. Sunil Kochhar, Nestle ´ Research Center, BioAnalytical Sciences, P.O. Box 44, Vers-chez-les-Blanc, CH-1000 Lausanne 26, Switzerland. E-mail, [email protected]; phone, + 41 21 785 9336; fax, + 41 21 785 9486. † Nestle ´ Research Center. # These investigators contributed equally to this manuscript. ‡ Universitat Auto `noma de Barcelona. 10.1021/pr900525w CCC: $40.75 2009 American Chemical Society Journal of Proteome Research 2009, 8, 4799–4809 4799 Published on Web 09/09/2009

Welcome message from author
This document is posted to help you gain knowledge. Please leave a comment to let me know what you think about it! Share it to your friends and learn new things together.
Transcript
Metabotyping of Biofluids Reveals Stress-Based Differences in Gut
Permeability in Healthy Individuals
Serge Rezzi,†,# Francois-Pierre Martin,†,# Carmen Alonso,‡ Mar Guilarte,‡ Marıa Vicario,‡
Laura Ramos,‡ Cristina Martınez,‡ Beatriz Lobo,‡ Esteban Saperas,‡ Juan Ramon Malagelada,‡
Javier Santos,‡ and Sunil Kochhar*,†
Bioanalytical Science Department, Metabonomics & Biomarkers Group, Nestle Research Center,Lausanne, Switzerland, and Digestive Diseases Research Unit, Institut de Recerca, Department of Gastroenterology;
Hospital Universitari Vall d’Hebron, Universitat Autonoma de Barcelona, Department of Medicine,Barcelona, Spain
Received June 15, 2009
Life stress promotes gut dysfunction, but underlying biochemical events are not well-understood. Inthe present study, we describe the metabolic events associated with background stress and its potentialinfluence on the response to novel incoming stress stimulus in healthy subjects. A 15 min cold paintest was carried out in healthy men and women stratified according to low (LS; n ) 21) and moderatebackground stress (MS; n ) 9) during jejunal segmental perfusion. Cold pain induced a strongerpsychological response in MS compared to LS subjects, but similar increases in heart rate and bloodpressure. Urine and plasma were analyzed using 1H NMR-based metabonomics. Basal stress levelswere imprinted in the metabolic profiles indicating different energy and lipid homeostasis. Cold painincreased gut permeability, as determined by mannitol and xylose levels, the response being greaterin LS subjects. Moreover, the rate of plasma clearance of mannitol and xylose was dependent onbackground stress level and gender. In addition, cold pain modulated the levels of circulating ketonebodies, Krebs’s cycle intermediates, glucose, and the glucogenic alanine and lactate, which brings furtherevidence of an alteration of energy homeostasis. Therefore, unravelling life stress with metabonomicsmay provide a system biology basis for the clinical management and therapeutic surveillance of guthealth and disorders.
Keywords: Chemometrics • Cold water stress • Gut permeability • Metabolomics • Metabonomics •NMR • OPLS • Life stress
Introduction
The pandemy of functional digestive diseases and theirheterogeneous clinical manifestations, coupled with our in-complete understanding on their pathogenesis, explains thecurrent lack of therapeutic tools providing long-standingclinical remission and the progressive burden on healthcaresystems.1,2 Such limitations have promoted research initiativesaimed at deciphering the mechanisms involved in their origin.Particular attention has been paid to the pathogenesis of theirritable bowel syndrome (IBS), the most common functionaldisorder diagnosed by gastroenterologists, affecting 10-25% ofpeople worldwide.1,2 As a consequence, recent findings revealthat a prominent feature in the intestine of certain IBSsubgroups, the presence of mucosal inflammation and immune
activation, may be linked to IBS symptoms,3-5 challenging thetraditional assumption on its strict nonorganic nature.
The development of mucosal inflammation and immuneactivation in IBS is reckoned as multifactorial, and seeminglyimplicates complex interactions of genetic, biological, socio-cultural and environmental determinants.6-9 Among them, therole of psychosocial stress as a key factor in the pathophysiologyof IBS requires further insight. Although disputed, epidemio-logical evidence suggests that life stress is related to the onset,persistence, severity, and prognosis of IBS.10-13 Moreover,growing empirical and clinical observations provide additionaland valuable support for stress, either physical or psychological,as an important IBS determinant.14,15 A plausible pathophysi-ological connection between stress and IBS may reside in abilityof stress to disturb the functional homeostasis inherent to thegut epithelial barrier. This equilibrium requires the preservationof its nutitional role and physical tightness, to maintainadequate energy supply and restrict the access of luminalcontents to the internal milieu.16,17 Intuitively, the breakdownof barrier’s surveillance and executive activities might facilitateunfettered penetration of food and bacterial antigens across,to stimulate disruptive immunological responses that, unless
* To whom correspondence should be addressed. Sunil Kochhar, NestleResearch Center, BioAnalytical Sciences, P.O. Box 44, Vers-chez-les-Blanc,CH-1000 Lausanne 26, Switzerland. E-mail, [email protected];phone, + 41 21 785 9336; fax, + 41 21 785 9486.
† Nestle Research Center.# These investigators contributed equally to this manuscript.‡ Universitat Autonoma de Barcelona.
10.1021/pr900525w CCC: $40.75 2009 American Chemical Society Journal of Proteome Research 2009, 8, 4799–4809 4799Published on Web 09/09/2009
properly down-regulated, could lead to the chronification ofmucosal inflammation.
This validity of this intuitive model is endorsed by extensiveexperimental findings showing the ability of both acute andchronic stress to regulate ion and water secretion and intestinalpermeability, and to initiate and reactivate mucosal inflam-mation, in animal models18-20 and humans.21-23 Furthermore,heightened intestinal permeability24 and stress-induced mu-cosal proinflammatory25 responses have been also observedin IBS patients. Finally, we have recently described the keyparticipation of recent life events in the emergence of defectiveepithelial responses in the jejunum of young healthy women.26
Considering the female predominance in IBS and its greaterincidence between ages 20 and 40, it may be reasonablypresumed that a deeper insight into the role of stress in thetransition from a healthy to defective/unhealthy gut will helpto prevent and modulate the development of mucosal inflam-mation.
A consistent approach to improve our current knowledge onthe molecular basis and effects of stress in the human intestineis the comprehensive analysis of the real endpoints of physi-ological regulatory processes, the metabolites.27 Metabonomicsrepresents a powerful approach to assess the metabolic re-sponse to stress,28,29 and to characterize metabolic phenotypesof mammals including host and gut microbiome metabolicinteractions.30,31 Therefore, metabonomics stands as an in-novative tool in the field of gastroenterology offering a valuableaid to identify disease and prognostic biomarkers which couldbe implemented in the clinical strategies of stress-relateddigestive disorders.32
In the present study, we have sought to capture a global viewof the metabolic events associated with background stress andwith its potential influence on the response to novel incomingstress in healthy male and female subjects. For this purpose,we analyzed urine and plasma samples by high resolutionproton nuclear magnetic resonance (1H NMR) spectroscopy incombination with multivariate statistics.27 As an extension ofour previous investigation,26 we now describe the stress-relatedmetabolic fingerprints and discuss its association with energyhomeostasis and gut permeability.
Material and Methods
Participants. Healthy male and female volunteers wereprospectively recruited by public advertising. The study pro-tocol was approved by the Ethics Committee at Hospital Valld’Hebron and conducted according to the revised Declarationof Helsinki. Written informed consent was obtained from eachparticipant.
Participants gave a full medical history and underwentphysical examination. Main exclusion criteria included age <18years, positive Rome II criteria for functional dyspepsia33 orIBS,34 active smokers, positive prick skin tests for standard foodor respiratory allergens (Leti SA, Barcelona, Spain), body massindex <18.5 or >25, pregnancy, use of any pharmaceuticalcompound in the last 2 weeks, inability to provide informedconsent, and violation of the study protocol. Alcohol andcaffeine intake was prohibited before and during the study toavoid any influence on participants basal metabolism. Thecomplete list of exclusion criteria was previously reported,26
and is provided in Supporting Information.Jejunal Perfusion Method. We used a double-lumen closed-
segment perfusion technique, as previously described in de-tail.26 Briefly, after an overnight fast, a multichannel tube was
introduced orally and placed distal to Treitz under fluoroscopiccontrol, and a 20-cm segment was isolated between twoinflated balloons. The segment was perfused at a constant 5mL/min rate with a water-based solution (pH∼7.8, 280 mOsm/kg, 37 °C) containing 180 mmol/L mannitol, 100 mmol/L xylose,and 5 g/L of polyethylene glycol 4000. Accumulation of gas-troduodenal and biliopancreatic fluid was prevented by agravity drainage port placed just orad to the proximal balloon.Steady-state conditions were achieved within 30 min aftersegmental occlusion.26
Background Stress and Depression. Beck’s Inventory fordepression35 was used to evaluate depression levels in the weekbefore the experiment. Significant life events in the last yearwere assessed using the modified social readjustment scale ofHolmes-Rahe,36 and resulting scores were used to stratifyparticipants into background stress groups: low stress (LS,e150points) or moderate-high stress (MS, g151 points).
Cold Pain Stress. Physical stress was induced by the coldwater pressor test.37 Participants immersed their nondominanthand in iced water (4 °C) for 45 s, followed by withdrawal for15 s to prevent adaptation to pain. This pattern was repeatedfor 15 min. The potential confounding effects resulting fromintubation itself were evaluated in six subjects, serving as acontrol group, in whom the perfusion was performed withoutcold exposure (sham-cold).
Assessment of the Response to Cold Pain Stress.1. Hand Pain Perception. Hand discomfort was scored using
a simple analog scale (range: 0, complete comfort; 10, intoler-able pain).
2. Autonomic Response. It was evaluated by automatedregistration of blood pressure and heart rate (Omron M4-I;Omron Healthcare, West Sussex, U.K.).
3. Psychological Response. The magnitude of psychologicaldistress induced by cold pain was evaluated using the Subjec-tive Stress Rating Scale (SSRS).38
Menstrual Cycle. To control the potential influence ofestradiol and progesterone fluctuations on the response to coldpain, allocation of female participants to stress groups wasequilibrated for menstrual phase by asking them for their cyclephase.26
Experimental Design. Forty-six participants were initiallyrecruited. Ten participants were excluded because of positiveprick skin tests (n ) 4), inadequate placing of the tube (n )2), insufficient polyethylene glycol recovery (n ) 2), or dueto biliopancreatic contamination of perfusates (n ) 2).Therefore, 36 subjects were finally evaluated, with nodemographic, clinical, menstrual, BMI and age differencesbetween LS and MS groups, and only stress and depressionlevels as discriminant factors (Table 1). The study included21 volunteers with low background stress (12 males, 9females) and 9 with moderate stress levels (3 males, 6females) (Table 1). In addition, 6 other healthy subjects (5males, 1 female) were used as a reference group for perfusionto control the effect of intervention stress. Anamnesis,physical examination, allergy testing, and background stressand depression evaluation were performed the week beforeperfusion. The day of the experiment, participants were citedat 8:00 a.m. and were intubated after treatment assignment,verification of the compliance for inclusion/exclusion cri-teria, and obtention of informed consent. In a first step,participants were randomly allocated to receive either coldpain or sham-cold, as determined by a computerized randomnumber generator tool with no repeats, until the control
research articles Rezzi et al.
4800 Journal of Proteome Research • Vol. 8, No. 10, 2009
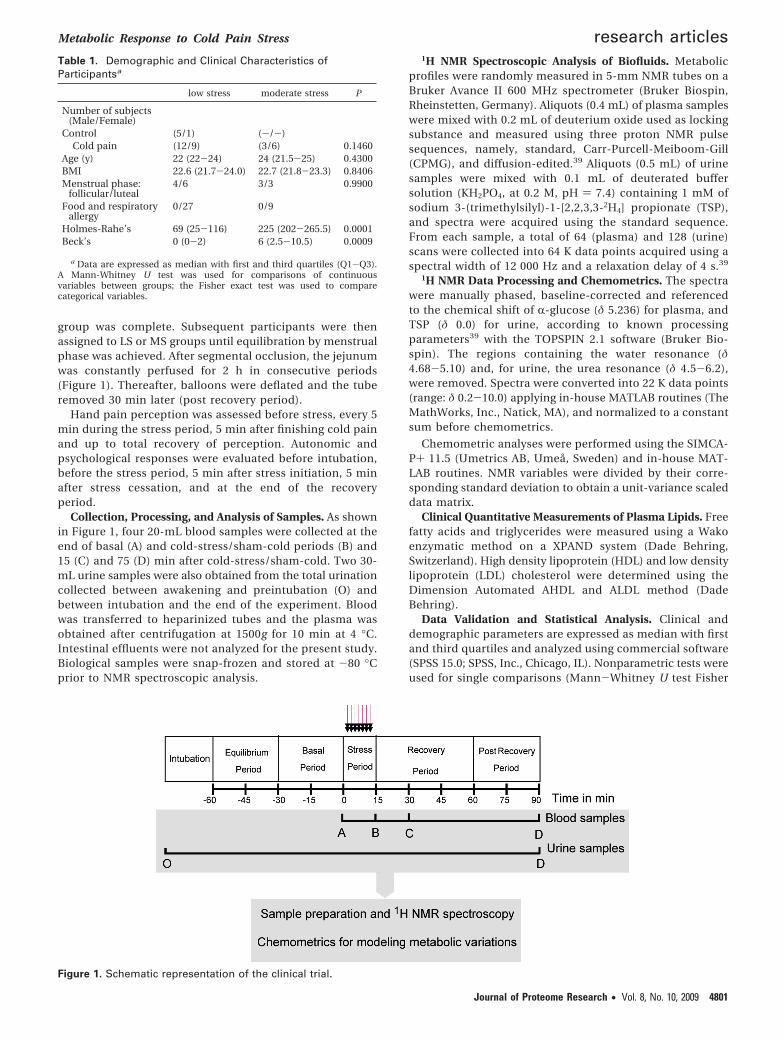
group was complete. Subsequent participants were thenassigned to LS or MS groups until equilibration by menstrualphase was achieved. After segmental occlusion, the jejunumwas constantly perfused for 2 h in consecutive periods(Figure 1). Thereafter, balloons were deflated and the tuberemoved 30 min later (post recovery period).
Hand pain perception was assessed before stress, every 5min during the stress period, 5 min after finishing cold painand up to total recovery of perception. Autonomic andpsychological responses were evaluated before intubation,before the stress period, 5 min after stress initiation, 5 minafter stress cessation, and at the end of the recoveryperiod.
Collection, Processing, and Analysis of Samples. As shownin Figure 1, four 20-mL blood samples were collected at theend of basal (A) and cold-stress/sham-cold periods (B) and15 (C) and 75 (D) min after cold-stress/sham-cold. Two 30-mL urine samples were also obtained from the total urinationcollected between awakening and preintubation (O) andbetween intubation and the end of the experiment. Bloodwas transferred to heparinized tubes and the plasma wasobtained after centrifugation at 1500g for 10 min at 4 °C.Intestinal effluents were not analyzed for the present study.Biological samples were snap-frozen and stored at -80 °Cprior to NMR spectroscopic analysis.
1H NMR Spectroscopic Analysis of Biofluids. Metabolicprofiles were randomly measured in 5-mm NMR tubes on aBruker Avance II 600 MHz spectrometer (Bruker Biospin,Rheinstetten, Germany). Aliquots (0.4 mL) of plasma sampleswere mixed with 0.2 mL of deuterium oxide used as lockingsubstance and measured using three proton NMR pulsesequences, namely, standard, Carr-Purcell-Meiboom-Gill(CPMG), and diffusion-edited.39 Aliquots (0.5 mL) of urinesamples were mixed with 0.1 mL of deuterated buffersolution (KH2PO4, at 0.2 M, pH ) 7.4) containing 1 mM ofsodium 3-(trimethylsilyl)-1-[2,2,3,3-2H4] propionate (TSP),and spectra were acquired using the standard sequence.From each sample, a total of 64 (plasma) and 128 (urine)scans were collected into 64 K data points acquired using aspectral width of 12 000 Hz and a relaxation delay of 4 s.39
1H NMR Data Processing and Chemometrics. The spectrawere manually phased, baseline-corrected and referencedto the chemical shift of R-glucose (δ 5.236) for plasma, andTSP (δ 0.0) for urine, according to known processingparameters39 with the TOPSPIN 2.1 software (Bruker Bio-spin). The regions containing the water resonance (δ4.68-5.10) and, for urine, the urea resonance (δ 4.5-6.2),were removed. Spectra were converted into 22 K data points(range: δ 0.2-10.0) applying in-house MATLAB routines (TheMathWorks, Inc., Natick, MA), and normalized to a constantsum before chemometrics.
Chemometric analyses were performed using the SIMCA-P+ 11.5 (Umetrics AB, Umea, Sweden) and in-house MAT-LAB routines. NMR variables were divided by their corre-sponding standard deviation to obtain a unit-variance scaleddata matrix.
Clinical Quantitative Measurements of Plasma Lipids. Freefatty acids and triglycerides were measured using a Wakoenzymatic method on a XPAND system (Dade Behring,Switzerland). High density lipoprotein (HDL) and low densitylipoprotein (LDL) cholesterol were determined using theDimension Automated AHDL and ALDL method (DadeBehring).
Data Validation and Statistical Analysis. Clinical anddemographic parameters are expressed as median with firstand third quartiles and analyzed using commercial software(SPSS 15.0; SPSS, Inc., Chicago, IL). Nonparametric tests wereused for single comparisons (Mann-Whitney U test Fisher
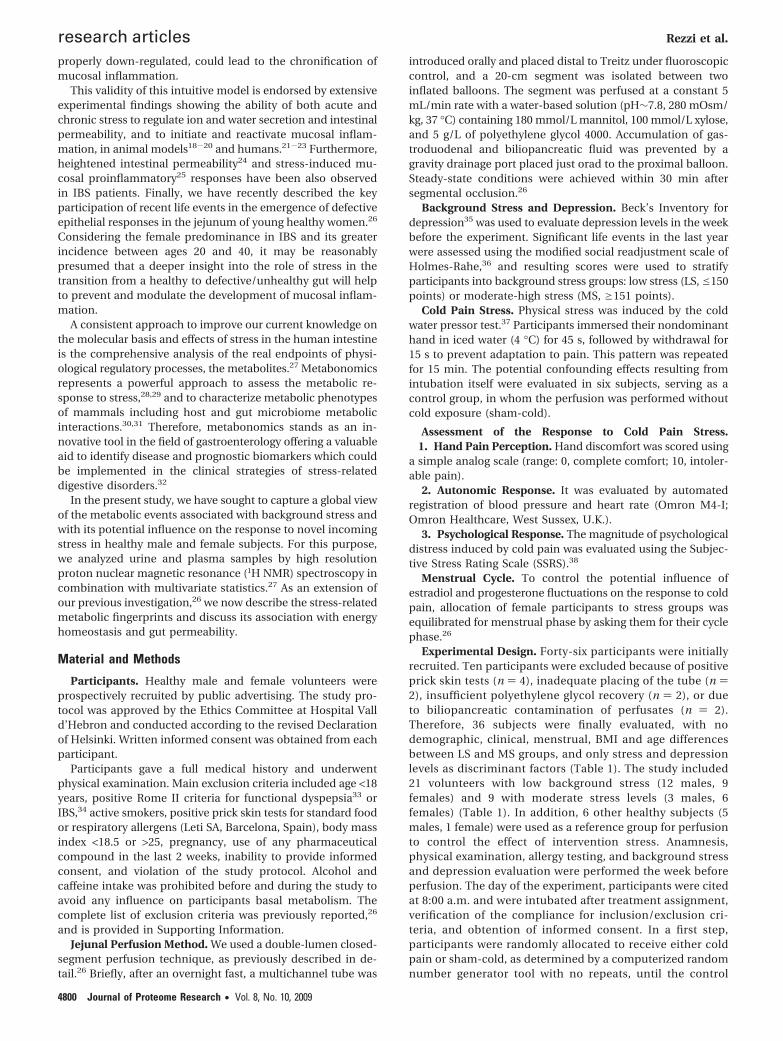
Table 1. Demographic and Clinical Characteristics ofParticipantsa
low stress moderate stress P
Number of subjects(Male/Female)
Control (5/1) (-/-)Cold pain (12/9) (3/6) 0.1460
Age (y) 22 (22-24) 24 (21.5-25) 0.4300BMI 22.6 (21.7-24.0) 22.7 (21.8-23.3) 0.8406Menstrual phase:
follicular/luteal4/6 3/3 0.9900
Food and respiratoryallergy
0/27 0/9
Holmes-Rahe’s 69 (25-116) 225 (202-265.5) 0.0001Beck’s 0 (0-2) 6 (2.5-10.5) 0.0009
a Data are expressed as median with first and third quartiles (Q1-Q3).A Mann-Whitney U test was used for comparisons of continuousvariables between groups; the Fisher exact test was used to comparecategorical variables.
Figure 1. Schematic representation of the clinical trial.
Metabolic Response to Cold Pain Stress research articles
Journal of Proteome Research • Vol. 8, No. 10, 2009 4801
exact test) to ensure statistical robustness. For other com-parisons, a 2-way repeated-measures analysis of variance(ANOVA) was used as reported.26 Background stress wasconsidered as the between-subjects factor (stress group) and
changes along time as the within-subject factor (time). P <0.05 was considered significant.
Metabolic similarities among samples were first testedusing a unsupervised method, principal component analysis
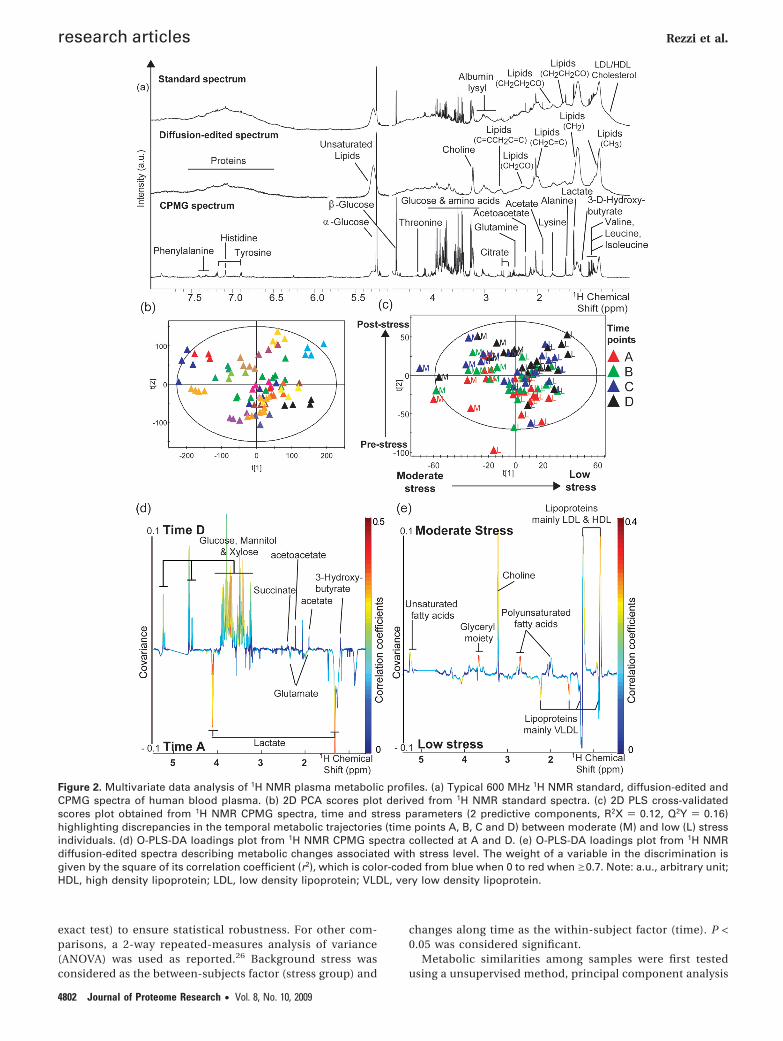
Figure 2. Multivariate data analysis of 1H NMR plasma metabolic profiles. (a) Typical 600 MHz 1H NMR standard, diffusion-edited andCPMG spectra of human blood plasma. (b) 2D PCA scores plot derived from 1H NMR standard spectra. (c) 2D PLS cross-validatedscores plot obtained from 1H NMR CPMG spectra, time and stress parameters (2 predictive components, R2X ) 0.12, Q2Y ) 0.16)highlighting discrepancies in the temporal metabolic trajectories (time points A, B, C and D) between moderate (M) and low (L) stressindividuals. (d) O-PLS-DA loadings plot from 1H NMR CPMG spectra collected at A and D. (e) O-PLS-DA loadings plot from 1H NMRdiffusion-edited spectra describing metabolic changes associated with stress level. The weight of a variable in the discrimination isgiven by the square of its correlation coefficient (r2), which is color-coded from blue when 0 to red when g0.7. Note: a.u., arbitrary unit;HDL, high density lipoprotein; LDL, low density lipoprotein; VLDL, very low density lipoprotein.
research articles Rezzi et al.
4802 Journal of Proteome Research • Vol. 8, No. 10, 2009
(PCA).40 In addition, the well-validated projection to latentstructure (PLS) and orthogonal-PLS (O-PLS) methods41,42
were applied to maximize the discrimination of metabolicvariations between stress groups, and before and after coldpain. Influential variables that are correlated to the groupseparation are identified using coefficients (covariance)plots.43 Each data variable is plotted with a color code, whichrelates to the significance of class discrimination as calcu-lated from the correlation matrix. The robustness of themodel was confirmed with the standard 7-fold cross-valida-tion method.44 To test the validity of the model againstoverfitting, the goodness of fit (R2X) and predictability (Q2Y)values of O-PLS-DA models were computed and reportedseparately for NMR spectroscopic data for plasma and urine.The test for the significance of the Pearson’s product-moment correlation coefficient was used to calculate thecutoff value of the correlation coefficients based on dis-crimination significance at the level of P < 0.05. Therobustness of our multivariate statistical analysis and thesignificance of the differences was further assessed bycomparing area normalized intensities of metabolite signalsinfluenced by the different treatments by nonparametric ttests.
Results
Effect of Cold Stress on Hand Pain Perception, Autonomicand Psychological Response. Cold stress increased hand dis-comfort similarly in both groups (∆LS, 7.7 [6-9.6]; ∆MS, 7.8[5.7-8.8]; P < 0.0010 vs basal; P ) NS, LS vs MS). Both groupsdisplayed equal heart rate and blood pressure at baseline andexperienced a significant but comparable increase after cold(Supplementary Figure 1) with all measurements returning tobaseline 5 min after finishing stress.
SSRS was similar at baseline (LS, 4.0 [2.0-5.0]; MS, 5.2[3.3-7.1]; P ) NS). Cold pain markedly raised perceived stresslevels in both groups (F[4, 26] ) 9.37; P < 0.0005), although ina similar magnitude (F[1, 26] ) 1.64; P ) NS, SupplementaryFigure 2).
Metabonomic Analysis of Plasma Samples. Examples oftypical 1H NMR spectra of human plasma are shown in Figure2a and resolved signals were assigned according to literature45
and confirmed by 2D 1H NMR spectroscopy experimentsperformed on selected samples. The standard spectra includedbroad signals from albumin, lipoproteins and lipids as well assharp resonances arising from small molecular weight metabo-lites. Attenuation of sharp resonances after diffusion-editingconfirmed spectroscopic information from proteins and lipo-proteins, while the reduction of broad signals after CPMGfiltering revealed high concentration of mannitol and xyloseand detected a wide range of low molecular weight metabolitessuch as amino and organic acids, glucose, and ketone bodies.
PCA of the metabolic profiles were obtained before andafter cold stress. Data were visualized by means of principalcomponent (PC) scores, where each point represents anindividual metabolic profile. NMR variables, for example,metabolic concentrations, responsible for differences amongsamples in the scores plot can be extracted from thecorresponding loadings plot, where each coordinate repre-sents a single NMR signal. PC scores plot indicated interin-dividual differences as the main source of metabolic varia-tion, as shown by the comapping of samples from the sameindividual (Figure 2b). PCA profiles from controls and
subjects submitted to cold pain did not reveal differencesbetween the groups (data not shown).
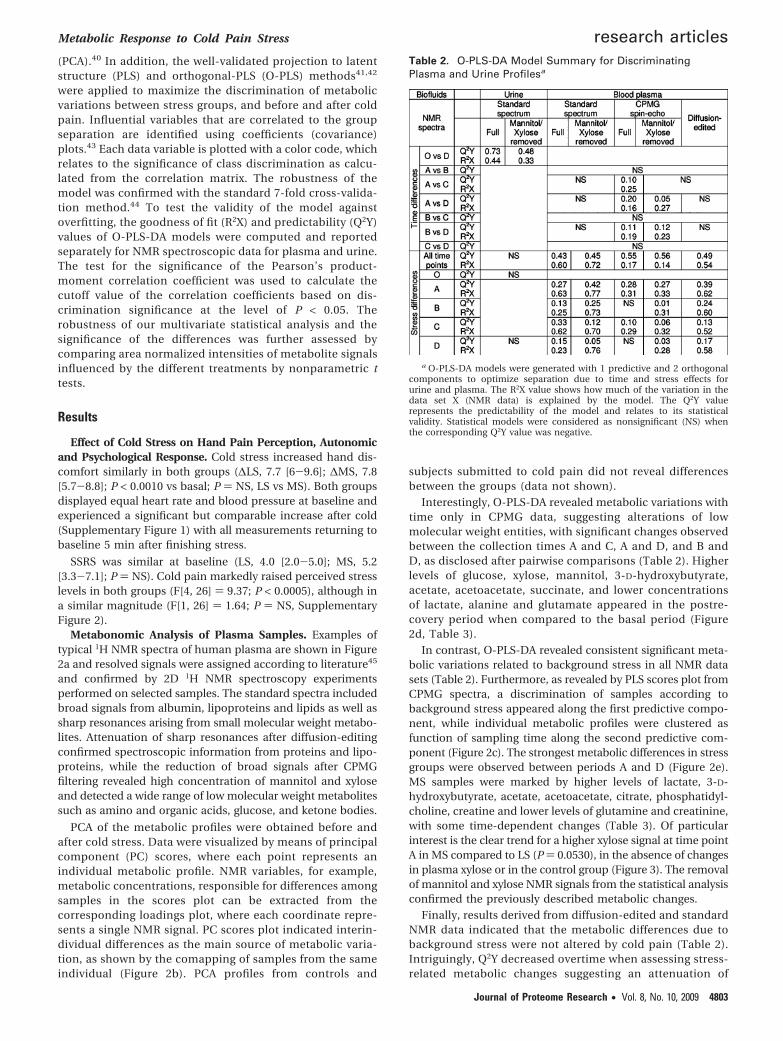
Interestingly, O-PLS-DA revealed metabolic variations withtime only in CPMG data, suggesting alterations of lowmolecular weight entities, with significant changes observedbetween the collection times A and C, A and D, and B andD, as disclosed after pairwise comparisons (Table 2). Higherlevels of glucose, xylose, mannitol, 3-D-hydroxybutyrate,acetate, acetoacetate, succinate, and lower concentrationsof lactate, alanine and glutamate appeared in the postre-covery period when compared to the basal period (Figure2d, Table 3).
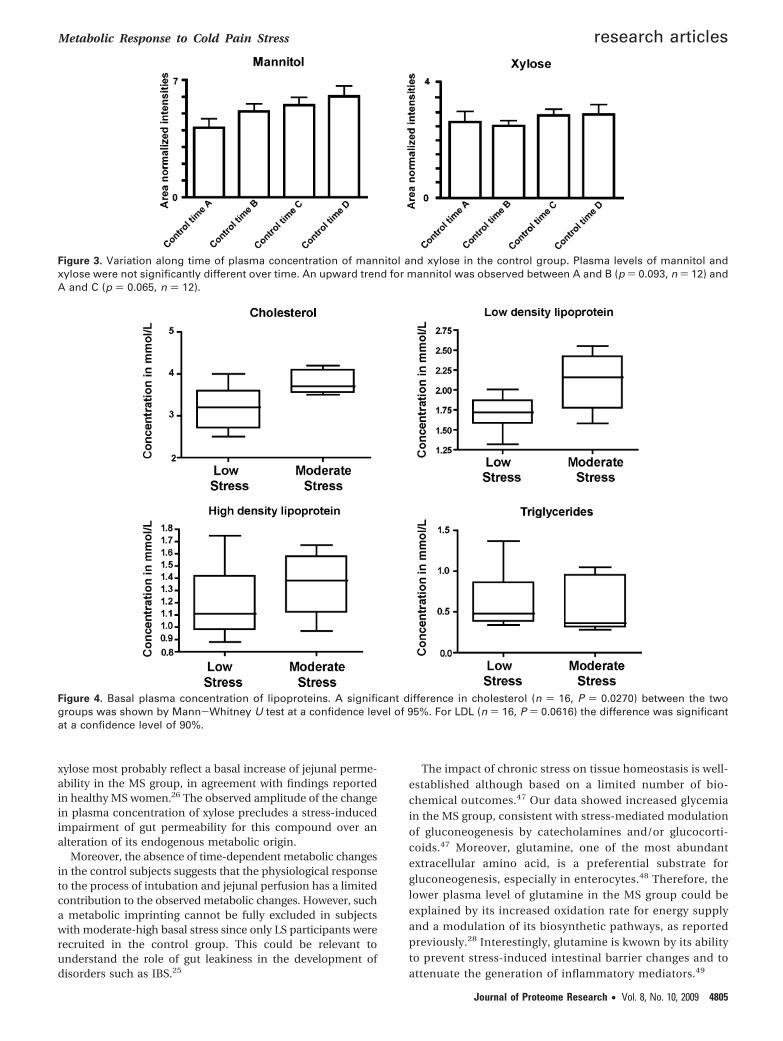
In contrast, O-PLS-DA revealed consistent significant meta-bolic variations related to background stress in all NMR datasets (Table 2). Furthermore, as revealed by PLS scores plot fromCPMG spectra, a discrimination of samples according tobackground stress appeared along the first predictive compo-nent, while individual metabolic profiles were clustered asfunction of sampling time along the second predictive com-ponent (Figure 2c). The strongest metabolic differences in stressgroups were observed between periods A and D (Figure 2e).MS samples were marked by higher levels of lactate, 3-D-hydroxybutyrate, acetate, acetoacetate, citrate, phosphatidyl-choline, creatine and lower levels of glutamine and creatinine,with some time-dependent changes (Table 3). Of particularinterest is the clear trend for a higher xylose signal at time pointA in MS compared to LS (P ) 0.0530), in the absence of changesin plasma xylose or in the control group (Figure 3). The removalof mannitol and xylose NMR signals from the statistical analysisconfirmed the previously described metabolic changes.
Finally, results derived from diffusion-edited and standardNMR data indicated that the metabolic differences due tobackground stress were not altered by cold pain (Table 2).Intriguingly, Q2Y decreased overtime when assessing stress-related metabolic changes suggesting an attenuation of
Table 2. O-PLS-DA Model Summary for DiscriminatingPlasma and Urine Profilesa
a O-PLS-DA models were generated with 1 predictive and 2 orthogonalcomponents to optimize separation due to time and stress effects forurine and plasma. The R2X value shows how much of the variation in thedata set X (NMR data) is explained by the model. The Q2Y valuerepresents the predictability of the model and relates to its statisticalvalidity. Statistical models were considered as nonsignificant (NS) whenthe corresponding Q2Y value was negative.
Metabolic Response to Cold Pain Stress research articles
Journal of Proteome Research • Vol. 8, No. 10, 2009 4803
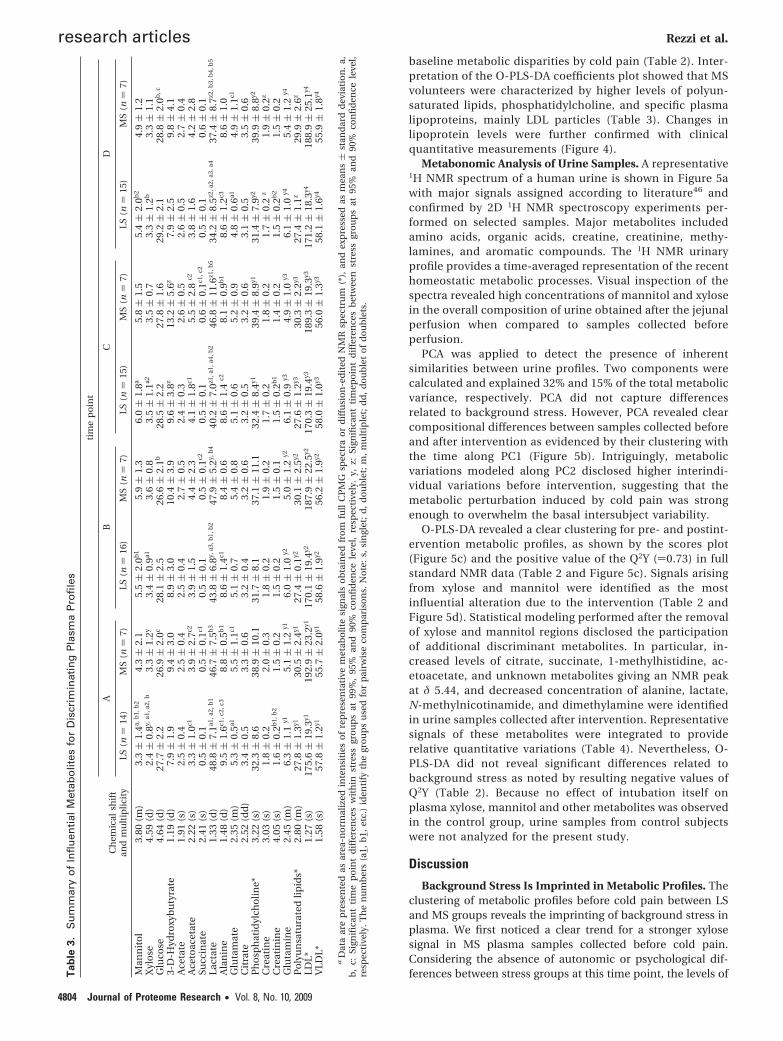
baseline metabolic disparities by cold pain (Table 2). Inter-pretation of the O-PLS-DA coefficients plot showed that MSvolunteers were characterized by higher levels of polyun-saturated lipids, phosphatidylcholine, and specific plasmalipoproteins, mainly LDL particles (Table 3). Changes inlipoprotein levels were further confirmed with clinicalquantitative measurements (Figure 4).
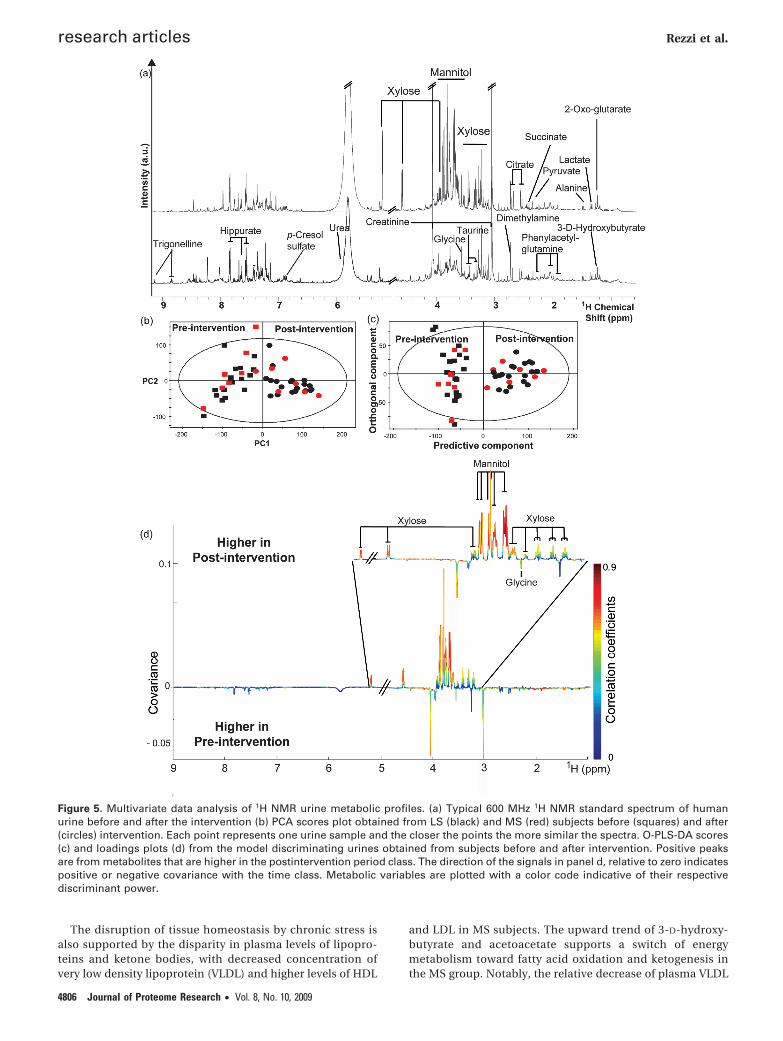
Metabonomic Analysis of Urine Samples. A representative1H NMR spectrum of a human urine is shown in Figure 5awith major signals assigned according to literature46 andconfirmed by 2D 1H NMR spectroscopy experiments per-formed on selected samples. Major metabolites includedamino acids, organic acids, creatine, creatinine, methy-lamines, and aromatic compounds. The 1H NMR urinaryprofile provides a time-averaged representation of the recenthomeostatic metabolic processes. Visual inspection of thespectra revealed high concentrations of mannitol and xylosein the overall composition of urine obtained after the jejunalperfusion when compared to samples collected beforeperfusion.
PCA was applied to detect the presence of inherentsimilarities between urine profiles. Two components werecalculated and explained 32% and 15% of the total metabolicvariance, respectively. PCA did not capture differencesrelated to background stress. However, PCA revealed clearcompositional differences between samples collected beforeand after intervention as evidenced by their clustering withthe time along PC1 (Figure 5b). Intriguingly, metabolicvariations modeled along PC2 disclosed higher interindi-vidual variations before intervention, suggesting that themetabolic perturbation induced by cold pain was strongenough to overwhelm the basal intersubject variability.
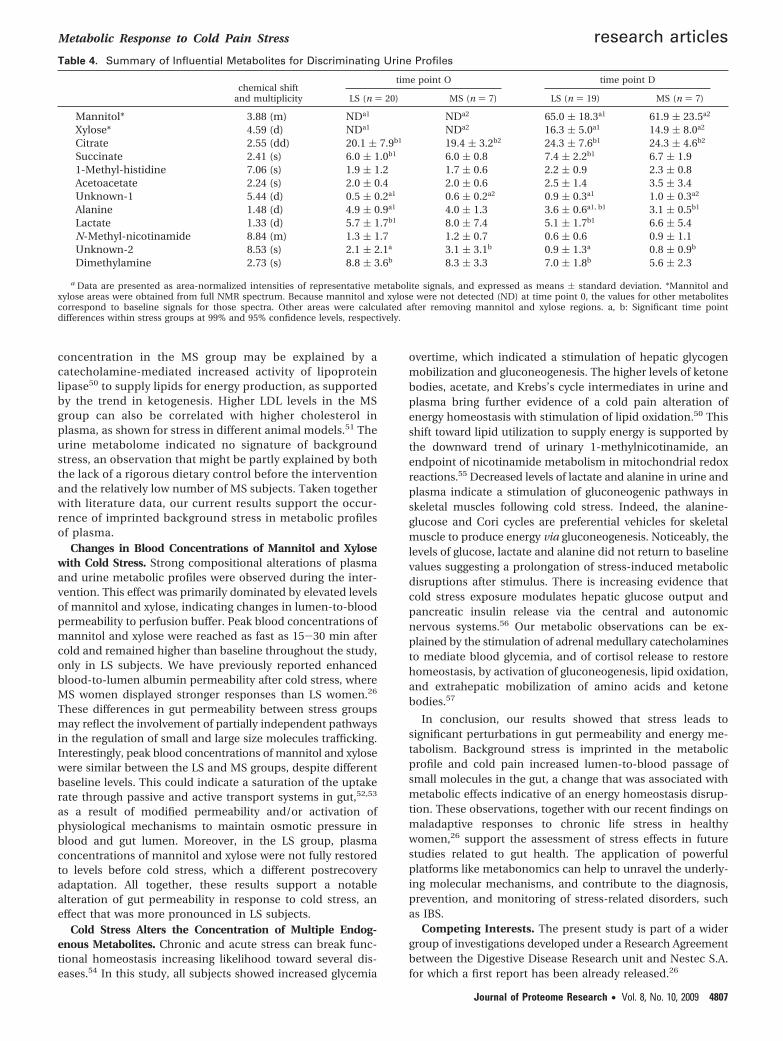
O-PLS-DA revealed a clear clustering for pre- and postint-ervention metabolic profiles, as shown by the scores plot(Figure 5c) and the positive value of the Q2Y ()0.73) in fullstandard NMR data (Table 2 and Figure 5c). Signals arisingfrom xylose and mannitol were identified as the mostinfluential alteration due to the intervention (Table 2 andFigure 5d). Statistical modeling performed after the removalof xylose and mannitol regions disclosed the participationof additional discriminant metabolites. In particular, in-creased levels of citrate, succinate, 1-methylhistidine, ac-etoacetate, and unknown metabolites giving an NMR peakat δ 5.44, and decreased concentration of alanine, lactate,N-methylnicotinamide, and dimethylamine were identifiedin urine samples collected after intervention. Representativesignals of these metabolites were integrated to providerelative quantitative variations (Table 4). Nevertheless, O-PLS-DA did not reveal significant differences related tobackground stress as noted by resulting negative values ofQ2Y (Table 2). Because no effect of intubation itself onplasma xylose, mannitol and other metabolites was observedin the control group, urine samples from control subjectswere not analyzed for the present study.
Discussion
Background Stress Is Imprinted in Metabolic Profiles. Theclustering of metabolic profiles before cold pain between LSand MS groups reveals the imprinting of background stress inplasma. We first noticed a clear trend for a stronger xylosesignal in MS plasma samples collected before cold pain.Considering the absence of autonomic or psychological dif-ferences between stress groups at this time point, the levels ofT
ab
le3.
Su
mm
ary
of
Infl
uen
tial
Met
abo
lites
for
Dis
crim
inat
ing
Pla
sma
Pro
file
s
tim
ep
oin
t
AB
CD
Ch
emic
alsh
ift
and
mu
ltip
lici
tyLS
(n)
14)
MS
(n)
7)LS
(n)
16)
MS
(n)
7)LS
(n)
15)
MS
(n)
7)LS
(n)
15)
MS
(n)
7)
Man
nit
ol
3.80
(m)
3.3(
1.4a,
b1,
b2
4.3(
2.1
5.5(
2.0b
15.
9(
1.3
6.0(
1.8a
5.8(
1.5
5.4(
2.0b
24.
9(
1.2
Xyl
ose
4.59
(d)
2.4(
0.8y,
a1,a
2,b
3.3(
1.2y
3.4(
0.9a1
3.6(
0.8
3.5(
1.1a2
3.5(
0.7
3.3(
1.2b
3.3(
1.1
Glu
cose
4.64
(d)
27.7
(2.
226
.9(
2.0c
28.1
(2.
526
.6(
2.1b
28.5
(2.
227
.8(
1.6
29.2
(2.
128
.8(
2.0b
,c
3-D
-Hyd
roxy
bu
tyra
te1.
19(d
)7.
9(
1.9
9.4(
3.0
8.9(
3.0
10.4
(3.
99.
6(
3.8z
13.2
(5.
6z7.
9(
2.5
9.8(
4.1
Ace
tate
1.91
(s)
2.5(
0.4
2.5(
0.4
2.5(
0.4
2.7(
0.5
2.4(
0.3
2.6(
0.5
2.6(
0.5
2.7(
0.4
Ace
toac
etat
e2.
22(s
)3.
3(
1.0c1
3.9(
2.7c2
3.9(
1.5
4.4(
2.3
4.1(
1.8c1
5.5(
2.8
c23.
8(
1.6
4.2(
2.8
Succ
inat
e2.
41(s
)0.
5(
0.1
0.5(
0.1c1
0.5(
0.1
0.5(
0.1c2
0.5(
0.1
0.6(
0.1c1
,c2
0.5(
0.1
0.6(
0.1
Lact
ate
1.33
(d)
48.8
(7.
1a1,a
2,b
146
.7(
7.5b
343
.8(
6.8y,
a3,b
1,b
247
.9(
5.2y,
b4
40.2
(7.
0z1,a
1,a4
,b2
46.8
(11
.6z1
,b5
34.2
(8.
5z2,a
2,a3
,a4
37.4
(8.
7z2,b
3,b
4,b
5
Ala
nin
e1.
48(d
)9.
5(
1.6c1
,c2,
c38.
8(
0.5b
18.
6(
1.4c1
8.4(
0.6
8.6(
1.4
c28.
1(
0.9b
18.
6(
1.2c3
8.6(
1.0
Glu
tam
ate
2.35
(m)
5.3(
0.5a1
5.5(
1.1c1
5.1(
0.7
5.4(
0.8
5.1(
0.6
5.2(
0.9
4.8(
0.6a1
4.9(
1.1c1
Cit
rate
2.52
(dd
)3.
4(
0.5
3.3(
0.6
3.2(
0.4
3.2(
0.6
3.2(
0.5
3.2(
0.6
3.1(
0.5
3.5(
0.6
Ph
osp
hat
idyl
cho
line*
3.22
(s)
32.3
(8.
638
.9(
10.1
31.7
(8.
137
.1(
11.1
32.4
(8.
4y139
.4(
8.9y1
31.4
(7.
9y239
.9(
8.8y2
Cre
atin
e3.
03(s
)1.
8(
0.2
2.0(
0.3
1.8(
0.2
1.9(
0.2
1.7(
0.2
1.8(
0.2
1.7(
0.2
z1.
9(
0.2z
Cre
atin
ine
4.05
(s)
1.6(
0.2b
1,b
21.
5(
0.2
1.5(
0.2
1.5(
0.1
1.5(
0.2b
11.
4(
0.2
1.5(
0.2b
21.
5(
0.2
Glu
tam
ine
2.45
(m)
6.3(
1.1
y15.
1(
1.2
y16.
0(
1.0
y25.
0(
1.2
y26.
1(
0.9
y34.
9(
1.0
y36.
1(
1.0
y45.
4(
1.2
y4
Po
lyu
nsa
tura
ted
lipid
s*2.
80(m
)27
.8(
1.3y1
30.5
(2.
4y127
.4(
0.1y2
30.1
(2.
5y227
.6(
1.2y3
30.3
(2.
2y327
.4(
1.1z
29.9
(2.
6z
LDL*
1.27
(s)
175.
6(
19.3
y119
2.9(
23.2
y117
0.1(
19.4
y218
7.9(
22.5
y217
0.3(
19.4
y318
9.3(
19.3
y317
1.2(
18.3
y418
8.9(
25.1
y4
VLD
L*1.
58(s
)57
.8(
1.2y1
55.7
(2.
0y158
.6(
1.9y2
56.2
(1.
9y258
.0(
1.0y3
56.0
(1.
3y358
.1(
1.6y4
55.9
(1.
8y4
aD
ata
are
pre
sen
ted
asar
ea-n
orm
aliz
edin
ten
siti
eso
fre
pre
sen
tati
vem
etab
olit
esi
gnal
so
bta
ined
fro
mfu
llC
PM
Gsp
ectr
ao
rd
iffu
sio
n-e
dit
edN
MR
spec
tru
m(*
),an
dex
pre
ssed
asm
ean
s(
stan
dar
dd
evia
tio
n.
a,b
,c:
Sign
ifica
nt
tim
ep
oin
td
iffe
ren
ces
wit
hin
stre
ssgr
ou
ps
at99
%,
95%
and
90%
con
fid
ence
leve
l,re
spec
tive
ly.
y,z:
Sign
ifica
nt
tim
epo
int
dif
fere
nce
sb
etw
een
stre
ssgr
ou
ps
at95
%an
d90
%co
nfi
den
cele
vel,
resp
ecti
vely
.T
he
nu
mb
ers
(a1,
b1,
etc.
)id
enti
fyth
egr
ou
ps
use
dfo
rp
airw
ise
com
par
iso
ns.
No
te:
s,si
ngl
et;
d,
do
ub
let;
m,
mu
ltip
let;
dd
,d
ou
ble
to
fd
ou
ble
ts.
research articles Rezzi et al.
4804 Journal of Proteome Research • Vol. 8, No. 10, 2009
xylose most probably reflect a basal increase of jejunal perme-ability in the MS group, in agreement with findings reportedin healthy MS women.26 The observed amplitude of the changein plasma concentration of xylose precludes a stress-inducedimpairment of gut permeability for this compound over analteration of its endogenous metabolic origin.
Moreover, the absence of time-dependent metabolic changesin the control subjects suggests that the physiological responseto the process of intubation and jejunal perfusion has a limitedcontribution to the observed metabolic changes. However, sucha metabolic imprinting cannot be fully excluded in subjectswith moderate-high basal stress since only LS participants wererecruited in the control group. This could be relevant tounderstand the role of gut leakiness in the development ofdisorders such as IBS.25
The impact of chronic stress on tissue homeostasis is well-established although based on a limited number of bio-chemical outcomes.47 Our data showed increased glycemiain the MS group, consistent with stress-mediated modulationof gluconeogenesis by catecholamines and/or glucocorti-coids.47 Moreover, glutamine, one of the most abundantextracellular amino acid, is a preferential substrate forgluconeogenesis, especially in enterocytes.48 Therefore, thelower plasma level of glutamine in the MS group could beexplained by its increased oxidation rate for energy supplyand a modulation of its biosynthetic pathways, as reportedpreviously.28 Interestingly, glutamine is kwown by its abilityto prevent stress-induced intestinal barrier changes and toattenuate the generation of inflammatory mediators.49
Figure 3. Variation along time of plasma concentration of mannitol and xylose in the control group. Plasma levels of mannitol andxylose were not significantly different over time. An upward trend for mannitol was observed between A and B (p ) 0.093, n ) 12) andA and C (p ) 0.065, n ) 12).
Figure 4. Basal plasma concentration of lipoproteins. A significant difference in cholesterol (n ) 16, P ) 0.0270) between the twogroups was shown by Mann-Whitney U test at a confidence level of 95%. For LDL (n ) 16, P ) 0.0616) the difference was significantat a confidence level of 90%.
Metabolic Response to Cold Pain Stress research articles
Journal of Proteome Research • Vol. 8, No. 10, 2009 4805
The disruption of tissue homeostasis by chronic stress isalso supported by the disparity in plasma levels of lipopro-teins and ketone bodies, with decreased concentration ofvery low density lipoprotein (VLDL) and higher levels of HDL
and LDL in MS subjects. The upward trend of 3-D-hydroxy-butyrate and acetoacetate supports a switch of energymetabolism toward fatty acid oxidation and ketogenesis inthe MS group. Notably, the relative decrease of plasma VLDL
Figure 5. Multivariate data analysis of 1H NMR urine metabolic profiles. (a) Typical 600 MHz 1H NMR standard spectrum of humanurine before and after the intervention (b) PCA scores plot obtained from LS (black) and MS (red) subjects before (squares) and after(circles) intervention. Each point represents one urine sample and the closer the points the more similar the spectra. O-PLS-DA scores(c) and loadings plots (d) from the model discriminating urines obtained from subjects before and after intervention. Positive peaksare from metabolites that are higher in the postintervention period class. The direction of the signals in panel d, relative to zero indicatespositive or negative covariance with the time class. Metabolic variables are plotted with a color code indicative of their respectivediscriminant power.
research articles Rezzi et al.
4806 Journal of Proteome Research • Vol. 8, No. 10, 2009
concentration in the MS group may be explained by acatecholamine-mediated increased activity of lipoproteinlipase50 to supply lipids for energy production, as supportedby the trend in ketogenesis. Higher LDL levels in the MSgroup can also be correlated with higher cholesterol inplasma, as shown for stress in different animal models.51 Theurine metabolome indicated no signature of backgroundstress, an observation that might be partly explained by boththe lack of a rigorous dietary control before the interventionand the relatively low number of MS subjects. Taken togetherwith literature data, our current results support the occur-rence of imprinted background stress in metabolic profilesof plasma.
Changes in Blood Concentrations of Mannitol and Xylosewith Cold Stress. Strong compositional alterations of plasmaand urine metabolic profiles were observed during the inter-vention. This effect was primarily dominated by elevated levelsof mannitol and xylose, indicating changes in lumen-to-bloodpermeability to perfusion buffer. Peak blood concentrations ofmannitol and xylose were reached as fast as 15-30 min aftercold and remained higher than baseline throughout the study,only in LS subjects. We have previously reported enhancedblood-to-lumen albumin permeability after cold stress, whereMS women displayed stronger responses than LS women.26
These differences in gut permeability between stress groupsmay reflect the involvement of partially independent pathwaysin the regulation of small and large size molecules trafficking.Interestingly, peak blood concentrations of mannitol and xylosewere similar between the LS and MS groups, despite differentbaseline levels. This could indicate a saturation of the uptakerate through passive and active transport systems in gut,52,53
as a result of modified permeability and/or activation ofphysiological mechanisms to maintain osmotic pressure inblood and gut lumen. Moreover, in the LS group, plasmaconcentrations of mannitol and xylose were not fully restoredto levels before cold stress, which a different postrecoveryadaptation. All together, these results support a notablealteration of gut permeability in response to cold stress, aneffect that was more pronounced in LS subjects.
Cold Stress Alters the Concentration of Multiple Endog-enous Metabolites. Chronic and acute stress can break func-tional homeostasis increasing likelihood toward several dis-eases.54 In this study, all subjects showed increased glycemia
overtime, which indicated a stimulation of hepatic glycogenmobilization and gluconeogenesis. The higher levels of ketonebodies, acetate, and Krebs’s cycle intermediates in urine andplasma bring further evidence of a cold pain alteration ofenergy homeostasis with stimulation of lipid oxidation.50 Thisshift toward lipid utilization to supply energy is supported bythe downward trend of urinary 1-methylnicotinamide, anendpoint of nicotinamide metabolism in mitochondrial redoxreactions.55 Decreased levels of lactate and alanine in urine andplasma indicate a stimulation of gluconeogenic pathways inskeletal muscles following cold stress. Indeed, the alanine-glucose and Cori cycles are preferential vehicles for skeletalmuscle to produce energy via gluconeogenesis. Noticeably, thelevels of glucose, lactate and alanine did not return to baselinevalues suggesting a prolongation of stress-induced metabolicdisruptions after stimulus. There is increasing evidence thatcold stress exposure modulates hepatic glucose output andpancreatic insulin release via the central and autonomicnervous systems.56 Our metabolic observations can be ex-plained by the stimulation of adrenal medullary catecholaminesto mediate blood glycemia, and of cortisol release to restorehomeostasis, by activation of gluconeogenesis, lipid oxidation,and extrahepatic mobilization of amino acids and ketonebodies.57
In conclusion, our results showed that stress leads tosignificant perturbations in gut permeability and energy me-tabolism. Background stress is imprinted in the metabolicprofile and cold pain increased lumen-to-blood passage ofsmall molecules in the gut, a change that was associated withmetabolic effects indicative of an energy homeostasis disrup-tion. These observations, together with our recent findings onmaladaptive responses to chronic life stress in healthywomen,26 support the assessment of stress effects in futurestudies related to gut health. The application of powerfulplatforms like metabonomics can help to unravel the underly-ing molecular mechanisms, and contribute to the diagnosis,prevention, and monitoring of stress-related disorders, suchas IBS.
Competing Interests. The present study is part of a widergroup of investigations developed under a Research Agreementbetween the Digestive Disease Research unit and Nestec S.A.for which a first report has been already released.26
Table 4. Summary of Influential Metabolites for Discriminating Urine Profiles
time point O time point Dchemical shift
and multiplicity LS (n ) 20) MS (n ) 7) LS (n ) 19) MS (n ) 7)
Mannitol* 3.88 (m) NDa1 NDa2 65.0 ( 18.3a1 61.9 ( 23.5a2
Xylose* 4.59 (d) NDa1 NDa2 16.3 ( 5.0a1 14.9 ( 8.0a2
Citrate 2.55 (dd) 20.1 ( 7.9b1 19.4 ( 3.2b2 24.3 ( 7.6b1 24.3 ( 4.6b2
Succinate 2.41 (s) 6.0 ( 1.0b1 6.0 ( 0.8 7.4 ( 2.2b1 6.7 ( 1.91-Methyl-histidine 7.06 (s) 1.9 ( 1.2 1.7 ( 0.6 2.2 ( 0.9 2.3 ( 0.8Acetoacetate 2.24 (s) 2.0 ( 0.4 2.0 ( 0.6 2.5 ( 1.4 3.5 ( 3.4Unknown-1 5.44 (d) 0.5 ( 0.2a1 0.6 ( 0.2a2 0.9 ( 0.3a1 1.0 ( 0.3a2
Alanine 1.48 (d) 4.9 ( 0.9a1 4.0 ( 1.3 3.6 ( 0.6a1, b1 3.1 ( 0.5b1
Lactate 1.33 (d) 5.7 ( 1.7b1 8.0 ( 7.4 5.1 ( 1.7b1 6.6 ( 5.4N-Methyl-nicotinamide 8.84 (m) 1.3 ( 1.7 1.2 ( 0.7 0.6 ( 0.6 0.9 ( 1.1Unknown-2 8.53 (s) 2.1 ( 2.1a 3.1 ( 3.1b 0.9 ( 1.3a 0.8 ( 0.9b
Dimethylamine 2.73 (s) 8.8 ( 3.6b 8.3 ( 3.3 7.0 ( 1.8b 5.6 ( 2.3
a Data are presented as area-normalized intensities of representative metabolite signals, and expressed as means ( standard deviation. *Mannitol andxylose areas were obtained from full NMR spectrum. Because mannitol and xylose were not detected (ND) at time point 0, the values for other metabolitescorrespond to baseline signals for those spectra. Other areas were calculated after removing mannitol and xylose regions. a, b: Significant time pointdifferences within stress groups at 99% and 95% confidence levels, respectively.
Metabolic Response to Cold Pain Stress research articles
Journal of Proteome Research • Vol. 8, No. 10, 2009 4807
Abbreviations: CPMG, Carr-Purcell-Meiboom-Gill; HDL,high density lipoprotein; IBS, irritable bowel syndrome, LDL,low density lipoprotein; LS, low stress; MS, moderate-highstress; NMR, nuclear magnetic resonance; O-PLS-DA, orthogo-nal projection to latent structure discriminant analysis; PCA,principal component analysis; SSRS, subjective stress ratingscale; TSP, sodium 3-(trimethylsilyl)-1-[2,2,3,3-2H4] propionate;VLDL, very low density lipoprotein.
Acknowledgment. We are grateful to Anny Blondel-Lubrano for her assistance in measuring plasma lipids; LionelTornier and Francia Arce Vera for sample preparation and dataacquisition; Ziad Ramadan for statistical inputs and helpfuldiscussions. We also acknowledge Milagros Gallart, MontseCasellas, Carmen Alastrue, and Marıa Antolın for theircollaboration in the preparation of perfusion buffers andsample analysis. We also thank Anna Aparici, Maria TeresaCasaus and Purificacion Rodrıguez for their assistance in theperformance of jejunal perfusion. Grant Support: Supported inpart by Nestec S. A. and the Spanish Ministry of Sanidad yConsumo, Subdireccion General de Investigacion Sanitaria,Instituto Carlos III, Fondo de Investigacion Sanitaria. Dr. C.Alonso (CM04/00019), Dr. M. Vicario (CD05/00060), Dr. L.Ramos (CM05/00055), and Dr. J. Santos (F.I.S. 05/1423) werethe recipients of these grants. The role of Nestec S.A. in thisstudy was not limited to provide funding, yet includedcollaboration in the processing of samples, in the analysis andinterpretation of data, in the writing and review of themanuscript, and in the decision to submit the paper forpublication to this journal.
Supporting Information Available: Supplementarymaterial and methods; Supplementary Figure 1, autonomicresponse to cold stress; Supplementary Figure 2, psychologicalresponse to cold stress. This material is available free of chargevia the Internet at http://pubs.acs.org.
References(1) American College of Gastroenterology IBS Task Force. An evidence-
based position statement on the management of irritable bowelsyndrome. Am. J. Gastroenterol. 2009, 104, S1–S35.
(2) Williams, J. G.; Roberts, S. E.; Ali, M. F.; Cheung, W. Y.; Cohen,D. R.; Demery, G.; Edwards, A.; Greer, M.; Hellier, M. D.; Hutchings,H. A.; Ip, B.; Longo, M. F.; Russell, I. T.; Snooks, H. A.; Williams,J. C. Gastroenterology services in the UK. The burden of disease,and the organisation and delivery of services for gastrointestinaland liver disorders: a review of the evidence. Gut 2007, 56 Suppl1, 1–113.
(3) Chadwick, V. S.; Chen, W.; Shu, D.; Paulus, B.; Bethwaite, P.; Tie,A.; Wilson, I. Activation of the mucosal immune system in irritablebowel syndrome. Gastroenterology 2002, 122 (7), 1778–1783.
(4) Cremon, C.; Gargano, L.; Morselli-Labate, A. M.; Santini, D.;Cogliandro, R. F.; De, G. R.; Stanghellini, V.; Corinaldesi, R.;Barbara, G. Mucosal immune activation in irritable bowel syn-drome: gender-dependence and association with digestive symp-toms. Am. J. Gastroenterol. 2009, 104 (2), 392–400.
(5) Guilarte, M.; Santos, J.; de, T. I.; Alonso, C.; Vicario, M.; Ramos,L.; Martinez, C.; Casellas, F.; Saperas, E.; Malagelada, J. R.Diarrhoea-predominant IBS patients show mast cell activation andhyperplasia in the jejunum. Gut 2007, 56 (2), 203–209.
(6) Rodriguez, L. A.; Ruigomez, A. Increased risk of irritable bowelsyndrome after bacterial gastroenteritis: cohort study. Br. Med. J.1999, 318 (7183), 565–566.
(7) von Stein, P.; Lofberg, R.; Kuznetsov, N. V.; Gielen, A. W.; Persson,J. O.; Sundberg, R.; Hellstrom, K.; Eriksson, A.; Befrits, R.; Ost, A.;von Stein, O. D. Multigene analysis can discriminate betweenulcerative colitis, Crohn’s disease, and irritable bowel syndrome.Gastroenterology 2008, 134 (7), 1869–1881.
(8) Mayer, E. A. Clinical practice. Irritable bowel syndrome. N. Engl.J. Med. 2008, 358 (16), 1692–1699.
(9) Chang, L.; Toner, B. B.; Fukudo, S.; Guthrie, E.; Locke, G. R.;Norton, N. J.; Sperber, A. D. Gender, age, society, culture, and thepatient’s perspective in the functional gastrointestinal disorders.Gastroenterology 2006, 130 (5), 1435–1446.
(10) Gwee, K. A.; Leong, Y. L.; Graham, C.; McKendrick, M. W.; Collins,S. M.; Walters, S. J.; Underwood, J. E.; Read, N. W. The role ofpsychological and biological factors in postinfective gut dysfunc-tion. Gut 1999, 44 (3), 400–406.
(11) Bennett, E. J.; Tennant, C. C.; Piesse, C.; Badcock, C. A.; Kellow,J. E. Level of chronic life stress predicts clinical outcome in irritablebowel syndrome. Gut 1998, 43 (2), 256–261.
(12) Faresjo, A.; Grodzinsky, E.; Johansson, S.; Wallander, M. A.; Timpka,T.; Akerlind, I. Psychosocial factors at work and in every day lifeare associated with irritable bowel syndrome. Eur J Epidemiol.2007, 22 (7), 473–480.
(13) Nicholl, B. I.; Halder, S. L.; Macfarlane, G. J.; Thompson, D. G.;O’Brien, S.; Musleh, M.; McBeth, J. Psychosocial risk markers fornew onset irritable bowel syndrome--results of a large prospectivepopulation-based study. Pain 2008, 137 (1), 147–155.
(14) Labus, J. S. In search of mechanisms of change in treatmentoutcome research: mediators and moderators of psychological andpharmacological treatments for irritable bowel syndrome. Gas-troenterology 2007, 133 (2), 702–705.
(15) Santos, J.; Alonso, C.; Vicario, M.; Ramos, L.; Lobo, B.; Malagelada,J. R. Neuropharmacology of stress-induced mucosal inflammation:implications for inflammatory bowel disease and irritable bowelsyndrome. Curr. Mol. Med. 2008, 8 (4), 258–273.
(16) Shen, L.; Turner, J. R. Role of epithelial cells in initiation andpropagation of intestinal inflammation. Eliminating the static: tightjunction dynamics exposed. Am. J. Physiol.: Gastrointest. LiverPhysiol. 2006, 290 (4), G577–G582.
(17) Sansonetti, P. J. War and peace at mucosal surfaces. Nat. Rev.Immunol. 2004, 4 (12), 953–964.
(18) Caso, J. R.; Leza, J. C.; Menchen, L. The effects of physical andpsychological stress on the gastro-intestinal tract: lessons fromanimal models. Curr. Mol. Med. 2008, 8 (4), 299–312.
(19) Santos, J.; Perdue, M. H. Stress and neuroimmune regulation ofgut mucosal function. Gut 2000, 47 Suppl 4, iv49–iv51.
(20) Soderholm, J. D.; Yang, P. C.; Ceponis, P.; Vohra, A.; Riddell, R.;Sherman, P. M.; Perdue, M. H. Chronic stress induces mast cell-dependent bacterial adherence and initiates mucosal inflamma-tion in rat intestine. Gastroenterology 2002, 123 (4), 1099–1108.
(21) Barclay, G. R.; Turnberg, L. A. Effect of psychological stress on saltand water transport in the human jejunum. Gastroenterology 1987,93 (1), 91–97.
(22) Wallon, C.; Yang, P. C.; Keita, A. V.; Ericson, A. C.; McKay, D. M.;Sherman, P. M.; Perdue, M. H.; Soderholm, J. D. Corticotropin-releasing hormone (CRH) regulates macromolecular permeabilityvia mast cells in normal human colonic biopsies in vitro. Gut 2008,57 (1), 50–58.
(23) Gareau, M. G.; Silva, M. A.; Perdue, M. H. Pathophysiologicalmechanisms of stress-induced intestinal damage. Curr. Mol. Med.2008, 8 (4), 274–281.
(24) Dunlop, S. P.; Hebden, J.; Campbell, E.; Naesdal, J.; Olbe, L.;Perkins, A. C.; Spiller, R. C. Abnormal intestinal permeability insubgroups of diarrhea-predominant irritable bowel syndromes.Am. J. Gastroenterol. 2006, 101 (6), 1288–1294.
(25) Alonso, C.; Santos, J.; Guilarte, M.; Vicario, M.; Antolın, M.; Saperas,E.; Malagelada, J. R. Corticotropin-releasing hormone promotesjejunal proinflammatory responses in IBS patients. Gastroenterol-ogy 2004, 126 (4, Suppl. 2), A703.
(26) Alonso, C.; Guilarte, M.; Vicario, M.; Ramos, L.; Ramadan, Z.;Antolin, M.; Martinez, C.; Rezzi, S.; Saperas, E.; Kochhar, S.; Santos,J.; Malagelada, J. R. Maladaptive Intestinal Epithelial Responsesto Life Stress May Predispose Healthy Women to Gut MucosalInflammation. Gastroenterology 2008, 135 (1), 163–172.
(27) Nicholson, J. K.; Holmes, E.; Lindon, J. C. Metabonomics; Under-standing the consequences of xenobiotic induced metabolicdysfunction using NMR spectroscopy of the biofluids, multivariatestatistics and expert system. Xenobiotica 1999, 29 (11), 1181–1189.
(28) Teague, C. R.; Dhabhar, F. S.; Barton, R. H.; Beckwith-Hall, B.;Powell, J.; Cobain, M.; Singer, B.; McEwen, B. S.; Lindon, J. C.;Nicholson, J. K.; Holmes, E. Metabonomic studies on the physi-ological effects of acute and chronic psychological stress inSprague-Dawley rats. J. Proteome Res. 2007, 6 (6), 2080–2093.
(29) Wang, Y.; Holmes, E.; Tang, H.; Lindon, J. C.; Sprenger, N.; Turini,M. E.; Bergonzelli, G.; Fay, L. B.; Kochhar, S.; Nicholson, J. K.Experimental metabonomic model of dietary variation and stressinteractions. J. Proteome Res. 2006, 5 (7), 1535–1542.
(30) Martin, F.-P. J.; Wang, Y.; Sprenger, N.; Yap, I. K. S.; Rezzi, S.;Ramadan, Z.; Pere-Trepat, E.; Rochat, F.; Cherbut, C.; van Bladeren,
research articles Rezzi et al.
4808 Journal of Proteome Research • Vol. 8, No. 10, 2009
P.; Fay, L. B.; Kochhar, S.; Lindon, J. C.; Holmes, E.; Nicholson,J. K. Top-down Systems biology integration of conditional prebiotictransgenomic interactions in a humanized microbiome mousemodel. Mol. Syst. Biol. 2008, 4, 205.
(31) Rezzi, S.; Ramadan, Z.; Fay, L. B.; Kochhar, S. Nutritional meta-bonomics: applications and perspectives. J. Proteome Res. 2007, 6(2), 513–525.
(32) Bjerrum, J. T.; Nielsen, O. H.; Wang, Y. L.; Olsen, J. Technologyinsight: metabonomics in gastroenterology-basic principles andpotential clinical applications. Nat. Clin. Pract. Gastroenterol.Hepatol. 2008, 5 (6), 332–343.
(33) Talley, N. J.; Stanghellini, V.; Heading, R. C.; Koch, K. L.; Malage-lada, J. R.; Tytgat, G. N. Functional gastroduodenal disorders. Gut1999, 45 (Suppl. 2), II37–II42.
(34) Thompson, W. G.; Longstreth, G. F.; Drossman, D. A.; Heaton,K. W.; Irvine, E. J.; Muller-Lissner, S. A. Functional bowel disordersand functional abdominal pain. Gut 1999, 45 (Suppl. 2), II43–II47.
(35) Beck, A.; Ward, C.; Mendelson, M.; Mock, J.; Erbaugh, J. Aninventory for measuring depression. Arch. Gen. Psychiatry 1961,4, 561–571.
(36) Holmes, T. H.; Rahe, R. H. The social readjustment rating scale.J. Psychosom. Res. 1967, 11 (2), 213–218.
(37) Lovallo, W. The cold pressor test and autonomic function: a reviewand integration. Psychophysiology 1975, 12 (3), 268–282.
(38) Naliboff, B. D.; Benton, D.; Solomon, G. F.; Morley, J. E.; Fahey,J. L.; Bloom, E. T.; Makinodan, T.; Gilmore, S. L. Immunologicalchanges in young and old adults during brief laboratory stress.Psychosom. Med. 1991, 53 (2), 121–132.
(39) Rezzi, S.; Ramadan, Z.; Martin, F. P.; Fay, L. B.; Bladeren, P. V.;Lindon, J. C.; Nicholson, J. K.; Kochhar, S. Human metabolicphenotypes link directly to specific dietary preferences in healthyindividuals. J. Proteome Res. 2007, 6 (11), 4469–4477.
(40) Wold, S.; Esbensen, K.; Geladi, P. Principal component analysis.Chemom. Intell. Lab. Syst. 1987, 2 (1-3), 37–52.
(41) Wold, S.; Hellberg, S.; Lundstedt, T.; Sjostrom, M. PLS Modelingwith latent variables in two or more dimensions. PLS Meeting,Frankfurt, 1987.
(42) Trygg, J. O2-PLS for qualitative and quantitative analysis inmultivariate calibration. J. Chemom. 2002, 16 (6), 283–293.
(43) Cloarec, O.; Dumas, M. E.; Trygg, J.; Craig, A.; Barton, R. H.; Lindon,J. C.; Nicholson, J. K.; Holmes, E. Evaluation of the orthogonalprojection on latent structure model limitations caused by chemi-cal shift variability and improved visualization of biomarkerchanges in 1H NMR spectroscopic metabonomic studies. Anal.Chem. 2005, 77 (2), 517–526.
(44) Holmes, E.; Cloarec, O.; Nicholson, J. K. Probing latent biomarkersignatures and in vivo pathway activity in experimental diseasestates via statistical total correlation spectroscopy (STOCSY) ofbiofluids: Application to HgCl2 toxicity. J. Proteome Res. 2006, 5(6), 1313–1320.
(45) Nicholson, J. K.; Foxall, P. J.; Spraul, M.; Farrant, R. D.; Lindon,J. C. 750 MHz 1H and 1H-13C NMR spectroscopy of human bloodplasma. Anal. Chem. 1995, 67 (5), 793–811.
(46) Bales, J. R.; Higham, D. P.; Howe, I.; Nicholson, J. K.; Sadler, P. J.Use of high resolution proton nuclear magnetic resonance spec-troscopy for rapid multicomponent analysis of urine. Clin. Chem.1984, 30, 426–432.
(47) Noble, R. E. Diagnosis of stress. Metabolism 2002, 51 (6 Suppl. 1),37–39.
(48) Souba, W. W.; Herskowitz, K.; Salloum, R. M.; Chen, M. K.; Austgen,T. R. Gut glutamine metabolism. JPEN, J. Parenter. Enteral Nutr.1990, 14 (4 Suppl), 45S–50S.
(49) Wischmeyer, P. E. Glutamine: role in gut protection in criticalillness. Curr. Opin. Clin. Nutr. Metab. Care 2006, 9 (5), 607–612.
(50) Ricart-Jane, D.; Rodriguez-Sureda, V.; Benavides, A.; Peinado-Onsurbe, J.; Lopez-Tejero, M. D.; Llobera, M. Immobilization stressalters intermediate metabolism and circulating lipoproteins in therat. Metabolism 2002, 51 (7), 925–931.
(51) Clarkson, T. B.; Adams, M. R.; Kaplan, J. R.; Koritnik, D. R.Psychosocial and reproductive influences on plasma lipids, lipo-proteins, and atherosclerosis in nonhuman primates. J. Lipid Res.1984, 25 (13), 1629–1634.
(52) Rolston, D. D.; Mathan, V. I. Xylose transport in the humanjejunum. Dig. Dis. Sci. 1989, 34 (4), 553–558.
(53) Laker, M. F.; Bull, H. J.; Menzies, I. S. Evaluation of mannitol foruse as a probe marker of gastrointestinal permeability in man. Eur.J. Clin. Invest. 1982, 12 (6), 485–491.
(54) Gunnar, M.; Quevedo, K. The neurobiology of stress and develop-ment. Annu. Rev. Psychol. 2007, 58, 145–173.
(55) Okamoto, H.; Ishikawa, A.; Yoshitake, Y.; Kodama, N.; Nishimuta,M.; Fukuwatari, T.; Shibata, K. Diurnal variations in human urinaryexcretion of nicotinamide catabolites: effects of stress on themetabolism of nicotinamide. Am. J. Clin. Nutr. 2003, 77 (2), 406–410.
(56) Smythe, G. A.; Pascoe, W. S.; Storlien, L. H. Hypothalamicnoradrenergic and sympathoadrenal control of glycemia afterstress. Am. J. Physiol. 1989, 256 (2 Pt. 1), E231-E235.
(57) Freeman, L. J.; Nixon, P. G.; Sallabank, P.; Reaveley, D. Psychologi-cal stress and silent myocardial ischemia. Am. Heart J. 1987, 114(3), 477–482.
PR900525W
Metabolic Response to Cold Pain Stress research articles
Journal of Proteome Research • Vol. 8, No. 10, 2009 4809
Related Documents