See discussions, stats, and author profiles for this publication at: https://www.researchgate.net/publication/258704147 Metabolic Syndrome Remodels Electrical Activity of the Sinoatrial Node and Produces Arrhythmias in Rats Article in PLoS ONE · November 2013 DOI: 10.1371/journal.pone.0076534 · Source: PubMed CITATIONS 21 READS 521 5 authors, including: Some of the authors of this publication are also working on these related projects: Regulatory networks of metabolic syndrome and type 2 diabetes mellitus View project Nerve Growth Factor in insulin secretion and beta cell development View project Alondra Albarado-Ibañez Benemerita Universidad autónoma de puebla 14 PUBLICATIONS 82 CITATIONS SEE PROFILE José Everardo Avelino-Cruz Benemérita Universidad Autónoma de Puebla 20 PUBLICATIONS 703 CITATIONS SEE PROFILE Myrian Velasco Universidad Nacional Autónoma de México 31 PUBLICATIONS 241 CITATIONS SEE PROFILE Julián Torres-Jácome Benemérita Universidad Autónoma de Puebla 21 PUBLICATIONS 295 CITATIONS SEE PROFILE All content following this page was uploaded by Marcia Hiriart on 28 May 2014. The user has requested enhancement of the downloaded file.

Welcome message from author
This document is posted to help you gain knowledge. Please leave a comment to let me know what you think about it! Share it to your friends and learn new things together.
Transcript

See discussions, stats, and author profiles for this publication at: https://www.researchgate.net/publication/258704147
Metabolic Syndrome Remodels Electrical Activity of the Sinoatrial Node and
Produces Arrhythmias in Rats
Article in PLoS ONE · November 2013
DOI: 10.1371/journal.pone.0076534 · Source: PubMed
CITATIONS
21READS
521
5 authors, including:
Some of the authors of this publication are also working on these related projects:
Regulatory networks of metabolic syndrome and type 2 diabetes mellitus View project
Nerve Growth Factor in insulin secretion and beta cell development View project
Alondra Albarado-Ibañez
Benemerita Universidad autónoma de puebla
14 PUBLICATIONS 82 CITATIONS
SEE PROFILE
José Everardo Avelino-Cruz
Benemérita Universidad Autónoma de Puebla
20 PUBLICATIONS 703 CITATIONS
SEE PROFILE
Myrian Velasco
Universidad Nacional Autónoma de México
31 PUBLICATIONS 241 CITATIONS
SEE PROFILE
Julián Torres-Jácome
Benemérita Universidad Autónoma de Puebla
21 PUBLICATIONS 295 CITATIONS
SEE PROFILE
All content following this page was uploaded by Marcia Hiriart on 28 May 2014.
The user has requested enhancement of the downloaded file.

Metabolic Syndrome Remodels Electrical Activity of theSinoatrial Node and Produces Arrhythmias in RatsAlondra Albarado-Ibanez1, Jose Everardo Avelino-Cruz2, Myrian Velasco1, Julian Torres-Jacome3*,
Marcia Hiriart1*
1 Departamento de Neurodesarrollo y Fisiologıa, Instituto de Fisiologıa Celular, Universidad Nacional Autonoma de Mexico. Mexico D.F., Mexico, 2 Laboratorio de
Cardiologıa Molecular, Instituto de Fisiologıa, Benemerita Universidad Autonoma de Puebla, Puebla, Puebla, Mexico, 3 Laboratorio de Fisiopatologıa Cardiovascular,
Instituto de Fisiologıa, Benemerita Universidad Autonoma de Puebla, Puebla, Puebla, Mexico
Abstract
In the last ten years, the incidences of metabolic syndrome and supraventricular arrhythmias have greatly increased.The metabolic syndrome is a cluster of alterations, which include obesity, hypertension, hypertriglyceridemia, glucoseintolerance and insulin resistance, that increase the risk of developing, among others, atrial and nodalarrhythmias. The aim of this study is to demonstrate that metabolic syndrome induces electrical remodeling of thesinus node and produces arrhythmias. We induced metabolic syndrome in 2-month-old male Wistar rats byadministering 20% sucrose in the drinking water. Eight weeks later, the rats were anesthetized and theelectrocardiogram was recorded, revealing the presence of arrhythmias only in treated rats. Using conventionalmicroelectrode and voltage clamp techniques, we analyzed the electrical activity of the sinoatrial node. We observedthat in the sinoatrial node of ‘‘metabolic syndrome rats’’, compared to controls, the spontaneous firing of all cellsdecreased, while the slope of the diastolic depolarization increased only in latent pacemaker cells. Accordingly, thepacemaker currents If and Ist increased. Furthermore, histological analysis showed a large amount of fat surroundingnodal cardiomyocytes and a rise in the sympathetic innervation. Finally, Poincare plot denoted irregularity in the R-Rand P-P ECG intervals, in agreement with the variability of nodal firing potential recorded in metabolic syndromerats. We conclude that metabolic syndrome produces a dysfunction SA node by disrupting normal architecture andthe electrical activity, which could explain the onset of arrhythmias in rats.
Citation: Albarado-Ibanez A, Avelino-Cruz JE, Velasco M, Torres-Jacome J, Hiriart M (2013) Metabolic Syndrome Remodels Electrical Activity of the Sinoatrial Nodeand Produces Arrhythmias in Rats. PLoS ONE 8(11): e76534. doi:10.1371/journal.pone.0076534
Editor: Sompop Bencharit, University of North Carolina at Chapel Hill, United States of America
Received May 27, 2013; Accepted September 1, 2013; Published November 8, 2013
Copyright: � 2013 Albarado-Ibanez et al. This is an open-access article distributed under the terms of the Creative Commons Attribution License, which permitsunrestricted use, distribution, and reproduction in any medium, provided the original author and source are credited.
Funding: Gobierno del Distrito Federal PICDS08-72, CONACYT CB2009-131647, and DGAPA-PAPIIT IN215611, Universidad Nacional utonoma de Mexico. The´funders had no role in study design, data collection and analysis, decision to publish, or preparation of the manuscript.
Competing Interests: The authors declare that no competing interests exist.
* E-mail: [email protected] (JTJ); [email protected] (MH)
Introduction
Sedentary lifestyle and fast food have positioned the
metabolic syndrome (MeS) as the epidemic of this century
[1,2]. MeS, increase the risk factor for developing diabetes
mellitus type 2 (DM2), and cardiovascular diseases [3,4].
MeS also increases the probability of suffering supraventric-
ular arrhythmias, like in the Sick Sinus Syndrome (SSS) and
the abnormal P-wave. Moreover, the risk of developing
atrial fibrillation increases in patients with obesity and MeS
[5,6,7]. Atrial fibrillation is the most common tachyarrhyth-
mia associated with an increased morbidity and mortality
[7,8,9].
The precise mechanisms through which MeS causes atrial
fibrillation are not completely understood, but the syndrome has
been associated with electrical remodeling of the atrium and
sinoatrial (SA) node [8,10]; specifically, an increase in action
potential duration and changes in the refractory period, as well as
changes in the passive electrical properties in both tissues
[11,12,13].
Indeed, it has been demonstrated that old obese rats undergo
electrical remodeling of pacemaker activity [14]. Furthermore, Lin
et al proposed that excessive deposits of fat on the heart could
cause electrical remodeling of the atrium, since adipocytes on the
epicardial surface interact with cardiomyocytes. This generates
ectopic excitation foci and increases oxidative stress because
adipose tissue releases adipokines and pro-inflammatory cytokines
[15,16].
In the same way, mortal arrhythmias are associated with a
reduced sympathetic activity or with a reduced vagal tone [7,17].
In fact, the quantification of sympathetic and vagal activity, taken
together with the study of heart rate variability has been proposed
as a marker for supraventricular arrhythmias [18,19]. Actually,
heart rate variability is considered one of the best markers of AF
by cardiologists [20].
Currently, there are no specific studies correlating MeS
and cardiac alterations. Most studies have correlated the
individual conditions of MeS and the risk to develop
cardiovascular disease [1,2]; however, specific cardiac alter-
ations induced by MeS have not been reported. In this work
we investigated if MeS produces electrical remodeling of the
SA node and if these changes predispose nodal tissue to
suffer arrhythmias that could eventually spread to the
atrium.
PLOS ONE | www.plosone.org 1 November 2013 | Volume 8 | Issue 11 | e76534
A

Materials and Methods
AnimalsAll methods used in this study were approved by the Animal
Care Committee of the Instituto de Fisiologıa Celular, Universi-
dad Nacional Autonoma de Mexico. Animal care was to the
‘‘International Guiding Principles for Biomedical Research
Involving Animals’’, Council for International Organizations of
Medical Sciences, 2010. Wistar rats were obtained from the local
animal facility, maintained with a 12:12 h light-dark cycle (0600-
1800), and allowed free access to standard laboratory rat diet and
tap water.
Metabolic syndrome modelWe used 2-months old male Wistar rats weighing between 250
and 280 g. Metabolic syndrome was induced by including 20%
sucrose in the drinking water for 8 weeks [21]. After treatment, we
took a blood sample to measure glucose, triglycerides, cholesterol,
fatty acids and HDL-c. Additionally, central obesity, body weight
and epididymal fat were analyzed.
ElectrocardiographyAn electrocardiogram (ECG) was performed on rats (8 control
animals and 7 with MeS) anesthetized with sodium pentobarbital
(63 mg.Kg21, IP). Bipolar ECGs were recorded using subcutane-
ous needle electrodes and following ECG lead I configuration.
ECG signal was 700X amplified and acquired at 1 KHz for
5 minutes. Data was stored in a personal computer and analyzed
off-line using ClampFit (Molecular Devices). All rats were
continuously monitored to guarantee right ventilation and
temperature.
Sinoatrial node dissectionSA node was prepared as previously reported [22]. Rats were
heparinized (1000 U/kg IP) and anesthetized with sodium
pentobarbital (63 mg.kg21, IP). The heart was immediately
excised, hung up and perfused in a Langendorff system at 36.5uC.
For the isolated atrial preparation the ventricles were removed
and the atria were stretched and pinned to the bottom of a sylgard-
coated chamber (Figure S1). Once the SA node was cleaned of
surrounding tissues, it was fixed with tungsten pins to a sylgard-
based chamber with the endocardial face up. Tissue was left
resting for three hours and then spontaneous action potentials (AP)
were recorded.
Action potential recordings in sinoatrial nodepreparation
The AP of SA nodes were recorded using sharp microelectrodes
of borosilicate (WPI Inc.) filled with 3M KCl and resistance of 25–
35 MV. The sensed signal was amplified with a WPI Duo 776
electrometer, digitalized (SCB-68 Quick Reference label, National
Instruments), and captured at 10 KHz on a personal computer
where it was analyzed using ClampFit (Molecular Devices) and
Origin 7.0 (Southampton) [23].
To record spontaneous electrical activity we first localized the
nodal artery on the SA node [22], and the electrical activity was
recorded for 60 seconds. Using the same preparation we explored
the whole sinoatrial node, as explained in Figure S1, every AP was
associated with a recording position.
Isolation of sinoatrial node cellsSinoatrial nodal cells were isolated as reported by Arechiga-
Figueroa, et al., 2010. Briefly, rats were anesthetized and
heparinized, and the heart was excised and mounted via the
aorta to a Langendorff perfusion system. After Tyrode solution
perfusion, the heart was digested with enzymatic method for
12 minutes in calcium-free solution. Then, the SA node was
dissected out from the heart, cut into small pieces and incubated in
0.5 mg/mL collagenase and 0.2 mg/mL elastase at 36uC, for at
least 5 minutes. Finally, we proceeded with mechanical dissocia-
tion in Kraft-Brueh (KB) solution.
Voltage clamp experimentsWe used the patch clamp technique in whole cell configuration
to record pacemaker currents, the patch pipettes had a resistance
between 2 and 4 MOhm. The signal was captured at 10 KHz,
amplified (Axopatch 1C, Axon Instrument Inc.), digitalized
(Digidata TL1 interface, Axon Instrument Inc.), and stored on a
personal computer. Recordings were analyzed off-line using
pClamp 9.2 (Molecular Devices) and Origin 8.0 (OriginLab
corporation).
The cardiomyocytes were placed in a perfusion chamber
mounted to an inverted microscope (Axioscope, Nikon). Only
beating, spindle-shaped cells were selected for the study in order to
avoid atrial cardiomyocytes. The capacitances of cells were ranged
from 20 to 65 pF; these values are similar to those reported for
nodal cells [24].
Protocol currentsThe funny current (If) was evoked by square voltage pulses with
a holding potential of 240 mV and going from 220 mV to
2120 mV in 10 mV increments. The initial step lasted 2.5 sec-
onds and successive pulses were decreased in 200 ms, time
between pulses was 20 seconds [23,24].
The potassium current (Ik1) was elicited from a holding potential
of 260 mV by square voltage pulses lasting 1 second and going
from 260 mV to 2120 mV in 10 mV increments, every
15 seconds.
The sustained current (Ist) is an unspecific cationic was fixed the
membrane potential at 280 mV then applied hyperpolarizing
potentials from 280 mV to 2120 mV for 500 ms every
10 seconds.
SolutionsThe Tyrode solution contained (mM) 118 NaCl, 5.4 KCl, 1.05
MgCl2, 0.42 NaH2PO4, 1.8 CaCl2, 24 NaHCO3 and 11 glucose.
The solution was equilibrated with 95% O2 and 5% CO2 with pH
of 7.4 [23].
The Tyrode calcium-free solution was prepared omitting CaCl2 in
the Tyrode solution.
The Kraft-Brueh (KB) solution contained (mM): 80 K-glutamate,
40 KCl, 10 KH2PO4, 20 taurine, 0.2 EGTA, 10 HEPES, 0.5
creatine, 5 MgSO4 and 10 succinic acid; pH was adjusted to 7.4
with KOH [23]. The solution was saturated with 100% O2.
The external patch solution to record If, Ik1 and Ist currents had the
following composition (mM): 136 NaCl2, 4 KCl, 2 MgCl2, 11
glucose, 10 HEPES, and 1.8 CaCl2; pH was adjusted to 7.4 with
NaOH.
To record If or Ik1 currents the solutions were supplemented
with 0.5 mM BaCl2 or 1 mM CsCl, respectively [24]. In the case
of Ist recordings, the solution was supplemented, either with
0.5 mM BaCl2 or 1 mM CsCl.
Patch pipettes were filled with internal solution with the following
composition (mM): 80 potassium aspartate, 10 KH2PO4, 1
MgSO4.7 H2O, 40 KCl, 10 HEPES, 10 EGTA, 3 Na2ATP and
0.2 NaGTP; pH adjusted to 7.3 with KOH.
Sinoatrial Remodeling in Metabolic Syndrome
PLOS ONE | www.plosone.org 2 November 2013 | Volume 8 | Issue 11 | e76534
Immunofluorescent stainingIndirect immunostaining was analyzed using confocal micros-
copy (Confocal Olympus FV1000, Olympus America Inc.). SA
nodes were isolated as mentioned above, embedded in Tissue-Tek
(Sakura), frozen, and cut coronally into 5 mm-thick slices
beginning from endocardium. The antibodies used were anti-
tyrosine hydroxylase (1:250 rabbit polyclonal antibody; Millipore
Corporation) and CY-5 (1:200, rabbit polyclonal antibody;
Jackson ImmunoResearch laboratory Inc.).
Lipid stainingThe oil red-O stain was used to detect hydrophobic lipids
(cholesteryl ester and triglycerides). The frozen sections were fixed
with formalin for 3 minutes, then washed three times with PBS
and placed in absolute propylene glycol for 4 minutes. Staining
was by immersion in a warm red-oil solution for 10 minutes, and
then sections were washed in 85% propylene-glycol for 3 minutes.
After washing, a counterstaining was performed with Gill’s
hematoxylin. Finally, slices were mounted in glycerin jelly.
Rate variabilityTo quantify the variation in heart rate and the firing rate nodal
we used a Poincare plot constructed with R-R and P-P intervals of
the electrocardiogram and the interpotential intervals of the
spontaneous AP respectively. To construct the Poincare plot was
plotted the second interval I(n+1) as function of the first I(n). To
quantify the variability, we calculated standard deviation of the
distances between all points of the diagram and the line
Figure 1. High carbohydrate diet produces MeS in Wistar rats.(A) Metabolic parameters associated with MeS. (B) Intraperitonealglucose tolerance test in rats with MeS (control: n = 11; MeS: n = 13). *p#0.05 vs. control.doi:10.1371/journal.pone.0076534.g001
Figure 2. MeS increased risk of suffering arrhythmias. (A) Uppertrace, representative electrocardiogram (ECG) of control rats. Lowertrace; rats with MeS presented irregular sinusal rhythm (see asterisks).(B) Poincare plot of ECG R-R interval evidenced an increase in the heartrate variability in MeS (n = 7; black) vs. control animals (n = 8; grey). Theline dot represents the length and width of the area surrounding thepoints in Poincare plot. (This plot was built with each interval R-R of ECGas a function of the previous R-R interval).doi:10.1371/journal.pone.0076534.g002
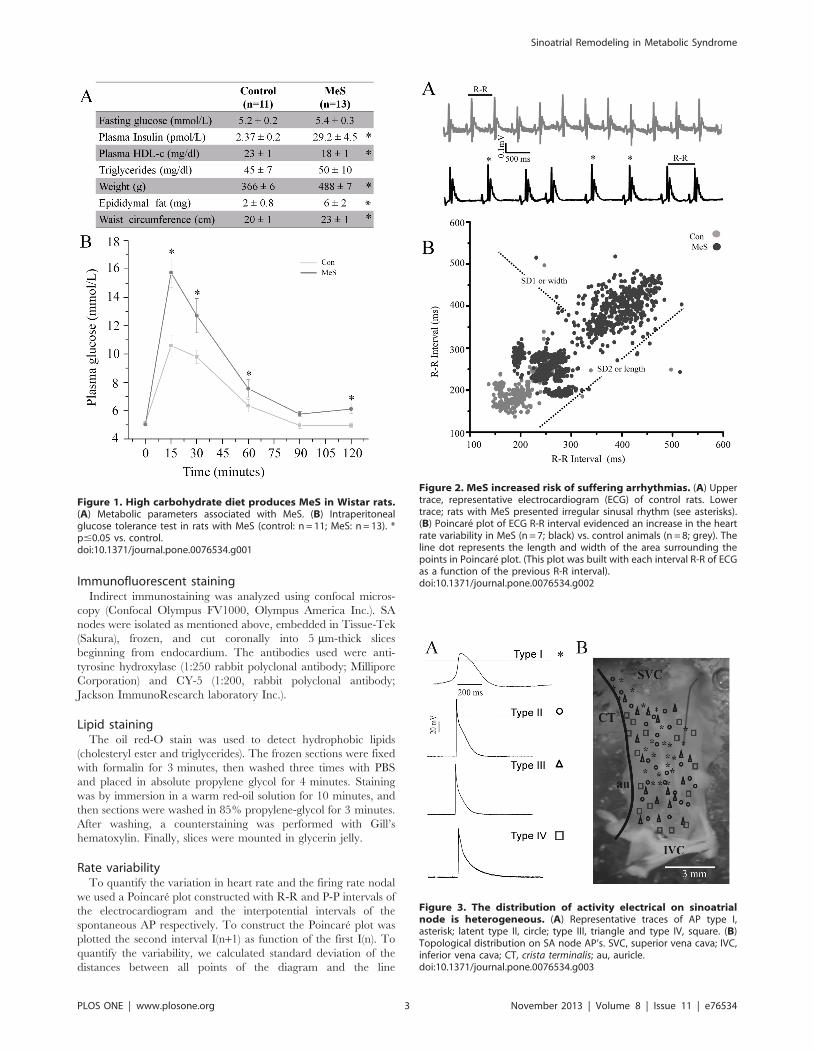
Figure 3. The distribution of activity electrical on sinoatrialnode is heterogeneous. (A) Representative traces of AP type I,asterisk; latent type II, circle; type III, triangle and type IV, square. (B)Topological distribution on SA node AP’s. SVC, superior vena cava; IVC,inferior vena cava; CT, crista terminalis; au, auricle.doi:10.1371/journal.pone.0076534.g003
Sinoatrial Remodeling in Metabolic Syndrome
PLOS ONE | www.plosone.org 3 November 2013 | Volume 8 | Issue 11 | e76534

Figure 4. MeS remodels the electrical activity of sinoatrial node. (A) MeS decreases firing rate of true and latent pacemaker cells, (B) withoutany change in their location. (C). Note that true pacemaker cells in rats with MeS fire AP at higher frequencies than latent cells. 1 p#0.05 vs. control.doi:10.1371/journal.pone.0076534.g004
Sinoatrial Remodeling in Metabolic Syndrome
PLOS ONE | www.plosone.org 4 November 2013 | Volume 8 | Issue 11 | e76534

I(n+1) = I(n), this value is called SD1 or width of the plot. In the
same way, the standard deviation of the distances between the
points of the graph and the line I(n+1) = 2I(n)+2I(n) is called SD2
or length. SD1/SD2 is the index of rate variability [18,19,20].
Action potential analysisA file corresponding to one minute of spontaneous activity of
sinoatrial node was opened in pClamp 9.2 software (Axon
Instruments) and it was calculated the following parameters
amplitude, peak, rate of depolarization, upstroke velocity, action
potential duration (APD), and frequency of firing, these param-
eters were used to classify the nodal action potential (See Figure
S2).
Patch clamp recordingThe current at the end of each test pulse of the Protocol was
measured for the current to voltage graphic; all values corre-
sponding to each experimental condition were averaged and
compared via a t-test. Final graphs were normalized by cell
capacitance.
Data analysis and statisticsAll data is presented as the mean 6 standard error unless
otherwise specified. To compare the same variable of two types of
AP we used the ANOVA-test. To assess differences between two
metabolic conditions of the same variable we used the t-test.
Values were considered statistically significant if p value was
inferior to 0.05, denoted with an * or 1.
Results
Metabolic parameters of the MeS modelThe MeS group consisted of 13 rats, all of which presented at
least three signs of the syndrome. Body weight and waist
circumference increased by 23% and 14%, respectively, in
controls and treated animals (p,0.05); epididymal fat, a central
obesity marker in rats, increased by 3 times (from 260.8 g in
controls to 662 g in the treated rats p,0.05) compared to their
age-matched littermates in the control group. We also found a 10-
fold increase in the insulin levels in plasma (Figure 1A).
Additionally, an intraperitoneal glucose tolerance test revealed
reduced glucose metabolism in MeS rats (Figure 1B).
Electrocardiographic changes in MeSElectrocardiographic studies evidenced in the MeS model a
lower heart rate (control = 4.260.01, n = 7 Hz vs.
MeS = 3.760.7 Hz, n = 8) and an increase in beat variability
compared to control rats. In addition, 43% of rats with MeS
showed an increase in the R-R interval with an irregular pattern,
consisting of a short interval followed by a long one, a pattern
similar to the SA node firing recorded in vitro (Figure 2).
In the R-R Poincare plot, the control standard deviations
were, SD1 (5.560.1) and SD2 (2660.5). In contrast in the MeS
model were SD1 (1560.4) and SD2 (6961); 3 times increased
compared to controls. However, SD1/SD2 quotients were not
different, because SD1 and SD2 increased proportionally. The
remaining 57% of the rats with MeS showed ventricular
arrhythmias, registered as T wave inversion, bigeminy and
short QT syndrome (data not shown). The mean QRS complex
did not change, being 2166 ms for controls and 2266 ms for
MeS. Interval QT was 55610 ms and 4262 ms respectively for
control and MeS. The corrected QT was 3.6 ms for controls
and 2.5 ms for MeS.
Recording of spontaneous electrical activity of thesinoatrial node
In the spontaneous activity of the entire SA node, at least two
different types of action potential (AP) were identified. One was a
‘‘true pacemaker’’ AP that has a phase 4, with slope of ,10 V/s,
an slow upstroke and repolarization, all classical parameters of
true nodal cells [14,24,25]. The second type was characteristic of
‘‘latent pacemaker’’ cells, these AP have a shorter duration than
true nodal AP or type I; the repolarization and upstroke phases
were also faster. A detailed (Figure S2) analysis revealed that AP of
latent cells can be divided in 3 subgroups (type II, III and IV). The
Figure 5. The MeS increase rate variability in the sinoatrialnode. (A) Representative AP recorded on sinoatrial nodes from controland MeS animals, respectively. Note in the Poincare plots a highvariability between AP intervals recorded in rats with MeS (C) vs. control(B). The insert in B is the plot rescaling, ‘‘width’’ vs ‘‘length’’. SD1/SD2increased more than two times in MeS rats (control n = 11; MeS n = 13,p,0.05), indicating the possibility of suffering mortal arrhythmias.doi:10.1371/journal.pone.0076534.g005
Sinoatrial Remodeling in Metabolic Syndrome
PLOS ONE | www.plosone.org 5 November 2013 | Volume 8 | Issue 11 | e76534
type IV showed higher frequency, amplitude and depolarization
rate than types III, II or even I. Moreover, type I had a longer
duration than the rest of the subtypes (AP lasting: type
I.II.III.IV), Figures 3A and S2.
Spatial distribution of action potential in the sinoatrial nodeThe type I APs were located between the superior vena cava
(SVC), close to the crista terminalis, to within nearly 6 mm of the
mouth of the inferior vena cava (IVC). The distribution of AP
shifts toward the center as it approaches the IVC. Type IV AP
surrounded type I; type III latent cells almost overlap the
distribution of type IV cells, but remained close to the center of
the node. Finally, some type II APs were detected in the middle,
overlapping type I cells, but most of the cells were dispersed along
with type III and IV APs cells (Figure 3).
MeS modify action potential morphology and increasesfiring variability of nodal tissue
The analysis of AP recorded in the nodal tissue from MeS rats
did not reveal changes in the topological distribution reported
above (Figure 4 A, B,). Interestingly, we found a decrease in the
spontaneous activity of latent cells and a complete reversal of the
firing frequency pattern previously observed in control animals
(frequency pattern: type IV.III.II.I); see Figure 3A and C and
Table S1. In intact sinoatrial node the pacemaker true cells have
lower frequency than the latent cells. This is a protection
mechanism of re-excitement and reentry arrhythmias.
In MeS rats, true nodal pacemaker cells have higher sponta-
neous activity than latent cells, which predispose nodal tissue to
suffer arrhythmias (Figure 4A, 4C and 5). Accordingly, MeS
increased the variability firing rate in nodal tissue, evidenced in the
Poincare plot (Control: SD1/SD2 = 0.25; MeS: SD1/SD2 = 0.55;
Figure 5). In general, the frequency nodal tissue was reduced
(Control: 2.0460.21 Hz; MeS: 1.3460.54 Hz, p.0.05). Also,
MeS increased the slope of phase 4 in type II, III and IV cells
(Figure 4A and 4C).
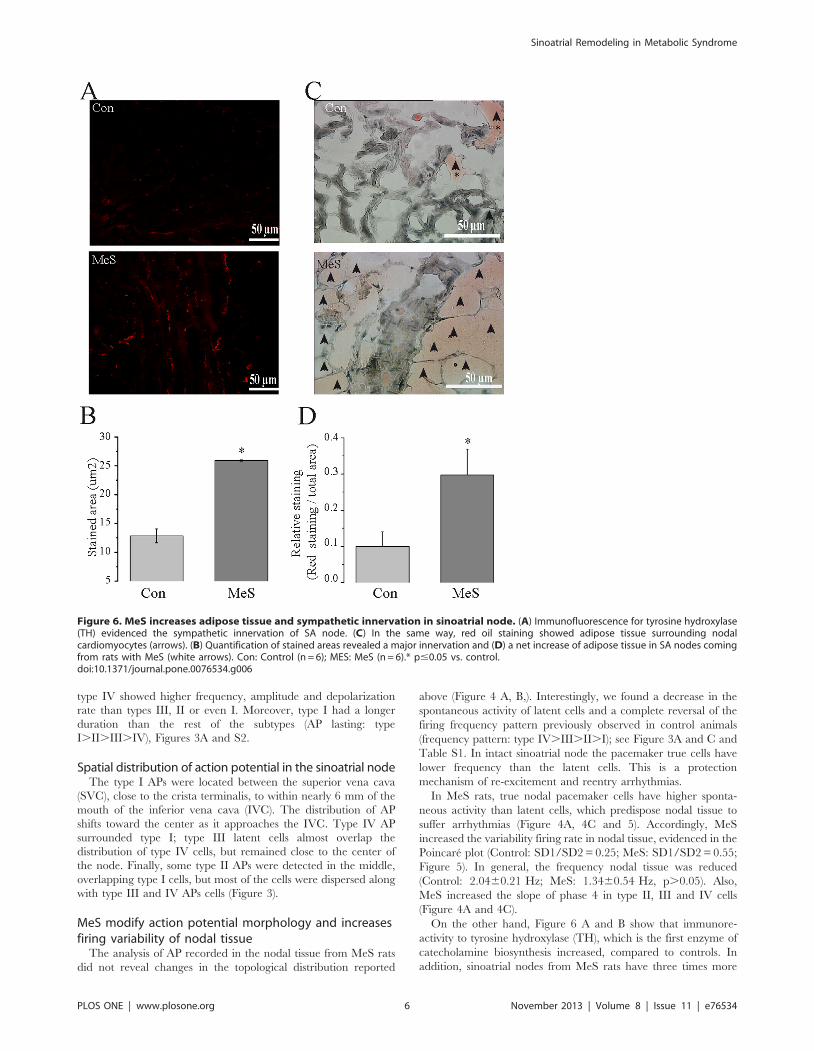
On the other hand, Figure 6 A and B show that immunore-
activity to tyrosine hydroxylase (TH), which is the first enzyme of
catecholamine biosynthesis increased, compared to controls. In
addition, sinoatrial nodes from MeS rats have three times more
Figure 6. MeS increases adipose tissue and sympathetic innervation in sinoatrial node. (A) Immunofluorescence for tyrosine hydroxylase(TH) evidenced the sympathetic innervation of SA node. (C) In the same way, red oil staining showed adipose tissue surrounding nodalcardiomyocytes (arrows). (B) Quantification of stained areas revealed a major innervation and (D) a net increase of adipose tissue in SA nodes comingfrom rats with MeS (white arrows). Con: Control (n = 6); MES: MeS (n = 6).* p#0.05 vs. control.doi:10.1371/journal.pone.0076534.g006
Sinoatrial Remodeling in Metabolic Syndrome
PLOS ONE | www.plosone.org 6 November 2013 | Volume 8 | Issue 11 | e76534

adipose tissue than control nodes. It is worth noting that this
increase in fat is not only around the boundaries of nodal tissue but
also in the center, surrounding the nodal cardiomyocytes
(Figure 6C, D).
MeS modified the voltage clockThe slow depolarizing 4 phase of the nodal AP in control rats
depends of the If current, and two cationic currents, the Ist and the
Ik1. These three together are activated by hyperpolarizing
potentials [24]. As shown in Figure 7, Ik1 is the main
hyperpolarizing current, followed closely by If (Figure 7A and 7B).
In rats with MeS, the main pacemaker current was If, which was
three-fold larger compared to controls (Figure 7A, B and C) at
2120 mV. Furthermore, the Ist current also increased from
0.05 pA/pF to 0.1 pA/pF (Figure 7B and D) at the same voltage.
The later correlates with the increase in the slope of phase 4 found
in type II, III and IV AP.
Discussion
This work demonstrates that MeS produced changes in nodal
architecture and electrical activity, generating a dysfunction SA
node, which could explain the onset of arrhythmias in rats.
Rat SA node has not been well characterized; almost all
electrophysiological data in the literature are referred to rabbit
SA node [22,26]. The reports in rat were restricted to the tissue
that surrounds the nodal artery, which was used as an
anatomical reference. The electrophysiological characterization
of this area showed several subtypes of AP [25,26]. In this work,
we found four different types of AP, based on several
electrophysiological parameters, and in contrast to the previous
reports, we also found true pacemaker cells and three different
latent cell subtypes, distributed throughout the entire nodal
surface (Figure S1).
To test the possible changes induced by MeS, we developed a
model that mimics the etiology and signs of MeS in patients, by
increasing sucrose intake in the drinking-water. Other MeS
models have been studied [21], the most common being the
mouse lacking leptin (ob2/ob2 mouse) [27]. These models
develop hypertension that could per se modify all the cardiac
functions, due to alterations in the morphology of the heart and
vessels [28]. The present MeS model only develops mild
hypertension and more than three other signs of MeS; obesity,
impaired fasting glucose and high levels of insulin (Figure 1) [21].
The limitations of this model include that in the animal model we
can select a single variable to be changed, in this case Wistar rats do
Figure 7. The pacemaker currents experiment remodeling on rats with MeS. (A) Patch clamp recorded cells were spindle shaped (upper leftpanel) with mean capacitances of 6563 pF in control cells (n = 16) against 6567 pF in the MeS cells (n = 16). Upper right panel shows the voltageprotocol used to evocate If current. Inferior panel showed If current family control (con) and MeS, respectively (B). Bar graphs showing an increase Ifand Ist, current density recorded at 2120 mV in nodal cells from control (grey) and MeS (black) rats. Voltage vs. current graphs of If and Ist current Cand D are respectively. * p,0.05 vs. control current evocated at the same voltage step.doi:10.1371/journal.pone.0076534.g007
Sinoatrial Remodeling in Metabolic Syndrome
PLOS ONE | www.plosone.org 7 November 2013 | Volume 8 | Issue 11 | e76534

not show a genetic predisposition to develop obesity and MeS and
we induced it only increasing sucrose intake. In human subjects the
scenario is quite different because of the complex genetic traits, a
mixed excessive diet and differences in metabolism. For example,
humans with MeS often show high concentrations of uric acid that
rats do not develop (unpublished observations).
Other limitations to this work include that ECG signal
morphology of the control rats is different to the human, because
S and T waves are closer to the R-wave in rats.
We did not study the mechanism that altered the activity electrical;
for example the managing of intracellular calcium ‘‘calcium clock’’ in
the nodal cardiomyocytes. On the other hand, we could also consider
possible changes in the extracellular matrix and in the action
potential propagation on nodal tissue and pacemaker atrial cells.
Finally other pathway to be studied is the intracellular signaling.
MeS produced an increase in R-R interval variability in the
EGC (Figure 2), which is clinically manifested as arrhythmias.
Moreover, the fact that R-R and P-P intervals have the same
variability and no changes in the PQ interval were observed,
indicate that in MeS rats sinus rhythm is never lost, and
arrhythmias originate in the sinoatrial node (Figure S3). This is
consistent with the Poincare plot of the interpotential interval of
spontaneous electrical activity (Figure 5), suggesting that in MeS
rats augments the probability of arrhythmias like atrial fibrillation
(AF) and sick sinus syndrome and ventricular fibrillation. We
propose that these arrhythmias originate in the pacemaker.
We observed fat accumulation in the area node, as well as an
increase in sympathetic innervation that could partly explain the
remodeling of the tissue and the increment in phase 4 and the
decrease APD by 30% and 60%. Accordingly, it has been
observed that free fatty acids can modulate cardiac hyperpolar-
izing and potassium currents [29]. Similarly, Yanni et al, 2010
demonstrated that in old obese rats, the localization and
morphology of true pacemaker AP shifts towards the inferior
vena cava. It has been informed that patients with MeS have a
decrease in sympathetic activity [3,7]. This could be due to nerve
growth factor (NGF) release by adipocytes; which could also
explain the increase of innervation in the nodal tissue [30].
It is well known that the If current is positively modulated by free
fatty acids and sympathetic innervation, thus predisposing cells to
higher intracellular calcium levels, and therefore, increasing Ist
current that are calcium dependent [10,29]. Eventually the
cardiomyocyte-fibroblast interactions are replaced by cardiomyo-
cyte-adipocyte interactions, which decrease the electrotonic interac-
tion between cardiomyocytes, thus uncoupling pacemaker cells [31].
In addition, in this MeS rat model, the pacemaker current is
increased and the cells could be uncoupled by the adipocytes
present around them that also change the conduction of electrical
activity in the SA node. If we analyze the SA node as an oscillator
commanded by the true pacemaker, this decoupling could be a
risk factor for generating nodal arrhythmias. MeS rats develop
four distinct oscillators, each one with different frequencies,
originating variability in firing pattern frequency in the intact
SA node (Figure 4 and 5).
We conclude that MeS modify the activity of the SA node by
changing sympathetic innervation, remodeling the anatomy and
the equilibrium between the different pacemaker currents; these
effects predispose the sinoatrial node and heart to suffer
arrhythmias.
Supporting Information
Figure S1 Sinoatrial node dissection. (A) Sinoatrial node
dissection was limited by the following structures: in the upper and
lower side by the superior and inferior vena cava (SVC and IVC),
on the left and right side by right atrium and the inter-atrial
septum (IAS) (red dotted line). NA: nodal artery; NAb: nodal
artery branches (yellow lines). (B) (B) Picture of sinoatrial node
where are depicted the areas reported by other authors as the zone
of true pacemaker cells in rabbit (gridded rectangle), mouse
(squared oval) and rat (ellipse on nodal artery). Small box
area = 1 mm2.
(TIF)
Figure S2 Classification of sinoatrial node action po-tentials recorded in control rats. Nodal action potentials
were classified using three different parameters: amplitude,
upstroke velocity and action potential duration (APD). The 3D
graph shows the four types of the action potentials detected in
sinoatrial node: True pacemaker action potential (black), type II
(red), type III (blue) and type IV (green).
(TIF)
Figure S3 SA node is the origin of arrhythmias in MeSrats. (A) Poincare plot using ECG PP interval. PP interval
variability mimics the pattern observed R-R interval of the
electrocardiogram. (B) Times series of ECG PQ interval, MeS
does not induce changes in PQ interval of EGC. Control (grey) = 8
rats; Mes (black) = 7 rats.
(TIF)
Table S1 Action potential parameters measured fromthe rat SA node.(DOC)
Acknowledgments
We would like to thank Alvaro Caso for proofreading and discussing the
manuscript; Guadalupe Hiriart-Valencia (Instituto Nacional de Enferme-
dades Respiratorias), Carmen Sanchez-Soto, Felix Sierra (UNAM) and
Karina Linares Xilotl (BUAP) for expert technical support; SERVALABHLaboratory and the Microscopy, Histology and Compute Units of the
Instituto de Fisiologıa Celular, UNAM.
Author Contributions
Performed the experiments: AA-I. Analyzed the data: AA-I MV JTJ MH.
Contributed reagents/materials/analysis tools: MH JTJ. Wrote the paper:
AA-I MV JTJ MH. Wrote, edited and revised the manuscript: AA-I JEA-C
MV. Designed the experiments, coordinated the work and reviewed the
manuscript: MH JTJ. Read the last version and approved the manuscript:
AA-I JEA-C MV JTJ MH.
References
1. Alberti K, Zimmet P, Shaw J (2006) Metabolic syndrome—a new world-wide
definition. A Consensus Statement from the International Diabetes Federation.
Diabetic Medicine 23: 469–480.
2. Haffner S, Taegtmeyer H (2003) Epidemic Obesity and the Metabolic
Syndrome. Circulation 108: 1541–1545.
3. Assoumou N, Pichot V, Barthelemy JC, Dauphinot V, Celle S, et al. (2010)
Metabolic Syndrome and Short-Term and Long-Term Heart Rate Variability
in Elderly Free of Clinical Cardiovascular Disease: The PROOF Study.
Rejuvenation Research 13: 653–663.
4. Tang R-B, Dong J-Z, Liu X-P, Long D-Y, Yu R-H, et al. (2009) Metabolic
Syndrome and Risk of Recurrence of Atrial Fibrillation After Catheter Ablation.
Circulation Journal 73: 438–443.
5. Kumagai K, Akimitsu S, Kawahira K, Kawanami F, Yamanouchi Y, et al.
(1991) Electrophysiological properties in chronic lone atrial fibrillation.
Circulation 84: 1662–1668.
6. Rosiak M, Bolinska H, Ruta J (2002) P wave dispersion and P wave duration on
SAECG in predicting atrial fibrillation in patients with acute myocardial
infarction. Ann Noninvasive Electrocardiol 7: 363–368.
Sinoatrial Remodeling in Metabolic Syndrome
PLOS ONE | www.plosone.org 8 November 2013 | Volume 8 | Issue 11 | e76534

7. Lin Y-K, Chen Y-J, Chen S-A (2010) Potential atrial arrhythmogenicity of
adipocytes: Implications for the genesis of atrial fibrillation. Medical Hypotheses74: 1026–1029.
8. Pastelin G, Mendez R, Moe GK (1978) Participation of atrial specialized
conduction pathways in atrial flutter. Circ Res 42: 386–393.9. Corbi GM, Carbone S, Ziccardi P, Giugliano G, Marfella R, et al. (2002) FFAs
and QT intervals in obese women with visceral adiposity: effects of sustainedweight loss over 1 year. J Clin Endocrinol Metab 87: 2080–2083.
10. Vinogradova T, Bogdanov KY, Lakatta E (2002) beta-Adrenergic stimulation
modulates ryanodine receptor Ca(2+) release during diastolic depolarization toaccelerate pacemaker activity in rabbit sinoatrial nodal cells. Circulation
Research 90: 73–79.11. Boyett MR, Honjo H, Yamamoto M, Nikmaram MR, Niwa R, et al. (1998)
Regional differences in effects of 4-aminopyridine within the sinoatrial node.The American journal of physiology 275.
12. Opthof T (1998) The membrane current (I(f)) in human atrial cells: implications
for atrial arrhythmias. Cardiovasc Res 38: 537–540.13. Oren R, Clancy C (2010) Determinants of heterogeneity, excitation and
conduction in the sinoatrial node: a model study. PLoS Computational Biology6: e1001041.
14. Yanni J, Tellez JO, Sutyagin PV, Boyett MR, Dobrzynski H (2010) Structural
remodelling of the sinoatrial node in obese old rats. J Mol Cell Cardiol 48: 653–662.
15. Ryan VH, German AJ, Wood IS, Hunter L, Morris P, et al. (2008) NGF geneexpression and secretion by canine adipocytes in primary culture: upregulation by
the inflammatory mediators LPS and TNFalpha. Horm Metab Res 40: 861–868.16. Ouwens M, Sell H, Greulich S, Eckel J (2010) The role of epicardial and
perivascular adipose tissue in the pathophysiology of cardiovascular disease.
Journal of Cellular and Molecular Medicine 14: 2223–2234.17. Vinogradova T, Bogdanov KY, Lakatta E (2002) Novel perspectives on the
beating rate of the heart. Circulation research 91.18. Acharya R, Kumar A, Bhat P, Lim C, Lyengar S, et al. (2004) Classification of
cardiac abnormalities using heart rate signals. Medical and Biological
Engineering and Computing 42: 288–293.19. Karmakar CK, Khandoker AH, Gubbi J, Palaniswami M (2009) Defining
asymmetry in heart rate variability signals using a Poincare plot. Physiol Meas30: 1227–1240.
20. Rajendra Acharya U, Paul Joseph K, Kannathal N, Lim C, Suri J (2006) Heart
rate variability: a review. Medical and Biological Engineering and Computing
44: 1031–1051.
21. Larque C, Velasco M, Navarro-Tableros V, Duhne M, Aguirre J, et al. (2011)
Early endocrine and molecular changes in metabolic syndrome models. IUBMB
Life 63: 831–839.
22. Sutyagin PV, Kalinina EE, Pylaev AS (2005) Morphofunctional organization of
sinoatrial node in rat heart. Bulletin of experimental biology and medicine 139:
256–259.
23. Arechiga-Figueroa IA, Rodriguez-Martinez M, Albarado A, Torres-Jacome J,
Sanchez-Chapula JA (2010) Multiple effects of 4-aminopyridine on feline and
rabbit sinoatrial node myocytes and multicellular preparations. Pflugers Arch
459: 345–355.
24. Shinagawa Y, Satoh H, Noma A (2000) The sustained inward current and
inward rectifier K+ current in pacemaker cells dissociated from rat sinoatrial
node. The Journal of Physiology 523: 593–605.
25. Zhang H, Holden AV, Boyett MR (2001) Gradient model versus mosaic model
of the sinoatrial node. Circulation 103: 584–588.
26. Kodama I, Boyett MR, Nikmaram MR, Yamamoto M, Honjo H, et al. (1999)
Regional differences in effects of E-4031 within the sinoatrial node. The
American journal of physiology 276.
27. Chen GC, Huang CY, Chang MY, Chen CH, Chen SW, et al. (2011) Two
unhealthy dietary habits featuring a high fat content and a sucrose-containing
beverage intake, alone or in combination, on inducing metabolic syndrome in
Wistar rats and C57BL/6J mice. Metabolism 60: 155–164.
28. Hofer J, Niebauer J (2007) Cardiovascular risk factors: lipids and lifestyle
changes. Archives of Medical Science 3: S69–S73.
29. Deng W, Bukiya A, Rodrıguez-Menchaca A, Zhang Z, Baumgarten C, et al.
(2012) Hypercholesterolemia induces up-regulation of KACh cardiac currents
via a mechanism independent of phosphatidylinositol 4,5-bisphosphate and
Gbc. The Journal of biological chemistry 287: 4925–4935.
30. Sornelli F, Fiore M, Chaldakov G, Aloe L (2009) Adipose tissue-derived nerve
growth factor and brain-derived neurotrophic factor: results from experimental
stress and diabetes. General physiology and biophysics 28 Spec No: 179–183.
31. Camelliti P, Green C, LeGrice I, Kohl P (2004) Fibroblast Network in Rabbit
Sinoatrial Node. Circulation Research 94: 828–835.
Sinoatrial Remodeling in Metabolic Syndrome
PLOS ONE | www.plosone.org 9 November 2013 | Volume 8 | Issue 11 | e76534
View publication statsView publication stats
Related Documents