Metabolic re-patterning in COPD airway smooth muscle cells Charalambos Michaeloudes 1,2 , Chih-Hsi Kuo 1,2,3 , Gulam Haji 1,2 , Donna K. Finch 4 , Andrew J. Halayko 5,6,7 , Paul Kirkham 8 , Kian Fan Chung 1,2,9 and Ian M. Adcock 1,2,9 on behalf of COPDMAP 10 Affiliations: 1 Airways Disease, National Heart and Lung Institute, Imperial College London, London, UK. 2 Biomedical Research Unit, Royal Brompton and Harefield NHS Trust, London, UK. 3 Dept of Computing and Data Science Institute, Imperial College London, London, UK. 4 Respiratory, Inflammation and Autoimmunity, MedImmune Ltd, Cambridge, UK. 5 Dept of Physiology and Pathophysiology, University of Manitoba, Winnipeg, MB, Canada. 6 Dept of Internal Medicine, University of Manitoba, Winnipeg, MB, Canada. 7 Canadian Respiratory Research Network, Ottawa, ON, Canada. 8 Dept of Biomedical Sciences, Faculty of Science and Engineering, University of Wolverhampton, Wolverhampton, UK. 9 Both authors contributed equally. 10 A full list of COPDMAP collaborators can be found in the acknowledgements section. Correspondence: Charalambos Michaeloudes, Airway Disease Section, National Heart and Lung Institute, Imperial College London, Dovehouse Street, London SW3 6LY, UK. E-mail: [email protected] @ERSpublications A metabolic shift in airway smooth muscle cells of COPD patients may support their increased growth and survival http://ow.ly/XVkb30eUTLJ Cite this article as: Michaeloudes C, Kuo C-H, Haji G, et al. Metabolic re-patterning in COPD airway smooth muscle cells. Eur Respir J 2017; 50: 1700202 [https://doi.org/10.1183/13993003.00202-2017]. ABSTRACT Chronic obstructive pulmonary disease (COPD) airways are characterised by thickening of airway smooth muscle, partly due to airway smooth muscle cell (ASMC) hyperplasia. Metabolic reprogramming involving increased glycolysis and glutamine catabolism supports the biosynthetic and redox balance required for cellular growth. We examined whether COPD ASMCs show a distinct metabolic phenotype that may contribute to increased growth. We performed an exploratory intracellular metabolic profile analysis of ASMCs from healthy nonsmokers, healthy smokers and COPD patients, under unstimulated or growth conditions of transforming growth factor (TGF)-β and fetal bovine serum (FBS). COPD ASMCs showed impaired energy balance and accumulation of the glycolytic product lactate, glutamine, fatty acids and amino acids compared to controls in unstimulated and growth conditions. Fatty acid oxidation capacity was reduced under unstimulated conditions. TGF-β/FBS-stimulated COPD ASMCs showed restoration of fatty acid oxidation capacity, upregulation of the pentose phosphate pathway product ribose-5-phosphate and of nucleotide biosynthesis intermediates, and increased levels of the glutamine catabolite glutamate. In addition, TGF-β/FBS-stimulated COPD ASMCs showed a higher reduced-to- oxidised glutathione ratio and lower mitochondrial oxidant levels. Inhibition of glycolysis and glutamine depletion attenuated TGF-β/FBS-stimulated growth of COPD ASMCs. Changes in glycolysis, glutamine and fatty acid metabolism may lead to increased biosynthesis and redox balance, supporting COPD ASMC growth. This article has supplementary material available from erj.ersjournals.com Received: Jan 27 2017 | Accepted after revision: Aug 29 2017 Conflict of interest: Disclosures can be found alongside this article at erj.ersjournals.com Copyright ©ERS 2017. This version is distributed under the terms of the Creative Commons Attribution Licence 4.0. https://doi.org/10.1183/13993003.00202-2017 Eur Respir J 2017; 50: 1700202 | ORIGINAL ARTICLE COPD

Welcome message from author
This document is posted to help you gain knowledge. Please leave a comment to let me know what you think about it! Share it to your friends and learn new things together.
Transcript
Metabolic re-patterning in COPD airwaysmooth muscle cells
Charalambos Michaeloudes1,2, Chih-Hsi Kuo1,2,3, Gulam Haji1,2,Donna K. Finch4, Andrew J. Halayko5,6,7, Paul Kirkham8, KianFan Chung1,2,9and Ian M. Adcock1,2,9 on behalf of COPDMAP10
Affiliations: 1Airways Disease, National Heart and Lung Institute, Imperial College London, London, UK.2Biomedical Research Unit, Royal Brompton and Harefield NHS Trust, London, UK. 3Dept of Computing andData Science Institute, Imperial College London, London, UK. 4Respiratory, Inflammation and Autoimmunity,MedImmune Ltd, Cambridge, UK. 5Dept of Physiology and Pathophysiology, University of Manitoba, Winnipeg,MB, Canada. 6Dept of Internal Medicine, University of Manitoba, Winnipeg, MB, Canada. 7Canadian RespiratoryResearch Network, Ottawa, ON, Canada. 8Dept of Biomedical Sciences, Faculty of Science and Engineering,University of Wolverhampton, Wolverhampton, UK. 9Both authors contributed equally. 10A full list ofCOPDMAP collaborators can be found in the acknowledgements section.
Correspondence: Charalambos Michaeloudes, Airway Disease Section, National Heart and Lung Institute,Imperial College London, Dovehouse Street, London SW3 6LY, UK. E-mail: [email protected]
@ERSpublicationsA metabolic shift in airway smooth muscle cells of COPD patients may support their increased growthand survival http://ow.ly/XVkb30eUTLJ
Cite this article as: Michaeloudes C, Kuo C-H, Haji G, et al. Metabolic re-patterning in COPD airwaysmooth muscle cells. Eur Respir J 2017; 50: 1700202 [https://doi.org/10.1183/13993003.00202-2017].
ABSTRACT Chronic obstructive pulmonary disease (COPD) airways are characterised by thickening ofairway smooth muscle, partly due to airway smooth muscle cell (ASMC) hyperplasia. Metabolicreprogramming involving increased glycolysis and glutamine catabolism supports the biosynthetic andredox balance required for cellular growth. We examined whether COPD ASMCs show a distinctmetabolic phenotype that may contribute to increased growth.
We performed an exploratory intracellular metabolic profile analysis of ASMCs from healthynonsmokers, healthy smokers and COPD patients, under unstimulated or growth conditions oftransforming growth factor (TGF)-β and fetal bovine serum (FBS).
COPD ASMCs showed impaired energy balance and accumulation of the glycolytic product lactate,glutamine, fatty acids and amino acids compared to controls in unstimulated and growth conditions. Fattyacid oxidation capacity was reduced under unstimulated conditions. TGF-β/FBS-stimulated COPD ASMCsshowed restoration of fatty acid oxidation capacity, upregulation of the pentose phosphate pathway productribose-5-phosphate and of nucleotide biosynthesis intermediates, and increased levels of the glutaminecatabolite glutamate. In addition, TGF-β/FBS-stimulated COPD ASMCs showed a higher reduced-to-oxidised glutathione ratio and lower mitochondrial oxidant levels. Inhibition of glycolysis and glutaminedepletion attenuated TGF-β/FBS-stimulated growth of COPD ASMCs.
Changes in glycolysis, glutamine and fatty acid metabolism may lead to increased biosynthesis andredox balance, supporting COPD ASMC growth.
This article has supplementary material available from erj.ersjournals.com
Received: Jan 27 2017 | Accepted after revision: Aug 29 2017
Conflict of interest: Disclosures can be found alongside this article at erj.ersjournals.com
Copyright ©ERS 2017. This version is distributed under the terms of the Creative Commons Attribution Licence 4.0.
https://doi.org/10.1183/13993003.00202-2017 Eur Respir J 2017; 50: 1700202
| ORIGINAL ARTICLECOPD
IntroductionChronic obstructive pulmonary disease (COPD) is characterised by airway remodelling that involvesairway smooth muscle thickening, possibly caused by airway smooth muscle cell (ASMC) hypertrophyand/or hyperplasia [1]. ASMC dysfunction is caused, at least in part, by chronic exposure toinflammation-derived mediators, such as transforming growth factor (TGF)-β [2]. ASMCs from COPDpatients show enhanced proliferation in response to TGF-β and fetal bovine serum (FBS), compared toASMCs from healthy subjects [3]. However, the molecular mechanisms underlining ASMC dysfunction inCOPD are not well understood.
Mitochondria are key regulators of metabolism, redox homeostasis and cell survival and proliferation [4].Impaired mitochondrial function has been demonstrated in the large airways [5, 6] and lungs [7, 8] ofpatients with COPD, and may drive lung inflammation and remodelling [6–8]. Importantly, we have showndefective mitochondrial respiration in cultured COPD ASMCs [6]. Mitochondrial dysfunction associatedwith metabolic changes such as increased glycolysis and glutamine catabolism contribute to aberrant cellulargrowth in diseases such as pulmonary arterial hypertension (PAH) and cancer [9, 10]. Glycolyticintermediates feed into amino acid and fatty acid synthesis, and into the pentose phosphate pathway (PPP)to produce reduced nicotinamide adenine diphosphate (NADPH) required for redox homeostasis, andribose-5-phosphate for nucleotide synthesis. Glutamine catabolism provides nitrogen for nucleotide andamino acid synthesis and glutamate for glutathione synthesis [11]. Therefore, these changes supportmacromolecule synthesis and maintain cellular redox balance, thereby facilitating cell growth and survival.
The metabolomic profile of serum, urine, bronchoalveolar lavage fluid and exhaled breath condensatesfrom COPD patients has been investigated in order to identify novel biomarkers for disease diagnosis andclassification [12–20]. However, this approach does not indicate whether a different metabolic profile inlung structural cells, such as ASMCs, contributes to cellular dysfunction in COPD.
We hypothesised that the mitochondrial dysfunction in COPD ASMCs is accompanied by metabolic andredox changes that may contribute to the increased capacity of COPD ASMCs to proliferate. To identifychanges in metabolic pathways associated with the hyperproliferative phenotype of COPD ASMCs weinvestigated the global intracellular metabolome of ASMCs from healthy nonsmokers, healthy smokers andpatients with COPD, at baseline and under the growth conditions of TGF-β and FBS.
Materials and methodsAdditional details on the methods used in the study are provided in the online supplementary material.
Subject demographicsASMCs were isolated from patients with mild/moderate COPD as defined by GOLD criteria, while healthynonsmokers and healthy smokers, both current and ex-smokers, were used as controls. COPD patientsshowed significant airflow obstruction, as indicated by the forced expiratory volume in 1 s (FEV1) and theFEV1/forced vital capacity (FVC) ratio, had no history of asthma, gave a classical history of shortness ofbreath on exertion and were all smokers. The mean age of COPD patients was significantly higher thanthat of controls and smoking pack-year history was greater (tables 1 and 2).
ASMC isolation and cultureASMCs were isolated from endobronchial biopsies and from second- to fourth-generation segmentalairways obtained during lung resection surgery from healthy nonsmoker and healthy smoker subjects andpatients with COPD (tables 1 and 2), and placed in culture as described previously [21, 22]. The study wasapproved by the local ethics committee and informed consent was obtained from all participants.
Untargeted metabolomics analysisFollowing treatment, ASMCs were detached, pelleted by centrifugation and stored at −80°C untilprocessed. Sample preparation and analysis using ultra-high performance liquid chromatography-massspectrometry or gas chromatography-mass spectrometry was performed by Metabolon (Durham NC,USA), as described previously [23].
Support statement: This study was supported by the MRC-ABPI COPD-MAP consortium (G1001367/1) and a DunhillMedical Trust grant (R368/0714). It was also supported by the NIHR Respiratory Disease Biomedical Research Unit atthe Royal Brompton and Harefield NHS Foundation Trust and Imperial College London. The Canadian RespiratoryResearch Network (CRRN) is supported by grants from the Canadian Institutes of Health Research (CIHR), Institute ofCirculatory and Respiratory Health; Canadian Lung Association (CLA); British Columbia Lung Association; andindustry partners Boehringer-Ingelheim Canada, AstraZeneca Canada, Novartis Canada and GlaxoSmithKline. Thefunders had no role in the study design, data collection and analysis, or preparation of the manuscript. Fundinginformation for this article has been deposited with the Crossref Funder Registry.
https://doi.org/10.1183/13993003.00202-2017 2
COPD | C. MICHAELOUDES ET AL.
Determination of differentially expressed metabolitesData preprocessing and normalisation was performed by Metabolon. Data are presented as “scaledintensity” and were re-scaled to have a median equal to one. Missing values were imputed with theminimum observed value. Differential expression analysis was performed using the Bioconductor Rpackage limma (http://bioconductor.org/packages/release/bioc/html/limma.html).
Supervised learning algorithm for phenotype classificationDetermination of the optimal number of differentially expressed metabolites was performed using thenearest shrunken centroid method [24], using an algorithm available in the Comprehensive R ArchiveNetwork (CRAN-pamr package, https://cran.r-project.org/). Data were adjusted for sex and age using thesurrogate variable analysis package in Bioconductor, and principal component analysis was applied.
Pathway analysisPathway analysis was performed using the Pathway Activity Profiling algorithm, as previously described [25].
Determination of mitochondrial reactive oxygen species levelsMitochondrial reactive oxygen species (ROS) levels were determined using the mitochondrial-targeted,redox-sensitive fluorescent probe MitoSOX Red (Invitrogen, Paisley, UK) as previously described [6].
Determination of ASMC proliferationChanges in cell proliferation were determined by measuring BrdU incorporation using the CellProliferation ELISA kit (Roche Diagnostics, Burgess Hill, UK) according to the manufacturer’s
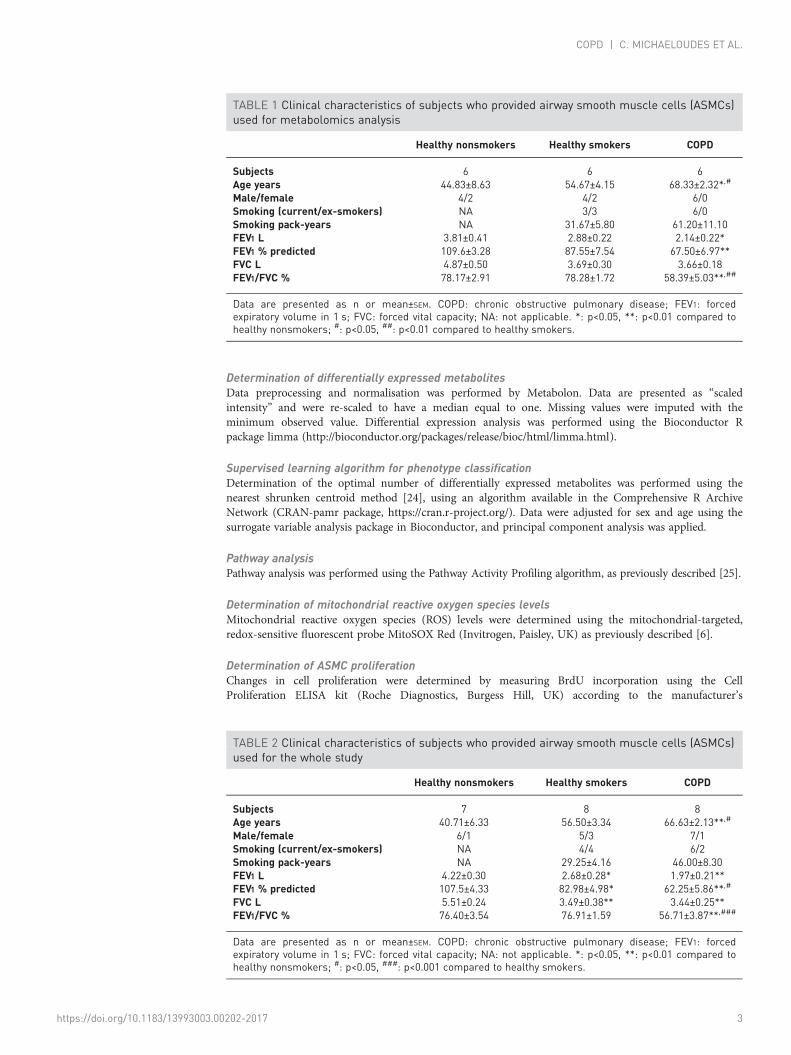
TABLE 1 Clinical characteristics of subjects who provided airway smooth muscle cells (ASMCs)used for metabolomics analysis
Healthy nonsmokers Healthy smokers COPD
Subjects 6 6 6Age years 44.83±8.63 54.67±4.15 68.33±2.32*,#
Male/female 4/2 4/2 6/0Smoking (current/ex-smokers) NA 3/3 6/0Smoking pack-years NA 31.67±5.80 61.20±11.10FEV1 L 3.81±0.41 2.88±0.22 2.14±0.22*FEV1 % predicted 109.6±3.28 87.55±7.54 67.50±6.97**FVC L 4.87±0.50 3.69±0.30 3.66±0.18FEV1/FVC % 78.17±2.91 78.28±1.72 58.39±5.03**,##
Data are presented as n or mean±SEM. COPD: chronic obstructive pulmonary disease; FEV1: forcedexpiratory volume in 1 s; FVC: forced vital capacity; NA: not applicable. *: p<0.05, **: p<0.01 compared tohealthy nonsmokers; #: p<0.05, ##: p<0.01 compared to healthy smokers.
TABLE 2 Clinical characteristics of subjects who provided airway smooth muscle cells (ASMCs)used for the whole study
Healthy nonsmokers Healthy smokers COPD
Subjects 7 8 8Age years 40.71±6.33 56.50±3.34 66.63±2.13**,#
Male/female 6/1 5/3 7/1Smoking (current/ex-smokers) NA 4/4 6/2Smoking pack-years NA 29.25±4.16 46.00±8.30FEV1 L 4.22±0.30 2.68±0.28* 1.97±0.21**FEV1 % predicted 107.5±4.33 82.98±4.98* 62.25±5.86**,#
FVC L 5.51±0.24 3.49±0.38** 3.44±0.25**FEV1/FVC % 76.40±3.54 76.91±1.59 56.71±3.87**,###
Data are presented as n or mean±SEM. COPD: chronic obstructive pulmonary disease; FEV1: forcedexpiratory volume in 1 s; FVC: forced vital capacity; NA: not applicable. *: p<0.05, **: p<0.01 compared tohealthy nonsmokers; #: p<0.05, ###: p<0.001 compared to healthy smokers.
https://doi.org/10.1183/13993003.00202-2017 3
COPD | C. MICHAELOUDES ET AL.
instructions. Alternatively, the numbers of live cells were determined by Trypan blue staining andhaemocytometer counting.
Statistical analysisStatistical analysis was performed using the GraphPad Prism v.5 software (GraphPad Software, San Diego,CA, USA). Unless specified otherwise, intragroup comparisons were performed using the Friedman testfollowed by Dunn’s post hoc test, and intergroup comparisons used the Mann–Whitney test. Correlationswere determined using Spearman’s correlation coefficient. p<0.05 was considered as statistically significant.
ResultsCOPD ASMCs show a distinct metabolic profileMetabolomic analysis was performed directly after serum-starvation (0 h; baseline) and following 48 hincubation in the absence (unstimulated) and presence of TGF-β/FBS (growth conditions). Under theseconditions, COPD ASMCs showed a distinct phenotype compared to ASMCs from healthy smokers,displaying increased proliferation in response to TGF-β/FBS, an effect inversely correlated with thesubjects’ lung function, and a lower α-smooth muscle actin mRNA expression (online supplementaryfigure E1).
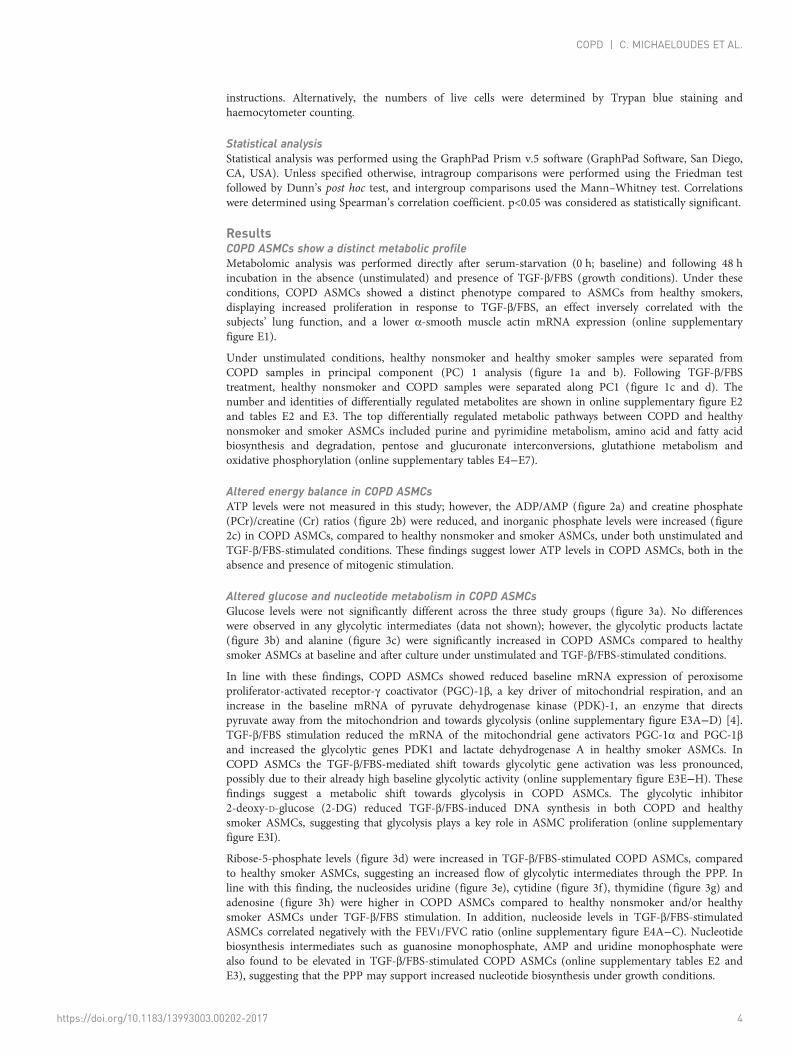
Under unstimulated conditions, healthy nonsmoker and healthy smoker samples were separated fromCOPD samples in principal component (PC) 1 analysis (figure 1a and b). Following TGF-β/FBStreatment, healthy nonsmoker and COPD samples were separated along PC1 (figure 1c and d). Thenumber and identities of differentially regulated metabolites are shown in online supplementary figure E2and tables E2 and E3. The top differentially regulated metabolic pathways between COPD and healthynonsmoker and smoker ASMCs included purine and pyrimidine metabolism, amino acid and fatty acidbiosynthesis and degradation, pentose and glucuronate interconversions, glutathione metabolism andoxidative phosphorylation (online supplementary tables E4−E7).
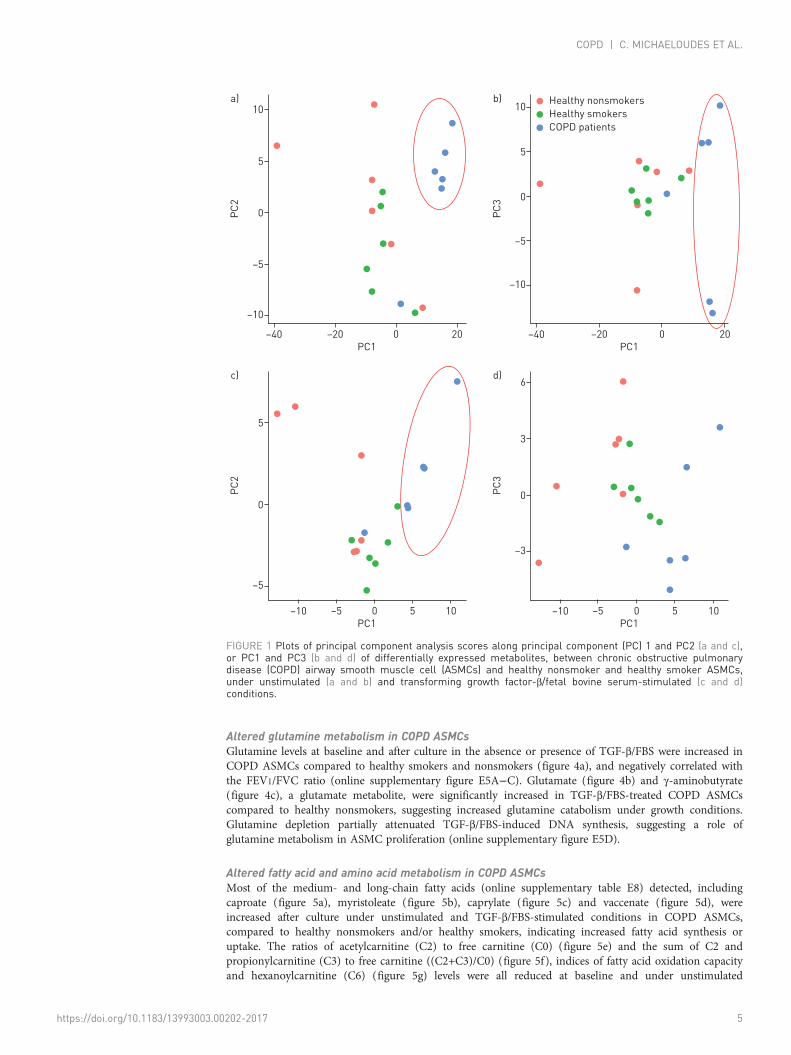
Altered energy balance in COPD ASMCsATP levels were not measured in this study; however, the ADP/AMP (figure 2a) and creatine phosphate(PCr)/creatine (Cr) ratios (figure 2b) were reduced, and inorganic phosphate levels were increased (figure2c) in COPD ASMCs, compared to healthy nonsmoker and smoker ASMCs, under both unstimulated andTGF-β/FBS-stimulated conditions. These findings suggest lower ATP levels in COPD ASMCs, both in theabsence and presence of mitogenic stimulation.
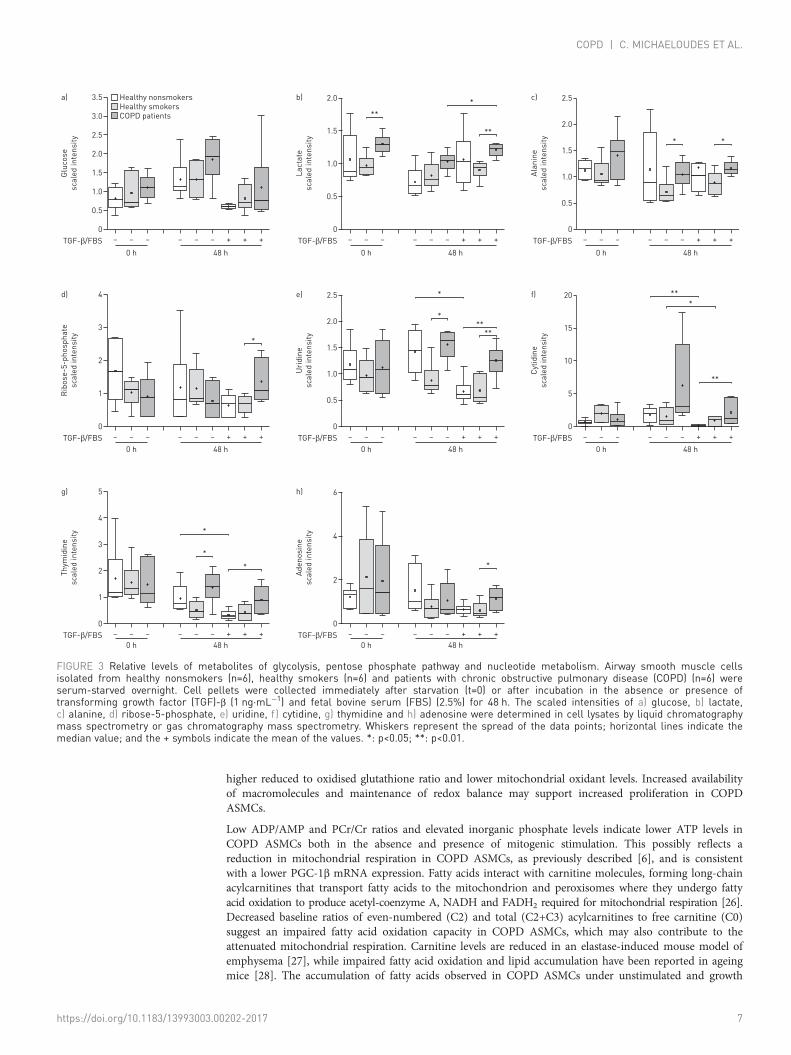
Altered glucose and nucleotide metabolism in COPD ASMCsGlucose levels were not significantly different across the three study groups (figure 3a). No differenceswere observed in any glycolytic intermediates (data not shown); however, the glycolytic products lactate(figure 3b) and alanine (figure 3c) were significantly increased in COPD ASMCs compared to healthysmoker ASMCs at baseline and after culture under unstimulated and TGF-β/FBS-stimulated conditions.
In line with these findings, COPD ASMCs showed reduced baseline mRNA expression of peroxisomeproliferator-activated receptor-γ coactivator (PGC)-1β, a key driver of mitochondrial respiration, and anincrease in the baseline mRNA of pyruvate dehydrogenase kinase (PDK)-1, an enzyme that directspyruvate away from the mitochondrion and towards glycolysis (online supplementary figure E3A−D) [4].TGF-β/FBS stimulation reduced the mRNA of the mitochondrial gene activators PGC-1α and PGC-1βand increased the glycolytic genes PDK1 and lactate dehydrogenase A in healthy smoker ASMCs. InCOPD ASMCs the TGF-β/FBS-mediated shift towards glycolytic gene activation was less pronounced,possibly due to their already high baseline glycolytic activity (online supplementary figure E3E−H). Thesefindings suggest a metabolic shift towards glycolysis in COPD ASMCs. The glycolytic inhibitor2-deoxy-D-glucose (2-DG) reduced TGF-β/FBS-induced DNA synthesis in both COPD and healthysmoker ASMCs, suggesting that glycolysis plays a key role in ASMC proliferation (online supplementaryfigure E3I).
Ribose-5-phosphate levels (figure 3d) were increased in TGF-β/FBS-stimulated COPD ASMCs, comparedto healthy smoker ASMCs, suggesting an increased flow of glycolytic intermediates through the PPP. Inline with this finding, the nucleosides uridine (figure 3e), cytidine (figure 3f), thymidine (figure 3g) andadenosine (figure 3h) were higher in COPD ASMCs compared to healthy nonsmoker and/or healthysmoker ASMCs under TGF-β/FBS stimulation. In addition, nucleoside levels in TGF-β/FBS-stimulatedASMCs correlated negatively with the FEV1/FVC ratio (online supplementary figure E4A−C). Nucleotidebiosynthesis intermediates such as guanosine monophosphate, AMP and uridine monophosphate werealso found to be elevated in TGF-β/FBS-stimulated COPD ASMCs (online supplementary tables E2 andE3), suggesting that the PPP may support increased nucleotide biosynthesis under growth conditions.
https://doi.org/10.1183/13993003.00202-2017 4
COPD | C. MICHAELOUDES ET AL.
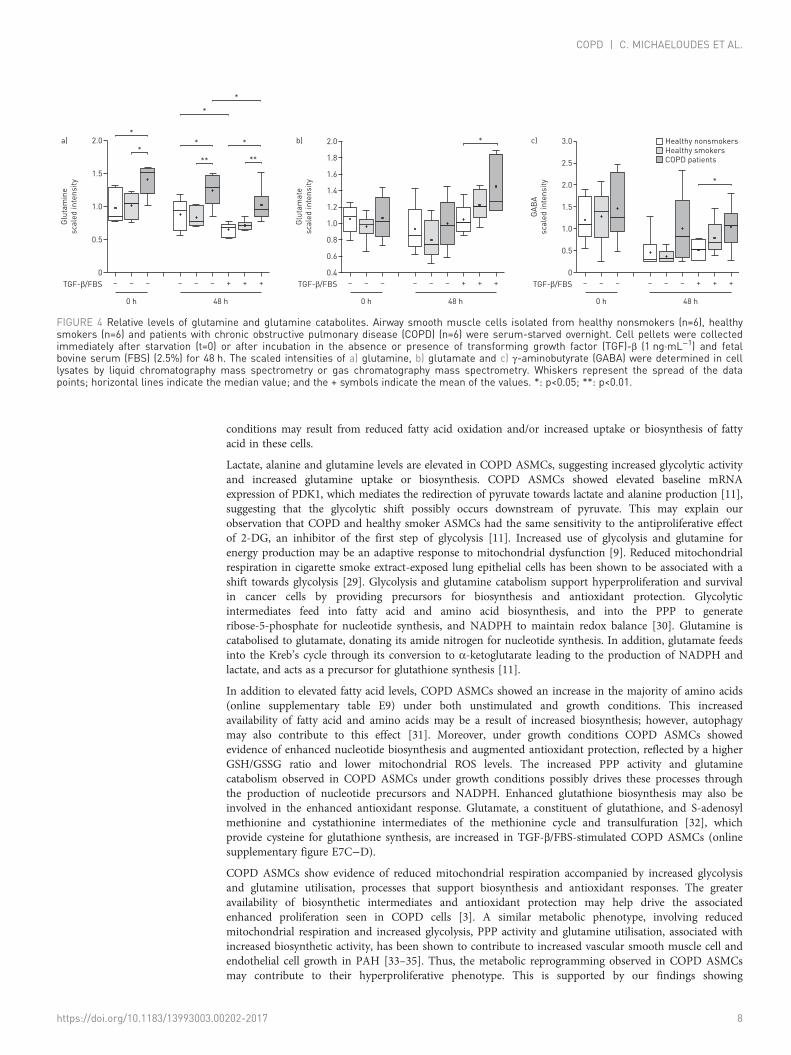
Altered glutamine metabolism in COPD ASMCsGlutamine levels at baseline and after culture in the absence or presence of TGF-β/FBS were increased inCOPD ASMCs compared to healthy smokers and nonsmokers (figure 4a), and negatively correlated withthe FEV1/FVC ratio (online supplementary figure E5A−C). Glutamate (figure 4b) and γ-aminobutyrate(figure 4c), a glutamate metabolite, were significantly increased in TGF-β/FBS-treated COPD ASMCscompared to healthy nonsmokers, suggesting increased glutamine catabolism under growth conditions.Glutamine depletion partially attenuated TGF-β/FBS-induced DNA synthesis, suggesting a role ofglutamine metabolism in ASMC proliferation (online supplementary figure E5D).
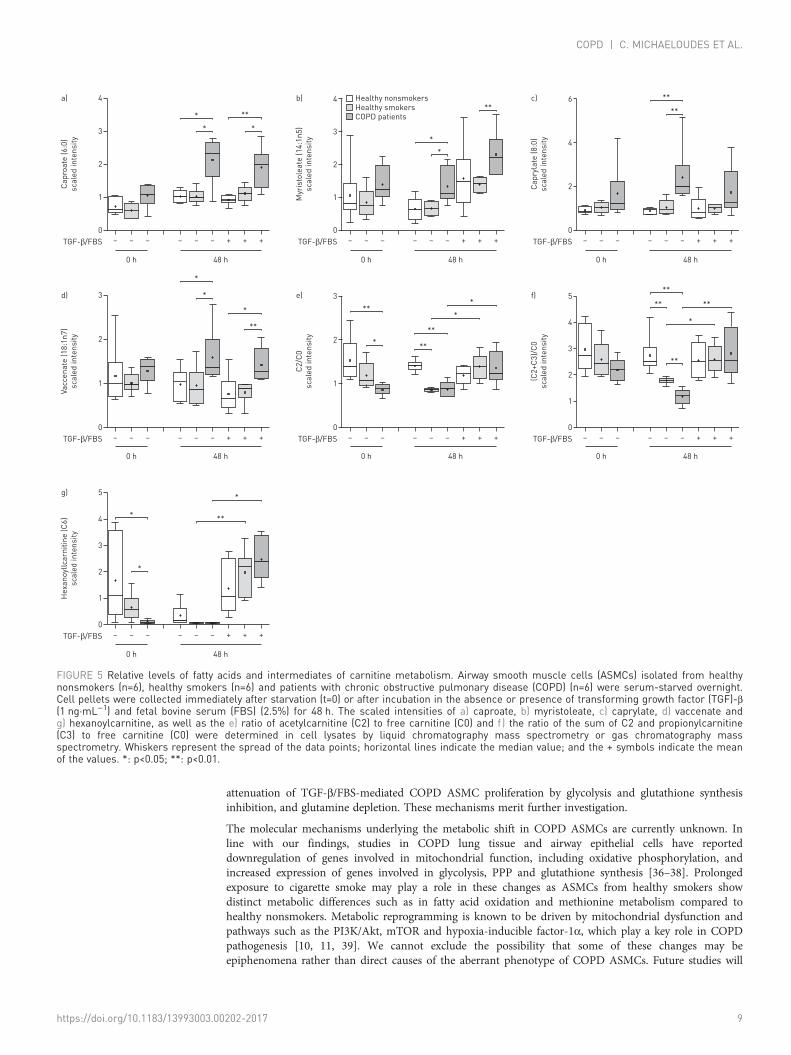
Altered fatty acid and amino acid metabolism in COPD ASMCsMost of the medium- and long-chain fatty acids (online supplementary table E8) detected, includingcaproate (figure 5a), myristoleate (figure 5b), caprylate (figure 5c) and vaccenate (figure 5d), wereincreased after culture under unstimulated and TGF-β/FBS-stimulated conditions in COPD ASMCs,compared to healthy nonsmokers and/or healthy smokers, indicating increased fatty acid synthesis oruptake. The ratios of acetylcarnitine (C2) to free carnitine (C0) (figure 5e) and the sum of C2 andpropionylcarnitine (C3) to free carnitine ((C2+C3)/C0) (figure 5f), indices of fatty acid oxidation capacityand hexanoylcarnitine (C6) (figure 5g) levels were all reduced at baseline and under unstimulated
–10
–5
0
5
10a)
PC
2
PC1
–40 –20 0 20
–10
–5
0
5
10b)
PC
3
PC1
–40 –20 0 20
–5
0
5
c)
PC
2
PC1
–10 –5 0 5 10
–3
0
3
6d)
PC
3
PC1
Healthy nonsmokers
Healthy smokers
COPD patients
–10 –5 0 5 10
FIGURE 1 Plots of principal component analysis scores along principal component (PC) 1 and PC2 (a and c),or PC1 and PC3 (b and d) of differentially expressed metabolites, between chronic obstructive pulmonarydisease (COPD) airway smooth muscle cell (ASMCs) and healthy nonsmoker and healthy smoker ASMCs,under unstimulated (a and b) and transforming growth factor-β/fetal bovine serum-stimulated (c and d)conditions.
https://doi.org/10.1183/13993003.00202-2017 5
COPD | C. MICHAELOUDES ET AL.
conditions in healthy smoker and COPD ASMCs compared to healthy nonsmoker cells. In addition, thebaseline C2/C0 ratio (figure 5e) and C6 (figure 5g) levels, and the (C2+C3)/C0 ratio in unstimulated cells(figure 5f) were lower in COPD ASMCs compared to healthy smoker ASMCs.
The (C2+C3)/C0 ratios in untreated ASMCs correlated positively with the FEV1/FVC ratio and correlatednegatively with age, suggesting an association of attenuated fatty acid oxidation with lung dysfunction andincreasing age (online supplementary figure E6A−B). TGF-β/FBS restored the C2/C0 (figure 5e) and (C2+C3)/C0 (figure 5f) ratios and hexanoylcarnitine (figure 5g) levels in healthy smoker and COPD ASMCs,suggesting an increase in fatty acid oxidation during proliferation.
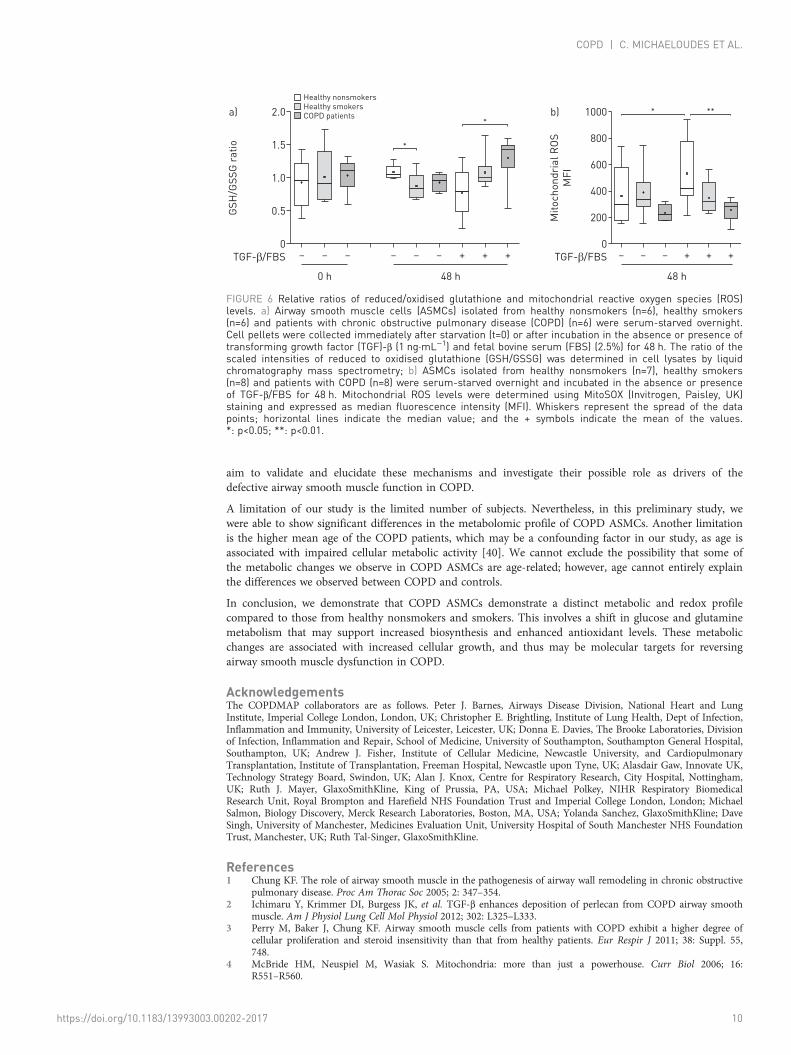
Enhanced glutathione biosynthesis and reduced mitochondrial ROS levels in COPD ASMCsThe ratio of reduced (GSH) to oxidised (GSSG) glutathione was similar between the study groups atbaseline. However, after culture under unstimulated conditions, the GSH/GSSG ratio was lower in healthysmoker ASMCs and showed a statistically nonsignificant reduction in COPD ASMCs (figure 6a), reflectingoxidant–antioxidant imbalance in healthy smoker and COPD cells in the absence of mitogenicstimulation. In contrast, the GSH/GSSG ratio in TGF-β/FBS-treated COPD ASMCs was higher comparedto healthy nonsmoker ASMCs, while healthy smoker ASMCs showed an increasing trend (figure 6a).
In addition, TGF-β/FBS-treated COPD ASMCs had significantly lower mitochondrial ROS levels, andhealthy smoker ASMCs showed a trend towards reduced levels, compared to healthy nonsmoker ASMCs(figure 6b). The glutathione synthesis inhibitor buthionine sulfoximine (10–25 µM) increasedmitochondrial ROS levels both in the absence and presence of TGF-β/FBS (online supplementary figureE7A), and inhibited the increase in COPD ASMC number in response to TGF-β/FBS (onlinesupplementary figure E7B). Thus, COPD, and to a lesser extent, healthy smoker ASMCs show improvedredox homeostasis under growth conditions, which may contribute to their increased survival andproliferation.
DiscussionWe have demonstrated that COPD ASMCs exhibit a hyperproliferative phenotype associated with analtered metabolic profile in vitro. COPD cells show lower ATP levels, indicated by lower ADP/AMP andPCr/Cr ratios, both under unstimulated and growth conditions. In addition, fatty acid oxidation capacitywas reduced in COPD ASMCs compared to healthy nonsmoker and smoker ASMCs under unstimulatedconditions, but it was restored under growth conditions. COPD ASMCs showed increased levels ofglutamine and the glycolytic products lactate and alanine, compared to healthy nonsmoker and/or smokerASMCs, under both unstimulated and growth conditions. Additionally, TGF-β/FBS-stimulated COPDASMCs showed higher levels of ribose-5-phosphate, indicating increased flow of glycolytic intermediatesthrough the PPP, and accumulation of glutamine catabolites. Glycolysis, PPP and glutamine catabolismgenerate intermediates required for the biosynthesis of macromolecules and the maintenance of redoxbalance [11]. Indeed, fatty acid and amino acid levels were elevated in COPD ASMCs compared to healthynonsmoker and/or smoker cells under unstimulated and growth conditions. Moreover, TGF-β/FBS-stimulated COPD ASMCs maintained higher levels of nucleotide biosynthesis intermediates, and a
20
15
****
**
10
5
0
a)
AD
P/A
MP
ra
tio
– – – – – – + + +
0 h 48 h
TGF-β/FBS
6
*
4
2
0
b)
PC
r/C
r ra
tio
– – – – – – + + +
0 h 48 h
TGF-β/FBS
***
*
*
*
*
0
0.5
1.0
1.5
2.0
2.5c)
Ino
rga
nic
ph
osp
ha
te
sca
led
in
ten
sit
y
– – – – – – + + +
0 h 48 h
TGF-β/FBS
*
**
**
*
*
Healthy nonsmokersHealthy smokersCOPD patients
FIGURE 2 Relative ADP/AMP and creatine phosphate (PCr)/creatine (Cr) ratios and inorganic phosphate levels. Airway smooth muscle cellsisolated from healthy nonsmokers (n=6), healthy smokers (n=6) and patients with chronic obstructive pulmonary disease (COPD) (n=6) wereserum-starved overnight. Cell pellets were collected immediately after starvation (t=0) or after incubation in the absence or presence oftransforming growth factor (TGF)-β (1 ng·mL−1) and fetal bovine serum (FBS) (2.5%) for 48 h. The ratios of the scaled intensities of a) ADP/AMPand b) PCr/Cr, and the scaled intensities of c) inorganic phosphate were determined in cell lysates using liquid chromatography massspectrometry. Whiskers represent the spread of the data points; horizontal lines indicate the median value; and the + symbols indicate the meanof the values. *: p<0.05; **: p<0.01.
https://doi.org/10.1183/13993003.00202-2017 6
COPD | C. MICHAELOUDES ET AL.
higher reduced to oxidised glutathione ratio and lower mitochondrial oxidant levels. Increased availabilityof macromolecules and maintenance of redox balance may support increased proliferation in COPDASMCs.
Low ADP/AMP and PCr/Cr ratios and elevated inorganic phosphate levels indicate lower ATP levels inCOPD ASMCs both in the absence and presence of mitogenic stimulation. This possibly reflects areduction in mitochondrial respiration in COPD ASMCs, as previously described [6], and is consistentwith a lower PGC-1β mRNA expression. Fatty acids interact with carnitine molecules, forming long-chainacylcarnitines that transport fatty acids to the mitochondrion and peroxisomes where they undergo fattyacid oxidation to produce acetyl-coenzyme A, NADH and FADH2 required for mitochondrial respiration [26].Decreased baseline ratios of even-numbered (C2) and total (C2+C3) acylcarnitines to free carnitine (C0)suggest an impaired fatty acid oxidation capacity in COPD ASMCs, which may also contribute to theattenuated mitochondrial respiration. Carnitine levels are reduced in an elastase-induced mouse model ofemphysema [27], while impaired fatty acid oxidation and lipid accumulation have been reported in ageingmice [28]. The accumulation of fatty acids observed in COPD ASMCs under unstimulated and growth
0
0.5
1.0
1.5
2.0
2.5
3.0
3.5a)
Glu
co
se
sca
led
in
ten
sit
y
– – – – – – + + +
0 h 48 h
TGF-β/FBS
1.5
1.0
2.0
0.5
0
b)
La
cta
te
sca
led
in
ten
sit
y
– – – – – – + + +
0 h 48 h
TGF-β/FBS
0
0.5
1.0
1.5
2.0
2.5c)
Ala
nin
e
sca
led
in
ten
sit
y
– – – – – – + + +
0 h 48 h
TGF-β/FBS
4
3
2
1
0
d)
Rib
ose
-5-p
ho
sp
ha
te
sca
led
in
ten
sit
y
– – – – – – + + +TGF-β/FBS
0
0.5
1.0
1.5
2.0
2.5e)U
rid
ine
sca
led
in
ten
sit
y
– – – – – – + + +TGF-β/FBS
0
5
10
15
20f)
Cyt
idin
e
sca
led
in
ten
sit
y
– – – – – – + + +TGF-β/FBS
4
3
5
2
1
0
g)
Th
ymid
ine
sca
led
in
ten
sit
y
– – – – – – + + +TGF-β/FBS
6
4
2
0
h)
Ad
en
osin
e
sca
led
in
ten
sit
y
– – – – – – + + +TGF-β/FBS
**
**
*
* *
*
*
*
**
*
*
****
**
*
**
Healthy nonsmokersHealthy smokersCOPD patients
0 h 48 h 0 h 48 h 0 h 48 h
0 h 48 h 0 h 48 h
FIGURE 3 Relative levels of metabolites of glycolysis, pentose phosphate pathway and nucleotide metabolism. Airway smooth muscle cellsisolated from healthy nonsmokers (n=6), healthy smokers (n=6) and patients with chronic obstructive pulmonary disease (COPD) (n=6) wereserum-starved overnight. Cell pellets were collected immediately after starvation (t=0) or after incubation in the absence or presence oftransforming growth factor (TGF)-β (1 ng·mL−1) and fetal bovine serum (FBS) (2.5%) for 48 h. The scaled intensities of a) glucose, b) lactate,c) alanine, d) ribose-5-phosphate, e) uridine, f ) cytidine, g) thymidine and h) adenosine were determined in cell lysates by liquid chromatographymass spectrometry or gas chromatography mass spectrometry. Whiskers represent the spread of the data points; horizontal lines indicate themedian value; and the + symbols indicate the mean of the values. *: p<0.05; **: p<0.01.
https://doi.org/10.1183/13993003.00202-2017 7
COPD | C. MICHAELOUDES ET AL.
conditions may result from reduced fatty acid oxidation and/or increased uptake or biosynthesis of fattyacid in these cells.
Lactate, alanine and glutamine levels are elevated in COPD ASMCs, suggesting increased glycolytic activityand increased glutamine uptake or biosynthesis. COPD ASMCs showed elevated baseline mRNAexpression of PDK1, which mediates the redirection of pyruvate towards lactate and alanine production [11],suggesting that the glycolytic shift possibly occurs downstream of pyruvate. This may explain ourobservation that COPD and healthy smoker ASMCs had the same sensitivity to the antiproliferative effectof 2-DG, an inhibitor of the first step of glycolysis [11]. Increased use of glycolysis and glutamine forenergy production may be an adaptive response to mitochondrial dysfunction [9]. Reduced mitochondrialrespiration in cigarette smoke extract-exposed lung epithelial cells has been shown to be associated with ashift towards glycolysis [29]. Glycolysis and glutamine catabolism support hyperproliferation and survivalin cancer cells by providing precursors for biosynthesis and antioxidant protection. Glycolyticintermediates feed into fatty acid and amino acid biosynthesis, and into the PPP to generateribose-5-phosphate for nucleotide synthesis, and NADPH to maintain redox balance [30]. Glutamine iscatabolised to glutamate, donating its amide nitrogen for nucleotide synthesis. In addition, glutamate feedsinto the Kreb’s cycle through its conversion to α-ketoglutarate leading to the production of NADPH andlactate, and acts as a precursor for glutathione synthesis [11].
In addition to elevated fatty acid levels, COPD ASMCs showed an increase in the majority of amino acids(online supplementary table E9) under both unstimulated and growth conditions. This increasedavailability of fatty acid and amino acids may be a result of increased biosynthesis; however, autophagymay also contribute to this effect [31]. Moreover, under growth conditions COPD ASMCs showedevidence of enhanced nucleotide biosynthesis and augmented antioxidant protection, reflected by a higherGSH/GSSG ratio and lower mitochondrial ROS levels. The increased PPP activity and glutaminecatabolism observed in COPD ASMCs under growth conditions possibly drives these processes throughthe production of nucleotide precursors and NADPH. Enhanced glutathione biosynthesis may also beinvolved in the enhanced antioxidant response. Glutamate, a constituent of glutathione, and S-adenosylmethionine and cystathionine intermediates of the methionine cycle and transulfuration [32], whichprovide cysteine for glutathione synthesis, are increased in TGF-β/FBS-stimulated COPD ASMCs (onlinesupplementary figure E7C−D).
COPD ASMCs show evidence of reduced mitochondrial respiration accompanied by increased glycolysisand glutamine utilisation, processes that support biosynthesis and antioxidant responses. The greateravailability of biosynthetic intermediates and antioxidant protection may help drive the associatedenhanced proliferation seen in COPD cells [3]. A similar metabolic phenotype, involving reducedmitochondrial respiration and increased glycolysis, PPP activity and glutamine utilisation, associated withincreased biosynthetic activity, has been shown to contribute to increased vascular smooth muscle cell andendothelial cell growth in PAH [33–35]. Thus, the metabolic reprogramming observed in COPD ASMCsmay contribute to their hyperproliferative phenotype. This is supported by our findings showing
2.0
1.5
*
1.0
0.5
0
a)
Glu
tam
ine
sca
led
in
ten
sit
y
– – – – – – + + +
0 h 48 h
Healthy nonsmokersHealthy smokersCOPD patients
TGF-β/FBS
*
0.4
0.6
0.8
1.0
1.2
1.4
1.6
1.8
2.0b)
Glu
tam
ate
sca
led
in
ten
sit
y
– – – – – – + + +
0 h 48 h
TGF-β/FBS
*
0
0.5
1.0
1.5
2.0
2.5
3.0c)
GA
BA
sca
led
in
ten
sit
y
– – – – – – + + +
0 h 48 h
TGF-β/FBS
*
** **
* *
*
*
FIGURE 4 Relative levels of glutamine and glutamine catabolites. Airway smooth muscle cells isolated from healthy nonsmokers (n=6), healthysmokers (n=6) and patients with chronic obstructive pulmonary disease (COPD) (n=6) were serum-starved overnight. Cell pellets were collectedimmediately after starvation (t=0) or after incubation in the absence or presence of transforming growth factor (TGF)-β (1 ng·mL−1) and fetalbovine serum (FBS) (2.5%) for 48 h. The scaled intensities of a) glutamine, b) glutamate and c) γ-aminobutyrate (GABA) were determined in celllysates by liquid chromatography mass spectrometry or gas chromatography mass spectrometry. Whiskers represent the spread of the datapoints; horizontal lines indicate the median value; and the + symbols indicate the mean of the values. *: p<0.05; **: p<0.01.
https://doi.org/10.1183/13993003.00202-2017 8
COPD | C. MICHAELOUDES ET AL.
attenuation of TGF-β/FBS-mediated COPD ASMC proliferation by glycolysis and glutathione synthesisinhibition, and glutamine depletion. These mechanisms merit further investigation.
The molecular mechanisms underlying the metabolic shift in COPD ASMCs are currently unknown. Inline with our findings, studies in COPD lung tissue and airway epithelial cells have reporteddownregulation of genes involved in mitochondrial function, including oxidative phosphorylation, andincreased expression of genes involved in glycolysis, PPP and glutathione synthesis [36–38]. Prolongedexposure to cigarette smoke may play a role in these changes as ASMCs from healthy smokers showdistinct metabolic differences such as in fatty acid oxidation and methionine metabolism compared tohealthy nonsmokers. Metabolic reprogramming is known to be driven by mitochondrial dysfunction andpathways such as the PI3K/Akt, mTOR and hypoxia-inducible factor-1α, which play a key role in COPDpathogenesis [10, 11, 39]. We cannot exclude the possibility that some of these changes may beepiphenomena rather than direct causes of the aberrant phenotype of COPD ASMCs. Future studies will
0
1
2
3
4a)
Ca
pro
ate
(6
:0)
sca
led
in
ten
sit
y
– – – – – – + + +
0 h 48 h
TGF-β/FBS
3
2
4
1
0
b)
Myr
isto
lea
te (
14
:1n
5)
sca
led
in
ten
sit
y
– – – – – – + + +
0 h 48 h
TGF-β/FBS
0
2
4
6c)
Ca
pry
late
(8
:0)
sca
led
in
ten
sit
y
– – – – – – + + +
0 h 48 h
TGF-β/FBS
3
2
1
0
d)
Va
cce
na
te (
18
:1n
7)
sca
led
in
ten
sit
y
– – – – – – + + +TGF-β/FBS
3
2
1
0
e)C
2/C
0
sca
led
in
ten
sit
y
– – – – – – + + +TGF-β/FBS
0
1
2
3
4
5f)
(C2
+C
3)/
C0
sca
led
in
ten
sit
y
– – – – – – + + +TGF-β/FBS
4
3
5
2
1
0
g)
He
xa
no
yllc
arn
itin
e (
C6
)
sca
led
in
ten
sit
y
– – – – – – + + +TGF-β/FBS
**
*
*
*
***
*
**
**
**
*
*
*
*
* **
*
*
***
***
**
**
**
**
*
**
Healthy nonsmokersHealthy smokersCOPD patients
0 h 48 h 0 h 48 h 0 h 48 h
0 h 48 h
FIGURE 5 Relative levels of fatty acids and intermediates of carnitine metabolism. Airway smooth muscle cells (ASMCs) isolated from healthynonsmokers (n=6), healthy smokers (n=6) and patients with chronic obstructive pulmonary disease (COPD) (n=6) were serum-starved overnight.Cell pellets were collected immediately after starvation (t=0) or after incubation in the absence or presence of transforming growth factor (TGF)-β(1 ng·mL−1) and fetal bovine serum (FBS) (2.5%) for 48 h. The scaled intensities of a) caproate, b) myristoleate, c) caprylate, d) vaccenate andg) hexanoylcarnitine, as well as the e) ratio of acetylcarnitine (C2) to free carnitine (C0) and f) the ratio of the sum of C2 and propionylcarnitine(C3) to free carnitine (C0) were determined in cell lysates by liquid chromatography mass spectrometry or gas chromatography massspectrometry. Whiskers represent the spread of the data points; horizontal lines indicate the median value; and the + symbols indicate the meanof the values. *: p<0.05; **: p<0.01.
https://doi.org/10.1183/13993003.00202-2017 9
COPD | C. MICHAELOUDES ET AL.
aim to validate and elucidate these mechanisms and investigate their possible role as drivers of thedefective airway smooth muscle function in COPD.
A limitation of our study is the limited number of subjects. Nevertheless, in this preliminary study, wewere able to show significant differences in the metabolomic profile of COPD ASMCs. Another limitationis the higher mean age of the COPD patients, which may be a confounding factor in our study, as age isassociated with impaired cellular metabolic activity [40]. We cannot exclude the possibility that some ofthe metabolic changes we observe in COPD ASMCs are age-related; however, age cannot entirely explainthe differences we observed between COPD and controls.
In conclusion, we demonstrate that COPD ASMCs demonstrate a distinct metabolic and redox profilecompared to those from healthy nonsmokers and smokers. This involves a shift in glucose and glutaminemetabolism that may support increased biosynthesis and enhanced antioxidant levels. These metabolicchanges are associated with increased cellular growth, and thus may be molecular targets for reversingairway smooth muscle dysfunction in COPD.
AcknowledgementsThe COPDMAP collaborators are as follows. Peter J. Barnes, Airways Disease Division, National Heart and LungInstitute, Imperial College London, London, UK; Christopher E. Brightling, Institute of Lung Health, Dept of Infection,Inflammation and Immunity, University of Leicester, Leicester, UK; Donna E. Davies, The Brooke Laboratories, Divisionof Infection, Inflammation and Repair, School of Medicine, University of Southampton, Southampton General Hospital,Southampton, UK; Andrew J. Fisher, Institute of Cellular Medicine, Newcastle University, and CardiopulmonaryTransplantation, Institute of Transplantation, Freeman Hospital, Newcastle upon Tyne, UK; Alasdair Gaw, Innovate UK,Technology Strategy Board, Swindon, UK; Alan J. Knox, Centre for Respiratory Research, City Hospital, Nottingham,UK; Ruth J. Mayer, GlaxoSmithKline, King of Prussia, PA, USA; Michael Polkey, NIHR Respiratory BiomedicalResearch Unit, Royal Brompton and Harefield NHS Foundation Trust and Imperial College London, London; MichaelSalmon, Biology Discovery, Merck Research Laboratories, Boston, MA, USA; Yolanda Sanchez, GlaxoSmithKline; DaveSingh, University of Manchester, Medicines Evaluation Unit, University Hospital of South Manchester NHS FoundationTrust, Manchester, UK; Ruth Tal-Singer, GlaxoSmithKline.
References1 Chung KF. The role of airway smooth muscle in the pathogenesis of airway wall remodeling in chronic obstructive
pulmonary disease. Proc Am Thorac Soc 2005; 2: 347–354.2 Ichimaru Y, Krimmer DI, Burgess JK, et al. TGF-β enhances deposition of perlecan from COPD airway smooth
muscle. Am J Physiol Lung Cell Mol Physiol 2012; 302: L325–L333.3 Perry M, Baker J, Chung KF. Airway smooth muscle cells from patients with COPD exhibit a higher degree of
cellular proliferation and steroid insensitivity than that from healthy patients. Eur Respir J 2011; 38: Suppl. 55,748.
4 McBride HM, Neuspiel M, Wasiak S. Mitochondria: more than just a powerhouse. Curr Biol 2006; 16:R551–R560.
2.0
1.5 *
1.0
0.5
0
a)
GS
H/G
SS
G r
ati
o
– – – –– – + + +
0 h 48 h
TGF-β/FBS
*
Healthy nonsmokersHealthy smokersCOPD patients
800
600
1000 *
400
200
0
b)
Mit
och
on
dri
al
RO
S
MF
I
–– – + + +
48 h
TGF-β/FBS
**
FIGURE 6 Relative ratios of reduced/oxidised glutathione and mitochondrial reactive oxygen species (ROS)levels. a) Airway smooth muscle cells (ASMCs) isolated from healthy nonsmokers (n=6), healthy smokers(n=6) and patients with chronic obstructive pulmonary disease (COPD) (n=6) were serum-starved overnight.Cell pellets were collected immediately after starvation (t=0) or after incubation in the absence or presence oftransforming growth factor (TGF)-β (1 ng·mL−1) and fetal bovine serum (FBS) (2.5%) for 48 h. The ratio of thescaled intensities of reduced to oxidised glutathione (GSH/GSSG) was determined in cell lysates by liquidchromatography mass spectrometry; b) ASMCs isolated from healthy nonsmokers (n=7), healthy smokers(n=8) and patients with COPD (n=8) were serum-starved overnight and incubated in the absence or presenceof TGF-β/FBS for 48 h. Mitochondrial ROS levels were determined using MitoSOX (Invitrogen, Paisley, UK)staining and expressed as median fluorescence intensity (MFI). Whiskers represent the spread of the datapoints; horizontal lines indicate the median value; and the + symbols indicate the mean of the values.*: p<0.05; **: p<0.01.
https://doi.org/10.1183/13993003.00202-2017 10
COPD | C. MICHAELOUDES ET AL.
5 Hoffmann RF, Zarrintan S, Brandenburg SM, et al. Prolonged cigarette smoke exposure alters mitochondrialstructure and function in airway epithelial cells. Respir Res 2013; 14: 97.
6 Wiegman CH, Michaeloudes C, Haji G, et al. Oxidative stress-induced mitochondrial dysfunction drivesinflammation and airway smooth muscle remodeling in patients with chronic obstructive pulmonary disease.J Allergy Clin Immunol 2015; 136: 769–780.
7 Ahmad T, Sundar IK, Lerner CA, et al. Impaired mitophagy leads to cigarette smoke stress-induced cellularsenescence: implications for chronic obstructive pulmonary disease. FASEB J 2015; 29: 2912–2929.
8 Mizumura K, Cloonan SM, Nakahira K, et al. Mitophagy-dependent necroptosis contributes to the pathogenesisof COPD. J Clin Invest 2014; 124: 3987–4003.
9 Sutendra G, Bonnet S, Rochefort G, et al. Fatty acid oxidation and malonyl-CoA decarboxylase in the vascularremodeling of pulmonary hypertension. Sci Transl Med 2010; 2: 44ra58.
10 Srinivasan S, Guha M, Dong DW, et al. Disruption of cytochrome c oxidase function induces the Warburg effectand metabolic reprogramming. Oncogene 2016; 35: 1585–1595.
11 Tennant DA, Durán RV, Gottlieb E. Targeting metabolic transformation for cancer therapy. Nat Rev Cancer 2010;10: 267–277.
12 Adamko DJ, Nair P, Mayers I, et al. Metabolomic profiling of asthma and chronic obstructive pulmonary disease:a pilot study differentiating diseases. J Allergy Clin Immunol 2015; 136: 571–580.
13 Basanta M, Jarvis RM, Xu Y, et al. Non-invasive metabolomic analysis of breath using differential mobilityspectrometry in patients with chronic obstructive pulmonary disease and healthy smokers. Analyst 2010; 135:315–320.
14 Bowler RP, Jacobson S, Cruickshank C, et al. Plasma sphingolipids associated with chronic obstructive pulmonarydisease phenotypes. Am J Respir Crit Care Med 2015; 191: 275–284.
15 Ubhi BK, Cheng KK, Dong J, et al. Targeted metabolomics identifies perturbations in amino acid metabolism thatsub-classify patients with COPD. Mol Biosyst 2012; 8: 3125–3133.
16 Ubhi BK, Riley JH, Shaw PA, et al. Metabolic profiling detects biomarkers of protein degradation in COPDpatients. Eur Respir J 2012; 40: 345–355.
17 Wang L, Tang Y, Liu S, et al. Metabonomic profiling of serum and urine by 1H NMR-based spectroscopydiscriminates patients with chronic obstructive pulmonary disease and healthy individuals. PLoS One 2013; 8:e65675.
18 Motta A, Paris D, Melck D, et al. Nuclear magnetic resonance-based metabolomics of exhaled breath condensate:methodological aspects. Eur Respir J 2012; 39: 498–500.
19 Sharma P, Tran T, Stelmack GL, et al. Expression of the dystrophin-glycoprotein complex is a marker for humanairway smooth muscle phenotype maturation. Am J Physiol Lung Cell Mol Physiol 2008; 294: L57–L68.
20 Naz S, Kolmert J, Yang M, et al. Metabolomics analysis identifies sex-associated metabotypes of oxidative stressand the autotaxin-lysoPA axis in COPD. Eur Respir J 2017; 49: 1602322.
21 Michaeloudes C, Chang PJ, Petrou M, et al. Transforming growth factor-β and nuclear factor E2-related factor 2regulate antioxidant responses in airway smooth muscle cells: role in asthma. Am J Respir Crit Care Med 2011;184: 894–903.
22 Gosens R, Stelmack GL, Dueck G, et al. Caveolae facilitate muscarinic receptor-mediated intracellular Ca2+
mobilization and contraction in airway smooth muscle. Am J Physiol Lung Cell Mol Physiol 2007; 293:L1406–L1418.
23 Fessel JP, Hamid R, Wittmann BM, et al. Metabolomic analysis of bone morphogenetic protein receptor type 2mutations in human pulmonary endothelium reveals widespread metabolic reprogramming. Pulm Circ 2012; 2:201–213.
24 Tibshirani R, Hastie T, Narasimhan B, et al. Diagnosis of multiple cancer types by shrunken centroids of geneexpression. Proc Natl Acad Sci USA 2002; 99: 6567–6572.
25 Aggio RB, Ruggiero K, Villas-Bôas SG. Pathway Activity Profiling (PAPi): from the metabolite profile to themetabolic pathway activity. Bioinformatics 2010; 26: 2969–2976.
26 Metallo CM, Gameiro PA, Bell EL, et al. Reductive glutamine metabolism by IDH1 mediates lipogenesis underhypoxia. Nature 2012; 481: 380–384.
27 Conlon TM, Bartel J, Ballweg K, et al. Metabolomics screening identifies reduced L-carnitine to be associated withprogressive emphysema. Clin Sci 2016: 130: 273–287.
28 Hyyti OM, Ledee D, Ning XH, et al. Aging impairs myocardial fatty acid and ketone oxidation and modifiescardiac functional and metabolic responses to insulin in mice. Am J Physiol Heart Circ Physiol 2010; 299:H868–H875.
29 Cloonan SM, Glass K, Laucho-Contreras ME, et al. Mitochondrial iron chelation ameliorates cigarettesmoke-induced bronchitis and emphysema in mice. Nat Med 2016; 22: 163–174.
30 Boroughs LK, DeBerardinis RJ. Metabolic pathways promoting cancer cell survival and growth. Nat Cell Biol 2015;17: 351–359.
31 Eng CH, Abraham RT. The autophagy conundrum in cancer: influence of tumorigenic metabolic reprogramming.Oncogene 2011; 30: 4687–4696.
32 Liu Y, Hyde AS, Simpson MA, et al. Emerging regulatory paradigms in glutathione metabolism. Adv Cancer Res2014; 122: 69–101.
33 Chettimada S, Gupte R, Rawat D, et al. Hypoxia-induced glucose-6-phosphate dehydrogenase overexpression and-activation in pulmonary artery smooth muscle cells: implication in pulmonary hypertension. Am J Physiol LungCell Mol Physiol 2015; 308: L287–L300.
34 Li M, Riddle S, Zhang H, et al. Metabolic reprogramming regulates the proliferative and inflammatory phenotypeof adventitial fibroblasts in pulmonary hypertension through the transcriptional corepressor C-terminal bindingprotein-1. Circulation 2016; 134: 1105–1121.
35 Plecitá-Hlavatá L, Tauber J, Li M, et al. Constitutive reprogramming of fibroblast mitochondrial metabolism inpulmonary hypertension. Am J Respir Cell Mol Biol 2016; 55: 47–57.
36 Golpon HA, Coldren CD, Zamora MR, et al. Emphysema lung tissue gene expression profiling. Am J Respir CellMol Biol 2004; 31: 595–600.
https://doi.org/10.1183/13993003.00202-2017 11
COPD | C. MICHAELOUDES ET AL.

37 Ning W, Li CJ, Kaminski N, et al. Comprehensive gene expression profiles reveal pathways related to thepathogenesis of chronic obstructive pulmonary disease. Proc Natl Acad Sci USA 2004; 101: 14895–14900.
38 Pierrou S, Broberg P, O’Donnell RA, et al. Expression of genes involved in oxidative stress responses in airwayepithelial cells of smokers with chronic obstructive pulmonary disease. Am J Respir Crit Care Med 2007; 175:577–586.
39 Selak MA, Armour SM, MacKenzie ED, et al. Succinate links TCA cycle dysfunction to oncogenesis by inhibitingHIF-α prolyl hydroxylase. Cancer Cell 2005; 7: 77–85.
40 Finkel T. The metabolic regulation of aging. Nat Med 2015; 21: 1416–1423.
https://doi.org/10.1183/13993003.00202-2017 12
COPD | C. MICHAELOUDES ET AL.
Related Documents