Journal of Experimental Botany doi:10.1093/jxb/eru432 RESEARCH PAPER Metabolic profiles of soybean roots during early stages of Fusarium tucumaniae infection María M. Scandiani 1, *, Alicia G. Luque 1 , María V. Razori 2 , Lucila Ciancio Casalini 2 , Takayuki Aoki 3 , Kerry O’Donnell 4 , Gerardo D.L. Cervigni 2 and Claudia P. Spampinato 2, * 1 Centro de Referencia de Micología (CEREMIC), Facultad de Ciencias Bioquímicas y Farmacéuticas, Universidad Nacional de Rosario, Suipacha 531, 2000 Rosario, Argentina 2 Centro de Estudios Fotosintéticos y Bioquímicos (CEFOBI), Facultad de Ciencias Bioquímicas y Farmacéuticas, Universidad Nacional de Rosario, Suipacha 531, 2000 Rosario, Argentina 3 National Institute of Agrobiological Sciences, Genetic Resources Center, 2-1-2 Kannondai, Tsukuba, Ibaraki 305–8602, Japan 4 Bacterial Foodborne Pathogens and Mycology, National Center for Agricultural Utilization Research, United States Department of Agriculture, Agricultural Research Service, Peoria, IL 61604–3999, USA * To whom correspondence should be addressed. E-mail: [email protected] or [email protected] Received 28 July 2014; Revised 16 September 2014; Accepted 25 September 2014 Abstract Soybean germplasm exhibits various levels of resistance to Fusarium tucumaniae, the main causal agent of sudden death syndrome (SDS) of soybean in Argentina. In this study, two soybean genotypes, one susceptible (NA 4613) and one partially resistant (DM 4670) to SDS infection, were inoculated with F. tucumaniae. Disease symptoms were scored at 7, 10, 14, and 25 days post-inoculation (dpi). The greatest difference in the area under the disease progress curve (AUDPC) values among genotypes was observed at 25 dpi. In order to detect early metabolic markers that could potentially discriminate between susceptible and resistant genotypes, gas chromatography–mass spectrometry (GC- MS) analyses of root samples were performed. These analyses show higher levels of several amino acids and the polyamine cadaverine in the inoculated than in the uninoculated susceptible cultivar at 7 dpi. Principal component analysis (PCA) revealed that the metabolic profile of roots harvested at the earliest time points from the inoculated susceptible genotype was clearly differentiated from the rest of the samples. Furthermore, variables associated with the first principal component were mainly amino acids. Taken together, the results indicate that the pathogen induced the susceptible plant to accumulate amino acids in roots at early time points after infection, suggesting that GC-MS- based metabolomics could be used for the rapid characterization of cultivar response to SDS. Key words: GC-MS, Glycine max, metabolomics, pathogen infection, plant susceptibility, sudden death syndrome. Introduction Soybean [Glycine max (L.) Merr.] is the most important crop in Argentina. Its production can be greatly limited by diseases. One of the most important diseases is sudden death syndrome (SDS). In Argentina, SDS is caused by at least four Fusarium species: F. tucumaniae, F. virguliforme, F. brasiliense, and F. crassistipitatum (Aoki et al., 2005, 2012; O’Donnell et al., 2010), with F. tucumaniae being the dominant species. The fungus is a soil-borne pathogen that infects plants through the roots, but foliar symptoms typically become discernible only after flowering. Severely infected plants exhibit poor root growth, brownish discoloration of the cortical tissue, and sometimes blue spore masses can be observed on the root © The Author 2014. Published by Oxford University Press on behalf of the Society for Experimental Biology. All rights reserved. For permissions, please email: [email protected] Journal of Experimental Botany Advance Access published October 21, 2014 by guest on October 22, 2014 http://jxb.oxfordjournals.org/ Downloaded from

Welcome message from author
This document is posted to help you gain knowledge. Please leave a comment to let me know what you think about it! Share it to your friends and learn new things together.
Transcript

Journal of Experimental Botanydoi:10.1093/jxb/eru432
ReseaRch PaPeR
Metabolic profiles of soybean roots during early stages of Fusarium tucumaniae infection
María M. Scandiani1,*, Alicia G. Luque1, María V. Razori2, Lucila Ciancio Casalini2, Takayuki Aoki3, Kerry O’Donnell4, Gerardo D.L. Cervigni2 and Claudia P. Spampinato2,*1 Centro de Referencia de Micología (CEREMIC), Facultad de Ciencias Bioquímicas y Farmacéuticas, Universidad Nacional de Rosario, Suipacha 531, 2000 Rosario, Argentina2 Centro de Estudios Fotosintéticos y Bioquímicos (CEFOBI), Facultad de Ciencias Bioquímicas y Farmacéuticas, Universidad Nacional de Rosario, Suipacha 531, 2000 Rosario, Argentina3 National Institute of Agrobiological Sciences, Genetic Resources Center, 2-1-2 Kannondai, Tsukuba, Ibaraki 305–8602, Japan4 Bacterial Foodborne Pathogens and Mycology, National Center for Agricultural Utilization Research, United States Department of Agriculture, Agricultural Research Service, Peoria, IL 61604–3999, USA
* To whom correspondence should be addressed. E-mail: [email protected] or [email protected]
Received 28 July 2014; Revised 16 September 2014; Accepted 25 September 2014
Abstract
Soybean germplasm exhibits various levels of resistance to Fusarium tucumaniae, the main causal agent of sudden death syndrome (SDS) of soybean in Argentina. In this study, two soybean genotypes, one susceptible (NA 4613) and one partially resistant (DM 4670) to SDS infection, were inoculated with F. tucumaniae. Disease symptoms were scored at 7, 10, 14, and 25 days post-inoculation (dpi). The greatest difference in the area under the disease progress curve (AUDPC) values among genotypes was observed at 25 dpi. In order to detect early metabolic markers that could potentially discriminate between susceptible and resistant genotypes, gas chromatography–mass spectrometry (GC-MS) analyses of root samples were performed. These analyses show higher levels of several amino acids and the polyamine cadaverine in the inoculated than in the uninoculated susceptible cultivar at 7 dpi. Principal component analysis (PCA) revealed that the metabolic profile of roots harvested at the earliest time points from the inoculated susceptible genotype was clearly differentiated from the rest of the samples. Furthermore, variables associated with the first principal component were mainly amino acids. Taken together, the results indicate that the pathogen induced the susceptible plant to accumulate amino acids in roots at early time points after infection, suggesting that GC-MS-based metabolomics could be used for the rapid characterization of cultivar response to SDS.
Key words: GC-MS, Glycine max, metabolomics, pathogen infection, plant susceptibility, sudden death syndrome.
Introduction
Soybean [Glycine max (L.) Merr.] is the most important crop in Argentina. Its production can be greatly limited by diseases. One of the most important diseases is sudden death syndrome (SDS). In Argentina, SDS is caused by at least four Fusarium species: F. tucumaniae, F. virguliforme, F. brasiliense, and F. crassistipitatum (Aoki et al., 2005, 2012; O’Donnell et al.,
2010), with F. tucumaniae being the dominant species. The fungus is a soil-borne pathogen that infects plants through the roots, but foliar symptoms typically become discernible only after flowering. Severely infected plants exhibit poor root growth, brownish discoloration of the cortical tissue, and sometimes blue spore masses can be observed on the root
© The Author 2014. Published by Oxford University Press on behalf of the Society for Experimental Biology. All rights reserved. For permissions, please email: [email protected]
Journal of Experimental Botany Advance Access published October 21, 2014 by guest on O
ctober 22, 2014http://jxb.oxfordjournals.org/
Dow
nloaded from
Page 2 of 12 | Scandiani et al.
surface. The disease is characterized by the sudden develop-ment of foliar chlorosis and necrosis, followed by premature defoliation (Rupe and Hartman, 1999; Navi and Yang, 2008; Gongora-Canul and Leandro, 2011b; Gongora-Canul et al., 2012). Additional symptoms include mottling of leaves on the upper part of the plant, vascular discoloration of the lower part of the stem, pod abortion, petiole retention, and red coloration on the basal stems, although the pith remains white (Rupe and Hartman, 1999).
Selection for field resistance to SDS caused by F. virgu-liforme is difficult due to the quantitative nature of the trait and interactions between resistance loci and environmental factors (Njiti et al., 1996; Rupe et al., 1996). Infection and disease development are highly dependent on environmental conditions. Soil moisture and warm/cool temperatures play important roles in the occurrence and severity of SDS, with foliar symptoms being more severe during wet seasons when soils are saturated (Gongora-Canul and Leandro, 2011a; Leandro et al., 2013). Thus, any soybean variety available to growers can develop disease in particularly favourable condi-tions for the pathogens, such as high inoculum density, abun-dant soil moisture, or presence of the soybean cyst nematode (SCN) (Gongora-Canul et al., 2012; Leandro et al., 2012). Various levels of resistance to F. tucumaniae have also been observed in Argentinean soybean germplasm (Scandiani et al., 2011; Lenzi et al., 2013).
Because root infection occurs prior to expression of foliar symptoms, pathogen effects on root metabolism in pre-symp-tomatic plants may be important for discriminating resist-ant and susceptible genotypes. In fact, metabolite profiling has been proposed as a highly valuable and well established method in identifying plant responses to biotic stresses (Colebatch et al., 2004; Desbrosses et al., 2005; Parker et al., 2009; Hofmann et al., 2010; Bazzini et al., 2011). Here, gas chromatography–mass spectrometry (GC-MS) analyses were used with the aim of detecting early alterations in plant metabolic pathways following infection by F. tucumaniae. The experimental design involved the use of a single strain of F. tucumaniae, two genetically diverse soybean cultivars, one susceptible (NA 4613) and one partially resistant (DM 4670) to SDS infection, and sampling at different stages of plant pathogenesis. Thirty-eight metabolites including amino acids, organic acids, soluble sugars, alcohols, fatty acids, and a miscellaneous group were identified. In addition, two uniden-tified sugars and two unidentified analytes were discovered. To the best of the authors’ knowledge, this is the first report that provides information concerning primary metabolic changes that are triggered in soybean roots by F. tucumaniae infection.
Materials and methods
Plant and pathogenic materialsTwo commercial soybean cultivars with contrasting levels of resist-ance to SDS, based on previous field evaluations, one susceptible (NA 4613) and one partially resistant (DM 4670), and F. tucumaniae isolate CCC130-11 [CCC=Culture Collection of the CEREMIC (Centro de Referencia de Micología), Facultad de Ciencias
Bioquímicas y Farmacéuticas, UNR] were used in the experiments. Both soybean cultivars were of the same maturity group and they shared a similar growth habit.
Fungal infectionsInoculum was prepared by culturing F. tucumaniae CCC130-11 on potato dextrose agar (PDA, Britania) supplemented with 100 mg l–1 streptomycin in 9 cm plastic Petri dishes for 1 week at 25 °C in the dark, after which agar plugs (6 mm in diameter) were excised from the growing edge of the colony. Five plugs were added to 125 g of sorghum grain that had been autoclaved for 60 min at 121 °C in a 500 ml flask on two consecutive days, following a published protocol (Hartman et al., 1997). The flask was incubated at 25 °C in the dark for 2 weeks and shaken daily.
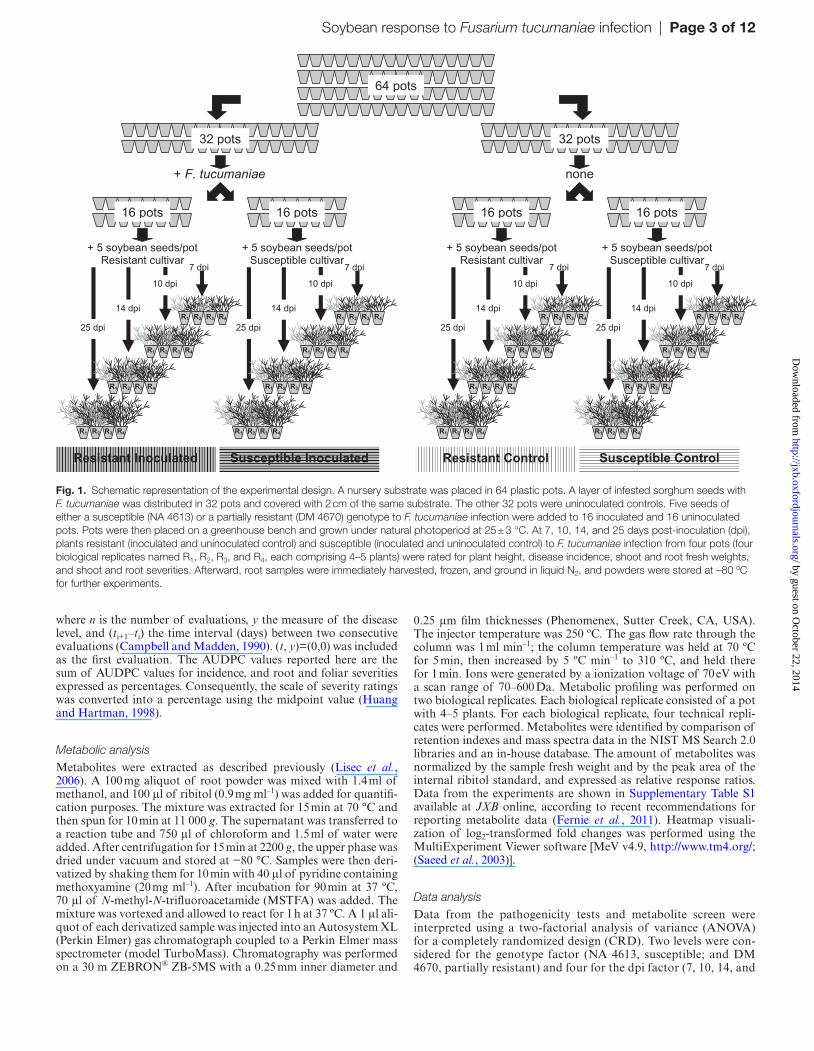
Figure 1 shows a schematic representation of the experimental design. A nursery substrate (120 g, Grow Mix, Multipro, Terrafertil S.A., Buenos Aires, Argentina) (Barros et al., 2014) was placed in 8 × 11 cm plastic pots (Scandiani et al., 2011). A layer of infested sorghum seeds (3 g) was distributed in half of the experimental pots and covered with 2 cm of the same substrate. The other pots were not inoculated. Five seeds of the susceptible or partially resistant soybean cultivar were then added to inoculated and uninoculated pots and covered with another 2 cm of the same substrate (Aoki et al., 2005; Scandiani et al., 2011). Soil was watered to saturation after planting and maintained at near field capacity throughout the study in a greenhouse under a natural photoperiod at 25 ± 3 °C for 7, 10, 14, and 25 d. Each biological replicate consisted of a pot with 4–5 plants. All plants were cultivated in parallel under equal growth conditions. The experimental design, comprising (i) the presence and absence of fungal infection, (ii) two soybean cultivars display-ing different resistance to fungal infection, and (iii) four time points after inoculation, allowed the discrimination of effects that were due to progression of the plant–fungal interaction from those related either to genotype or to developmental effects of the plant.
Pathogenicity testsPlants were rated for height, disease incidence, shoot and root fresh weight, and foliar and root severity at 7, 10, 14, and 25 days post-inoculation (dpi). Disease incidence was based on the percentage of plants with foliar symptoms typical of SDS (Roy, 1997; Rupe et al., 2001). Symptoms ranged from leaf curling and rugosity, marginal cupping, mottling, chlorotic interveinal spots, interveinal chlorosis and necrosis, to leaf drop and stunting (Rupe and Hartman, 1999).
Foliar disease severity was rated at each time point based on a scale of 1–5 where 1=no symptoms, 2=light symptom development with mottling and mosaic (1–20% foliage affected), 3=moderate symptom development with interveinal chlorosis and necrosis (21–50% foliage affected), 4=heavy symptom development (51–80% foli-age affected), and 5=severe symptom development with interveinal chlorosis and necrosis and/or dead plants (81–100% foliage affected) (Huang and Hartman, 1998). Plants were then removed from the soil and cut off at the soil line for the determination of fresh shoot weight. Roots were then washed under running water before rating rot using a 1–5 scale where 1=healthy roots and tap root, 2= <25% of lateral roots and tap root with necrosis, 3=25–50% of lateral roots and tap root with visible necrosis, 4=51–90% of lateral roots and tap roots with necrosis, and 5= >90% of root system with necrosis, plants dead (Achenbach et al., 1996). Finally, fresh root weight was determined and root samples were ground in liquid N2 into powders that were stored at –80 ºC for further analyses.
At the end of the experiment, the area under the disease progress curve (AUDPC) was estimated. The AUDPC was calculated using the following equation:
AUDPC y y t ti i i in
n
= + × −+ +
−
∑ ( ) / ( )1 1
1
2
by guest on October 22, 2014
http://jxb.oxfordjournals.org/D
ownloaded from
Soybean response to Fusarium tucumaniae infection | Page 3 of 12
where n is the number of evaluations, y the measure of the disease level, and (ti+1–ti) the time interval (days) between two consecutive evaluations (Campbell and Madden, 1990). (t, y)=(0,0) was included as the first evaluation. The AUDPC values reported here are the sum of AUDPC values for incidence, and root and foliar severities expressed as percentages. Consequently, the scale of severity ratings was converted into a percentage using the midpoint value (Huang and Hartman, 1998).
Metabolic analysisMetabolites were extracted as described previously (Lisec et al., 2006). A 100 mg aliquot of root powder was mixed with 1.4 ml of methanol, and 100 μl of ribitol (0.9 mg ml–1) was added for quantifi-cation purposes. The mixture was extracted for 15 min at 70 °C and then spun for 10 min at 11 000 g. The supernatant was transferred to a reaction tube and 750 μl of chloroform and 1.5 ml of water were added. After centrifugation for 15 min at 2200 g, the upper phase was dried under vacuum and stored at −80 °C. Samples were then deri-vatized by shaking them for 10 min with 40 μl of pyridine containing methoxyamine (20 mg ml–1). After incubation for 90 min at 37 ºC, 70 μl of N-methyl-N-trifluoroacetamide (MSTFA) was added. The mixture was vortexed and allowed to react for 1 h at 37 ºC. A 1 μl ali-quot of each derivatized sample was injected into an Autosystem XL (Perkin Elmer) gas chromatograph coupled to a Perkin Elmer mass spectrometer (model TurboMass). Chromatography was performed on a 30 m ZEBRON® ZB-5MS with a 0.25 mm inner diameter and
0.25 μm film thicknesses (Phenomenex, Sutter Creek, CA, USA). The injector temperature was 250 ºC. The gas flow rate through the column was 1 ml min–1; the column temperature was held at 70 ºC for 5 min, then increased by 5 ºC min–1 to 310 ºC, and held there for 1 min. Ions were generated by a ionization voltage of 70 eV with a scan range of 70–600 Da. Metabolic profiling was performed on two biological replicates. Each biological replicate consisted of a pot with 4–5 plants. For each biological replicate, four technical repli-cates were performed. Metabolites were identified by comparison of retention indexes and mass spectra data in the NIST MS Search 2.0 libraries and an in-house database. The amount of metabolites was normalized by the sample fresh weight and by the peak area of the internal ribitol standard, and expressed as relative response ratios. Data from the experiments are shown in Supplementary Table S1 available at JXB online, according to recent recommendations for reporting metabolite data (Fernie et al., 2011). Heatmap visuali-zation of log2-transformed fold changes was performed using the MultiExperiment Viewer software [MeV v4.9, http://www.tm4.org/; (Saeed et al., 2003)].
Data analysisData from the pathogenicity tests and metabolite screen were interpreted using a two-factorial analysis of variance (ANOVA) for a completely randomized design (CRD). Two levels were con-sidered for the genotype factor (NA 4613, susceptible; and DM 4670, partially resistant) and four for the dpi factor (7, 10, 14, and
64 pots
32 pots 32 pots
+ F. tucumaniae none
Resistant Control
16 pots
+ 5 soybean seeds/pot Resistant cultivar
Susceptible Control
16 pots
+ 5 soybean seeds/pot Susceptible cultivar
10 dpi
7 dpi
14 dpi
25 dpi R1 R2 R3 R4
R1 R2 R3 R4
R1 R2 R3 R4
R1 R2 R3 R4
10 dpi
7 dpi
14 dpi
25 dpi R1 R2 R3 R4
R1 R2 R3 R4
R1 R2 R3 R4
R1 R2 R3 R4
Resistant Inoculated Susceptible Inoculated
16 pots
+ 5 soybean seeds/pot Resistant cultivar
16 pots
+ 5 soybean seeds/pot Susceptible cultivar
10 dpi
7 dpi
14 dpi
25 dpi R1 R2 R3 R4
R1 R2 R3 R4
R1 R2 R3 R4
R1 R2 R3 R4
10 dpi
7 dpi
14 dpi
25 dpi R1 R2 R3 R4
R1 R2 R3 R4
R1 R2 R3 R4
R1 R2 R3 R4
Fig. 1. Schematic representation of the experimental design. A nursery substrate was placed in 64 plastic pots. A layer of infested sorghum seeds with F. tucumaniae was distributed in 32 pots and covered with 2 cm of the same substrate. The other 32 pots were uninoculated controls. Five seeds of either a susceptible (NA 4613) or a partially resistant (DM 4670) genotype to F. tucumaniae infection were added to 16 inoculated and 16 uninoculated pots. Pots were then placed on a greenhouse bench and grown under natural photoperiod at 25 ± 3 °C. At 7, 10, 14, and 25 days post-inoculation (dpi), plants resistant (inoculated and uninoculated control) and susceptible (inoculated and uninoculated control) to F. tucumaniae infection from four pots (four biological replicates named R1, R2, R3, and R4, each comprising 4–5 plants) were rated for plant height, disease incidence, shoot and root fresh weights, and shoot and root severities. Afterward, root samples were immediately harvested, frozen, and ground in liquid N2, and powders were stored at –80 ºC for further experiments.
by guest on October 22, 2014
http://jxb.oxfordjournals.org/D
ownloaded from

Page 4 of 12 | Scandiani et al.
25). Differences between genotype and dpi factors were assessed using a multiple comparison method (Di Rienzo et al., 2002). Data comprise four biological replicates for pathogenicity tests or two biological and four technical replicates (n=8) for the meta-bolic screen. Each biological replicate consisted of a pot with 4–5 plants.
For principal component analysis (PCA), a correlation matrix of the variables involved was estimated based on a standard-ized data matrix. The results were then plotted out in a two-dimensional diagram where circles and triangles correspond to data obtained from susceptible and partially resistant cultivars, respectively, filled and open symbols correspond to data from inoculated and uninoculated control plants, respectively, and the different time points were indicated by the corresponding number. For the hierarchical cluster analysis (HCA), squared Euclidean distances were calculated using the average from each genotype–dpi. Statistical analysis of the corresponding den-dogram was obtained using Infostat software (Balzarini et al., 2008).
Results
Pathogenicity tests of susceptible and partially resistant soybean cultivars infected with F. tucumaniae
Two commercial soybean cultivars displaying different resistance to fungal infection (NA 4613, susceptible; and DM 4670, partially resistant) were used in the experiment. Figure 1 shows a schematic representation of the experi-mental design. Progression of the host–pathogen inter-action was monitored by measuring plant height, disease incidence, root and shoot fresh weight, and root and foliar disease severity at 7, 10, 14, and 25 dpi (Figs 2–4). At 7 dpi, there were no differences between cultivars in plant height (Fig. 2A), shoot weight (Fig. 3A), and root weight (Fig. 4A), and no visible foliar symptoms were observed on either cultivar infected with F. tucumaniae (Figs 2B, 3B). However, because root infection occurred prior to foliar symptom appearance, both infected cultivars displayed slight root rot symptoms along the main tap root (Fig. 4B). By 10 dpi, foliar and root rot disease severity of the sus-ceptible cultivar was 2.3 and 2.7, respectively, based on a rating scale from 1 to 5 (Figs 3B, 4B). The partially resist-ant cultivar only showed 2.0 and 2.3 foliar and root rot severity, respectively (Figs 3B, 4B). Plant height, and shoot and root weight were similar or slightly lower on infected cultivars compared with uninfected plants (Figs 2A, 3A, 4A). Disease symptoms progressed rapidly such that differ-ences between cultivars caused by the infection were more pronounced at 14 dpi. The incidence of plants with stem and foliar disease symptoms was rated at 90% and 70% for the susceptible and partially resistant cultivars, respec-tively (Fig. 2B). In addition, susceptible plants had more severe foliar and root rot symptoms than the partially resistant cultivar (Figs 3B, 5B). By 25 dpi, infected suscep-tible plants showed severe foliar (4.1 based on the rating scale) and root (3.9) disease symptoms, whereas foliar and root rot severity of infected partially resistant plants did not differ significantly from data obtained at 14 dpi (Figs 3B, 4B).
Multivariate analysis of the pathogenic responses to F. tucumaniae in susceptible and partially resistant soybean cultivars
The disease data (incidence, foliar severity, and root and crown rot severity) were examined cumulatively as the AUDPC (Campbell and Madden, 1990) (Fig. 5A). AUDPC values ranged from 39 to 2083 for the susceptible soybean cultivar (NA 4613) and from 11 to 794 for partially resistant plants (DM 4670). The greatest difference in AUDPC values among genotypes was observed at 25 dpi. All the pathogenicity data were then evaluated by PCA, with two principal components explaining 93.9% of the overall variance (Fig. 5B). The first principal component (PC1) alone accounted for 59.9% of the total variation and was dominated by shoot weight and root and crown severity. The second principal component (PC2) contributed to 34.0% of the total variation and was domi-nated by the other four traits. Projection of the PC1 and PC2 variables onto a plane revealed five different groups (Fig. 5B). Inoculated and uninoculated control genotypes were associ-ated at 7 dpi. Regardless of the genotype, the variables of the uninoculated control plants grouped together and sepa-rately from those of the inoculated cultivars at 10 and 14 dpi. Interestingly, the distance between inoculated and uninocu-lated control cultivars was higher for the susceptible cultivar than for the partially resistant cultivar at 25 dpi.
0
10
20
30
40
7 10 14 25
dpi
Hei
gh
t (cm
)
A
aaa a
a aab c
c c c
dd
e e
a
0
20
40
60
80
100
7 10 14 25
dpi
Inci
den
ce o
f fo
liar
sym
pto
ms
(%)
B b b b
dd
c
a a
Fig. 2. (A) Variation in plant height of susceptible (horizontal lines) and partially resistant (vertical lines) soybean cultivars inoculated with F. tucumaniae (dark grey) or uninoculated (light grey). (B) Incidence of SDS-like symptoms on foliage of susceptible (horizontal lines) and partially resistant (vertical lines) soybean cultivars inoculated with F. tucumaniae. Means with the same letter were not significantly different (P<0.05). dpi, days post-inoculation.
by guest on October 22, 2014
http://jxb.oxfordjournals.org/D
ownloaded from

Soybean response to Fusarium tucumaniae infection | Page 5 of 12
Metabolic profiling of roots from susceptible and partially resistant soybean cultivars infected with F. tucumaniae
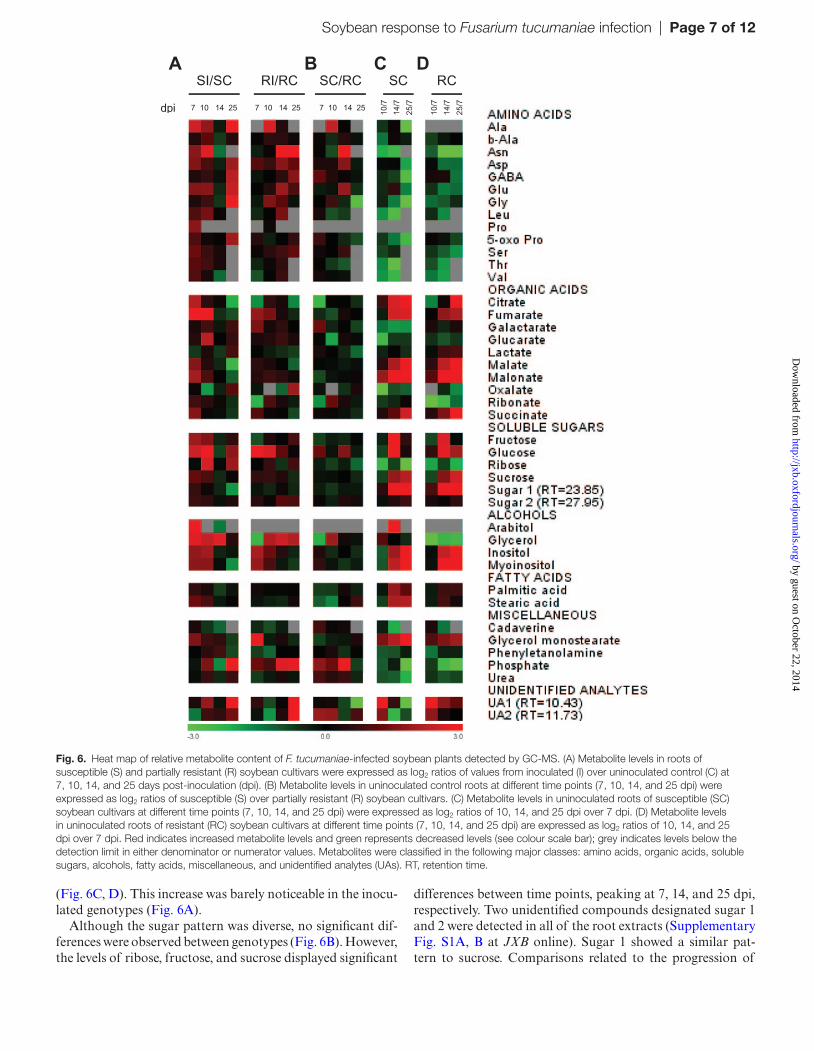
To establish whether differences in primary metabolite accu-mulation occurred during F. tucumaniae infection of soybean plants, a time-course analysis was performed by GC-MS. Root tissues were collected at four time points from infected and uninfected susceptible and partially resistant plants. Using the NIST (National Institute of Standards and Technology) MS Search 2.0 reference library, 38 metabolites were iden-tified (Supplementary Table S1 at JXB online). Changes in the metabolite composition were compared using a heatmap (Fig. 6). Metabolites were classified into the following bio-chemical groups: amino acids, organic acids, soluble sugars, alcohols, fatty acids, and a miscellaneous group. In addition, results for two unidentified sugars and two unidentified ana-lytes (UAs) were determined. Changes expressed as log2 ratios are shown in red or green when the levels of each metabo-lite was higher or lower, respectively, in the infected versus uninfected root tissues at each time point (Fig. 6A), in the
susceptible versus the partially resistant cultivar (Fig. 6B), or in the susceptible (Fig. 6C) or partially resistant (Fig. 6D) soy-bean cultivars after different experimental time points versus the first time point. These relative values indicate metabolite changes in the infected cultivars at each time point associ-ated with the genotype or produced as a consequence of plant development.
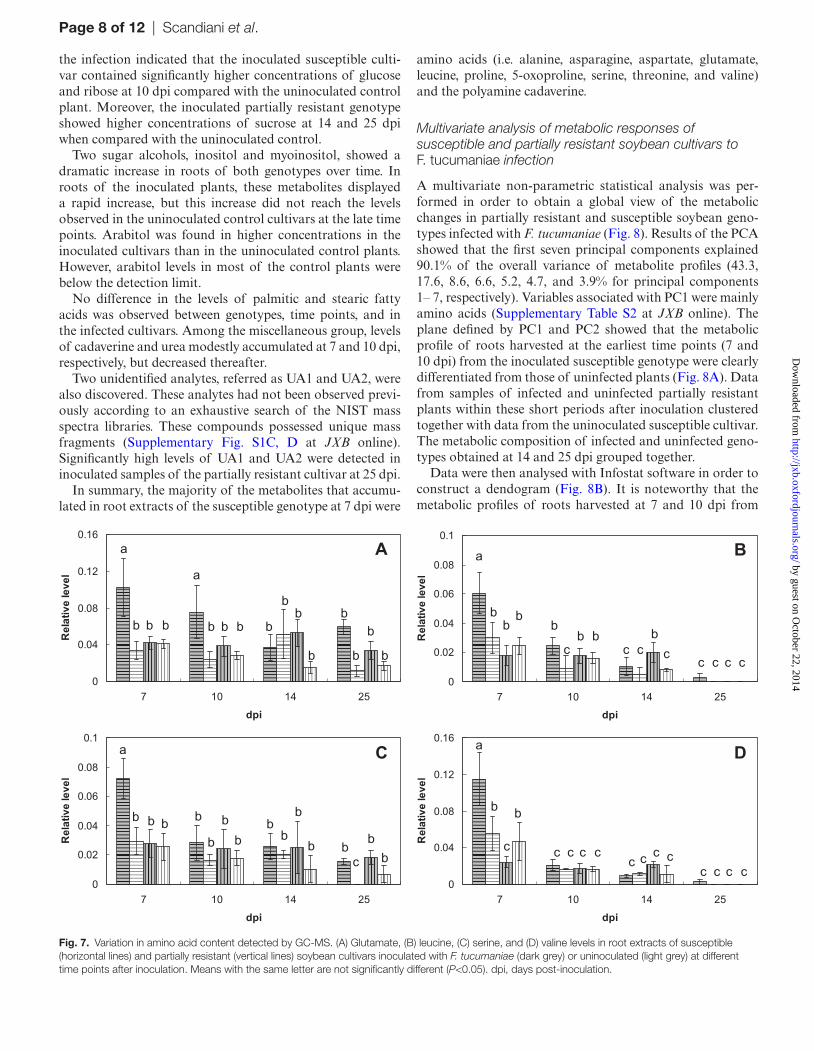
Levels of amino acids were significantly affected by geno-types and time post-inoculation. Of the 13 amino acids identi-fied, 10 displayed higher levels in the inoculated than in the uninoculated susceptible cultivar at 7 dpi (Fig. 6A). At this early time point, β-alanine, γ-aminobutyric acid (GABA), and glycine were not significantly elevated. At 10 dpi, levels of alanine, asparagine, glutamate, and leucine were statistically higher in inoculated roots of the susceptible cultivar compared with the uninoculated control (Fig. 6A). At 14 dpi, amino acid levels were relatively constant and by 25 dpi most of the amino acids were below the detection limit. This is reflected in the amino acid content of both cultivars that showed a trend towards lower levels in roots from older plants (Fig. 6C, D). Comparisons between genotypes at equivalent time points indicated that amino acid levels were only slightly affected by
0
1
2
3
4
5
7 10 14 25
dpi
Sev
erity
of f
olia
r sy
mp
tom
s
0
0.2
0.4
0.6
0.8
1
1.2
7 10 14 25
dpi
Sh
oo
t wei
gh
t (g
)
a a a aaa aa
bb b b b
c
d
eA
b bb
c
c
dB
a a
Fig. 3. (A) Variation in fresh aerial plant weight of susceptible (horizontal lines) and partially resistant (vertical lines) soybean cultivars inoculated with F. tucumaniae (dark grey) or uninoculated (light grey). (B) Effect of F. tucumaniae on foliar disease severity of susceptible (horizontal lines) and partially resistant (vertical lines) soybean cultivars. Leaves were rated for foliar disease severity using a 1–5 scale where 1=no symptoms (0% foliage affected), 2=slight symptom development with mottling and mosaic on leaves (1–20% foliage affected), 3=moderate symptom development with interveinal chlorosis and necrosis on foliage (21–50% foliage affected), 4=heavy symptom development with interveinal chlorosis and necrosis (51–80% foliage affected), and 5=severe interveinal chlorosis and necrosis (81–100% foliage affected). Means with the same letter were not significantly different (P<0.05). dpi, days post-inoculation.
0
1
2
3
4
5
7 10 14 25
dpi
Ro
ot a
nd
cro
wn
ro
t sev
eriti
es
0
0.1
0.2
0.3
0.4
0.5
0.6
0.7
7 10 14 25
dpi
Ro
ot w
eig
ht (
g)
B
aa
b
aa a
d
c
A
a a a a a a a
b b b b
c
a
c
d
e
Fig. 4. (A) Variation in fresh root weight of susceptible (horizontal lines) and partially resistant (vertical lines) soybean cultivars inoculated with F. tucumaniae (dark grey) or uninoculated (light grey). (B) Effect of F. tucumaniae on root and crown rot severity of susceptible (horizontal lines) and partially resistant (vertical lines) soybean cultivars. Roots were rated for rot using a 1–5 scale where 1=healthy roots and tap root, 2= <25% of lateral roots and tap root with necrosis, 3=25–50% of lateral roots and tap root with visible necrosis, 4=51–90% of lateral roots and tap roots with necrosis, and 5= >90% of the root system with necrosis, plants dead. Means with the same letter were not significantly different (P<0.05). dpi, days post-inoculation.
by guest on October 22, 2014
http://jxb.oxfordjournals.org/D
ownloaded from

Page 6 of 12 | Scandiani et al.
genotype, except for the absence of alanine and proline in the partially resistant cultivar (Fig. 6B). The levels of some amino acids affected by the infection are shown in Fig. 7.
With respect to organic acids, malonate, malate, citrate, and succinate showed a co-ordinated increase in roots of the partially resistant and susceptible genotypes over time
R C -25
R C -14
R C -10
R C -7
R I-25
R I-14
R I-10
R I-7
S C -25
S C -14
S C -10
S C -7
S I-25
S I-14
S I-10
S I-7
-3
-2
-1
0
1
2
3
-4 -3 -2 -1 0 1 2 3 4
PC 1 (59.89 % )
PC2(34.02
%)
B
PC1 PC2 2.129.21thgieH
Incidence 16.1 19.1 Shoot weight 19.3 11.5 Shoot severity 15.3 20.5 Root weight 16.5 18.4 Root and crown severities 20.0 9.2
0
500
1000
1500
2000
2500
7 10 14 25
dpi
AU
DP
C
A
Fig. 5. (A) Calculated cumulative area under the disease progress curve (AUDPC) of incidence and foliar and root severity. (B) Principal component analysis of the entire pathogenicity data set of inoculated and uninoculated soybean plants using susceptible and partially resistant genotypes at different time points. The first (PC1) and second (PC2) principal components explain 93.91% of the variance. Circles and triangles correspond to data obtained from susceptible (S) and partially resistant (R) cultivars, respectively. Filled and open symbols correspond to data from inoculated (I) and uninoculated control (C) plants, respectively. Different time points are indicated by numbers (7, 10, 14, and 25). The table shows the percentage contribution of each evaluation to both vectors. dpi, days post-inoculation.
by guest on October 22, 2014
http://jxb.oxfordjournals.org/D
ownloaded from
Soybean response to Fusarium tucumaniae infection | Page 7 of 12
(Fig. 6C, D). This increase was barely noticeable in the inocu-lated genotypes (Fig. 6A).
Although the sugar pattern was diverse, no significant dif-ferences were observed between genotypes (Fig. 6B). However, the levels of ribose, fructose, and sucrose displayed significant
differences between time points, peaking at 7, 14, and 25 dpi, respectively. Two unidentified compounds designated sugar 1 and 2 were detected in all of the root extracts (Supplementary Fig. S1A, B at JXB online). Sugar 1 showed a similar pat-tern to sucrose. Comparisons related to the progression of
CB D A
7 10 14 25 7 10 14 25 7 10 14 25
10/7
14/7
25/7
dpi 10/7
14/7
25/7
SI/SC RI/RC SC/RC SC RC
Fig. 6. Heat map of relative metabolite content of F. tucumaniae-infected soybean plants detected by GC-MS. (A) Metabolite levels in roots of susceptible (S) and partially resistant (R) soybean cultivars were expressed as log2 ratios of values from inoculated (I) over uninoculated control (C) at 7, 10, 14, and 25 days post-inoculation (dpi). (B) Metabolite levels in uninoculated control roots at different time points (7, 10, 14, and 25 dpi) were expressed as log2 ratios of susceptible (S) over partially resistant (R) soybean cultivars. (C) Metabolite levels in uninoculated roots of susceptible (SC) soybean cultivars at different time points (7, 10, 14, and 25 dpi) were expressed as log2 ratios of 10, 14, and 25 dpi over 7 dpi. (D) Metabolite levels in uninoculated roots of resistant (RC) soybean cultivars at different time points (7, 10, 14, and 25 dpi) are expressed as log2 ratios of 10, 14, and 25 dpi over 7 dpi. Red indicates increased metabolite levels and green represents decreased levels (see colour scale bar); grey indicates levels below the detection limit in either denominator or numerator values. Metabolites were classified in the following major classes: amino acids, organic acids, soluble sugars, alcohols, fatty acids, miscellaneous, and unidentified analytes (UAs). RT, retention time.
by guest on October 22, 2014
http://jxb.oxfordjournals.org/D
ownloaded from
Page 8 of 12 | Scandiani et al.
the infection indicated that the inoculated susceptible culti-var contained significantly higher concentrations of glucose and ribose at 10 dpi compared with the uninoculated control plant. Moreover, the inoculated partially resistant genotype showed higher concentrations of sucrose at 14 and 25 dpi when compared with the uninoculated control.
Two sugar alcohols, inositol and myoinositol, showed a dramatic increase in roots of both genotypes over time. In roots of the inoculated plants, these metabolites displayed a rapid increase, but this increase did not reach the levels observed in the uninoculated control cultivars at the late time points. Arabitol was found in higher concentrations in the inoculated cultivars than in the uninoculated control plants. However, arabitol levels in most of the control plants were below the detection limit.
No difference in the levels of palmitic and stearic fatty acids was observed between genotypes, time points, and in the infected cultivars. Among the miscellaneous group, levels of cadaverine and urea modestly accumulated at 7 and 10 dpi, respectively, but decreased thereafter.
Two unidentified analytes, referred as UA1 and UA2, were also discovered. These analytes had not been observed previ-ously according to an exhaustive search of the NIST mass spectra libraries. These compounds possessed unique mass fragments (Supplementary Fig. S1C, D at JXB online). Significantly high levels of UA1 and UA2 were detected in inoculated samples of the partially resistant cultivar at 25 dpi.
In summary, the majority of the metabolites that accumu-lated in root extracts of the susceptible genotype at 7 dpi were
amino acids (i.e. alanine, asparagine, aspartate, glutamate, leucine, proline, 5-oxoproline, serine, threonine, and valine) and the polyamine cadaverine.
Multivariate analysis of metabolic responses of susceptible and partially resistant soybean cultivars to F. tucumaniae infection
A multivariate non-parametric statistical analysis was per-formed in order to obtain a global view of the metabolic changes in partially resistant and susceptible soybean geno-types infected with F. tucumaniae (Fig. 8). Results of the PCA showed that the first seven principal components explained 90.1% of the overall variance of metabolite profiles (43.3, 17.6, 8.6, 6.6, 5.2, 4.7, and 3.9% for principal components 1– 7, respectively). Variables associated with PC1 were mainly amino acids (Supplementary Table S2 at JXB online). The plane defined by PC1 and PC2 showed that the metabolic profile of roots harvested at the earliest time points (7 and 10 dpi) from the inoculated susceptible genotype were clearly differentiated from those of uninfected plants (Fig. 8A). Data from samples of infected and uninfected partially resistant plants within these short periods after inoculation clustered together with data from the uninoculated susceptible cultivar. The metabolic composition of infected and uninfected geno-types obtained at 14 and 25 dpi grouped together.
Data were then analysed with Infostat software in order to construct a dendogram (Fig. 8B). It is noteworthy that the metabolic profiles of roots harvested at 7 and 10 dpi from
0
0.02
0.04
0.06
0.08
0.1
7 10 14 25
dpi
Rel
ativ
e le
vel
Ba
bb
c
bb
b bbc c
c c c c c
0
0.02
0.04
0.06
0.08
0.1
7 10 14 25
dpi
Rel
ativ
e le
vel
c b
Ca
b bb b b
b bb
b
b
b bb
0
0.04
0.08
0.12
0.16
7 10 14 25
dpi
Rel
ativ
e le
vel
Aa
b
a
b b b b b b
bb
b
b
b
b
b
0
0.04
0.08
0.12
0.16
7 10 14 25
dpi
Rel
ativ
e le
vel
Da
b b
c c c c c c c cc
c c c c
Fig. 7. Variation in amino acid content detected by GC-MS. (A) Glutamate, (B) leucine, (C) serine, and (D) valine levels in root extracts of susceptible (horizontal lines) and partially resistant (vertical lines) soybean cultivars inoculated with F. tucumaniae (dark grey) or uninoculated (light grey) at different time points after inoculation. Means with the same letter are not significantly different (P<0.05). dpi, days post-inoculation.
by guest on October 22, 2014
http://jxb.oxfordjournals.org/D
ownloaded from

Soybean response to Fusarium tucumaniae infection | Page 9 of 12
infected susceptible plants were highly similar. Samples obtained at 25 dpi grouped together. The metabolic compo-sition of roots from inoculated genotypes exhibited greater
similarity and those from uninoculated control tissues were also comparable. Finally, the remaining data clustered together in a heterogeneous group.
Fig. 8. (A) Principal component analysis of the metabolite profiles of inoculated and uninoculated control susceptible and partially resistant genotypes at different time points. The first (PC1) and second (PC2) principal components explain 59.0% of the variance. Circles and triangles correspond to data obtained from susceptible (S) and partially resistant (R) cultivars, respectively. Filled and open symbols correspond to data from inoculated (I) and uninoculated control (C) plants, respectively. Different time points are indicated by numbers (7, 10, 14, and 25). (B) Dendogram generated using squared Euclidean distances based on metabolic profiles of all samples studied.
by guest on October 22, 2014
http://jxb.oxfordjournals.org/D
ownloaded from

Page 10 of 12 | Scandiani et al.
Discussion
Fusarium tucumaniae colonized roots and caused root and crown rot severity at 7 dpi in the susceptible (NA 4613) and partially resistant (DM 4670) host plants. By 10 dpi, the first foliar symptoms were visible, but both cultivars were equally affected. At 14 dpi, shoot and root fresh weight were similar in the inoculated susceptible and partially resistant plants, while root infection and foliar symptoms were slightly higher in the susceptible cultivar compared with the partially resistant cultivar. By 25 dpi, the disease-associated variables (height, incidence, root and shoot weight, and root and foliar severity) were significantly different between the inoculated genotypes. These data were supported by the AUDPC and PCA results.
In order to identify early specific responses of soybean roots to F. tucumaniae infection, a metabolic profiling approach was used. Previous reports have used isoflavonoid accumula-tion (Lozovaya et al., 2004) or transcriptional changes (Iqbal et al., 2005; Radwan et al., 2011) to characterize soybean response to F. virguliforme infection. However, studies involv-ing F. tucumaniae are limited to date. Furthermore, little is known regarding the primary metabolic changes that are trig-gered in soybean roots by fungal infection.
Of the various metabolite groups, amino acid synthesis appeared to be most affected in the infected susceptible culti-var, a pattern frequently observed in host–pathogen interac-tions (Colebatch et al., 2004; Desbrosses et al., 2005; Depuydt et al., 2009; Parker et al., 2009; Hofmann et al., 2010). In fact, a dramatic shift in carbon and nitrogen metabolism has been proposed as a general plant response to pest insect infec-tions (Zhu et al., 2008). Furthermore, evidence is available that nitrogen metabolism is expressed differentially in com-patible and incompatible interactions (Tavernier et al., 2007). The present results support these previous observations. The major transport amino acids (aspartate and glutamate) accu-mulated significantly in the inoculated susceptible cultivar at very early stages after inoculation (196% and 91% for aspar-tate, at 7 and 10 dpi, respectively, and 205% and 214% for glutamate, at 7 and 10 dpi, respectively). Aspartate is one of the central regulators for carbon/nitrogen metabolism. Aspartate-derived amino acids (asparagine and threonine) were also elevated (216% and 117%) in the inoculated suscep-tible cultivar at 7 dpi. Other amino acids were also enriched in the inoculated susceptible cultivar at 7 dpi, including alanine (454%), proline (213%), serine (147%), valine (104%), leucine (101%), and 5-oxoproline (97%). Glutamate, alanine, and proline are known to accumulate in plants under biotic stress (Choi et al., 2004; Allwood et al., 2008; Lima et al., 2010), and proline, serine, threonine, and aspartate are reported to be up-regulated significantly in plants during compatible interactions (Zhu et al., 2008). It is also well known that pro-line accumulation is related to plant susceptibility to patho-gen infection (Jubault et al., 2008; Haudecoeur et al., 2009). In addition, increased levels of valine and leucine could be expected due to the abundance of small peptides (di- and tripeptides) composed of branched amino acids in plant roots (Moussaieff et al., 2013). Likewise, 5-oxoproline, a major contributor to glutamate steady-state levels, mainly accumulates in roots (Ohkama-Ohtsu et al., 2008).
Cadaverine, an essential diamine for normal root develop-ment in germinating soybean seeds (Gamarnik and Frydman, 1991), also accumulated in infected roots of the susceptible cultivar at 7 dpi. This result is consistent with a previous report that indicates that Phytophthora sojae preferentially colonizes soybean roots that contain high levels of cadaverine (Chibucos and Morris, 2006).
Nitrogen remobilization processes may also involve regula-tion of arginase activity. This enzyme hydrolyses arginine to urea and ornithine. It has been shown that arginase expres-sion is induced in response to pathogen infection (Chen et al., 2004). Accordingly, a significant increase in urea was found in fungus-infected roots of the susceptible cultivar at 10 dpi.
An increase in amino acids and nitrogen-containing com-pounds should be comparable with a decrease in intermedi-ates of the glycolytic pathway and tricarboxylic acid (TCA) cycle. However, insignificant changes (P<0.05) in citrate, fumarate, malate, and succinate were observed at early time points, possibly due to compensatory mechanisms. Likewise, low levels of TCA intermediates have been attributed to the up-regulation of the gene coding for isocitrate dehydrogenase (Hofmann et al., 2010).
The level of glucose and ribose increased significantly in roots of the susceptible cultivar at 10 dpi as compared with the uninoculated control. A higher concentration of glucose could suggest a role in host–pathogen interactions (Morkunas et al., 2005). A higher concentration of ribose was also reported in Tobacco mosaic virus (TMV)-infected tobacco plants at 1 dpi (Bazzini et al., 2011). Levels of inositol and myoinositol also showed a rapid increase in the infected cul-tivars, but this increase was not as high as observed in the uninoculated control cultivars at the late time points. It is well known that these sugar alcohols accumulate in plants under stress (Taji et al., 2006).
Finally, it is interesting to note that global analysis of the whole data set, using PCA and HCA, indicated that the meta-bolic profile of roots harvested at the earliest time points (7 and 10 dpi) from the inoculated susceptible genotype were clearly differentiated from the rest of the samples obtained from both cultivars at different time points. Furthermore, the variables associated with PC1 were mainly amino acids.
In summary, a detailed primary metabolic profile of inoculated soybean roots from two genotypes with contrast-ing resistance to F. tucumaniae infection is presented. The study showed that inoculated susceptible plants accumulated amino acids during early stages of infection, suggesting that GC-MS-based metabolomics could be a suitable approach for the rapid characterization of the cultivar response to SDS. These results deserve further validation with a large number of susceptible and partially resistant genotypes to provide more assurance that the screening method can predict culti-var response to F. tucumaniae infection in the field.
Supplementary data
Supplementary data are available at JXB online.Figure S1. GC-MS mass spectra of unidentified com-
pounds. (A) 476 Sugar 1 (RT=23.85), (B) Sugar 2 (RT=27.95),
by guest on October 22, 2014
http://jxb.oxfordjournals.org/D
ownloaded from
Soybean response to Fusarium tucumaniae infection | Page 11 of 12
(C) unidentified analyte (UA) 1 (RT=10.43), and (D) UA2 (RT=11.73). Inserts show the level of these metabolites in root extracts of susceptible (horizontal lines) and resistant (vertical lines) soybean cultivars inoculated with F. tucuma-niae (dark gray) or uninoculated (light gray) at different time points after infection. Means with the same letter were not significantly different (P<0.05).
Table S1. Metabolite profiling data set from roots of sus-ceptible and resistant soybean cultivars either uninoculated or inoculated with F. tucumaniae.
Table S2. Contribution of each metabolite to each princi-pal component.
AcknowledgementsWe wish to thank Mónica Hourcade for GC-MS technical support. This work was supported by grants from the Agencia Nacional de Promoción Científica y Tecnológica (PICT 2010-0458) and Consejo Nacional de Investigaciones Científicas y Técnicas (CONICET; PIP 0018) to CPS. GDLC and CPS are members of the Researcher Career of CONICET. The mention of firm names or trade products does not imply that they are endorsed or recommended by the US Department of Agriculture over other firms or similar products not mentioned. The USDA is an equal opportunity provider and employer.
ReferencesAchenbach L, Patrick J, Gray L. 1996. Use of RAPD markers as a diagnostic tool for the identification of Fusarium solani isolates that cause soybean sudden death syndrome. Plant Disease 80, 1228–1232.
Allwood J, Ellis D, Goodacre R. 2008. Metabolomic technologies and their application to the study of plants and plant–host interactions. Physiologia Plantarum 132, 117–135.
Aoki T, O´Donnell K, Scandiani M. 2005. Sudden death syndrome of soybean in South America is caused by four species of Fusarium: Fusarium brasiliense sp. nov., F. cuneirostrum sp. nov., F. tucumaniae and F. virguliforme. Mycoscience 46, 162–183.
Aoki T, Scandiani M, O’Donnell K. 2012. Phenotypic, molecular phylogenetic, and pathogenetic characterization of Fusarium crassistipitatum sp. nov., a novel soybean sudden death syndrome pathogen from Argentina and Brazil. Mycoscience 53, 167–186.
Balzarini M, Gonzalez L, Tablada M, Casanoves F, Di Rienzo J, Robledo C. 2008. Manual del Usuario. Córdoba, Argentina.
Barros G, Alaniz Zanon M, Chiotta M, Reynoso M, Scandiani M, Chulze S. 2014. Pathogenicity of phylogenetic species in the Fusarium graminearum complex on soybean seedlings in Argentina. European Journal of Plant Pathology 138, 215–222.
Bazzini A, Manacorda C, Tohge T, Conti G, Rodriguez M, Nunes-Nesi A, Villanueva S, Fernie A, Carrari F, Asurmendi S. 2011. Metabolic and miRNA profiling of TMV infected plants reveals biphasic temporal changes. PLoS One 6, e28466.
Campbell C, Madden L. 1990. Introduction to plant disease epidemiology. New York: John Wiley.
Chen H, McCaig B, Melotto M, He S, Howe G. 2004. Regulation of plant arginase by wounding, jasmonate, and the phytotoxin coronatine. Journal of Biological Chemistry 279, 45998–46007.
Chibucos M, Morris P. 2006. Levels of polyamines and kinetic characterization of their uptake in the soybean pathogen Phytophthora sojae. Applied Environmental Microbiology 72, 3350–3356.
Choi Y, Tapias E, Hye K, Lefeber A, Erkelens C, Verhoeven J, Brzin J, Zel J, Verpoorte R. 2004. Metabolic discrimination of Catharanthus roseus leaves infected by phytoplasma using 1H-NMR spectroscopy and multivariate data analysis. Plant Physiology 135, 2398–2410.
Colebatch G, Desbrosses G, Ott T, Krusell L, Montanari O, Kloska S, Kopka J, Udvardi M. 2004. Global changes in transcription orchestrate metabolic differentiation during symbiotic nitrogen fixation in Lotus japonicus. The Plant Journal 39, 487–512.
Depuydt S, Trenkamp S, Fernie A, Elftieh S, Renou J-P, Vuylsteke M, Holsters M, Vereecke D. 2009. An integrated genomics approach to define niche establishment by Rhodococcus fascians. Plant Physiology 149, 1366–1386.
Desbrosses G, Kopka J, Udvardi M. 2005. Lotus japonicus metabolic profiling. Development of gas chromatography–mass spectrometry resources for the study of plant–microbe interactions. Plant Physiology 137, 1302–1318.
Di Rienzo J, Guzmán A, Casanoves F. 2002. A multiple comparisons method based on the distribution of the root node distance of a binary tree. Journal of Agricultural, Biological, and Environmental Statistics 7, 1–14.
Fernie A, Aharoni A, Willmitzer L, Stitt M, Tohge T, Kopka J, Carroll A, Saito K, Fraser P, De Luca V. 2011. Recommendations for reporting metabolite data. The Plant Cell 23, 2477–2482.
Gamarnik A, Frydman R. 1991. Cadaverine, an essential diamine for the normal root development of germinating soybean (Glycine max) seeds. Plant Physiology 97, 778–785.
Gongora-Canul C, Leandro L. 2011a. Effect of soil temperature and plant age at time of inoculation on progress of root rot and foliar symptoms of soybean sudden death syndrome. Plant Disease 95, 436–440.
Gongora-Canul C, Leandro L. 2011b. Plant age affects root infection and development of foliar symptoms of soybean sudden death syndrome. Plant Disease 95, 242–247.
Gongora-Canul C, Nutter FJ, Leandro L. 2012. Temporal dynamics of root and foliar severity of soybean sudden death syndrome at different inoculum densities. European Journal of Plant Pathology 132, 71–79.
Hartman G, Huang Y, Nelson R, Noel G. 1997. Germplasm evaluation of Glycine max for resistance to Fusarium solani, the causal organism of sudden death syndrome. Plant Disease 81, 515–518.
Haudecoeur E, Planamentre S, Cirou A, Tannieres M, Shelp B, Morera S, Faure D. 2009. Proline antagonizes GABA-induced quenching of quorum-sensing in Agrobacterium tumefaciens. Proceedings of the National Academy of Sciences, USA 106, 14587–14592.
Hofmann J, El Ashry AeN, Anwar S, Erban A, Kopka J, Grundler F. 2010. Metabolic profiling reveals local and systemic responses of host plants to nematode parasitism. The Plant Journal 62, 1058–1071.
Huang Y, Hartman G. 1998. Reaction of selected soybean genotypes to isolates of Fusarium solani f. sp. glycines and their culture filtrates. Plant Disease 82, 999–1002.
Iqbal M, Yaegashi S, Ahsan R, Shopinski K, Lightfoot D. 2005. Root response to Fusarium solani f. sp. glycines: temporal accumulation of transcripts in partially resistant and susceptible soybean. Theoretical and Applied Genetics 110, 1429–1438.
Jubault M, Hamon C, Gravot A, Lariagon C, Delourme R, Bouchereau A, Manzanares-Dauleux MJ. 2008. Differential regulation of root arginine catabolism and polyamine metabolism in clubroot-susceptible and partially resistant Arabidopsis genotypes. Plant Physiology 146, 2008–2019.
Leandro L, Robertson A, Mueller D, Yang X-B. 2013. Climatic and environmental trends observed during epidemic and non-epidemic years of soybean sudden death syndrome in Iowa. Plant Health Progress doi: 10.1094/PHP-2013-0529-01-RS.
Leandro L, Tatlovic N, Luckew A. 2012. Soybean sudden death syndrome—advances in knowledge and disease management. CAB Reviews 7, 1–14.
Lenzi L, Masiero B, Conde B, Fuentes F, Distéfano S, Salines L. 2013. Comportamiento de cultivares de soja frente al síndrome de la muerte súbita. Campañas 2006/07 a 2012/13. Marcos Juárez.
Lima M, Felgueiras M, Graca G, Rodrigues J, Barros A, Gil A, Dias A. 2010. NMR metabolomics of esca disease-affected Vitis vinifera cv. Alvarinho leaves. Journal of Experimental Botany 61, 4033–4042.
Lisec J, Schauer N, Kopka J, Willmitzer L, Fernie A. 2006. Gas chromatography mass spectrometry-based metabolite profiling in plants. Nature Protocols 1, 387–396.
Lozovaya V, Lygin A, Zernova O, Li S, Hartman G, Widholm J. 2004. Isoflavonoid accumulation in soybean hairy roots upon treatment with Fusarium solani. Plant Physiology and Biochemistry 42, 671–679.
by guest on October 22, 2014
http://jxb.oxfordjournals.org/D
ownloaded from
Page 12 of 12 | Scandiani et al.
Morkunas I, Marczak Q, Stachowiak J, Stobiecki M. 2005. Sucrose-stimulated accumulation of isoflavonoids as a defence response of lupine to Fusarium oxysporum. Plant Physiology and Biochemistry 43, 363–373.
Moussaieff A, Rogachev I, Brodsky L, Malitsky S, Toal T, Belcher H, Yativ M, Brady S, Benfey P, Aharoni A. 2013. High-resolution metabolic mapping of cell types in plant roots. Proceedings of the National Academy of Sciences, USA 110, E1232–E1241.
Navi S, Yang X. 2008. Foliar symptom expression in association with early infection and xylem colonization by Fusarium virguliforme (formerly F. solani f. sp. glycines), the causal agent of soybean sudden death syndrome. Plant Health Progress doi: 10.1094/PHP-2008-0222-01-RS.
Njiti V, Shenaut M, Suttner R, Schmidt M, Gibson P. 1996. Soybean response to sudden death syndrome: inheritance influenced by cyst nematode resistance in Pyramid×Douglas progenies. Crop Science 36, 1165–1170.
O’Donnell K, Sink S, Scandiani M, et al. 2010. Soybean sudden death syndrome species diversity within North and South America revealed by multilocus genotyping. Phytopathology 100, 58–71.
Ohkama-Ohtsu N, Oikawa A, Zhao P, Xiang C, Saito K, Oliver D. 2008. A gamma-glutamyl transpeptidase-independent pathway of glutathione catabolism to glutamate via 5-oxoproline in Arabidopsis. Plant Physiology 143, 1603–1613.
Parker D, Beckmann M, Zubair H, Enot D, Caracuel-Rios Z, Overy D, Snowdon S, Talbot N, Draper J. 2009. Metabolomic analysis reveals a common pattern of metabolic re-programming during invasion of three host plant species by Magnaporthe grisea. The Plant Journal 59, 723–773.
Radwan O, Liu Y, Clough S. 2011. Transcriptional analysis of soybean root response to Fusarium virguliforme, the causal agent of sudden death syndrome. Molecular Plant-Microbe Interactions 24, 958–972.
Roy K. 1997. Fusarium solani on soybean roots: nomenclature of the causal agent of sudden death syndrome and identity and relevance of F. solani form B. Plant Disease 81, 259–266.
Rupe J, Becton C, Williams K, Yount P. 1996. Isolation, identification, and evaluation of fungi for the control of sudden death syndrome of soybean. Canadian Journal of Plant Pathology 18, 1–6.
Rupe J, Correll J, Guerber J, Becton C, Gbur E, Cummings M, Yount P. 2001. Differentiation of the sudden death syndrome pathogen of soybean, Fusarium solani f. sp. glycines, from other isolates of F. solani based on cultural morphology, pathogenicity, and mitochondrial DNA restriction fragment length polymorphisms. Canadian Journal of Botany 79, 829–835.
Rupe J, Hartman G. 1999. Sudden death syndrome. Minnesota, MN: APS Press.
Saeed A, Sharov V, White J, et al. 2003. TM4: a free, open-source system for microarray data management and analysis. BioTechniques 34, 374–378.
Scandiani M, Ruberti D, Giorda L, Pioli R, Luque A, Bottai H, Ivancovich J, Aoki T, O’Donnell K. 2011. Comparison of inoculation methods for characterizing relative aggressiveness of two soybean sudden-death syndrome pathogens: Fusarium virguliforme and F. tucumaniae. Tropical Plant Pathology 36, 133–140.
Taji T, Takahashi S, Shinozaki K. 2006. Inositols and their metabolites in abiotic and biotic stress responses. Subcellular Biochemistry 39, 239–264.
Tavernier V, Cadiou S, Pageau K, Laugé R, Reisdorf-Cren M, Langin T, Masclaux-Daubresse C. 2007. The plant nitrogen mobilization promoted by Colletotrichum lindemuthianum in Phaseolus leaves depends on fungus pathogenicity. Journal of Experimental Botany 58, 3351–3360.
Zhu L, Liu X, Liu X, Jeannotte R, Reese J, Harris M, Stuart J, Chen M. 2008. Hessian fly (Mayetiola destructor) attack causes a dramatic shift in carbon and nitrogen metabolism in wheat. Molecular Plant-Microbe Interactions 21, 70–78.
by guest on October 22, 2014
http://jxb.oxfordjournals.org/D
ownloaded from
Related Documents