Martínez et al. BMC Systems Biology (2018) 12:102 https://doi.org/10.1186/s12918-018-0632-4 RESEARCH ARTICLE Open Access Metabolic modeling and response surface analysis of an Escherichia coli strain engineered for shikimic acid production Juan A. Martínez 1 , Alberto Rodriguez 1 , Fabian Moreno 1 , Noemí Flores 1 , Alvaro R. Lara 2 , Octavio T. Ramírez 3 , Guillermo Gosset 1 and Francisco Bolivar 1* Abstract Background: Classic metabolic engineering strategies often induce significant flux imbalances to microbial metabolism, causing undesirable outcomes such as suboptimal conversion of substrates to products. Several mathematical frameworks have been developed to understand the physiological and metabolic state of production strains and to identify genetic modification targets for improved bioproduct formation. In this work, a modeling approach was applied to describe the physiological behavior and the metabolic fluxes of a shikimic acid overproducing Escherichia coli strain lacking the major glucose transport system, grown on complex media. Results: The obtained flux distributions indicate the presence of high fluxes through the pentose phosphate and Entner-Doudoroff pathways, which could limit the availability of erythrose-4-phosphate for shikimic acid production even with high flux redirection through the pentose phosphate pathway. In addition, highly active glyoxylate shunt fluxes and a pyruvate/acetate cycle are indicators of overflow glycolytic metabolism in the tested conditions. The analysis of the combined physiological and flux response surfaces, enabled zone allocation for different physiological outputs within variant substrate conditions. This information was then used for an improved fed-batch process designed to preserve the metabolic conditions that were found to enhance shikimic acid productivity. This resulted in a 40% increase in the shikimic acid titer (60 g/L) and 70% increase in volumetric productivity (2.45 gSA/L*h), while preserving yields, compared to the batch process. Conclusions: The combination of dynamic metabolic modeling and experimental parameter response surfaces was a successful approach to understand and predict the behavior of a shikimic acid producing strain under variable substrate concentrations. Response surfaces were useful for allocating different physiological behavior zones with different preferential product outcomes. Both model sets provided information that could be applied to enhance shikimic acid production on an engineered shikimic acid overproducing Escherichia coli strain. Keywords: Metabolic modeling, Central carbon metabolism, Response surface analysis, Cybernetic modeling, Shikimic acid Background The aromatic amino acid pathway (AAAP) branches from the central carbon metabolism (CCM) by the aldolic condensation of erythrose-4-phosphate (E4P) and phosphoenolpyruvate (PEP), being present in bacteria *Correspondence: [email protected] Francisco Bolivar is a member from El Colegio Nacional, México 1 Departamento de Ingeniería Celular y Biocatálisis, Instituto de Biotecnología, Universidad Nacional Autónoma de México (UNAM), Avenida Universidad 2001, Colonia Chamilpa, 62210 Cuernavaca, Morelos, México Full list of author information is available at the end of the article and plants. The AAAP is responsible for the produc- tion of aromatic amino acids and aromatic vitamins. As a consequence, it is an essential and highly reg- ulated pathway [1, 2]. AAAP intermediates and final compounds play important roles in the pharmaceuti- cal and food industries, either as raw materials, addi- tives or final products [3–9]. Among them, shikimic acid (SA) can be used as an enantiomeric precursor to produce valuable biological molecules such as antipyret- ics, antioxidants, anticoagulants, antithrombotics, anti- inflammatories, analgesic agents, antibacterial, hormonal © The Author(s). 2018 Open Access This article is distributed under the terms of the Creative Commons Attribution 4.0 International License (http://creativecommons.org/licenses/by/4.0/), which permits unrestricted use, distribution, and reproduction in any medium, provided you give appropriate credit to the original author(s) and the source, provide a link to the Creative Commons license, and indicate if changes were made. The Creative Commons Public Domain Dedication waiver (http://creativecommons.org/publicdomain/zero/1.0/) applies to the data made available in this article, unless otherwise stated.

Welcome message from author
This document is posted to help you gain knowledge. Please leave a comment to let me know what you think about it! Share it to your friends and learn new things together.
Transcript
Martínez et al. BMC Systems Biology (2018) 12:102 https://doi.org/10.1186/s12918-018-0632-4
RESEARCH ARTICLE Open Access
Metabolic modeling and response surfaceanalysis of an Escherichia coli strainengineered for shikimic acid productionJuan A. Martínez1 , Alberto Rodriguez1, Fabian Moreno1, Noemí Flores1, Alvaro R. Lara2,Octavio T. Ramírez3, Guillermo Gosset1 and Francisco Bolivar1*
Abstract
Background: Classic metabolic engineering strategies often induce significant flux imbalances to microbialmetabolism, causing undesirable outcomes such as suboptimal conversion of substrates to products. Severalmathematical frameworks have been developed to understand the physiological and metabolic state of productionstrains and to identify genetic modification targets for improved bioproduct formation. In this work, a modelingapproach was applied to describe the physiological behavior and the metabolic fluxes of a shikimic acidoverproducing Escherichia coli strain lacking the major glucose transport system, grown on complex media.
Results: The obtained flux distributions indicate the presence of high fluxes through the pentose phosphate andEntner-Doudoroff pathways, which could limit the availability of erythrose-4-phosphate for shikimic acid productioneven with high flux redirection through the pentose phosphate pathway. In addition, highly active glyoxylate shuntfluxes and a pyruvate/acetate cycle are indicators of overflow glycolytic metabolism in the tested conditions. Theanalysis of the combined physiological and flux response surfaces, enabled zone allocation for different physiologicaloutputs within variant substrate conditions. This information was then used for an improved fed-batch processdesigned to preserve the metabolic conditions that were found to enhance shikimic acid productivity. This resulted ina 40% increase in the shikimic acid titer (60 g/L) and 70% increase in volumetric productivity (2.45 gSA/L*h), whilepreserving yields, compared to the batch process.
Conclusions: The combination of dynamic metabolic modeling and experimental parameter response surfaces wasa successful approach to understand and predict the behavior of a shikimic acid producing strain under variablesubstrate concentrations. Response surfaces were useful for allocating different physiological behavior zones withdifferent preferential product outcomes. Both model sets provided information that could be applied to enhanceshikimic acid production on an engineered shikimic acid overproducing Escherichia coli strain.
Keywords: Metabolic modeling, Central carbon metabolism, Response surface analysis, Cybernetic modeling,Shikimic acid
BackgroundThe aromatic amino acid pathway (AAAP) branchesfrom the central carbon metabolism (CCM) by thealdolic condensation of erythrose-4-phosphate (E4P) andphosphoenolpyruvate (PEP), being present in bacteria
*Correspondence: [email protected] Bolivar is a member from El Colegio Nacional, México1Departamento de Ingeniería Celular y Biocatálisis, Instituto de Biotecnología,Universidad Nacional Autónoma de México (UNAM), Avenida Universidad2001, Colonia Chamilpa, 62210 Cuernavaca, Morelos, MéxicoFull list of author information is available at the end of the article
and plants. The AAAP is responsible for the produc-tion of aromatic amino acids and aromatic vitamins.As a consequence, it is an essential and highly reg-ulated pathway [1, 2]. AAAP intermediates and finalcompounds play important roles in the pharmaceuti-cal and food industries, either as raw materials, addi-tives or final products [3–9]. Among them, shikimicacid (SA) can be used as an enantiomeric precursor toproduce valuable biological molecules such as antipyret-ics, antioxidants, anticoagulants, antithrombotics, anti-inflammatories, analgesic agents, antibacterial, hormonal
© The Author(s). 2018 Open Access This article is distributed under the terms of the Creative Commons Attribution 4.0International License (http://creativecommons.org/licenses/by/4.0/), which permits unrestricted use, distribution, andreproduction in any medium, provided you give appropriate credit to the original author(s) and the source, provide a link to theCreative Commons license, and indicate if changes were made. The Creative Commons Public Domain Dedication waiver(http://creativecommons.org/publicdomain/zero/1.0/) applies to the data made available in this article, unless otherwise stated.
Martínez et al. BMC Systems Biology (2018) 12:102 Page 2 of 26
or antiviral compounds [8, 9]. SA was at first pro-duced from the seed of the Chinese star anise plantIllicium verum, employing classic extraction processeswith yields of only 30 mg/Kg approximately [10–12].For this reason, over the past years, many studies concern-ing SA production have focused on recovery technologies,chemical synthesis methods and biotechnological produc-tion using different microorganisms [9, 13, 14]. The latterresulted in many genetically engineered strains that pro-duce SA at laboratory and industrial scales with relativelyhigh yields (between 40–50% mol/mol), but still far fromthe theoretical maximum (86% mol/mol) [2, 9, 13–15].Although classic metabolic engineering (ME) allows
flux redirection in a biochemical network into valuablecompounds by genetic manipulation, it often induces sig-nificant flux imbalances to the CCM that may cause unde-sirable outcomes. These imbalances can disrupt precursoravailability and energy balances, causing the accumula-tion of pathway intermediates and unwanted byproducts,reducing strain fitness and product yields [16]. Theseimbalances derive from alterations to the complex con-nectivity of biological information networks (genome,transcriptome, proteome, and metabolome) [17, 18].Therefore, there is an increasing interest into a moreglobal and detailed understanding of the metabolic andregulatory network changes imposed by different geneticmodifications or process conditions in various productionsystems. In recent years, mathematical models, advanceson informatics and the availability of big and more pre-cise omics data sets have proved useful to resolve andclarify the complex network interactions and systemcharacteristics [19–22].To mathematically model metabolism, a metabolic net-
work must be assembled with sufficient detail and curatedfrom genomic data to be represented as a matrix ofequations, including all available stoichiometric, ther-modynamic and kinetic data. Given the complexity ofmicroorganisms, the parameter sets required to describethe networks for genome-scale models are quite largeand require informatically-intensive modeling approaches[23]. Most of the constructed metabolic models use massbalances and assume pseudo-steady state conditions tosolve the highly undetermined linear equation systemsand render a convex space, which contains all the pos-sible solutions for the system. This solution space thenmust be narrowed with experimental data and some otherassumptions to acquire a meaningful and useful solution[18, 19, 21, 24]. Different approaches have been devel-oped to find the most meaningful solution, such asmechanism-based, interaction-based and the constraint-based methodologies. The latter, are the most commonlyused for their capability to render useful flux distributions,even with relatively small amounts of information [20, 23].Nevertheless, a challenging ground for models still exists
for high-throughput data acquisition and interpretationwhen non-defined cultivation media and dynamic pro-cesses are used. The challenges and achievements withinthis field can be consulted elsewhere [20, 21, 25–31].Regarding SA production with E. coli, few modeling
studies could be found in the literature. Chen et al. (2011)[32] used a constraint-based analysis with flux balanceanalysis (FBA), assumed no growth and used SA as theobjective function, to design modifications for the over-production of AAAP intermediates. The model identifiedaroF, tktA, ppsA and glf genes as candidates for over-expression. As well, suggested the inactivation of ldhAand ackA genes to avoid carbon waste through lactate(LA) and acetate (AC) fluxes. These genes and nodesare in accordance to other reports on AAAP interme-diate production [2, 5, 7, 14]. Nevertheless, this modelalso identified the non-evident zwf gene as critical forredirection of the carbon flux into E4P on the AAAP.Its overexpression resulted in an increase of 47% molarconversion of glucose (GLC) to aromatic intermediates[32, 33]. Similarly, Ahn et al. (2008) [34] constructed amodel for maximizing SA production from GLC high-lighting the importance of CCM genes like tktA andzwf, although growth or maintenance requirements werenot considered. Rizk and Liao (2009) [35] used ensem-ble modeling, a mechanism-based approach, to identifytktA as the first-rate controlling step, founding that theppsA gene can only augment production of aromaticintermediates when tktA is simultaneously overexpressed.There still are several challenges that must be addressedregarding model construction and implementation. Forexample, models are often limited by specific assump-tions, defined conditions and are performed primarilyunder stationary constraints. Importantly, the assumptionof stationary state provides only limited information onthe dynamic properties of the system or network regula-tion. These limitations can result in some contradictionsto real cell behavior under changing conditions, given bythe existence of complex regulatory mechanisms modify-ing metabolic fluxes. New models and tools accountingfor more complex solutions and on dynamic conditions,would result in a better understanding of cell behav-ior and produce new insights for strain and bioprocessdesign. On the other hand, for E. coli strains constructedfor SA production, most of the work done has beenfocused on testing and improving expression platforms,genetic backgrounds, including the use of strains lackingthemain phosphoglucotransferase transport (PTS), whichlack catabolite repression and can redirect part of the car-bon flux in to the production of aromatic compounds[2, 5, 7, 9, 33, 36], and culture strategies using traditionalengineering approaches. Only few studies have focusedon metabolic modeling to better understand and engineerSA overproduction at a more global level. Even less has
Martínez et al. BMC Systems Biology (2018) 12:102 Page 3 of 26
been done on modeling production strains under com-plex media or on dynamic conditions, which are criticalconsiderations for further process improvement. Here, adynamic modeling approach of the physiological behaviorand the dynamic metabolic flux distributions for an engi-neered E. coli strain is presented. The results were usefulfor strain behavior characterization and SA productivityenhancement on variable complex media compositions.
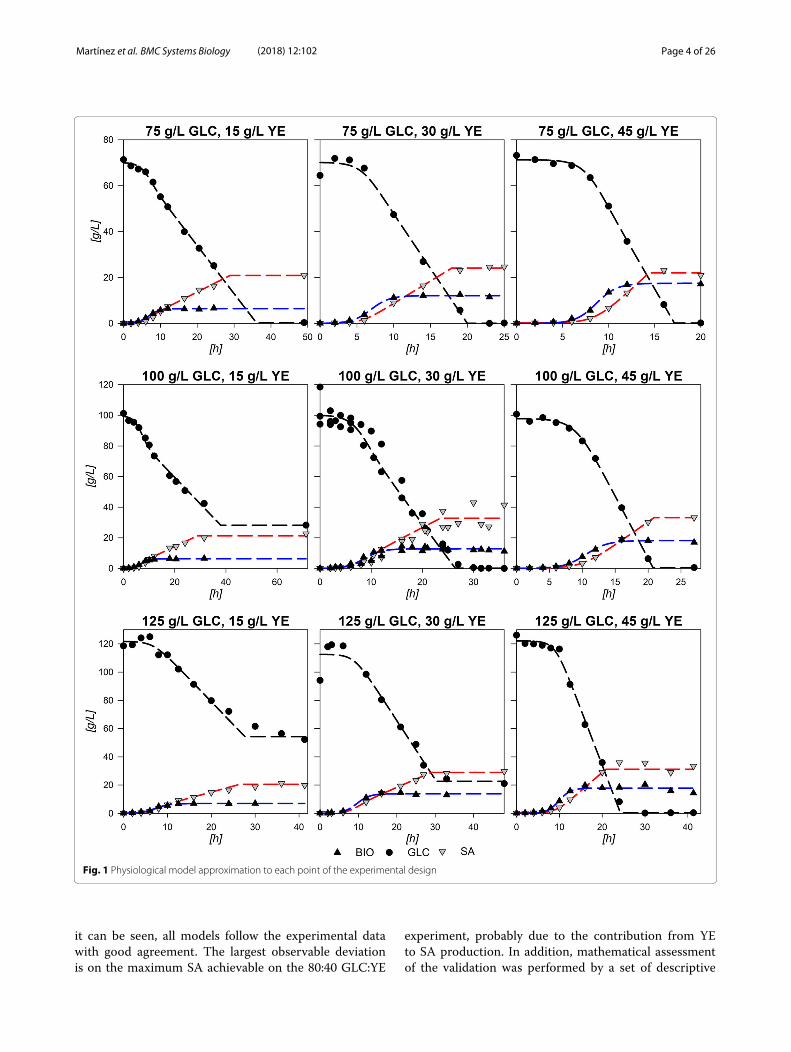
ResultsPhysiological characterization, parametrization andmodeling of strain AR36 on variant substrate conditionsFigure 1 depicts the results from the 9 experimentaldesign fermentations with the central point done by trip-licate along with constructed physiological models (see“Methods” section). Central experimental condition(100:30 GLC:YE g/L) average parameters and deviationsare summarized in Table 1. The standard deviations showrelatively low values in accordance to experiments usingyeast extract (YE) from three different batches. The largeststandard deviations corresponded to final SA produced([SA]f ), final consumed GLC (�[GLC]) and the expo-nential consumption rate
(qexps
). Nevertheless, the aver-
aged model depicts a fair agreement with data as canbe observed in Fig. 1. The observed behavior and statis-tical data proved that the logistic models were suitableto describe and parametrize the consumption of GLCand production of SA in strain AR36, within the bound-aries of the experimental design. Statistical validation andaccuracy of the models are presented in Additional file 1.With the parameters obtained, three-dimensional
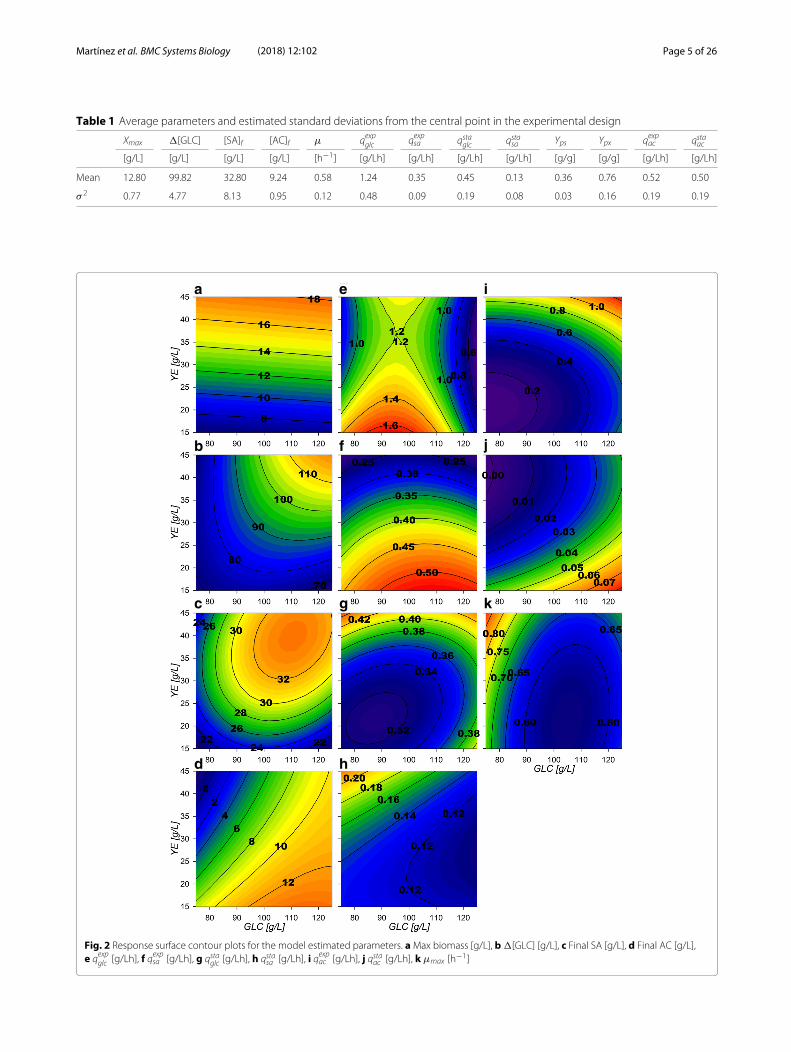
response surfaces were constructed (Fig. 2 and “Methods”section). Maximum biomass (Xmax) response surface(Fig. 2a) shows only small increases with higher GLCconcentrations at similar amounts of YE. �[GLC]response surface (Fig. 2b) depicts that GLC consumptionincreases proportionally with higher starting GLC and YEconcentrations. This is especially observed under highGLC concentrations, where at least ≈40 g/L of YE arerequired for complete exhaustion of more than ≈110 g/Lof GLC. Regarding final SA concentration ([SA]f ), surfacemorphology is similar to the consumed GLC surface, butexhibits a maximum critical point at 110:40 g/L GLC:YEinitial concentrations (Fig. 2c). For kinetic parameters,GLC consumption rate at exponential phase
(qexpglc
)shows
a saddle type behavior on its response surface (Fig. 2e).This morphology is characterized by the existence of amaximum critical point for GLC and a simultaneous min-imum for YE, found at 96 g/L and 37 g/L concentrations,respectively. These results suggest that cellular responsesto GLC concentrations lower than ≈75 g/L (increasingconsumption) or higher than ≈100 g/L (decreasingconsumption), may be occurring in strain AR36. Surfaces
also showed that qexpglc highest values are found at lowerconcentrations of YE and GLC and the lowest rates underhigh concentrations of initial GLC. For the SA exponentialproduction rate
(qexpsa
)surface, a tendency to increase
towards lower initial [YE] was found, with an up to 50%decrease when more than 40 g/L of YE are utilized (Fig. 2eand f). The growth rate (μmax) displays a minimum crit-ical point on 105:21 g/L GLC:YE initial concentrations(Fig. 2k) with the highest values found towards lower[GLC] in combination with higher [YE]. Finally, the ACproduction rate
(qexpac
)shows a tendency to present higher
values as [YE] and [GLC] increase (Fig. 2i) and could beresponsible for reducing biomass and SA production ratesas the AC highest rates were found above ≈40 g/L [YE]and ≈110 g/L GLC. In summary, all the specific rates atexponential phase suggest an allocation of rate maximiza-tion zones or quadrants on the experimental design asfollows: at high [GLC] and high [YE] concentrations ACproduction is predominant, at low [GLC] and high [YE]concentrations biomass production is predominant, athigh [GLC] but low [YE] concentrations SA production ispredominant and finally at lower concentrations of bothsubstrates a more balanced growth and production of allfinal products is to be found (Fig. 2).At the stationary phase, a reduced metabolic activity
on all consumption and production rates was observed.qstaglc surface (Fig. 2g) tends to have larger values on higherinitial concentration of substrate sources (GLC and YE).The SA stationary production rate
(qstasa
)surface (Fig. 2h)
reveals a tendency to increase towards low GLC with highYE initial concentrations, showing an opposite behaviorthan qstaac (Fig. 2j). Their surface analysis helps to allocatepredominant stationary phase output zones as follows.A SA production zone found above an imaginary diag-onal line cutting the experimental design area from lowinitial concentrations of both substrate sources to high ini-tial concentrations and a predominantly AC productionzone found below this imaginary diagonal. It should bealso noted that zone preferences on stationary phase arefound on opposite sides respective to the allocated oneson the exponential phase. More so, SA specific produc-tion rates observed at higher initial [YE] and lower initial[GLC] conditions seem to have smaller variations betweenphases and AC specific production rates seem to vary lesson low initial [YE] high initial [GLC] conditions.The descriptive viability of the constructed response
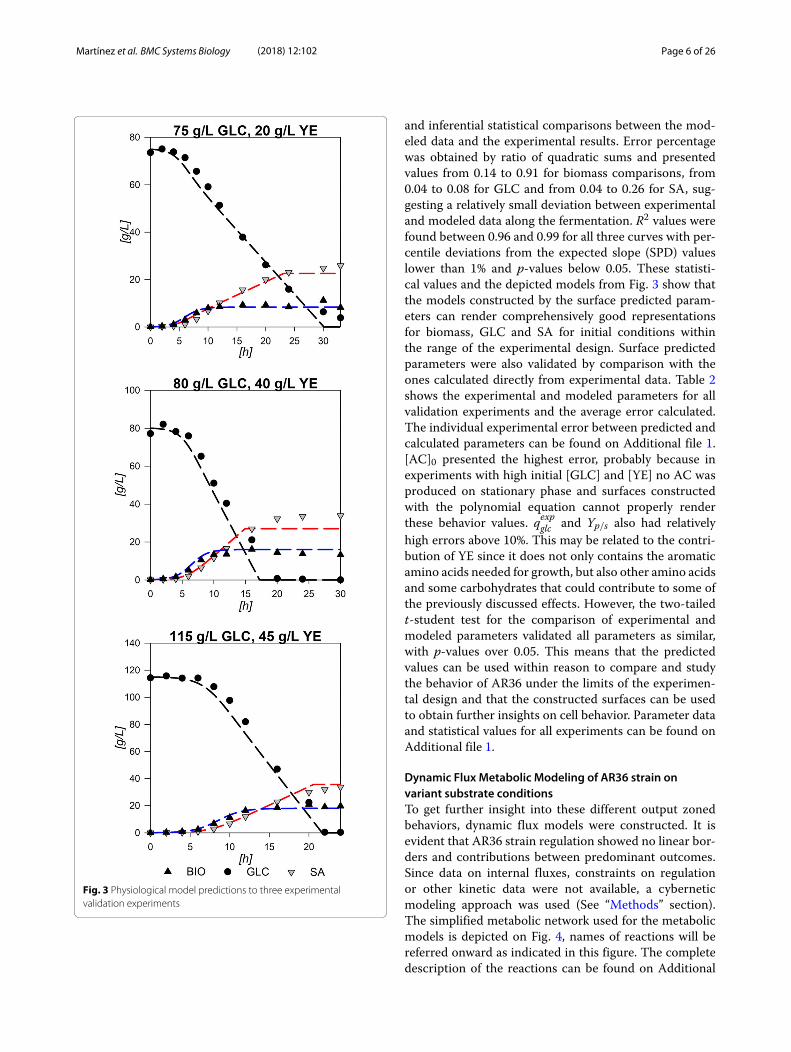
surfaces was validated by performing fermentationsusing three conditions not included in the experimentaldesign (75:20, 80:40 and 115:45 GLC:YE initial condi-tions). Figure 3 shows the results for the logistic growthmodel and the consumption/production integrated mod-els rendered with the surface calculated parameters:Xmax, μ, qexpglc , q
expsa , qstaglc , q
stasa and SAfinal parameters. As
Martínez et al. BMC Systems Biology (2018) 12:102 Page 4 of 26
Fig. 1 Physiological model approximation to each point of the experimental design
it can be seen, all models follow the experimental datawith good agreement. The largest observable deviationis on the maximum SA achievable on the 80:40 GLC:YE
experiment, probably due to the contribution from YEto SA production. In addition, mathematical assessmentof the validation was performed by a set of descriptive
Martínez et al. BMC Systems Biology (2018) 12:102 Page 5 of 26
Table 1 Average parameters and estimated standard deviations from the central point in the experimental design
Xmax �[GLC] [SA]f [AC]f μ qexpglc qexpsa qstaglc qstasa Yps Ypx qexpac qstaac
[g/L] [g/L] [g/L] [g/L] [h−1] [g/Lh] [g/Lh] [g/Lh] [g/Lh] [g/g] [g/g] [g/Lh] [g/Lh]
Mean 12.80 99.82 32.80 9.24 0.58 1.24 0.35 0.45 0.13 0.36 0.76 0.52 0.50
σ 2 0.77 4.77 8.13 0.95 0.12 0.48 0.09 0.19 0.08 0.03 0.16 0.19 0.19
a e i
b f j
c g k
d h
Fig. 2 Response surface contour plots for the model estimated parameters. aMax biomass [g/L], b �[GLC] [g/L], c Final SA [g/L], d Final AC [g/L],e qexpglc [g/Lh], f qexpsa [g/Lh], g qstaglc [g/Lh], h qstasa [g/Lh], i qexpac [g/Lh], j qstaac [g/Lh], k μmax [h−1]
Martínez et al. BMC Systems Biology (2018) 12:102 Page 6 of 26
Fig. 3 Physiological model predictions to three experimentalvalidation experiments
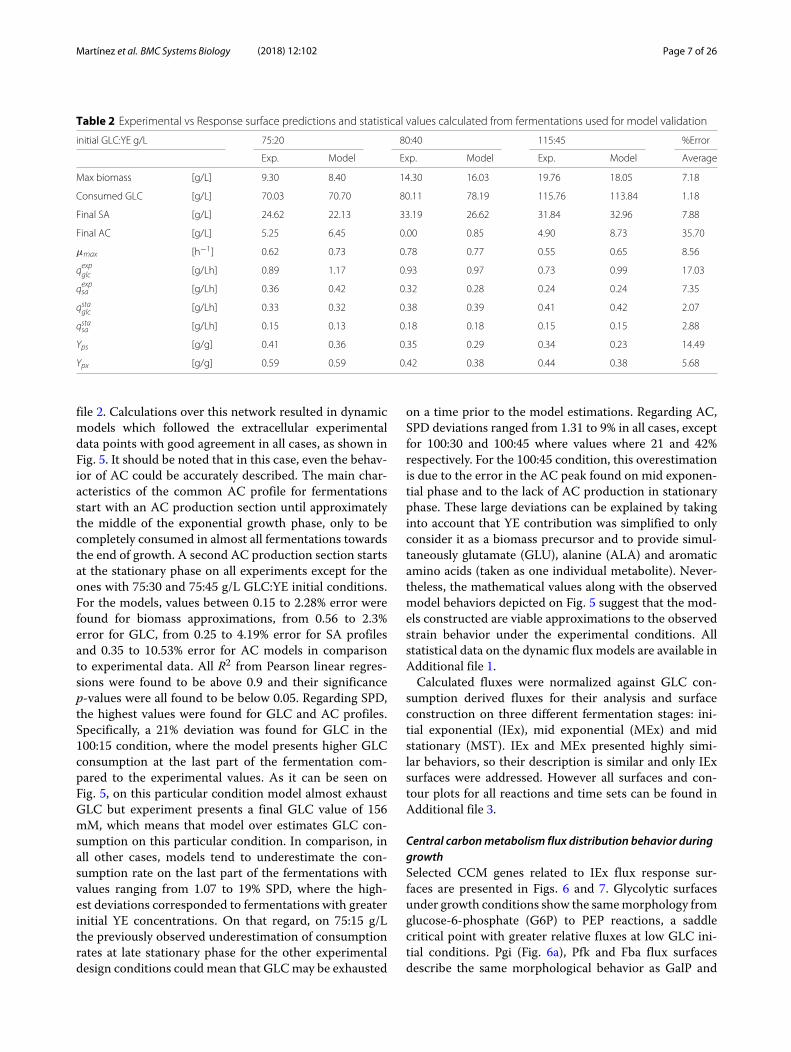
and inferential statistical comparisons between the mod-eled data and the experimental results. Error percentagewas obtained by ratio of quadratic sums and presentedvalues from 0.14 to 0.91 for biomass comparisons, from0.04 to 0.08 for GLC and from 0.04 to 0.26 for SA, sug-gesting a relatively small deviation between experimentaland modeled data along the fermentation. R2 values werefound between 0.96 and 0.99 for all three curves with per-centile deviations from the expected slope (SPD) valueslower than 1% and p-values below 0.05. These statisti-cal values and the depicted models from Fig. 3 show thatthe models constructed by the surface predicted param-eters can render comprehensively good representationsfor biomass, GLC and SA for initial conditions withinthe range of the experimental design. Surface predictedparameters were also validated by comparison with theones calculated directly from experimental data. Table 2shows the experimental and modeled parameters for allvalidation experiments and the average error calculated.The individual experimental error between predicted andcalculated parameters can be found on Additional file 1.[AC]0 presented the highest error, probably because inexperiments with high initial [GLC] and [YE] no AC wasproduced on stationary phase and surfaces constructedwith the polynomial equation cannot properly renderthese behavior values. qexpglc and Yp/s also had relativelyhigh errors above 10%. This may be related to the contri-bution of YE since it does not only contains the aromaticamino acids needed for growth, but also other amino acidsand some carbohydrates that could contribute to some ofthe previously discussed effects. However, the two-tailedt-student test for the comparison of experimental andmodeled parameters validated all parameters as similar,with p-values over 0.05. This means that the predictedvalues can be used within reason to compare and studythe behavior of AR36 under the limits of the experimen-tal design and that the constructed surfaces can be usedto obtain further insights on cell behavior. Parameter dataand statistical values for all experiments can be found onAdditional file 1.
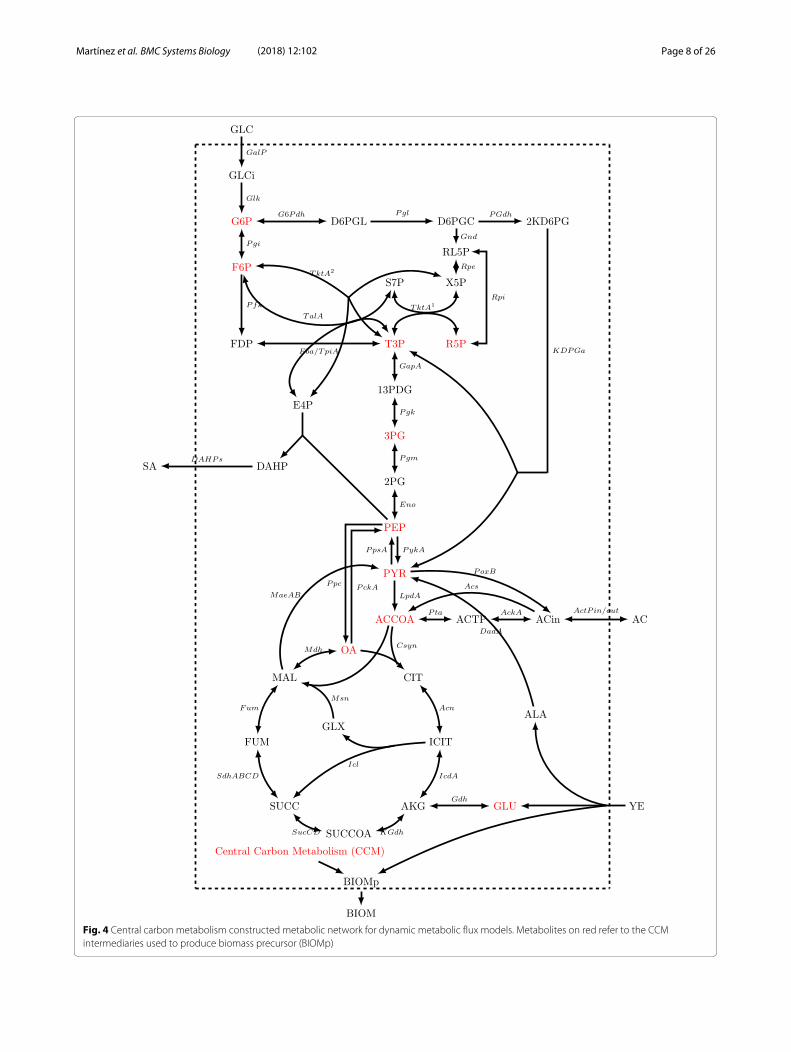
Dynamic Flux Metabolic Modeling of AR36 strain onvariant substrate conditionsTo get further insight into these different output zonedbehaviors, dynamic flux models were constructed. It isevident that AR36 strain regulation showed no linear bor-ders and contributions between predominant outcomes.Since data on internal fluxes, constraints on regulationor other kinetic data were not available, a cyberneticmodeling approach was used (See “Methods” section).The simplified metabolic network used for the metabolicmodels is depicted on Fig. 4, names of reactions will bereferred onward as indicated in this figure. The completedescription of the reactions can be found on Additional
Martínez et al. BMC Systems Biology (2018) 12:102 Page 7 of 26
Table 2 Experimental vs Response surface predictions and statistical values calculated from fermentations used for model validation
initial GLC:YE g/L 75:20 80:40 115:45 %Error
Exp. Model Exp. Model Exp. Model Average
Max biomass [g/L] 9.30 8.40 14.30 16.03 19.76 18.05 7.18
Consumed GLC [g/L] 70.03 70.70 80.11 78.19 115.76 113.84 1.18
Final SA [g/L] 24.62 22.13 33.19 26.62 31.84 32.96 7.88
Final AC [g/L] 5.25 6.45 0.00 0.85 4.90 8.73 35.70
μmax [h−1] 0.62 0.73 0.78 0.77 0.55 0.65 8.56
qexpglc [g/Lh] 0.89 1.17 0.93 0.97 0.73 0.99 17.03
qexpsa [g/Lh] 0.36 0.42 0.32 0.28 0.24 0.24 7.35
qstaglc [g/Lh] 0.33 0.32 0.38 0.39 0.41 0.42 2.07
qstasa [g/Lh] 0.15 0.13 0.18 0.18 0.15 0.15 2.88
Yps [g/g] 0.41 0.36 0.35 0.29 0.34 0.23 14.49
Ypx [g/g] 0.59 0.59 0.42 0.38 0.44 0.38 5.68
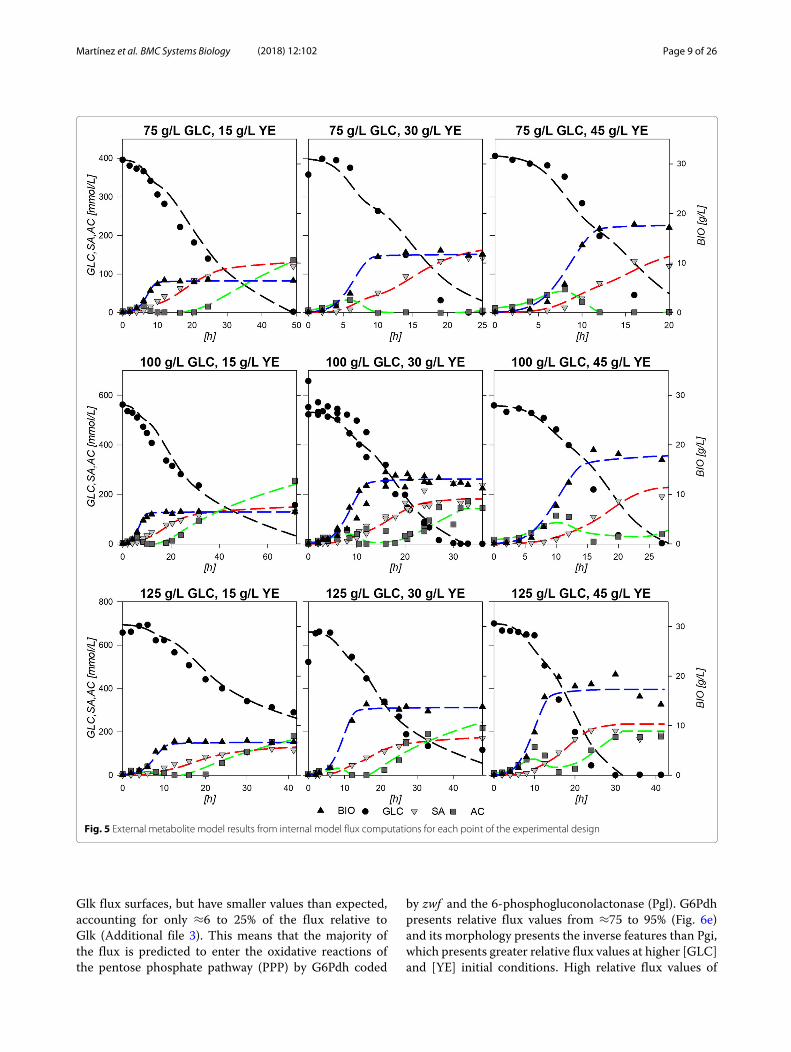
file 2. Calculations over this network resulted in dynamicmodels which followed the extracellular experimentaldata points with good agreement in all cases, as shown inFig. 5. It should be noted that in this case, even the behav-ior of AC could be accurately described. The main char-acteristics of the common AC profile for fermentationsstart with an AC production section until approximatelythe middle of the exponential growth phase, only to becompletely consumed in almost all fermentations towardsthe end of growth. A second AC production section startsat the stationary phase on all experiments except for theones with 75:30 and 75:45 g/L GLC:YE initial conditions.For the models, values between 0.15 to 2.28% error werefound for biomass approximations, from 0.56 to 2.3%error for GLC, from 0.25 to 4.19% error for SA profilesand 0.35 to 10.53% error for AC models in comparisonto experimental data. All R2 from Pearson linear regres-sions were found to be above 0.9 and their significancep-values were all found to be below 0.05. Regarding SPD,the highest values were found for GLC and AC profiles.Specifically, a 21% deviation was found for GLC in the100:15 condition, where the model presents higher GLCconsumption at the last part of the fermentation com-pared to the experimental values. As it can be seen onFig. 5, on this particular condition model almost exhaustGLC but experiment presents a final GLC value of 156mM, which means that model over estimates GLC con-sumption on this particular condition. In comparison, inall other cases, models tend to underestimate the con-sumption rate on the last part of the fermentations withvalues ranging from 1.07 to 19% SPD, where the high-est deviations corresponded to fermentations with greaterinitial YE concentrations. On that regard, on 75:15 g/Lthe previously observed underestimation of consumptionrates at late stationary phase for the other experimentaldesign conditions could mean that GLCmay be exhausted
on a time prior to the model estimations. Regarding AC,SPD deviations ranged from 1.31 to 9% in all cases, exceptfor 100:30 and 100:45 where values where 21 and 42%respectively. For the 100:45 condition, this overestimationis due to the error in the AC peak found on mid exponen-tial phase and to the lack of AC production in stationaryphase. These large deviations can be explained by takinginto account that YE contribution was simplified to onlyconsider it as a biomass precursor and to provide simul-taneously glutamate (GLU), alanine (ALA) and aromaticamino acids (taken as one individual metabolite). Never-theless, the mathematical values along with the observedmodel behaviors depicted on Fig. 5 suggest that the mod-els constructed are viable approximations to the observedstrain behavior under the experimental conditions. Allstatistical data on the dynamic flux models are available inAdditional file 1.Calculated fluxes were normalized against GLC con-
sumption derived fluxes for their analysis and surfaceconstruction on three different fermentation stages: ini-tial exponential (IEx), mid exponential (MEx) and midstationary (MST). IEx and MEx presented highly simi-lar behaviors, so their description is similar and only IExsurfaces were addressed. However all surfaces and con-tour plots for all reactions and time sets can be found inAdditional file 3.
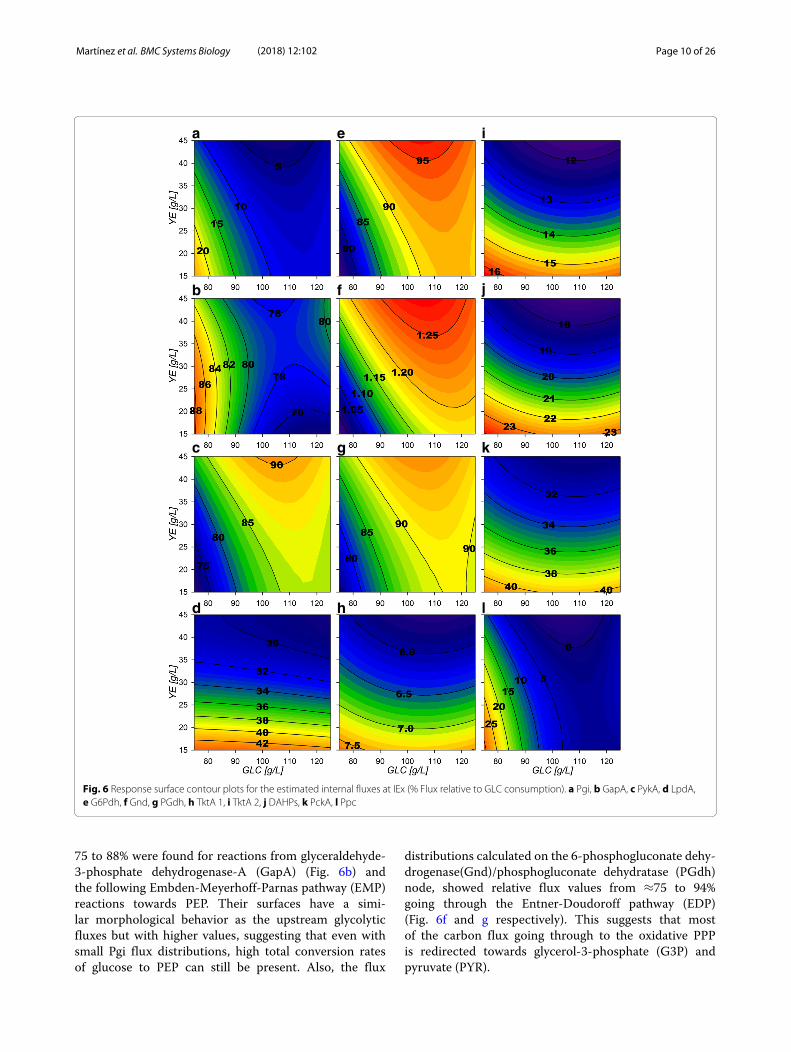
Central carbonmetabolism flux distribution behavior duringgrowthSelected CCM genes related to IEx flux response sur-faces are presented in Figs. 6 and 7. Glycolytic surfacesunder growth conditions show the samemorphology fromglucose-6-phosphate (G6P) to PEP reactions, a saddlecritical point with greater relative fluxes at low GLC ini-tial conditions. Pgi (Fig. 6a), Pfk and Fba flux surfacesdescribe the same morphological behavior as GalP and
Martínez et al. BMC Systems Biology (2018) 12:102 Page 8 of 26
Fig. 4 Central carbon metabolism constructed metabolic network for dynamic metabolic flux models. Metabolites on red refer to the CCMintermediaries used to produce biomass precursor (BIOMp)
Martínez et al. BMC Systems Biology (2018) 12:102 Page 9 of 26
Fig. 5 External metabolite model results from internal model flux computations for each point of the experimental design
Glk flux surfaces, but have smaller values than expected,accounting for only ≈6 to 25% of the flux relative toGlk (Additional file 3). This means that the majority ofthe flux is predicted to enter the oxidative reactions ofthe pentose phosphate pathway (PPP) by G6Pdh coded
by zwf and the 6-phosphogluconolactonase (Pgl). G6Pdhpresents relative flux values from ≈75 to 95% (Fig. 6e)and its morphology presents the inverse features than Pgi,which presents greater relative flux values at higher [GLC]and [YE] initial conditions. High relative flux values of
Martínez et al. BMC Systems Biology (2018) 12:102 Page 10 of 26
a e i
b f j
c g k
ld h
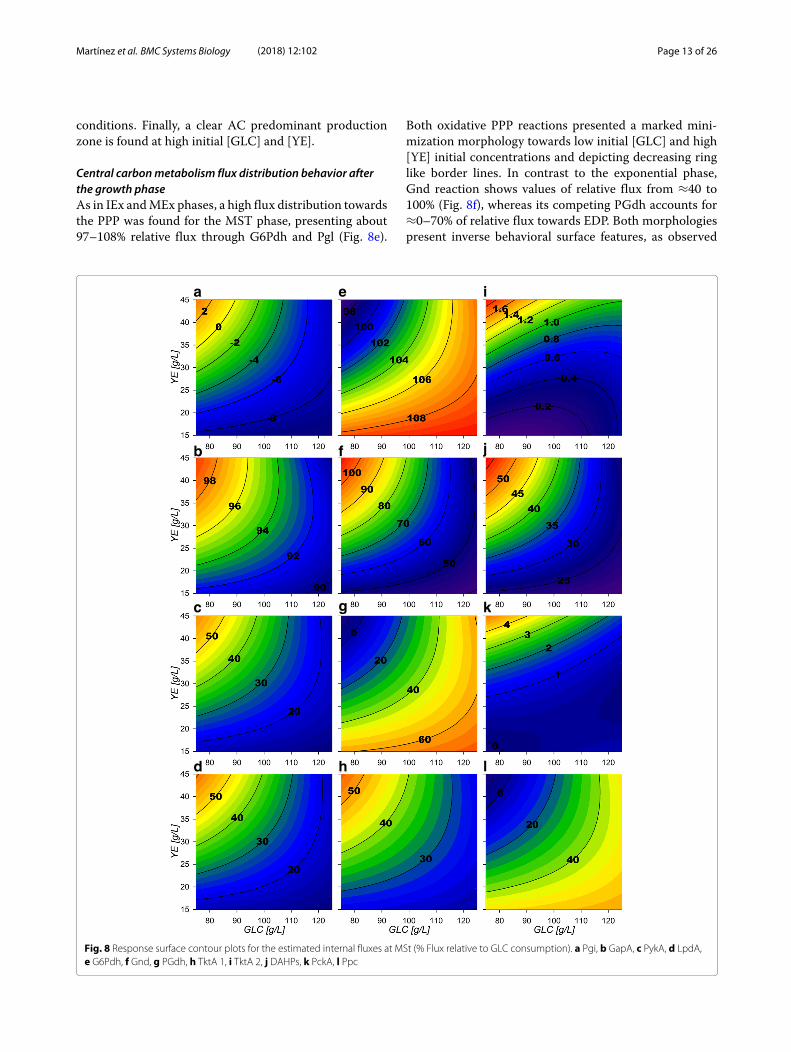
Fig. 6 Response surface contour plots for the estimated internal fluxes at IEx (% Flux relative to GLC consumption). a Pgi, b GapA, c PykA, d LpdA,e G6Pdh, f Gnd, g PGdh, h TktA 1, i TktA 2, j DAHPs, k PckA, l Ppc
75 to 88% were found for reactions from glyceraldehyde-3-phosphate dehydrogenase-A (GapA) (Fig. 6b) andthe following Embden-Meyerhoff-Parnas pathway (EMP)reactions towards PEP. Their surfaces have a simi-lar morphological behavior as the upstream glycolyticfluxes but with higher values, suggesting that even withsmall Pgi flux distributions, high total conversion ratesof glucose to PEP can still be present. Also, the flux
distributions calculated on the 6-phosphogluconate dehy-drogenase(Gnd)/phosphogluconate dehydratase (PGdh)node, showed relative flux values from ≈75 to 94%going through the Entner-Doudoroff pathway (EDP)(Fig. 6f and g respectively). This suggests that mostof the carbon flux going through to the oxidative PPPis redirected towards glycerol-3-phosphate (G3P) andpyruvate (PYR).
Martínez et al. BMC Systems Biology (2018) 12:102 Page 11 of 26
a e i
b f j
c g k
ld h
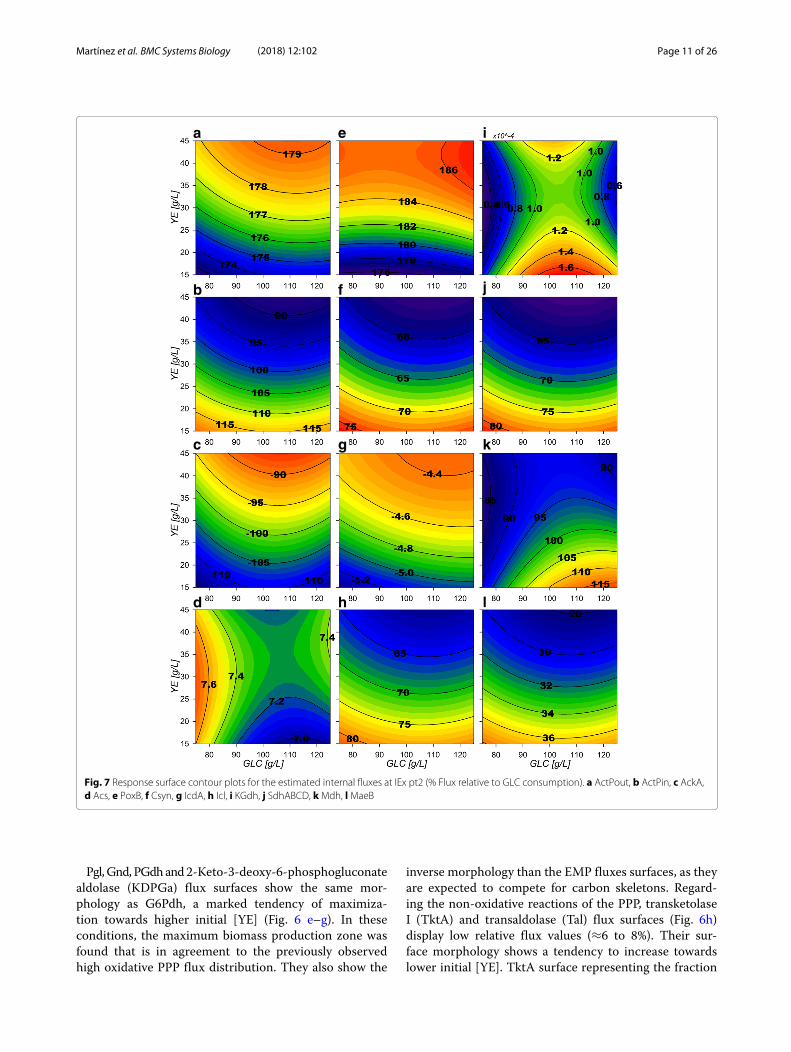
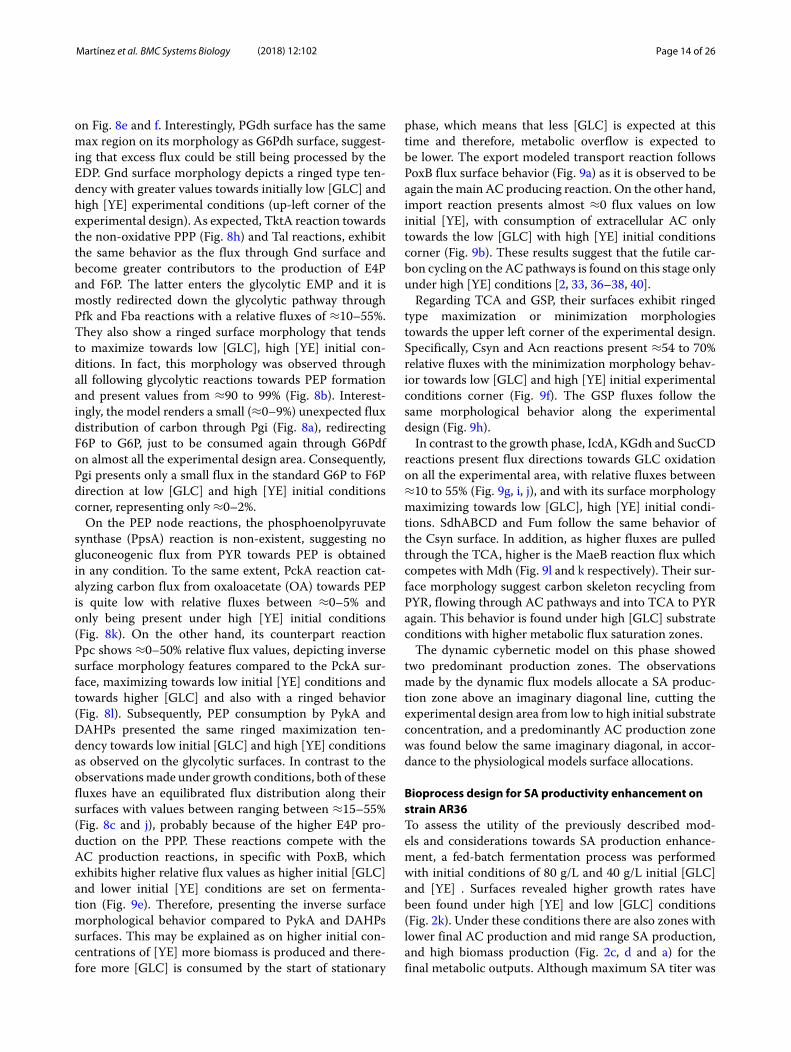
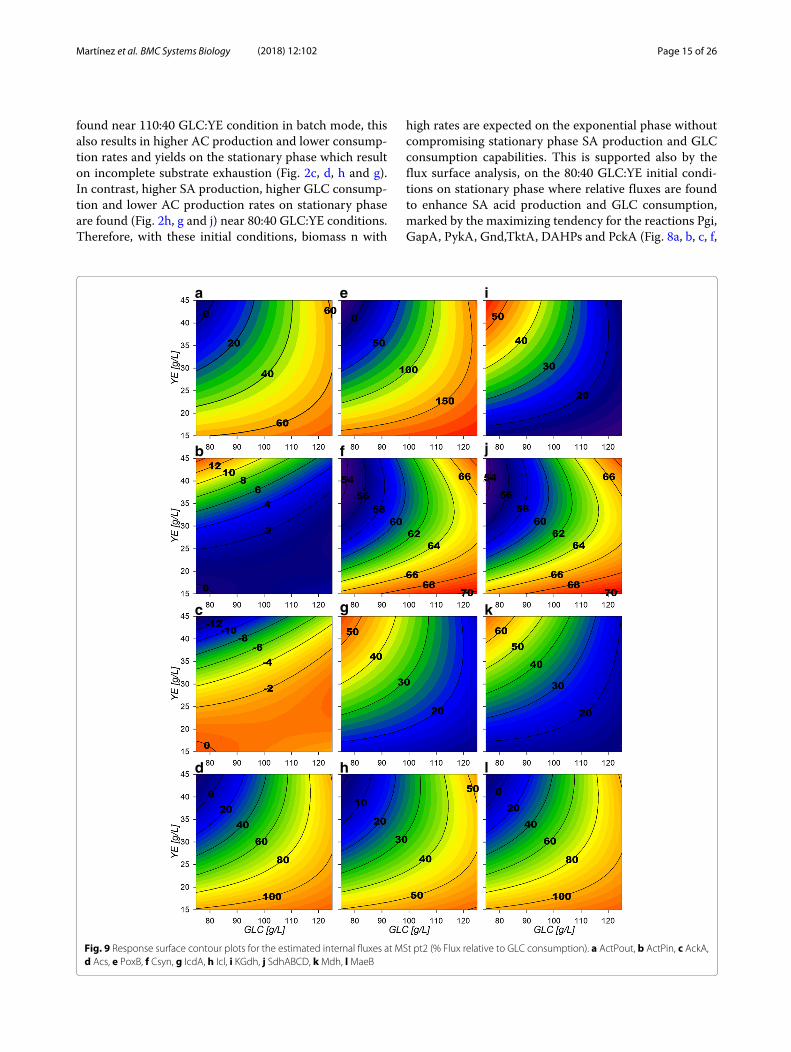
Fig. 7 Response surface contour plots for the estimated internal fluxes at IEx pt2 (% Flux relative to GLC consumption). a ActPout, b ActPin, c AckA,d Acs, e PoxB, f Csyn, g IcdA, h Icl, i KGdh, j SdhABCD, kMdh, lMaeB
Pgl,Gnd, PGdhand2-Keto-3-deoxy-6-phosphogluconatealdolase (KDPGa) flux surfaces show the same mor-phology as G6Pdh, a marked tendency of maximiza-tion towards higher initial [YE] (Fig. 6 e–g). In theseconditions, the maximum biomass production zone wasfound that is in agreement to the previously observedhigh oxidative PPP flux distribution. They also show the
inverse morphology than the EMP fluxes surfaces, as theyare expected to compete for carbon skeletons. Regard-ing the non-oxidative reactions of the PPP, transketolaseI (TktA) and transaldolase (Tal) flux surfaces (Fig. 6h)display low relative flux values (≈6 to 8%). Their sur-face morphology shows a tendency to increase towardslower initial [YE]. TktA surface representing the fraction
Martínez et al. BMC Systems Biology (2018) 12:102 Page 12 of 26
of carbon being redirected from EMP towards the non-oxidative branch of PPP, shows values ranging from ≈12 to 16% (Fig. 6i). These non-oxidative branch reac-tions are responsible for the E4P formation and presentcombined flux values from ≈ 18 to 24%, which matchesthe predicted flux being redirected toward SA produc-tion by the 2-dehydro-3-deoxyphosphoheptonate aldolase(DAHPs) during growth (Fig. 6j). An interesting con-sequence is that up to ≈72 to 90% of flux modeledis going through the pyruvate kinase II (PykA) relatedreaction (Figure 6c), meaning that the majority of PEPis probably being converted to PYR. Phosphoenolpyru-vate carboxylase (Ppc) surface shows the same morphol-ogy described by the glycolytic genes (Fig. 6l), indicatingthat on low [GLC] and low [YE] conditions, glycolyticmetabolism is favored. Meanwhile, Phosphoenolpyruvatecarboxykinase (PckA) (Fig. 6k) presents a tendency toincrease flux towards low initial [YE] conditions. PckAand Ppc fluxes presented values ranging from ≈31 to41% and ≈0 to 30%, respectively. Their simultaneousflux, suggests the existence of an ATP consuming futilecycle.The high inflow to PYR is probably caused by the
high EDP and PykA relative fluxes and increased evenfurther by a high malic enzyme carbon reincorpora-tion from the Tricarboxylic Acid Cycle (TCA), account-ing for ≈28–38% from the NADPH dependent enzyme(MaeB) (Fig. 7l) and ≈0-30% from the NADH depen-dent (MaeA). In the model, PYR can also be producedfrom YE-derived ALA conversion by alanine D-aminoacid dehydrogenase (DadA) reaction. On the other hand,for PYR conversion to acetyl coenzyme-A (ACCOA),the reaction was attributed to pyruvate dehydrogenase(LpdA). This reaction showed relatively small values, from≈28–42% of relative flux (Fig. 6d) compared to pyruvateoxidase (PoxB), which presented fluxes towards AC cal-culated to be between ≈176–186% during growth phase(Fig. 7e). It is noticeable that for AC production, no con-straint was imposed for flux preference on either acetatekinase (AckA), acetyl-CoA synthetase (Acs) and PoxBreactions and the model renders consumption over thereversible (AckA) since it is energetically favorable com-pared to Acs (Fig. 7c–e). Surfaces for extracellular ACexport and import fluxes for AR36 (ActPout and ActPin)show greater export rates with higher initial YE concen-trations. This could be attributed to the introduction ofcarbon to the CCM through ALA and GLU consump-tion (Fig. 7a and b), but can also be extended to otherYE-derived amino acids catabolized through TCA notincluded on the model. On the other hand, the importof AC presents a maximization tendency towards lowinitial [YE] with relative flux values between ≈ 90 to115%. To clarify the node distribution around PoxB, anAR36�poxB strain was constructed and cultured under
high [GLC] and high [YE], conditions that maximize ACproduction according to the response surfaces. Interest-ingly, the initial AC concentration peak observed in allprevious experiments was not detected in this case withthe mutant strain (Additional file 4). Furthermore, thefinal AC concentration was significantly lower comparedto AR36 on similar fermentation conditions. This sug-gest that PoxB could be indeed the main contributor toAC production in the AR36 PTS− strain [2, 33, 36–38].The AR36�poxB cultures also showed lower growthrates (0.21 h−1) and lower exponential GLC consump-tion rates (0.61 g/gh) (Additional file 4). This may indicatethat its inactivation could be causing PYR accumula-tion and less ATP generation via the electron-transferchain [39].Regarding TCA behavior, the glta coded citrate syn-
thase (Csyn) reaction presents relative flux values from≈56 to 75% (Fig. 7f). As expected aconitase (Acn) reac-tion (Additional file 3) presents the same behavior as theCsyn reaction and both present the inverse morphologicalfeatures compared to the AC producing surfaces. Con-versely, the following reaction by isocitrate dehydrogenase(IcdA) seems to not be sending carbon flux down TCA.On the contrary, its reversible reaction is found, transport-ing the small excess of GLU derived from YE consumptiontowards isocitrate (ICIT) (Fig. 7g). The isocitrate lyase(Icl) and malate synthase (Msn) from this pathway, hav-ing relative fluxes values accounting from ≈60 to 82%of relative flux (Fig. 7h), and present the same surfacemorphology as the TCA carbon uptake Csyn flux sur-face. On the other hand, 2-ketoglutarate dehydrogenase(KGdh) and succinyl-CoA synthetase (SucCD) complexesseem to be catalyzing very small amounts of flux towardssuccinate (SUC) (Fig. 7i). Calculations for the glutamatedehydrogenase (Gdh) show relative fluxes between ≈3.1to 3.7%, suggesting only small input by [YE] compo-nents into TCA and apparently processed mainly by IcdA.This means that SUC, is mostly produced by the glyoxy-late shunt pathway (GSP) and subsequently catalyzed tomalate (MAL) by the succinate dehydrogenase complex(SdhABCD) (Fig. 7j) and the fumarase (Fum). Their sur-faces share the morphological characteristics of the Csynand the GSP surfaces. In consequence, the malate dehy-drogenase (Mdh) reaction exhibits higher relative fluxvalues, from ≈85 to 1125% (Fig. 7k) as it also assim-ilates ACCOA carbon derived from the Msn reactionon GSP.Surface morphologies suggest the allocation of different
predominant extracellular production zones at the expo-nential growth phase. A SA production predominanceflux zone is found at low initial [YE] and as the initial[GLC] diminishes a more balanced production towardsbiomass and SA is found. This follows up to the pre-dominant region for biomass found at low initial [GLC]
Martínez et al. BMC Systems Biology (2018) 12:102 Page 13 of 26
conditions. Finally, a clear AC predominant productionzone is found at high initial [GLC] and [YE].
Central carbonmetabolism flux distribution behavior afterthe growth phaseAs in IEx andMEx phases, a high flux distribution towardsthe PPP was found for the MST phase, presenting about97–108% relative flux through G6Pdh and Pgl (Fig. 8e).
Both oxidative PPP reactions presented a marked mini-mization morphology towards low initial [GLC] and high[YE] initial concentrations and depicting decreasing ringlike border lines. In contrast to the exponential phase,Gnd reaction shows values of relative flux from ≈40 to100% (Fig. 8f), whereas its competing PGdh accounts for≈0–70% of relative flux towards EDP. Both morphologiespresent inverse behavioral surface features, as observed
a e i
b f j
c g k
ld h
Fig. 8 Response surface contour plots for the estimated internal fluxes at MSt (% Flux relative to GLC consumption). a Pgi, b GapA, c PykA, d LpdA,e G6Pdh, f Gnd, g PGdh, h TktA 1, i TktA 2, j DAHPs, k PckA, l Ppc
Martínez et al. BMC Systems Biology (2018) 12:102 Page 14 of 26
on Fig. 8e and f. Interestingly, PGdh surface has the samemax region on its morphology as G6Pdh surface, suggest-ing that excess flux could be still being processed by theEDP. Gnd surface morphology depicts a ringed type ten-dency with greater values towards initially low [GLC] andhigh [YE] experimental conditions (up-left corner of theexperimental design). As expected, TktA reaction towardsthe non-oxidative PPP (Fig. 8h) and Tal reactions, exhibitthe same behavior as the flux through Gnd surface andbecome greater contributors to the production of E4Pand F6P. The latter enters the glycolytic EMP and it ismostly redirected down the glycolytic pathway throughPfk and Fba reactions with a relative fluxes of ≈10–55%.They also show a ringed surface morphology that tendsto maximize towards low [GLC], high [YE] initial con-ditions. In fact, this morphology was observed throughall following glycolytic reactions towards PEP formationand present values from ≈90 to 99% (Fig. 8b). Interest-ingly, the model renders a small (≈0–9%) unexpected fluxdistribution of carbon through Pgi (Fig. 8a), redirectingF6P to G6P, just to be consumed again through G6Pdfon almost all the experimental design area. Consequently,Pgi presents only a small flux in the standard G6P to F6Pdirection at low [GLC] and high [YE] initial conditionscorner, representing only ≈0–2%.On the PEP node reactions, the phosphoenolpyruvate
synthase (PpsA) reaction is non-existent, suggesting nogluconeogenic flux from PYR towards PEP is obtainedin any condition. To the same extent, PckA reaction cat-alyzing carbon flux from oxaloacetate (OA) towards PEPis quite low with relative fluxes between ≈0–5% andonly being present under high [YE] initial conditions(Fig. 8k). On the other hand, its counterpart reactionPpc shows ≈0–50% relative flux values, depicting inversesurface morphology features compared to the PckA sur-face, maximizing towards low initial [YE] conditions andtowards higher [GLC] and also with a ringed behavior(Fig. 8l). Subsequently, PEP consumption by PykA andDAHPs presented the same ringed maximization ten-dency towards low initial [GLC] and high [YE] conditionsas observed on the glycolytic surfaces. In contrast to theobservationsmade under growth conditions, both of thesefluxes have an equilibrated flux distribution along theirsurfaces with values between ranging between ≈15–55%(Fig. 8c and j), probably because of the higher E4P pro-duction on the PPP. These reactions compete with theAC production reactions, in specific with PoxB, whichexhibits higher relative flux values as higher initial [GLC]and lower initial [YE] conditions are set on fermenta-tion (Fig. 9e). Therefore, presenting the inverse surfacemorphological behavior compared to PykA and DAHPssurfaces. This may be explained as on higher initial con-centrations of [YE] more biomass is produced and there-fore more [GLC] is consumed by the start of stationary
phase, which means that less [GLC] is expected at thistime and therefore, metabolic overflow is expected tobe lower. The export modeled transport reaction followsPoxB flux surface behavior (Fig. 9a) as it is observed to beagain themain AC producing reaction. On the other hand,import reaction presents almost ≈0 flux values on lowinitial [YE], with consumption of extracellular AC onlytowards the low [GLC] with high [YE] initial conditionscorner (Fig. 9b). These results suggest that the futile car-bon cycling on the AC pathways is found on this stage onlyunder high [YE] conditions [2, 33, 36–38, 40].Regarding TCA and GSP, their surfaces exhibit ringed
type maximization or minimization morphologiestowards the upper left corner of the experimental design.Specifically, Csyn and Acn reactions present ≈54 to 70%relative fluxes with the minimization morphology behav-ior towards low [GLC] and high [YE] initial experimentalconditions corner (Fig. 9f). The GSP fluxes follow thesame morphological behavior along the experimentaldesign (Fig. 9h).In contrast to the growth phase, IcdA, KGdh and SucCD
reactions present flux directions towards GLC oxidationon all the experimental area, with relative fluxes between≈10 to 55% (Fig. 9g, i, j), and with its surface morphologymaximizing towards low [GLC], high [YE] initial condi-tions. SdhABCD and Fum follow the same behavior ofthe Csyn surface. In addition, as higher fluxes are pulledthrough the TCA, higher is the MaeB reaction flux whichcompetes with Mdh (Fig. 9l and k respectively). Their sur-face morphology suggest carbon skeleton recycling fromPYR, flowing through AC pathways and into TCA to PYRagain. This behavior is found under high [GLC] substrateconditions with higher metabolic flux saturation zones.The dynamic cybernetic model on this phase showed
two predominant production zones. The observationsmade by the dynamic flux models allocate a SA produc-tion zone above an imaginary diagonal line, cutting theexperimental design area from low to high initial substrateconcentration, and a predominantly AC production zonewas found below the same imaginary diagonal, in accor-dance to the physiological models surface allocations.
Bioprocess design for SA productivity enhancement onstrain AR36To assess the utility of the previously described mod-els and considerations towards SA production enhance-ment, a fed-batch fermentation process was performedwith initial conditions of 80 g/L and 40 g/L initial [GLC]and [YE] . Surfaces revealed higher growth rates havebeen found under high [YE] and low [GLC] conditions(Fig. 2k). Under these conditions there are also zones withlower final AC production and mid range SA production,and high biomass production (Fig. 2c, d and a) for thefinal metabolic outputs. Although maximum SA titer was
Martínez et al. BMC Systems Biology (2018) 12:102 Page 15 of 26
found near 110:40 GLC:YE condition in batch mode, thisalso results in higher AC production and lower consump-tion rates and yields on the stationary phase which resulton incomplete substrate exhaustion (Fig. 2c, d, h and g).In contrast, higher SA production, higher GLC consump-tion and lower AC production rates on stationary phaseare found (Fig. 2h, g and j) near 80:40 GLC:YE conditions.Therefore, with these initial conditions, biomass n with
high rates are expected on the exponential phase withoutcompromising stationary phase SA production and GLCconsumption capabilities. This is supported also by theflux surface analysis, on the 80:40 GLC:YE initial condi-tions on stationary phase where relative fluxes are foundto enhance SA acid production and GLC consumption,marked by the maximizing tendency for the reactions Pgi,GapA, PykA, Gnd,TktA, DAHPs and PckA (Fig. 8a, b, c, f,
a e i
b f j
c g k
ld h
Fig. 9 Response surface contour plots for the estimated internal fluxes at MSt pt2 (% Flux relative to GLC consumption). a ActPout, b ActPin, c AckA,d Acs, e PoxB, f Csyn, g IcdA, h Icl, i KGdh, j SdhABCD, kMdh, lMaeB
Martínez et al. BMC Systems Biology (2018) 12:102 Page 16 of 26
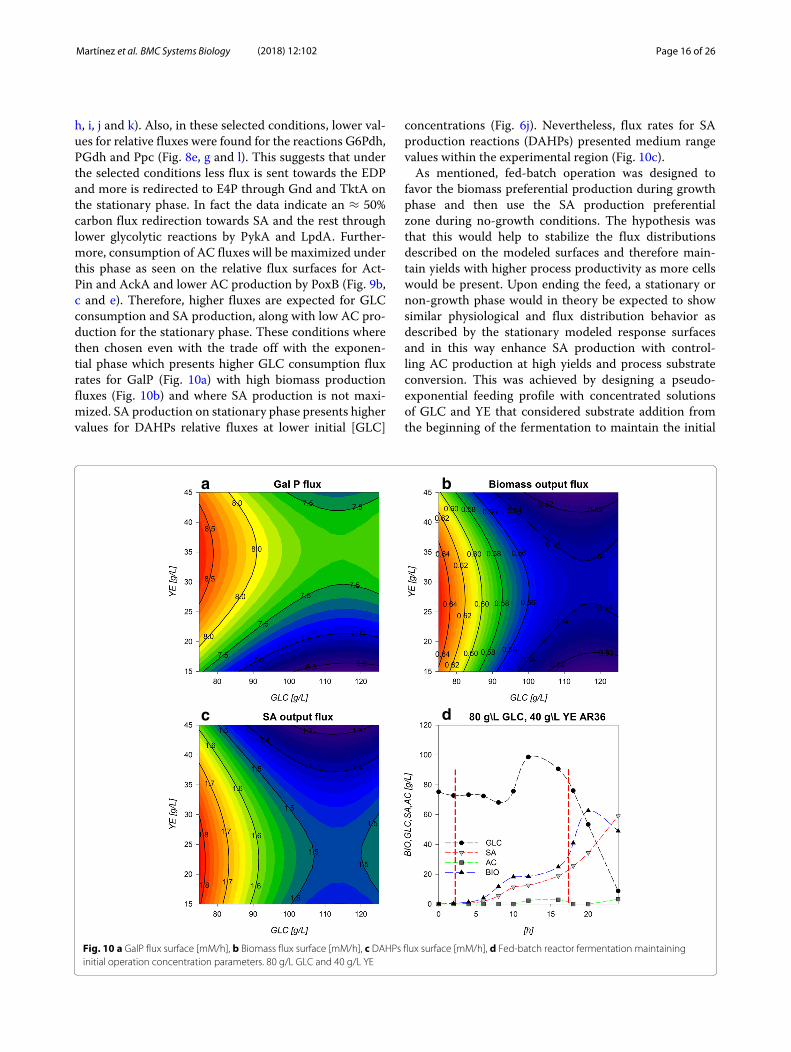
h, i, j and k). Also, in these selected conditions, lower val-ues for relative fluxes were found for the reactions G6Pdh,PGdh and Ppc (Fig. 8e, g and l). This suggests that underthe selected conditions less flux is sent towards the EDPand more is redirected to E4P through Gnd and TktA onthe stationary phase. In fact the data indicate an ≈ 50%carbon flux redirection towards SA and the rest throughlower glycolytic reactions by PykA and LpdA. Further-more, consumption of AC fluxes will be maximized underthis phase as seen on the relative flux surfaces for Act-Pin and AckA and lower AC production by PoxB (Fig. 9b,c and e). Therefore, higher fluxes are expected for GLCconsumption and SA production, along with low AC pro-duction for the stationary phase. These conditions wherethen chosen even with the trade off with the exponen-tial phase which presents higher GLC consumption fluxrates for GalP (Fig. 10a) with high biomass productionfluxes (Fig. 10b) and where SA production is not maxi-mized. SA production on stationary phase presents highervalues for DAHPs relative fluxes at lower initial [GLC]
concentrations (Fig. 6j). Nevertheless, flux rates for SAproduction reactions (DAHPs) presented medium rangevalues within the experimental region (Fig. 10c).As mentioned, fed-batch operation was designed to
favor the biomass preferential production during growthphase and then use the SA production preferentialzone during no-growth conditions. The hypothesis wasthat this would help to stabilize the flux distributionsdescribed on the modeled surfaces and therefore main-tain yields with higher process productivity as more cellswould be present. Upon ending the feed, a stationary ornon-growth phase would in theory be expected to showsimilar physiological and flux distribution behavior asdescribed by the stationary modeled response surfacesand in this way enhance SA production with control-ling AC production at high yields and process substrateconversion. This was achieved by designing a pseudo-exponential feeding profile with concentrated solutionsof GLC and YE that considered substrate addition fromthe beginning of the fermentation to maintain the initial
a b
dc
Fig. 10 a GalP flux surface [mM/h], b Biomass flux surface [mM/h], c DAHPs flux surface [mM/h], d Fed-batch reactor fermentation maintaininginitial operation concentration parameters. 80 g/L GLC and 40 g/L YE
Martínez et al. BMC Systems Biology (2018) 12:102 Page 17 of 26
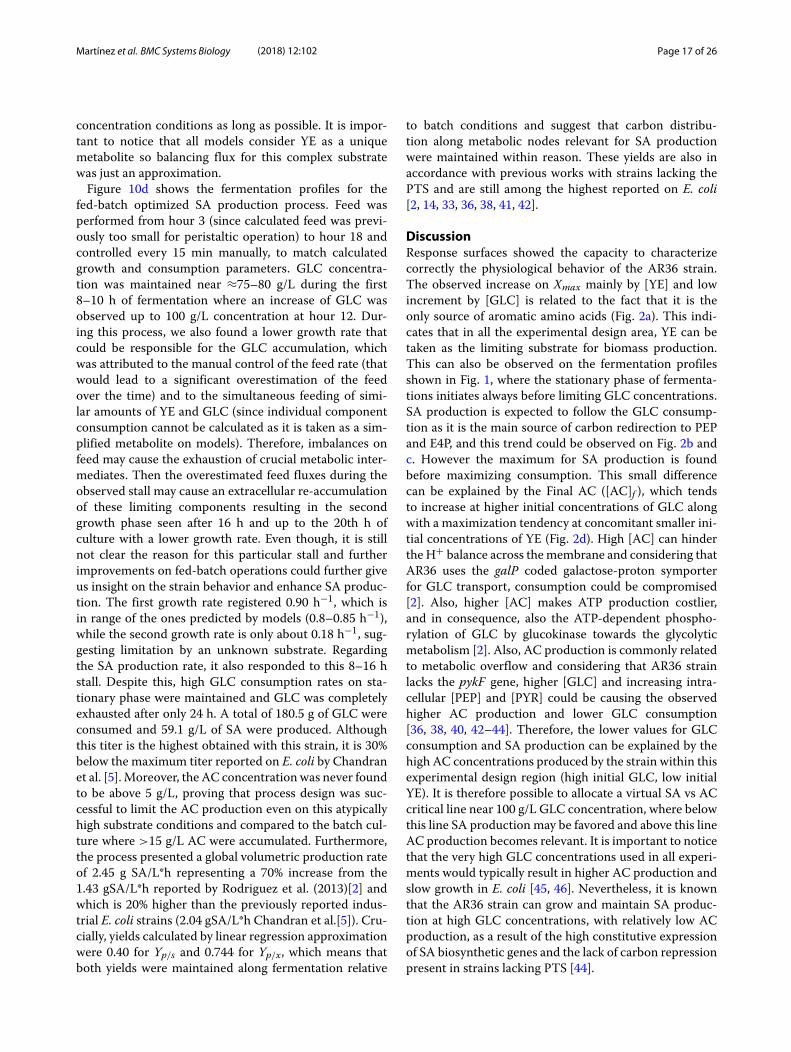
concentration conditions as long as possible. It is impor-tant to notice that all models consider YE as a uniquemetabolite so balancing flux for this complex substratewas just an approximation.Figure 10d shows the fermentation profiles for the
fed-batch optimized SA production process. Feed wasperformed from hour 3 (since calculated feed was previ-ously too small for peristaltic operation) to hour 18 andcontrolled every 15 min manually, to match calculatedgrowth and consumption parameters. GLC concentra-tion was maintained near ≈75–80 g/L during the first8–10 h of fermentation where an increase of GLC wasobserved up to 100 g/L concentration at hour 12. Dur-ing this process, we also found a lower growth rate thatcould be responsible for the GLC accumulation, whichwas attributed to the manual control of the feed rate (thatwould lead to a significant overestimation of the feedover the time) and to the simultaneous feeding of simi-lar amounts of YE and GLC (since individual componentconsumption cannot be calculated as it is taken as a sim-plified metabolite on models). Therefore, imbalances onfeed may cause the exhaustion of crucial metabolic inter-mediates. Then the overestimated feed fluxes during theobserved stall may cause an extracellular re-accumulationof these limiting components resulting in the secondgrowth phase seen after 16 h and up to the 20th h ofculture with a lower growth rate. Even though, it is stillnot clear the reason for this particular stall and furtherimprovements on fed-batch operations could further giveus insight on the strain behavior and enhance SA produc-tion. The first growth rate registered 0.90 h−1, which isin range of the ones predicted by models (0.8–0.85 h−1),while the second growth rate is only about 0.18 h−1, sug-gesting limitation by an unknown substrate. Regardingthe SA production rate, it also responded to this 8–16 hstall. Despite this, high GLC consumption rates on sta-tionary phase were maintained and GLC was completelyexhausted after only 24 h. A total of 180.5 g of GLC wereconsumed and 59.1 g/L of SA were produced. Althoughthis titer is the highest obtained with this strain, it is 30%below the maximum titer reported on E. coli by Chandranet al. [5].Moreover, the AC concentration was never foundto be above 5 g/L, proving that process design was suc-cessful to limit the AC production even on this atypicallyhigh substrate conditions and compared to the batch cul-ture where >15 g/L AC were accumulated. Furthermore,the process presented a global volumetric production rateof 2.45 g SA/L*h representing a 70% increase from the1.43 gSA/L*h reported by Rodriguez et al. (2013)[2] andwhich is 20% higher than the previously reported indus-trial E. coli strains (2.04 gSA/L*h Chandran et al.[5]). Cru-cially, yields calculated by linear regression approximationwere 0.40 for Yp/s and 0.744 for Yp/x, which means thatboth yields were maintained along fermentation relative
to batch conditions and suggest that carbon distribu-tion along metabolic nodes relevant for SA productionwere maintained within reason. These yields are also inaccordance with previous works with strains lacking thePTS and are still among the highest reported on E. coli[2, 14, 33, 36, 38, 41, 42].
DiscussionResponse surfaces showed the capacity to characterizecorrectly the physiological behavior of the AR36 strain.The observed increase on Xmax mainly by [YE] and lowincrement by [GLC] is related to the fact that it is theonly source of aromatic amino acids (Fig. 2a). This indi-cates that in all the experimental design area, YE can betaken as the limiting substrate for biomass production.This can also be observed on the fermentation profilesshown in Fig. 1, where the stationary phase of fermenta-tions initiates always before limiting GLC concentrations.SA production is expected to follow the GLC consump-tion as it is the main source of carbon redirection to PEPand E4P, and this trend could be observed on Fig. 2b andc. However the maximum for SA production is foundbefore maximizing consumption. This small differencecan be explained by the Final AC ([AC]f ), which tendsto increase at higher initial concentrations of GLC alongwith a maximization tendency at concomitant smaller ini-tial concentrations of YE (Fig. 2d). High [AC] can hinderthe H+ balance across themembrane and considering thatAR36 uses the galP coded galactose-proton symporterfor GLC transport, consumption could be compromised[2]. Also, higher [AC] makes ATP production costlier,and in consequence, also the ATP-dependent phospho-rylation of GLC by glucokinase towards the glycolyticmetabolism [2]. Also, AC production is commonly relatedto metabolic overflow and considering that AR36 strainlacks the pykF gene, higher [GLC] and increasing intra-cellular [PEP] and [PYR] could be causing the observedhigher AC production and lower GLC consumption[36, 38, 40, 42–44]. Therefore, the lower values for GLCconsumption and SA production can be explained by thehigh AC concentrations produced by the strain within thisexperimental design region (high initial GLC, low initialYE). It is therefore possible to allocate a virtual SA vs ACcritical line near 100 g/L GLC concentration, where belowthis line SA production may be favored and above this lineAC production becomes relevant. It is important to noticethat the very high GLC concentrations used in all experi-ments would typically result in higher AC production andslow growth in E. coli [45, 46]. Nevertheless, it is knownthat the AR36 strain can grow and maintain SA produc-tion at high GLC concentrations, with relatively low ACproduction, as a result of the high constitutive expressionof SA biosynthetic genes and the lack of carbon repressionpresent in strains lacking PTS [44].
Martínez et al. BMC Systems Biology (2018) 12:102 Page 18 of 26
Regarding specific rates a diminution of the GLC con-sumption rate under increasing [YE] was also found.This could be related to YE components competingfor transport energy or amino acid allocation for theirtransporters. This may be possible since as mentioned,AR36 does not present catabolic repression (as a con-sequence of crrHI operon deletion) and is capable totransport simultaneously various carbon sources in thepresence of GLC after synthesis induction of alter-native transporters by cell carbon scavenging signals[36, 40, 42, 44]. More over, at higher [YE], PYR con-sumption reactions could be kinetically saturated sincegreater alanine (ALA) YE derived concentrations couldenter the CCM to PYR saturating this metabolite pool andreducing GLC consumption. In contrast, at the station-ary phase qstaglc presented higher values on higher initialconcentration of both substrate sources. This behavioris expected for GLC, as higher concentrations of thissubstrate remain on the stationary phase and could betriggering higher consumption rates. However, it remainsunclear why higher concentrations of initial YE couldcause greater GLC stationary consumption rates. Onepossibility is that, higher initial [YE] could result inmore oxaloacetate present on this phase increasing TCAactivity and GLC consumption. This observation corre-lates with the behavior found for �[GLC] where onlyat high [YE], high [GLC] initial concentrations can beexhausted.Regarding SA and AC production profiles it seems
clear that as they are the main metabolic outputs forthis strain they present the inverse maximization zoneson experimental design area on both fermentation stages(Fig. 2f, h, i and j). This can be explained by the poten-tial competition for carbon flux. These characteristicsalong with the biomass and the GLC related surfacesallowed to describe different output behavioral zones asdescribed on the results section. However it is interestingthat on the surfaces, it is possible to find similar con-sumption rates on opposing sides of the experimentaldesign area with greatly different physiological outputs.Furthermore, the response surfaces morphologies havefar from linear contours along the different physiolog-ical characteristics found on them. This could suggestthe existence of metabolic state multiplicity similar topseudo-stationary ones described by Namjoshi et al. oncontinuous bioreactors [47].The difference on responsesurface behaviors should derive from the dynamic prop-erties, which produce different outcomes depending onthe extracellular and intracellular metabolite concentra-tions and to the non-linearity associated with metabolicregulation [36, 42, 43, 47].For the reasons described above and as the underly-
ing characteristics of the systems were difficult to addressonly with external behavioral response surfaces, dynamic
flux models were constructed. Cybernetic modeling wasused mainly because interaction between cellular auto-regulated and inter-regulated subsystems (DNA, RNA,ENZYME) cannot be mechanistically described but somesystematical characteristics can be approximately mod-eled [31, 48, 49]. Also, it is important to note that ourmedia contains a non fully described compound substrateas YE, which was simplified as describe to only fewmetabolites resulting from its consumption by AR36. Thissimplification could not only impacts the growth phase,but also means that consumption of other YE compo-nents are not fully considered and may modify yieldsand rates. However, it is also noticeable that this sim-plification resulted enough to reasonably describe somebehavioral characteristics on the fluxes found for AR36,which in consequence described the physiological outputswith reasonable accuracy. The latter observed responsesare the results of a matrix made out from the networkof the central carbon metabolism to which mathematicalreduction and yield analysis from the previously deter-mined parameters resulted on 6 elementary modes (EMs)modes for the exponential phase and 3 EMs for the sta-tionary phase, and their combination across time rendersthe output described. This means that model is in essencethe same for all 9 experiments and the approximationwas performed on to the parameters that regulate theircombination across time. Results suggest that with thisEMs an estimated description of metabolic behavior canbe made for the various initial conditions explored. Theusage of the experimental design and surface renderingfor the relative fluxes helps depict the metabolic behaviorof the strain even with the errors described previously onindividual points. Flux surfaces where then correlated tothe physiological characterization as well as for behaviorsknown for this strain on the literature as discussed below.An unusual flux distribution redirecting most of the
GLC derived carbon through PPP was found. This maybe possible on strain AR36 as it has the zwf gene over-expressed by a strong promoter on a high copy numberplasmid [2]. Furthermore, FBA models by Chen et al.(2011)[32] have established that G6Pdh is rate limitingfor PPP flux. Therefore, the high expression of zwf onAR36 strain could in fact be causing this low Pgi fluxdistribution. Despite this, a high total glycolytic flux isstill found as described by Rodriguez et al. 2017 [44] asit was found that the operon-containing plasmid aug-mented the GLC consumption rate. The latter is inagreement to the high relative flux values of 75 to 88%towards PEP and PYR. On the modeled results this waspossible since the high PPP flux was mainly redirectedtrough EDP to G3P and PYR. In this regard, it has beenreported that on pykF mutants (such as AR36), fluxesthrough PPP are increased up to 79% by pgi, pfkA andtpiA down-regulation and zwf, gnd and edd concomitant
Martínez et al. BMC Systems Biology (2018) 12:102 Page 19 of 26
up-regulations [50, 51]. For AR36, a low intracellular levelof fructose-1,6-bisphosphate (FDP) was previously foundby comparative metabolomics and explained as a con-sequence of TktA activity [42, 44]. But with the resultshere obtained it can be suggested that it could also beinfluenced by a high flux deviation into the PPP byG6Pdh . Although pgi mutants have been reported tohave lower growth rates caused by NADPH accumulationredox imbalance, it also has been found that overexpres-sion of NADPH-consuming pathways can recover thegrowth rate [51]. Therefore, in AR36 the high produc-tion of SA, requiring NADPH by aroE coded shikimatedehydrogenase, could be alleviating the NADPH imbal-ance and promoting higher growth rates in the presence ofhigh PPP flux distributions. In this sense, the productionof SA in this strain could act as an important driver of itsown synthesis when the zwf gene is overexpressed along-side the SA biosynthetic genes during growth phase. Incontrast, on the stationary phase although a high PPP fluxdistribution was also found, low EDP flux was also foundwhile high glycolytic PEP producing reactions were main-tained. However this could also be possible since higherfluxes through Tal were found and that could cause higherFDP concentrations compared to the growth phase, sig-naling the up-regulation of the downstream glycolyticgenes [43].These results imply that E4P is the limiting substrate
for SA production even with zwf overexpression and ahigh flux redirection towards the PPP, as previously sug-gested [42–44]. The modeled flux ratio analysis suggestthat sole overexpression of zwf is not sufficient for alle-viating E4P limitation. Therefore, edd and/or eda genescould be attractive deletion targets to avoid undesiredpartitioning of PPP fluxes, along with exerting better con-trol under zwf and gnd overexpression to obtain higherbut controlled flux distributions towards E4P and SA.Following on, PpsA presented a near-zero flux withinall experiments. Considering the PEP overabundance toE4P, it can be deduced that even when ppsA has beenpreviously used as a target to enhance SA production[14, 36, 38, 52, 53], the overexpression of this gene inAR36 may not further increase SA production. Further-more, it is possible that overexpression of ppsA on thisgenetic background could hinder growth and GLC con-sumption by reducing carbon flux towards TCA and otherPEP derived pathways.Also, an unusually high PoxB flux was found in this
strain as consequence of the increased influx towardsPYR. This is supported by the previous findings in otherrelated PTS-deficient strains lacking carbon catabolismrepression, where PoxB has been proposed to be themain AC producing enzyme [33, 36, 38]. Furthermore, anarcA/arcB mutation has been found for this strain lin-eage that could be making PoxB available for expression
on earlier fermentation phases [33, 34, 36, 38, 40]. Otherstudies have also proposed PoxB as the main AC synthe-sizing enzyme under higher growth rates on accelerostatson other E. coli strains [54].Regarding the AckA vs Acs AC consumption flux dis-
tribution, a high up-regulation of acs and poxB genes hasbeen observed to occur as a response to PTS inactivationon this strain, suggesting that carbon cycling on ACoccurs through Acs [36, 38, 40]. Therefore, it is probablethat the model depicted the incorrect or inverse distri-bution around these reactions during growth. Moreover,the AR36 lineage strains does not show the expectedPTS mutant low cAMP concentrations, probably dueto AC cycling through Acs restoring cAMP along withadelynate cylase, which in turn has been also found tobe up-regulated on these PTS− strains during growth[36–38, 40]. It is interesting to find that the EMs used forstationary phase rendered Acs as the principal reactionresponsible for redirecting AC to ACCOA (Fig. 9c and d),probably due to less ATP demand on this phase. Further-more, the combination of the export and import AC sur-faces strongly correlates with the qexpb approximated ACproduction rate on the physiological analysis presentedbefore (Fig. 2i), where high extracellular AC productionis found towards high initial [GLC] and towards high ini-tial [YE]. Since both fluxes are present, it can be proposedthat an AC production/consumption futile cycle couldpotentially be relieving part of the metabolic overflow onthe CCM [33, 36, 37], as has previously been reported tohelp adjusting imbalances between glycolysis and the TCAactivities [43].TCA activity on its part, showed the unexpected IcdA
reverse reaction. This could be attributed to the YEderived GLU entering the TCA through α-ketoglutarate(AKG) by Gdh, but since this compound is used also forbiomass precursor formation, only if it is consumed onexcess it will enter the CCM. This effect could also beincreased by other YE derived amino acids entering CCM.On that regard, reports on complex media have showna tendency to favor extracellular amino acid consump-tion and catabolism through AKG with the concomitantup-regulation of biomass producing pathways [55]. Also,the high GSP and malic enzyme activities suggest thatthis strain counteracts metabolic saturation by trying torelieve the PYR saturation by assimilating more ACCOAthrough lower CCM pathways. This may be the result ofa selective pressure to the high osmotic pressure on thismedia to recover high substrate consumption rates andconsume the highly concentrated substrates faster. In fact,high osmotic stress conditions have been found to incre-ment the GSP activity and to reduce the icdA/aceA codedenzymes ratio, favoring the production of biomass build-ing blocks [56]. Therefore, the high anaplerotic reactions(APR) fluxes along with GSP found also may contribute
Martínez et al. BMC Systems Biology (2018) 12:102 Page 20 of 26
to maintain high biomass and SA production since thiscould help to minimize toxic AC production by ACCOAfast consumption ,along with a response to osmotic pres-sure [43, 56]. This behavior may be expected as with thehigher [GLC] more stress upregulating GSP could be usedto relieve carbon flux from the PYR and ACCOA nodes[33, 36–38, 40, 43]. Furthermore, the excess carbon arriv-ing to MAL then seems to be redirected to PYR andPEP by the previously detailed MaeB, MaeA and PckAreactions. MaeB presents greater fluxes possibly due toconsuming the excess NADPH produced by the high PPPflux conditions [51].Overall, the dynamic cybernetic model approach seems
to unveil behaviors that are in accordance to the physi-ological observations and to the knowledge available forthis laboratory evolved strain lacking the mayor GLCtransport and therefore catabolite repression. The behav-ior of the calculated fluxes surfaces during the growthphase is in agreement with the results obtained with thephysiological surface analysis. Particularly, on many ofthe IE and ME surfaces, critical surface saddle pointsbetween 110–115 g/L of initial [GLC] and between 35–40 g/L of initial [YE] have been found. It is interesting tonotice that 9 EMs were enough to describe all the patternsconformed by the surfaces by only modifying the param-eters which alter their combination across time. Thesechanges, although cannot be used to describe regulatorymechanisms, unveil relevant systems characteristics andinterestingly also suggest the existence of metabolic statemultiplicity derived from changing extracellular condi-tions [47].
ConclusionIn this report we describe a modeling approach for aPTS− laboratory evolved E. coli engineered strain for SAoverproduction [2, 33, 36, 38, 40] to study and character-ize its physiological and metabolic responses to variantcomplex substrate concentration. The constructed mod-els were able to describe in good agreement the individualexperimental fermentations performed with this strain.Three-dimensional response surfaces were constructedwith polynomial equations allowing to morphologicallydescribe the cell output behavior under the experimen-tal conditions. It was found that the production strainresponds differently to initial substrate concentrations,allocating resources in different ways. This was inferredsince regulation along variations from complex mediasubstrate conditions did not affect linearly the perfor-mance of the strain, but showed refined nonlinear bor-ders between predominant outcomes. For these reasonsa dynamic cybernetic model was constructed and theirflux distributions studied and compared to the physiolog-ical models. The constructed dynamic metabolic modelwas able to follow the extracellular experimental behaviors
and three-dimensional response surfaces for relative fluxdistributions were used to unveil insights into the strainmetabolism.Flux distributions helped to explain the previously
observed low intracellular level of fructose-1, 6-bisphosphate (FDP) reports by unveiling a high PPP fluxduring all fermentation processes. MaeB high relativeflux, potentially helps alleviate the NADPH redox imbal-ance caused by NADPH-dependent SA production andcontributes to growth rate recovery [2]. Flux distributionsallocated AC production, GSP and APR with high fluxesto contend with the metabolic stress produced by theconcentrated substrates on media helping to relieve PYRand ACCOA overflow. PoxB was found to be the predom-inant AC production enzymatic reaction on this strainunder high substrate conditions. An AR36�poxB strainwas constructed and cultured showing the loss of growthphase AC peak and along with lower growth, GLC con-sumption rates probably by greater PYR accumulation onthis derivative [33, 36–38, 44]. Model analysis also foundthat edd and/or eda could be targeted for deletion, alongwith a better control under zwf overexpression and gndexpression, to obtain better flux distributions towardsE4P and SA production. Also, ppsA overexpression andother modifications involving higher PEP accumulationmay not improve SA production until E4P limitationis resolved on this strain. Dynamic models were foundto be in accordance to the physiological observationsand the knowledge available for AR36 a PTS− strainlacking catabolite repression, and were useful to allocatepreferential metabolism output zones within the exper-imental design area that correlated in good agreementwith the zones observed during the physiological modelcharacterization.Finally, to assess the utility for SA production enhance-
ment with all the previously described models, a fed-batch fermentation regime was designed. An unusualoperation was employed to maintain initial media con-ditions which would in theory help maintain metabolican physiological conditions. The fed-batch fermentationresulted in a 40% titer and 70% volumetric produc-tivity increases while preserving product and biomassyields. Process presented yield values among the high-est yields reported and presented the highest productivityreported on E. coli AR36. Although reports concerningother strains have shown higher titers [57], this reportwas centered on the mathematical approach to furtherextend E. coli production capabilities. On that matter, themodel implemented in this report is the first approxima-tion to render flux distributions for this E. coli PTS− strainunder high-substrate production conditions and one ofthe first approaches towards modeling E. coli metabolismin complex media containing high concentrations ofGLC and YE.
Martínez et al. BMC Systems Biology (2018) 12:102 Page 21 of 26
MethodsStrain, cultivation and analytical proceduresE. coli AR36 strain constructed by Rodríguez et al. (2013)[2] was used for all experiments and calculations. AR36 isan E. coli PB12 laboratory evolved derivative lacking thephosphoenolpryruvate:carbohydrate phosphotransferasesystem (PTS) [33, 36, 38, 40]. AR36 carries additionalinactivations in aroK, aroL, pykF and lacI genes, andcontains a high copy number plasmid with the strong trcpromoter controlling transcription of a six-gene operoncomposed of genes: aroB, tktA, aroG, aroE, aroD and zwf[2]. This strain is an aromatic amino acid auxotroph andtherefore it must be cultured on supplemented media.Yeast extract (YE) (BD Bacto) and GLC (Fermentas) wereused as nitrogen and carbon sources [2]. All cultureswere performed on 0.5 L working volume bioreactorswith AD 1010 controllers (Applikon). Bioreactors wereoperated as batch processes at 37◦C and 1 vvm aera-tion. Dissolved oxygen tension (DOT) was maintainedabove 20% by an agitation cascade control between 500and 1200 rpm. pH was maintained at 7 by means ofNH4OH and H3PO4 addition. Other media compounds,salts, buffer and antibiotics were used as previouslydescribed [2].Physiological behavior characterization was performed
with a central composite design experimental matrix with3 levels for each substrate source. Experimental con-dition levels were: 75, 100 and 125 g/L for GLC and15, 30 and 45 g/L for YE. Nine experiments were con-ducted with the central point 100 g/L GLC and 30 g/LYE, tested by triplicate to approximate the experimentaldesign standard deviation. Fermentations were sampledevery 2 h during the first 12 h, and every 4 to 6 h afterthis point. Each sample was used to determine biomass,GLC, SA and AC. Biomass was determined by opticaldensity measurements at 600 nm with a DU700 Beck-man spectrophotometer. GLC, SA and AC were deter-mined by HPLC with a Waters equipment(600E qua-ternary pump, 717 automatic injector, 2410 refractionindex an 966 photodiode array detectors) and an aminexHPX-87H column (300 x 7.8 mm; 9 μm), using 5 mMH2SO4 as mobile phase at 50◦C; either UV or refractiveindex detectors were used for qualitative and quantitativedetermination. All measured parameters were volumetri-cally corrected for the acid or base added by pH controlpumps.
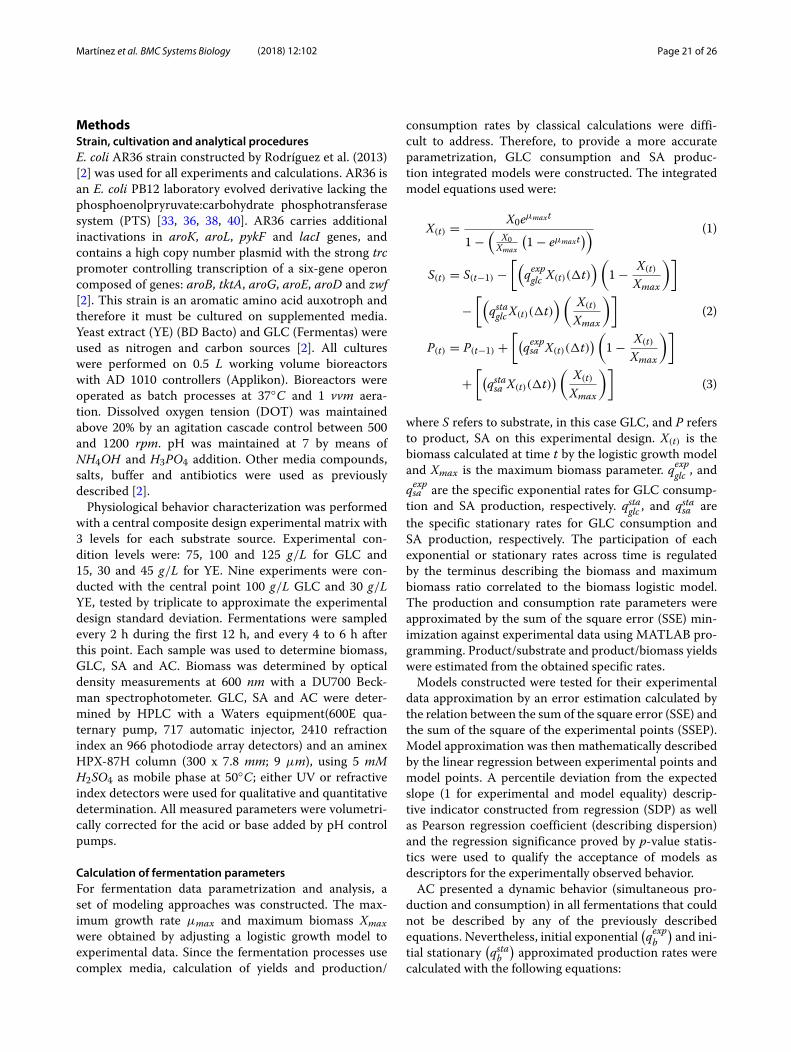
Calculation of fermentation parametersFor fermentation data parametrization and analysis, aset of modeling approaches was constructed. The max-imum growth rate μmax and maximum biomass Xmaxwere obtained by adjusting a logistic growth model toexperimental data. Since the fermentation processes usecomplex media, calculation of yields and production/
consumption rates by classical calculations were diffi-cult to address. Therefore, to provide a more accurateparametrization, GLC consumption and SA produc-tion integrated models were constructed. The integratedmodel equations used were:
X(t) = X0eμmaxt
1 −(
X0Xmax
(1 − eμmaxt
)) (1)
S(t) = S(t−1) −[(
qexpglc X(t)(�t))(
1 − X(t)Xmax
)]
−[(
qstaglc X(t)(�t))(
X(t)Xmax
)](2)
P(t) = P(t−1) +[(qexpsa X(t)(�t)
)(1 − X(t)
Xmax
)]
+[(qstasa X(t)(�t)
)(
X(t)Xmax
)](3)
where S refers to substrate, in this case GLC, and P refersto product, SA on this experimental design. X(t) is thebiomass calculated at time t by the logistic growth modeland Xmax is the maximum biomass parameter. qexpglc , andqexpsa are the specific exponential rates for GLC consump-tion and SA production, respectively. qstaglc , and qstasa arethe specific stationary rates for GLC consumption andSA production, respectively. The participation of eachexponential or stationary rates across time is regulatedby the terminus describing the biomass and maximumbiomass ratio correlated to the biomass logistic model.The production and consumption rate parameters wereapproximated by the sum of the square error (SSE) min-imization against experimental data using MATLAB pro-gramming. Product/substrate and product/biomass yieldswere estimated from the obtained specific rates.Models constructed were tested for their experimental
data approximation by an error estimation calculated bythe relation between the sum of the square error (SSE) andthe sum of the square of the experimental points (SSEP).Model approximation was then mathematically describedby the linear regression between experimental points andmodel points. A percentile deviation from the expectedslope (1 for experimental and model equality) descrip-tive indicator constructed from regression (SDP) as wellas Pearson regression coefficient (describing dispersion)and the regression significance proved by p-value statis-tics were used to qualify the acceptance of models asdescriptors for the experimentally observed behavior.AC presented a dynamic behavior (simultaneous pro-
duction and consumption) in all fermentations that couldnot be described by any of the previously describedequations. Nevertheless, initial exponential
(qexpb
)and ini-
tial stationary(qstab
)approximated production rates were
calculated with the following equations:
Martínez et al. BMC Systems Biology (2018) 12:102 Page 22 of 26
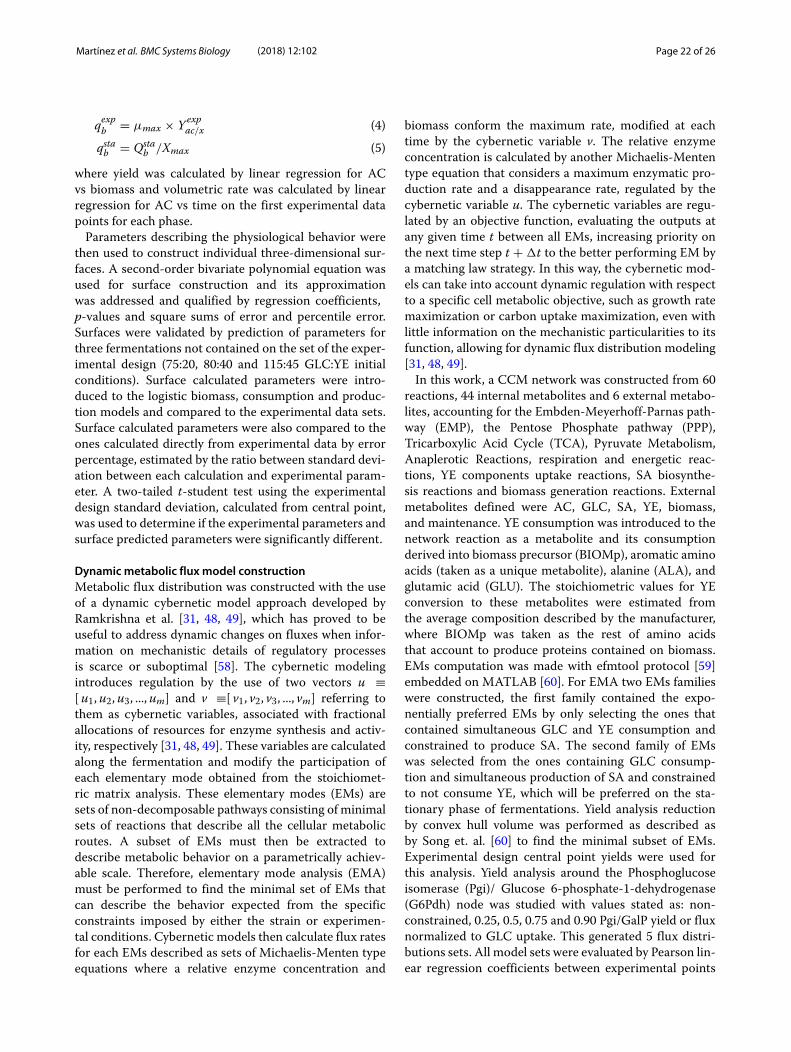
qexpb = μmax × Yexpac/x (4)
qstab = Qstab /Xmax (5)
where yield was calculated by linear regression for ACvs biomass and volumetric rate was calculated by linearregression for AC vs time on the first experimental datapoints for each phase.Parameters describing the physiological behavior were
then used to construct individual three-dimensional sur-faces. A second-order bivariate polynomial equation wasused for surface construction and its approximationwas addressed and qualified by regression coefficients,p-values and square sums of error and percentile error.Surfaces were validated by prediction of parameters forthree fermentations not contained on the set of the exper-imental design (75:20, 80:40 and 115:45 GLC:YE initialconditions). Surface calculated parameters were intro-duced to the logistic biomass, consumption and produc-tion models and compared to the experimental data sets.Surface calculated parameters were also compared to theones calculated directly from experimental data by errorpercentage, estimated by the ratio between standard devi-ation between each calculation and experimental param-eter. A two-tailed t-student test using the experimentaldesign standard deviation, calculated from central point,was used to determine if the experimental parameters andsurface predicted parameters were significantly different.
Dynamic metabolic flux model constructionMetabolic flux distribution was constructed with the useof a dynamic cybernetic model approach developed byRamkrishna et al. [31, 48, 49], which has proved to beuseful to address dynamic changes on fluxes when infor-mation on mechanistic details of regulatory processesis scarce or suboptimal [58]. The cybernetic modelingintroduces regulation by the use of two vectors u ≡[u1,u2,u3, ...,um] and v ≡[ v1, v2, v3, ..., vm] referring tothem as cybernetic variables, associated with fractionalallocations of resources for enzyme synthesis and activ-ity, respectively [31, 48, 49]. These variables are calculatedalong the fermentation and modify the participation ofeach elementary mode obtained from the stoichiomet-ric matrix analysis. These elementary modes (EMs) aresets of non-decomposable pathways consisting of minimalsets of reactions that describe all the cellular metabolicroutes. A subset of EMs must then be extracted todescribe metabolic behavior on a parametrically achiev-able scale. Therefore, elementary mode analysis (EMA)must be performed to find the minimal set of EMs thatcan describe the behavior expected from the specificconstraints imposed by either the strain or experimen-tal conditions. Cybernetic models then calculate flux ratesfor each EMs described as sets of Michaelis-Menten typeequations where a relative enzyme concentration and
biomass conform the maximum rate, modified at eachtime by the cybernetic variable v. The relative enzymeconcentration is calculated by another Michaelis-Mententype equation that considers a maximum enzymatic pro-duction rate and a disappearance rate, regulated by thecybernetic variable u. The cybernetic variables are regu-lated by an objective function, evaluating the outputs atany given time t between all EMs, increasing priority onthe next time step t + �t to the better performing EM bya matching law strategy. In this way, the cybernetic mod-els can take into account dynamic regulation with respectto a specific cell metabolic objective, such as growth ratemaximization or carbon uptake maximization, even withlittle information on the mechanistic particularities to itsfunction, allowing for dynamic flux distribution modeling[31, 48, 49].In this work, a CCM network was constructed from 60
reactions, 44 internal metabolites and 6 external metabo-lites, accounting for the Embden-Meyerhoff-Parnas path-way (EMP), the Pentose Phosphate pathway (PPP),Tricarboxylic Acid Cycle (TCA), Pyruvate Metabolism,Anaplerotic Reactions, respiration and energetic reac-tions, YE components uptake reactions, SA biosynthe-sis reactions and biomass generation reactions. Externalmetabolites defined were AC, GLC, SA, YE, biomass,and maintenance. YE consumption was introduced to thenetwork reaction as a metabolite and its consumptionderived into biomass precursor (BIOMp), aromatic aminoacids (taken as a unique metabolite), alanine (ALA), andglutamic acid (GLU). The stoichiometric values for YEconversion to these metabolites were estimated fromthe average composition described by the manufacturer,where BIOMp was taken as the rest of amino acidsthat account to produce proteins contained on biomass.EMs computation was made with efmtool protocol [59]embedded on MATLAB [60]. For EMA two EMs familieswere constructed, the first family contained the expo-nentially preferred EMs by only selecting the ones thatcontained simultaneous GLC and YE consumption andconstrained to produce SA. The second family of EMswas selected from the ones containing GLC consump-tion and simultaneous production of SA and constrainedto not consume YE, which will be preferred on the sta-tionary phase of fermentations. Yield analysis reductionby convex hull volume was performed as described asby Song et. al. [60] to find the minimal subset of EMs.Experimental design central point yields were used forthis analysis. Yield analysis around the Phosphoglucoseisomerase (Pgi)/ Glucose 6-phosphate-1-dehydrogenase(G6Pdh) node was studied with values stated as: non-constrained, 0.25, 0.5, 0.75 and 0.90 Pgi/GalP yield or fluxnormalized to GLC uptake. This generated 5 flux distri-butions sets. All model sets were evaluated by Pearson lin-ear regression coefficients between experimental points
Martínez et al. BMC Systems Biology (2018) 12:102 Page 23 of 26
and model points, slope deviation and their significancewas proved by p-value statistics and error. The set withbetter behavior to experimental data was used for fur-ther analysis. Reduced EMs reaction rates were describedby sets of Michaelis-Menten equations modified to cou-ple families to each fermentation phase (exponential orstationary) by a terminus similar to the physiological con-sumption/production models described before, and withan added terminus to represent AC inhibition. Model rateequations were constructed as follow:
rMi =(kMmax,i[GLC](t)KMm,i+[GLC](t)
) (1 + [AC](t)
KacI
)−1 (1 − X(t)
Xmax
)
(6)
rGi =(kGmax,i[GLC](t)KGm,i+[GLC](t)
) (1 + [AC](t)
KacI
)−1 (X(t)Xmax
)
(7)
where indexes M and G refer to the exponential (mixedconsumption) family and stationary (glucose only con-sumption) family, respectively. Index i refers to each ithEM of each family, Kmax and Km are the Michaelis-Menten parameters, Kac
I is the inhibition coefficient andXmax refers to the maximum biomass calculated fromthe previously calculated logistic growth model for eachexperimental point. [GLC](t), [AC](t), X(t) refer to theGLC, AC and biomass concentrations at each time t inmmol/L for the first two and g/L for the biomass. Ini-tial relative enzyme concentration ratio was set to 0.95 forthe first EM, 0.5 for the EMs remaining of the exponen-tial family, and 0.1 for the EMs of the stationary family.These values were set in this way as the first EM was theone that comprised AC production and was inferred tobe the initially preferred one, due to the observed rapidincrease in extracellular AC acid at the initial phases forall fermentations. In addition, EMs of the second fam-ily were chosen to be smaller as they are expected to bemore relevant at later stages of fermentation. All othercybernetic model parameters for enzyme production anddecay rates were set as described by Ramkrishna et al.[31, 48, 58, 60]. Flux rate equation parameters Kmax andKm were approximated with a genetic algorithm (Addi-tional file 2). Briefly, the Matlab algorithm started withassigning Kmax and Km initial values of 1 and 10, respec-tively for every EM. Then, by perturbation of one param-eter at a time by a random numeric factor, 18 parame-ter sets were obtained. Subsequently, the sets were usedfor 200 step SSE driven nonlinear numeric minimizationalgorithms to generate new daughterKmax andKm param-eter model sets. From these daughter models, the set withthe lowest SSE was extracted and crossed with the sec-ond lowest SSE set by acquiring the value of its perturbedparameter (Kmax or Km). This inter-crossed set passed
onto the next generation where another round of individ-ual parameter perturbations wasmade. The algorithmwascycled until SSE was found constant (less than 20 cyclesin all cases). Finally, these parameters were subjected toa final SSE nonlinear numeric minimization to model theflux rates of each EM and the final metabolic dynamic fluxmodel for each fermentation.Flux distributions were used to construct three-
dimensional behavioral surfaces with the second ordertwo variable polynomial equation at three fermentationtimes: initial exponential (IEx), mid exponential (MEx)and mid stationary (MSt). Calculation of MEx time wasmade by obtaining the maximum point of the secondderivative vs. time for each biomass model, IEx was set asthe mid time between t = 0 and MEx time, and MSt asthe middle point between the end of the fermentation andthe initial time of stationary phase. Constructed surfaceswere statistically qualified and used to analyze and studythe behavior of strain metabolism and SA production.
Bioprocess design for SA productivity enhancement onstrain AR36To assess the utility of the metabolic models developed,a fermentation process was designed with the informa-tion acquired by physiological models and flux distribu-tion surfaces to optimize SA productivity. Process wasdesigned to maintain constant the initial GLC:YE con-ditions. This would in theory, maintain constant thecybernetic variables (which are a representation of theregulation parameters) and therefore the internal flux dis-tributions accordingly. Initial conditions around 80:40 g/LGLC:YE were used. A pseudo-exponential flux was oper-ated and regulated by a peristaltic pump manually setevery 15 min to calculated exponential feeding needs,with measured GLC and calculated growth and consump-tion rates. Feed consisted on two simultaneously addedsolutions, one containing mineral media with GLC 400g/L and the second containing phosphate buffer solutionwith YE at 400 g/L. After 12 h, the feed was stoppedand the fermentation was allowed to enter stationaryphase to consume the remaining GLC. Oxygen was addedwhen needed tomaintain dissolved oxygen tension (DOT)over 20% along with an agitation cascade. Other mediacompounds, salts, buffer and antibiotics were used asdescribed by Rodriguez et. al. [2] and added through thefeeding solutions to avoid dilution.
Additional files
Additional file 1: Model and validation data, parameters and statisticalvalues. Description: Parameters and statistical value tables for physiologicalmodels. Response surface parameters and statistical values for thepolynomial approximation. Response surface prediction validation data.Response surface critical points calculations. Dynamic Flux modelsparameters and statistics. (PDF 186 kb)
Martínez et al. BMC Systems Biology (2018) 12:102 Page 24 of 26
Additional file 2: Metabolic network definition for dynamic model.Description: Definition of reactions, internal and external metabolitescomprehending the metabolic network. Matlab program section for thegenetic algorithm used for parameter approximation. (PDF 173 kb)
Additional file 3: Response surfaces and contour plots for all fluxes.Description: Response surfaces and contour plots for all reactions detailedon the metabolic network for initial exponential, mid exponential and midstationary fermentation stages. (PDF 25,629 kb)
Additional file 4: Strains, plasmids and oligonucleotides used on thiswork, AR36 poxB− figures. Description: Table for all plasmids andoligonucleotides used. AR36�poxB strain construction. Fermentationprofiles for AR36�poxB and AR36 on highly concentrated substrate media.(PDF 215 kb)
AcknowledgmentsWe would like to thank Professor Doriswami Ramkrishna and Dr. Huyn-SeobSong for kindly providing the software and knowledge used in this work andfor their support and fruitful discussions. Thanks to Dr. Adelfo Escalante for thehelp on the construction of this manuscript. Also, thankes to GeorginaHernández and Ramón de Anda for their technical support.
FundingThis work was supported by Consejo Nacional de Ciencia y Tecnología(CONACYT, México) Ciencia Básica grant 240519 and DGAPA-PAPIIT UNAM,México grant IN209618.
Availability of data andmaterialsThe data generated or analyzed during this study are included in thispublished article [and its supplementary information files] or available fromthe corresponding author on reasonable request.
Authors’ contributionsJAM, NF, OTR, ARL, GG and FB contributed to the conceptual creation,methods design, interpretation and critical evaluation and discussion of theresults presented in this report. Fermentation experiments planning, anddesign were carried out by JAM, ARL and OTR. All fermentation experimentswere executed by JAM, except for the fed-batch fermentation, which wasperformed by JAM and AR. Molecular biology and strain design was performedby AR, GG, NF and FB. Data analysis and parameter calculations wereperformed by JAM along with ARL and OTR. JAM designed the models andimplemented the genetic algorithm. JAM and FM constructed and evaluatedAR36 �poxB with the support of NF. JAM wrote the manuscript with thesupport of AR, ARL, NF, OTR, GG and FB, who critically revised the results of thisreport. All authors have read and approved the final version of manuscript.
Ethics approval and consent to participateNot Applicable.
Consent for publicationNot Applicable.
Competing interestsThe authors declare that they have no competing interests.
Publisher’s NoteSpringer Nature remains neutral with regard to jurisdictional claims inpublished maps and institutional affiliations.
Author details1Departamento de Ingeniería Celular y Biocatálisis, Instituto de Biotecnología,Universidad Nacional Autónoma de México (UNAM), Avenida Universidad2001, Colonia Chamilpa, 62210 Cuernavaca, Morelos, México. 2Departamentode Ciencias Naturales, Universidad Autonoma Metropolitana (UAM),Vasco deQuiroga 4871, Colonia Santa Fe Cuajimalpa, 05348 Delegación Cuajimalpa deMorelos, México D.F., Mexico. 3Departamento de Medicina Molecular yBioprocesos, Instituto de Biotecnología, Universidad Nacional Autónoma deMéxico, Avenida Universidad 2001, Colonia Chamilpa, 62210 Cuernavaca,Morelos, México.
Received: 25 April 2018 Accepted: 12 October 2018
References1. Patnaik R, Spitzer RG, Liao JC. Pathway engineering for production of
aromatic in Escherichia coli: Confirmation of stoichiometric analysis byindependent modulation of arog, tkta, and pps activities. Biotech Bioeng.1995;46:361–70. https://doi.org/doi:10.1002/bit.260460409.
2. Rodriguez A, Martínez JA, Báez-Viveros JL, Flores N, Hernández-ChávezG, Ramírez OT, Gosset G, Bolivar F. Constitutive expression of selectedgenes from the pentose phosphate and aromatic pathways increases theshikimic acid yield in high-glucose batch cultures of an Escherichia colistrain lacking pts and pykF. Microb Cell Factories. 2013;12:1–16. https://doi.org/doi:0.1186/1475-2859-12-86.
3. Bongaerts J, Krämer M, Müller U, Raeven L, Wubbolts M. Metabolicengineering for microbial production of aromatic amino acids andderived compounds. Metab Eng. 2001;3:289–300. https://doi.org/doi:10.1006/mben.2001.0196.
4. Yi J, Li K, Draths KM, Frost JW. Modulation of phosphoenolpyruvatesynthase expression increases shikimate pathway product yields in E. coli.Biotechnol Prog. 2002;18:1141–8. https://doi.org/doi:10.1021/bp020101w.
5. Chandran SS, Yi J, Draths KM, von Daeniken R, Weber W, Frost JW.Phosphoenolpyruvate availability and the biosynthesis of shikimic acid.Biotechnol Prog. 2003;19:808–14. https://doi.org/doi:10.1021/bp025769p.
6. Báez-Viveros JL, Osuna J, Hernández-Chávez G, Soberon X, Bolivar F,Gosset G. Metabolic engineering and protein directed evolution increasethe yield of l-phenylalanine synthesized from glucose in Escherichia coli.Biotech Bioeng. 2004;87:516–24. https://doi.org/doi:10.1002/bit.20159.
7. Gosset G. Production of aromatic compounds in bacteria. Curr OpinBiotechnol. 2009;20:651–8. https://doi.org/doi:0.1016/j.copbio.2009.09.012.
8. Estévez AM, Estévez RJ. A short overview on the medicinal chemistry of(-)shikimic acid. Mini-Rev Med Chem. 2012;12:1443–54. https://doi.org/doi:10.2174/138955712803832735.
9. Quiroz DD, Carmona S, Bolívar F, Escalante A. Current perspectives onapplications of shikimic and aminoshikimic acids in pharmaceuticalchemistry. Res Rep Med Chem. 2014;4:35–46. https://doi.org/doi:10.2147/RRMC.S46560.
10. Li S, Yuan W, Wang P, Zhang Z, Zhang W, Ownby S. Method for RheExtraction and Purification of Shikimic Acid; 2007, p. 20070149805A1.
11. Raghavendra TR, Vaidyanathan P, Swathi HK, Ravikanth G, GaneshiahKN, Srikrishna A, Shaanker RU. Prospecting for alternate sources ofshikimic acid, a precursor of tamiflu, a bird-flu drug. Curr Sci. 2009;96:771–2. Scientific Correspondence.
12. Wang G-W, Hu W-T, Huang B-K, Qin L-P. Illicium verum: A review on itsbotany, traditional use, chemistry and pharmacology. J Ethnopharmacol.2011;136:10–20. https://doi.org/doi:10.1016/j.jep.2011.04.051.
13. Ghosh S, Chisti Y, Banerjee UC. Production of shikimic acid. Biotechnol Adv.2012;30:1425–31. https://doi.org/doi:10.1016/j.biotechadv.2012.03.001.
14. Martínez JA, Bolívar F, Escalante A. Shikimic acid production inEscherichia coli: from classical metabolic engineering strategies to omicsapplied to improve its production. Front Bioeng Biotechnol. 2015;3:1–16.https://doi.org/doi:10.3389/fbioe.2015.00145.
15. Krämer M, Bongaerts J, Bovenberg R, Kremer S, Müler U, Org S,Wubbolts M, Raeven L. Metabolic engineering for microbial productionof shikimic acid. Metab Eng. 2003;5:277–83. https://doi.org/doi:10.1016/j.ymben.2003.09.001.
16. Biggs BW, Paepe BD, Santos CNS, Mey MD, Ajikumar PK. Multivariatemodular metabolic engineering for pathway and strain optimization. CurrOpin Biotechnol. 2014;29:156–62. https://doi.org/doi:10.1016/j.copbio.2014.05.005.
17. Cloots L, Marchal K. Network-based funcional modeling of genomics,transcriptomics and metabolism in bacteria. Curr Opin Microbiol. 2011;14:599–607. https://doi.org/doi:10.1016/j.mib.2011.09.003.
18. Fong SS. Computational approaches to metabolic engineering utilizingsystems biology and synthetic biology. Comput Struct Biotechnol J.2014;11:28–34. https://doi.org/doi:10.1016/j.csbj.2014.08.005.
19. Akesson M, Forster J, Nielsen J. Integration of gene expression data intogenome-scale metabolic models. Metab Eng. 2004;6:284–93. https://doi.org/doi:10.1016/j.ymben.2003.12.002.
Martínez et al. BMC Systems Biology (2018) 12:102 Page 25 of 26
20. Stelling J. Mathematical models in microbial systems biology. Curr OpinMicrobiol. 2004;7:513–8. https://doi.org/doi:10.1016/j.mib.2004.08.004.
21. Kim TY, Sohn SB, Kim YB, Kim WJ, Lee SY. Recent advances inreconstruction and applications of genome-scale metabolic models. CurrOpin Biotechnol. 2012;23:617–23. https://doi.org/doi:10.1016/j.copbio.2011.10.007.
22. Covert MW, Schilling CH, Famili I, Edwards JS, Goryanin II, Selkov E,Palsson BO. Metabolic modeling of microbial strains in silico. TrendsBiochem Sci. 2001;26:179–86. https://doi.org/doi:10.1016/S0968-0004(00)01754-0.
23. Price ND, Papin JA, Schilling CH, Palsson BO. Genome-scale in microbialin silicomodels: the constraints-based approach. Trends Biotechnol.2003;21:162–9. https://doi.org/doi:10.1016/S0167-7799(03)00030-1.
24. Jouhten P. Metabolic modelling in the development of cell factories bysynthetic biology. Comput Struct Biotechnol J. 2012;3:201210009. https://doi.org/doi:10.5936/csbj.201210009.
25. Patil KR, Akesson M, Nielsen J. Use of genome-scale microbial models formetabolic engineering. Curr Opin Biotechnol. 2004;15:64–9. https://doi.org/doi:10.1016/j.copbio.2003.11.003.
26. Schuetz R, Kuepfer L, Sauer U. Systematic evaluation of objectivefunctions for predicting intracellular fluxes in Escherichia coli. Mol Syst Biol.2007;3:1–15. https://doi.org/doi:10.1038/msb4100162.
27. Machado D, Herrgard M. Systematic evaluation of methods forintegration of transcriptomic data into constraint-based models ofmetabolism. PLoS Comput Biol. 2014;10:1003580. https://doi.org/doi:10.1371/journal.pcbi.1003580.
28. Saha R, Chowdhury A, Maranas CD. Recent advances in thereconstruction of metabolic models and integration of omics data. CurrOpin Biotechnol. 2014;29:39–45. https://doi.org/doi:10.1016/j.copbio.2014.02.011.
29. Long MR, Ong WK, Reed JL. Computational methods in metabolicengineering for strain design. Curr Opin Biotechnol. 2015;34:135–41.https://doi.org/doi:0.1016/j.copbio.2014.12.019.
30. OBrien EJ, Palsson BO. Computing the functional proteome: recentprogress and future prospects for genome-scale models. Curr Opin Biotechnol.2015;34:125–34. https://doi.org/doi:10.1016/j.copbio.2014.12.017.
31. Ramkrishna D, Song H-S. Dynamic models of metabolism: Review of thecybernetic approach. Bioeng, Food, Nat Prod. 2012;58:986–97. https://doi.org/doi:10.1002/aic.13734.
32. Chen PT, Chiang C-J, Wang J-Y, Lee M-Z, Chao Y-P. Genomicengineering of Escherichia coli for production of intermediate metabolitesin the aromatic pathwaty. J Taiwan Inst Chem Eng. 2011;42:34–40.https://doi.org/doi:10.1016/j.jtice.2010.03.010.
33. Flores S, Gosset G, Flores N, de Graaf AA, Bolívar F. Analysis of carbonmetabolism in Escherichia coli strains with an inactive phosphotransferasesystem by 13c labeling and nmr spectroscopy. Metab Eng. 2002;4:124–37.https://doi.org/doi:10.1006/mben.2001.0209.
34. Oh AJ, Lee HW, Saha R, Park MS, Joon Kj, Lee D-Y. Exploring the effectsof carbon sources on the metabolic capacity for shikimic acid productionin Escherichia coli using in silico metabolic predictions. J MicrobiolBiotechnol. 2008;18:1773–84. https://doi.org/doi:10.4014/jmb.0700.705.
35. Rizk ML, Liao JC. Ensemble modeling for aromatic production inEscherichia coli. PLoS ONE. 2009;4:6903. https://doi.org/doi:10.1371/journal.pone.0006903.
36. Flores N, Flores S, Escalante A, de Anda R, Leal L, Malpica R, Georgellis D,Gosset G, Bolívar F. Adaptation for fast growth on glucose by differentialexpression of central carbon metabolism and gal regulon genes in anEscherichia coli strain lacking the phosphoenolpyruvate: carbohydratephosphotransferase system. Metab Eng. 2005;7:70–87. https://doi.org/doi:10.1016/j.ymben.2004.10.002.
37. Sigala JC, Flores S, Flores N, Aguilar C, de Anda R, gosset G, Bolívar F.Acetate metabolism in Escherichia coli strains lackingphosphoenlpyruvate: carbohydrate phosphotransferase system;evidence of carbon recycling strategies and futile cycles. J Mol MicrobiolBiotechnol. 2008;16:224–35. https://doi.org/doi:10.1159/000151219.
38. Flores N, de Anda R, Flores S, Escalante A, Hernández G, Martínez A,Ramírez OT, Gosset G, Bolívar F. Role of pyruvate oxidase in Escherichiacoli strains lacking the phosphoenolpyruvate: carbohydratephosphotransferase system. J Mol Microbiol Biotechnol. 2004;8:209–21.https://doi.org/doi:10.1159/000086702.
39. Causey TB, Shanmugam KT, Yomano LP, Ingram LO. EngineeringEscherichia coli for efficient conversion of glucose to pyruvate. Proc NatlAcad Sci U S A. 2004;8:2235–40. https://doi.org/doi:10.1073/pnas.0308171100.
40. Aguilar C, Escalante A, Flores N, de Anda R, Riveros-Mckay F, Gosset G,Morett E, Bolívar F. Genetic changes during a laboratory adaptiveevolution process that allowed fast growth in glucose to an Escherichiacoli strain lacking the major glucose transport system. BMC Genomics.2012;13:1–17. https://doi.org/doi:10.1186/1471-2164-13-385.
41. Rodriguez A, Martínez JA, Flores N, Escalante A, Gosset G, Bolivar F.Engineering Escherichia coli to overproduce aromatic amino acids andderived compounds. Microb Cell Factories. 2014;13:1–15. https://doi.org/doi:10.1186/s12934-014-0126-z.
42. Martínez K, de Anda R, Hernández G, Escalante A, Ramírez O, Bolívar F.Coutilization of glucose and glycerol enhances the production ofaromatic compounds in an Escherichia coli strain lacking thephosphoenolpyruvate: carbohydrate phosphotransferase system. MicrobCell Factories. 2008;22:1–12. https://doi.org/doi:10.1186/1475-2859-7-1.
43. Matsuoka Y, Shimizu K. A new insight into the main metabolic regulationof Escherichia coli based on systems biology approach. 12th IFAC SympComput Appl Biotechnol. 2013;12:16–8.
44. Rodriguez A, Martínez JA, Millard P, Gosset G, Portais J-C, Létisse F,Bolívar F. Plasmid-encoded biosynthetic genes alleviate metabolicdisadvantages while increasing glucose conversion to shikimate in anengineered Escherichia coli strain. Biotech Bioeng. 2017;114:1319–30.https://doi.org/doi:10.1002/bit.26264.
45. Lara AR, Caspeta L, Gosset G, Bolivar F, Ramírez OT. Utility of anEscherichia coli strain engineered in the substrate uptake system forimproved culture performance at high glucose and cell concentrations:An alternative to fed-batch cultures. Biotech Bioeng. 2007;99:893–901.https://doi.org/doi:10.1002/bit.21664.
46. Luli G, Stohl W. Comparison of growth, acetate production, and acetateinhibition of Escherichia coli strains in batch and fed-batch fermentations.Appl Environ Microbiol. 1990;4:1004–11. https://doi.org/doi:0099-2240/90/041004-08\protect\T1\textdollar02.00/0.
47. Namjoshi AA, Ramkrishna D. Multiplicity and stability of steady states incontinuous bioreactors: Dissection of cybernetic models. Chem Eng Sci.2001;56:5593–607. https://doi.org/doi:10.1016/S0009-2509(01)00166-X.
48. Kompala DS, Ramkrishna D, Jansen NB, Tsao GT. Investigation ofbacterial growth on mixed substrates: Experimental evaluation ofcybernetic models. Biotech Bioeng. 1986;28:1044–55. https://doi.org/doi:10.1002/bit.260280715.
49. Varner J, Ramkrishna D. The non-linear analysis of cybernetic models.guidelines for model formulation. J Biotechnol. 1999;71:67–104. https://doi.org/doi:10.1016/S0168-1656(99)00016-4.
50. Siddiquee KAZ, Arauzo-bravo MJ, Shimizu K. Effect of a pyruvate kinase(pykF-gene) knockout mutation on the control of gene expression andmetabolic fluxes in Escherichia coli. FEMS Microbiol Lett. 2004;235:25–33.https://doi.org/doi:10.1016/j.femsle.2004.04.004.
51. Kabir MM, Shimizu K. Gene expression patterns for metabolic pathway inpgi knockout Escherichia coli with and without phb genes based on rt-pcr.J Biotechnol. 2003;105:11–31. https://doi.org/doi:10.1016/S0168-1656(03)00170-6.
52. Cui Y-Y, Ling C, Zhang Y-Y, Huang J, Liu J-Z. Production of shikimic acidfrom Escherichia coli through chemically inducible chromosomalevolution and cofactor metabolic engineering. Microb Cell Factories.2014;13:1–11. https://doi.org/doi:10.1186/1475-2859-13-21.
53. Chen X, Li M, Zhou L, Shen W, Algasan G, Fan Y, Wang Z. Metabolicengineering of Escherichia coli for improving shikimate synthesis fromglucose. Bioresour Technol. 2014;166:64–71. https://doi.org/doi:10.1016/j.biortech.2014.05.035.
54. Nahku R, Valgepea K, Lahtve P-J, Erm S, Abner K, Adamberg K, Vilu R.Specific growth rate dependent transcriptome profiling of Escherichia colik12 mg16555 in accelerostat cultures. J Biotechnol. 2010;145:60–5.https://doi.org/doi:10.1016/j.jbiotec.2009.10.007.
55. Lyubetskaya AV, Rubanov LI, Gelfand MS. Use of the flux model of aminoacid metabolism of Escherichia coli. Biochem. 2006;71:1256–60.
56. Arense P, Bernal V, Iborra JL, Cánovas M. Metabolic adaptation ofEscherichia coli to long-term exposure to salt stress. Process Biochem.2010;45:1495–67. https://doi.org/doi:10.1016/j.procbio.2010.05.022.
Martínez et al. BMC Systems Biology (2018) 12:102 Page 26 of 26
57. Takahisa K, Takeshi K, Masako S, Kazumi H, Masayuki I. Metabolicengineering of Corynebacterium glutamicum for shikimateoverproduction by growth-arrested cell reaction. Metab Eng. 2016;38:204–16. https://doi.org/doi:10.1016/j.ymben.2016.08.005.
58. Song H-S, Ramkrishna D. Prediction of dynamic behavior of mutantstrains from limited wild-type data. Metab Eng. 2012;14:69–80. https://doi.org/doi:10.1016/j.ymben.2012.02.003.
59. Terzer M, Stelling J. Large-scale computation of elementary flux modeswith bit pattern trees. Bioinformatics. 2008;24:2229–35. https://doi.org/doi:10.1093/bioinformatics/btn401.
60. Song H-S, Ramkrishna D. Reduction of a set of elementary modes usingyield analysis. Biotech Bioeng. 2009;102:554–68. https://doi.org/doi:10.1002/bit.22062.
Related Documents

![Lecture [3] : Surface Modeling€¦ · Lecture [3] : Surface Modeling. Surface model ... Therefore, this type of surface representation is called nonparametric representation. The](https://static.cupdf.com/doc/110x72/5eb5ad6f8eb1025587244fa4/lecture-3-surface-modeling-lecture-3-surface-modeling-surface-model-.jpg)


