Mesquita et al. Microb Cell Fact (2019) 18:150 https://doi.org/10.1186/s12934-019-1198-6 RESEARCH Metabolic fluxes-oriented control of bioreactors: a novel approach to tune micro-aeration and substrate feeding in fermentations Thiago José Barbosa Mesquita 1 , Cíntia Regina Sargo 2 , José Roberto Fuzer Neto 1 , Sheyla Alexandra Hidalgo Paredes 1 , Roberto de Campos Giordano 1 , Antonio Carlos Luperni Horta 1 and Teresa Cristina Zangirolami 1* Abstract Background: Fine-tuning the aeration for cultivations when oxygen-limited conditions are demanded (such as the production of vaccines, isobutanol, 2–3 butanediol, acetone, and bioethanol) is still a challenge in the area of biore- actor automation and advanced control. In this work, an innovative control strategy based on metabolic fluxes was implemented and evaluated in a case study: micro-aerated ethanol fermentation. Results: The experiments were carried out in fed-batch mode, using commercial Saccharomyces cerevisiae, defined medium, and glucose as carbon source. Simulations of a genome-scale metabolic model for Saccharomyces cerevisiae were used to identify the range of oxygen and substrate fluxes that would maximize ethanol fluxes. Oxygen supply and feed flow rate were manipulated to control oxygen and substrate fluxes, as well as the respiratory quotient (RQ). The performance of the controlled cultivation was compared to two other fermentation strategies: a conventional “Brazilian fuel-ethanol plant” fermentation and a strictly anaerobic fermentation (with ultra-pure nitrogen used as the inlet gas). The cultivation carried out under the proposed control strategy showed the best average volumetric ethanol productivity (7.0 g L −1 h −1 ), with a final ethanol concentration of 87 g L −1 and yield of 0.46 g ethanol g −1 substrate . The other fermentation strategies showed lower yields (close to 0.40 g ethanol g −1 substrate ) and ethanol productivity around 4.0 g L −1 h −1 . Conclusion: The control system based on fluxes was successfully implemented. The proposed approach could also be adapted to control several bioprocesses that require restrict aeration. Keywords: Metabolic flux control, Micro-aeration, Bioreactor advanced control, Alcoholic fermentation, Saccharomyces cerevisiae © The Author(s) 2019. This article is distributed under the terms of the Creative Commons Attribution 4.0 International License (http://creativecommons.org/licenses/by/4.0/), which permits unrestricted use, distribution, and reproduction in any medium, provided you give appropriate credit to the original author(s) and the source, provide a link to the Creative Commons license, and indicate if changes were made. The Creative Commons Public Domain Dedication waiver (http://creativecommons.org/ publicdomain/zero/1.0/) applies to the data made available in this article, unless otherwise stated. Introduction e performance of bioreactors depends on the control of several cultivation conditions (e.g.: pH, temperature, dis- solved oxygen), in order to direct cell metabolism towards the improvement in yield, selectivity, and productivity of the target product. For example, the control of the oxy- gen supply to facultative microorganisms plays a key role in driving metabolic routes towards the production of biomass (favored under aerobic conditions) or the syn- thesis of some fermentative products (favored by low or zero oxygen availability) [1]. Conventional strategies in aerobic processes are essen- tially based on measurements of the dissolved oxygen concentration (DOC), which is then controlled by adjust- ing the stirrer speed and, occasionally, the composition of Open Access Microbial Cell Factories *Correspondence: [email protected] 1 Graduate Program of Chemical Engineering, Federal University of São Carlos (PPGEQ-UFSCar), Rodovia Washington Luís, Km 235, São Carlos, SP 13565-905, Brazil Full list of author information is available at the end of the article

Welcome message from author
This document is posted to help you gain knowledge. Please leave a comment to let me know what you think about it! Share it to your friends and learn new things together.
Transcript
Mesquita et al. Microb Cell Fact (2019) 18:150 https://doi.org/10.1186/s12934-019-1198-6
RESEARCH
Metabolic fluxes-oriented control of bioreactors: a novel approach to tune micro-aeration and substrate feeding in fermentationsThiago José Barbosa Mesquita1 , Cíntia Regina Sargo2, José Roberto Fuzer Neto1, Sheyla Alexandra Hidalgo Paredes1, Roberto de Campos Giordano1, Antonio Carlos Luperni Horta1 and Teresa Cristina Zangirolami1*
Abstract
Background: Fine-tuning the aeration for cultivations when oxygen-limited conditions are demanded (such as the production of vaccines, isobutanol, 2–3 butanediol, acetone, and bioethanol) is still a challenge in the area of biore-actor automation and advanced control. In this work, an innovative control strategy based on metabolic fluxes was implemented and evaluated in a case study: micro-aerated ethanol fermentation.
Results: The experiments were carried out in fed-batch mode, using commercial Saccharomyces cerevisiae, defined medium, and glucose as carbon source. Simulations of a genome-scale metabolic model for Saccharomyces cerevisiae were used to identify the range of oxygen and substrate fluxes that would maximize ethanol fluxes. Oxygen supply and feed flow rate were manipulated to control oxygen and substrate fluxes, as well as the respiratory quotient (RQ). The performance of the controlled cultivation was compared to two other fermentation strategies: a conventional “Brazilian fuel-ethanol plant” fermentation and a strictly anaerobic fermentation (with ultra-pure nitrogen used as the inlet gas). The cultivation carried out under the proposed control strategy showed the best average volumetric ethanol productivity (7.0 g L−1 h−1), with a final ethanol concentration of 87 g L−1 and yield of 0.46 gethanol g
−1substrate.
The other fermentation strategies showed lower yields (close to 0.40 gethanol g−1substrate) and ethanol productivity around
4.0 g L−1 h−1.
Conclusion: The control system based on fluxes was successfully implemented. The proposed approach could also be adapted to control several bioprocesses that require restrict aeration.
Keywords: Metabolic flux control, Micro-aeration, Bioreactor advanced control, Alcoholic fermentation, Saccharomyces cerevisiae
© The Author(s) 2019. This article is distributed under the terms of the Creative Commons Attribution 4.0 International License (http://creat iveco mmons .org/licen ses/by/4.0/), which permits unrestricted use, distribution, and reproduction in any medium, provided you give appropriate credit to the original author(s) and the source, provide a link to the Creative Commons license, and indicate if changes were made. The Creative Commons Public Domain Dedication waiver (http://creativecommons.org/publicdomain/zero/1.0/) applies to the data made available in this article, unless otherwise stated.
IntroductionThe performance of bioreactors depends on the control of several cultivation conditions (e.g.: pH, temperature, dis-solved oxygen), in order to direct cell metabolism towards the improvement in yield, selectivity, and productivity of
the target product. For example, the control of the oxy-gen supply to facultative microorganisms plays a key role in driving metabolic routes towards the production of biomass (favored under aerobic conditions) or the syn-thesis of some fermentative products (favored by low or zero oxygen availability) [1].
Conventional strategies in aerobic processes are essen-tially based on measurements of the dissolved oxygen concentration (DOC), which is then controlled by adjust-ing the stirrer speed and, occasionally, the composition of
Open Access
Microbial Cell Factories
*Correspondence: [email protected] Graduate Program of Chemical Engineering, Federal University of São Carlos (PPGEQ-UFSCar), Rodovia Washington Luís, Km 235, São Carlos, SP 13565-905, BrazilFull list of author information is available at the end of the article

Page 2 of 17Mesquita et al. Microb Cell Fact (2019) 18:150
the gas supplied to the reactor (for instance, enrichment with pure oxygen) or the total gas flow rate [2, 3]. Some improvements have been made over time including more refined DOC controls through the use of mechanistic models [3] or neural networks [4], to mention a few.
However, the application of these strategies may be not effective under microaerobic conditions, because ordi-nary probes are not accurate at low dissolved oxygen ten-sion [5]. Under oxygen-limited conditions, DOC < 1.5% [6], the control strategies previously mentioned may become unstable. Nevertheless, micro-aerobic condi-tions are required to produce many biotechnological products, including vaccines used against H. influenzae, S. pnemoniae, and N. meningitidis [7–9], and bioethanol production by S. cerevisiae [10], by E. coli [11], and by P. stipitis [12]. The production of advanced biofuels and bio-based chemical intermediates, including n-butanol [13], 2,3-butanediol [14] and acetone [15], important in the context of the emerging low carbon economy also relies on micro-aerobic cultivations. Bio-based processes can be used to convert agricultural residues’ biomass into industrially valuable products such as lactic acid [16] and bioethanol [17], serving as alternative routes to petro-chemical products. Thus, the need for updated, robust, and low-cost control strategies for microaerobic fermen-tations in industrial bioreactors is likely to increase soon.
In the context of bioethanol production using S. cer-evisiae, the catabolism of sugars is a key factor affecting process performance and is strongly influenced by oxygen availability. If the oxygen supplied is below a threshold value, glycerol will be produced, decreasing the ethanol yield [18]. On the other hand, if respiration is activated, greater substrate fluxes will be directed towards biomass formation [18], also leading to reduced ethanol yields. Providing a suitable oxygen flux seems important for 2nd generation ethanol production from xylose because it helps to relieve observed redox imbalances through cofac-tor regeneration [19] and to maintain sufficient amino acids and protein synthesis, necessary for growth [20, 21]. Furthermore, micro-aeration helps to preserve cell viabil-ity, hence affecting ethanol productivity [10, 22].
Despite the importance of the control of micro-aerobic conditions in fermentations, there are not many studies addressing this topic in the literature. The use of a con-stant (sparged or headspace) air flow, without any con-trol, to cultivate S. cerevisiae under oxygen limitation was reported in a couple of works [10, 22, 23]. Even RQ-based control, extensively studied to adjust feeding supply for aerobic S. cerevisiae cultures [24, 25], was little explored to set up micro-aeration control strategies. In fact, this approach was applied to continuous fermentations using S. cerevisiae and consisted in the manipulation of the inlet
gas stream composition to maintain RQ at the desired level and enforce microaerobic conditions [26]. Easily estimated from off-gas measurements and available on-line, RQ provides valuable information about S. cerevisiae respiratory activity [24, 25]. Furthermore, when RQ is integrated with other inputs within a suitable framework, a more complete control system, able to tune both oxygen and carbon source supplies, can be implemented.
In this context, genome-scale metabolic models (GSMs) can also be employed for bioreactor control. They are a source of in silico data reproducing the cell metabolism. With these models, it is possible to estimate intracellular and extracellular fluxes of metabolites at steady-state for different environmental conditions, considering the inlet fluxes of substrate and oxygen—which in fact drive the metabolic reactions occurring within the cell. Saccharo-myces cerevisiae, in particular, has been extensively stud-ied, with at least 12 GSMs published ever since 2003 [27]. S. cerevisiae GSMs have been employed with satisfactory results to improve the understanding of yeast physiology, as well as to predict targets for metabolic engineering in order to overproduce chemicals such as succinic acid [28], fumaric acid [29], bioethanol [30], 2,3-butanediol [31] and l-tyrosine [32]. Still, the application of metabolic models is not restricted to understanding cell pathway networks or improving them. Indeed, metabolic models may be powerful tools for process improvement and for biore-actor’s control. With this kind of information, estimated metabolic fluxes can be used to develop cultivation strate-gies better tuned with the cell actual metabolism.
GSMs are stoichiometric models, which assume steady-state behavior. Usually, this is not the case in real fermentations, especially in industrial scale, but the information concerning metabolic fluxes may delimit regions of operation for the reactor. Following this concept, the GSMs output can be understood as a pseudo-stationary response to the environmental con-ditions observed during the process. These estimates of substrate/product fluxes may provide useful infor-mation for the control system, even though the biore-actor does not operate at steady-state.
An innovative bioreactor control system is herein reported, based on metabolic fluxes estimated using a GSM. This new approach is evaluated using the production of bioethanol under microaerobic condi-tions as a case study. Indeed, an important problem in industrial fermentations is to increase bioethanol production at the expense of biomass and glycerol, and this was the focus of this work. A novel supervisory system is also presented, which combines advanced strategies for bioprocess control, on-line data acquisi-tion, and a flux-oriented control model.
Page 3 of 17Mesquita et al. Microb Cell Fact (2019) 18:150
ResultsThe development of the metabolic flux-oriented control involves several steps including GSM simulations, selec-tion of suitable simulated data, and their integration with model equations to configure the control system. Addi-tionally, it is important to assess the control performance by applying it to a real process. In the present work, etha-nol production in S. cerevisiae fermentation operated in fed-batch mode was chosen as a case study to test the flux-based micro-aeration control (FMC).
Initially, simulations using the genome-scale metabolic model of S. cerevisiae iND750 [33] and the Optflux 3.2.7 software [34] were run. From this in silico study, simulated metabolic fluxes (Ji
MM) for different species (substrate, eth-anol, CO2, O2, etc.) were collected and used to generate mathematical correlations (MC), which in turn provided estimations of substrate
(
JMCS
)
and oxygen (
JMCO2
)
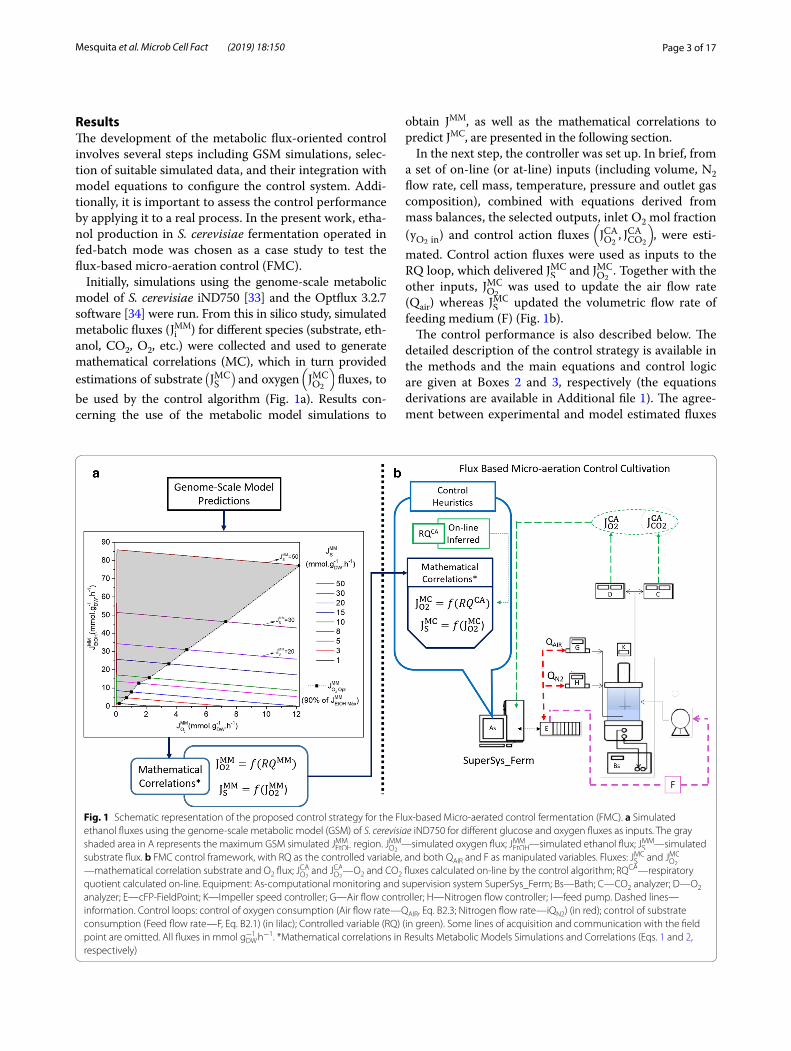
fluxes, to be used by the control algorithm (Fig. 1a). Results con-cerning the use of the metabolic model simulations to
obtain JMM, as well as the mathematical correlations to predict JMC, are presented in the following section.
In the next step, the controller was set up. In brief, from a set of on-line (or at-line) inputs (including volume, N2 flow rate, cell mass, temperature, pressure and outlet gas composition), combined with equations derived from mass balances, the selected outputs, inlet O2 mol fraction ( yO2 in
) and control action fluxes (
JCAO2, JCACO2
)
, were esti-mated. Control action fluxes were used as inputs to the RQ loop, which delivered JMC
S and JMCO2
. Together with the other inputs, JMC
O2 was used to update the air flow rate
(Qair) whereas JMCS updated the volumetric flow rate of
feeding medium (F) (Fig. 1b).The control performance is also described below. The
detailed description of the control strategy is available in the methods and the main equations and control logic are given at Boxes 2 and 3, respectively (the equations derivations are available in Additional file 1). The agree-ment between experimental and model estimated fluxes
Fig. 1 Schematic representation of the proposed control strategy for the Flux-based Micro-aerated control fermentation (FMC). a Simulated ethanol fluxes using the genome-scale metabolic model (GSM) of S. cerevisiae iND750 for different glucose and oxygen fluxes as inputs. The gray shaded area in A represents the maximum GSM simulated JMM
EtOH region. JMMO2
—simulated oxygen flux; JMMEtOH—simulated ethanol flux; JMM
S —simulated substrate flux. b FMC control framework, with RQ as the controlled variable, and both QAIR and F as manipulated variables. Fluxes: JMC
S and JMCO2
—mathematical correlation substrate and O2 flux; JCAO2 and JCAO2
—O2 and CO2 fluxes calculated on-line by the control algorithm; RQCA—respiratory quotient calculated on-line. Equipment: As-computational monitoring and supervision system SuperSys_Ferm; Bs—Bath; C—CO2 analyzer; D—O2 analyzer; E—cFP-FieldPoint; K—Impeller speed controller; G—Air flow controller; H—Nitrogen flow controller; I—feed pump. Dashed lines—information. Control loops: control of oxygen consumption (Air flow rate—QAIR, Eq. B2.3; Nitrogen flow rate—iQN2) (in red); control of substrate consumption (Feed flow rate—F, Eq. B2.1) (in lilac); Controlled variable (RQ) (in green). Some lines of acquisition and communication with the field point are omitted. All fluxes in mmol gDW
−1 h−1. *Mathematical correlations in Results Metabolic Models Simulations and Correlations (Eqs. 1 and 2, respectively)

Page 4 of 17Mesquita et al. Microb Cell Fact (2019) 18:150
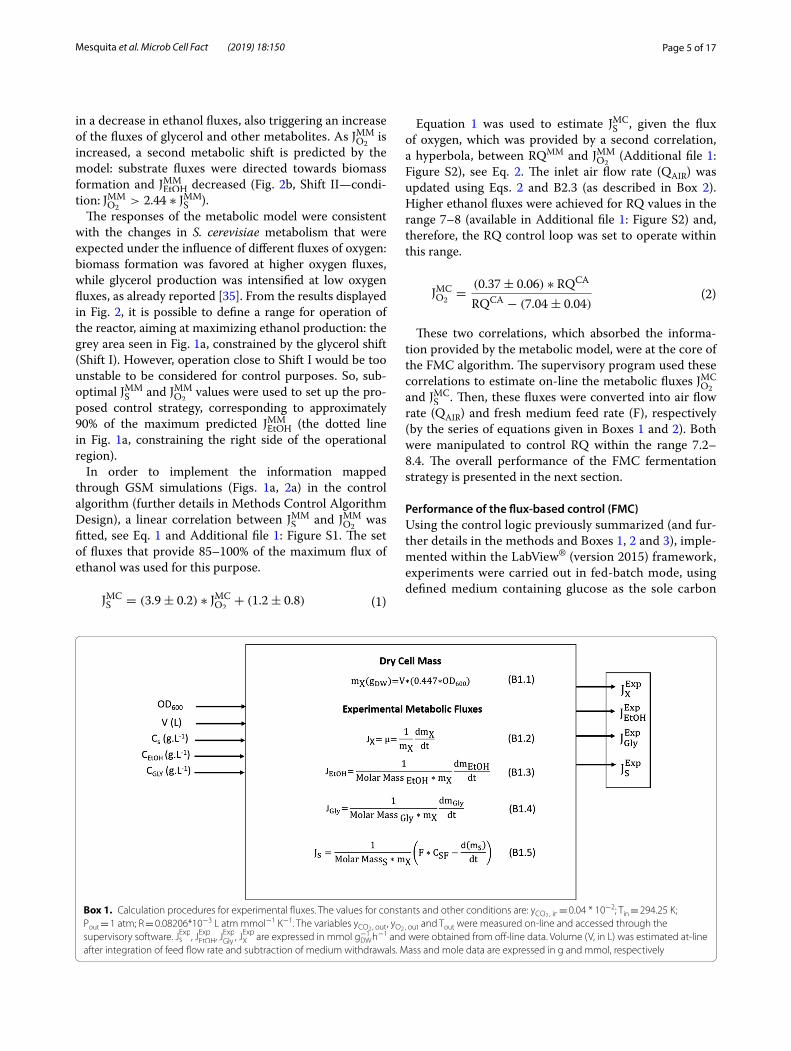
is also used herein to evaluate the proposed control strat-egy. To do so, experimental fluxes ( JExpi ) for ethanol, sub-strate, and biomass were calculated from off-line data using component mass balances (as depicted in Box 1) and compared to the corresponding Ji
MM fluxes.Finally, the performance of the fermentation carried
out under the Flux-based Micro-aeration Control (FMC) was compared to other fermentation strategies: a conven-tional fermentation strategy, used in Brazilian Bioethanol Plants (BBP), and another cultivation carried out under strictly anaerobic conditions (SAC).
Metabolic model simulations and correlations implemented in the control algorithmTo select the most suitable oxygen levels to be imple-mented by the proposed flux-based micro-aeration
control, a more detailed view of the influence of oxygen on yeast metabolism is required. Several simulations of the genome-scale metabolic model (GSM) of S. cerevi-siae iND750 [33] were run, using the software Optflux 3.2.7 [34]. Different combinations of inlet fluxes, JMM
S and JMM
O2 , were used as inputs to Optflux, and the corre-
sponding output fluxes for ethanol, biomass, CO2, and glycerol were generated for each simulated condition (Fig. 2a).
Figure 2b shows the metabolic shifts that occur when the flux of oxygen is increased (see also Additional file 1: Table S1), for a specified flux of substrate (in this case, for example, the substrate flux was 3 mmol gDW
−1 h−1). A first shift occurs at a minimum critical value of JMM
O2
(Fig. 2b, Shift I—condition: JMMO2
< 7E−4 ∗ JMMS ). Simula-
tions with smaller values than this critical JMMO2
resulted
Fig. 2 Metabolic shifts predicted by the GSM for different oxygen and substrate fluxes. a Metabolic fluxes predicted by the genome-scale metabolic model (GSM) of S. cerevisiae iND750 [33]. b An example of the metabolic shifts predicted by the GSM, for a glucose flux of 3 mmol gDW
−1 h−1. Shift I: increase of JMMGly and decrease of JMM
EtOH ; Shift II: increase of JMMX and decrease of JMM
EtOH
Page 5 of 17Mesquita et al. Microb Cell Fact (2019) 18:150
in a decrease in ethanol fluxes, also triggering an increase of the fluxes of glycerol and other metabolites. As JMM
O2 is
increased, a second metabolic shift is predicted by the model: substrate fluxes were directed towards biomass formation and JMM
EtOH decreased (Fig. 2b, Shift II—condi-tion: JMM
O2> 2.44 ∗ JMM
S ).The responses of the metabolic model were consistent
with the changes in S. cerevisiae metabolism that were expected under the influence of different fluxes of oxygen: biomass formation was favored at higher oxygen fluxes, while glycerol production was intensified at low oxygen fluxes, as already reported [35]. From the results displayed in Fig. 2, it is possible to define a range for operation of the reactor, aiming at maximizing ethanol production: the grey area seen in Fig. 1a, constrained by the glycerol shift (Shift I). However, operation close to Shift I would be too unstable to be considered for control purposes. So, sub-optimal JMM
S and JMMO2
values were used to set up the pro-posed control strategy, corresponding to approximately 90% of the maximum predicted JMM
EtOH (the dotted line in Fig. 1a, constraining the right side of the operational region).
In order to implement the information mapped through GSM simulations (Figs. 1a, 2a) in the control algorithm (further details in Methods Control Algorithm Design), a linear correlation between JMM
S and JMMO2
was fitted, see Eq. 1 and Additional file 1: Figure S1. The set of fluxes that provide 85–100% of the maximum flux of ethanol was used for this purpose.
(1)JMCS = (3.9± 0.2) ∗ JMC
O2+ (1.2± 0.8)
Equation 1 was used to estimate JMCS , given the flux
of oxygen, which was provided by a second correlation, a hyperbola, between RQMM and JMM
O2 (Additional file 1:
Figure S2), see Eq. 2. The inlet air flow rate (QAIR) was updated using Eqs. 2 and B2.3 (as described in Box 2). Higher ethanol fluxes were achieved for RQ values in the range 7–8 (available in Additional file 1: Figure S2) and, therefore, the RQ control loop was set to operate within this range.
These two correlations, which absorbed the informa-tion provided by the metabolic model, were at the core of the FMC algorithm. The supervisory program used these correlations to estimate on-line the metabolic fluxes JMC
O2
and JMCS . Then, these fluxes were converted into air flow
rate (QAIR) and fresh medium feed rate (F), respectively (by the series of equations given in Boxes 1 and 2). Both were manipulated to control RQ within the range 7.2–8.4. The overall performance of the FMC fermentation strategy is presented in the next section.
Performance of the flux‑based control (FMC)Using the control logic previously summarized (and fur-ther details in the methods and Boxes 1, 2 and 3), imple-mented within the LabView® (version 2015) framework, experiments were carried out in fed-batch mode, using defined medium containing glucose as the sole carbon
(2)JMCO2
=(0.37± 0.06) ∗ RQCA
RQCA − (7.04 ± 0.04)
Box 1. Calculation procedures for experimental fluxes. The values for constants and other conditions are: yCO2, in = 0.04 * 10−2; Tin = 294.25 K;
Pout = 1 atm; R = 0.08206*10−3 L atm mmol−1 K−1. The variables yCO2, out , yO2, out
and Tout were measured on-line and accessed through the supervisory software. JExps , JExpEtOH , JExpGly , JExpX are expressed in mmol gDW
−1 h−1 and were obtained from off-line data. Volume (V, in L) was estimated at-line after integration of feed flow rate and subtraction of medium withdrawals. Mass and mole data are expressed in g and mmol, respectively

Page 6 of 17Mesquita et al. Microb Cell Fact (2019) 18:150
source. Glucose, biomass, ethanol and glycerol profiles for the reactor operating under FMC can be seen in Fig-ure SM3 (Additional file 1). The cultivation strategy was split into three stages: (i) a batch, aerobic phase (until 2.6 h) to increase biomass concentration; (ii) the fed-batch phase carried out under micro-aeration condi-tions implemented by the proposed control strategy to supply glucose and O2 (from 2.6 to 10.6 h); (iii) a final batch phase (from 10.6 to 12.6 h), started when glucose feeding was stopped (at 10.6 h), still carried out under micro-aeration conditions implemented by the pro-posed control strategy for O2 supply.
The overall performance of the controller, particu-larly in sustaining a micro-aerated environment, can be assessed from JCAO2
, JCACO2 and RQCA data (Fig. 3a) as well as
from the profiles of the manipulated air and N2 flow rates (Fig. 3b).
After 2.6 h the dissolved oxygen was set to zero (Addi-tional file 1: Figure S3) by injecting N2, and the control action started. The gas phase control action consisted of correcting the air inlet flow to keep RQ between 7.2 and 8.4. Within this control range, the inlet air flow was updated using Eq. 2 and the other equations are given at Box 2. QN2 was increased in steps during the cultivation
to keep the outlet CO2 mol fraction within the gas ana-lyzer maximum detection limit (20% CO2). The micro-aeration control remained active until all glucose was consumed at the end of the 3rd stage of the FMC experi-ment in order to get a full picture of its performance.
The controlled variable (RQCA) (Fig. 3a) followed the proposed control logic throughout the experiment. RQCA remained close to the lower boundary of 7.2 until 6.8 h. At this moment, RQCA values presented oscillations, and subsequently, they remained above the upper RQCA boundary of 8.4 mol CO2 mol O2
−1. The observed oscilla-tions matched the increase in the dissolved oxygen ten-sion (Additional file 1: Figure S3).
A reduction of the cell fermentative capability, proba-bly caused by ethanol inhibition or viability loss, as dis-cussed later, may have contributed to decreasing the specific growth rate (or biomass flux JX) and, conse-quently, the oxygen uptake flux
(
JCAO2
)
, as well (Fig. 3a). Once RQ is calculated by the ratio
(
JCACO2∗ JCA
−1
O2
)
(Box 2, Eq. B2.6), low JCAO2
values would result in the increasing RQ pattern observed from 8.5 to 11.5 h of FMC fermen-tation (Fig. 3a). The change in RQ trajectory in the last 30 min of experiment could be attributed to the activa-tion of the respiratory metabolism, once Additional file 1:
Box 2. Flux-based micro-aerated control (FMC): equations for updating fresh medium feeding and air flow rates. The values for constants and other conditions are: yCO2, N2
= 0.01*10−2; Tin = 294.25 K; Pout = 1 atm; R = 0.08206*10−3 L atm mmol−1 K−1. Qgas,out, yCO2, in , and yO2, in
were estimated through mass balance. The variables yCO2, out
, yO2, out and Tout were measured on-line and accessed through the supervisory software. JMC
s , JMCO2
, JCAO2 ,
JCACO2 are expressed in mmol gDW
−1 h−1. QN2, QAIR and F were manipulated and are expressed in L h−1. *Mathematical correlations in Results Metabolic Models Simulations and Correlations (Eqs. 1 and 2, respectively)
Page 7 of 17Mesquita et al. Microb Cell Fact (2019) 18:150
Figure S3 showed an increase in the biomass concentra-tion close to the ending of the cultivation.
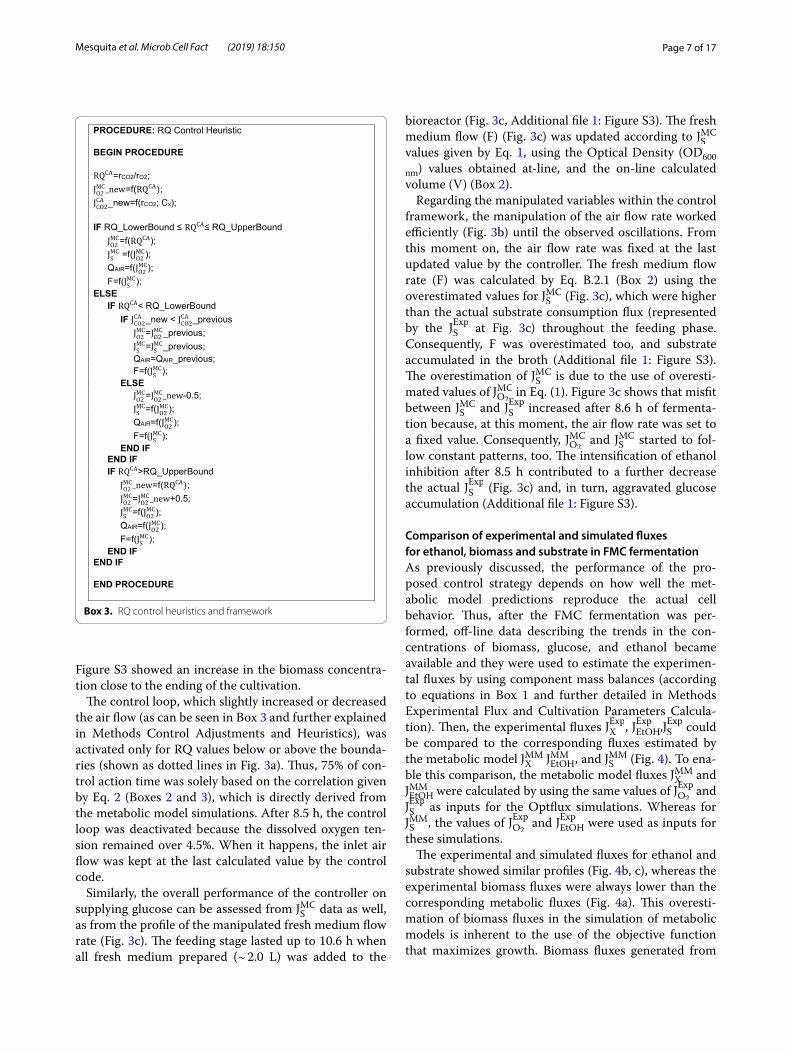
The control loop, which slightly increased or decreased the air flow (as can be seen in Box 3 and further explained in Methods Control Adjustments and Heuristics), was activated only for RQ values below or above the bounda-ries (shown as dotted lines in Fig. 3a). Thus, 75% of con-trol action time was solely based on the correlation given by Eq. 2 (Boxes 2 and 3), which is directly derived from the metabolic model simulations. After 8.5 h, the control loop was deactivated because the dissolved oxygen ten-sion remained over 4.5%. When it happens, the inlet air flow was kept at the last calculated value by the control code.
Similarly, the overall performance of the controller on supplying glucose can be assessed from JMC
S data as well, as from the profile of the manipulated fresh medium flow rate (Fig. 3c). The feeding stage lasted up to 10.6 h when all fresh medium prepared (~ 2.0 L) was added to the
bioreactor (Fig. 3c, Additional file 1: Figure S3). The fresh medium flow (F) (Fig. 3c) was updated according to JMC
S values given by Eq. 1, using the Optical Density (OD600
nm) values obtained at-line, and the on-line calculated volume (V) (Box 2).
Regarding the manipulated variables within the control framework, the manipulation of the air flow rate worked efficiently (Fig. 3b) until the observed oscillations. From this moment on, the air flow rate was fixed at the last updated value by the controller. The fresh medium flow rate (F) was calculated by Eq. B.2.1 (Box 2) using the overestimated values for JMC
S (Fig. 3c), which were higher than the actual substrate consumption flux (represented by the JExpS at Fig. 3c) throughout the feeding phase. Consequently, F was overestimated too, and substrate accumulated in the broth (Additional file 1: Figure S3). The overestimation of JMC
S is due to the use of overesti-mated values of JMC
O2 in Eq. (1). Figure 3c shows that misfit
between JMCS and JExpS increased after 8.6 h of fermenta-
tion because, at this moment, the air flow rate was set to a fixed value. Consequently, JMC
O2 and JMC
S started to fol-low constant patterns, too. The intensification of ethanol inhibition after 8.5 h contributed to a further decrease the actual JExpS (Fig. 3c) and, in turn, aggravated glucose accumulation (Additional file 1: Figure S3).
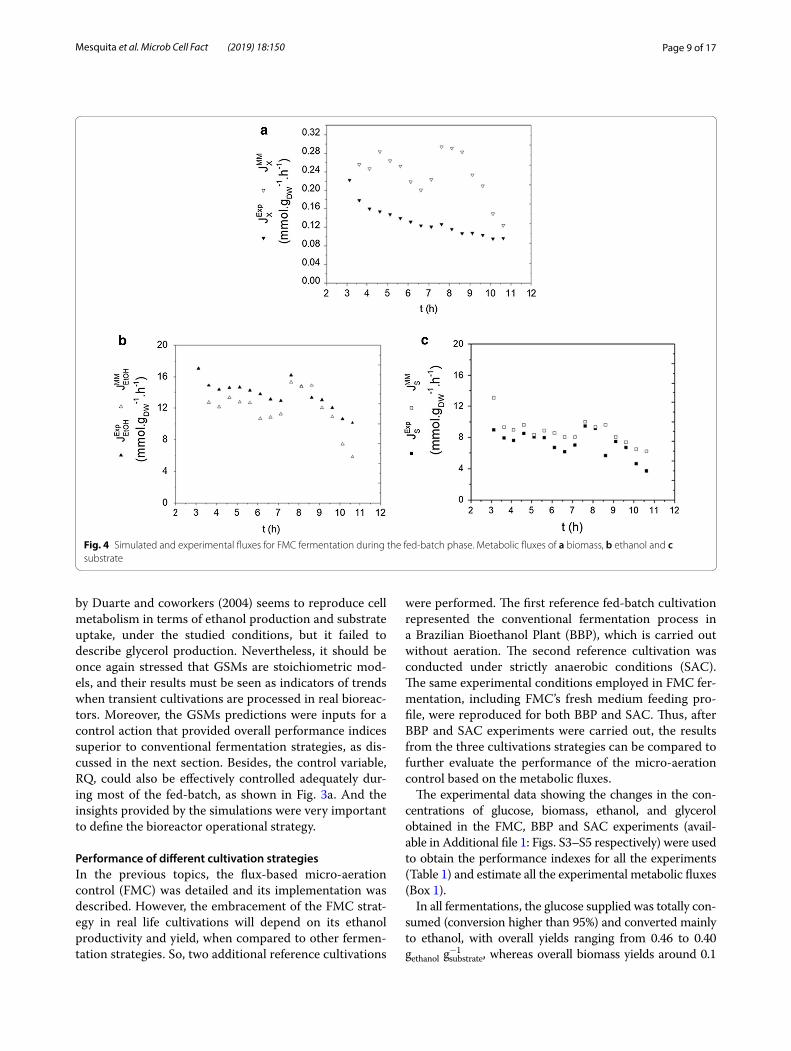
Comparison of experimental and simulated fluxes for ethanol, biomass and substrate in FMC fermentationAs previously discussed, the performance of the pro-posed control strategy depends on how well the met-abolic model predictions reproduce the actual cell behavior. Thus, after the FMC fermentation was per-formed, off-line data describing the trends in the con-centrations of biomass, glucose, and ethanol became available and they were used to estimate the experimen-tal fluxes by using component mass balances (according to equations in Box 1 and further detailed in Methods Experimental Flux and Cultivation Parameters Calcula-tion). Then, the experimental fluxes JExpX , JExpEtOH,JExpS could be compared to the corresponding fluxes estimated by the metabolic model JMM
X JMMEtOH , and JMM
S (Fig. 4). To ena-ble this comparison, the metabolic model fluxes JMM
X and JMMEtOH were calculated by using the same values of JExpO2
and JExpS as inputs for the Optflux simulations. Whereas for JMMS , the values of JExpO2
and JExpEtOH were used as inputs for these simulations.
The experimental and simulated fluxes for ethanol and substrate showed similar profiles (Fig. 4b, c), whereas the experimental biomass fluxes were always lower than the corresponding metabolic fluxes (Fig. 4a). This overesti-mation of biomass fluxes in the simulation of metabolic models is inherent to the use of the objective function that maximizes growth. Biomass fluxes generated from
Box 3. RQ control heuristics and framework

Page 8 of 17Mesquita et al. Microb Cell Fact (2019) 18:150
metabolic model simulations for this objective function, in fact, represent the theoretical upper limit for the maxi-mum specific growth rate that could be attained by the cells under the model constraints. So, as expected, in vivo biomass fluxes remained below these maximum theoreti-cal values. As further detailed at the Methods Metabolic Model Simulations, the maximization of growth was cho-sen as the objective function because it provides a better emulation of the actual yeast cell metabolism than other options, such as maximization of ethanol flux.
The decrease in JExpX , JExpEtOH , and JExpS as ethanol concen-trations increased (Fig. 4a–c) is another notable trend. The observed decreasing pattern for cells and substrate uptake was probably related to ethanol inhibition, which is intensified at ethanol concentrations above 0.75 M [36, 37]. This threshold value for the ethanol concentration
that triggers inhibition can vary according to the strain and cultivation conditions [37]. Besides experimen-tal fluxes, the fluxes JMM
X ,JMMEtOH and JMM
S estimated from model simulations also showed decreasing trends at high ethanol concentrations (Fig. 4a–c), because smaller val-ues of JExpO2
were observed at this cultivation condition, and provided as inputs to Optflux.
Regarding glycerol production, there was an accumula-tion of 9 g L−1 at the end of the fermentation (Additional file 1: Figure S3). Experimental glycerol fluxes decreased from 1.4 to 0.7 mmol gDW
−1 h−1 from the beginning to the end of the fermentation (data not shown). This produc-tion is higher than the values predicted by the metabolic model, which would vary from 0 to 0.12 mmol gDW
−1 h−1 (data not shown) for the values of JExpO2
and JExpS used as inputs. Thus, the metabolic model iND750 developed
Fig. 3 Overall performance of the flux-based Micro-aerated Control. a Respiratory quotient (RQ), oxygen flux ( JCAO2 ), and carbon dioxide flux
(
JCACO2
)
in
FMC fermentation. The arrows indicate the activation of the RQ loop, which was deactivated when RQ returned to the set boundaries (lower boundary: red dashed line, upper boundary: blue dashed line) or when DOT ≥ 4.5%. b QN2 and QAIR flow rates during the feeding phase and up to the end of the cultivation. c Fresh medium feed flow rate and substrate flux
(
JCAS)
in FMC fermentation
Page 9 of 17Mesquita et al. Microb Cell Fact (2019) 18:150
by Duarte and coworkers (2004) seems to reproduce cell metabolism in terms of ethanol production and substrate uptake, under the studied conditions, but it failed to describe glycerol production. Nevertheless, it should be once again stressed that GSMs are stoichiometric mod-els, and their results must be seen as indicators of trends when transient cultivations are processed in real bioreac-tors. Moreover, the GSMs predictions were inputs for a control action that provided overall performance indices superior to conventional fermentation strategies, as dis-cussed in the next section. Besides, the control variable, RQ, could also be effectively controlled adequately dur-ing most of the fed-batch, as shown in Fig. 3a. And the insights provided by the simulations were very important to define the bioreactor operational strategy.
Performance of different cultivation strategiesIn the previous topics, the flux-based micro-aeration control (FMC) was detailed and its implementation was described. However, the embracement of the FMC strat-egy in real life cultivations will depend on its ethanol productivity and yield, when compared to other fermen-tation strategies. So, two additional reference cultivations
were performed. The first reference fed-batch cultivation represented the conventional fermentation process in a Brazilian Bioethanol Plant (BBP), which is carried out without aeration. The second reference cultivation was conducted under strictly anaerobic conditions (SAC). The same experimental conditions employed in FMC fer-mentation, including FMC’s fresh medium feeding pro-file, were reproduced for both BBP and SAC. Thus, after BBP and SAC experiments were carried out, the results from the three cultivations strategies can be compared to further evaluate the performance of the micro-aeration control based on the metabolic fluxes.
The experimental data showing the changes in the con-centrations of glucose, biomass, ethanol, and glycerol obtained in the FMC, BBP and SAC experiments (avail-able in Additional file 1: Figs. S3–S5 respectively) were used to obtain the performance indexes for all the experiments (Table 1) and estimate all the experimental metabolic fluxes (Box 1).
In all fermentations, the glucose supplied was totally con-sumed (conversion higher than 95%) and converted mainly to ethanol, with overall yields ranging from 0.46 to 0.40 gethanol g−1
substrate, whereas overall biomass yields around 0.1
Fig. 4 Simulated and experimental fluxes for FMC fermentation during the fed-batch phase. Metabolic fluxes of a biomass, b ethanol and c substrate

Page 10 of 17Mesquita et al. Microb Cell Fact (2019) 18:150
gbiomass g−1substrate were observed (Table 1). However, SAC and
BBP lasted longer than FMC (Additional file 1: Figures S4, S5), which means that micro-aeration increased produc-tivities for both ethanol and biomass (Table 1). In addition, the ratio between ethanol and glycerol concentrations at the end of the fermentation strategies (SIndex, Eq. 5) of FMC (9.9) is superior to the corresponding values for BBP’s and SAC’s (6.6 and 6.2, respectively), confirming that metabolic flux towards glycerol (Fig. 2 and Additional file 1: Table S1) was reduced under controlled micro-aeration.
Regarding metabolic fluxes, the ethanol fluxes during the feeding stage for BPP and SAC were similar and remained below 10 mmol gDW
−1 h−1 throughout the fed-batch phase (Fig. 5a). On the other hand, for FMC, the ethanol flux remained around 14 mmol gDW
−1 h−1 during the feeding. A better explanation for the different volumetric produc-tivities (Table 1) can be obtained by comparing the ethanol concentrations (Fig. 5b). For FMC, the ethanol concentra-tion increased steadily during the feeding phase, surpassing the dilution effect. Consequently, FMC ethanol produc-tivity was 1.5-fold the values observed for BPP and SAC (Table 1). These results emphasize the potential benefits of a flux-based cultivation strategy. Indeed, high ethanol con-centration and productivity were achieved in FMC due to the high ethanol flux policy successfully applied to this cul-tivation, as will be further discussed in the next section.
DiscussionThe modulation of oxygen fluxes following the pattern defined by the data obtained in silico using Saccharo-myces cerevisiae iND750 GSM was effective in direct-ing the yeast metabolism towards ethanol formation.
Furthermore, the values of experimental and simulated ethanol fluxes differed by less than 15% on average (Fig. 4a), validating the initial assumption of applying the GSM steady-state simulated fluxes as a pseudo-stationary response. The proposed control strategy was successful because, in micro-aerated condition, the fluxes for biomass formation, substrate uptake, and ethanol production were limited by the oxygen supply, which, in turn, was defined by the control action.
Regarding ethanol production, the highest experi-mental ethanol flux achieved was 17 mmol gDW
−1 h−1 for FMC (Fig. 5a), applying JCAS of 9 mmol gDW
−1 h−1 and JCAO2
of 1.5 mmol gDW−1 h−1, which agrees with model pre-
dictions (Fig. 1a). However, this JEXPEtOH value is almost half of the highest reported ethanol fluxes (up to 32 mmol gDW
−1 h−1) in chemostat cultures under anaero-bic/micro-aerated conditions using S. cerevisiae CBS 8066 [35]. This fast-growing S. cerevisiae lab strain (maximum specific growth rate of 0.45 h−1 at 30 °C)
Table 1 Performance indexes for controlled fermentation FMC and for the reference fermentation strategies (BBP and SAC)
Ethanol and glycerol concentrations at the end of the cultivation. Overall cultivation parameters estimated: Yx/s biomass yield, YEtOH/S ethanol yield, PrX volumetric cell productivity, Prp,Ethanol volumetric ethanol productivity, SIndex selectivity index, STotal total glucose mass fed
Performance indexes FMC BBP SAC
Ethanol (g L−1) 87 ± 2 62.1 ± 0.3 57.2 ± 0.8
Glycerol (g L−1) 8.76 ± 0.01 9.33 ± 0.02 9.3 ± 0.1
Yx/s (gcells g−1substrate) 0.11 ± 0.001 0.08 ± 0.01 0.08 ± 0.01
YEtOH/s(gethanol g
−1substrate)
0.46 ± 0.01 0.38 ± 0.03 0.39 ± 0.02
Prx (g L−1 h−1) 1.2 ± 0.2 0.59 ± 0.01 0.77 ± 0.01
Prp,Ethanol (g L−1 h−1) 7.0 ± 0.2 3.75 ± 0.02 4.05 ± 0.02
SIndex 9.9 ± 0.8 6.6 ± 0.1 6.2 ± 0.7
Total glucose mass fed (g) 616 ± 4 552 ± 2 544 ± 2
Conversion (%) 99.6 ± 0.4 97.88 ± 0.02 99.00 ± 0.02
Fig. 5 Experimental fluxes (a) and concentrations (b) of ethanol during the fed-batch phase for FMC, BBP, and SAC. a Experimental fluxes of ethanol
(
JExpEtOH
)
. b Concentrations of ethanol (CEtOH) . FMC
flux-based micro-aeration control, BBP “Brazilian Bioethanol Plant”-type fermentation, SAC strictly anaerobic condition
Page 11 of 17Mesquita et al. Microb Cell Fact (2019) 18:150
shows high glucose uptake fluxes (up 20 mmol gDW−1 h−1)
under anaerobic conditions [38]. Thus, the use of high ethanol producing S. cerevisiae strains would certainly lead to larger experimental ethanol fluxes.
In this case, the control action proved to be sufficiently robust in managing with the limited capability of the commercial baker’s yeast used for ethanol production. Higher inlet fluxes of oxygen led to increased biomass fluxes, resulting in an RQ decrease, which was satisfac-torily corrected by the implemented control loop (Fig. 1b and Box 3).
Concerning substrate feeding, glucose accumula-tion was observed in FMC, SAC and BBP cultures. As mentioned before, the accumulation was caused by the overestimation of the JMC
S by Eq. 1 (Fig. 3c) due to the influence of overestimated JMM
X (Fig. 4a) used for the calculation of JMC
O2 in Eq. 2. Glucose accumulation (Addi-
tional file 1: Figure S3) was intensified for ethanol con-centrations over 40 g L−1, most certainly due to product inhibition and viability loss. This increase in glucose concentration was a consequence of misleading biomass information provided by the at-line optical density meas-urements, which reflected the concentrations of viable and non-viable cells. High ethanol concentrations can trigger viability loss, but the OD600 readings (updated at-line; Box 2) used as inputs led to overestimated Cx values and, consequently, to exaggerated feeding rates. Other effects of ethanol inhibition were also observed, includ-ing increased dissolved oxygen concentrations (Addi-tional file 1: Figure S3) as well as reduced experimental substrate and biomass fluxes (Fig. 4a–c). However, no increase in glycerol metabolic flux was observed (data not shown).
Even at low concentrations (5% (v/v)), ethanol can act as an inhibitor of yeast growth, while high ethanol con-centrations (10% (v/v)) greatly reduce cell viability [39]. One of the main effects of the exposure to this metabo-lite is an increased membrane fluidity and consequently a decrease in membrane integrity [40].
In addition, other assumptions, such as the pseudo-stationary state for substrate balance and the constant value for biomass yield, could also influence the feed flow rate calculated by the expression F (Box 2). Never-theless, although undesirable, glucose accumulation did not hamper ethanol productivity or yield. The reason is that the cultivations were continued after the feeding of fresh medium was ended until the residual glucose was completely assimilated by the cells. Substrate accu-mulation is a common problem observed for different control approaches involving supplementary medium feeding in fed-batch cultures [41, 42]. The robustness of the proposed control system could be improved by on-line viable cell quantification (using a biomass sensor) or
its inference using a softsensor, which should reduce the glucose accumulation.
Table 2 summarizes the main results of this work and other reported studies employing micro-aeration strategies.
The cultivations performed according to the meta-bolic flux-based control logic showed higher pro-ductivity (7.0 gethanol L−1 h−1, respectively) than those obtained in any other reported study, while the prod-uct yield (0.46 gethanol g−1
substrate) was similar to the values achieved in four [23, 43–45] out of the five previously reported studies. To help contextualize these results it should be again noted that the present study used a minimum medium and a wild yeast strain.
Overall, the integration of on-line/at-line data acqui-sition with the trajectory predicted for the metabolic fluxes from GSM simulations within the control logic provided suitable oxygen fluxes for running a micro-aerated fermentation. The structure of the proposed control system is more flexible and comprehensive than micro-aeration tuning schemes based just on RQ meas-urements. The control algorithm and the mathemati-cal model can be easily modified to handle different inputs (JX, JS, JCO2
, and others, besides RQ), according to their availability or better matching of the meta-bolic response of each organism under oxygen-limited growth, both for those exhibiting homofermentative pathways (such as S. cerevisiae) and others following heterofermentative patterns.
ConclusionsThe proposed control system based on fluxes estimated from a genome-scale metabolic model (GSM) for S. cer-evisiae was successfully implemented. A new supervi-sory system (SuperSys_Ferm) was developed and was evaluated under real fermentation conditions, with biomass concentrations ranging from 4 to 16 gDW L−1, ethanol concentrations over 70 g L−1, and fed-batch/batch bioreactor operation mode. The efficacy of the control strategy was confirmed by the high ethanol yield (YP/S,FMC = 0.46 gethanol g−1
substrate) and productivity (PrEtOH,FMC = 7.0 g L−1 h−1) that were achieved relative to controls.
This work has applied GSM simulations for control-ling a bioprocess, manipulating both feeding and inlet gas flow rates to meet cell requirements for the desired prod-uct. As already mentioned, tuning of the control action and estimation of experimental fluxes by the supervisory system would greatly benefit from the use of an in-line biomass sensor able to determine the actual active cell concentration, which was not employed in this study. The proposed control approach is rather general and can

Page 12 of 17Mesquita et al. Microb Cell Fact (2019) 18:150
be adapted to control several bioprocesses that require restricted aeration.
Materials and methodsMicroorganism and cultivation mediaFed-batch cultures were carried out using fresh com-mercial Saccharomyces cerevisiae (baker’s yeast, Itaiquara brand) and minimal medium (5.0 g L−1 KH2PO4, 2.0 g L−1 MgSO4 7H2O, 1.5 g L−1 urea, for both batch and feeding stages), with glucose as carbon source (30 g L−1 for batch cultivations and 300 g L−1 for the feeding medium) [46].
Cultivation strategiesThree cultivation strategies were evaluated: (i) Metabolic Flux oriented based micro-aeration Control (FMC); (ii) “Brazilian Bioethanol Plant” type fermentation (BBP); (iii) Strictly Anaerobic Condition (SAC).
The BBP strategy reproduced the current combined fed-batch/batch cultivations used for ethanol produc-tion in most of the Brazilian sugarcane mills. Briefly, in the usual Brazilian bioethanol production process, also known as Melle-Boinot [47] a stream of concentrated yeast suspension (to achieve cell densities of 10–15% w/v) and a stream of molasse are supplied until the ves-sel is filled (fed-batch stage). After filling is completed,
the process continues as a batch fermentation until sugar exhaustion (batch stage). During both stages no inlet gas stream is supplied [47–49]. For SAC, ultrapure nitrogen was continuously flushed into the bioreactor to ensure “true” anaerobic conditions. The description of FMC strategy is given in Methods Control strategy for FMC Cultivation. One replication of each cultivation strategy was carried out and the experiments are reproducible and representative within an expected variance for an operation of bioreactors for glycerol, ethanol and bio-mass concentrations (less than 15% deviation, on average, for ethanol concentrations, and less than 10% for glycerol and biomass).
Bioreactor operation, instrumentation, and automationThe experiments were conducted in a 5-L stirred tank bioreactor (fabricated in-house) with a working volume of 3.5 L. The pH was automatically controlled (on/off, in-line GLI PRO pH meter) at 4.5 by the addition of NH4OH (7%) and H3PO4 (20%). Ammonium solution added dur-ing all cultures, doubling as a nitrogen source [50, 51]. The temperature was set at 30 °C. The dissolved oxygen concentration (DOC) was measured in-line using a Met-tler Toledo Inpro 6800 probe connected to a CE O2 4050 transmitter. The exhaust gas composition was measured on-line using a Sick/Maihak S.710 system for CO2 and an
Table 2 Main performance indexes for micro-aeration cultures carried out with S. cerevisiae using different substrates and medium compositions
All the cited experiments were carried at 30 °C, with exception of López-Abelairas et al. [10], which was at 32.5 °C
Source Yp/s (gethanol g
−1substrate)
PrP, EtOH (gethanol L
−1 h−1)Final CEtOH (g L−1)
Medium Carbon source Cultivation conditions
Yeast strain (S. cerevisiae)
This work (FMC) 0.46 7.0 87.2 Defined Glucose Fed-batch, micro-aerated
Itaiquara baker’s yeast
This work (BBP) 0.38 3.8 62.1 Defined Glucose Fed-batch, no gas supplied
Itaiquara baker’s yeast
This work (SAC) 0.39 4.1 57.2 Defined Glucose Fed-batch, strictly anaerobic
Itaiquara baker’s yeast
Ben Chaabane et al. [23]
0.44 41 65.0 Defined Glucose Two-stage con-tinuous with cell recirculation, second stage micro-aerated
CBS 8066
Brandberg et al. [43] 0.47 ~0.2 18.5 Defined Glucose Continuous with cell recirculation, micro-aerated
ATCC 96581
López-Abelairas et al. [10]
0.38 3.3 46.9 Complex Maltose Continuous, periodi-cal micro-aerated
Commercial Fermentis yeast
Joannis et al. [44] 0.47 2.3 118.7 Complex Sucrose Very high gravity fed-batch, constant aeration (1 vvh)
C10
Deesuth et al. [45] 0.49 2.7 127.9 Complex Sucrose Very high gravity batch, constant aeration (0.31 vvm)
NP01

Page 13 of 17Mesquita et al. Microb Cell Fact (2019) 18:150
additional Mettler Toledo Inpro 6800 probe for O2. The feed supply was provided by an Ismatec BVP pump. In all the experiments, data acquisition and monitoring/control of the instruments were achieved using Super-Sys_Ferm, an in-house computational tool for flux-based control of micro-aerated fermentation processes. Super-Sys_Ferm was implemented in LabView, via a Compact FieldPoint (Model cFP-2020, National Instruments), and was based on SuperSys_HCDC, which was developed to assist fed-batch bioreactor operation during high cell density cultivations [52, 53].
For all experiments, 41 g (wet mass, ~ 70% humidity) of fresh commercial baker’s yeast was suspended in 0.6 L of defined medium. This inoculum was transferred to the bioreactor leading to an initial biomass concentration of about 3.5 g L−1. After inoculation, the cultivations were split into three stages, as described in the following.
The first stage was a batch phase used for activation of the yeast cells and increase of the biomass concen-tration up to the desired range (8–12 gDW L−1). In this stage, the oxygen saturation was kept at 30% by means of a PID controller that adjusted the stirrer speed between 200 and 1000 rpm. The air was supplied to the bioreac-tor at flow rates ranging from 0.5 to 5 L min−1, adjusted using a mass flow controller (Model GFC, Aalborg). For all experiments, as soon as the biomass concentration reached the desired range, air supply was shut down and industrial nitrogen started to be flushed to the bioreactor to reduce DOC.
For all experiments, the second and third stages mimic the current combined fed-batch/batch cultivations used for ethanol production in Brazil. The second stage started after the DOC was below 3% and was conducted in fed-batch mode. For FMC, the flow rate of the feed-ing medium was defined by the control strategy (further detailed in Methods Control Algorithm Design). For both BBP and SAC cultivations, the feeding profiles repro-duced the one automatically implemented in the FMC culture by the control action. Since all experiments were performed using the same feeding pattern and the same overall mass of supplied substrate, this approach enabled a direct comparison of the three competing strategies. Concerning the gas supply in this cultivation stage, for FMC the inlet gas stream was a mixture of air and indus-trial nitrogen (99.99% N2 (v/v)), supplied by two mass flow controllers at the rates automatically defined by the FMC control strategy. For BBP, no gas stream was sup-plied, whereas for SAC ultrapure nitrogen (99.999% N2 (v/v)) was provided at a constant flow rate of 1 L min−1.
The third stage was a batch culture that followed the fed-batch phase when the feeding supply was stopped. The third phase ended when the glucose accumulated during
the feeding phase, for all experiments, was totally con-sumed. The same strategy of gas supply already described for the second stage of FMC, BBP and SAC continued dur-ing the third stage. The stirring speed was kept constant at 400 rpm in all the experiments throughout the second and third stages.
Concentrations of biomass, glucose and metabolitesDuring the experiments, samples were withdrawn and bio-mass formation was measured by at-line optical density readings (OD600) at λ = 600 nm and dry cell weight method [54]. A correlation (Eq. 3) was then used to convert OD600 measurements into cell mass concentration, CX (gDW L−1), to be used as input to the control action (better detailed in Methods Control Algorithm Design).
The concentrations of ethanol, glycerol, and glucose were measured off-line by HPLC with refractive index detection (Model 410, Waters) [55], using the following conditions: Aminex HPX-87H column (Bio-Rad); 5 mM sulfuric acid solution at a flow rate of 0.6 mL min−1 as the mobile phase; temperature of 50 °C.
Experimental flux and cultivation parameters calculationDetermination of the experimental flux ( JExpi ) for each i component was based on Eq. 4 [56], where ri is the volu-metric production or consumption rate (obtained by mate-rial balances for each i component), in mmol of “i” L−1 h−1, and Cx is the biomass concentration, in gDW L−1.
Box 1 shows the equations used off-line to estimate JExpi . To obtain the derivative terms presented for each com-ponent in Box 1, the polynomial approximation was fit to the experimental mass data as a function of time, which was further derived (Box 1, Eqs.B1.2 to B1.5). It is worth to point out that the components mass data were calculated based on the HPLC concentration results and volume cor-rection. Besides the experimental fluxes calculated from off-line data given at Box 1, fluxes of oxygen uptake and carbon dioxide evolution were also calculated from the available on-line gas data. Experimental values of JO2
and JCO2
are essential for running the control algorithm and their estimation is given at equations B2.4 and B2.5 (Box 2).
An additional index, denominated Overall Selectivity Index (SIndex) was defined as the ratio between the concen-trations of ethanol and glycerol at the end of the cultiva-tion, as stated in Eq. 5, and represented a measure of the metabolic shift towards glycerol formation under the dif-ferent policies of oxygen supply applied.
(3)Cx = (0.447± 0.007) ∗OD600(R2= 0.99)
(4)JExpi =
ri
Cx
(5)SIndex =CEtOH,Final
CGly,Final

Page 14 of 17Mesquita et al. Microb Cell Fact (2019) 18:150
The products yields (Yi/s) (Eq. 6) and volumetric pro-ductivities, Prp,i (Eq. 7) were obtained also as overall indexes, according to the definitions described below.
Control strategy for FMC cultivationBesides experimental fluxes ( JExpi ), three different kinds of fluxes are presented in this paper They were gener-ated using data from: (1) Metabolic Model simulations ( JMMi ); (2) On-line Estimation using the supervisory
software ( JCAi ); and (3) Mathematical Correlations ( JMCi );
these fluxes are used as inputs for the control algorithm to manipulate the flow rates of air (QAIR), nitrogen (QN2), and fresh medium feed (F). The nomenclature included at the beginning of the article provides a detailed descrip-tion of all fluxes used in this work and their symbols.JMMi are represented in Fig. 1a, and they were estimated
off-line from metabolic model simulations (detailed in the next section). JMC
i were the fluxes calculated on-line by mathematical correlations. These correlations were generated off-line from selected JMM
i (Fig. 1a). JCAi were the fluxes calculated on-line by the control algorithm, which was set up to drive the control action (Fig. 1b, Boxes 2 and 3).
Metabolic model simulationsThe control strategy implemented in the FMC experi-ment was based on the S. cerevisiae cell metabolic responses. An overview of the proposed control and experimental approach is shown in Fig. 1. Figure 1a pre-sents the in silico studies of S. cerevisiae metabolism performed off-line with glucose as carbon source, using Optflux 3.2.7 software [34]. The genome-scale metabolic model (GSM) of S. cerevisiae iND750 [33] was used, together with the parsimonious flux balance analysis optimization method (pFBA) [57]. The objective func-tion that maximizes the biomass flux was chosen, assum-ing that it may provide a better emulation of the actual behavior of a yeast cell struggling to grow in the environ-ment of the bioreactor. Another meaningful objective function would be the maximization of the ethanol flux, but within our concept, the actuation of the advanced control system would be responsible for the task of maxi-mizing ethanol yields.
The simulations focused on mapping the metabolism, given inlet fluxes of oxygen and glucose ranging from 15 (fully aerobic) to 0.001 (severely oxygen-limited) mmol O2 gDW
−1 h−1, and from 1 to 50 mmol glucose gDW−1 h−1,
(6)
Yi/S =(Final mass− Initial mass)Product,i
(Total mass fed− Residual mass)Glucose
(7)Prp,i =Final concentrationProduct,i
Total cultivation time
respectively [35]. Several simulations were carried out and the simulated responses of metabolic ethanol flux ( JMMEtOH ) and respiratory quotient (RQMM) were collected
for each JMMS and JMM
O2 used as the environmental condi-
tions. JMMS was kept constant at fixed values and JMM
O2 was
gradually reduced until a maximum JMMEtOH was observed.
This procedure was repeated for several JMMS (Step 1,
illustrated in Table SM1 available in Additional file 1). The optimal inlet fluxes JMM
O2 for each JMM
S were identified considering the range from 85 to 100% of the maximum JMMEtOH obtained in the simulations (Step 2, illustrated in
Additional file 1: Table S2).In Fig. 1a, it is possible to observe a gray shaded area,
which was generated by compiling all simulation results for several JMM
S and the corresponding optimal JMMO2
. The RQMM, JMM
O2 , and JMM
S data into the 85% to 100% bound-ary were further used to obtain the mathematical cor-relations presented in the results, which were used to support the control action (Fig. 1b).
Control algorithm designThe flux-based micro-aerated control fermentation (FMC) was implemented as an on-line closed-loop type control policy [58], with RQ as the controlled variable ( RQCA ) (Fig. 1b), having the O2 and CO2 molar fractions in the exhaust gas as input variables (Box 2). The link between metabolic model simulations and the control action can be seen in Eqs. B2.1 and B2.3, where JMC
O2 (on-
line estimated by the RQ-based correlation given at Eq. 2) and JMC
S (on-line estimated by Eq. 1) were input vari-ables used to update air and feeding medium flow rates, respectively. In addition, the control actuated to keep RQ at the desired range. The entire supervisory system was assembled in SuperSys_Ferm.
The algorithm which was set up to run the on-line flux-based control for the FMC experiment is outlined in Box 2. The rO2 equation was based on the combination of the metabolic flux definition and mass balance (Box 2, Eq. B2.2). Thus, the QAIR was manipulated according to Eq. B2.3 and the QN2 increased automatically (observing the CO2 molar fraction upper detection limit provided by the gas analyzer) during the experiment’s second and third stages (as described in Methods Cultivation Strat-egies). The respiratory quotient (Box 2, Eq. B2.6) was calculated on-line as the ratio between carbon dioxide evolution rate (CER) ( rCO2 ) and the oxygen uptake rate (OUR) ( rO2 ) or, similarly, JCACO2
and JCAO2 . Both JCAO2
and JCACO2
were obtained on-line by a pseudo steady-state material balance for the continuous gas phase (Box 2, B2.4 and B2.5, respectively). The flow rate of fresh medium (F) as a function of JMC
S was calculated using Eq. B2.1 (Box 2). The F equation is the solution of a second-order poly-nomial, which was obtained from a pseudo steady-state
Page 15 of 17Mesquita et al. Microb Cell Fact (2019) 18:150
material balance for the substrate, together with the cell yield definition.
Cell masses mX and mX,0 (Box 2, Eq. B1.1) were obtained at-line using OD measurements. The biomass yield (YX/S) and the volume (V) were estimated at-line by the supervisory system. The value of CSF was set to the actual glucose concentration in the feeding medium (~ 300 g L−1) measured before the experiment was started.
Control adjustments and heuristicsSeveral adjustments were made to provide better perfor-mance for the control system. The first modification was the insertion of an 80-point moving average filter [59] on the input variables: inlet pressure (Pin), outlet tempera-ture (Tout), outlet oxygen fraction ( yO2, out
), outlet carbon dioxide fraction ( yCO2, out
), inlet oxygen fraction ( yO2, in ),
and inlet carbon dioxide fraction ( yCO2, in ). This was done
in order to maintain system stability and protect the equipment (e.g.: mass flow controllers, peristaltic pump) against sudden changes or oscillations [26]. The sec-ond adjustment was the addition of a control delay with Δtlag = 60 s. This value refers to the time interval required for a given change in the gas stream composition to travel through the entire piping system and to be detected by the gas analyzer.
The pseudo-code of the RQ control implemented in the FMC cultivation is shown in Box 3. It can be separated into three conditions, as follows.
In condition (1), the heuristics first determine if the on-line calculated RQ ( RQCA) is between the estab-lished boundaries. If this statement is true, JMC
S and JMCO2
are updated along with F and QAIR (Box 2, Eqs. B2.1 and B2.3, respectively). If the statement in (1) is false, then conditions (2) and (3) are examined.
Condition (2) is true when RQCA is lower than the lower boundary, with the heuristics then calculating JCACO2
at an instant (n) ( JCACO2
_new) and comparing it to JCACO2 at
an instant (n-1) ( JCACO2 _previous). If
(
JCACO2
)
n < (
JCACO2
)
n−1 is true, the last JMC
S , JMCO2
, QAIR, and F are maintained. If false, it means that respiration might be under increasing activation. So, JMC
O2 is decremented by 0.5 mmol gMS
−1 h−1 to increase RQ at the next iteration, and JMC
S , QAIR, and F are updated. The RQCA ’s lower boundary is based on the 90% region of the maximum JMM
EtOH (explained in Methods Metabolic Models Simulations).
Condition (3) is true when RQCA is higher than the upper boundary. In this case, JMC
O2 undergoes an incre-
ment of 0.5 mmol gMS−1 h−1, to decrease RQ at the next
iteration, and JMCS , QAIR, and F are also updated. The
RQCA ’s upper boundary was established due to the mass flow meters operational restrictions.
Supplementary informationSupplementary information accompanies this paper at https ://doi.org/10.1186/s1293 4-019-1198-6.
Additional file 1: Figure S1. Linear correlation used to estimate JMC
S from
JMC
O2 input data. Each state in Fig SM1 corresponds to a different solution
of the GSM, which provides different fluxes of ethanol and biomass. The multiplicity of metabolic states in this figure reflects the use of an 85–100% range of JMM
EtOH . Figure S2. Hyperbolic correlation employed to
estimate JMC
O2 from RQCA (control loop action). The influence of RQCA on
JMM
EtOH is also shown. Figure S3. FMC cultivation profile: biomass (black
square), ethanol (red circle), glycerol (brown inverted triangle), glucose (blue triangle), dissolved oxygen (green line). (a) Beginning of control action; (b) end of fresh medium feeding. Figure S4. BBP cultivation profile: biomass (black square), ethanol (red circle), glycerol (brown inverted triangle), glucose (blue triangle), dissolved oxygen (green line). (a) Begin-ning of fresh medium feeding (F profile reproduced from FMC); (b) end of fresh medium feeding. Figure S5. SAC cultivation profile: biomass (black square), ethanol (red circle), glycerol (brown inverted triangle), glucose (blue triangle), dissolved oxygen (green line). (a) Beginning of fresh medium feeding (F profile reproduced from FMC); (b) end of fresh medium feeding. Table S1. Results of in silico studies (Step 1) using the IND750 metabolic model (DUARTE, HERRGÂRD and PALSSON, 2004). Influence of the oxygen inlet fluxes on the biomass, CO2, and ethanol production fluxes (for an inlet glucose flux of 3 mmol gDW
−1 h−1). *Condi-tions for the maximum ethanol flux production. Table S2. Ethanol fluxes for different oxygen inlet fluxes (Step 2) (considering an inlet glucose flux of 3 mmol gDW −1 h−1). *Inlet O2 flux that led to 90% of the maximum ethanol production flux observed. + Maximum ethanol flux production JMM
EtOHMAX.
AbbreviationscFP: Compact Fieldpoint; CSF: feed flow substrate concentration (g L−1); Cx: at-line dry cell mass concentration (gDW L−1); DOC: In-line dissolved oxygen concentration (% saturation); BBP: “Brazilian Bioethanol Plant”-type fermentation; EtOH: ethanol; F: fresh medium feeding flow (L h−1); FMC: flux-based micro-aeration control; GSM: genome-scale metabolic model; Gly: glycerol; HPLC: high performance liquid chromatography; JCA
O2: control on-line estimated O2 flux (mmol gDW
−1 h−1); JCACO2
: control on-line estimated CO2 flux (mmol gDW
−1 h−1); JExpEtOH: off-line experimental ethanol flux (mmol gDW
−1 h−1); JExpX
: off-line experimental biomass flux (mmol gDW
−1 h−1); JExpGly : off-line experimental glycerol flux (mmol gDW−1 h−1); JExp
X:
off-line experimental biomass flux (mmol gDW−1 h−1); JMC
O2: mathematical correlation
O2 flux (mmol gDW−1 h−1); JMC
S: mathematical correlation substrate flux
(mmol gDW−1 h−1); JMC
O2 _new: JMC
O2 at a moment (n); JMC
O2 _previous: JMC
O2 at a moment
(n − 1); JMC
S _new: JMC
S at a moment (n); JMC
S _previous: JMC
S at a moment (n − 1); JMM
O2
: metabolic model O2 flux (mmol gDW−1 h−1); JMM
CO2: metabolic model CO2 flux
(mmol gDW−1 h−1); JMM
EtOH: metabolic model ethanol flux (mmol gDW
−1 h−1); JMMGly :
metabolic model glycerol flux (mmol gDW−1 h−1); JMM
S: metabolic model substrate flux
(mmol gDW−1 h−1); JMM
X: metabolic model biomass flux (mmol gDW
−1 h−1); mx: off-line dry cell weight (gDW); ms: substrate weight (g); mxin: dry cell weight at the beginning of the feeding (gDW); nO2,in
: inlet oxygen molar flow (mol h−1); nO2,out: outlet oxygen
molar flow (mol h−1); OD600: at-line Optical density at 600 nm; Pin: on-line Inlet pressure (atm); PrpEthanol: ethanol volumetric productivity (g L−1 h−1); Pout: outlet pressure (atm); PrX: cell volumetric productivity (g L−1 h−1); Qgas in: inlet gas flow (L min−1); Qgas out: outlet gas flow (L min−1); QAIR: air flow (L min−1); QAIR_previous: calculated air flow at a moment (n-1); R: universal gas constant (atm L mol−1 K−1); ri: component i production or consumption rate (mmol L−1 h−1); rCO2
: carbon evolution rate (mmol L−1 h−1); rO2
: oxygen uptake rate (mmol L−1 h−1); RQ: respiratory quotient; RQCA: respiratory quotient calculated using on-line data; RQMM: respiratory quotient predicted by the metabolic model; RQ_LowerBound: lower RQ boundary; RQ_UpperBound: upper RQ boundary; S: substrate; SAC: strictly Anaerobic Condition; SIndex: selectivity index; t: time (h); Tin: inlet temperature (K); Tout: in-line Outlet temperature (K); V: control estimated Volume (L); vvm: vessel volumes per minute; vvh: vessel volumes per hour; yCO2in
: control estimated Inlet CO2 fraction; yCO2 out
: on-line Outlet CO2 fraction; yO2 AIR: air O2 fraction; yO2 in
:

Page 16 of 17Mesquita et al. Microb Cell Fact (2019) 18:150
control estimated Inlet O2 fraction; yO2 out: on-line Outlet O2 fraction; YP/S: product
yield (gP g substrate−1); YX/S: biomass yield (gDW g substrate−1); Δt: time interval (program iteration) (h); Δtlag: time delay (s).
AcknowledgementsWe thank Andrew George Allan for its professional English Language revision. The authors also acknowledge the laboratory technician Amadeus Gomes de Azevedo for the HPLC’s analysis.
Authors’ contributionsTCZ and RCG conceived the research. TJBM and ACLH conceived the control logics and set-up SuperSys_Ferm. CRS and TJBM carried out the metabolic model simulations. TJBM ran all experiments, with the support of CRS, SAHP and JRFN. TCZ and ACLH supervised the study. TJBM, with the help of CRS, prepared all figures and boxes. TJBM, CRS, ACLH, RCG and TCZ wrote the manuscript. All authors read and approved the final manuscript.
FundingThis study was financed in part by the Coordenação de Aperfeiçoamento de Pessoal de Nível Superior-Brasil (CAPES)—Finance Code 001. The authors also acknowledge Grants #2016/10636-8, São Paulo Research Foundation (FAPESP) and #409366/2016-1, Brazilian National Council for Scientific and Technologi-cal Development (CNPq) as well as the fellowships from Amazonas Research Foundation (FAPEAM) (Grant No. Programa RH-Edital 001/2015) and from Brazilian National Post Doctoral Program (PNPD/CAPES).
Availability of data and materialsAll data presented in this article, including Additional file 1, are also available from the corresponding author on reasonable request.
Ethics approval and consent to participateNot applicable.
Consent for publicationNot applicable.
Competing interestsThe authors declare that they have no competing interests.
Author details1 Graduate Program of Chemical Engineering, Federal University of São Carlos (PPGEQ-UFSCar), Rodovia Washington Luís, Km 235, São Carlos, SP 13565-905, Brazil. 2 Graduate Program of Chemical Engineering-Institute of Chemistry, Federal University of Goiás (PPGEQ/IQ-UFG), Avenida Esperança, Campus Samambaia, Goiânia, GO 74690-900, Brazil.
Received: 5 November 2018 Accepted: 25 August 2019
References 1. Shuler ML, Kargi F. Bioprocess engineering: basic concepts. 2nd ed. New
Jersey: Prentice Hall; 2002. 2. Lee SC, Hwang YB, Chang HN, Chang YK. Adaptive control of dissolved
oxygen concentration in a bioreactor. Biotechnol Bioeng. 1991;37:597–607. https ://doi.org/10.1002/bit.26037 0702.
3. Mears L, Stocks SM, Albaek MO, Cassells B, Sin G, Gernaey KV. A novel model-based control strategy for aerobic filamentous fungal fed-batch fermentation processes. Biotechnol Bioeng. 2017;114:1459–68. https ://doi.org/10.1002/bit.26274 .
4. Mete T, Ozkan G, Hapoglu H, Alpbaz M. Control of dissolved oxygen concentration using neural network in a batch bioreactor. Comput Appl Eng Educ. 2012;20:619–28. https ://doi.org/10.1002/cae.20430 .
5. Carius L, Rumschinski P, Faulwasser T, Flockerzi D, Grammel H, Findeisen R. Model-based derivation, analysis and control of unstable microaerobic steady-states-considering Rhodospirillum rubrum as an example. Biotech-nol Bioeng. 2014;111:734–47. https ://doi.org/10.1002/bit.25140 .
6. Zeng A-P, Deckwer W-D. Bioreaction techniques under microaerobic conditions: from molecular level to pilot plant reactors. Chem Eng Sci. 1996;51:2305–14.
7. Takagi M, Cabrera-Crespo J, Baruque-Ramos J, Zangirolami TC, Raw I, Tanizaki MM. Characterization of polysaccharide production of Haemo-philus influenzae type b and its relationship to bacterial cell growth. Appl Biochem Biotechnol. 2003;110:91–100.
8. Marthos BV, Ferri ALS, de Figueiredo DB, Zangirolami TC, Gonçalves VM. Capsular polysaccharide production by Streptococcus pneumoniae sero-type 1: from strain selection to fed-batch cultivation. Appl Microbiol Bio-technol. 2015;99:10447–56. https ://doi.org/10.1007/s0025 3-015-6928-z.
9. van de Waterbeemd B, Zomer G, Kaaijk P, Ruiterkamp N, Wijffels RH, van den Dobbelsteen GPJM, et al. Improved production process for native outer membrane vesicle vaccine against Neisseria meningitidis. PLoS ONE. 2013;8:e65157. https ://doi.org/10.1371/journ al.pone.00651 57.
10. López-Abelairas M, Pena R, Fleischhacker L, Lú-Chau TA, Lema JM. Operational strategies for producing bioethanol in a continuous single-stage reactor. Bioprocess Biosyst Eng. 2013;36:1929–37. https ://doi.org/10.1007/s0044 9-013-0969-4.
11. Deniz I, Imamoglu E, Vardar-Sukan F. Aeration-enhanced bioethanol production. Biochem Eng J. 2014;92:41–6.
12. Bellido C, González-Benito G, Coca M, Lucas S, García-Cubero MT. Influ-ence of aeration on bioethanol production from ozonized wheat straw hydrolysates using Pichia stipitis. Bioresour Technol. 2013;133:51–8.
13. Wen RC, Shen CR. Self-regulated 1-butanol production in Escherichia coli based on the endogenous fermentative control. Biotechnol Biofuels. 2016;9:267. https ://doi.org/10.1186/s1306 8-016-0680-1.
14. Chan S, Jantama SS, Kanchanatawee S, Jantama K, Nie Z, Du J. Process optimization on micro-aeration supply for high production yield of 2,3-butanediol from maltodextrin by metabolically-engineered Klebsiella oxytoca. PLoS One. 2016;11:e0161503. https ://doi.org/10.1371/journ al.pone.01615 03.
15. May A, Fischer R-J, Maria Thum S, Schaffer S, Verseck S, Dürre P, et al. A modified pathway for the production of acetone in Escherichia coli. Metab Eng. 2013;15:218–25.
16. Ye L, Zhou X, Bin MS, Li Z, Wu JC. Highly efficient production of l-lactic acid from xylose by newly isolated Bacillus coagulans C106. Bioresour Technol. 2013;132:38–44.
17. Talebnia F. Bioethanol from lignocellulosic wastes: current status and future prospects. In: Karimi K, editor. Lignocellul Bioprod. Switzer-land: Springer International Publishing; 2015. p. 175–206. https ://doi.org/10.1007/978-3-319-14033 -9_5.
18. Pitkänen J-P, Aristidou A, Salusjärvi L, Ruohonen L, Penttilä M. Metabolic flux analysis of xylose metabolism in recombinant Saccharomyces cerevi-siae using continuous culture. Metab Eng. 2003;5:16–31.
19. Wasylenko TM, Stephanopoulos G. Metabolomic and (13)C-metabolic flux analysis of a xylose-consuming Saccharomyces cerevisiae strain expressing xylose isomerase. Biotechnol Bioeng. 2015;112:470–83.
20. Runquist D, Hahn-Hägerdal B, Bettiga M. Increased expression of the oxidative pentose phosphate pathway and gluconeogenesis in anaerobi-cally growing xylose-utilizing Saccharomyces cerevisiae. Microb Cell Fact. 2009;8:49.
21. Bergdahl B, Heer D, Sauer U, Hahn-Hägerdal B, van Niel EW. Dynamic metabolomics differentiates between carbon and energy starvation in recombinant Saccharomyces cerevisiae fermenting xylose. Biotechnol Biofuels. 2012;5:34. https ://doi.org/10.1186/1754-6834-5-34.
22. Alfenore S, Cameleyre X, Benbadis L, Bideaux C, Uribelarrea JL, Goma G, et al. Aeration strategy: A need for very high ethanol performance in Saccharomyces cerevisiae fed-batch process. Appl Microbiol Biotechnol. 2004;63:537–42. https ://doi.org/10.1007/s0025 3-003-1393-5.
23. Ben Chaabane F, Aldiguier AS, Alfenore S, Cameleyre X, Blanc P, Bideaux C, et al. Very high ethanol productivity in an innovative continuous two-stage bioreactor with cell recycle. Bioprocess Biosyst Eng. 2006;29:49–57. https ://doi.org/10.1007/s0044 9-006-0056-1.
24. Xiong Z-Q, Guo M-J, Guo Y-X, Chu J, Zhuang Y-P, Wang NS, et al. RQ feedback control for simultaneous improvement of GSH yield and GSH content in Saccharomyces cerevisiae T65. Enzyme Microb Technol. 2010;46:598–602.
25. Tippmann S, Scalcinati G, Siewers V, Nielsen J. Production of farnesene and santalene by Saccharomyces cerevisiae using fed-batch cultivations with RQ -controlled feed. Biotechnol Bioeng. 2016;113:72–81. https ://doi.org/10.1002/bit.25683 .

Page 17 of 17Mesquita et al. Microb Cell Fact (2019) 18:150
26. Franzén CJ, Albers E, Niklasson C. Use of the inlet gas composition to control the respiratory quotient in microaerobic bioprocesses. Chem Eng Sci. 1996;51:3391–402.
27. Heavner BD, Price ND, Ennis M, Hastings J, Zbinden M, McNaught A, et al. Comparative analysis of yeast metabolic network models highlights progress, opportunities for metabolic reconstruction. PLOS Comput Biol J. 2015;11:e1004530. https ://doi.org/10.1371/journ al.pcbi.10045 30.
28. Agren R, Otero JM, Nielsen J. Genome-scale modeling enables metabolic engineering of Saccharomyces cerevisiae for succinic acid production. J Ind Microbiol Biotechnol. 2013;40:735–47.
29. Xu G, Zou W, Chen X, Xu N, Liu L, Chen J. Fumaric acid production in Sac-charomyces cerevisiae by in silico aided metabolic engineering. PLoS One. 2012;7:e52086. https ://doi.org/10.1371/journ al.pone.00520 86.
30. Quarterman J, Kim SR, Kim P-J, Jin Y-S. Enhanced hexose fermentation by Saccharomyces cerevisiae through integration of stoichiometric modeling and genetic screening. J Biotechnol. 2015;194:48–57.
31. Ng CY, Jung M, Lee J, Oh M-K. Production of 2,3-butanediol in Saccha-romyces cerevisiae by in silico aided metabolic engineering. Microb Cell Fact. 2012;11:68.
32. Gold ND, Gowen CM, Lussier F-X, Cautha SC, Mahadevan R, Martin VJJ. Metabolic engineering of a tyrosine-overproducing yeast platform using targeted metabolomics. Microb Cell Fact. 2015;14:73.
33. Duarte NC, Herrgård MJ, Palsson BØ. Reconstruction and validation of Saccharomyces cerevisiae iND750, a fully compartmentalized genome-scale metabolic model. Genome Res. 2004;14:1298–309.
34. Rocha I, Maia P, Evangelista P, Vilaça P, Soares S, Pinto JP, et al. OptFlux: an open-source software platform for in silico metabolic engineering. BMC Syst Biol. 2010;4:45.
35. Franzén CJ. Metabolic flux analysis of RQ-controlled microaerobic ethanol production by Saccharomyces cerevisiae. Yeast. 2003;20:117–32. https ://doi.org/10.1002/yea.956.
36. Carlsen HN, Degn H, Lloyd D. Effects of alcohols on the respiration and fermentation of aerated suspensions of baker’s yeast. J Gen Microbiol. 1991;137:2879–83. http://www.micro biolo gyres earch .org/docse rver/fullt ext/micro /137/12/mic-137-12-2879.pdf?expir es=15015 09188 &id=id&accna me=guest &check sum=56A22 8855B 368B2 C2783 CB455 F6E3B 9C
37. Fornairon-Bonnefond C, Aguera E, Deytieux C, Sablayrolles J-M, Salmon J-M. Impact of oxygen addition during enological fermentation on sterol contents in yeast lees and their reactivity towards oxygen. J Biosci Bioeng. 2003;95:496–503.
38. Nissen TL, Schulze U, Nielsen J, Villadsen J. Flux distributions in anaerobic, glucose-limited continuous cultures of Saccharomyces cerevisiae. Microbiology. Microbiology Society. 1997;143:203–18. https ://doi.org/10.1099/00221 287-143-1-203.
39. Birch RM, Walker GM. Influence of magnesium ions on heat shock and ethanol stress responses of Saccharomyces cerevisiae. Enzyme Microb Technol. 2000;26:678–87.
40. Mishra P, Prasad R. Relationship between ethanol tolerance and fatty acyl composition of Saccharomyces cerevisiae. Appl Microbiol Biotechnol. 1989;30:294–8. https ://doi.org/10.1007/BF002 56221 .
41. Hocalar A, Türker M. Model based control of minimal overflow metabo-lite in technical scale fed-batch yeast fermentation. Biochem Eng J. 2010;51:64–71.
42. Karapatsia A, Penloglou G, Chatzidoukas C, Kiparissides C. Fed-batch Saccharomyces cerevisiae fermentation of hydrolysate sugars: a dynamic model-based approach for high yield ethanol production. Biomass Bioenergy. 2016;90:32–41.
43. Brandberg T, Gustafsson L, Franzén CJ. The impact of severe nitrogen limi-tation and microaerobic conditions on extended continuous cultivations
of Saccharomyces cerevisiae with cell recirculation. Enzyme Microb Technol. 2007;40:585–93.
44. Joannis-Cassan C, Riess J, Jolibert F, Taillandier P. Optimization of very high gravity fermentation process for ethanol production from industrial sugar beet syrup. Biomass Bioenergy. 2014;70:165–73.
45. Deesuth O, Laopaiboon P, Laopaiboon L. High ethanol production under optimal aeration conditions and yeast composition in a very high gravity fermentation from sweet sorghum juice by Saccharomyces cerevisiae. Ind Crops Prod. 2016;92:263–70.
46. Silva CR, Zangirolami TC, Rodrigues JP, Matugi K, Giordano RC, Giordano RLC. An innovative biocatalyst for production of ethanol from xylose in a continuous bioreactor. Enzyme Microb Technol. 2012;50:35–42.
47. Basso LC, Basso TO, Rocha SN. Ethanol Production in Brazil: The Industrial Process and Its Impact on Yeast Fermentation. Biofuel Prod Dev Prospect. InTech; 2011. http://www.intec hopen .com/books /biofu el-produ ction -recen t-devel opmen ts-and-prosp ects/ethan ol-produ ction -in-brazi l-the-indus trial -proce ss-and-its-impac t-on-yeast -ferme ntati on
48. Amorim HV, Lopes ML, De Castro Oliveira JV, Buckeridge MS, Goldman GH. Scientific challenges of bioethanol production in Brazil. Appl Micro-biol Biotechnol. 2011;91:1267–75.
49. Lopes ML, Paulillo SC, Godoy A, Cherubin RA, Lorenzi MS, Giometti FHC, et al. Ethanol production in Brazil: a bridge between science and industry. Brazilian J Microbiol. 2016;47:64–76.
50. Riesenberg D. High-cell-density cultivation of Escherichia coli. Curr Opin Biotechnol. 1991;2:380–4.
51. Korz DJ, Rinas U, Hellmuth K, Sanders EA, Deckwer WD. Simple fed-batch technique for high cell density cultivation of Escherichia coli. J Biotechnol. 1995;39:59–65.
52. Horta ACL, Sargo CR, da Silva AJ, de Gonzaga M, dos Santos MP, Gon-çalves VM, et al. Intensification of high cell-density cultivations of r E. coli for production of S pneumoniae antigenic surface protein, PspA3, using model-based adaptive control. Bioprocess Biosyst Eng. 2012;35:1269–80.
53. Vélez AM, da Silva AJ, Luperni Horta AC, Sargo CR, Campani G, Gonçalves Silva G, et al. High-throughput strategies for penicillin G acylase produc-tion in rE. coli fed-batch cultivations. BMC Biotechnol. 2014;14:6.
54. Olsson L, Nielsen J. On-line and in situ monitoring of biomass in sub-merged cultivations. Trends Biotechnol. 1997;15:517–22.
55. da Silva AJ, de Baptistaeto Á, do Cilento M, de Giordano R, Zangirolami TC. Bioreactor aeration conditions modulate growth and antigen expression during Erysipelothrix rhusiopathiae cultivation. Appl Microbiol Biotechnol. 2008;79:23–31.
56. Stephanopoulos GN, Aristidou AA, Nielsen J. Chapter 8-Metabolic flux analysis. Metab Eng Princ Methodol. 1998;1:309–51.
57. Lewis NE, Hixson KK, Conrad TM, Lerman JA, Charusanti P, Polpitiya AD, et al. Omic data from evolved E. coli are consistent with computed opti-mal growth from genome-scale models. Mol Syst Biol. 2010;6:390.
58. Ogata K. Modern control engineering. 5th ed. New Jersey: Pearson; 2010. 59. Horta ACL, Da Silva AJ, Sargo CR, Cavalcanti-Montaño ID, Galeano-Suarez
CA, Velez AM, et al. On-line monitoring of biomass concentration based on a capacitance sensor: Assessing the methodology for different bacte-ria and yeast high cell density fed-batch cultures. Brazilian J Chem Eng. Associação Brasileira de Engenharia Química; 2015;32:821–9. http://www.sciel o.br/sciel o.php?scrip t=sci_artte xt&pid=S0104 -66322 01500 04008 21&lng=en&nrm=iso&tlng=en
Publisher’s NoteSpringer Nature remains neutral with regard to jurisdictional claims in pub-lished maps and institutional affiliations.
Related Documents