Metabolic Adaptation

Welcome message from author
This document is posted to help you gain knowledge. Please leave a comment to let me know what you think about it! Share it to your friends and learn new things together.
Transcript
Metabolic Adaptation
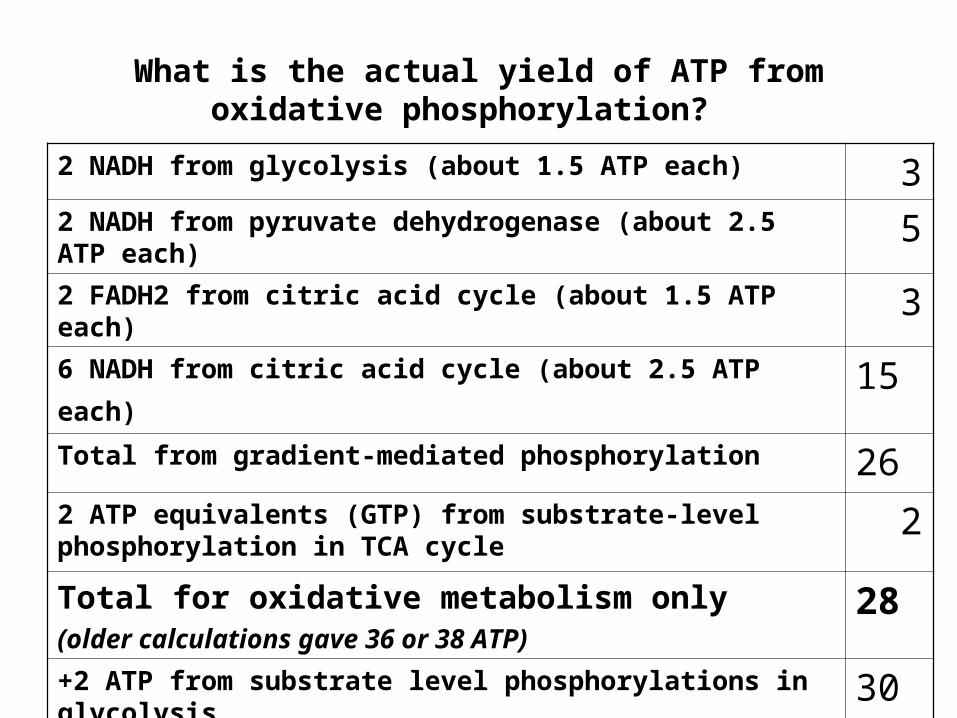
What is the actual yield of ATP from oxidative phosphorylation?
2 NADH from glycolysis (about 1.5 ATP each) 32 NADH from pyruvate dehydrogenase (about 2.5 ATP each) 52 FADH2 from citric acid cycle (about 1.5 ATP each) 3
6 NADH from citric acid cycle (about 2.5 ATP each) 15Total from gradient-mediated phosphorylation 262 ATP equivalents (GTP) from substrate-level phosphorylation in TCA cycle
2
Total for oxidative metabolism only
(older calculations gave 36 or 38 ATP)28
+2 ATP from substrate level phosphorylations in glycolysisThis is the approximate total yield of ATP starting with 1 glucose – remember, it’s not a hard number or necessarily an integer
30

What is an adaptation?
• An evolutionary modification of the characteristics of an organism that facilitates an enhanced ability to survive and reproduce in a particular environment, or to exploit a new environment.

What do metabolic adaptations do?
• Protect cellular function in the face of environmental challenge.
• Modulate energy supply in response to energy demand.

What aspects of energy metabolism can provide material for the operation of natural selection?
• Fuels/energy storage forms
• Pathways/energy yields
• Endproducts

Choosing a fuel:carbohydrate vs fat
• Energy yield for complete oxidation of 6 glucose carbons is 28 ATP total or about 4.6 ATP/C
• Energy yield for complete oxidation of a 16C fatty acid (palmitic acid) is about 91.8 ATP total or a little less than 6 ATP/C
• So, we can get more energy from fat carbons than glucose carbons (i.e. fat is a more reduced material than carbohydrate) – but the difference isn’t huge.

Fat vs carbs, round 2
• However, on an ATP/gram basis, the difference is huge: a gram of fat gives us more than twice the energy of a gram of glycogen.
• This is especially important because an animal has to carry its stored fuel around with it.
Fat is hard to transfer from place to place
• There is a down side to fat – moving fatty acids through the bloodstream at a high rate is a challenge because they are not very water-soluble. Fat can be moved, but only as a complex with carrier protein that surrounds it, forming a lipoprotein. Similar carrier proteins are present in cytoplasm.
• Furthermore, to leave cells or enter them, most triacyglycerols must undergo lipolysis.

It is hard to get energy from fat quickly
Fuel/Pathway Maximum Sustainable Metabolic Rate in mammals (microg ATP/g/min)
Fatty acid oxidation 20
Complete oxidation starting with glycogen
30
Anaerobic glycolysis starting with glucose
60

Reliance on anaerobic glycolysis increases as power output increases
In this graph, the highest rates of power output are sustained by drawing on creatine phosphate stores to recharge ATP stores – but this can be sustained for only a few tens of seconds at most. The term “fermentation” in this graph refers to anaerobic glucose metabolism with glycogen as the startpoint.

Choosing a fuel: carbohydrate versus protein
• Amino acids and carbohydrates are at about the same oxidation state – so although the exact pathways may vary from one amino acid to another, the yield of ATP from a gram of amino acid is about the same as the yield from a gram of glucose.
• However, as in the example of the fly, amino acids can be useful in anapleurotic pathways.
• Proteins frequently are catabolized to meet energy needs.
Adaptation at the level of organs/tissues: heart versus brain
• Mammalian brain and heart are both highly dependent on oxidative metabolism
• The brain is highly adapted to get its AcetylCoA from glycolysis –
• In contrast, the heart can metabolize fatty acids, lactate and some amino acids as well as glucose.
Adaptation of skeletal muscle
• Type I “red” slowly fatiguing slow twitch muscle: preferentially metabolizes fatty acids but can utilize glucose-derived pyruvate
• Type IIB “white” rapidly fatiguing fast twitch muscle – must utilize glucose or glycogen – because few or no mitochondria are present.
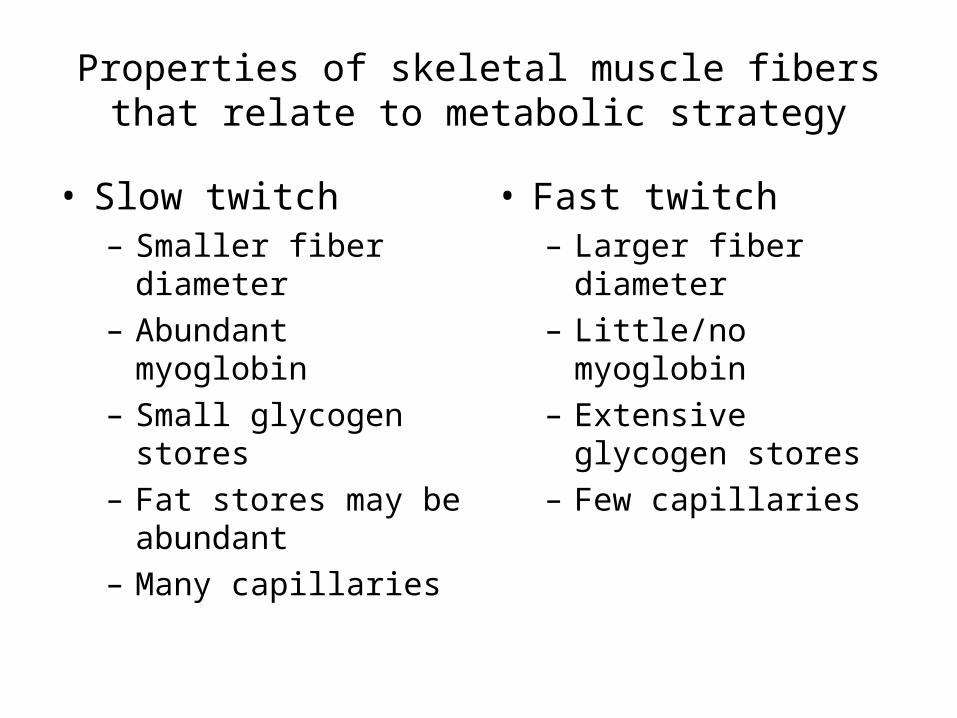
Properties of skeletal muscle fibers that relate to metabolic strategy
• Slow twitch– Smaller fiber diameter– Abundant myoglobin– Small glycogen stores– Fat stores may be
abundant– Many capillaries
• Fast twitch– Larger fiber diameter– Little/no myoglobin– Extensive glycogen
stores– Few capillaries

Hypoxia tolerance - Adaptation at the level of the whole organism: 3 kinds of examples
• Infant mammals vs adult mammals– Fetal heart and brain are significantly more able to tolerate low oxygen
levels than adult organs.
• High altitude animals vs low altitude animals– At high altitudes, oxygen is delivered to the cells at a lower partial
pressure than near sea level, so the oxygen affinities of both hemoglobin (the oxygen carrier) and cytochrome oxidase (the oxygen acceptor) have been increased (an evolutionary process) as species adapted to live at high altitude.
• “Lower” vertebrates vs typical mammals– Some vertebrates can live for phenomenally long periods without
oxygen – aquatic turtles are apparently the champs in this – the heart and brain of the turtle must therefore be able to subsist entirely through the glycolytic pathway and the animal must have large glycogen stores.

The respiratory quotient is an indication of what fuels are being metabolized
• The RQ is the ratio of CO2 produced/ O2 consumed.
• For glucose or glycogen as the starting material, the ratio is 1/1
• For fat as the starting material, the ratio can be as low as 0.7 –when you think about this, remember that the O in the CO2 produced by oxidative metabolism comes from the fuel, not the atmosphere, and fat contains less oxygen per carbon than carbohydrate.
• RQ Values for protein lie between the values for fat and carbohydrate.
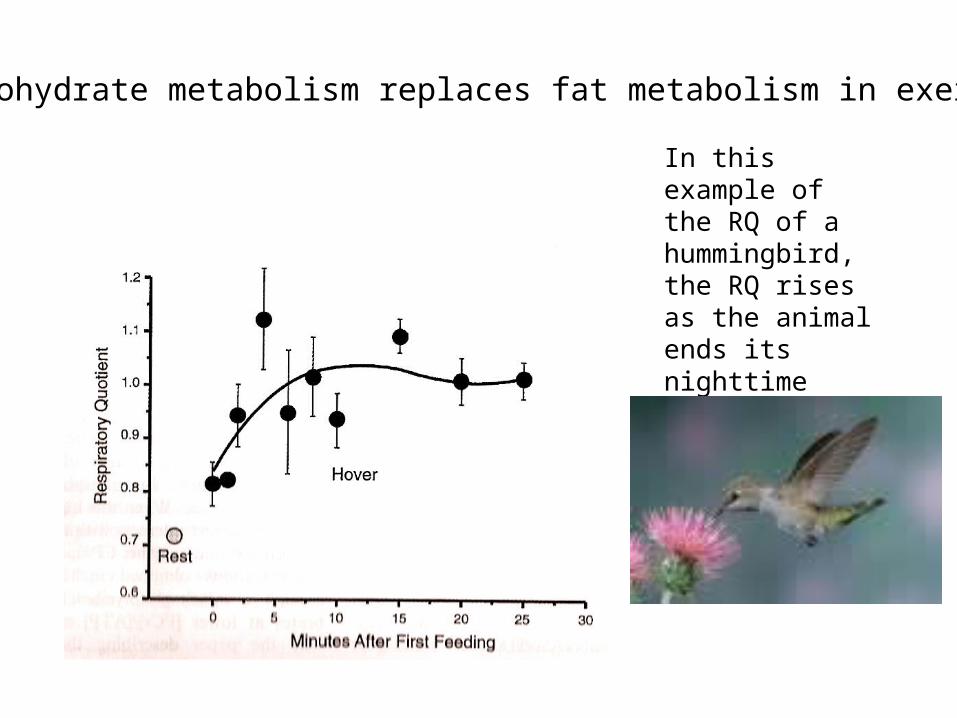
In this example of the RQ of a hummingbird, the RQ rises as the animal ends its nighttime rest and starts foraging.
Carbohydrate metabolism replaces fat metabolism in exertion
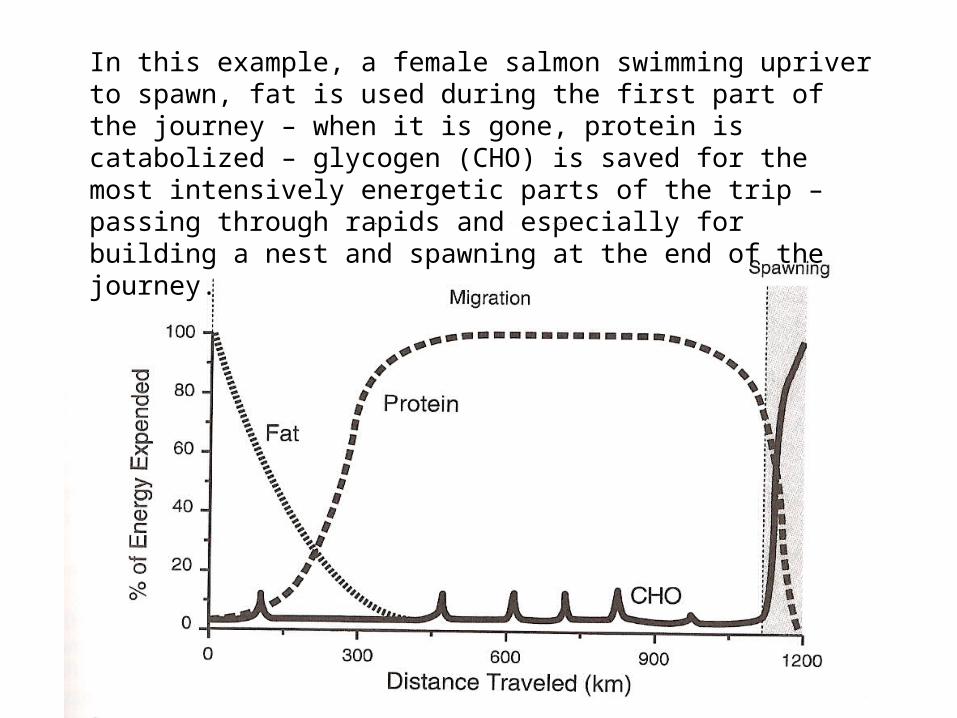
In this example, a female salmon swimming upriver to spawn, fat is used during the first part of the journey – when it is gone, protein is catabolized – glycogen (CHO) is saved for the most intensively energetic parts of the trip – passing through rapids and especially for building a nest and spawning at the end of the journey.

Thought question
• There is a hummingbird species that migrates on a path that crosses the Gulf of Mexico – what fuel should it be using to do this?
Mammalian brown fat: Sometimes, a futile cycle is OK
• Located around heart and around thorax and neck of infant humans and true hibernators.
• Brown color is due to abundant mitochondria – in contrast to ordinary adipose tissue which is white fat.
• Epinephrine released in cold stress or spring rewarming causes production of uncoupling factors that induce a proton leak in inner mitochondrial membrane. Consequently, all of the free energy released by oxidative metabolism of fat appears as heat.

Endproduct Adaptations
• The primary endproducts of amino acid catabolism are NH3 and CO2. The NH3
may be excreted as NH3, NH4
+, urea or uric acid.
• Which option is best depends on the species and life stage.

Structures of ammonia, urea and uric acid

Relative advantages and disadvantages of different endproducts of protein catabolism
• Ammonia + Carbon Dioxide – NH3 is a gas that can be excreted as such (if you
happen to have gills), or converted to NH4+ under
acidic conditions and thus trapped in solution – this happens in urine formation – for this mechanism of excretion, we are also automatically forced to excrete the CO2
as HCO3-
– NH3 is relatively toxic, especially to the brain of
vertebrates
– NH3 is cheap to make, energetically
Urea
• Urea – – readily soluble in water – relatively non-toxic – removes ammonia and carbon dioxide in
stoichiometric amounts, preventing acid-base balance issues
– costly to make – not just a wasteproduct - has a variety of possible
uses in physiology – ex. It is a critical component of the mammalian renal concentrating mechanism.

Uric Acid
• Uric acid and its salts – not very soluble in water – readily form a crystalline
precipitate when concentrated – valuable for animals that form a solid urine to save
water (insects, reptiles, birds), animals that estivate as a closed system (snails, lungfish) or ones that have to accumulate waste products in a closed system (bird and reptile eggs).
– In mammals, most of the relatively little uric acid produced is the result of purine catabolism. Disorders of uric acid excretion can lead to deposits of uric acid crystals in joints, i.e. gout. This is the most common form of inflammatory arthritis in adult men.

The overall outcome of the urea cycle
The two N atoms of urea come from ammonia and aspartate whereas the C comes from the HCO3
-.

These are also the last three steps of the Krebs cycle.
Arginine and ornithine are potent stimulants of growth hormone release in adults. Why does this make metabolic sense?
Remember that glutamate serves as a common collector of amino groups.
Key features of the urea cycle• 5 enzymatic reactions – two are mitochondrial
and 3 are cytosolic. Ornithine can enter the mitochondria in exchange for citrulline, or by a separate process driven by the H+ gradient.
• The mitochondrial enzyme carbamoyl phosphate synthetase is a site of control of urea synthesis – it is activated by increased glutamate concentrations that signal that an increase in deamination is happening.
• Amino groups from glutamate can be fed into the cycle at two different locations.

Elevated SGOT is a clinical indicator of damage to the liver
• SGOT is the abbreviation for “serum glutamate oxaloacetate transaminase” – also called AST (“aspartate aminotransferase”). This enzyme is present in large amounts in liver cells and is released into the plasma by damaged cells in liver disease.
Related Documents