Meta and Longitudinal Analyses of High Death Rates of Some Particular Municipalities in GEJET 2011. ICHARM International Centre for Water Hazard Risk Management under the auspices of UNESCO CTI Engineering Co., Ltd. Japan

Meta and Longitudinal Analyses of High Death Rates of Some Particular Municipalities in GEJET
Feb 23, 2016
Meta and Longitudinal Analyses of High Death Rates of Some Particular Municipalities in GEJET. ICHARM International Centre for Water Hazard Risk Management under the auspices of UNESCO CTI Engineering Co., Ltd. Japan. 2011. 7 .21. IRDR (Integrated Research on Disaster Risk). Working Groups. - PowerPoint PPT Presentation
Welcome message from author
This document is posted to help you gain knowledge. Please leave a comment to let me know what you think about it! Share it to your friends and learn new things together.
Transcript

Meta and Longitudinal Analyses of High Death Rates of Some Particular
Municipalities in GEJET
2011. 7 .21
ICHARM International Centre for Water Hazard Risk Management under the auspices of UNESCO
CTI Engineering Co., Ltd. Japan

IRDR (Integrated Research on Disaster Risk)
Forensic Investigations
Meta-Analysis
Longitudinal Analysis
Critical Cause Analysis
Scenario Analysis
Risk Interpretation and Action
Disaster Loss Data
Working Groups

Why some municipalities had high human losses and the others less?
Where those differences come from?
Identify the Uniqueness of High Human Losses of Particular Municipalities
Purpose Utilizing Meta and longitudinal Analyses, we try to examine:

Over view of GEJET in 2011
M 9.0Death Toll 15,690 Missing 4,735 Completely Destroyed House 112,901 A Partly Destroyed House 144,598 (2011.10.12)
Non Tsunami Affected Area 94 (0.5%)Tsunami Affected Area 20,329 (99.5%)
Epicentral Area (Wave Source Area) : Extending 200 km east to west by 500 km north to south < From off the coast of Hachinohe to off the coast of Kashima >
Tsunami Arrival : Approx. 30min. to 2.5hr (From north <South Sanriku> to south <South Boso Peninsula>)
Tsunami Height :
North of Iwate Prefecture to Ozika Peninsula (220km) : Ria Coastline 20-30 m Max.40mSouth of Ozika Peninsula to Iwaki (150 km) : Straight Coastline 10-20 m
Ibaraki Pref. and Chiba Pref. 5-10 mAomori 5m
Tsunami Height

Over view of GEJET in 2011
Source : FDMA ( 9Sep.2011 )
凡 例
0~1 % 1~3 % 3~5 % 5~10 % 10 % <
Death Number
<(Death Number / Population) in each Municipalities Inundated Areas>
Dead or Missing
1~9 10~99 100~499 500~999 1000~
Death Ratio
Human Loss Ratio (IA)

Dead-Missing
HLRatio (IA) HLratio IA
(km2)
Kuji 4 0.06% 0.01% 4Noda 38 1.2 0.8 2Fudai 1 0.9 1Tanohata 33 2.1 0.9 1Iwaizumi 7 0.6 0.1 1Miyako 544 3.0 1.0 10Yamada 853 7.5 4.6 5Otsuchi 1449 12.2 10.6 4Kamaishi 1180 9.0 3.1 7Ofunato 449 2.4 1.1 8Rikuzentakata 2115 12.7 8.6 13Kesennuma 1414 3.5 1.9 18Minamisanriku 987 6.9 5.7 10Onagawa 949 11.8 9.2 3Total/Average 10023 6.0% 2.8% 88
Human Loss Ratio : Sanriku Ria Coastal Area
Iwate
Miyagi
Fukushima
Sendai
Morioka

Meta-Analysis : Literature survey and statistical analysis
Longitudinal Analysis : Comparative studies of a set of target areas by temporal and historical perspective.
Data Source for this Study <Open Source Data> 1. Central Gov. / 2. Regional Gov. / 3. Organizations / 4. Libraries internet source, major newspapers, statistical data, raw data historical documents, historical statistics, local newspapers, vernacular magazines ※ <Closed Source Data> Field survey data mainly can be utilized for critical cause analysis
Major Source for this Study (Mainly in Japanese)General info : Cabinet Office, Ministry of Internal Affairs and Communications, Fire Defense AgencyVictims related info : National Police AgencyGeographical info : Geospatial Information Authority of JapanLocal info : Iwate Prefectural Gov., Iwate fukko net, Iwate Statistics Data BaseHistorical info : Japan Destructive Earthquake General Survey(Usami, 2003) Japan Maps Encyclopedia(Yamaguchi et al., 1980)
Methodology (How to investigate)

Investigate Human Loss Ratio (IA) in Some Municipalities We need following related info. to investigate ○ Past Experiences Compared to the Past Tsunami Disasters ○ Age Structures in IA Age Structures of the Death People Social Change ○ Evacuation Conditions Distance from Higher Ground Places Evacuation Methods , Warnings , Education/Training, Health However, it is not possible to get those direct data, therefore following approaches were taken
Approach ① Past Experiences : try to estimate HVR (will be explained) and compared to the past tsunami (Meiji<1896>,Showa< 1933>) disasters.
② Age Structures : try to find elderly population rates, social participation rates including recent trends by prefectural statistical data.
③ Evacuation Conditions: Growing population , infrastructures, and evacuation center’s safety in IAs.
Methodology (What do we investigate?)

Following indicator was established to compare to the past tsunami disasters. (Meiji<1896>,Showa< 1933>)
Human Vulnerability Ratio = Human Loss (HL) Ratio Completed House Destroyed(CHD) Ratio
= HL numbers / Total Population CHD numbers / Total House numbers
= HL numbers Total Population × CHD numbers / Total House numbers
Therefore, we could estimate
HVR = HL numbers Affected Population
Approaches ① Past Experiences

Miyagi Iwate
Why do they reverse the historical trends? Did they learn from the experience?
Approaches Past Experiences ①
HVR (%)

Yamada town and Rikuzentakata city
Rikuzentakata city Yamada town
Approach ② Age Structures Approach ③ Evacuation Conditions

Over 60s in Reported Total Dead
3 Pref. Average 65 %Rikuzentakata 61 %Yamada 75 %
Approaches Age Structures ②Age Structures of Reported Death

Approaches Age Structures ②
21% ▼
26%▼
Miyako,Ofunatos, and Kuji are included estimations by the impact of annexation. <miyako (2005.6.6) ofunato (2001.11.15)>

Percentage of HH with Elderly Persons over 65
YamadaTown
Rikuzentakata City
Coastal Area Ave.
Iwate Pref.
Present<Year>
57.4<2006>
62.8<2006>
54.3<2006>
46.1<2006>
Change Ratio
+ 26 %▲( 2004 -2006 )
+ 16 %▲
( 2004-2006 )
+ 25%▲
( 2004-2006 )
+ 19%▲
( 2004- 2006 )
Approaches ② Age Structures

Approaches Age Structures ②
Aging society with less social participation

Yamada town and Rikuzentakata city
Rikuzentakata city Yamada cho
Approach ② Age Structures Approach ③ Evacuation Conditions

Areas Total Population
Dead Ratio (%) Missing Ratio (%)
Yahagi 1793 18 1 4 0
Yokota 1405 14 1 2 0
Takekoma 1291 38 3 4 0
Kesen 3480 194 6 65 2
Takata 7601 879 12 298 4
Yonezaki 2902 82 3 32 1
Otomo 2025 45 2 17 1
Hirota 3749 42 1 16 0
Total 24246 1312 5 438 2
Rikuzentakata city 2011.7.11
Increasing Population in High Risk Area
Approaches ③ Evacuation Conditions

Taka t a – area (high risk area)s populationYear 1896 1940 1945 1950 1954 1995 2000 2005
Pop. 3,489 4,960 6,060 6,461 6,488 7,605 7,663 7,711
Meiji(1896) Showa(1933)
Approaches ③ Evacuation Conditions

陸前高田 市街地の変化
2000 年
1913 年 1933 年
1968 年
1952 年
1960-1966 Tsunami Project
Approaches Evacuation Conditions③

Before
After
Approaches ③ Evacuation Conditions

TOPICS : In the Takata area (high risk area) , Rikuzentakata city , 70-80 evacuated and only 3 survived at Civic Gymnasium. (Source : Kahoku Shinbun)
PrimaryEvacuation Centers
Iwate Prefecture
Rikuzentakata city
Total Numbers
411 68
Affected 48 35
Affected Ratio
11.7 % 51.5 %
Approaches ③ Evacuation Conditions
Affected Primary Evacuation Center

Why some municipalities had high human losses and the others less?
Where those differences come from? Identify the Uniqueness of High Human Losses of
Particular Municipalities
Methods : Meta and Longitudinal Analysis - Development of the HVR. - Surveys of literatures, statistical data sets, and maps.
Conclusion (Try to answer the first 3 inquiries)
Findings: Yamada town : Aging society with low social participation especially since 1980s Rikuzentakata city : Increasing pop. in high risk areas, especially after the last tsunami Combination with critical cause analysis should be implemented to investigate more detail
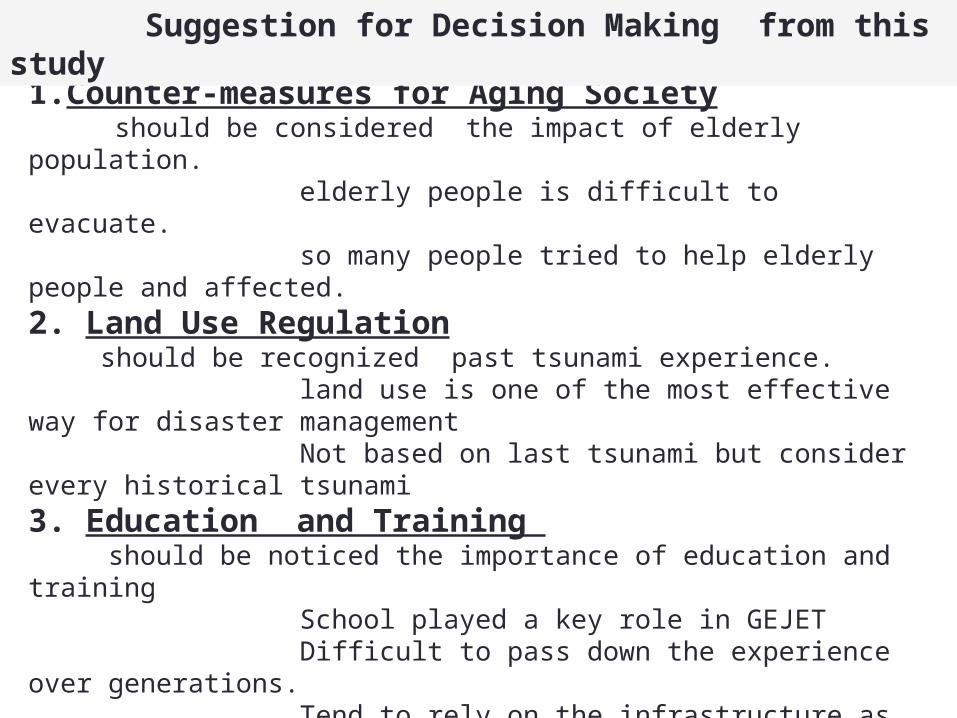
1.Counter-measures for Aging Society should be considered the impact of elderly population. elderly people is difficult to evacuate. so many people tried to help elderly people and affected.2. Land Use Regulation should be recognized past tsunami experience. land use is one of the most effective way for disaster management Not based on last tsunami but consider every historical tsunami3. Education and Training should be noticed the importance of education and training School played a key role in GEJET Difficult to pass down the experience over generations. Tend to rely on the infrastructure as time passes.
4. Evacuation Planning should be remarked the location of evacuation centers and related planning
These should be considered based on “Worst Case Scenario”
Suggestion for Decision Making from this study

Many Thanks
2011. 7 .21
ICHARM International Centre for Water Hazard Risk Management under the auspices of UNESCO
CTI Engineering Co., Ltd. Japan
Related Documents