Meta-analysis of Yield QTLs Derived from Inter-specific Crosses of Rice Reveals Consensus Regions and Candidate Genes B. P. Mallikarjuna Swamy & Neelamraju Sarla # Springer-Verlag 2010 Abstract Several reports on mapping and introgression of quantitative trait loci (QTLs) for yield and related traits from wild species showed their importance in yield improvement. The aim of this study was to locate common major effect, consistent and precise yield QTLs across the wild species of rice by applying genome-wide QTL meta- analysis for their use in marker-aided selection (MAS) and candidate gene identification. Seventy-six yield QTLs reported in 11 studies involving inter-specific crosses were projected on a consensus map consisting of 699 markers. The integration of 11 maps resulted in a consensuses map of 1,676 cM. The number of markers ranged from 32 on chromosome 12 to 96 on chromosome 1. The order of markers between consensus map and original map was generally consistent. Meta-analysis of 68 yield QTLs resulted in 23 independent meta-QTLs on ten different chromosomes. Eight meta-QTLs were less than 1.3 Mb. The smallest confidence interval of a meta-QTL (MQTL) was 179.6 kb. Four MQTLs were around 500 kb and two of these correspond to a reasonably small genetic distance 4.6 and 5.2 cM, respectively, and suitable for MAS. MQTL8.2 was 326-kb long with a 35-cM interval indicating it was in a recombination hot spot and suitable for fine mapping. Our results demonstrate the narrowing down of initial yield QTLs by Meta-analysis and thus enabling short listing of QTLs worthy of MAS or fine mapping. The candidate genes shortlisted are useful in validating their function either by loss of function or over expression. Keywords Meta-analysis . Oryza sativa . Wild species . Yield . Marker-assisted selection . Candidate genes Introduction Rice is a major staple food crop for more than half of the world’ s population. When all developing countries are considered together, rice provides 27% of dietary energy supply and 20% of dietary protein intake (www.fao.org). The observed levelling-off of yield in rice cultivars along with the adverse effects of climate and deteriorating environmen- tal health in rice growing areas are of concern in today’ s food security priorities. It is increasingly being recognized that exploitation of gene pools of wild progenitor species is the fastest and acceptable approach to achieve the twin goals of high productivity and adaptability in any crop (Gur and Zamir 2004; McCouch et al. 2007; Kovach and McCouch 2008; Swamy and Sarla 2008). It is therefore important to identify QTLs from wild × cultivated crosses and to intro- gress those in cultivated varieties through marker-aided selection (MAS). This would provide impetus to marker- assisted breeding on one hand and enable gene discovery on the other for sustainable rice production (Fridman et al. 2004; Ashikari and Matsuoka 2006). Yield is governed by several quantitative trait loci (QTLs) across the genome and their effect changes with Electronic supplementary material The online version of this article (doi:10.1007/s11105-010-0274-1) contains supplementary material, which is available to authorized users. B. P. M. Swamy : N. Sarla (*) Biotechnology, Directorate of Rice Research, Rajendranagar, Hyderabad, Andhra Pradesh, India 500030 e-mail: [email protected] B. P. M. Swamy e-mail: [email protected] B. P. M. Swamy Plant Breeding, Genetics and Biotechnology Division, International Rice Research Institute, DAPO Box 7777, Metro Manila, Philippines Plant Mol Biol Rep (2011) 29:663– DOI 10.1007/s11105-010-0274-1 680 Published online: 2010 14 December

Welcome message from author
This document is posted to help you gain knowledge. Please leave a comment to let me know what you think about it! Share it to your friends and learn new things together.
Transcript
Meta-analysis of Yield QTLs Derived from Inter-specificCrosses of Rice Reveals Consensus Regions and CandidateGenes
B. P. Mallikarjuna Swamy & Neelamraju Sarla
# Springer-Verlag 2010
Abstract Several reports on mapping and introgression ofquantitative trait loci (QTLs) for yield and related traitsfrom wild species showed their importance in yieldimprovement. The aim of this study was to locate commonmajor effect, consistent and precise yield QTLs across thewild species of rice by applying genome-wide QTL meta-analysis for their use in marker-aided selection (MAS) andcandidate gene identification. Seventy-six yield QTLsreported in 11 studies involving inter-specific crosses wereprojected on a consensus map consisting of 699 markers.The integration of 11 maps resulted in a consensuses mapof 1,676 cM. The number of markers ranged from 32 onchromosome 12 to 96 on chromosome 1. The order ofmarkers between consensus map and original map wasgenerally consistent. Meta-analysis of 68 yield QTLsresulted in 23 independent meta-QTLs on ten differentchromosomes. Eight meta-QTLs were less than 1.3 Mb.The smallest confidence interval of a meta-QTL (MQTL)was 179.6 kb. Four MQTLs were around 500 kb and two ofthese correspond to a reasonably small genetic distance 4.6and 5.2 cM, respectively, and suitable for MAS. MQTL8.2
was 326-kb long with a 35-cM interval indicating it was ina recombination hot spot and suitable for fine mapping. Ourresults demonstrate the narrowing down of initial yieldQTLs by Meta-analysis and thus enabling short listing ofQTLs worthy of MAS or fine mapping. The candidategenes shortlisted are useful in validating their functioneither by loss of function or over expression.
Keywords Meta-analysis .Oryza sativa . Wild species .
Yield .Marker-assisted selection . Candidate genes
Introduction
Rice is a major staple food crop for more than half of theworld’s population. When all developing countries areconsidered together, rice provides 27% of dietary energysupply and 20% of dietary protein intake (www.fao.org). Theobserved levelling-off of yield in rice cultivars along withthe adverse effects of climate and deteriorating environmen-tal health in rice growing areas are of concern in today’sfood security priorities. It is increasingly being recognizedthat exploitation of gene pools of wild progenitor species isthe fastest and acceptable approach to achieve the twin goalsof high productivity and adaptability in any crop (Gur andZamir 2004; McCouch et al. 2007; Kovach and McCouch2008; Swamy and Sarla 2008). It is therefore important toidentify QTLs from wild×cultivated crosses and to intro-gress those in cultivated varieties through marker-aidedselection (MAS). This would provide impetus to marker-assisted breeding on one hand and enable gene discovery onthe other for sustainable rice production (Fridman et al.2004; Ashikari and Matsuoka 2006).
Yield is governed by several quantitative trait loci(QTLs) across the genome and their effect changes with
Electronic supplementary material The online version of this article(doi:10.1007/s11105-010-0274-1) contains supplementary material,which is available to authorized users.
B. P. M. Swamy :N. Sarla (*)Biotechnology, Directorate of Rice Research,Rajendranagar,Hyderabad, Andhra Pradesh, India 500030e-mail: [email protected]
B. P. M. Swamye-mail: [email protected]
B. P. M. SwamyPlant Breeding, Genetics and Biotechnology Division,International Rice Research Institute,DAPO Box 7777, Metro Manila, Philippines
Plant Mol Biol Rep (2011) 29:663–DOI 10.1007/s11105-010-0274-1
680
Published online: 201014 December
the genomic and environmental context. So far only fewyield QTLs have been successfully used in MAS (Liang etal. 2004). Most of the QTLs for yield have been mapped inearly generations (F2, BC2, and BC2F2), in limited numberof environments and genetic backgrounds. Use of suchQTLs in MAS is less likely to yield desired results becauseof their inconsistent performance in subsequent generationsand in different environments. However, it is difficult toevaluate the mapping populations in all possible environ-ments to identify such large effect and consistent QTLsacross the genetic backgrounds.
The most precise major effect yield QTLs identified atthe same chromosomal location across studies are moreuseful in MAS and positional cloning to identifycandidate genes (Swamy and Sarla 2008; Price 2006).Different approaches can be followed to find preciselocation of common large effect QTLs across the studies.One approach is the bibliographic review of QTLsaffecting a trait and their comparison across studies forco-location and effect, which is supported by a statisticalanalysis and graphical representation (Chardon et al.2004). Another approach is the joint analysis of raw datacollected from mapping populations in several experi-ments. However, this approach is impossible due tounavailability of raw data from individual studies andvastly differing data structures.
QTL meta-analysis is an approach to identify consen-sus QTL across studies, to validate QTL effects acrossenvironments/genetic backgrounds and also to refine theQTL positions on the consensus map (Goffinet andGerber 2000). QTL meta-analysis requires independentQTLs for the same trait obtained from different plantpopulations, different locations, or different environmentalconditions (Goffinet and Gerber 2000). The consistentQTL identified by meta-analysis for a set of QTLs at a
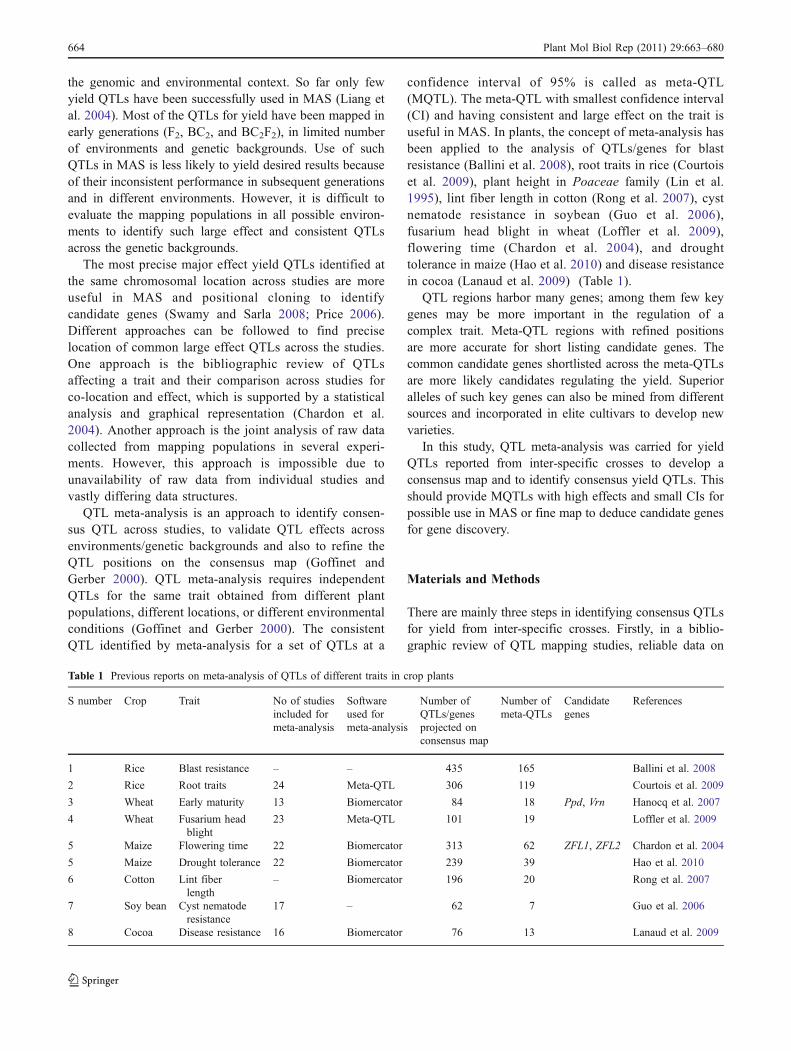
confidence interval of 95% is called as meta-QTL(MQTL). The meta-QTL with smallest confidence interval(CI) and having consistent and large effect on the trait isuseful in MAS. In plants, the concept of meta-analysis hasbeen applied to the analysis of QTLs/genes for blastresistance (Ballini et al. 2008), root traits in rice (Courtoiset al. 2009), plant height in Poaceae family (Lin et al.1995), lint fiber length in cotton (Rong et al. 2007), cystnematode resistance in soybean (Guo et al. 2006),fusarium head blight in wheat (Loffler et al. 2009),flowering time (Chardon et al. 2004), and droughttolerance in maize (Hao et al. 2010) and disease resistancein cocoa (Lanaud et al. 2009) (Table 1).
QTL regions harbor many genes; among them few keygenes may be more important in the regulation of acomplex trait. Meta-QTL regions with refined positionsare more accurate for short listing candidate genes. Thecommon candidate genes shortlisted across the meta-QTLsare more likely candidates regulating the yield. Superioralleles of such key genes can also be mined from differentsources and incorporated in elite cultivars to develop newvarieties.
In this study, QTL meta-analysis was carried for yieldQTLs reported from inter-specific crosses to develop aconsensus map and to identify consensus yield QTLs. Thisshould provide MQTLs with high effects and small CIs forpossible use in MAS or fine map to deduce candidate genesfor gene discovery.
Materials and Methods
There are mainly three steps in identifying consensus QTLsfor yield from inter-specific crosses. Firstly, in a biblio-graphic review of QTL mapping studies, reliable data on
Table 1 Previous reports on meta-analysis of QTLs of different traits in crop plants
S number Crop Trait No of studiesincluded formeta-analysis
Softwareused formeta-analysis
Number ofQTLs/genesprojected onconsensus map
Number ofmeta-QTLs
Candidategenes
References
1 Rice Blast resistance – – 435 165 Ballini et al. 2008
2 Rice Root traits 24 Meta-QTL 306 119 Courtois et al. 2009
3 Wheat Early maturity 13 Biomercator 84 18 Ppd, Vrn Hanocq et al. 2007
4 Wheat Fusarium headblight
23 Meta-QTL 101 19 Loffler et al. 2009
5 Maize Flowering time 22 Biomercator 313 62 ZFL1, ZFL2 Chardon et al. 2004
5 Maize Drought tolerance 22 Biomercator 239 39 Hao et al. 2010
6 Cotton Lint fiberlength
– Biomercator 196 20 Rong et al. 2007
7 Soy bean Cyst nematoderesistance
17 – 62 7 Guo et al. 2006
8 Cocoa Disease resistance 16 Biomercator 76 13 Lanaud et al. 2009
664 Plant Mol Biol Rep (2011) 29:663–680
QTLs for yield was compiled (Supplementary Table 1).Secondly, a consensus map was created and on thisconsensus map QTLs of individual studies were projected.In the third step, a meta-analysis was performed on QTLclusters to identify the consensus MQTL.
Bibliographic Review and Synthesis of Yield QTL Data
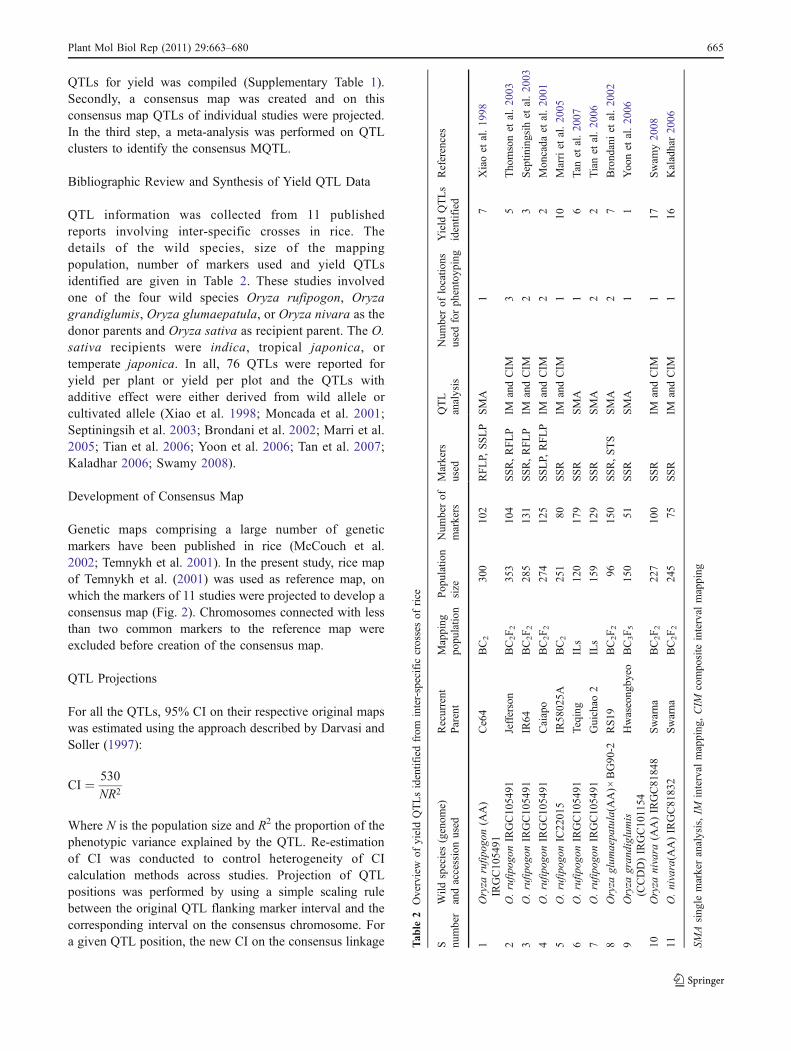
QTL information was collected from 11 publishedreports involving inter-specific crosses in rice. Thedetails of the wild species, size of the mappingpopulation, number of markers used and yield QTLsidentified are given in Table 2. These studies involvedone of the four wild species Oryza rufipogon, Oryzagrandiglumis, Oryza glumaepatula, or Oryza nivara as thedonor parents and Oryza sativa as recipient parent. The O.sativa recipients were indica, tropical japonica, ortemperate japonica. In all, 76 QTLs were reported foryield per plant or yield per plot and the QTLs withadditive effect were either derived from wild allele orcultivated allele (Xiao et al. 1998; Moncada et al. 2001;Septiningsih et al. 2003; Brondani et al. 2002; Marri et al.2005; Tian et al. 2006; Yoon et al. 2006; Tan et al. 2007;Kaladhar 2006; Swamy 2008).
Development of Consensus Map
Genetic maps comprising a large number of geneticmarkers have been published in rice (McCouch et al.2002; Temnykh et al. 2001). In the present study, rice mapof Temnykh et al. (2001) was used as reference map, onwhich the markers of 11 studies were projected to develop aconsensus map (Fig. 2). Chromosomes connected with lessthan two common markers to the reference map wereexcluded before creation of the consensus map.
QTL Projections
For all the QTLs, 95% CI on their respective original mapswas estimated using the approach described by Darvasi andSoller (1997):
CI ¼ 530
NR2
Where N is the population size and R2 the proportion of thephenotypic variance explained by the QTL. Re-estimationof CI was conducted to control heterogeneity of CIcalculation methods across studies. Projection of QTLpositions was performed by using a simple scaling rulebetween the original QTL flanking marker interval and thecorresponding interval on the consensus chromosome. Fora given QTL position, the new CI on the consensus linkage T
able
2Overview
ofyieldQTLsidentifiedfrom
inter-specific
crossesof
rice
S number
Wild
species(genom
e)andaccessionused
Recurrent
Parent
Mapping
popu
latio
nPop
ulation
size
Num
berof
markers
Markers
used
QTL
analysis
Num
berof
locatio
nsused
forph
entoyp
ing
Yield
QTLs
identified
References
1Oryza
rufip
ogon
(AA)
IRGC10
5491
Ce64
BC2
300
102
RFLP,
SSLP
SMA
17
Xiaoet
al.19
98
2O.rufip
ogon
IRGC10
5491
Jefferson
BC2F2
353
104
SSR,RFLP
IMandCIM
35
Tho
msonet
al.20
03
3O.rufip
ogon
IRGC10
5491
IR64
BC2F2
285
131
SSR,RFLP
IMandCIM
23
Septin
ingsih
etal.20
03
4O.rufip
ogon
IRGC10
5491
Caiapo
BC2F2
274
125
SSLP,
RFLP
IMandCIM
22
Mon
cada
etal.20
01
5O.rufip
ogon
IC22
015
IR58
025A
BC2
251
80SSR
IMandCIM
110
Marriet
al.20
05
6O.rufip
ogon
IRGC10
5491
Teqing
ILs
120
179
SSR
SMA
16
Tan
etal.20
07
7O.rufip
ogon
IRGC10
5491
Guichao
2ILs
159
129
SSR
SMA
22
Tianet
al.20
06
8Oryza
glum
aepa
tula(A
A)×
BG90
-2RS19
BC2F2
9615
0SSR,STS
SMA
27
Brond
aniet
al.20
02
9Oryza
gran
diglum
is(CCDD)IRGC10
1154
Hwaseong
byeo
BC3F5
150
51SSR
SMA
11
Yoo
net
al.20
06
10Oryza
nivara
(AA)IRGC81
848
Swarna
BC2F2
227
100
SSR
IMandCIM
117
Swam
y20
08
11O.nivara(A
A)IRGC81
832
Swarna
BC2F2
245
75SSR
IMandCIM
116
Kaladhar20
06
SMAsing
lemarkeranalysis,IM
interval
mapping
,CIM
compo
site
interval
mapping
Plant Mol Biol Rep (2011) 29:663–680 665
group was approximated with a Gaussian distribution aroundthe most likely QTL position. All projections of QTL onto theconsensus map were performed using the Biomercator 2.0(Arcade et al. 2004) (www.genoplante.org).
Meta-analysis
The meta-analysis was performed on the QTL clusters on eachchromosome using the Biomercator 2.0 (Arcade et al. 2004).The Akaike information criterion (AIC) was used to selectthe QTL model on each chromosome (Akaike 1974).According to this criterion, the QTL model with least AICvalue is considered the significant model indicating thenumber of meta-QTLs.
Insilico Identification of Candidate Genes
The 23 meta-QTLs were analyzed for the presence of genesregulating yield traits based on the comparative genomicsapproach with O. sativa Nipponbare sequences (www.rapdatabase.org). Gene content was noted based on anno-tated data of homologous regions in Nipponbare usingRAP, Build 5 (www.rapdatabase.org). It is assumed that thegenes identified in Nipponbare regions are homologous andcollinear to those underlying the yield enhancing QTLsmapped in different studies involving different donor wildspecies and recipients.
Results
Overview
In the 11 populations of rice derived from inter-specificcrosses, population size ranged from 96 (Brondani et al. 2002)to 353 lines (Thomson et al. 2003). The number of markersused ranged from 80 (Marri et al. 2005) to 150 (Moncada etal. 2001). The number of locations for phenotyping varied
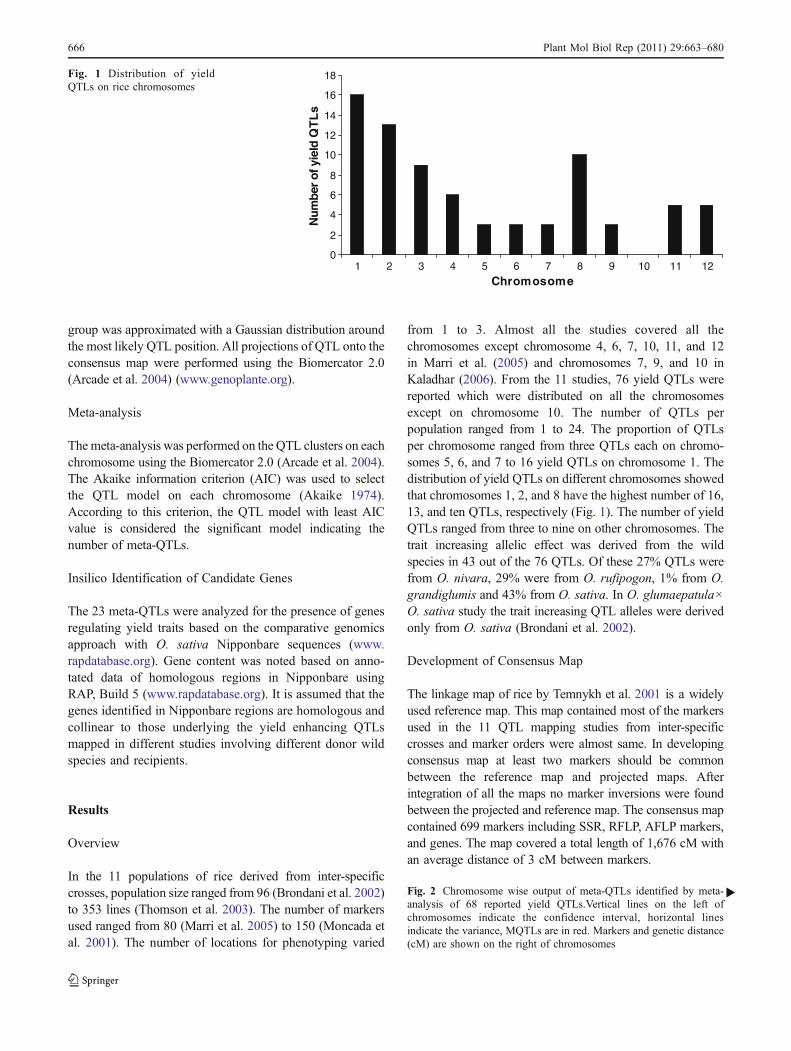
from 1 to 3. Almost all the studies covered all thechromosomes except chromosome 4, 6, 7, 10, 11, and 12in Marri et al. (2005) and chromosomes 7, 9, and 10 inKaladhar (2006). From the 11 studies, 76 yield QTLs werereported which were distributed on all the chromosomesexcept on chromosome 10. The number of QTLs perpopulation ranged from 1 to 24. The proportion of QTLsper chromosome ranged from three QTLs each on chromo-somes 5, 6, and 7 to 16 yield QTLs on chromosome 1. Thedistribution of yield QTLs on different chromosomes showedthat chromosomes 1, 2, and 8 have the highest number of 16,13, and ten QTLs, respectively (Fig. 1). The number of yieldQTLs ranged from three to nine on other chromosomes. Thetrait increasing allelic effect was derived from the wildspecies in 43 out of the 76 QTLs. Of these 27% QTLs werefrom O. nivara, 29% were from O. rufipogon, 1% from O.grandiglumis and 43% from O. sativa. In O. glumaepatula×O. sativa study the trait increasing QTL alleles were derivedonly from O. sativa (Brondani et al. 2002).
Development of Consensus Map
The linkage map of rice by Temnykh et al. 2001 is a widelyused reference map. This map contained most of the markersused in the 11 QTL mapping studies from inter-specificcrosses and marker orders were almost same. In developingconsensus map at least two markers should be commonbetween the reference map and projected maps. Afterintegration of all the maps no marker inversions were foundbetween the projected and reference map. The consensus mapcontained 699 markers including SSR, RFLP, AFLP markers,and genes. The map covered a total length of 1,676 cM withan average distance of 3 cM between markers.
0
2
4
6
8
10
12
14
16
18
1 2 3 4 5 6 7 8 9 10 11 12
Chromosome
Num
ber
of y
ield
QT
Ls
Fig. 1 Distribution of yieldQTLs on rice chromosomes
Fig. 2 Chromosome wise output of meta-QTLs identified by meta-analysis of 68 reported yield QTLs.Vertical lines on the left ofchromosomes indicate the confidence interval, horizontal linesindicate the variance, MQTLs are in red. Markers and genetic distance(cM) are shown on the right of chromosomes
�
66 Plant Mol Biol Rep (2011) 29:663–6806
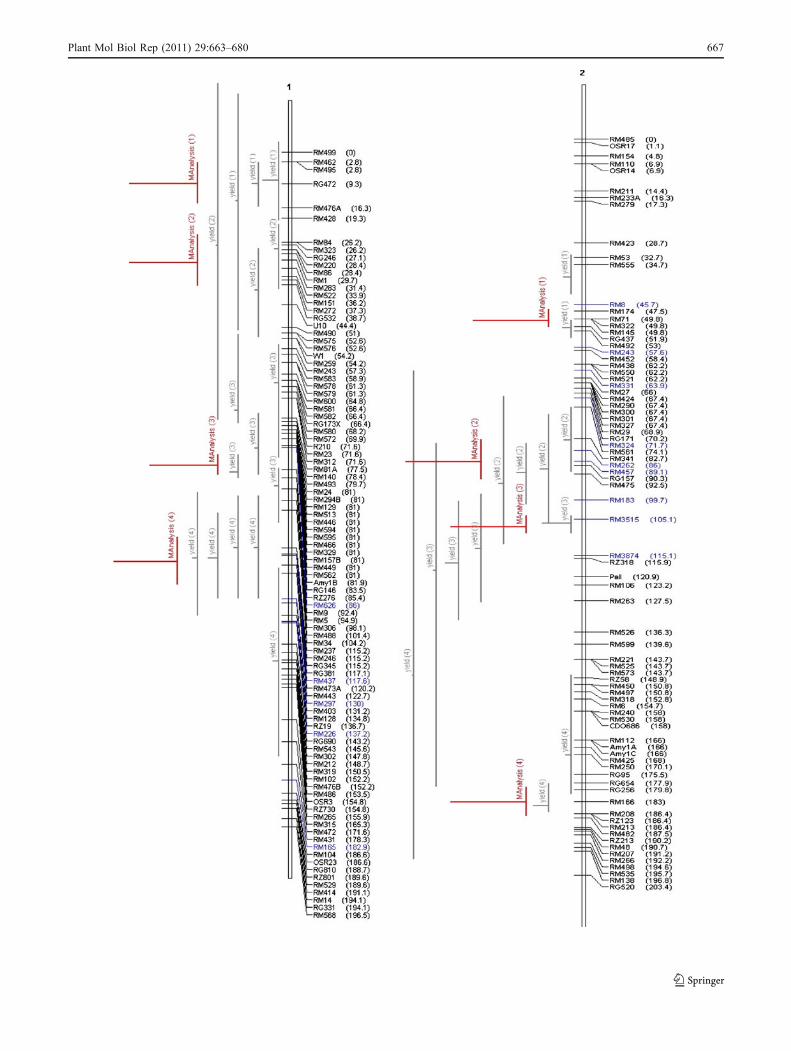
Plant Mol Biol Rep (2011) 29:663–680 667
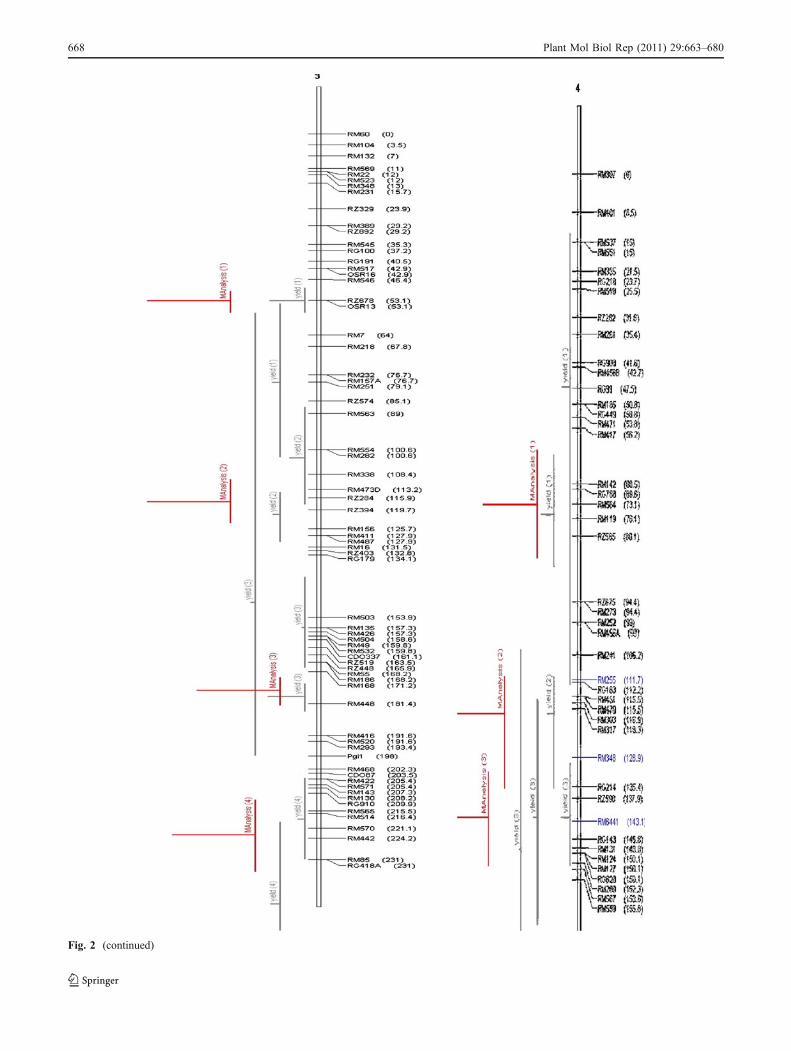
Fig. 2 (continued)
66 Plant Mol Biol Rep (2011) 29:663–6808
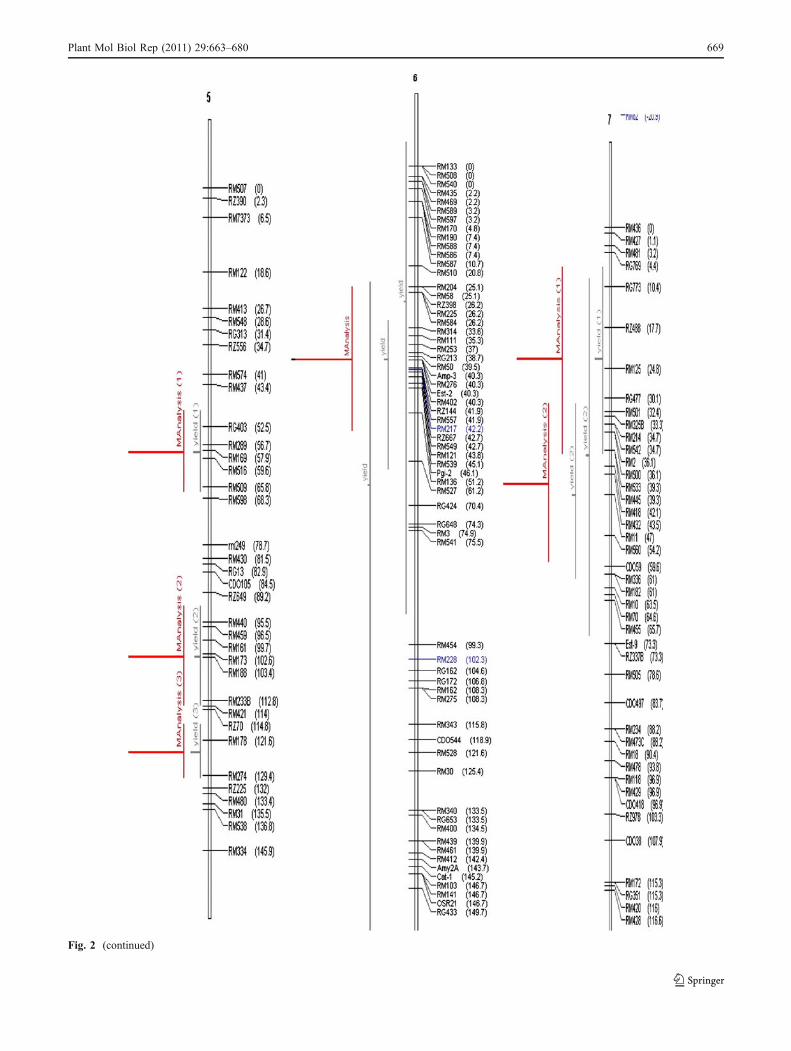
Fig. 2 (continued)
Plant Mol Biol Rep (2011) 29:663–680 669
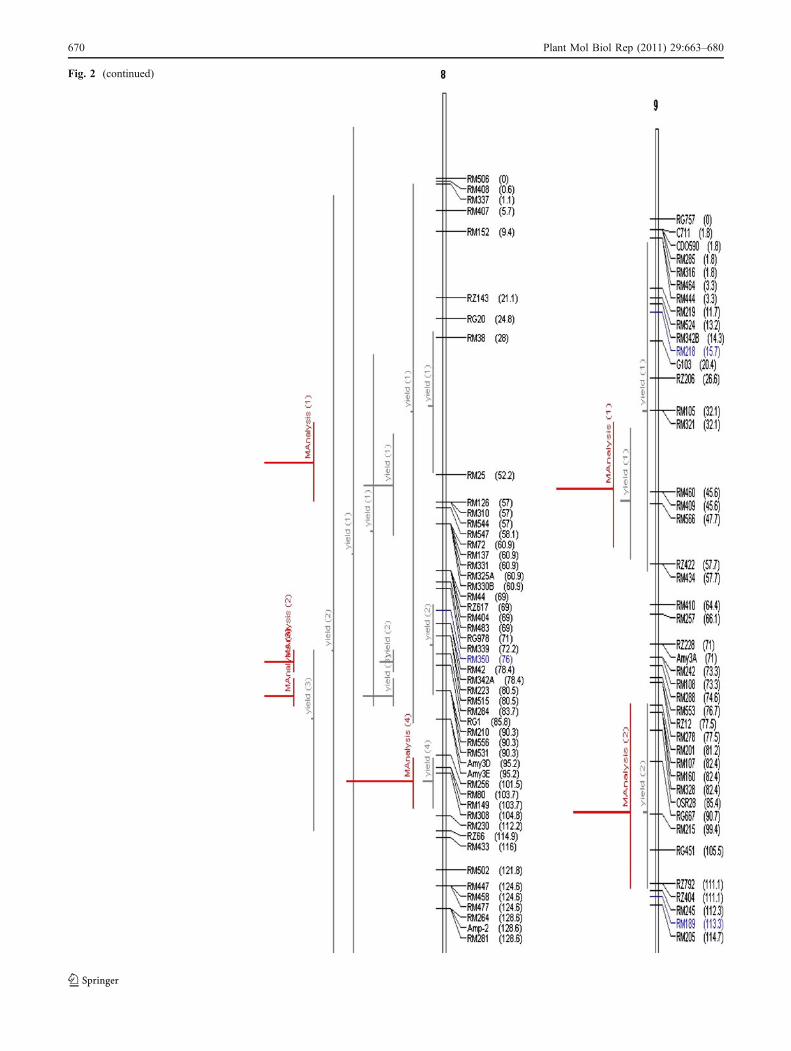
Fig. 2 (continued)
6 Plant Mol Biol Rep (2011) 29:663–68070
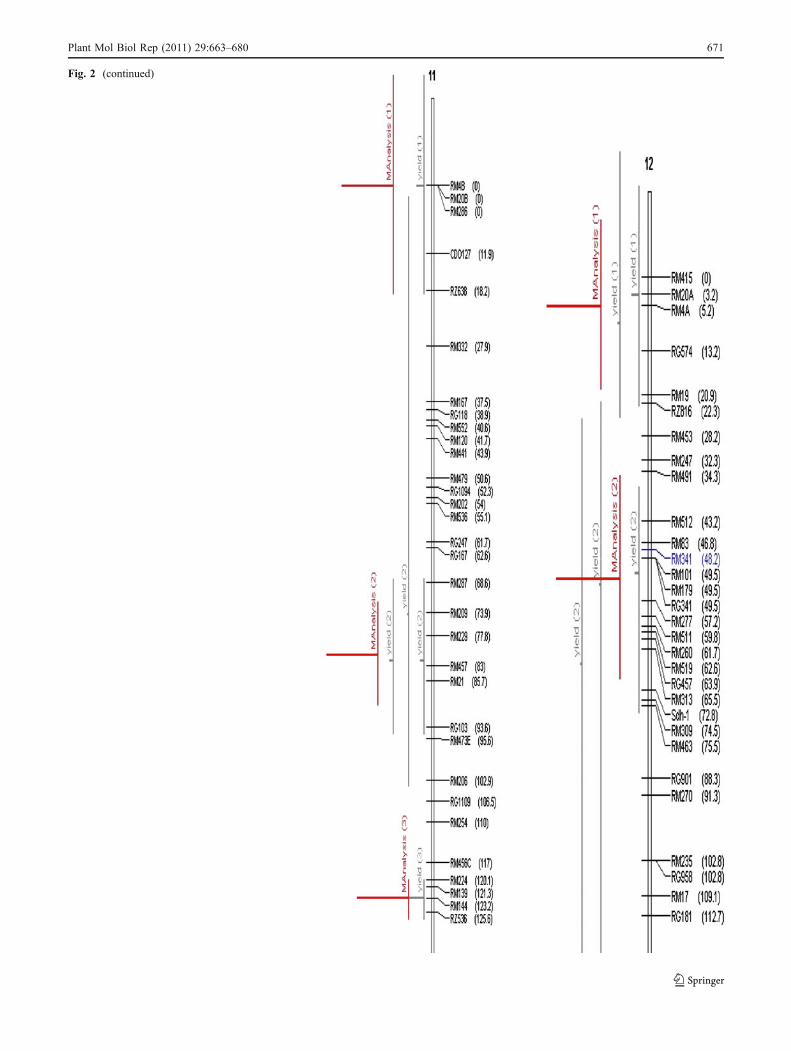
Fig. 2 (continued)
Plant Mol Biol Rep (2011) 29:663–680 671
Tab
le3
Yield
QTLsidentifiedby
meta-analysis
Snu
mberMQTL
Chrom
osom
esQTL
region
AIC
value
QTL
mod
elNum
ber
ofinitial
QTL
Meanvariance
ofinitial
QTL(R
2)
shortestCI
ofinitial
QTL(cM)
Mean
Initial
CI(cM)
MQTL
CI
(95%
)(cM)
Phy
sical
leng
thof
MQTL
(Mb)
KB/cM
Coefficient
ofReductio
nin
leng
thfrom
shortestinitial
QTLto
MQTL
Coefficient
ofredu
ctionin
leng
thfrom
meaninitial
QTLto
MQTL
MQTL
rank
for
MAS/
fine
mapping
1MQTL1.1
1RM49
9–RM42
816
3.4
43
9.3
6.9
13.1
11.3
2.2
196.2
0.6
1.1
2MQTL1.2
1RM32
3–RM15
13
6.0
13.5
28.9
15.0
1.3
89.6
0.9
2.0
3MQTL1.3
1RM62
6–RM9
55.7
11.6
24.2
5.5
10.2
1,85
6.9
2.1
4.4
4MQTL1.4
1RM24
6–RM44
35
9.4
2.9
14.6
14.2
1.00
70.7
0.2
1.0
7
5MQTL2.1
2RM17
4–RM49
213
7.4
42
10.5
36.9
37.9
4.6
0.28
60.8
8.0
8.2
2
6MQTL2.2
2RM34
1–RM47
54
7.7
10.0
17.6
10.9
1.06
97.4
0.9
1.7
7MQTL2.3
2RM38
74–
RM35
154
14.6
10.8
26.5
5.2
0.18
34.5
2.0
5.1
1
8MQTL2.4
2RG65
4–RM20
83
16.0
25.7
41.4
7.8
2.36
302.7
3.3
5.3
9MQTL3.1
3RM54
6–OSR13
97.86
42
14.0
12.7
13.9
7.0
0.98
140.7
1.8
2.0
3
10MQTL3.2
3RM33
8–RM15
62
10.7
9.2
10.7
13.9
5.08
365.1
0.6
0.7
11MQTL3.3
3RM16
8–RM44
83
12.0
8.4
128.9
3.39
381.0
0.9
1.4
12MQTL3.4
3RM13
0–RM85
220
7.6
2023
.12.95
128.0
0.3
0.9
13MQTL4.1
4RM41
7–RM119
54.45
22
12.2
5.4
12.9
6.3
1.82
288.5
0.9
5.6
4
14MQTL4.2
4RM34
8–RM12
43
6.4
7.3
6.8
21.0
2.09
99.6
0.4
0.3
15MQTL6.1
6RM20
4–RM13
626
.05
13
27.1
20.1
27.1
29.5
5.58
189.2
0.7
1.0
16MQTL7.1
7RM50
1–RM11
12
14.2
12.3
13.2
27.9
11.8
425.7
0.4
0.5
17MQTL8.1
8RM38–R
M25
98.83
35
2012
.217
.114
.12.26
160.5
0.9
1.2
18MQTL8.2
8RM34
2–RM51
53
2.7
14.8
32.9
35.1
0.33
9.3
0.4
0.9
19MQTL8.3
8RM24
8–RM21
02
4.2
8.1
22.4
4.4
1.92
435.3
1.8
5.1
5
20MQTL9.1
9RM10
5–RM43
423
.72
12
13.9
7.8
13.9
21.1
3.16
149.9
0.3
0.7
21MQTL11.1
11RM28
7–RM21
13
7.3
32.8
26.6
18.4
2.41
130.8
1.8
1.4
22MQTL12
.112
RM20
A–R
G57
444
.42
211.8
5.2
12.6
10.3
0.59
57.2
0.5
1.2
6
23MQTL12
.212
RM17
9–RM511
36.6
19.0
19.1
32.3
2.94
91.2
0.6
0.6
Total
687
AIC
Akaikeinform
ationcriterion
,CIconfidence
interval,cM
centim
organ,
MQTLmeta-QTL
6 Plant Mol Biol Rep (2011) 29:663–68072
Meta-analysis
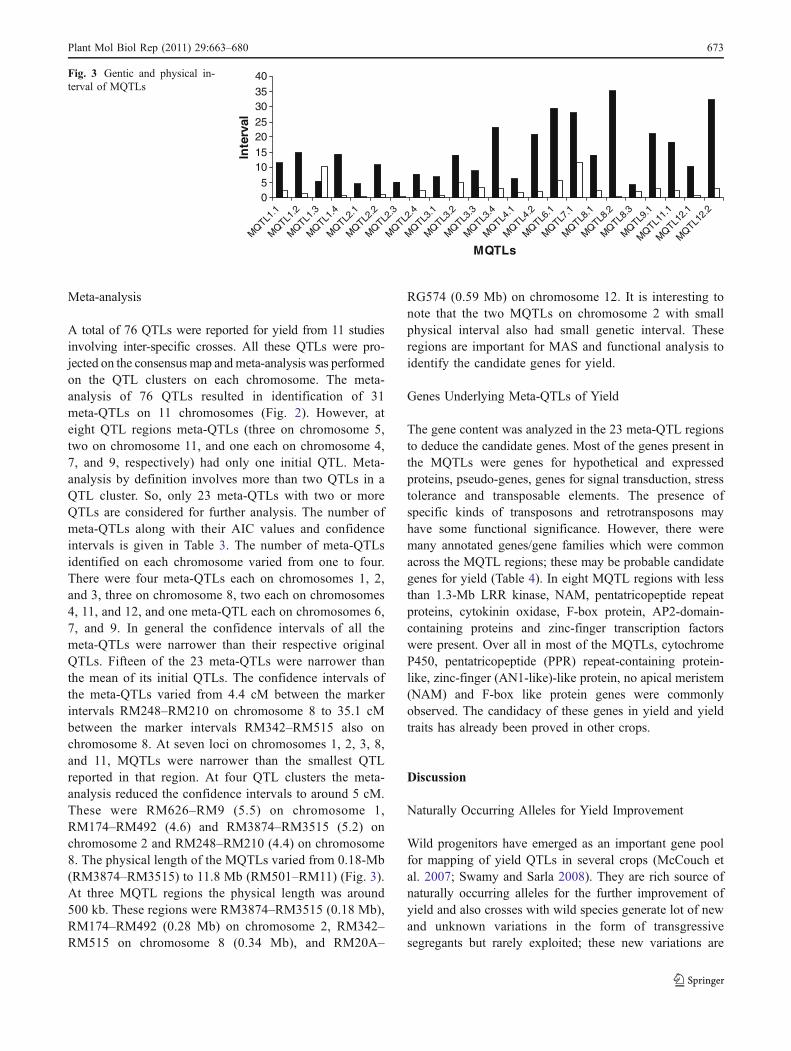
A total of 76 QTLs were reported for yield from 11 studiesinvolving inter-specific crosses. All these QTLs were pro-jected on the consensus map andmeta-analysis was performedon the QTL clusters on each chromosome. The meta-analysis of 76 QTLs resulted in identification of 31meta-QTLs on 11 chromosomes (Fig. 2). However, ateight QTL regions meta-QTLs (three on chromosome 5,two on chromosome 11, and one each on chromosome 4,7, and 9, respectively) had only one initial QTL. Meta-analysis by definition involves more than two QTLs in aQTL cluster. So, only 23 meta-QTLs with two or moreQTLs are considered for further analysis. The number ofmeta-QTLs along with their AIC values and confidenceintervals is given in Table 3. The number of meta-QTLsidentified on each chromosome varied from one to four.There were four meta-QTLs each on chromosomes 1, 2,and 3, three on chromosome 8, two each on chromosomes4, 11, and 12, and one meta-QTL each on chromosomes 6,7, and 9. In general the confidence intervals of all themeta-QTLs were narrower than their respective originalQTLs. Fifteen of the 23 meta-QTLs were narrower thanthe mean of its initial QTLs. The confidence intervals ofthe meta-QTLs varied from 4.4 cM between the markerintervals RM248–RM210 on chromosome 8 to 35.1 cMbetween the marker intervals RM342–RM515 also onchromosome 8. At seven loci on chromosomes 1, 2, 3, 8,and 11, MQTLs were narrower than the smallest QTLreported in that region. At four QTL clusters the meta-analysis reduced the confidence intervals to around 5 cM.These were RM626–RM9 (5.5) on chromosome 1,RM174–RM492 (4.6) and RM3874–RM3515 (5.2) onchromosome 2 and RM248–RM210 (4.4) on chromosome8. The physical length of the MQTLs varied from 0.18-Mb(RM3874–RM3515) to 11.8 Mb (RM501–RM11) (Fig. 3).At three MQTL regions the physical length was around500 kb. These regions were RM3874–RM3515 (0.18 Mb),RM174–RM492 (0.28 Mb) on chromosome 2, RM342–RM515 on chromosome 8 (0.34 Mb), and RM20A–
RG574 (0.59 Mb) on chromosome 12. It is interesting tonote that the two MQTLs on chromosome 2 with smallphysical interval also had small genetic interval. Theseregions are important for MAS and functional analysis toidentify the candidate genes for yield.
Genes Underlying Meta-QTLs of Yield
The gene content was analyzed in the 23 meta-QTL regionsto deduce the candidate genes. Most of the genes present inthe MQTLs were genes for hypothetical and expressedproteins, pseudo-genes, genes for signal transduction, stresstolerance and transposable elements. The presence ofspecific kinds of transposons and retrotransposons mayhave some functional significance. However, there weremany annotated genes/gene families which were commonacross the MQTL regions; these may be probable candidategenes for yield (Table 4). In eight MQTL regions with lessthan 1.3-Mb LRR kinase, NAM, pentatricopeptide repeatproteins, cytokinin oxidase, F-box protein, AP2-domain-containing proteins and zinc-finger transcription factorswere present. Over all in most of the MQTLs, cytochromeP450, pentatricopeptide (PPR) repeat-containing protein-like, zinc-finger (AN1-like)-like protein, no apical meristem(NAM) and F-box like protein genes were commonlyobserved. The candidacy of these genes in yield and yieldtraits has already been proved in other crops.
Discussion
Naturally Occurring Alleles for Yield Improvement
Wild progenitors have emerged as an important gene poolfor mapping of yield QTLs in several crops (McCouch etal. 2007; Swamy and Sarla 2008). They are rich source ofnaturally occurring alleles for the further improvement ofyield and also crosses with wild species generate lot of newand unknown variations in the form of transgressivesegregants but rarely exploited; these new variations are
05
10152025303540
MQ
TL1.1
MQ
TL1.2
MQ
TL1.3
MQ
TL1.4
MQ
TL2.1
MQ
TL2.2
MQ
TL2.3
MQ
TL2.4
MQ
TL3.1
MQ
TL3.2
MQ
TL3.3
MQ
TL3.4
MQ
TL4.1
MQ
TL4.2
MQ
TL6.1
MQ
TL7.1
MQ
TL8.1
MQ
TL8.2
MQ
TL8.3
MQ
TL9.1
MQ
TL11.
1
MQ
TL12.
1
MQ
TL12.
2
MQTLsIn
terv
al
Fig. 3 Gentic and physical in-terval of MQTLs
Plant Mol Biol Rep (2011) 29:663–680 673
Table 4 Meta-QTL regions tagged with QTLs for different yield components and candidate genes
Slnumber
MQTL Chromosome QTLregion
Interval (Mb) TaggedQTLs
Candidate genes
1 MQTL1.1 1 RM499–RM428 2.2 ph1, tn1 (Li et al. 2006) Putative LRR protein kinase
np1.1, sf1.1, gw1.1(Swamy and Sarla 2008)
Putative arm repeat-containingprotein
Putative nodulin-like protein
Zinc-finger transcription factor
Putative seed specific protein
Putative hexose transporter
Putative AP2-domain-containingprotein
Putative myb-like transcriptionfactor
2 MQTL1.2 1 RM323–RM151 1.3 gpl1.1 (Septiningsih et al.2003)
Putative MAR binding protein
spp, gpp, fgp (Brondaniet al. 2002)
Putative cytochrome P450
ph1.1 (Kaladhar 2006) Putative auxin-induced protein
Putative hexokinase
Putative 6-phospho-1-fructokinase
Zinc-finger protein like
Putative pollen specific protein
Always early 1 protein like
Basic helix-loop-helix protein like
Putative cytokinin oxidase
Phytocyanin protein like
3 MQTL1.3 1 RM626–RM9 10.2 bm1.1 I (Swamy andSarla 2008)
Pentatricopeptide (PPR) repeatprotein
Seed specific protein, AP-3complex delta subunit-likeprotein
F-box protein like
Zinc-finger protein like
Fertility restorer-like protein
NAM-like protein
4 MQTL1.4 1 RM246–RM443 1.00 ppl1.1, gpl1.1 (Xiaoet al. 1998)
Gibberellin response modulator-like
gw2.1, gpl2.1, ph2.1(Moncada et al. 2001)
Leaf senescence protein like
cl (Yoon et al. 2006) Mitogen-activated protein kinase-likeph1.4, nt1.4, pl1.3,gw1.7 (Kaladhar 2006)
5 MQTL2.1 2 RM174–RM492 0.28 gw2.1 (Kaladhar 2006) F-box family protein like
Putative pentatricopeptide early nodulin
Putative LRR receptor-like kinase
Putative CLAVATA1 receptor kinase
Putative aux/IAA protein
6 MQTL2.2 2 RM341–RM475 1.06 spp2 (Yoon et al. 2006) AP2-domain-containing protein,myb family transcription factor-liketetratricopeptide repeat-containing protein
pl2.1,nsp2.1,nt2.2,pl2.2, gnp2.1(Kaladhar 2006)
snp2.1, np2.1, nt2.1, gnp2.1(Marri et al. 2005)
Pentatricopeptide repeat-containing protein
Putative NAC domain protein
Putative auxin-responsive factor
Kelch repeat-containing F-boxfamily protein
Putative bHLH transcription factor
Putative cytochrome P450 zinc-finger,cryptochrome 1a leucine zipperprotein like
6 4 Plant Mol Biol Rep (2011) 29:663–6807
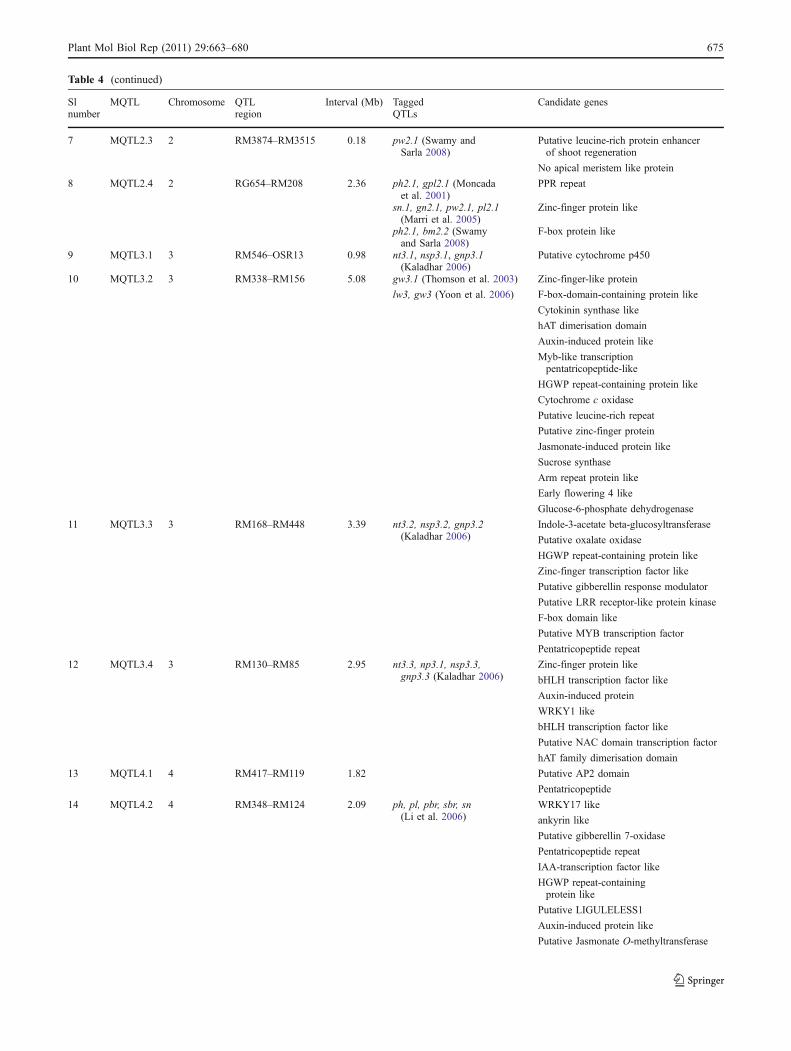
Table 4 (continued)
Slnumber
MQTL Chromosome QTLregion
Interval (Mb) TaggedQTLs
Candidate genes
7 MQTL2.3 2 RM3874–RM3515 0.18 pw2.1 (Swamy andSarla 2008)
Putative leucine-rich protein enhancerof shoot regeneration
No apical meristem like protein
8 MQTL2.4 2 RG654–RM208 2.36 ph2.1, gpl2.1 (Moncadaet al. 2001)
PPR repeat
sn.1, gn2.1, pw2.1, pl2.1(Marri et al. 2005)
Zinc-finger protein like
ph2.1, bm2.2 (Swamyand Sarla 2008)
F-box protein like
9 MQTL3.1 3 RM546–OSR13 0.98 nt3.1, nsp3.1, gnp3.1(Kaladhar 2006)
Putative cytochrome p450
10 MQTL3.2 3 RM338–RM156 5.08 gw3.1 (Thomson et al. 2003) Zinc-finger-like protein
lw3, gw3 (Yoon et al. 2006) F-box-domain-containing protein like
Cytokinin synthase like
hAT dimerisation domain
Auxin-induced protein like
Myb-like transcriptionpentatricopeptide-like
HGWP repeat-containing protein like
Cytochrome c oxidase
Putative leucine-rich repeat
Putative zinc-finger protein
Jasmonate-induced protein like
Sucrose synthase
Arm repeat protein like
Early flowering 4 like
Glucose-6-phosphate dehydrogenase
11 MQTL3.3 3 RM168–RM448 3.39 nt3.2, nsp3.2, gnp3.2(Kaladhar 2006)
Indole-3-acetate beta-glucosyltransferase
Putative oxalate oxidase
HGWP repeat-containing protein like
Zinc-finger transcription factor like
Putative gibberellin response modulator
Putative LRR receptor-like protein kinase
F-box domain like
Putative MYB transcription factor
Pentatricopeptide repeat
12 MQTL3.4 3 RM130–RM85 2.95 nt3.3, np3.1, nsp3.3,gnp3.3 (Kaladhar 2006)
Zinc-finger protein like
bHLH transcription factor like
Auxin-induced protein
WRKY1 like
bHLH transcription factor like
Putative NAC domain transcription factor
hAT family dimerisation domain
13 MQTL4.1 4 RM417–RM119 1.82 Putative AP2 domain
Pentatricopeptide
14 MQTL4.2 4 RM348–RM124 2.09 ph, pl, pbr, sbr, sn(Li et al. 2006)
WRKY17 like
ankyrin like
Putative gibberellin 7-oxidase
Pentatricopeptide repeat
IAA-transcription factor like
HGWP repeat-containingprotein like
Putative LIGULELESS1
Auxin-induced protein like
Putative Jasmonate O-methyltransferase
Plant Mol Biol Rep (2011) 29:663–680 6 57
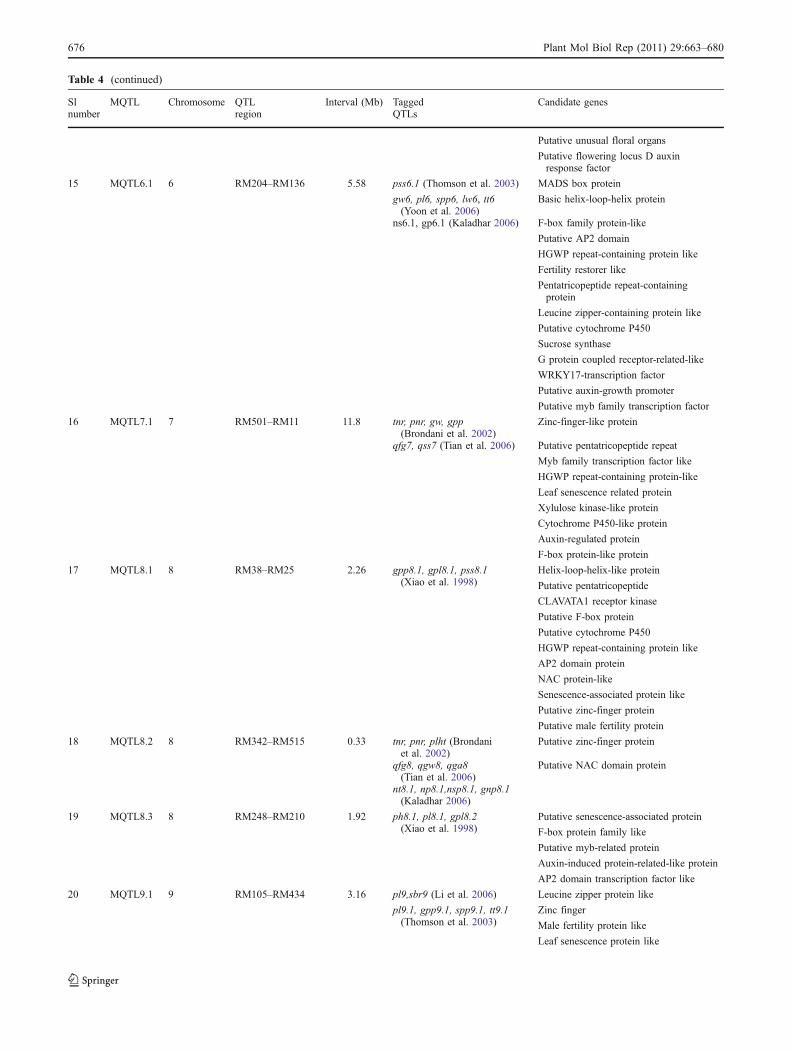
Table 4 (continued)
Slnumber
MQTL Chromosome QTLregion
Interval (Mb) TaggedQTLs
Candidate genes
Putative unusual floral organs
Putative flowering locus D auxinresponse factor
15 MQTL6.1 6 RM204–RM136 5.58 pss6.1 (Thomson et al. 2003) MADS box protein
gw6, pl6, spp6, lw6, tt6(Yoon et al. 2006)
Basic helix-loop-helix protein
ns6.1, gp6.1 (Kaladhar 2006) F-box family protein-like
Putative AP2 domain
HGWP repeat-containing protein like
Fertility restorer like
Pentatricopeptide repeat-containingprotein
Leucine zipper-containing protein like
Putative cytochrome P450
Sucrose synthase
G protein coupled receptor-related-like
WRKY17-transcription factor
Putative auxin-growth promoter
Putative myb family transcription factor
16 MQTL7.1 7 RM501–RM11 11.8 tnr, pnr, gw, gpp(Brondani et al. 2002)
Zinc-finger-like protein
qfg7, qss7 (Tian et al. 2006) Putative pentatricopeptide repeat
Myb family transcription factor like
HGWP repeat-containing protein-like
Leaf senescence related protein
Xylulose kinase-like protein
Cytochrome P450-like protein
Auxin-regulated protein
F-box protein-like protein
17 MQTL8.1 8 RM38–RM25 2.26 gpp8.1, gpl8.1, pss8.1(Xiao et al. 1998)
Helix-loop-helix-like protein
Putative pentatricopeptide
CLAVATA1 receptor kinase
Putative F-box protein
Putative cytochrome P450
HGWP repeat-containing protein like
AP2 domain protein
NAC protein-like
Senescence-associated protein like
Putative zinc-finger protein
Putative male fertility protein
18 MQTL8.2 8 RM342–RM515 0.33 tnr, pnr, plht (Brondaniet al. 2002)
Putative zinc-finger protein
qfg8, qgw8, qga8(Tian et al. 2006)
Putative NAC domain protein
nt8.1, np8.1,nsp8.1, gnp8.1(Kaladhar 2006)
19 MQTL8.3 8 RM248–RM210 1.92 ph8.1, pl8.1, gpl8.2(Xiao et al. 1998)
Putative senescence-associated protein
F-box protein family like
Putative myb-related protein
Auxin-induced protein-related-like protein
AP2 domain transcription factor like
20 MQTL9.1 9 RM105–RM434 3.16 pl9,sbr9 (Li et al. 2006) Leucine zipper protein like
pl9.1, gpp9.1, spp9.1, tt9.1(Thomson et al. 2003)
Zinc finger
Male fertility protein like
Leaf senescence protein like
6 Plant Mol Biol Rep (2011) 29:663–68076
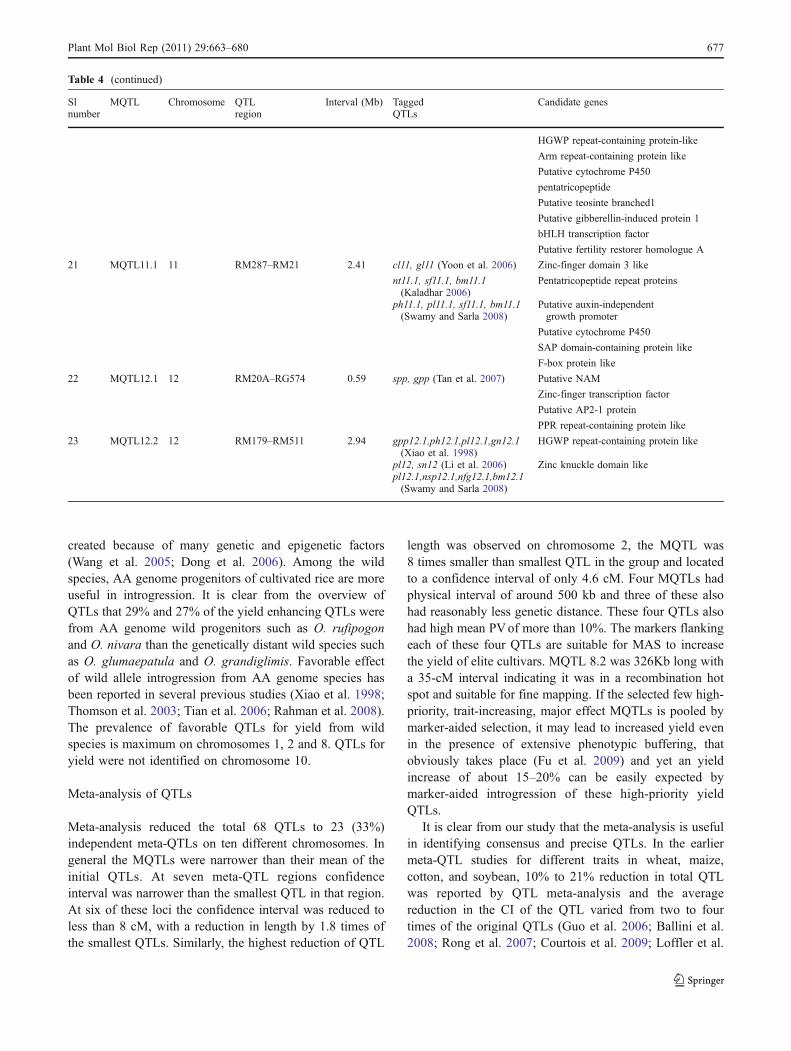
created because of many genetic and epigenetic factors(Wang et al. 2005; Dong et al. 2006). Among the wildspecies, AA genome progenitors of cultivated rice are moreuseful in introgression. It is clear from the overview ofQTLs that 29% and 27% of the yield enhancing QTLs werefrom AA genome wild progenitors such as O. rufipogonand O. nivara than the genetically distant wild species suchas O. glumaepatula and O. grandiglimis. Favorable effectof wild allele introgression from AA genome species hasbeen reported in several previous studies (Xiao et al. 1998;Thomson et al. 2003; Tian et al. 2006; Rahman et al. 2008).The prevalence of favorable QTLs for yield from wildspecies is maximum on chromosomes 1, 2 and 8. QTLs foryield were not identified on chromosome 10.
Meta-analysis of QTLs
Meta-analysis reduced the total 68 QTLs to 23 (33%)independent meta-QTLs on ten different chromosomes. Ingeneral the MQTLs were narrower than their mean of theinitial QTLs. At seven meta-QTL regions confidenceinterval was narrower than the smallest QTL in that region.At six of these loci the confidence interval was reduced toless than 8 cM, with a reduction in length by 1.8 times ofthe smallest QTLs. Similarly, the highest reduction of QTL
length was observed on chromosome 2, the MQTL was8 times smaller than smallest QTL in the group and locatedto a confidence interval of only 4.6 cM. Four MQTLs hadphysical interval of around 500 kb and three of these alsohad reasonably less genetic distance. These four QTLs alsohad high mean PVof more than 10%. The markers flankingeach of these four QTLs are suitable for MAS to increasethe yield of elite cultivars. MQTL 8.2 was 326Kb long witha 35-cM interval indicating it was in a recombination hotspot and suitable for fine mapping. If the selected few high-priority, trait-increasing, major effect MQTLs is pooled bymarker-aided selection, it may lead to increased yield evenin the presence of extensive phenotypic buffering, thatobviously takes place (Fu et al. 2009) and yet an yieldincrease of about 15–20% can be easily expected bymarker-aided introgression of these high-priority yieldQTLs.
It is clear from our study that the meta-analysis is usefulin identifying consensus and precise QTLs. In the earliermeta-QTL studies for different traits in wheat, maize,cotton, and soybean, 10% to 21% reduction in total QTLwas reported by QTL meta-analysis and the averagereduction in the CI of the QTL varied from two to fourtimes of the original QTLs (Guo et al. 2006; Ballini et al.2008; Rong et al. 2007; Courtois et al. 2009; Loffler et al.
Table 4 (continued)
Slnumber
MQTL Chromosome QTLregion
Interval (Mb) TaggedQTLs
Candidate genes
HGWP repeat-containing protein-like
Arm repeat-containing protein like
Putative cytochrome P450
pentatricopeptide
Putative teosinte branched1
Putative gibberellin-induced protein 1
bHLH transcription factor
Putative fertility restorer homologue A
21 MQTL11.1 11 RM287–RM21 2.41 cl11, gl11 (Yoon et al. 2006) Zinc-finger domain 3 like
nt11.1, sf11.1, bm11.1(Kaladhar 2006)
Pentatricopeptide repeat proteins
ph11.1, pl11.1, sf11.1, bm11.1(Swamy and Sarla 2008)
Putative auxin-independentgrowth promoter
Putative cytochrome P450
SAP domain-containing protein like
F-box protein like
22 MQTL12.1 12 RM20A–RG574 0.59 spp, gpp (Tan et al. 2007) Putative NAM
Zinc-finger transcription factor
Putative AP2-1 protein
PPR repeat-containing protein like
23 MQTL12.2 12 RM179–RM511 2.94 gpp12.1,ph12.1,pl12.1,gn12.1(Xiao et al. 1998)
HGWP repeat-containing protein like
pl12, sn12 (Li et al. 2006) Zinc knuckle domain likepl12.1,nsp12.1,nfg12.1,bm12.1(Swamy and Sarla 2008)
Plant Mol Biol Rep (2011) 29:663–680 677
2009; Hao et al. 2010; Lanaud et al. 2009). In some of thesestudies, MQTLs were used for deducing candidate genesalso. In wheat for Fusarium head blight resistance fourMQTLS were recommended for MAS after meta-analysis(Loffler et al. 2009).
Identification of Candidate Genes
Map based cloning of QTLs is the commonly used approachfor identification of candidate genes underlying the complextraits. Using this approach candidate genes have beenidentified for heading date, tiller number, submergencetolerance, grain number, and grain yield in rice (Yano et al.2001; Salvi and Tuberosa 2005; Ashikari et al. 2005, Xu et al.2006). However, this approach is time consuming and resultsdepend on the effect and consistency of the QTLs across thegenerations. A combination of meta-analysis and comparativein silico mapping can be an efficient and rapid approach foridentifying new candidate genes for trait variation. Based onthis approach candidate genes were deduced for floweringtime and drought tolerance in maize (Chardon et al. 2004;Hao et al. 2010) and for lint fiber length in cotton (Rong et al.2007). In the present study insilico candidate gene analysis ofmeta-QTLs resulted in several candidate genes involved inyield. Some of the important genes/gene families withsufficient evidence to support their candidacy in rice andother crops are listed and discussed further. The genes werecytochrome P450, cytokinin oxidase, PPR repeat-containingprotein-like, zinc-finger (AN1-like)-like protein, F-box-likeprotein, and NAM-like proteins.
Cytochrome P450 is a high-priority gene family associatedwith yield. This is supported by recent report of a ricebrassinosteroid deficient mutant osdwarf 4-1 encoding acytochrome P450 protein increasing biomass and grain yieldunder dense planting (Sakamoto et al. 2005). CytochromeP450 also has a role in homeostasis of cytokinin whichregulates growth, development in wheat and grain yield inrice (Ashikari et al. 2005; Xin et al. 2010). PPR repeats arepresent in promoter region of Rf genes of rice, regulateembryogenesis and fertility restoration in rice (Bentolila et al.2002; Akagi et al. 2004; Xu et al. 2009; Wang et al. 2010).Thus, association of PPR genes with 15 out of 23 meta-QTLs for yield may be through increase in fertility. Zinc-finger (AN1-like)-like proteins are known to be involved instress tolerance and in the regulation of rice plant architecture(Zhang et al. 2010). Suppression of this gene resulted indrastic increase in leaf and tiller angles, shortened shootheight and reduced grain production in rice (Mukhopadhyayet al. 2004; Wang et al. 2008). F-box proteins play animportant role in floral development and stress tolerance.They express during various stages of panicle and seeddevelopment regulating the grain yield (Jain et al. 2007).Theshortlisted common candidate genes underlying precise
meta-QTLs can be used for further function analysis todefine functions and to identify important yield enhancinggenes in rice. In addition, the presences of specific kinds oftransposable elements have some functional significance inyield improvement. The large amount of variation that isusually observed in inter-specific crosses is mainly becauseof many genetic and epigenetic factors, including transpos-able elements (Wang et al. 2005; Yu et al. 2010).
Conclusions
Meta-analysis of yield QTLs helped to identify the mostprecise and concise MQTLs. The meta-QTLs with a smallphysical and genetic interval are useful in MAS/pyramid-ing. The QTLs for use in MAS are also targets for finemapping and positional cloning for gene discovery. Theshortlisted candidate genes underlying meta-QTLs can becloned to unravel the molecular mechanisms regulatingyield. In breeding rice for higher yield, this study providesinsights into the location of important loci introgressedfrom wild species of rice.
Acknowledgment BPMS thanks UGC–CSIR for Senior ResearchFellowship. NS thanks Department of Biotechnology, Government ofIndia for financial support to the Network Project on FunctionalGenomics of rice at DRR. We thank the Director of DRR for constantsupport and encouragement.
References
Akagi H, Nakamura A, MisonoY IA, Takahashi H, Mori K, FujimuraT (2004) Positional cloning of the rice Rf-1 gene, a restorer ofBT-type cytoplasmic male sterility that encodes a mitochondriatargeting PPR protein. Theor Appl Genet 108:1449–1457
Akaike H (1974) A new look at the statistical model identification.IEEE Trans Autom Control 19:716–723
Arcade A, Labourdette A, Falque M, Mangin B, Chardon F,Charcosset A, Joets J (2004) BioMercator: integrating geneticmaps and QTL towards discovery of candidate genes. Bioinfor-matics 14:2324–2326
Ashikari M, Matsuoka M (2006) Identification, isolation andpyramiding of quantitative trait loci for rice breeding. TrendsPlant Sci 11:344–350
Ashikari M, Sakakibara H, Lin S, Ymamoto T, Takashi T, Nishimura A,Angeles ER, Qian Q, Kitano H, Matsuoka M (2005) Cytokininoxidase regulates rice grain production. Science 309:741–745
Ballini E, Morel JB, Droc G, Price AH, Courtois B, Nottehem JL,Tharreau DA (2008) Genome wide meta analysis of rice blastresistance genes and quantitative trait loci provides new insightsinto partial and complete resistance. Mol Plant Microbe Intera21:859–868
Bentolila S, Alfonso AA, Hanson MR (2002) A pentatricopeptiderepeat-containing gene restores fertility to cytoplasmic male-sterile plants. Proc Natl Acad Sci 99:10887–10892
Brondani C, Rangel PHN, Brondani RPV, Ferreira ME (2002) QTLmapping and introgression of yield-related traits from Oryza
6 Plant Mol Biol Rep (2011) 29:663–68078
glumaepatula to cultivated rice (Oryza sativa) using micro-satellite markers. Theor Appl Genet 104:1192–1203
Chardon F, Virlon B, Moreau L, Falque M, Joets J, Decousset L,Murigneux A, Charcosset A (2004) Genetic architecture offlowering time in maize as inferred from quantitative trait locimeta-analysis and synteny conservation with rice genome.Genetics 168:2169–2185
Courtois B, Ahmadi N, Khowaja F, Price AH, Rami J, Frouin J,Hamelin C, Ruiz M (2009) Rice root genetic architecture: meta-analysis from a drought QTL database. Rice 2:115–128
Darvasi A, Soller M (1997) A simple method to calculate resolvingpower and confidence interval of QTL map location. BehavGenet 27:125–132
Dong ZY, Wang YM, Zhang ZJ, Shen Y, Lin XY, Ou XF, Han FP, LiuB (2006) Extent and pattern of DNA methylation alteration inrice lines derived from introgressive hybridization of rice andZizania latifolia Griseb. Theor Appl Genet 113:196–205
Fridman E, Carrari F, Liu YS, Fernie AR, Zamir D (2004) Zooming inon a quantitative trait for tomato yield using interspecificintrogressions. Science 305:1786–1789
Fu J, Keurentjes JJ, Bouwmeester H, America T, Verstappen FW,Ward JL, Beale MH, Devos RC, Dijkstra M, Scheltema RA,Johannes F, Koornneef M, Vreugdenhil D, Breitling R, JansenRC (2009) System-wide molecular evidence for phenotypicbuffering in Arabidopsis. Nat Genet 4:144–145
Goffinet B, Gerber S (2000) Quantitative trait loci: a meta-analysis.Genetics 155:463–473
Guo B, Sleper DA, Lu P, Shannon JG, Nguyen HT, Arelli PR(2006) QTLs associated with resistance to soybean cystnematode in soybean meta-analysis of QTL locations. CropSci 46:202–208
Gur A, Zamir D (2004) Unused natural variation can lift yield barriersin plant breeding. PLoS Biol 2:e245
Hanocq E, Laperche A, Jaminon O, Laine AL, Gouis JL (2007) Mostsignificant genome regions involved in the control of earlinesstraits in bread wheat, as revealed by QTL meta-analysis. TheorAppl Genet 114:569–584
Hao Z, Li X, Liu X, Xie C, Li M, Zhang D, Zhang S (2010) Meta-analysis of constitutive and adaptive QTL for drought tolerancein maize. Euphytica 174:165–177
Jain M, Nijhawan A, Arora R, Agarwal P, Ray S, Sharma P, Kapoor S,Tyagi AK, Khurana JP (2007) F-box proteins in rice. Genome-wide analysis, classification, temporal and spatial gene expres-sion during panicle and seed development, and regulation bylight and abiotic stress. Plant Physiol 143:1467–1483
Kaladhar K (2006) Mapping of Quantitative Trait Loci (QTL) foryield and related traits in BC2F2 population of O. sativa cvSwarna×O. nivara (IRGC81832). PhD thesis Osmania Univer-sity, Hyderabad, India
Kovach MJ, McCouch SR (2008) Leveraging natural diversity:back through the bottleneck. Curr Opin Plant Biotechnol11:193–200
Lanaud C, Fouet O, Clement D, Boccara M, Risterucci AM, MaharajSS, Legavre T, Argout X (2009) A meta-QTL analysis of diseaseresistance traits of Theobroma cacao L. Mol Breed 24:361–374
Li C, Zhou A, Sang T (2006) Genetic analysis of rice domesticationsyndrome with the wild annual species, Oryza nivara. NewPhytol 170:185–194
Liang F, Deng Q, Wang Y, Xiong Y, Jin D, Li J, Wang B (2004)Molecular marker assisted selection for yield enhancing genes inthe progeny of “9311×O. rufipogon” using SSR. Euphytica139:159–165
Lin Y, Schertz K, Paterson A (1995) Comparative analysis of QTLsaffecting plant height and maturity across the Poaceae, inreference to an interspecific sorghum population. Genetics141:391–411
Loffler M, Schon CC, Miedaner T (2009) Revealing the geneticarchitecture of FHB resistance in hexaploid wheat (Triticumaestivum L.) by QTL meta-analysis. Mol Breed 23:473–488
Marri PR, Sarla N, Reddy LV, Siddiq EA (2005) Identification andmapping of yield and related QTLs from an Indian accession ofO. rufipogon. BMC Genet 6:33
McCouch SR, Sweeney M, Li J, Jiang H, Thomson M, SeptiningsihE, Edwards J, Moncada P, Xiao J, Garris A, Tai T, Martinez C,Tohme J, Sugiono M, McClung A, Yuan LP, Ahn SN (2007)Through the genetic bottleneck: O. rufipogon as a source of trait-enhancing alleles for O. sativa. Euphytica 154:317–339
McCouch et al (2002) Development and mapping of 2240 new SSRmarkers for rice (Oryza sativa L.). DNA Res 9:199–207
Moncada P, Martinez CP, Borrero J, Chatel M, Gouch JH, GlumaraesE, Tohme J, Mc Couch SR (2001) Qualitative trait loci for yieldand yield components in an Oryza sativa×Oryza rufipogonBC2F2 population evaluated in an upland environment. TheorAppl Genet 102:41–52
Mukhopadhyay A, Vij S, Tyagi AK (2004) Over expression of a zinc-finger protein gene from rice confers tolerance to cold,dehydration, and salt stress in transgenic tobacco. Proc NatlAcad Sci 101:6309–6314
Price AH (2006) Believe it or not, QTLs are accurate. Trends Plant Sci11:213–216
Rahman ML, Chu SH, Choi M, Qiao YL, Jiang W, Piao R, Khanam S,Cho Y, Jeung J, Jena KK, Koh H (2008) Identification of QTLsfor some agronomic traits in rice using an introgression line fromOryza minuta. Mol Cells 24:16–26
Rong J, Feltus FA, Waghmare VN, Pierce GJ, Chee PW, Draye X,Saranga Y, Wright RJ, Wilkins TA, May OL, Smith CW,Gannaway JR, Wendel JF, Paterson AH (2007) Meta-analysis of polyploid cotton QTL shows unequal contributionsof subgenomes to a complex network of genes and geneclusters implicated in lint fiber development. Genetics176:2577–2588
Sakamoto T, Morinaka Y, Ohnishi T, Sunohara H, Fujioka S, TanakaMU, Mizutani M, Sakata K, Takatsuto S, Yoshida S, Tanaka H,Kitano H, Matsuoka M (2005) Erect leaves caused by brassinos-teroid deficiency increase biomass production and grain yield inrice. Nat Biotechnol 24:105–109
Salvi S, Tuberosa R (2005) To clone or not to clone plant QTLs:present and future challenges. Trends Plant Sci 10:297–373
Septiningsih EM, Prasetiyono J, Lubis E, Tai TH, Tjubaryat T,Moeljopawiro S, McCouch SR (2003) Identification ofquantitative trait loci for yield and yield components in anadvanced backcross population derived from the Oryza sativavariety IR64 and the wild relative O. rufipogon. Theor ApplGenet 107:1419–1432
Swamy BPM (2008) Genome wide mapping of Quantitaive Trait Locifor yield and grain quality traits in O. sativa cv Swarna×O.nivara (IRGC81848) population. Phd thesis Osmania University,Hyderabad, India
Swamy BPM, Sarla N (2008) Yield enhancing QTLs from wildspecies. Biotechnol Adv 26:106–120
Tan L, Liu F, Xue W, Wang G, Ye S, Zhu Z, Fu Y, Wang X, Sun C(2007) Development of Oryza rufipogon and O. sativa introgres-sion lines and assessment for yield-related quantitative trait loci. JIntegr Plant Biol 49:871–884
Temnykh S, DeClerck G, Lukashova A, Lipovich L, Cartinhour S,McCouch SR (2001) Computational and experimental analysis ofmicrosatellites in rice (Oryza sativa L.): frequency, lengthvariation, transposon associations and genetic marker potential.Genome Res 11:1441–1452
ThomsonMJ, Tai TH,McClung AM, Lai XH, HingaME, Lobos KB, XuY,Martinez CP, McCouch SR (2003)Mapping quantitative trait locifor yield, yield components and morphological traits in an advanced
Plant Mol Biol Rep (2011) 29:663–680 679
backcross population between Oryza rufipogon and the Oryzasativa cultivar Jefferson. Theor Appl Genet 107:479–493
Tian F, Li DJ, Fu Q, Zhu ZF, Fu YC, Wang XK, Sun CQ (2006)Construction of introgression lines carrying wild rice (Oryzarufipogon Griff) segments in cultivated rice (Oryza sativa L.)background and characterization of introgressed segments asso-ciated with yield-related traits. Theor Appl Genet 112:570–580
Wang YM, Dong ZY, Zhang ZJ, Lin XY, Shen Y, Zhou D, Liu B(2005) Extensive denovo variation in rice induced by intro-gression from wild rice (Zizania latifolia). Genetics 170:1945–1956
Wang L, Xu Y, Zhang C, Ma Q, Joo SH, Kim SK, Xu Z, Chong K(2008) OsLIC, a Novel CCCH-type zinc finger protein withtranscription activation, mediates rice architecture via brassinos-teroids signaling. PLoS ONE 3:1–12
Wang K, Feng G, Zhu R, Li S, Zhu Y (2010) Expression, purification,and secondary structure prediction of pentatricopeptide repeatprotein RF1A from rice. Plant Mol Biol Rep. doi:10.1007/s11105-010-0260-7
Xiao J, Li J, Grandillo S, Ahn SN, Yuan L, Steven D, McCouch SR(1998) Identification of trait-improving quantitative trait locialleles from a wild rice relative, Oryza rufipogon. Genetics150:899–909
Xin M, Feng D, Wang H, Li X, Kong L (2010) Cloning and expressionanalysis of wheat cytokinin oxidase/dehydrogenase gene TaCKX3.Plant Mol Biol Rep. doi:10.1007/s11105-010-0209
Xu K, Xu X, Fukao T, Canlas P, Rodriguez RM, Heuer S, Ismail AM,Serres JB, Ronald PC, Mackill DJ (2006) Sub1A is an ethylene-response-factor-like gene that confers submergence tolerance torice. Nature 442:705–708
Xu X, Liu Z, Zhang D, Liu Y, Song W, Li J, Dai J (2009) Isolationand analysis of rice Rf1-orthologus PPR genes co-segregatingwith Rf3 in maize. Plant Mol Biol Rep 27:511–517
Yoon DB, Kang KH, Kim HJ, Ju HG, Kwon SJ, Suh JP, Jeong OY,Ahn SN (2006) Mapping quantitative trait loci for yieldcomponents and morphological traits in an advanced backcrosspopulation betweenOryza grandiglumis and the O. sativa japonicacultivar Hwaseongbyeo. Theor Appl Genet 112:1052–1062
Yu S, Li J, Luo L (2010) Complexity and specificity of precursormicroRNAs driven by transposable elements in rice. Plant MolBiol Rep 28:502–511
Zhang X, Guo X, Lei C, Cheng Z, Lin Q, Wang J, Wu F, Wang J, WanJ (2010) Over expression of SlCZFP1, a novel TFIIIA-type zincfinger protein from tomato, confers enhanced cold tolerance intransgenic Arabidopsis and rice. Plant Mol Biol Rep.doi:10.1007/s11105-010-0223
6 Plant Mol Biol Rep (2011) 29:663–68080
Related Documents