Powered by Editorial Manager® and Preprint Manager® from Aries Systems Corporation This article is protected by copyright and all rights are held exclusively by Springer- Verlag Berlin Heidelberg. . This is the accepted manuscript version. . The final publication is available at link.springer.com: http://link.springer.com/article/10.1007%2Fs00227-013-2262-0

Welcome message from author
This document is posted to help you gain knowledge. Please leave a comment to let me know what you think about it! Share it to your friends and learn new things together.
Transcript
!"#$%&'($)*)+,'
!&-).)-/'"%0'$%'-$12')3-"1$)%-')5'16&'32##)7$%+'-6#$/8'9"*)."#$-'1&/8*&/"%$:;&."8)0"<'=6"*"--$%$0&">'"%0'$1-'3$)12#3"1$)%'".1$4$1$&-'$%'-)51'-&0$/&%1-')5'16&
?"2#&%1$"%'=#)2+6@@!"%2-.#$81';#"51@@
'!"%2-.#$81'A2/3&#< !B(C@;@DE@FFGEHIE
J2**'=$1*&< !&-).)-/'"%0'$%'-$12')3-"1$)%-')5'16&'32##)7$%+'-6#$/8'9"*)."#$-'1&/8*&/"%$
:;&."8)0"<'=6"*"--$%$0&">'"%0'$1-'3$)12#3"1$)%'".1$4$1$&-'$%'-)51'-&0$/&%1-')5'16&
?"2#&%1$"%'=#)2+6
B#1$.*&'=,8&< K#$+$%"*'L"8&#
M&,7)#0-< 32##)7$%+'-6#$/8N''=6"*"--$%$0&"N''9"*)."#$-'1&/8*&/"%$N''3)11)/'86)1)+#"86,N''1$/&@
*"8-&0'4$0&)N''3&%16$.'/&-).)-/-N''0$-1#$321$)%N''0&%-$1,N''32##)7'"#.6$1&.12#&N
3&6"4$)2#N''3$)12#3"1$)%N''3$)$##$+"1$)%
9)##&-8)%0$%+'B216)#< O&"%@!"#.'P"+%)%Q'L6R;R
9"%"0$"%'!2-&2/')5'A"12#&
P"1$%&"2Q'S9'9BAB;B
9)##&-8)%0$%+'B216)#'T&.)%0"#,
C%5)#/"1$)%<
9)##&-8)%0$%+'B216)#U-'C%-1$121$)%< 9"%"0$"%'!2-&2/')5'A"12#&
9)##&-8)%0$%+'B216)#U-'T&.)%0"#,
C%-1$121$)%<
J$#-1'B216)#< O&"%@!"#.'P"+%)%Q'L6R;R
J$#-1'B216)#'T&.)%0"#,'C%5)#/"1$)%<
K#0&#')5'B216)#-< O&"%@!"#.'P"+%)%Q'L6R;R
?2.'(&"20$%Q'(RT.R
B%%&'!"24$&*Q'L6R';R
A)#/"%'T$*4&#+Q'L6R;R
K#0&#')5'B216)#-'T&.)%0"#,'C%5)#/"1$)%<
B3-1#".1< C%'4$4)')3-"1$)%-'$%'*"3)#"1)#,'/&-).)-/-'"%0'"V2"#$"Q'"..)/8"%$&0'7$16'$%'-$12
86)1)+#"86$.'-2#4&,-Q'6"4&'-6)7%'16"1'16&'32##)7$%+'-6#$/8'9"*)."#$-'1&/8*&/"%$
6"-'"'-$+%$5$."%1'$/8".1')%'3)11)/'-&0$/&%1'0,%"/$.-'"%0'+&).6&/$-1#,'$%'16&'T1R
?"7#&%.&'W-12"#,R'=6$-'32##)7$%+'-6#$/8'&-1"3*$-6&-'"%0'/"$%1"$%-'.)/8*&X'-&/$@
8&#/"%&%1'32##)7-'/"0&'28')5'-&4&#"*'$%1&#.)%%&.1&0Q'UY@-6"8&0U'+"**&#$&-'7$16
+&%&#"**,'Z')#'/)#&')8&%$%+-'1)'16&'-&0$/&%1'-2#5".&R'C%'16&'W-12"#,Q'"1'[Z\'/'0&816Q
9"*)."#$-'"4&#"+&'0&%-$1,'7"-'&-1$/"1&0'"1'[RZ'$%0$4$02"*-'/@ER'K3-&0'$%0$4$02"*
32##)7-'#&".6&0'"'/"X$/2/'4)*2/&')5'FR\Z'?R'9"*)."#$-'1&/8*&/"%$'0$-8*".&-'16$-
4)*2/&')5'/)-1*,'"%)X$.'-&0$/&%1-'5#)/'16&'-23-2#5".&'*",&#-':0)7%'1)'D\'./>'1)'16&
-&0$/&%1'-2#5".&Q'16&#&3,')3-.2#$%+'-)/&')5'16&'%"12#"*'-1#"1$5$."1$)%'8"11&#%-R']$16'"%
&-1$/"1&0'12#%)4&#'#"1&')5'"3)21'^'?'/@E',@D')5'-&0$/&%1Q')2#'."*.2*"1$)%-'-2++&-1'16"1
)4&#'"'8&#$)0')5'"3)21'D^RH\',&"#-Q'"**'16&'-&0$/&%1'1)'"'0&816')5'D\'./'7$**'6"4&'3&&%
#&7)#_&0'3,'9R'1&/8*&/"%$'"*)%&R
Powered by Editorial Manager® and Preprint Manager® from Aries Systems Corporation
This article is protected by copyright and all rights are held exclusively by Springer-
Verlag Berlin Heidelberg.
.
This is the accepted manuscript version.
.
The final publication is available at link.springer.com:
http://link.springer.com/article/10.1007%2Fs00227-013-2262-0
1
1
Mesocosm and in situ observations of the burrowing shrimp Calocaris templemani (Decapoda: Thalassinidea) 2
and its bioturbation activities in soft sediments of the Laurentian Trough 3
4
5
6
Jean-Marc Gagnon · Luc Beaudin · Norman Silverberg · Anne Mauviel 7
8
9
10
J.-M. Gagnon 11
Research & Collections Division, Canadian Museum of Nature, 12
P.O. Box 3443, Station D, Ottawa, ON, K1P 6P4, Canada 13
14
L. Beaudin 15
Institut Maurice-Lamontagne, Ministère des Pêches et des Océans Canada, 16
Casier postal 1000, Mont-Joli, PQ, G5H 3Z4, Canada 17
18
N. Silverberg 19
Centro Interdisciplinario de Ciencias Marinas, 20
Ave. Institut Politécnico Nacional s/n, 21
Playa Palo Santa Rita, La Paz, B.C.S., 23096, Mexico 22
23
A. Mauviel 24
ADPEP 50, 24 rue de la Poterne 25
50000 SAINT LO, FRANCE 26
27
Corresponding author: 28
J.-M. Gagnon: [email protected]; tel.: 613-364-4066; Fax : 613-364-4027 29
30
!"#$%&'()*+
!"#$%&'()(&*+&,+-."+/,&0/.12$)#3*4&5/6.+.7(*7/"702&8+&09:;<=<>?<@@A?BC>7D(E*F,+$&!"#$%&'()(&*+&,#(-&"#.%(/&0(1()(.$(2
2
Abstract 31
32
In vivo observations in laboratory mesocosms and aquaria, accompanied with in situ photographic surveys, have 33
shown that the burrowing shrimp Calocaris templemani has a significant impact on bottom sediment dynamics and 34
geochemistry in the St. Lawrence Estuary. This burrowing shrimp establishes and maintains complex semi-35
permanent burrows made up of several interconnected, ‘U-shaped’ galleries with generally 4 or more openings to 36
the sediment surface. In the Estuary, at 345 m depth, Calocaris average density was estimated at 3.4 individuals m-2
. 37
Observed individual burrows reached a maximum volume of 0.54 L. Calocaris templemani displaces this volume of 38
mostly anoxic sediments from the subsurface layers (down to 15 cm) to the sediment surface, thereby obscuring 39
some of the natural stratification patterns. With an estimated turnover rate of about 8 L m
-2 y
-1 of sediment, our 40
calculations suggest that over a period of about 18.75 years, all the sediment to a depth of 15 cm will have been 41
reworked by C. templemani alone. 42
43
3
Introduction 44
45
Thalassinidean shrimps are well known for their burrowing behaviour in soft sediments, coral reefs and sponges 46
(Griffis and Suchanek 1991). Although the Thalassinidea has now been revised and replaced by two infraorders, the 47
Axiidea and the Gebiidea (De Grave et al. 2009; Robles et al. 2009), the old term is retained here for reasons of 48
familiarity. They inhabit a great variety of marine habitats such as tropical lagoons, seagrass marshes and the deep 49
sea, where they can elaborate permanent or semi-permanent burrows several centimetres to a few metres below the 50
substratum surface. With densities sometimes reaching several hundreds to thousands of individuals per m2 (e.g. Ott 51
et al. 1976; Posey 1986), their bioturbational activities have obvious effects on benthic community structure and on 52
surface and sub-surface sediment characteristics (e.g. Aller and Dodge 1974; Suchanek 1983; Vaugelas 1985; Posey 53
1986; Widdicombe and Austen 2003). 54
The vast majority of burrowing shrimp species (also called mud or ghost shrimps) that have been studied, however, 55
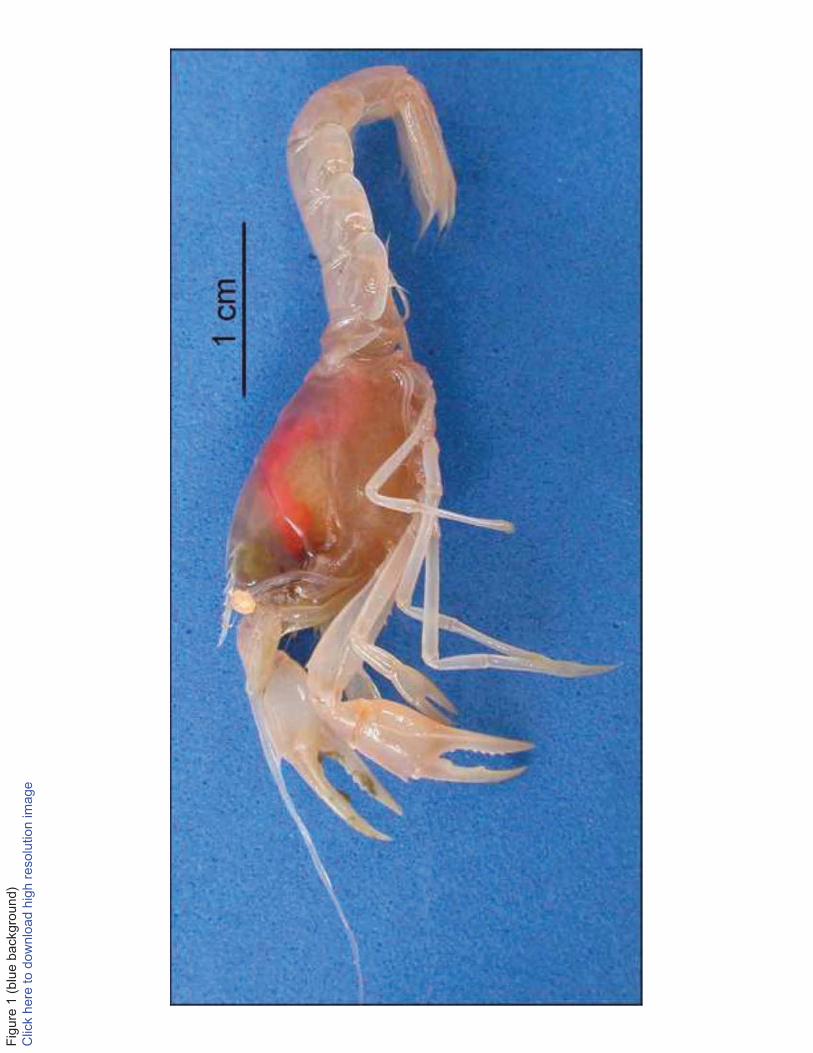
are from shallow coastal areas; only a few species are known from deep waters (Dworschak 2000). The burrowing 56
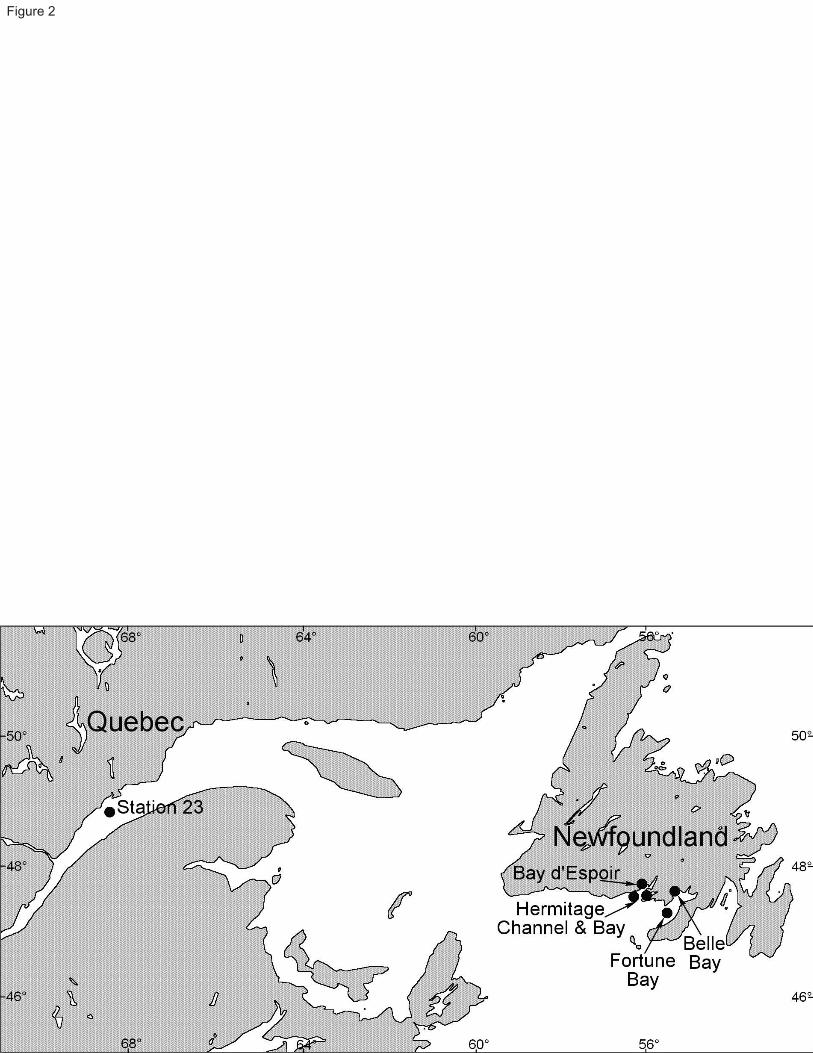
shrimp Calocaris templemani Squires 1965 (Fig. 1) is encountered in the estuarine portion of the Laurentian Trough, 57
Eastern Canada (Fig. 2), in association with the 350 m-deep, soft-bottom community. Prior to its original description 58
by Squires, the few specimens of this species that had been collected were incorrectly identified as Calocaris 59
macandreae Bell, 1846, its European sibling species (Squires 1965; Williams 1984). In fact, until the present study, 60
only a hand-full of specimens were available in research collections (particularly from the Gulf of Maine; Williams 61
1984) and what was known of the biology of C. templemani was mostly derived from studies on C. macandreae 62
(Buchanan 1963; Nash et al. 1984; Williams 1984; Squires 1990; Anderson et al. 1991; Pinn et al. 1998; Pinn and 63
Atkinson 2010). 64
As part of a mesocosm study on bioturbation by dominant soft-bottom invertebrates, several live specimens of 65
Calocaris templemani were collected with sediment box cores from 345 m depth in the St. Lawrence Estuary and 66
maintained alive under controlled laboratory conditions for several months (Silverberg et al. 1995). Among the 67
numerous species present in the benthic community, C. templemani was identified as one of few species to have 68
significant bioturbation impact. Based on in vivo observations and measurements in mesocosms and on in situ sea-69
bottom photographs, this study presents the first information available on the distribution, abundance, behaviour and 70
burrow architecture of C. templemani. Implications of its burrowing activities (i.e. bioturbation/irrigation) for the 71
geochemistry of the sediments are also discussed. 72
73
4
Materials and methods 74
75
Description of study area and associated benthic assemblage 76
77
Specimens of Calocaris templemani used in this study are part of the deep-water benthic community found at 78
Station 23, a site situated in the middle of the Lower St. Lawrence Estuary (Fig. 2), 90 km east of the head of the 79
Laurentian Trough. Water depth in this area is fairly constant at 345 ± 5 m, with year-round bottom temperatures 80
and salinities around 4 °C and 34.5, respectively. Sediments are particularly fine and poorly sorted, with 63% clay 81
(particle size < 4 mm), 33% silt (4 mm < particle size < 63 mm) and 3% sand (particle size ˃ 63 mm). The benthic 82
macrofauna is dominated in abundance by polychaetes (range: 48.8-87.6%; overall: 73.2%), bivalves (range: 6.8-83
47.2%; overall: 19.6%) and crustaceans (range: 0.9-14.2%; overall: 4.16%). Calocaris templemani alone represents 84
0.0-1.6% (overall: 0.2%) of the benthic fauna. Surface and sub-surface echinoderms usually represent less than 4% 85
(overall: 2.3%) of the total faunal abundance but are amongst the few species that have significant bioturbation 86
impact on the community (Silverberg et al. 1995). 87
88
In situ sampling and bottom photography 89
90
Sampling of the benthic community at Station 23 was carried out with a 0.25 m2 box corer. Two sets of triplicate 91
samples were collected in October 1991 and May 1992, respectively, to describe the in situ assemblage at that 92
station, including density estimates for Calocaris templemani (Silverberg et al. 1995). The same sampler was used in 93
October 1990, May 1991, October 1991, May 1992, and October 1993, to obtain sediment cores for the three 94
laboratory mesocosms (see following section). 95
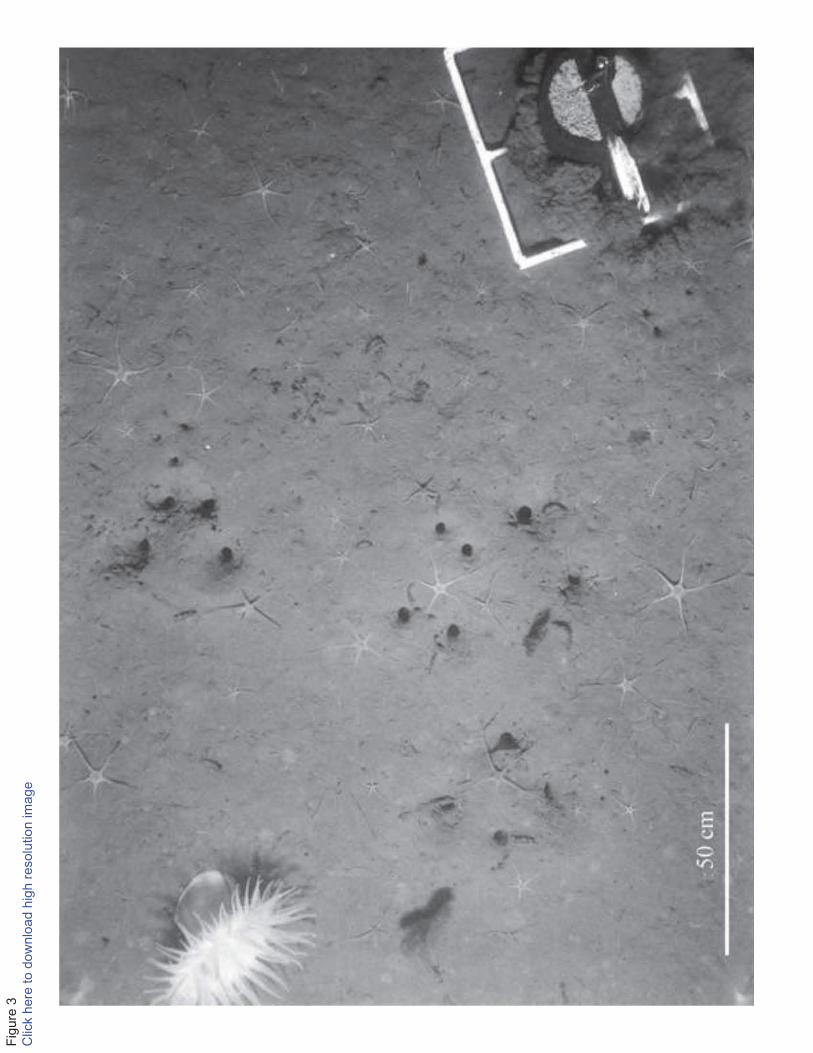
In order to characterize the epibenthic megafauna, we used photographs of the seafloor, each covering 1 m2 (see 96
example in Fig. 3), taken in July 1989 along three transects at Station 23 (Table 1). From these, the numbers of 97
complete and incomplete (i.e. marginally-located) Calocaris burrows were recorded, along with the number of 98
visible openings per burrow and the diameter of each opening. Density estimates were calculated by counting the 99
number of burrows on each photograph, where complete and incomplete burrows are given a value of 1 and 0.5, 100
respectively. These are considered to be conservative estimates since only burrows showing signs of activity and 101
with openings large enough (> 0.4 cm) to be distinguished from burrows and tubes of other benthic species were 102
recorded. 103
5
Bottom photographs taken in December 1984 and August 1985 by the first author at deep water stations along the 104
south shore of Newfoundland (Table 1 and Fig. 2; i.e., the same area from which Squires originally described the 105
species) were used to assess the distribution of Calocaris templemani and compare burrows (i.e., arrangement of 106
openings visible at the sediment surface) with those of the St. Lawrence Estuary. Unfortunately, while these 107
photographs provide greater coverage of the sediment surface (i.e., 2.0 m2), burrows appear to occupy a larger 108
surface area and frequent overlap of burrows are observed, therefore preventing quantitative estimation of burrow 109
density. Also, burrow opening diameters could not be measured in these photographs due to an inadequate angle of 110
incidence for the light source. 111
112
Mesocosm and aquarium observations and measurements 113
114
Observations on the behaviour of Calocaris templemani were made during five sets of mesocosm experiments, each 115
starting with a ‘fresh’ benthic community and lasting approximately five months, except for the last set which was 116
kept alive for about fifteen months. Each mesocosm experiment set was made up of three basins; each basin 117
representing a surface of 1.0 m2 of undisturbed sediment (depth of 35-40 cm) with its associated benthic 118
assemblages. Temperature (4.0 ± 0.5 °C) and salinity (34.5) were maintained constant by a dual water 119
circulation/cooling system. Details of the mesocosm system, sediment collection and transfer procedures are found 120
in Silverberg et al. (1995). In addition to the mesocosm observations, at the end of the third and fourth sets, two live 121
Calocaris were successfully transferred with sediment (10-15 cm deep) into a regular, temperature-controlled 122
aquarium (dimensions: 54 cm wide x 30 cm deep x 36 cm high) where they proceeded to elaborate their new 123
burrow, one of which was partly visible through the glass wall of the aquarium. 124
125
Time-lapsed video 126
127
A total of about 1050 hours of observations on the activities of Calocaris templemani were recorded on video tapes 128
under low-intensity red light, using time-lapse mode (i.e. 1 frame per second). For about 53% of these observations, 129
the b/w video camera was positioned vertically, opportunistically throughout the mesocosms sets, above a total of 130
six burrows in the mesocosms to quantify the frequency and duration of activities near the openings and outside the 131
burrow. The remaining observations were obtained during the 21-day elaboration and maintenance of a single 132
burrow by one individual in the aquarium. 133
6
Upon viewing the videos, frequencies and durations of the various activities of Calocaris templemani were tabulated 134
and subsequently compiled to establish a daily activity schedule. Particular attention was directed to activities 135
involving vertical sediment displacement in order to estimate volumes and rates of sediment transport to the surface. 136
When possible, the size of sediment packets or shovelfuls (i.e. height and width) was measured using the JANDEL 137
JAVA™ Image Analysis System to estimate the average volume of transported sediment. In most instances, 138
however, because the width of each packet is only slightly smaller than the opening diameter, the average diameter 139
of all openings for each burrow was used to estimate volume of sediment packets. The volume of each packet was 140
approximated as the volume (V) of an ellipsoid, V = (πL d2)/6, where the length (L) is approximately 1.2 times the 141
diameter (d) of a packet. The excavated sediment was not collected for analysis. 142
143
Burrow casts 144
145
At the end of each of the last four mesocosm sets, a cast of each burrow present in these sets was made with 146
polyester resin, following the method described by Shinn (1968) and Atkinson and Chapman (1984). A total of 11 147
casts were used to describe the burrow architecture and the relationships between volume occupied, the number of 148
openings and their diameter. The diameter of each opening was measured with a calibrated caliper at the point of 149
constriction nearest to the sediment surface. This measure is assumed comparable with those taken on bottom 150
photographs; i.e. it does not take into account the funnel shape of many ‘inhalant’ openings. The diameter of 151
horizontal galleries was also measured between intersections or between enlarged areas where the shrimp can 152
presumably turn around. The volume of each cast was determined by a simple volume displacement method. By 153
combining this information with the mean number of burrows per m2
measured from the in situ photographs at 154
Station 23, an estimate of the total volume occupied by Calocaris templemani burrows per m2 was obtained and 155
used to determine the rate of sediment displacement. 156
7
157
Results 158
159
Distribution and densities of Calocaris templemani and its burrows 160
161
Squires (1965) described Calocaris templemani from a specimen collected in Hermitage Bay, Newfoundland. The 162
photographic surveys from deep water areas off the south coast of Newfoundland, in and around Hermitage Bay, 163
suggest that this species is broadly distributed over fine sediment habitats between 270 and 540 m depth (Table 1). 164
Based on the presence of burrows, which are very distinctive from burrow of any other species in these habitats (see 165
following section), it appears to be most abundant in Fortune Bay where sediments are similar to those found at 166
Station 23 and absent from areas of Hermitage Channel where coarse sediments predominate. 167
Temperatures (-1.5 to 6 °C) and salinities (26-36) at the Newfoundland locations are typical of Modified Slope 168
Water under the influence of the Labrador Current (De Young and Hay 1987) and Coastal Water (McLellan 1957). 169
The variations in these physical properties encompass those found at Station 23, as well as those found in the Gulf of 170
St. Lawrence and the Gulf of Maine where C. templemani was previously collected (Squires 1965, 1990; Williams 171
1984). 172
The mean burrow density for Calocaris templemani at Station 23 was estimated from in situ bottom photographs as 173
1.7 burrows m-2
(Table 1), with a maximum of seven burrows observed per m2. The 270-metre station in Fortune 174
Bay displayed a slightly greater abundance of active burrows. Mean density estimates for C. templemani obtained 175
from Station 23 (in situ core samples; 4.4 individuals m-2
) and from the mesocosms (2.2 individuals m-2
) provide an 176
overall average density is 3.4 individuals m-2
. 177
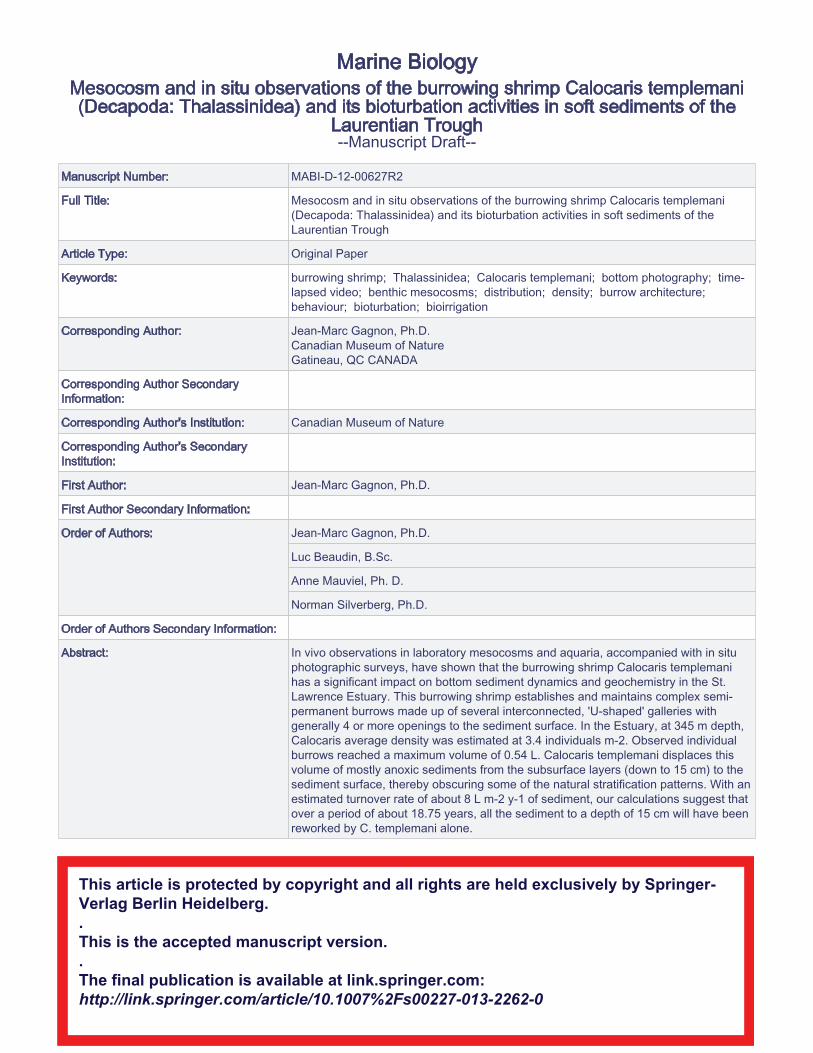
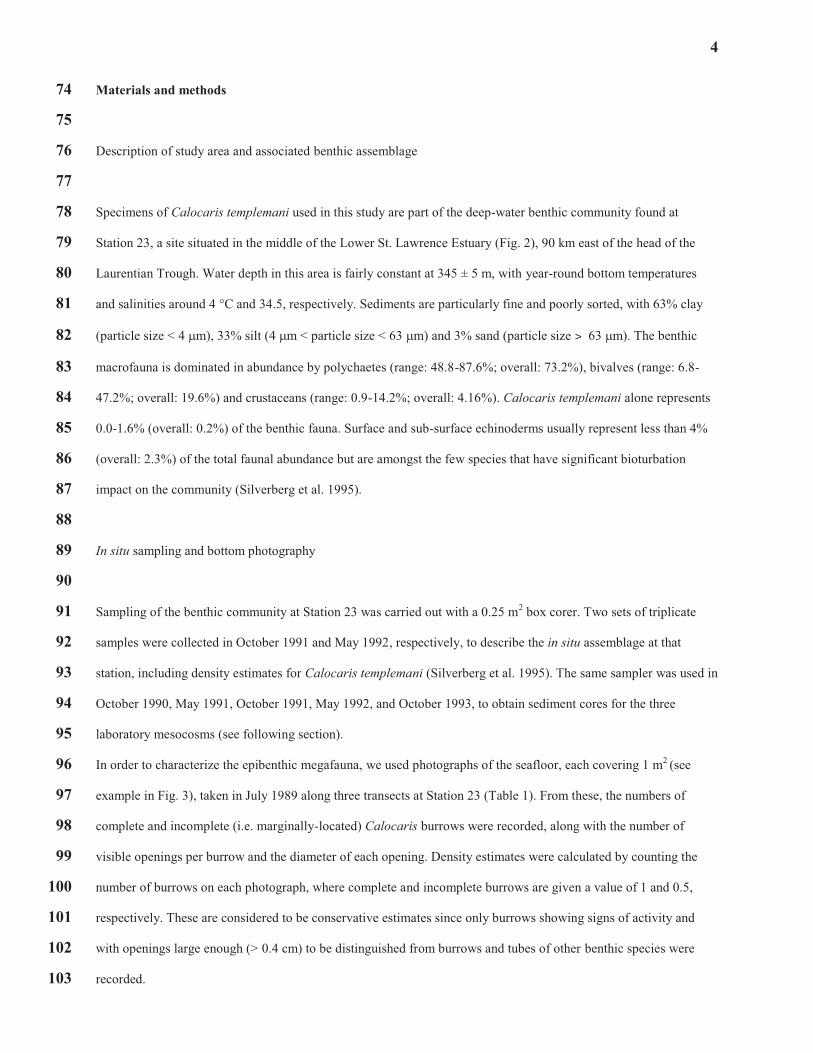
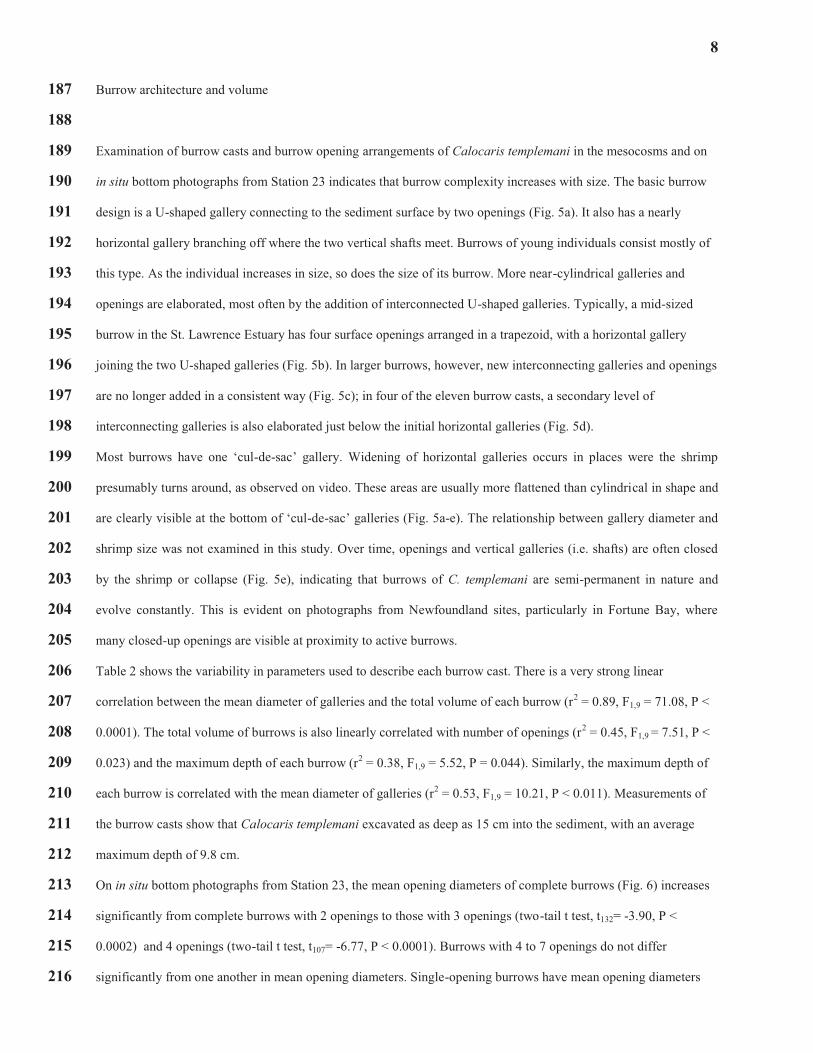
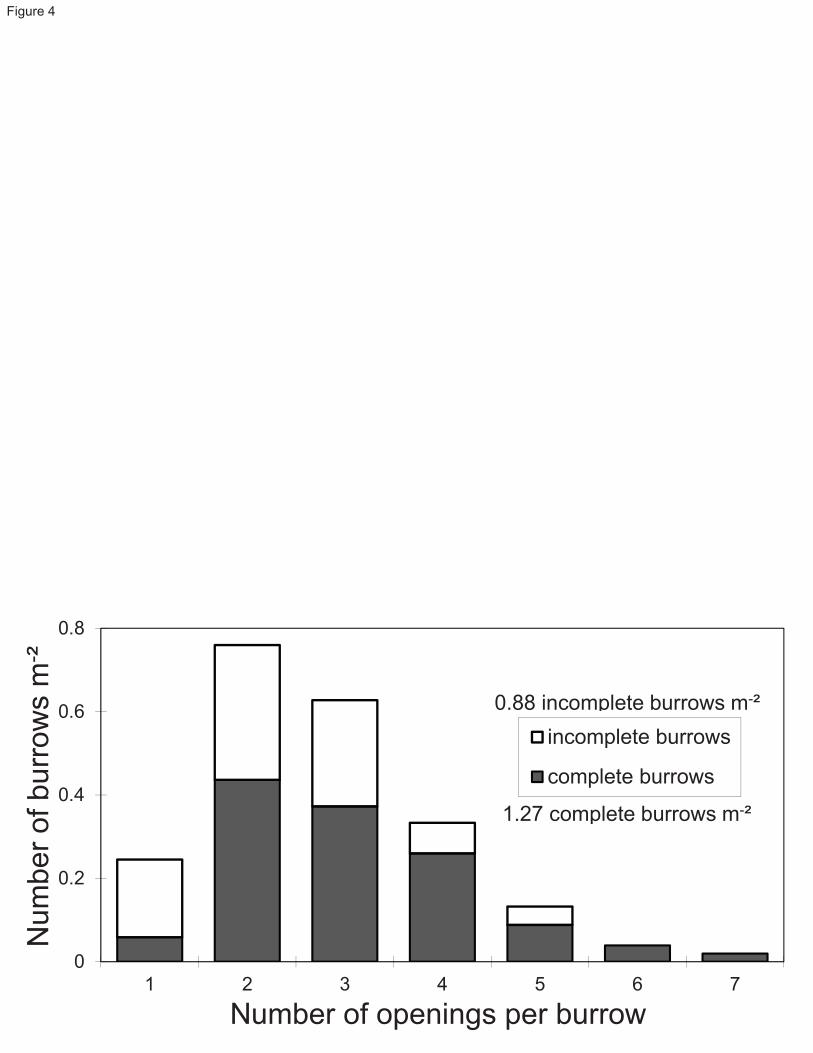
The frequency of complete and incomplete burrows per m2 and their corresponding number of openings for Station 178
23 is illustrated in Fig. 4. Most burrows observed on the bottom photographs have two to four openings, with no 179
significant differences in means (two-tail t-test, t11 = -0.66, P > 0.52) and variances (one-tailed F-test, F1,6 = 0.58, P > 180
0.26) for the number of openings between complete and incomplete burrows. On average, there were 6.0 (SD = 3.7, 181
N = 204) identifiable burrow openings per m2 at Station 23, compared with 3.6 (SD = 2.1, N = 171), 1.2 (SD = 1.0, 182
N = 60) and 0.5 (SD = 0.8, N = 48) openings m-2
in Fortune Bay, Bay d’Espoir and Hermitage Bay, respectively. At 183
the Newfoundland locations, however, burrow architecture (i.e., as seen on photos of the sediment surface) did not 184
appear to be as clearly defined as at Station 23, greatly limiting the estimation of densities (Table 1). 185
186
8
Burrow architecture and volume 187
188
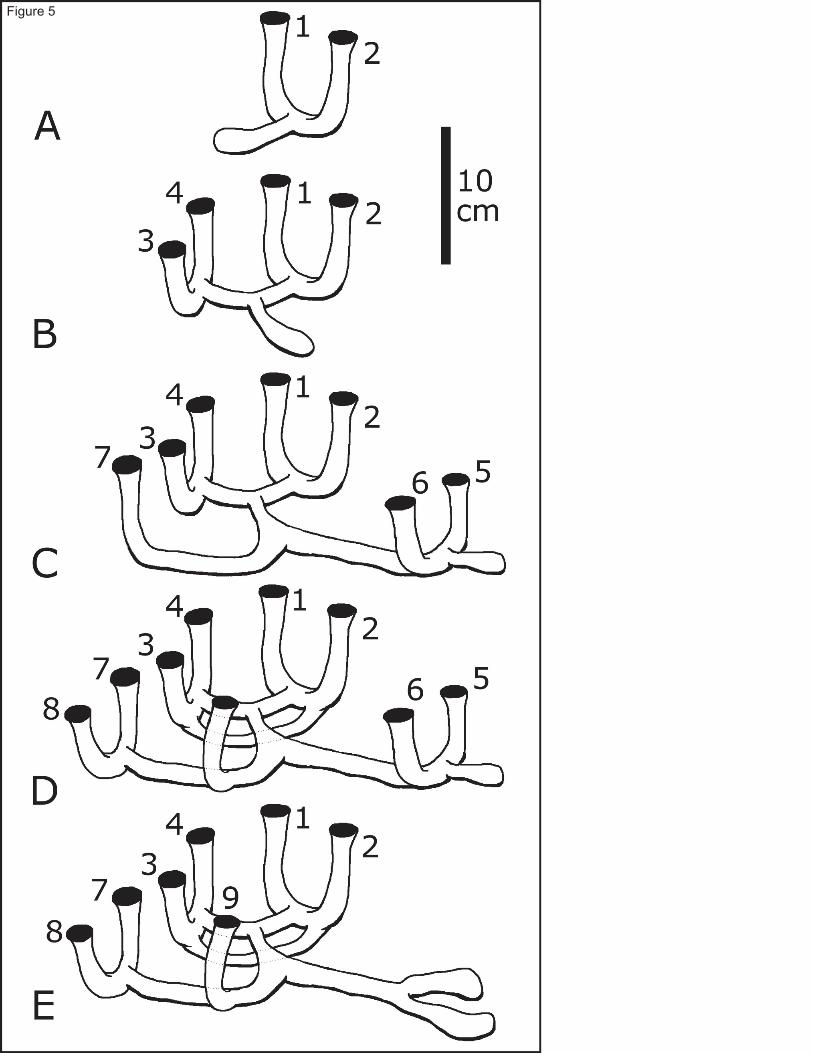
Examination of burrow casts and burrow opening arrangements of Calocaris templemani in the mesocosms and on 189
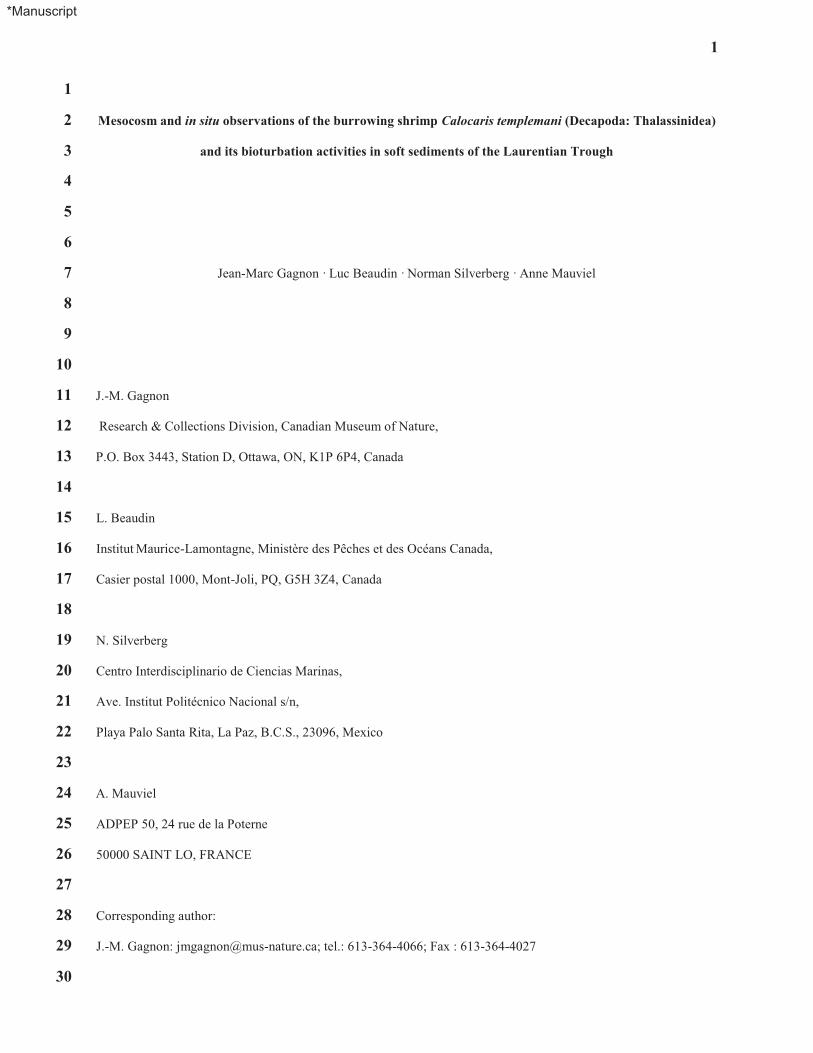
in situ bottom photographs from Station 23 indicates that burrow complexity increases with size. The basic burrow 190
design is a U-shaped gallery connecting to the sediment surface by two openings (Fig. 5a). It also has a nearly 191
horizontal gallery branching off where the two vertical shafts meet. Burrows of young individuals consist mostly of 192
this type. As the individual increases in size, so does the size of its burrow. More near-cylindrical galleries and 193
openings are elaborated, most often by the addition of interconnected U-shaped galleries. Typically, a mid-sized 194
burrow in the St. Lawrence Estuary has four surface openings arranged in a trapezoid, with a horizontal gallery 195
joining the two U-shaped galleries (Fig. 5b). In larger burrows, however, new interconnecting galleries and openings 196
are no longer added in a consistent way (Fig. 5c); in four of the eleven burrow casts, a secondary level of 197
interconnecting galleries is also elaborated just below the initial horizontal galleries (Fig. 5d). 198
Most burrows have one ‘cul-de-sac’ gallery. Widening of horizontal galleries occurs in places were the shrimp 199
presumably turns around, as observed on video. These areas are usually more flattened than cylindrical in shape and 200
are clearly visible at the bottom of ‘cul-de-sac’ galleries (Fig. 5a-e). The relationship between gallery diameter and 201
shrimp size was not examined in this study. Over time, openings and vertical galleries (i.e. shafts) are often closed 202
by the shrimp or collapse (Fig. 5e), indicating that burrows of C. templemani are semi-permanent in nature and 203
evolve constantly. This is evident on photographs from Newfoundland sites, particularly in Fortune Bay, where 204
many closed-up openings are visible at proximity to active burrows. 205
Table 2 shows the variability in parameters used to describe each burrow cast. There is a very strong linear 206
correlation between the mean diameter of galleries and the total volume of each burrow (r2 = 0.89, F1,9 = 71.08, P < 207
0.0001). The total volume of burrows is also linearly correlated with number of openings (r2 = 0.45, F1,9 = 7.51, P < 208
0.023) and the maximum depth of each burrow (r2 = 0.38, F1,9 = 5.52, P = 0.044). Similarly, the maximum depth of 209
each burrow is correlated with the mean diameter of galleries (r2 = 0.53, F1,9 = 10.21, P < 0.011). Measurements of 210
the burrow casts show that Calocaris templemani excavated as deep as 15 cm into the sediment, with an average 211
maximum depth of 9.8 cm. 212
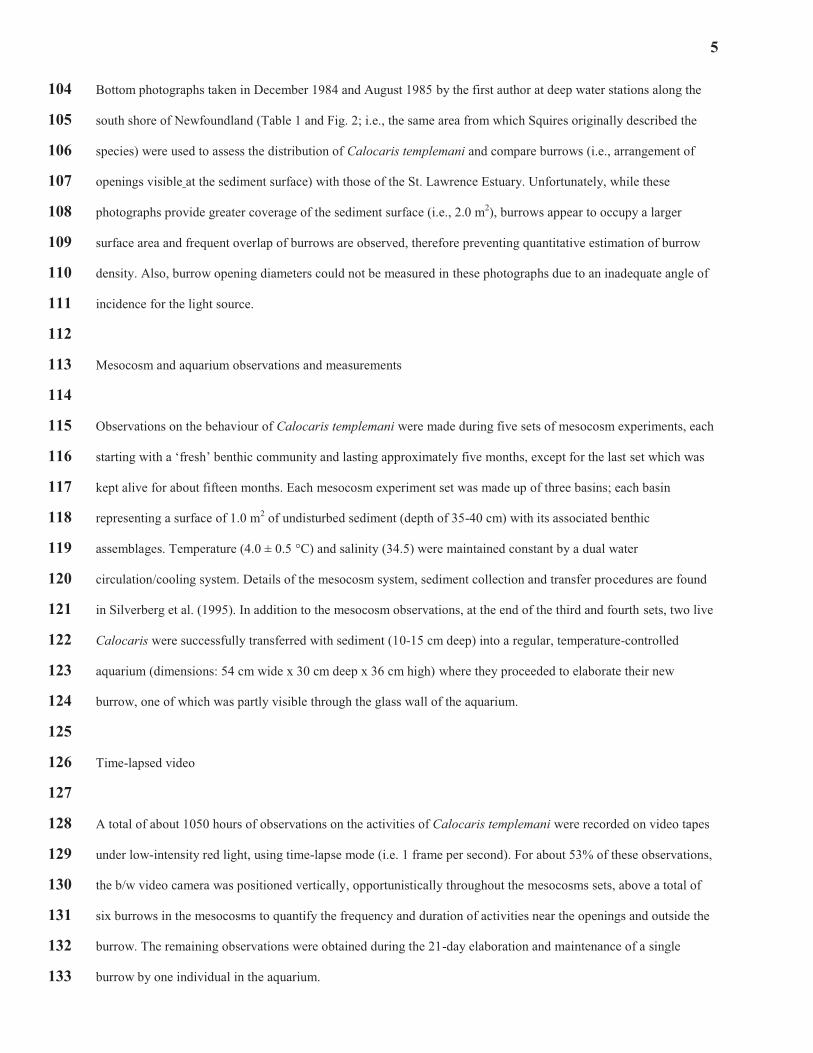
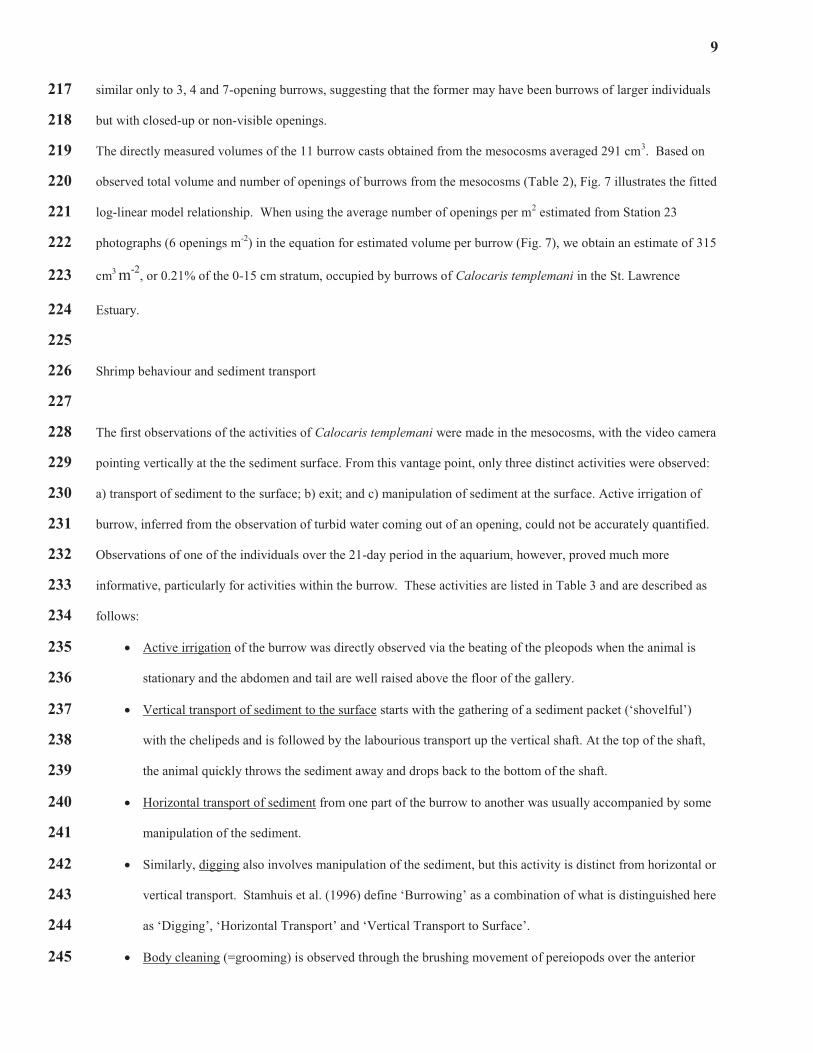
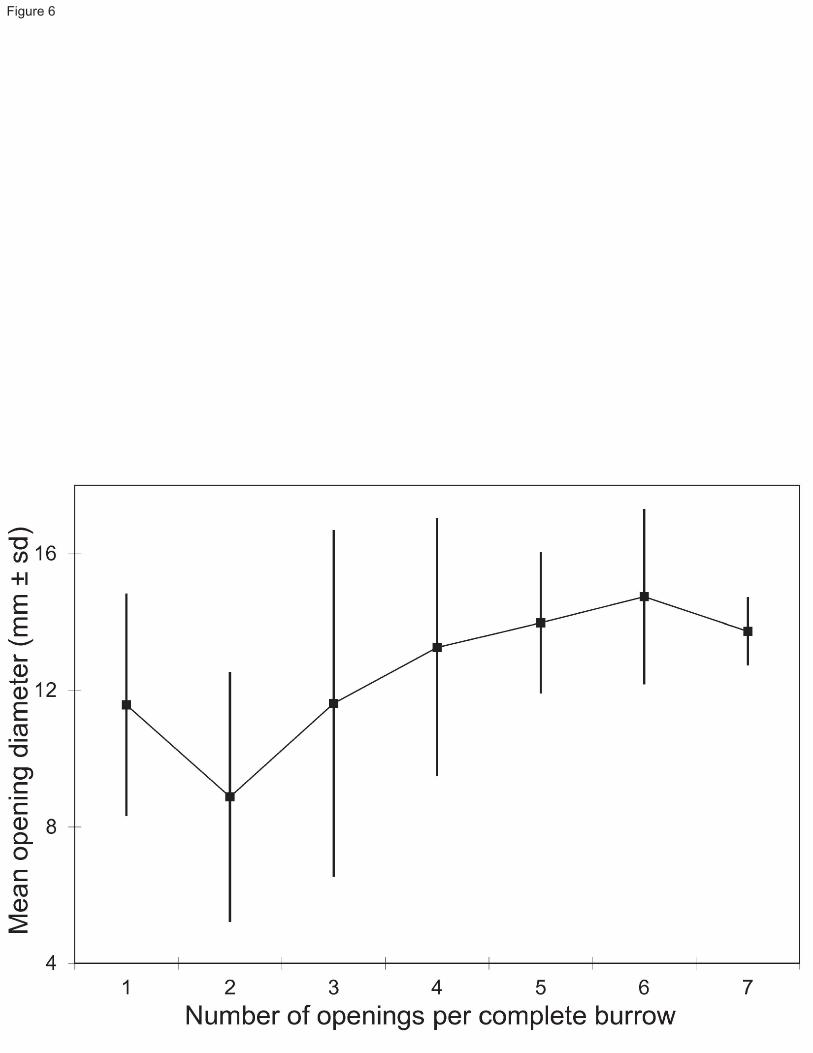
On in situ bottom photographs from Station 23, the mean opening diameters of complete burrows (Fig. 6) increases 213
significantly from complete burrows with 2 openings to those with 3 openings (two-tail t test, t132= -3.90, P < 214
0.0002) and 4 openings (two-tail t test, t107= -6.77, P < 0.0001). Burrows with 4 to 7 openings do not differ 215
significantly from one another in mean opening diameters. Single-opening burrows have mean opening diameters 216
9
similar only to 3, 4 and 7-opening burrows, suggesting that the former may have been burrows of larger individuals 217
but with closed-up or non-visible openings. 218
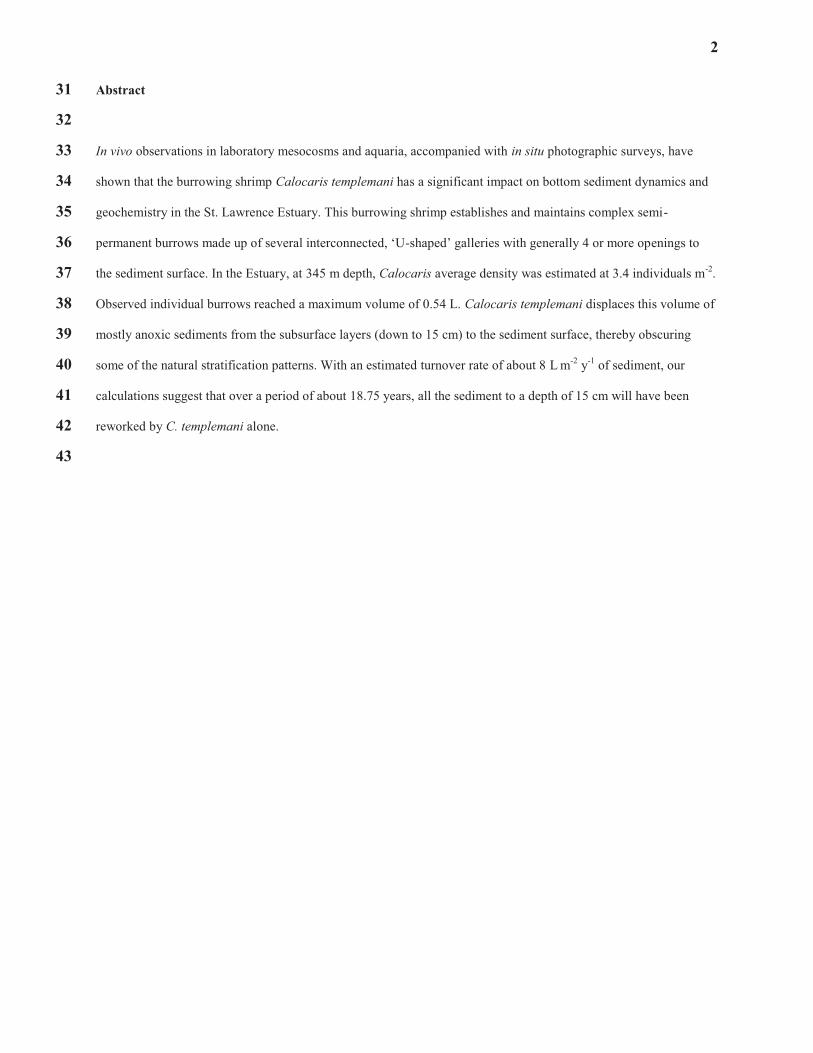
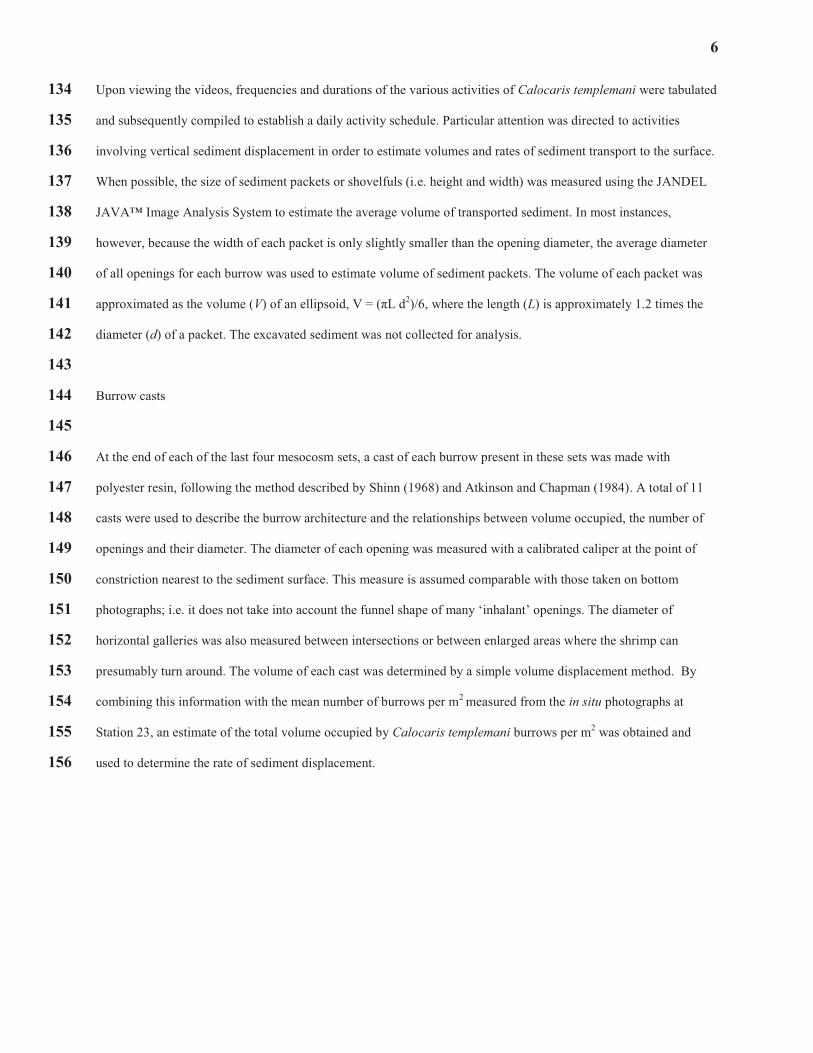
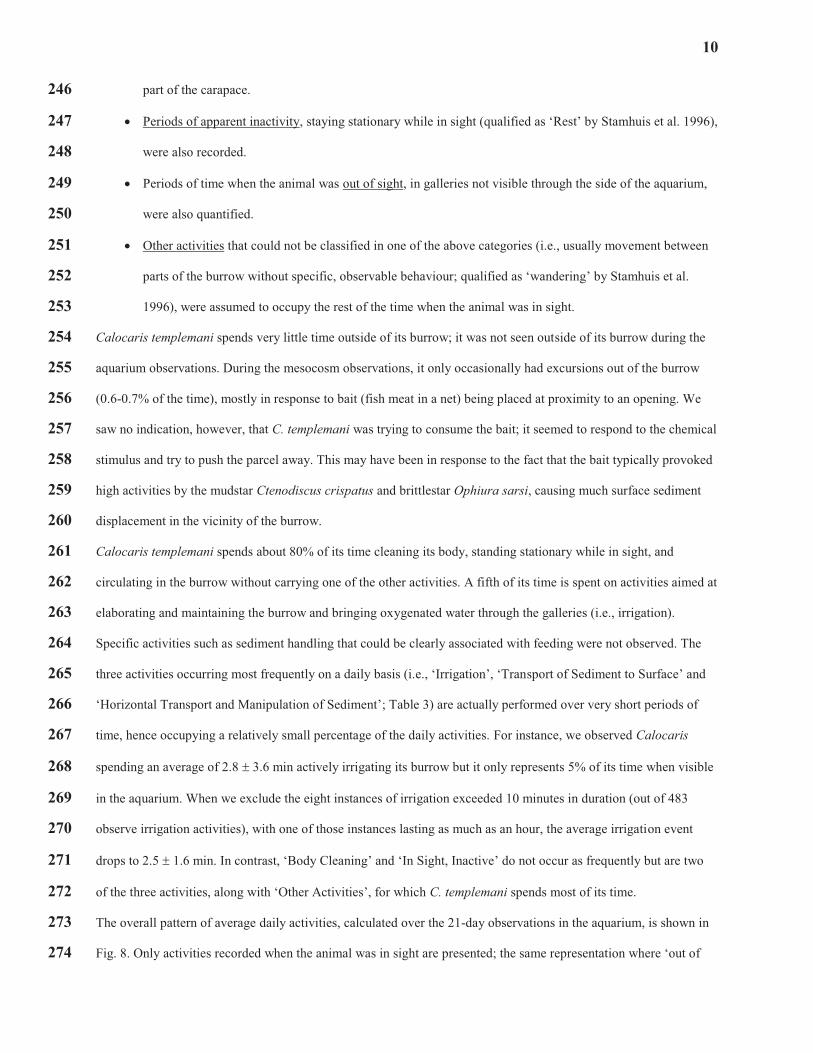
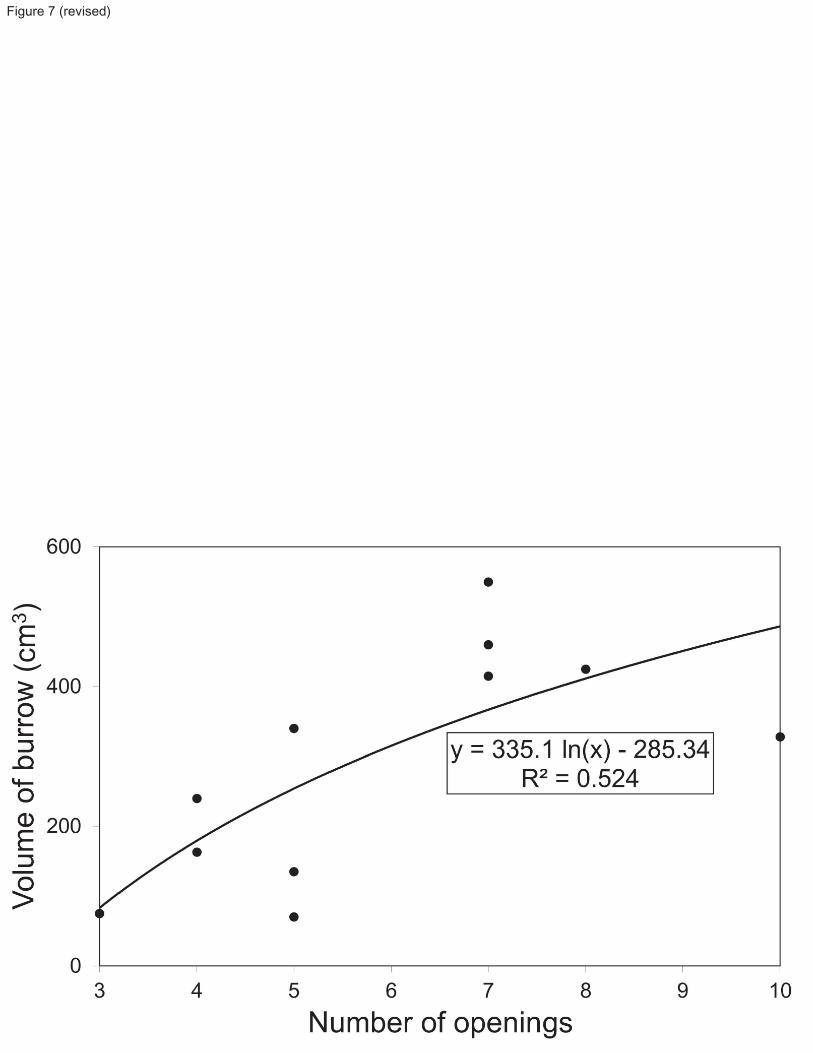
The directly measured volumes of the 11 burrow casts obtained from the mesocosms averaged 291 cm3. Based on 219
observed total volume and number of openings of burrows from the mesocosms (Table 2), Fig. 7 illustrates the fitted 220
log-linear model relationship. When using the average number of openings per m2 estimated from Station 23 221
photographs (6 openings m-2
) in the equation for estimated volume per burrow (Fig. 7), we obtain an estimate of 315 222
cm3 m
-2, or 0.21% of the 0-15 cm stratum, occupied by burrows of Calocaris templemani in the St. Lawrence 223
Estuary. 224
225
Shrimp behaviour and sediment transport 226
227
The first observations of the activities of Calocaris templemani were made in the mesocosms, with the video camera 228
pointing vertically at the the sediment surface. From this vantage point, only three distinct activities were observed: 229
a) transport of sediment to the surface; b) exit; and c) manipulation of sediment at the surface. Active irrigation of 230
burrow, inferred from the observation of turbid water coming out of an opening, could not be accurately quantified. 231
Observations of one of the individuals over the 21-day period in the aquarium, however, proved much more 232
informative, particularly for activities within the burrow. These activities are listed in Table 3 and are described as 233
follows: 234
· Active irrigation of the burrow was directly observed via the beating of the pleopods when the animal is 235
stationary and the abdomen and tail are well raised above the floor of the gallery. 236
· Vertical transport of sediment to the surface starts with the gathering of a sediment packet (‘shovelful’) 237
with the chelipeds and is followed by the labourious transport up the vertical shaft. At the top of the shaft, 238
the animal quickly throws the sediment away and drops back to the bottom of the shaft. 239
· Horizontal transport of sediment from one part of the burrow to another was usually accompanied by some 240
manipulation of the sediment. 241
· Similarly, digging also involves manipulation of the sediment, but this activity is distinct from horizontal or 242
vertical transport. Stamhuis et al. (1996) define ‘Burrowing’ as a combination of what is distinguished here 243
as ‘Digging’, ‘Horizontal Transport’ and ‘Vertical Transport to Surface’. 244
· Body cleaning (=grooming) is observed through the brushing movement of pereiopods over the anterior 245
10
part of the carapace. 246
· Periods of apparent inactivity, staying stationary while in sight (qualified as ‘Rest’ by Stamhuis et al. 1996), 247
were also recorded. 248
· Periods of time when the animal was out of sight, in galleries not visible through the side of the aquarium, 249
were also quantified. 250
· Other activities that could not be classified in one of the above categories (i.e., usually movement between 251
parts of the burrow without specific, observable behaviour; qualified as ‘wandering’ by Stamhuis et al. 252
1996), were assumed to occupy the rest of the time when the animal was in sight. 253
Calocaris templemani spends very little time outside of its burrow; it was not seen outside of its burrow during the 254
aquarium observations. During the mesocosm observations, it only occasionally had excursions out of the burrow 255
(0.6-0.7% of the time), mostly in response to bait (fish meat in a net) being placed at proximity to an opening. We 256
saw no indication, however, that C. templemani was trying to consume the bait; it seemed to respond to the chemical 257
stimulus and try to push the parcel away. This may have been in response to the fact that the bait typically provoked 258
high activities by the mudstar Ctenodiscus crispatus and brittlestar Ophiura sarsi, causing much surface sediment 259
displacement in the vicinity of the burrow. 260
Calocaris templemani spends about 80% of its time cleaning its body, standing stationary while in sight, and 261
circulating in the burrow without carrying one of the other activities. A fifth of its time is spent on activities aimed at 262
elaborating and maintaining the burrow and bringing oxygenated water through the galleries (i.e., irrigation). 263
Specific activities such as sediment handling that could be clearly associated with feeding were not observed. The 264
three activities occurring most frequently on a daily basis (i.e., ‘Irrigation’, ‘Transport of Sediment to Surface’ and 265
‘Horizontal Transport and Manipulation of Sediment’; Table 3) are actually performed over very short periods of 266
time, hence occupying a relatively small percentage of the daily activities. For instance, we observed Calocaris 267
spending an average of 2.8 ± 3.6 min actively irrigating its burrow but it only represents 5% of its time when visible 268
in the aquarium. When we exclude the eight instances of irrigation exceeded 10 minutes in duration (out of 483 269
observe irrigation activities), with one of those instances lasting as much as an hour, the average irrigation event 270
drops to 2.5 ± 1.6 min. In contrast, ‘Body Cleaning’ and ‘In Sight, Inactive’ do not occur as frequently but are two 271
of the three activities, along with ‘Other Activities’, for which C. templemani spends most of its time. 272
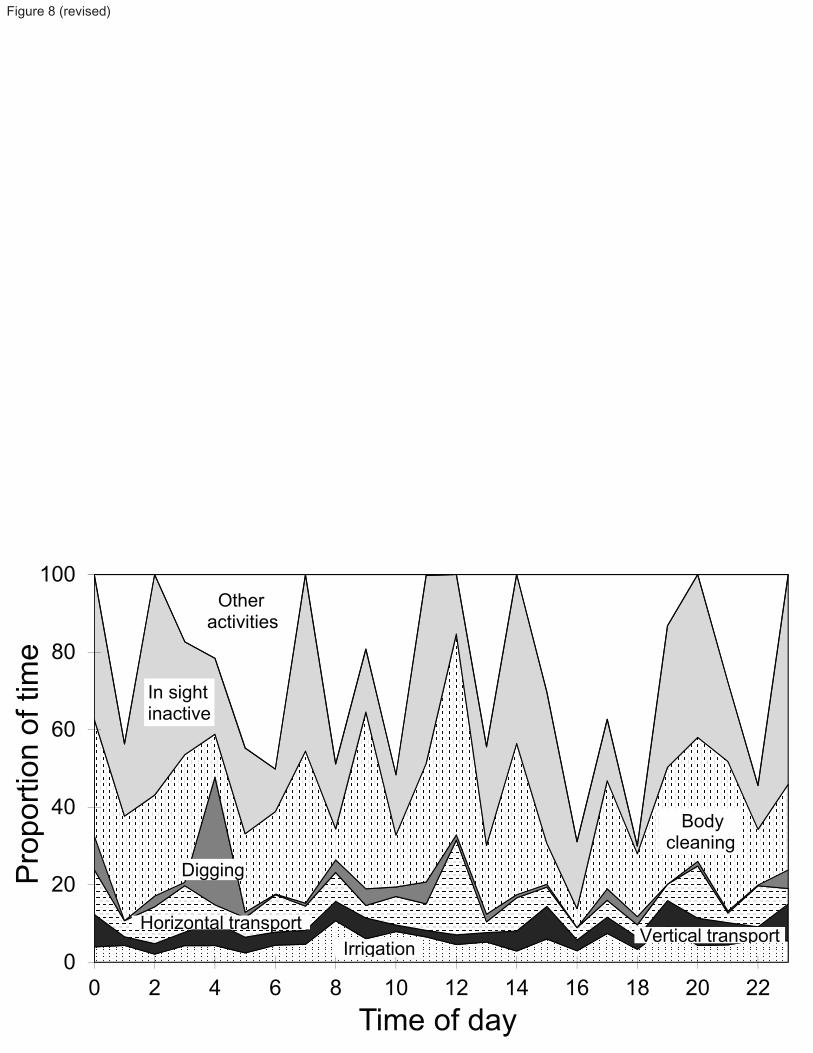
The overall pattern of average daily activities, calculated over the 21-day observations in the aquarium, is shown in 273
Fig. 8. Only activities recorded when the animal was in sight are presented; the same representation where ‘out of 274
11
sight’ periods are included (not illustrated) shows identical patterns. These reveal a certain degree of periodicity, 275
with activities such as ‘Body Cleaning’ and ‘Horizontal Transport of Sediment’ recurring at higher intensity every 276
2-4 hours and being correlated with each other (r2 = 0.18, F1,22= 4.83, P < 0.039). Similarly, periods of rest (i.e., ‘in 277
sight, inactive’) follow a similar pattern although not significantly correlated the latter two activities. 278
‘Other activities’ (i.e., movement in the galleries while in sight and not associated with one of the other described 279
activities) show significant negative relationships with body cleaning (r2 = 0.46, F1,22 = 18.87, P < 0.0003) and 280
horizontal transport of sediment (r2 = 0.62, F1,22 = 35.89, P < 0.0001), suggesting that, not surprisingly, periods 281
where Calocaris simply moves around in its burrow are often preceeded or followed those specific activities. 282
The average volume of sediment packets transported to the surface (i.e., outside the burrow) by an adult Calocaris 283
templemani is estimated at 0.49 cm³. However, since these packets consist of uncompacted sediment, a medium 284
compaction factor of 0.5 is applied to estimate the volume of subsurface (compacted) sediment displaced at 0.225 285
cm³ (0.113 g dry mass, averaged over the 0-15 cm strata). With a frequency of 28.8 packets transported to the 286
surface per day and an average population density of 3.4 individuals m-2
, an estimated volume of 8 L (4 kg dry 287
mass) m-² y
-2 of subsurface sediment is transported to the surface by this species. When considering the maximal 288
depth of the burrows of C. templemani (15 cm), the estimated turnover time of that layer of sediment is 18.75 years. 289
290
291
Discussion 292
293
Calocaris templemani is a small burrowing shrimp very similar to its European sibling, C. macandreae (4-5 cm total 294
adult length; 1.4 cm carapace length). The distribution of the former in the Northwest Atlantic and Gulf of St. 295
Lawrence shows similar preferences for sediment granulometry but a narrower depth range (270-540 m, this study; 296
200-700 m, Williams 1984) than for the latter species in the Northeast Atlantic (15-1400 m; Ingle and Christiansen 297
2004). Densities of C. templemani at Station 23 (3.4 ind. m-2
) appear much lower than in the area off the 298
Northumberland Coast studied by Buchanan (1963; average 18 ind. m-2
) and off Solbergstrand in Olslofjord, 299
Norway (Widdicombe and Austen 2003; 10 ind. m-2
) but higher than in the lochs of Northwest Scotland (0.02-0.4 300
burrows m-2
; Nash et al. 1984) and in West Scotland (0.53 to 1.29 m-2
; Pinn and Robertson 1998). While density 301
estimates from core samples obtained in the present study may not accurately reflect Calocaris macandreae’s actual 302
in situ density at Station 23 due to the relatively small surface area sampled by the corer, these values still suggests 303
that observations from bottom photographs underestimate the natural population density. The five sets of 304
12
mesocosms experiments, each representing a total of 3 m2-surface area, however, still show an overall density 305
estimate (2.2 individuals m-2
) greater than for bottom photographs, not taking into account possible mortality in 306
mesocosms due to the transfer of sediments from 345 m in the Estuary to the laboratory setup. 307
The burrow architecture for these two species of Calocaris also shares some resemblance, but mostly in their early 308
phase of development. Nash et al. (1984) describe the initiation of a burrow system for C. macandreae with a 309
simple U-shaped gallery connected to the sediment surface by two openings. This and the subsequent elaboration of 310
a horizontal tunnel originating from the bottom of the ‘U’ are also typical of C. templemani (Fig. 5a). Beyond that 311
point, however, the architecture appears to differ. While both species have a tripartite pattern of branching in the 312
horizontal plane, in the case of C. templemani this does not appear to result in triads of burrow openings as it does in 313
for C. macandreae; at least not in the early development of the burrow. C. macandreae will generally connect the 314
horizontal gallery to the surface by one vertical shaft (the ‘3-entrance’ basic system; only occasionally 4 entrances) 315
while C. templemani typically elaborates another U-shaped gallery at the end of the horizontal tunnel, forming the 316
‘4-entrance’ pattern (Fig. 5b) commonly observed in the bottom photographs at Station 23 (Fig. 3). In the southern 317
Newfoundland bays, however, the presence of many closed openings observed in the photographs suggests a greater 318
remodeling of burrows, possibly over shorter periods of time than at Station 23. This may be related to a more 319
abundant demersal fish fauna in the former (JM Gagnon pers observ), resulting in greater surface sediment 320
disturbance. 321
Other than the basic early patterns and the use of U-shaped galleries, there are relatively limited similarities in the 322
subsequent development of the gallery systems. In burrows of Calocaris macandreae, a second, deeper layer of 323
galleries is typically added, with only some tunnels occasionally connected to the sediment surface by additional 324
galleries in the first layer (Nash et al. 1984). In contrast, C. templemani mostly adds horizontal tunnels and vertical 325
shafts to the surface, often but not always in U-shape (Fig. 5c-d). Only occasionally does this species add deeper 326
galleries and these only seem to serve as a by-pass immediately below existing horizontal galleries (Fig. 5d). Unlike 327
C. macandreae, C. templemani does not appear to construct circular tunnels. 328
Thus far, direct observations of burrow architecture for Calocaris templemani are based on specimens maintained in 329
mesocosms. The only indication that in situ burrows in the Laurentian Trough may have the same architecture is the 330
arrangement of burrow openings as observed on bottom photographs. It is always possible that deeper galleries (or 331
secondary levels) are developed in their natural habitat. However, considering the fact that sediment depth in our 332
mesocosms was about 45 cm (i.e. well below the 21 cm depth of secondary levels observed for C. macandreae and 333
the deepest gallery for C. templemani; Table 1) and that the benthic assemblages in these mesocosms were 334
13
maintained for 19 to 61 weeks, this suggests that duration and the physical setup of the mesocosms were not limiting 335
factors in the development of deeper galleries by C. templemani. 336
The various activities observed during the elaboration and maintenance of the burrow by Calocaris templemani in 337
the aquarium are similar to those described as behaviour patterns by Anderson et al. (1991) for Calocaris 338
macandreae and behavioural classes by Stamhuis et al. (1996) for Callianassa subterranea (see Table 3). The 339
frequency and time allocation for each of these activities do not differ greatly between these three species. Being 340
inactive or resting occupies the largest proportion of their time (27.4-43%) while irrigating their burrow occupies the 341
least amount of time (2-8.5%); the latter suggesting that they are efficient at exchanging burrow water. These 342
proportions of their time spent irrigating are lower than those observed for Upogebia deltaura and U. stellata (2.3-343
32.6% and 5.7-38.6%, respectively; Astall et al. 1997), Neotrypaea (as Callianassa) californiensis (40%; Torres et 344
al. 1977) and Upogebia pusilla (28%; Dworschak 1981). Several factors may account for such differences, including 345
the burrow architecture, the laboratory (aquarium) set up, the degree of passive water flow in the burrow and the 346
oxygen saturation level in the ambient water. 347
Activities that involve interactions with the sediment, such as horizontal, vertical transport or other ‘Burrowing’ 348
activities occupy from 15 to 27% of their time and may relate, at least in part, to the degree to which the burrow has 349
evolved. Pinn and Atkinson (2010) noted that during the early stage of development of the burrow of Calocaris 350
macandreae, relatively little happened in terms of number of openings or galleries created. This would likely result 351
in a reduction of the amount of time allocated to ‘Burrowing’ activities, as well as other activities directly related to 352
burrowing such as ‘Grooming’, in favour of other activities such as ‘Resting’, ‘Wandering’ or ‘Irrigating’. Sediment 353
disturbance by epibenthic megafauna such as mudstars, brittlestars and even seapens and cerianthid anemones 354
observed in this study also influenced the time required to elaborate and maintain burrow openings and galleries. 355
The stability of sediment against the aquarium glass may also affect the amount of time required to maintain existing 356
galleries or construct new galleries to replace collapsed ones. In the present study, we used a regular aquarium 357
where the first galleries happened to be constructed directly against the glass. Evidences of sediment instability were 358
frequently observed, resulting in the diameter of the gallery becoming 2-3 times the original size over time and 359
ultimately collapsing at the end of the 21 days of observations. Results would likely have been different if narrow 360
aquaria or cuvettes were used (Stamhuis et al. 1996; Pinn and Atkinson 2010). This may be supported by the fact 361
that the most frequent daily activities observed in this study for Calocaris templemani (Table 3) can be grouped 362
under the broader category ‘Burrowing’ (52 events d-1
), even though each did not last long and amounted, all 363
together, to only 15% of its time budget. 364
14
Throughout nearly a thousand or so hours of time-lapsed video observations, including the 21 continuous days 365
during which an individual elaborated and maintained its burrow in plain view in an aquarium, no specific behaviour 366
could be directly associated with feeding. As suggested in Dworschack et al. (2006), feeding may be taking place 367
while transporting sediment or burrowing. The few excursions outside the burrow were mostly in response to the 368
presence of bait on surface, near the burrow, and seemingly due to the resulting high degree of surface sediment 369
disturbance by the epibenthic mudstar and brittlestar in response to the presence of bait. Unfortunately, unlike the 370
experiment conducted by Pinn and Atkinson (2010), in the present study, bait was always protected within a nylon 371
mesh, preventing Calocaris templemani from having direct access to the actual meat (capelin). 372
Pinn et al. (1998) and Atkinson and Taylor (2005) reported that the feeding strategies of Calocaris macandreae are 373
numerous and varied, including omnivory, scavenging, suspension feeding, cannibalism and necrophagy, although 374
selective deposit feeding appeared to be the dominant trophic mode. Interactions between C. templemani and live 375
endo- and epibenthic invertebrates were observed, albeit rarely, and consisted mostly of pushing the occasional 376
mudstar away from a burrow opening or trying to push up the bottom end of a cerianthid parchment tube dangling in 377
the gallery. Direct observations of carnivory and food burial (caching) were first made by Pinn and Atkinson (2010) 378
for C. macandreae, although it is assumed that these feeding behaviours are mostly opportunistic while deposit 379
feeding and microbial gardening would be the primary feeding strategies. Unfortunately, the image resolution in the 380
present work was not sufficient to observe fine movements of the maxillipeds and pereiopods II. Still, the lack of 381
direct observation of feeding activities suggest that C. templemani is, like many other thalanassideans (Pinn and 382
Atkinson 2010), mostly a deposit feeder. 383
Burrowing shrimps directly impact their surrounding environment, physically, chemically and biologically 384
(Atkinson and Taylor 2005; Kristensen and Kostka 2005; Meysman et al. 2006; Pinn and Atkinson, 2010), by 385
creating and maintaining relatively huge tunnel structures connected to the sediment surface and oxygenated water. 386
Most marine bioturbating species rework bottom sediment by displacing and mixing particles and solutes on a small 387
scale relative to their body size (i.e., movement around and along their body or tube). This is the case for the 388
mudstar, Ctenodiscus crispatus, and the heart urchin, Brisaster fragilis, two benthic species also encountered at 389
Station 23 in the St. Lawrence Estuary. While estimated sediment displacement rates for these two species are 4 to 390
22 folds greater than that of Calocaris templemani (JM Gagnon unpubl data), much of the sediment movement or 391
reworking is from the “front” to the “back” of their body; a scale of about 3 to 5 cm mostly on the horizontal plan. In 392
contrast and like most species of burrowing shrimps (Rowden et al. 1998), C. templemani displaces sediments 393
horizontally and vertically over substantial distances relative to its size (i.e. 15 cm vertically and potentially up to 44 394
15
cm horizontally), suggesting significant impact on sediment dynamics. These subsurface spaces and surfaces 395
provide a refuge or new surfaces for settling and growth of micro-, meio- and macrofauna (e.g. Suchanek 1983; 396
Widdicombe and Austen 2003; Papaspyrou et al. 2005), presumably even for some time after a burrow is 397
abandoned. In spite of its low density in the Laurentian Trough, C. templemani transports to the surface an estimated 398
8 L m-2
y-1
(4 kg dry mass m-2
y-1
) of subsurface sediment from the 0-15 cm stratum. Even through this sediment 399
turnover estimate lacks confidence in spatial and temporal units (Rowden and Jones 1993), it still suggests a 400
significant contribution of C. templemani to recirculating formerly buried organic and inorganic substances, also 401
allowing substances present on surface to reach deep within the sediment. Hence, these substances presumably 402
become available to other epi- and endobenthic organisms (Atkinson and Taylor 2005; Meysman et al. 2006). 403
Bioturbation by burrowing shrimps also contributes significantly to bio-irrigation in marine sediments (e.g. Webb 404
and Eyre 2004; Atkinson and Taylor 2005; Kristensen and Kostka 2005). Meysman et al. (2006) define bio-405
irrigation “in a broad sense, [as] any form of enhanced solute transport that results from sediment reworking by 406
organisms. In a strict sense, [as] the enhanced exchange between the pore water and the overlying water column 407
owing to burrow flushing.” Although our measures of the time spent by Calocaris templemani irrigating its burrow 408
do not include the actual volume of water transported (i.e. irrigation), one can still calculate a minimum estimate of 409
the rate of bio-irrigation. Since, apart from respiration demand by the animals themselves, oxygen is continuously 410
being lost by diffusion into the surrounding sediment through the burrow walls, it is presumed that C. templemani 411
must exchange a minimum volume of burrow water with the overlying, O2-saturated seawater if individuals are not 412
to succumb to asphyxiation. Assuming the estimated mean volume of burrows from the 11 casts obtained in this 413
study (291.0 ± 164.8 cm3; Table 2) to be equivalent to a sphere, it represents a mean radius of 3.9 ± 0.9 cm and a 414
mean surface area (mostly exposed to anoxic porewater) of 204.3 ± 84.2 cm2. With fairly consistent oxygen uptake 415
by the sediment measured during a number of mesocosm experiments (~ 0.4 mmol cm-2
d-1
; Silverberg et al. 1995), 416
oxygen uptake across this surface would represent an average 81.7 ± 33.7 mmol d-1
. Using 325 mM as the dissolved 417
O2 concentration of saturated seawater at 4 °C (in situ bottom water concentrations are considerably lower and 418
would thus entail even higher minimum exchange rates), the minimum exchange rate of water between the burrow 419
and the overlying water (= burrow flow rate) would amount to 0.25 ± 0.10 L d-1
(or 10.5 ± 4.3 mL h-1
). Actual 420
measurements of single burrow flow rates for thalassinidean shrimps vary considerably within and between species 421
(Webb and Eyre 2004; Atkinson and Taylor 2005), with generally higher flow rates in suspension feeding species 422
(19.9 to 134.6 mL h-1
for deposit feeders; 5 to 900 mL h-1
for suspension feeders). The minimum value calculated 423
16
here for C. templemani is, not surprisingly, lower than most individual burrow flow rates measured for 424
thalassinidean shrimps; actual individual flow rates for C. templemani will need to be obtained in vivo to allow 425
better comparisons. As observed for thalassinidean species where direct measurements are available (Webb and 426
Eyre 2004; Atkinson and Taylor 2005), however, it is likely that C. templemani also contributes considerably to 427
enhancing both oxidized and reduced dissolved substance transport, compared to simple molecular diffusion and is 428
likely an important factor in sediment geochemical cycles in the Laurentian Trough. While bioturbational activities 429
by C. templemani affecting the physical and chemical properties of surrounding sediments are likely to affect the 430
distribution and abundance of benthic organisms on and within these sediments as observed for C. macandreae 431
(Widdicombe and Austen 2003), further studies are required to quantify the actual impact.432
17
Acknowledgements 433
434
This study was made possible through financial support for post-doctoral research to the first author (Département 435
d’océanographie, Université du Québec à Rimouski; Institut Maurice-Lamontagne, Fisheries and Oceans Canada, 436
Mont-Joli), financial and logistical support to N. Silverberg by the Institut Maurice-Lamontagne, and a research 437
grant (Programme d’actions structurantes, Université du Québec à Rimouski) to A. Mauviel. 438
We are grateful for the assistance received from the crew of the research vessel Fogo Isle; this project would not 439
have been possible without their hard work. We are very thankful for the support and/or constructive suggestions 440
provided by Bjorn Sundby, Deborah Steele, and Bernard Chenard, Richard Larocque, Denis Guay, and Steve 441
Trottier, to name only a few of the devoted staff of Institut Maurice-Lamontagne that contributed to the Benthocosm 442
Project and this study. 443
Finally, we gratefully acknowledge the many helpful comments and suggestions received from Drs. Eunice H. Pinn 444
and R. James A. Atkinson and two anonymous reviewers; the completion of this paper has benefited substantially 445
from their comments. 446
447
18
References 448
449
Aller RC, Dodge RE (1974) Animal-sediment relations in a tropical lagoon, Discovery Bay, Jamaica. J Mar Res 450
32:209-232 451
Anderson SJ, Atkinson RJA, Taylor AC (1991) Behaviour and respiratory adaptations of the mud-burrowing shrimp 452
Calocaris macandreae Bell (Thalassinidea: Crustacea) to the burrow environment. Ophelia 34:143-156 453
http://dx.doi.org/10.1080/00785326.1991.10429702 454
Astall CM, Taylor AC, Atkinson RJA (1997) Behavioural and physiological implications of a burrow-dwelling 455
lifestyle for two species of upogebiid mud-shrimp (Crustacea: Thalassinidea). Estuar Coast Shelf Sci 44:155-456
168 http://dx.doi.org/10.1006/ecss.1996.0207 457
Atkinson RJA, Chapman CJ (1984) Resin casting: a technique for investigating burrows in sublittoral sediments 458
Progr Underwater Sci 9:15-25 459
Atkinson RJA, Taylor AC (2005) Aspects of the physiology, biology and ecology of thalassinidean shrimps in 460
relation to their burrow environment. Oceanogr Mar Biol Annu Rev 43:173-210 461
Bell T (1846). A History of the British Stalk-eyed Crustacea, 1844-1853. John Van Voorst 1, Paternoster Row, 462
London 463
Buchanan JB (1963) The biology of Calocaris macandreae (Crustacea, Thalassinidea). J Mar Biol Assoc UK 464
43:729-747 http://dx.doi.org/10.1017/S0025315400025650 465
De Grave S, Pentcheff ND, Ahyong ST, Chan T-Y, Crandall KA, Dworschak PC, Felder DL, Feldmann RM, 466
Fransen CHJM, Goulding LYD, Lemaitre R, Low MEY, Martin JW, Ng PKL, Schweitzer CE, Tan SH, 467
Tshudy D, Wetzer R (2009) A classification of living and fossil genera of decapods crustaceans. Raffles Bull 468
Zool, Suppl 21:1-109 469
De Young D, Hay AE (1987) Density current flow in Fortune Bay, Newfoundland. J Phys Oceanogr 17:1066-1070 470
http://dx.doi.org/10.1175/1520-0485(1987)017<1066:DCFIFB>2.0.CO;2 471
Dworschak PC (1981) The pumping rates of the burrowing shrimp Upogebia pusilla (Petagna) (Decapoda: 472
Thalassinidea). J Exp Mar Biol Ecol 52:25-35 http://dx.doi.org/10.1016/0022-0981(81)90168-4 473
Dworschak PC (2000) Global diversity in the Thalassinidea (Decapoda). J Crustac Biol 20, special number 2:238-474
245 475
Dworschak PC, Koller H, Abed-Navandi D (2006) Burrow structure, burrowing and feeding behaviour of 476
Corallianassa longiventris and Pestarella tyrrhena (Crustacea, Thalassinidea, Callianassidae). Mar Biol 477
19
148:1369-1382 http://dx.doi.org/10.1007/s00227-005-0161-8 478
Griffis RB, Suchanek TH (1991) A model of burrow architecture and trophic modes in Thalassinidean shrimp 479
(Decapoda: Thalassinidea). Mar Ecol Prog Ser 79:171-183 DOI: 0171-8630/91/0079/0171 480
Ingle RW, Christiansen ME (2004) Lobsters, Mud Shrimps and Anomuran Crabs: Keys and Notes for Identification 481
of the Species. Synopses of the British Fauna, new series, No. 55 482
Kristensen E, Kostka JE (2005) Macrofaunal burrows and irrigation in marine sediment: microbiological and 483
biogeochemical interactions. In: Interactions between Macro- and Microorganisms in Marine Sediments. In: 484
Kristensen E, Kostka JE, Haese R (eds) American Geophysical Union, Washington, DC, pp 125-158 485
McLellan HJ (1957) On the distinctiveness and origin of the slope water off the Scotia Shelf and its easterly flow 486
south of the Grand Banks. J Fish Res Board Can 14:213-239 487
Meysman FJR, Middelburg JJ, Heip CHR (2006) Bioturbation: a fresh look at Darwin’s last idea. Trends Ecol Evol 488
21:688-695 http://dx.doi.org/10.1016/j.tree.2006.08.002 489
Nash RDM, Chapman CJ, Atkinson RJA, Morgan PJ (1984) Observations on the burrows and burrowing behaviour 490
of Calocaris macandreae (Crustacea: Decapoda: Thalassinidea). J Zool 202:425-439 491
http://dx.doi.org/10.1111/j.1469-7998.1984.tb05093.x 492
Ott JA, Fuchs B, Fuchs R, Malasek A (1976) Observations on the biology of Callianassa stebbingi Borrodaille and 493
Upogebia litoralis Risso and their effect upon the sediment. Senckenberg Marit 8:61-79 494
Papaspyrou S, Gregersen T, Cox RP, Thessalou-Legaki M, Kristensen E (2005) Sediment properties and bacterial 495
community in burrows of the ghost shrimp Pestarella tyrrhena (Decapoda: Thalassinidea). Aquatic Microbial 496
Ecol 38:181-190 http://dx.doi.org/10.3354/ame038181 497
Pinn EH, Atkinson RJA (2010) Burrow development, nutrient fluxes, carnivory and caching behaviour by Calocaris 498
macandreae (Crustacea : Decapoda : Thalassinidea ). J Mar Biol Assoc UK 90(2):247-253 499
http://dx.doi.org/10.1017/S002531540999066X 500
Pinn EH, Robertson MR (1998) The effect of bioturbation on RoxAnn, a remote acoustic seabed discrimination 501
system. J Mar Biol Assoc UK 78:707-715 http://dx.doi.org/10.1017/S0025315400044726 502
Pinn EH, Atkinson RJA, Rogerson A (1998) The diet of two mud-shrimps, Calocaris macandreae and Upogebia 503
stellata (Crustacea, Decapoda, Thalassinidea). Ophelia 48(3):211-223 504
http://dx.doi.org/10.1080/00785236.1998.10426967 505
Posey MH (1986) Changes in a benthic community associated with dense beds of a burrowing deposit-feeder, 506
Callianassa californensis. Mar Ecol Prog Ser 31:15-22 DOI: 0171-8630/86/0031/0015 507
20
Robles R, Tudge CC, Dworschak PC, Poore GCB, Felder DL (2009) Molecular phylogeny of the Thalassinidea 508
based on nuclear and mitochondrial genes.. In: Martin JW, Crandall KA, Felder DL (eds) Decapod 509
Crustacean Phylogenetics. CRC Press, Taylor & Francis Group, Boca Raton, Florida, pp 309-326 510
Rowden AA, Jones MB (1993) Critical evaluation of sediment turnover estimates for Callianassidae (Decapoda: 511
Thalassinidea). J Exp Mar Biol Ecol 173:265-272 http://dx.doi.org/10.1016/0022-0981(93)90057-U 512
Rowden AA, Jones MB, Morris AW (1998) The role of Callianassa subterranea (Montagu) (Thalassinidea) in 513
sediment resuspension in the North Sea. Cont Shelf Res 18:1365-1380 http://dx.doi.org/10.1016/S0278-514
4343(98)00048-X 515
Shinn EA (1968) Burrowing in recent lime sediments of Florida and Bahamas. J Paleontol 42:879-894 516
Silverberg N, Gagnon J-M, Lee K (1995) A benthic mesocosm facility for maintaining soft-bottom sediments. Neth 517
J Sea Res 34:289-302 http://dx.doi.org/10.1016/0077-7579(95)90039-X 518
Squires HJ (1965) A new species of Calocaris (Crustacea: Decapoda, Thalassinidea) from the Northwest Atlantic. J 519
Fish Res Board Can 22:1-11 520
Squires HJ (1990) Decapod Crustacea of the Atlantic Coast of Canada. Can Bull Fish Aquat Sci 221:338-342 521
Stamhuis E, Reede-Dekker T, Etten Y van, Wiljes JJ de, Videler JJ (1996) Behaviour and time allocation of the 522
burrowing shrimp Callianassa subterranea (Decapoda, Thalassinidea). J Exp Mar Biol Ecol 204:225-239 523
http://dx.doi.org/10.1016/0022-0981(96)02587-7 524
Suchanek TH (1983) Control of seagrass communities and sediment distribution by Callianassa (Crustacea, 525
Thalassinidea) bioturbation. J Mar Res 41:281-298 http://dx.doi.org/10.1357/002224083788520216 526
Torres JJ, Gluck DL, Childress JJ (1977) Activities and physiological significant of the pleopods in the respiration 527
of Callianassa califoniensis (Dana) (Crustacea: Thalassinidea). Biol Bull 152:134-146 528
Vaugelas, J de (1985) Sediment reworking by Callianassid mud-shrimp in tropical lagoons: a review with 529
perspectives. In: C. Gabrie C, Harmelin M (assoc eds) Proceedings of the Fifth International Coral Reef 530
Congress, Tahiti, Vol. 6: Miscellaneous Paper (B), pp 617-622 531
Webb AP, Eyre BD (2004) Effect of natural populations of burrowing thalassinidean shrimp on sediment irrigation, 532
benthic metabolism nutrient fluxes and denitrification. Mar Ecol Prog Ser 268:205-220 533
http://dx.doi.org/10.3354/meps268205 534
Widdicombe S, Austen MC (2003) The effect of bioturbation by the burrowing shrimp Calocaris macandreae on a 535
subtidal macrobenthic community: further evidence for the importance of function over identity. Vie Milieu 536
35:163-169 537
21
Williams A (1984) Shrimps, lobsters, and crabs of the Atlantic coast of the Eastern United States, Maine to Florida. 538
Smithsonian Institute Press, Washington, D. C. 539
22
List of Figures 540
541
Fig. 1 Photograph of the burrowing shrimp, Calocaris templemani, freshly collected in the St. Lawrence Estuary 542
with shrimp otter trawl. Picture courtesy of CaRMS (Canadian Register of Marine Species) Photogallery / 543
Nozères, Claude 2013 544
Fig. 2 Collection sites of Calocaris templemani in the St. Lawrence Trough, from this study (Station 23 and 545
southern Newfoundland bays) and Squires (1965) 546
Fig. 3 In situ bottom photograph of the 350 m community, in the St. Lawrence Estuary (Station 23). Openings to a 547
burrow of Calocaris templemani are visible in the center of the image, with a sea pen (Pennatula aculeata) at 548
proximity and numerous brittlestars (Ophiura sarsi) on the sediment surface 549
Fig. 4 Frequency of complete and incomplete burrows in relation to the number of surface openings 550
Fig. 5 Schematic representation of the evolution of a Calocaris templemani burrow from the Laurentian Trough, 551
based on observations of burrow #7, from a) the initial 2-opening burrow; b) 4-opening burrow, c) 7-opening 552
burrow, d) full size, 9-opening burrow with deep by-pass gallery, and e) 7-opening burrow after 2 openings 553
have collapsed 554
Fig. 6 Relationship between mean burrow opening diameter (± standard deviation) and the number of openings for 555
complete burrows observed in bottom photographs from Station 23 556
Fig. 7 Estimated logn-linear relationship between total volume of burrow and number of sediment surface opening 557
for burrow casts obtained from the mesocosms 558
Fig. 8 Proportion of time spent during the day by Calocaris templemani on various activities in the burrow while in 559
sight, based on 21-day averages of observations for one individual in the aquarium 560
!"#$%&'(')*+$&'*,-.#%/$012
!"#$%&'()(&*+&,+-."+/,&'#0'&)(1+"2*#+./0(
!"#$%&'(
!ff (j Hermitag
Channel & Bay ~ o
Fo ne Bay
!"#$%&'(
!"#$%&'()(&*+&,+-."+/,&'#0'&)(1+"2*#+./0(
0
0.2
0.4
0.6
0.8
1 2 3 4 5 6 7
Nu
mb
er
of b
urr
ow
s m
- ²
Number of openings per burrow
incomplete burrows
complete burrows
1.27 complete burrows m-²
0.88 incomplete burrows m-²
!"#$%&'(
!"#$%&'(
A
B
7
c
2
2
2
10 cm
!"#$%&'(
~
~ 16 +1
E E '-'"
s..... ID Q) 12 E ro
"'C O) C .-C ID 8 Cl. O c ro ID ~
4 1 23456 7
Number of openings per complete burrow
!"#$%&'(')%&*"+&,-
600 ~----------------------------------------~
~ 400 O ~ ~
::::J ..c ~
O
ID 200 E ::::J
~
•
•
• •
•
• •
y = 335.1 In(x) - 285.34 R2 = 0.524
o ~----~----~----~----~----~----~----~ 3 4 567 8 9 10
Number of openings
�
��
��
��
��
���
� � � � � �� �� �� �� �� �� ��
����� �������
����������
��������
����������������
� ������� ������
�������� � �
����� �
��! ������� ���"����������� ���
!"#$%&'(')%&*"+&,-
1
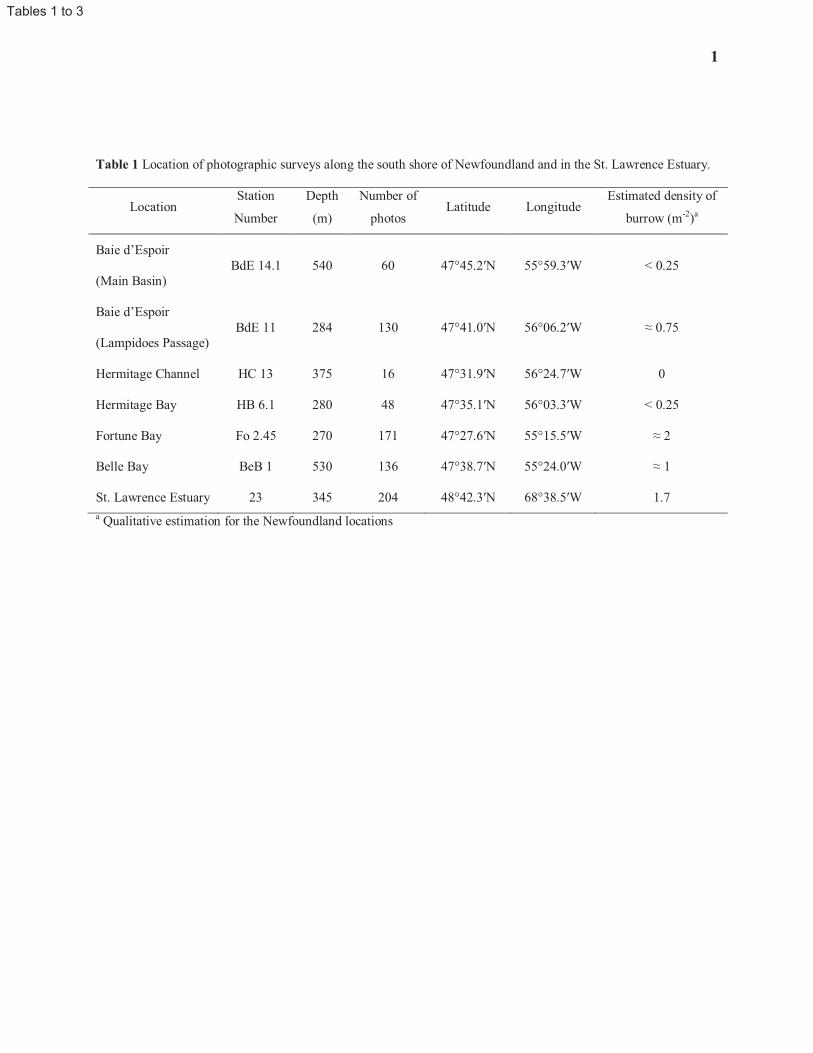
Table 1 Location of photographic surveys along the south shore of Newfoundland and in the St. Lawrence Estuary.
Location Station
Number
Depth
(m)
Number of
photos Latitude Longitude
Estimated density of
burrow (m-2)a
Baie d’Espoir
(Main Basin)
BdE 14.1 540 60 47°45.2′N 55°59.3′W < 0.25
Baie d’Espoir
(Lampidoes Passage)
BdE 11 284 130 47°41.0′N 56°06.2′W ≈ 0.75
Hermitage Channel HC 13 375 16 47°31.9′N 56°24.7′W 0
Hermitage Bay HB 6.1 280 48 47°35.1′N 56°03.3′W < 0.25
Fortune Bay Fo 2.45 270 171 47°27.6′N 55°15.5′W ≈ 2
Belle Bay BeB 1 530 136 47°38.7′N 55°24.0′W ≈ 1
St. Lawrence Estuary 23 345 204 48°42.3′N 68°38.5′W 1.7
a Qualitative estimation for the Newfoundland locations
!"#$%&'(')*'+
2
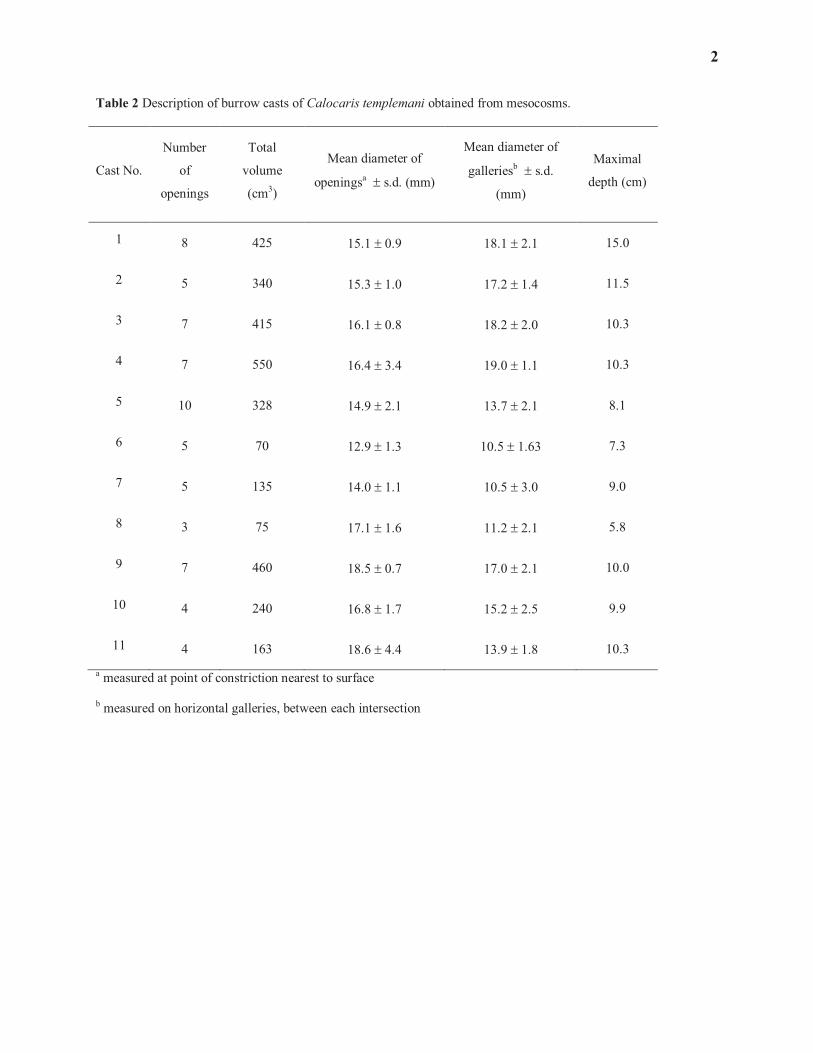
Table 2 Description of burrow casts of Calocaris templemani obtained from mesocosms.
Cast No.
Number
of
openings
Total
volume
(cm3)
Mean diameter of
openingsa ± s.d. (mm)
Mean diameter of
galleriesb ± s.d.
(mm)
Maximal
depth (cm)
1 8 425 15.1 ± 0.9 18.1 ± 2.1 15.0
2 5 340 15.3 ± 1.0 17.2 ± 1.4 11.5
3 7 415 16.1 ± 0.8 18.2 ± 2.0 10.3
4 7 550 16.4 ± 3.4 19.0 ± 1.1 10.3
5 10 328 14.9 ± 2.1 13.7 ± 2.1 8.1
6 5 70 12.9 ± 1.3 10.5 ± 1.63 7.3
7 5 135 14.0 ± 1.1 10.5 ± 3.0 9.0
8 3 75 17.1 ± 1.6 11.2 ± 2.1 5.8
9 7 460 18.5 ± 0.7 17.0 ± 2.1 10.0
10 4 240 16.8 ± 1.7 15.2 ± 2.5 9.9
11 4 163 18.6 ± 4.4 13.9 ± 1.8 10.3
a measured at point of constriction nearest to surface
b measured on horizontal galleries, between each intersection
3
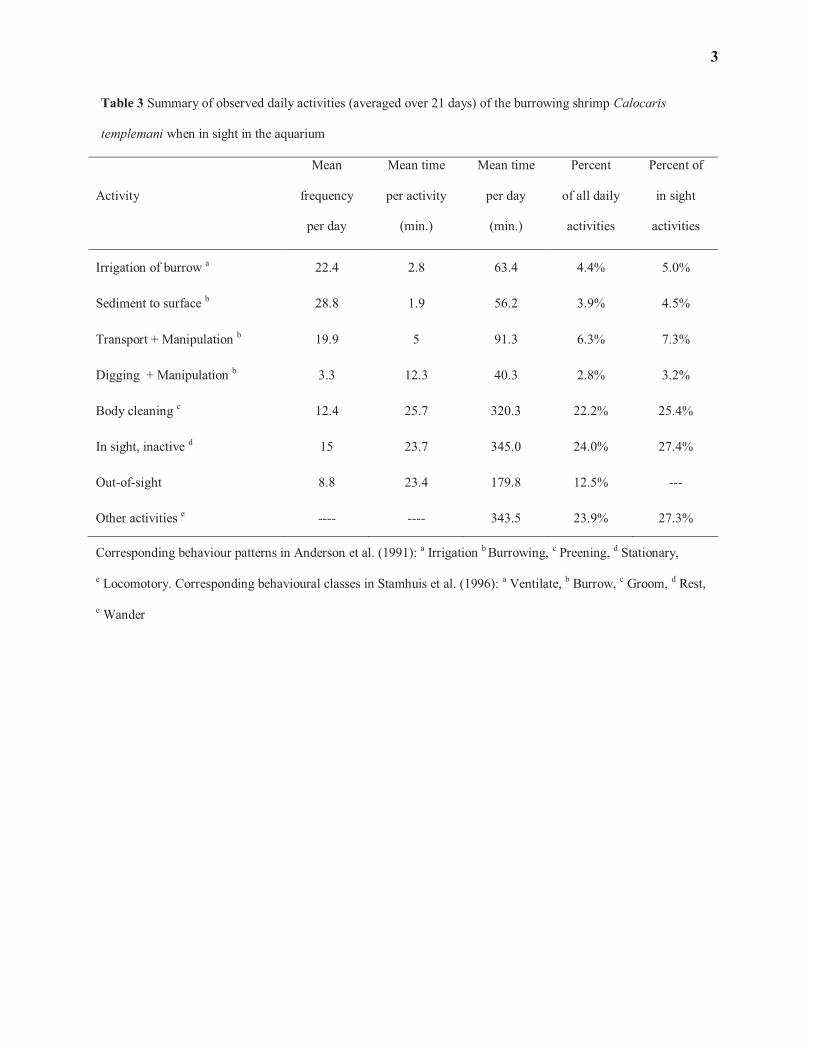
Table 3 Summary of observed daily activities (averaged over 21 days) of the burrowing shrimp Calocaris
templemani when in sight in the aquarium
Activity
Mean
frequency
per day
Mean time
per activity
(min.)
Mean time
per day
(min.)
Percent
of all daily
activities
Percent of
in sight
activities
Irrigation of burrow a 22.4 2.8 63.4 4.4% 5.0%
Sediment to surface b 28.8 1.9 56.2 3.9% 4.5%
Transport + Manipulation b 19.9 5 91.3 6.3% 7.3%
Digging + Manipulation b 3.3 12.3 40.3 2.8% 3.2%
Body cleaning c 12.4 25.7 320.3 22.2% 25.4%
In sight, inactive d 15 23.7 345.0 24.0% 27.4%
Out-of-sight 8.8 23.4 179.8 12.5% ---
Other activities e ---- ---- 343.5 23.9% 27.3%
Corresponding behaviour patterns in Anderson et al. (1991): a Irrigation b Burrowing, c Preening, d Stationary,
e Locomotory. Corresponding behavioural classes in Stamhuis et al. (1996): a Ventilate, b Burrow, c Groom, d Rest,
e Wander
Related Documents