Report No. MG_REP_EIA_026 March 2009 SCOUR AND ITS IMPACT ON WATER QUALITY MERSEY GATEWAY PROJECT

Welcome message from author
This document is posted to help you gain knowledge. Please leave a comment to let me know what you think about it! Share it to your friends and learn new things together.
Transcript

Report No. MG_REP_EIA_026 March 2009
SCOUR AND ITS IMPACT ON WATER QUALITY
MERSEY GATEWAY PROJECT
Mersey Gateway Project Gifford Scour and Its Impact on Water Quality Page i MG_REP_EIA_026
MERSEY GATEWAY PROJECT
SCOUR AND ITS IMPACT ON WATER QUALITY
C O N T E N T S
Page
1. INTRODUCTION................................................................................................................. 1
2. SCOUR ACTION ................................................................................................................ 1
3. CONSTRUCTION SEQUENCE.......................................................................................... 2
4. SCOUR PIT DIMENSIONS................................................................................................. 3
5. BED MATERIAL ................................................................................................................. 7
6. TIDAL INFLUENCE............................................................................................................ 9
7. TIDAL VOLUME ............................................................................................................... 10
8. MOVEMENT OF MATERIALS IN THE STUDY AREA.................................................... 10
9. SUSPENDED SOLID CONCENTRATIONS DURING TIDAL CYCLE ............................ 10
10. SUSPENDED SOLIDS INCREASE.................................................................................. 11
11. SEDIMENT DISPERSION MODELLING.......................................................................... 11
12. CONCLUDING COMMENTS............................................................................................ 19
13. REFERENCES.................................................................................................................. 20

Mersey Gateway Project Gifford Scour and Its Impact on Water Quality Page 1 MG_REP_EIA_026
1. INTRODUCTION
1.0.1 The purpose of this report is to provide an estimate of the quantity of the bed material that will be re-suspended through scour action resulting from the construction of the Mersey Gateway Bridge.
1.0.2 The report relies on the following:
i. There are three towers to be constructed in the estuary between the existing saltmarshes.
ii. Each tower is 10m in diameter and will be constructed inside a temporary cofferdam of 30m diameter.
iii. It is possible that the contractor will use a temporary jetty to gain access to the tower locations. It is assumed that this jetty will be formed of 500mm diameter piles 5m apart and at a distance of 12m between each pair of piles. These will form the support structure for the decking of the temporary jetty.
2. SCOUR ACTION
2.0.1 Scouring is the erosion of bed material from around the base of marine structures, induced by the action of waves and tidal currents.
2.0.2 In the Study Area wave action is fetch limited and tidal action is the most dominant process. This limits the amplitude of any waves that are propagated. Given these limitations, it is therefore unlikely that this process would have anything other than a transitory effect on the extent or depth of the scour pits formed by tidal action. As such scour induced by wave action is not considered further.
2.0.3 The shape and size of the structure and its orientation to the direction of flow will influence the shape of the scour pit formed. Given the changing patterns of flow within the Study Area and the formation and movement of the tidal channels, it is sensible to have selected a circular plan form for all of the structures. This shape presents the same obstacle to flow no matter from which direction it comes.
2.0.4 Bed shear stresses change as tidal velocities change and so some bed material is always being eroded and deposited during the tidal cycle. Placing a structure into the estuary has the effect of amplifying the ambient bed shear stresses that would otherwise exist had the structure not been present. As the bed shear stress increases and the ‘threshold of motion’ for the particular bed material are exceeded, sediment will be liberated from the bed and the scour pit will start to form.
2.0.5 The process of scour continues at the base of the structures until a pseudo equilibrium state is reached where the forces inducing erosion during part of the tide are balanced later in the tide by reduced velocities and subsequent deposition of suspended material. Once fully developed, the scour pit therefore remains reasonably constant in volume, depth and spatial extent.
2.0.6 The differences in the scour pit that do occur will be related to the gradual changes in current velocities, and thus bed shear stresses, as the tidal cycle moves from spring to neap tides. Other changes may be induced by occasional perturbations to this process caused by tidal surges, fluvial or storm events. The magnitude of the change in velocity that occurs is very small compared with the magnitude of the velocity changes that occur over a single tide. Thus, the effects on the scour pit volume and shape are also very small.

Mersey Gateway Project Gifford Scour and Its Impact on Water Quality Page 2 MG_REP_EIA_026
2.0.7 As the structures are in a tidal stream, scour action occurs at the structure on both the flood and the ebb tide. The outcome is a scour pit that is conical in shape, elongated upstream and downstream in those parts of the Study Area where there is a pronounced channel or direction for tidal currents.
3. CONSTRUCTION SEQUENCE
3.0.1 Given the size of the cofferdams and the practical difficulties of installing these in the estuary, it is assumed that the contractor will only mobilise sufficient equipment to install the cofferdams in sequence i.e. there would only be one cofferdam being installed at a time.
3.0.2 Based on previous experience of such installations, rapid progress for the installation of the cofferdam would amount to circa 6m of the circumference per day. On this basis, the cofferdam would take approximately 15 days to complete.
3.0.3 With an allowance for moving the rigs and re-establishing at each location, it is estimated that it would take a minimum of 60 days to form the three cofferdams.
3.0.4 It is assumed that the jetty would have been constructed in advance of the cofferdams. This provides the access for the installation of the cofferdams.
3.0.5 If this were not the case then a length of the jetty, perhaps 120m in length, could be being installed at the same time as one of the cofferdams. This would involve the driving of 22 piles of 500mm diameter, each of which would produce a scoured depression from the action of the tides. The rate of driving these piles is however likely to be related to the speed with which the jetty can then be formed on the piles. Based on this, it is estimated that a rate of 10 piles per day or perhaps 6 per tide would be a maximum.
3.0.6 In terms of scour, the formation of the scour pit will be developed over a number of tides. The duration of this process depends on the type of bed material and its degree of compaction. Given the nature of the sands in the Study Area, scour action is expected to be rapid. However this also relates to the obstacle to flow that the structure presents. For the pile supports for the jetty (500mm diameter piles), the scour pit is likely to form within two or three tides. For the cofferdam, however, it takes 15 days or so for the installation to be completed and so the scour pit will be developing and adjusting through out this period and for several days beyond.
3.0.7 For the purposes of this assessment, a conservative approach (worst case) has been adopted in which it is assumed that the scour pit at the cofferdam will have become fully developed in a 10 day period i.e. 2/3 the construction time of a cofferdam. If, as expected, the formation of each cofferdam takes longer, then the amount of scoured material released into the water column on each tide will be less and the formation of the fully developed scour pit will take longer.
3.0.8 On completion of the construction of the towers, the cofferdam will be removed. This will involve extracting the sheet piles, gradually exposing the permanent structure to tidal flows. During this process, the scour pit formed by the cofferdam will infill and the scour pit associated with the tower will gradually develop. There will be disturbance of bed material during this process. However, as the scour pit of the permanent structure is much smaller than that of the cofferdam, the net process is one of infilling and any temporary increase in suspended solids in the water column during this period should be less than those concentrations that will occur during installation of the cofferdams.

Mersey Gateway Project Gifford Scour and Its Impact on Water Quality Page 3 MG_REP_EIA_026
4. SCOUR PIT DIMENSIONS
Jetty piles
4.0.1 The scour pit formed at each jetty pile is a small conical depression (see Photo 1). The image was taken during the jack-up barge site investigation of the estuary and is a good indication of the size and extent of scour from a pile of a similar dimension to that of the jetty. Based on this a scour pit width of 3D to each side of the leg and 1.5D deep would be a reasonable estimate of the scour pit dimensions. For a 500mm diameter pile this equates to a scour pit volume of 1.8m3. Using this and the estimate of 6 piles during a single tide, a maximum release of sediment of 10.8m3 during a tide might occur. Given this relatively small quantity, it is not believed this would have any significant effect on water quality and will not be considered further.
Photograph 1 Scour to Jack-up Barge Leg, Mersey Estuary, November 2006
Cofferdam
4.0.2 Regarding the cofferdams, these will need to be in position for a long period and the scour pit will become fully developed. The cofferdams provide a much larger blockage in the estuary than will be the case with the permanent towers. This increases tidal velocities in the vicinity of the cofferdams and will thus increase bed shear stresses. Given that the cofferdams are much larger than the permanent bridge towers, it is the period when the cofferdams are present that the re-suspension of scoured material will impact most on water quality.

Mersey Gateway Project Gifford Scour and Its Impact on Water Quality Page 4 MG_REP_EIA_026
4.0.3 The cofferdam diameter is a much larger dimension than the maximum depth of water that the structure will experience during a high spring tide. The water depth at a high spring tide is unlikely to exceed 6m which gives a D/H ratio of 5, i.e. it is a large structure compared with the depth of the water and the scour process is different to that which would occur around a slender structure such as a pile.
4.0.4 UCL considered this in their work1 on the physical modelling of the estuary and proposed bridge. Using the Breusers2 formula (this was derived from measurements of scour depth in tidal estuaries) they estimated a maximum scour depth of 4.2m for the flood tidal velocities and 3.2m for the ebb. The laboratory flume work indicated a range of scour depths and showed that these were influenced by the depth of water to cylinder diameter ratio. The lowest water depth was 50mm or 1/3 of the cylinder diameter. This would equate to a depth of water of 10m in the estuary which is significantly greater than that which will occur. For the 50mm depth of water the scour depth to cylinder diameter ratio was 0.26 or equivalent to 7.8m for the 30m diameter cofferdam. This is higher than will occur in practice and so the 0.26 ratio is high. Given the limitation of the laboratory model and the results derived from empirical formulae, the UCL report recommended, for use in design, a scour depth of 4.5 – 5m. A scour pit depth of 5m has been used in this assessment.
4.0.5 The width of the scour pit can be up to 3 – 4 times the width of the structure. For the cofferdam, this equates to a maximum of 120m.
ABPmer modelling
4.0.6 It is worth comparing these estimates with the hydrodynamic modelling work undertaken by ABPmer on the construction options for the bridge. They included the assumed method of construction i.e. an aligned jetty and 30m diameter cofferdams at each bridge tower location. The results of this work are presented in ABPmer Report R11803. The modelling includes both the hydrodynamic and morphological changes to the existing situation caused by the proposed form of construction.
4.0.7 The spatial extent of the predicted changes of morphology is less than that from the assumptions given in 4.0.4 and 4.0.5 above. The most noticeable changes occur in the vicinity of the northern tower, Tower 1. Here the model predicts the maximum erosion to be 1.4m with some accretion along the existing channel of 0.3m. The impacts on the southern channel are not as pronounced.
4.0.8 This modelling work cannot predict local scour since the detailed and complex flow patterns adjacent to any structures cannot be reproduced by such a model. However, the model does predict the wider spatial impacts of the structure as the estuary adjusts to the changes induced by the cofferdams. Given how limited the spatial impacts were from this modelling, it is reasonable to use the lower factor 3 from the range given in 4.0.5 for the estimated spatial extent of the scour pit.
Scour at existing Railway Bridge
4.0.9 In January 2007, a bathymetric survey was undertaken of the scour pits adjacent to the existing railway bridge piers in the Runcorn Gap. These piers are rectangular with shaped ends to improve flow characteristics and are set parallel to the direction of flow. They are approximately 25m by 9.5m in plan.

Mersey Gateway Project Gifford Scour and Its Impact on Water Quality Page 5 MG_REP_EIA_026
4.0.10 The spatial extent of the scour pits to the sides of the piers were in the range 1.89D to 2.6D. The pits extended between 2.4D and 3.9D from the front of each pier. The maximum depth was from -3.55m to +0.99m i.e. a maximum depth of 4.54m.
4.0.11 It is possible that scour may be limited in depth by encountering bedrock. However, since the spatial extent is not excessive, any limitation from this cause is likely to be marginal. The scour pits do demonstrate the ease with which the bed material in the estuary will erode and also provides a useful guide to the processes that will occur with the cofferdams and the subsequent permanent structure.
4.0.12 However, it should be recognised that, at this location, the bed shear stresses induced by tidal currents are far higher than will be produced at any of the proposed tower locations, even with the cofferdams in place.
Basis of the Assessment
4.0.13 Based on the above and for the purpose of the estimation of scour volume, a dimension of 90m i.e. 3D, from centre of the cofferdam was used to define the scour pit in the south-west to north-east direction (the main direction of flow in the estuary) and 45m (1.5D) from the centre of the cofferdam in the north-west to south east direction. These dimensions define the ellipse of the scoured zone (see Figure 1). The maximum depth of the scour pit was set at 5m at the edge of the cofferdam.
4.0.14 For simplicity an elliptical truncated cone shape was assumed for calculation purposes. Using this approach, the fully developed scour pit for a cofferdam would be approximately 21,200m3 in volume. Based on the estimates and assumption given in Section 3 above, this will develop over a 10 day period i.e. 20 tides or approximately 1060m 3 per tide.
4.0.15 This approach is expected to provide a conservative (over-estimate) of the volume of sediment scoured which is appropriate for considering a worst case scenario of releases of bed material into the water column.

Mersey Gateway Project Gifford Scour and Its Impact on Water Quality Page 6 MG_REP_EIA_026
Mersey Gateway Project Gifford Scour and Its Impact on Water Quality Page 7 MG_REP_EIA_026
5. BED MATERIAL
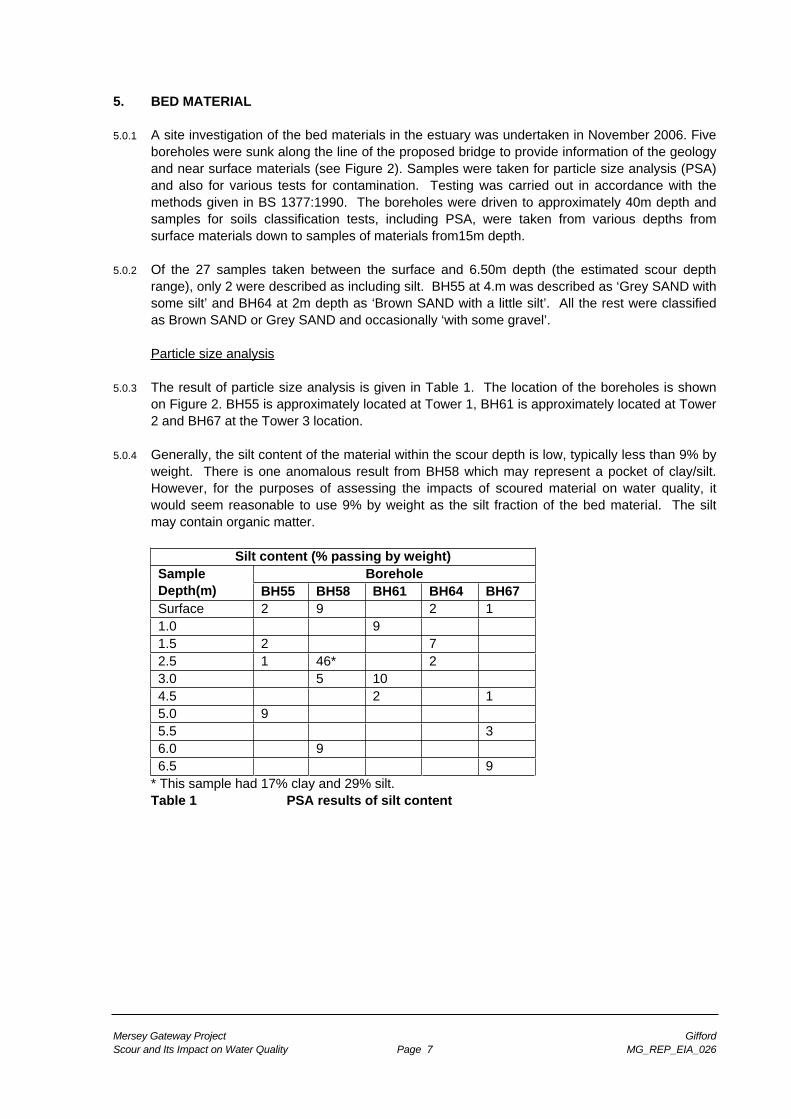
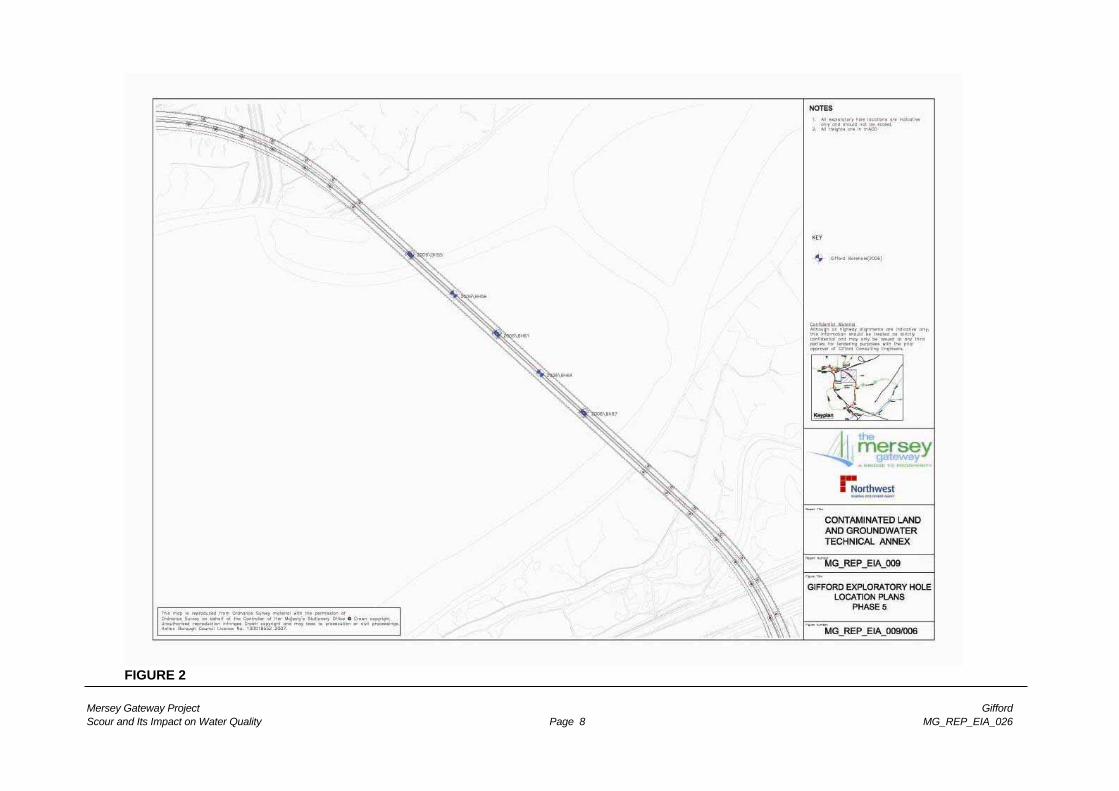
5.0.1 A site investigation of the bed materials in the estuary was undertaken in November 2006. Five boreholes were sunk along the line of the proposed bridge to provide information of the geology and near surface materials (see Figure 2). Samples were taken for particle size analysis (PSA) and also for various tests for contamination. Testing was carried out in accordance with the methods given in BS 1377:1990. The boreholes were driven to approximately 40m depth and samples for soils classification tests, including PSA, were taken from various depths from surface materials down to samples of materials from15m depth.
5.0.2 Of the 27 samples taken between the surface and 6.50m depth (the estimated scour depth range), only 2 were described as including silt. BH55 at 4.m was described as ‘Grey SAND with some silt’ and BH64 at 2m depth as ‘Brown SAND with a little silt’. All the rest were classified as Brown SAND or Grey SAND and occasionally ‘with some gravel’.
Particle size analysis
5.0.3 The result of particle size analysis is given in Table 1. The location of the boreholes is shown on Figure 2. BH55 is approximately located at Tower 1, BH61 is approximately located at Tower 2 and BH67 at the Tower 3 location.
5.0.4 Generally, the silt content of the material within the scour depth is low, typically less than 9% by weight. There is one anomalous result from BH58 which may represent a pocket of clay/silt. However, for the purposes of assessing the impacts of scoured material on water quality, it would seem reasonable to use 9% by weight as the silt fraction of the bed material. The silt may contain organic matter.
Silt content (% passing by weight) BoreholeSample
Depth(m) BH55 BH58 BH61 BH64 BH67 Surface 2 9 2 1 1.0 9 1.5 2 7 2.5 1 46* 2 3.0 5 10 4.5 2 1 5.0 9 5.5 3 6.0 9 6.5 9
* This sample had 17% clay and 29% silt. Table 1 PSA results of silt content
Mersey Gateway Project Gifford Scour and Its Impact on Water Quality Page 8 MG_REP_EIA_026
FIGURE 2

Mersey Gateway Project Gifford Scour and Its Impact on Water Quality Page 9 MG_REP_EIA_026
5.0.5 Total Organic Carbon (TOC) tests were completed on a number of bed material samples. The maximum TOC from the samples taken in the scour depth range (surface to 6.5m depth) is 4% by weight. Thus in a worst case, approximately half of the silt fraction could be organic material.
5.0.6 Taking the dry density of sand as 1600 kg m-3, the silt content equates to approximately 144kg per m3 of scoured material. Using the maximum TOC value of 4% suggests that the silt may contain approximately 64kg m-3 of organic material.
5.0.7 Thus the 1060m3 of material estimated to be released each tide until the scour pit is fully formed could contain 152,640kg of silt, of which 67,840kg may be organic material.
6. TIDAL INFLUENCE
6.0.1 The greatest erosion potential occurs when bed shear stresses are above the ‘threshold of motion’ and at their maximum. However, the period in each tide when the ‘threshold of motion’ is not exceeded is barely 20 minutes (see Figure 3). This explains why the morphology of the Study Area is so dynamic and why channel movement occurs with large volumes of material eroded and deposited on each tide.
6.0.2 In order to assess the impact of scoured material on water quality through a change in sediment load, then it would seem reasonable to assume that this material is eroded over a 12 hour period.
Figure 3 – Bed shear stress variations and the ‘threshold of motion’ [grey zone] for a neap tide

Mersey Gateway Project Gifford Scour and Its Impact on Water Quality Page 10 MG_REP_EIA_026
7. TIDAL VOLUME
7.0.1 Various topographic surveys have been completed from which an estimate of the estuary volume in the Study Area was made. This is the volume derived from the difference between the measured bathymetry and Mean High Water Spring tide level.
7.0.2 For the purposes of this assessment, an average volume of 5,000,000m3 has been used.
8. MOVEMENT OF MATERIALS IN THE STUDY AREA
8.0.1 The estuary in the Study Area is highly mobile. Figure 3 shows that for virtually the whole of the tidal cycle, bed shear stresses are substantially above the ‘threshold of motion’ of the bed material. In effect the bed surface is continually being eroded. Depressions form and velocities adjust as the tidal depth changes locally. As a consequence, in some locations deposition of suspended material will take place. This process of morphological change will continue throughout the tidal cycle.
8.0.2 The degree of change will be influenced by the particular tide i.e. spring or neaps, the strength of that tide and any tidal surges that may be influencing the particular tide. It is possible that on occasion, high fluvial flows from the River Mersey may also affect the degree of morphological change observed.
8.0.3 The volume of the estuary in the Study Area is not fixed. There is evidence from historic charts of significant changes in the number, location and size of the low water channels in the area. The extent of the saltmarshes is also changing.
8.0.4 A series of bathymetric surveys of the Study Area were completed to provide additional baseline data for the hydrodynamic modelling used in the assessment of hydrodynamic impacts of the proposed bridge. Of particular relevance to this report is the result of two surveys completed in 2006. These were repeat surveys approximately six weeks apart in March and April of that year. The difference in tidal volume (to MHWS) was 395,000m3 between the two surveys.
8.0.5 A significant change such as this equates to an average material movement in this period of approximately 4,700m3 per tide. Clearly these changes will not be ‘average’ events and so it is not unreasonable to anticipate some tides producing movement of 20% more than the average i.e. 5640m3.
9. SUSPENDED SOLID CONCENTRATIONS DURING TIDAL CYCLE
9.0.1 Using the fact that material is eroded through most of the tidal cycle in the Study Area, it is possible to estimate the average suspended solids concentration during this period. Using the figure of 5640m3 from 8.0.5 above, the average suspended solids concentration during this tide would be 1805mg l-1.
9.0.2 It is useful to compare this estimate with results from other estuaries. In a detailed field study of the Severn Estuary, R Kirby (April 2008) of Ravensrodd Consultants4 reported on early data from the 1970’s and recent survey data from the period 1990 – 2001. In this work, silt suspended solids concentrations of in excess of 2.5g l-1 were recorded i.e. greater than 2500 mg l-1.

Mersey Gateway Project Gifford Scour and Its Impact on Water Quality Page 11 MG_REP_EIA_026
9.0.3 A more recent paper of the Mersey provides more evidence. Andrew Lane in his paper5
‘Bathymetric evolution of the Mersey Estuary, UK, 1906-1997: causes and effects’, quotes suspended sediment concentrations in excess of 2000 mg l-1 and spring tidal fluxes (for the whole estuary) of the order of 200,000 t.
9.0.4 The estimate given in 9.0.1 is within the range that has been recorded in other estuaries and is similar to the figure for the Mersey given by Lane.
10. SUSPENDED SOLIDS INCREASE
10.0.1 Based on the assessment in this report, it is estimated that 1060m3 of bed material could be re-suspended during a single tide and this process would be continuous over the period i.e. covering both flood and ebb events. This would continue for a period of 10 days as the scour pit to the cofferdam forms and develops.
10.0.2 This volume of material (1060m3) is almost entirely sand. Based on the dry density given in 5.0.6, this means an increase in suspended load of 1,696,000kg over one tide. This equates to an average increase in suspended solids concentration in the water column in the study area of 339mg l-1.
10.0.3 Of this material, 9% by weight is silt which is approximately 152,640kg by weight. This means that 30mg l-1 of the 339mg l-1 increase in suspended solids concentration in the water column would be silt.
11. SEDIMENT DISPERSION MODELLING
11.0.1 In order consider the impacts on the morphology of the study area by the release of this material from scour action, ABPmer undertook further modelling of the dispersion of this material.
Model Set-up
11.0.2 Details of the model set-up designed to provide a ‘worst-case’ scenario are provided below:
Simultaneous release of sediment from all 3 cofferdams; Sand (150 m) and silt (26 m) fractions modelled separately; Sediment release distributed over bottom 10% of water depth; Release of sediment into ‘clear’ water (i.e. no background SSC in model); Constant release over 10-day period; and Model run continued for a further 5 days with no release.
11.0.3 It should be noted that in this modelling, the assumption was made that all three cofferdams would be constructed at the same time. This is extremely unlikely and so the results represent more severe conditions than have been assumed in the remainder of this report.
11.0.4 Similarly, the release of sediment into ‘clear’ water is a conservative approach since, as is evidenced by Figure 3, material movement into the water column occurs virtually throughout the tidal cycle.

Mersey Gateway Project Gifford Scour and Its Impact on Water Quality Page 12 MG_REP_EIA_026
Model Results
11.0.5 To assist with interpretation of the model outputs, time-series information at the five locations, identified in Figure 4, are presented in Figures 5 to 7. Figure 5 shows the variation in total Suspended Solids Concentration (SSC) and deposition whilst Figures 6 and 7 show the separate sand and silt components. Summary comments on the model results are provided below:
Silt concentrations up to 180mg/l are found near the cofferdam but reduce with distance upstream and downstream;
The silt ‘plume’ extends beyond Fiddler’s Ferry in the upstream direction and downstream of Runcorn Gap;
Concentrations of sand up to 1600mg/l are found near the cofferdams; There is a consistent accumulation of sediment (sand + silt) close to the cofferdams
(30mm) and in an area further upstream to the north-east (4mm); Elsewhere depths of accumulation are typically less than 1mm; SSC levels rapidly decay to background levels approximately 2 days after the sediment
release is stopped within the model; The net accumulation at the five sites identified ranges from 0.05mm to 30mm.
11.0.6 Figures 8 and 9 are reproduced show the spatial variation in SSC and depths of deposition within the Estuary at high water both during and after sediment release.
11.0.7 The results of the dispersion modelling provide evidence of the spatial extent of impacts from scour action at the cofferdams. The depth of deposition of up to 30mm predicted from this work needs to be set against the regular movement and deposition of material that occurs on each tide.

Mersey Gateway Project Gifford Scour and Its Impact on Water Quality Page 13 MG_REP_EIA_026
Figure 4. Location of Time-series Points (towers shown in purple)

Mersey Gateway Project Gifford Scour and Its Impact on Water Quality Page 14 MG_REP_EIA_026
Runcorn Gap
0
2040
6080
100120
140
30/12/2002 01/01/2003 03/01/2003 05/01/2003 07/01/2003 09/01/2003 11/01/2003 13/01/2003 15/01/2003 17/01/2003
SS
C (m
g/l)
0
0.10.2
0.30.4
0.50.6
0.7
Sed
imen
tatio
n (m
m)
Close to Release
0200400600800
10001200140016001800
30/12/2002 01/01/2003 03/01/2003 05/01/2003 07/01/2003 09/01/2003 11/01/2003 13/01/2003 15/01/2003 17/01/2003
SS
C (m
g/l)
0510152025303540
Sed
imen
tatio
n (m
m)
Build up Area
050
100150200250300350400
30/12/2002 01/01/2003 03/01/2003 05/01/2003 07/01/2003 09/01/2003 11/01/2003 13/01/2003 15/01/2003 17/01/2003
SS
C (m
g/l)
00.511.522.533.544.5
Sed
imen
tatio
n (m
m)
Manor Park
020406080
100120140160
30/12/2002 01/01/2003 03/01/2003 05/01/2003 07/01/2003 09/01/2003 11/01/2003 13/01/2003 15/01/2003 17/01/2003
SS
C (m
g/l)
0
0.05
0.1
0.15
0.2
0.25
Sed
imen
tatio
n (m
m)
Fiddler's Ferry
01020304050607080
30/12/2002 01/01/2003 03/01/2003 05/01/2003 07/01/2003 09/01/2003 11/01/2003 13/01/2003 15/01/2003 17/01/2003
SS
C (m
g/l)
0
0.01
0.02
0.03
0.04
0.05
0.06
0.07S
edim
enta
tion
(mm
)
Water Level
0
1
2
3
4
5
6
30/12/2002 01/01/2003 03/01/2003 05/01/2003 07/01/2003 09/01/2003 11/01/2003 13/01/2003
SS
C (m
g/l)
combined
Figure 5. Time-series data for combined sediments (sand + silt)

Mersey Gateway Project Gifford Scour and Its Impact on Water Quality Page 15 MG_REP_EIA_026
Runcorn Gap
0
5
10
15
20
25
30/12/2002 01/01/2003 03/01/2003 05/01/2003 07/01/2003 09/01/2003 11/01/2003 13/01/2003 15/01/2003 17/01/2003
SS
C (m
g/l)
00.020.040.060.080.10.120.140.160.18
Sed
imen
tatio
n (m
m)
Close to Release
0200400600800
10001200140016001800
30/12/2002 01/01/2003 03/01/2003 05/01/2003 07/01/2003 09/01/2003 11/01/2003 13/01/2003 15/01/2003 17/01/2003
SS
C (m
g/l)
0
5
10
15
20
25
30
35
Sed
imen
tatio
n (m
m)
Build up Area
050
100150200250300350400
30/12/2002 01/01/2003 03/01/2003 05/01/2003 07/01/2003 09/01/2003 11/01/2003 13/01/2003 15/01/2003 17/01/2003
SS
C (m
g/l)
00.511.522.533.54
Sed
imen
tatio
n (m
m)
Manor Park
01020304050607080
30/12/2002 01/01/2003 03/01/2003 05/01/2003 07/01/2003 09/01/2003 11/01/2003 13/01/2003 15/01/2003 17/01/2003
SS
C (m
g/l)
0
0.005
0.01
0.015
0.02
0.025
0.03
0.035
Sed
imen
tatio
n (m
m)
Fiddler's Ferry
0123456789
10
30/12/2002 01/01/2003 03/01/2003 05/01/2003 07/01/2003 09/01/2003 11/01/2003 13/01/2003 15/01/2003 17/01/2003
SS
C (m
g/l)
0
0.0002
0.0004
0.0006
0.0008
0.001
0.0012
Sed
imen
tatio
n (m
m)
Water Level
0
1
2
3
4
5
6
30/12/2002 01/01/2003 03/01/2003 05/01/2003 07/01/2003 09/01/2003 11/01/2003 13/01/2003
SS
C (m
g/l)
sand
Figure 6. Time-series data for sand sediment

Mersey Gateway Project Gifford Scour and Its Impact on Water Quality Page 16 MG_REP_EIA_026
Runcorn Gap
0
2040
6080
100120
140
30/12/2002 01/01/2003 03/01/2003 05/01/2003 07/01/2003 09/01/2003 11/01/2003 13/01/2003 15/01/2003 17/01/2003
SS
C (m
g/l)
0
0.1
0.2
0.3
0.4
0.5
0.6
Sed
imen
tatio
n (m
m)
Close to Release
020406080
100120140160180200
30/12/2002 01/01/2003 03/01/2003 05/01/2003 07/01/2003 09/01/2003 11/01/2003 13/01/2003 15/01/2003 17/01/2003
SS
C (m
g/l)
00.20.40.60.811.21.41.61.8
Sed
imen
tatio
n (m
m)
Build up Area
020406080
100120140160
30/12/2002 01/01/2003 03/01/2003 05/01/2003 07/01/2003 09/01/2003 11/01/2003 13/01/2003 15/01/2003 17/01/2003
SS
C (m
g/l)
00.10.20.30.40.50.60.70.80.91
Sed
imen
tatio
n (m
m)
Manor Park
0102030405060708090
100
30/12/2002 01/01/2003 03/01/2003 05/01/2003 07/01/2003 09/01/2003 11/01/2003 13/01/2003 15/01/2003 17/01/2003
SS
C (m
g/l)
0
0.05
0.1
0.15
0.2
0.25
Sed
imen
tatio
n (m
m)
Fiddler's Ferry
01020304050607080
30/12/2002 01/01/2003 03/01/2003 05/01/2003 07/01/2003 09/01/2003 11/01/2003 13/01/2003 15/01/2003 17/01/2003
SS
C (m
g/l)
0
0.01
0.02
0.03
0.04
0.05
0.06
0.07
Sed
imen
tatio
n (m
m)
Water Level
0
1
2
3
4
5
6
30/12/2002 01/01/2003 03/01/2003 05/01/2003 07/01/2003 09/01/2003 11/01/2003 13/01/2003
SS
C (m
g/l)
silt
Figure 7. Time-series data for silt sediment

Mersey Gateway Project Gifford Scour and Its Impact on Water Quality Page 17 MG_REP_EIA_026
Figure 8. Sediment (sand + silt) dispersion during scouring for construction phase

Mersey Gateway Project Gifford Scour and Its Impact on Water Quality Page 18 MG_REP_EIA_026
Figure 9. Sediment (sand + silt) dispersion after scouring for construction phase

Mersey Gateway Project Gifford Scour and Its Impact on Water Quality Page 19 MG_REP_EIA_026
12. CONCLUDING COMMENTS
12.0.1 There are a number of assumptions in this assessment which need to be recognised. It is not possible to distribute the re-suspended material instantly throughout the water column and the tidal volume. There will inevitably be high concentrations of suspended materials near the cofferdams but these will dissipate and disperse readily as the tidal currents move within the Study Area. These concentrations will also change significantly at different stages of the tide.
12.0.2 Much of the suspended material will redeposit as the tidal velocities decline and will be added to the morphological changes that are a feature of the Study Area. The hydrodynamic and morphological modelling completed by ABPmer supports the view that the distribution of the impacts of scour is limited.
12.0.3 Although a simple conical shape has been assumed for the scour pit shape to simplify calculation, it is more likely to have steeper side slopes and a reduced spatial extent, particularly given the nature of the bed material which consists almost entirely of sand.
12.0.4 As stated in Section 3, the construction sequence assumed relies on good progress to achieve the rate of installation indicated. Any delay would reduce the rate of formation of the scour pit and thus reduce the impact on suspended solids concentration in the water column. It would of course increase the duration of this activity.
12.0.5 The predicted increase in suspended solids concentration is approximately 25% of the figures quoted for suspended solids within the estuary. If this increase were to occur at a time of maximum suspended solids concentration, then the resulting concentration would still be within the figures quoted for the Severn Estuary.
12.0.6 It must also be recognised that the duration of this event would be limited to the construction phase for each cofferdam and the peak period for the formation of the scour pit, estimated to be a minimum of 10 days.

Mersey Gateway Project Gifford Scour and Its Impact on Water Quality Page 20 MG_REP_EIA_026
13. REFERENCES
1. University College London, (October 2007), ‘Physical Modelling Study’, UCL report GLPO 30817.
2. Breusers, H N C, Nicollet, G and Shen, H W (1977), ‘Local scour around cylindrical piers’, Journal of Hydraulics Research, IAHR, 15(3), 211-252.
3. ABPmer, (July 2005), ‘Phase II Modelling: Construction Options’, ABPmer Report R1180, Mersey Gateway project.
4. R Kirby, (2008), ‘The Fine Sediment regime of the Severn Estuary’. Severn Estuary Partnership. www.severnestuary.net/sep/pdfs/ecsa/19rkirby.pdf (accessed 9 February 2009)
5. Andrew Lane, (2003), ‘Bathymetric evolution of the Mersey Estuary, UK, 1906-1997: causes and effects’, Estuarine, Coastal and Shelf Science, Volume 59, Issue 2, February 2004, pages 249-263.
Related Documents