Merrimack Valley Workforce Investment Board Rafael Abislaiman, Executive Director MERRIMACK VALLEY WORKFORCE DEVELOPMENT AREA NORTHEAST REGION WIOA LOCAL PLAN FISCAL YEAR 2018

Welcome message from author
This document is posted to help you gain knowledge. Please leave a comment to let me know what you think about it! Share it to your friends and learn new things together.
Transcript
Merrimack Valley Workforce Investment Board
Rafael Abislaiman, Executive Director
MERRIMACK VALLEY WORKFORCE
DEVELOPMENT AREA
NORTHEAST REGION
WIOA LOCAL PLAN
FISCAL YEAR 2018
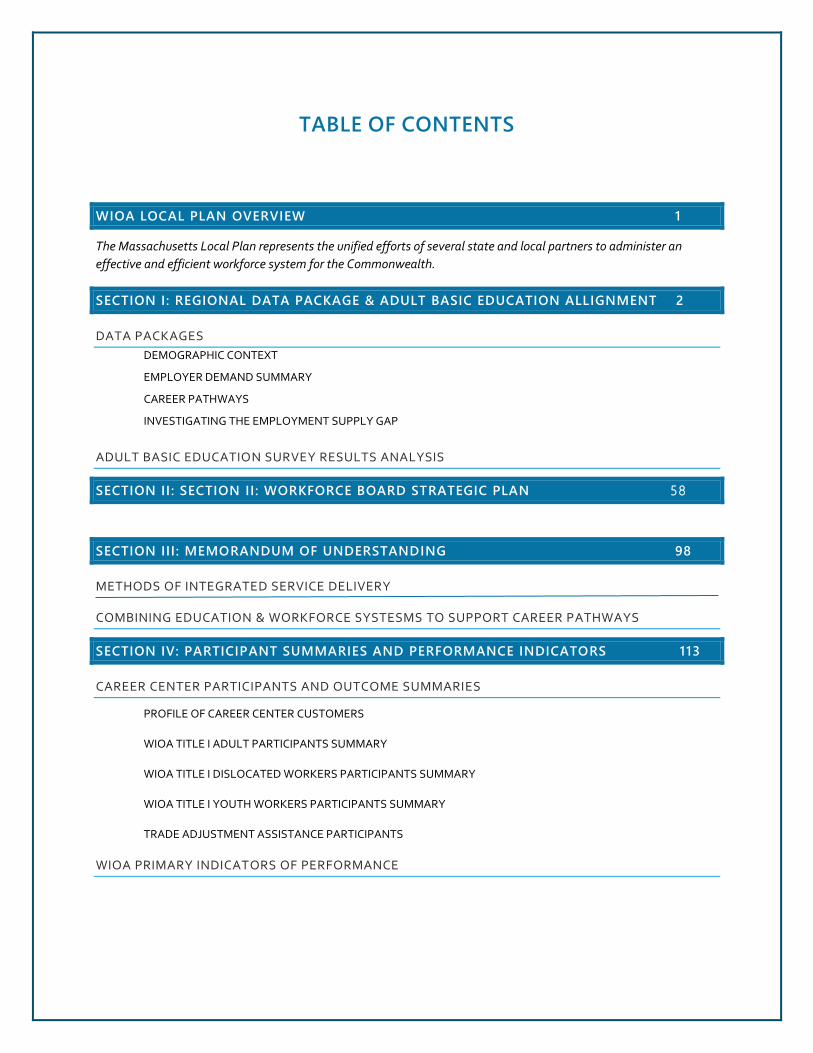
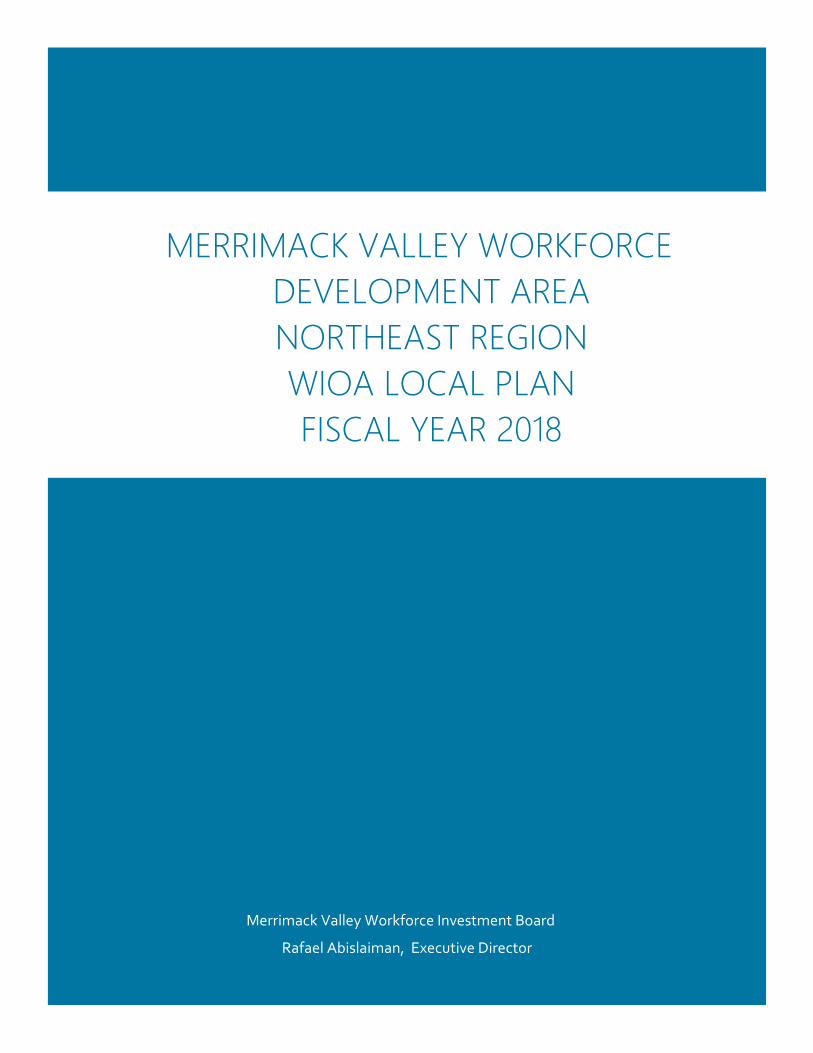
TABLE OF CONTENTS
WIOA LOCAL PLAN OVERVIEW 1
The Massachusetts Local Plan represents the unified efforts of several state and local partners to administer an
effective and efficient workforce system for the Commonwealth.
SECTION I: REGIONAL DATA PACKAGE & ADULT BASIC EDUCATION ALLIGNMENT 2
DATA PACKAGES
DEMOGRAPHIC CONTEXT
EMPLOYER DEMAND SUMMARY
CAREER PATHWAYS
INVESTIGATING THE EMPLOYMENT SUPPLY GAP
ADULT BASIC EDUCATION SURVEY RESULTS ANALYSIS
SECTION II: SECTION II: WORKFORCE BOARD STRATEGIC PLAN 58
SECTION III: MEMORANDUM OF UNDERSTANDING 98
METHODS OF INTEGRATED SERVICE DELIVERY
COMBINING EDUCATION & WORKFORCE SYSTESMS TO SUPPORT CAREER PATHWAYS
SECTION IV: PARTICIPANT SUMMARIES AND PERFORMANCE INDICATORS 113
CAREER CENTER PARTICIPANTS AND OUTCOME SUMMARIES
PROFILE OF CAREER CENTER CUSTOMERS
WIOA TITLE I ADULT PARTICIPANTS SUMMARY
WIOA TITLE I DISLOCATED WORKERS PARTICIPANTS SUMMARY
WIOA TITLE I YOUTH WORKERS PARTICIPANTS SUMMARY
TRADE ADJUSTMENT ASSISTANCE PARTICIPANTS
WIOA PRIMARY INDICATORS OF PERFORMANCE
WIOA LOCAL PLAN OVERVIEW FISCAL YEARS 2018-2021
Massachusetts’ WIOA 4‐Year Local Plan, as required at WIOA section 108, is the culmination of a deliberate strategy to align all of the WIOA required activities in a coherent manner that averts duplication. The MA WIOA Local Plan builds upward and outward from the documents listed in the Table of Contents, which coalesce into the first year of the Massachusetts 4‐year local plan.
For FY18, the Commonwealth has focused on Local Memoranda of Understanding (MOU) that articulate integrated service strategies for priority WIOA populations and Regional Data Packages, comprised of critical data and analysis illustrating employer demand and worker supply in each of the seven new planning regions. In addition, the Local Plan includes the local Strategic Plan for the Workforce Board that describes local career pathway models, and current local data and information addressing the needs of the local Adult Basic Education population as well as performance indicators and participant summaries to support customer service planning.
Page 1

SECTION I: REGIONAL DATA PACKAGE & ADULT BASIC EDUCATION ALLIGNMENT
DATA PACKAGE
DEMOGRAPHIC CONTEXT
Population growth: Projections through 2035 show the share of older residents in Massachusetts increasing, with working age population declining.
Trends in race, ethnicity, and national origin: Population growth is driven by immigration, and by the growth of non‐white racial groups.
Regional commuter patterns: Illustrates percentage of residents employed in region but living outside it, residents living and employed in the region, and the percentage of residents living in region but employed outside it.
EMPLOYER DEMAND SUMMARY
General employment patterns: Comparison of state and regional unemployment rates between 2005 and January 2017, along with a comparison of median state wages and median regional wages.
Industry data: A comprehensive view of regional sector makeup, organized according to total wages and total employment. Prominent industry groups are highlighted and arranged according to average weekly wages. The largest fifteen employers of each top industry in the region are identified and ranked.
Occupational data: Jobs and professions defined by SOC codes are indexed according to share of employment, employer demand, and Demand Star Ranking.
CAREER PATHWAYS
Projected employment through 2024 and median annual earnings for key career pathways important to the region.
INVESTIGATING THE EMPLOYMENT SUPPLY GAP
Supply gap ratio: A proxy measure for understanding which occupations present labor supply deficiencies that are outstripped by employer demand. It shows which occupations have more job openings than qualified workers to fill those same job openings.
Labor supply/employer demand = supply gap ratio
ADULT BASIC EDUCATION SURVEY
SURVEY RESULTS ANALYSIS
The Massachusetts Department of Education’s Adult and Community Learning Services (ACLS) Request for Proposal for Adult and Community Learning Service grants will provide adult education direct services in each of the 16 workforce development areas. The grants will support the development of innovative adult education programs to effectively serve shared customers. This section provides comprehensive information that will assist bidders in aligning Adult Education activities and services with the workforce system.
Page 2
Northeast
Data PackageWorkforce Skills Cabinet, 2017
Page 3

Table of Contents
I. Regional MapII. Demographic Context and OverviewIII. Employer Demand DataIV. Supply Gap Data
This report contains critical data and analysis illustrating employer demand and worker supply in the region. Developed under the auspices of the Massachusetts Workforce Skills Cabinet to inform workplace service strategies.
Page 4
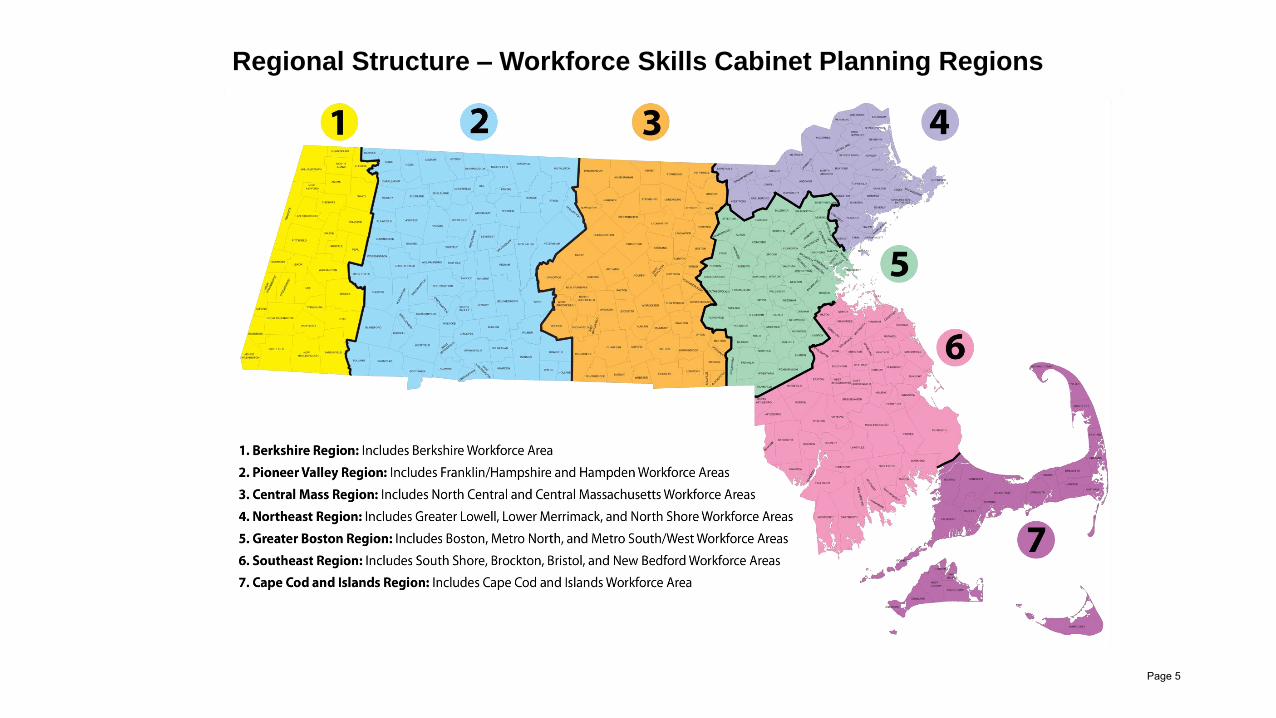
Regional Structure – Workforce Skills Cabinet Planning Regions
Page 5
II. Demographic Context and Overview
• Population trends in age, race, ethnicity, and immigration
• Commuter patterns in and out of the region
• Data summary
Page 6
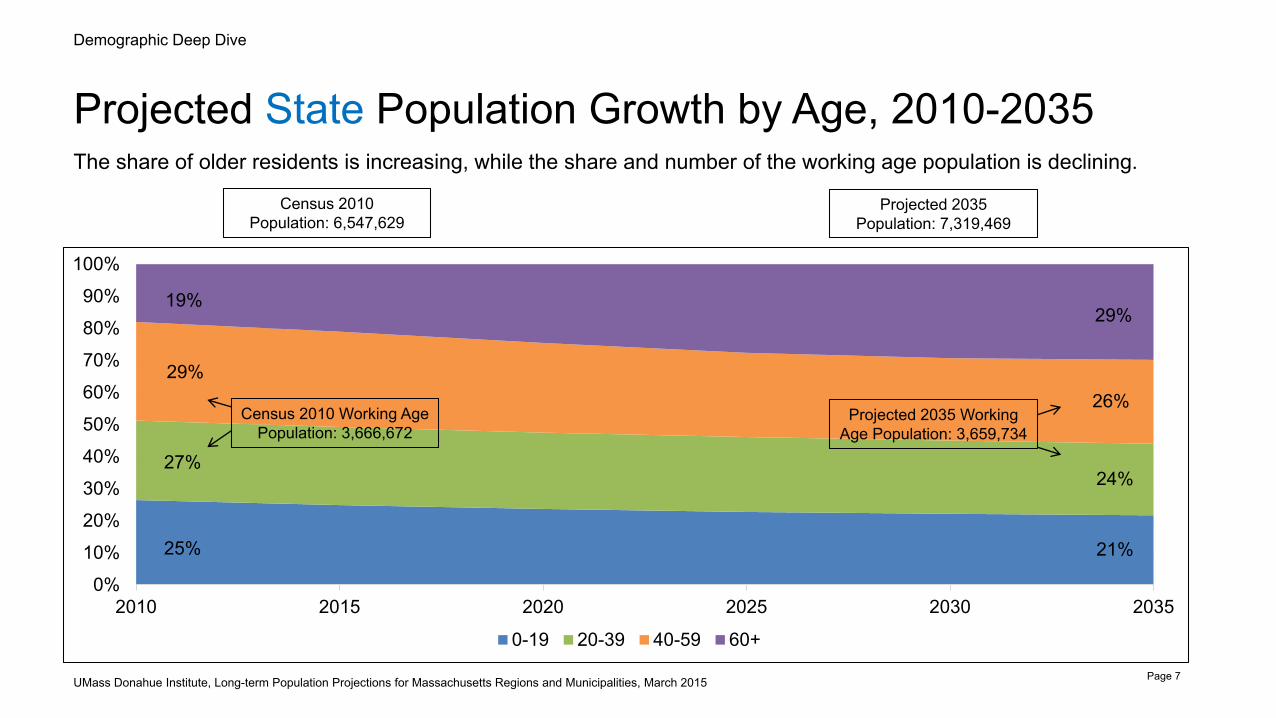
Projected State Population Growth by Age, 2010-2035
Demographic Deep Dive
The share of older residents is increasing, while the share and number of the working age population is declining.
UMass Donahue Institute, Long-term Population Projections for Massachusetts Regions and Municipalities, March 2015
25% 21%
27% 24%
29%26%
19%29%
0%
10%
20%
30%
40%
50%
60%
70%
80%
90%
100%
2010 2015 2020 2025 2030 2035
0-19 20-39 40-59 60+
Census 2010 Population: 6,547,629
Projected 2035 Population: 7,319,469
Census 2010 Working AgePopulation: 3,666,672
Projected 2035 Working Age Population: 3,659,734
Page 7

State Trends, Race/Ethnicity and Place of Origin
Demographic Deep Dive
Massachusetts population growth is driven by immigration and growth in diverse populations.
Source: Commonwealth Corporation via 2000 Census, 2012-2014 American Community Survey, PUMS.
Massachusetts 2000 2012-2014 Share of Total Population 2012-2014 Absolute Change Percent Change Average Annual
Growth Rate
Total Population* 6,131,752 6,447,295 100% 315,543 5.1% 0.4%
Nativity
Native Born 5,279,860 5,326,213 83% 46,353 0.9% 0.1%
Foreign Born** 851,892 1,121,082 17% 269,190 31.6% 2.1%
Race/Ethnicity
White, non-Hispanic 5,026,398 4,817,401 75% -208,997 -4.2% -0.3%
Black, non-Hispanic 300,758 407,723 6% 106,965 35.6% 2.4%
Asian, non-Hispanic 224,242 375,130 6% 150,888 67.3% 4.0%
Hispanic 412,496 678,193 11% 265,697 64.4% 3.9%
Other race, non-Hispanic 167,858 168,848 3% 990 0.6% 0.0%
*Civilian non-institutional population
**Foreign born is defined here as those born outside of the 50 states and the District of Columbia, who was not born to American parents abroad, and people born in Puerto Rico and other U.S. territories.
Page 8
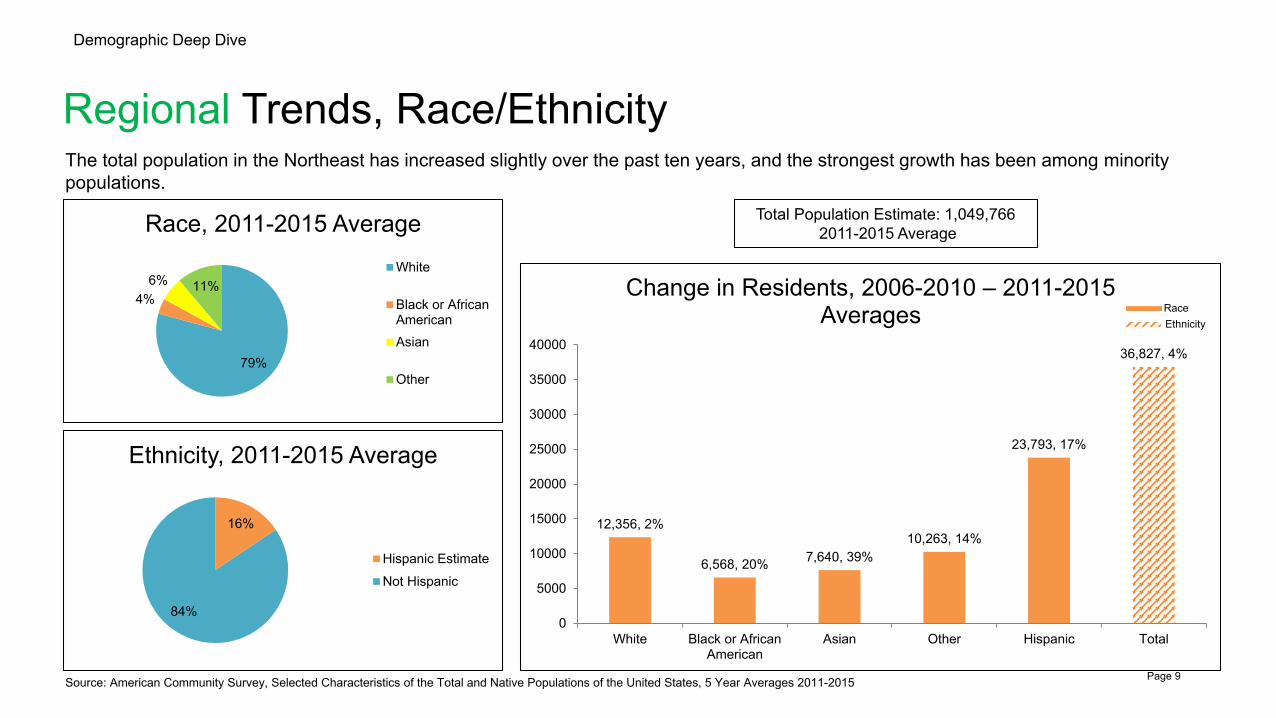
Regional Trends, Race/Ethnicity
Demographic Deep Dive
The total population in the Northeast has increased slightly over the past ten years, and the strongest growth has been among minority populations.
Source: American Community Survey, Selected Characteristics of the Total and Native Populations of the United States, 5 Year Averages 2011-2015
Total Population Estimate: 1,049,766 2011-2015 Average
RaceEthnicity
16%
84%
Ethnicity, 2011-2015 Average
Hispanic EstimateNot Hispanic
79%
4%6% 11%
Race, 2011-2015 AverageWhite
Black or AfricanAmericanAsian
Other
12,356, 2%
6,568, 20% 7,640, 39%10,263, 14%
23,793, 17%
36,827, 4%
0
5000
10000
15000
20000
25000
30000
35000
40000
White Black or AfricanAmerican
Asian Other Hispanic Total
Change in Residents, 2006-2010 – 2011-2015 Averages
Page 9

Regional Trends, Place of Origin
Demographic Deep Dive
About 2/3 of the Northeast was born locally. The share of foreign-born residents has increased by 8%, while out of state migrants have not increased.
Source: American Community Survey, Selected Characteristics of the Total and Native Populations of the United States, 5 Year Averages 2011-2015
67%
15%
3%
15%
Place of Origin, 2011-2015 Average
Native; born in state ofresidenceNative; born in other statein the U.S.Native; born outside U.S.
Foreign Born
19,533, 3%
583, 0%
3,932, 15%
12,566, 8%
0 5000 10000 15000 20000 25000
Native; born in state of residence
Native; born in other state in the U.S.
Native; born outside U.S.
Foreign Born
Change in Place of Origin, 2006-2010 –2011-2015 Average
Page 10
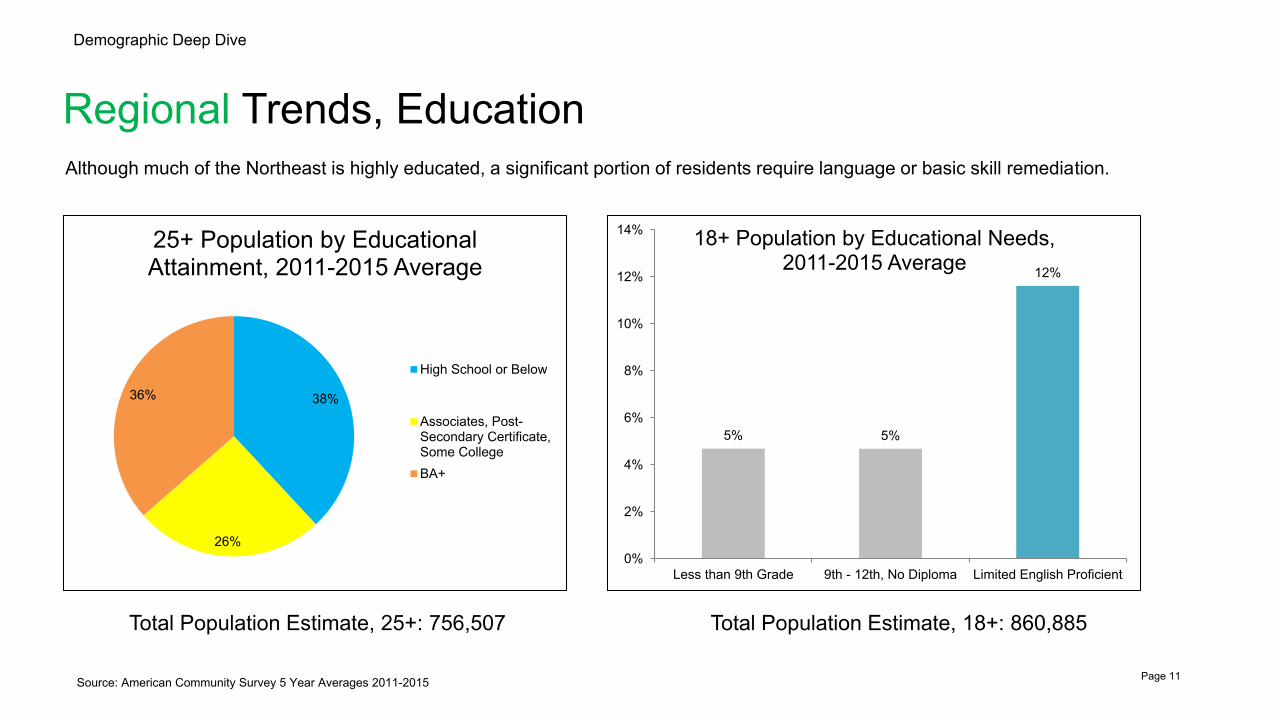
Regional Trends, Education
Demographic Deep Dive
Although much of the Northeast is highly educated, a significant portion of residents require language or basic skill remediation.
Source: American Community Survey 5 Year Averages 2011-2015
Total Population Estimate, 25+: 756,507 Total Population Estimate, 18+: 860,885
5% 5%
12%
0%
2%
4%
6%
8%
10%
12%
14%
Less than 9th Grade 9th - 12th, No Diploma Limited English Proficient
18+ Population by Educational Needs, 2011-2015 Average
38%
26%
36%
25+ Population by Educational Attainment, 2011-2015 Average
High School or Below
Associates, Post-Secondary Certificate,Some CollegeBA+
Page 11
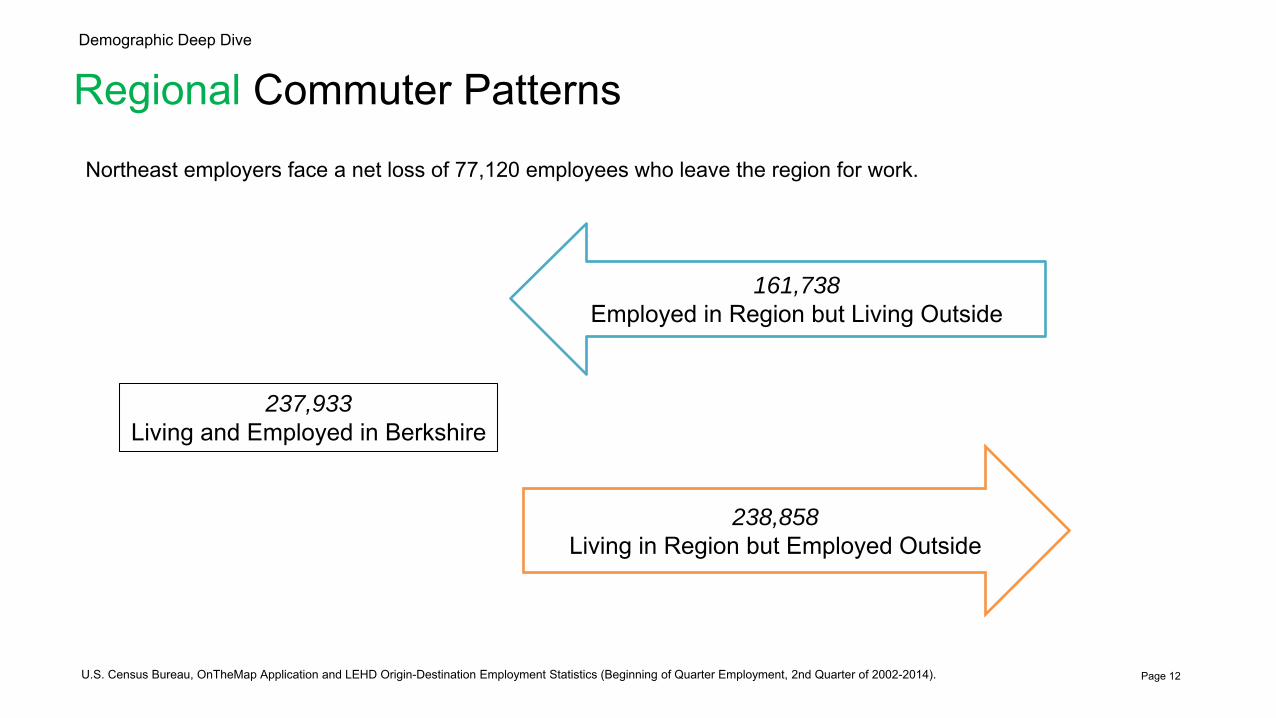
Regional Commuter Patterns
Northeast employers face a net loss of 77,120 employees who leave the region for work.
U.S. Census Bureau, OnTheMap Application and LEHD Origin-Destination Employment Statistics (Beginning of Quarter Employment, 2nd Quarter of 2002-2014).
Demographic Deep Dive
237,933
Living and Employed in Berkshire
238,858
Living in Region but Employed Outside
161,738
Employed in Region but Living Outside
Page 12

Summary of Demographic TrendsDemographic Deep Dive
• As our State’s population ages, the share of working age and young people is declining.
• The total population in the Northeast has increased slightly over the past ten years, and the strongest growth has been among minority populations.
• The Northeast Region loses more workers to outside of the region than the amount of employees that it gains.
Page 13
III. Employer Demand Data
A. Context
B. Industry Overview
C. Occupation Overview
D. Career Pathways Page 14
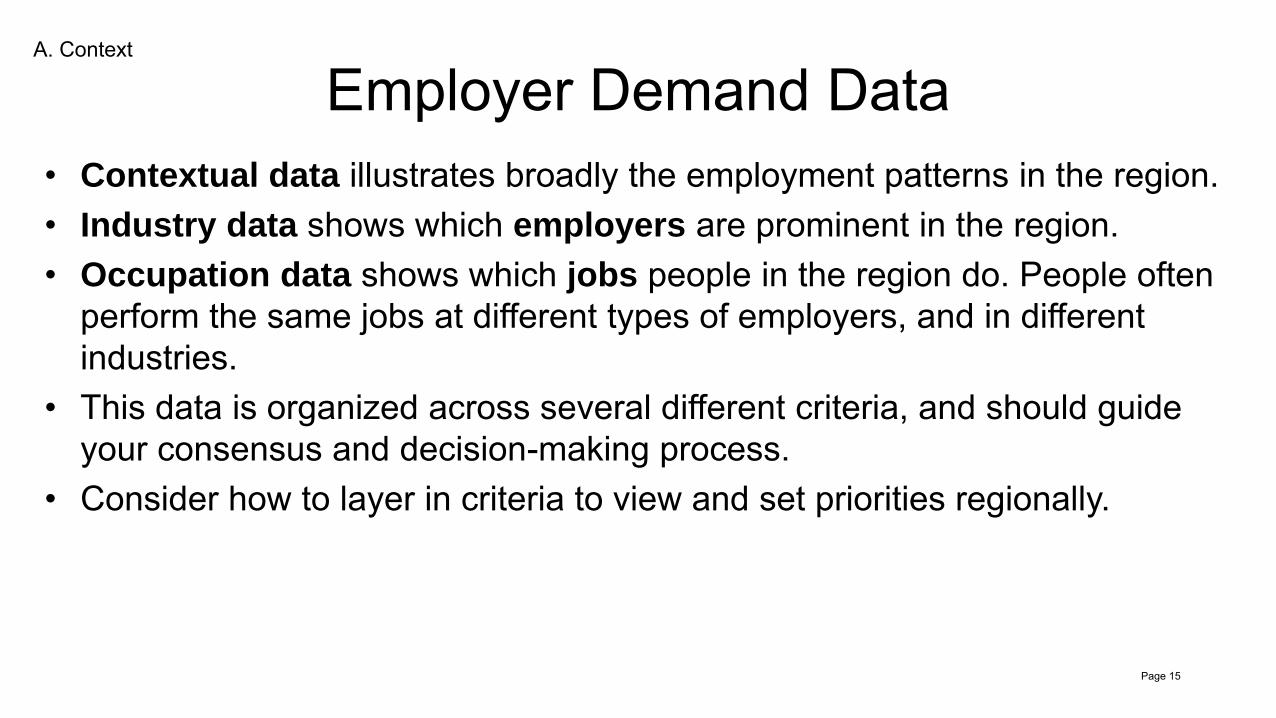
Employer Demand Data• Contextual data illustrates broadly the employment patterns in the region.• Industry data shows which employers are prominent in the region.• Occupation data shows which jobs people in the region do. People often
perform the same jobs at different types of employers, and in different industries.
• This data is organized across several different criteria, and should guide your consensus and decision-making process.
• Consider how to layer in criteria to view and set priorities regionally.
A. Context
Page 15
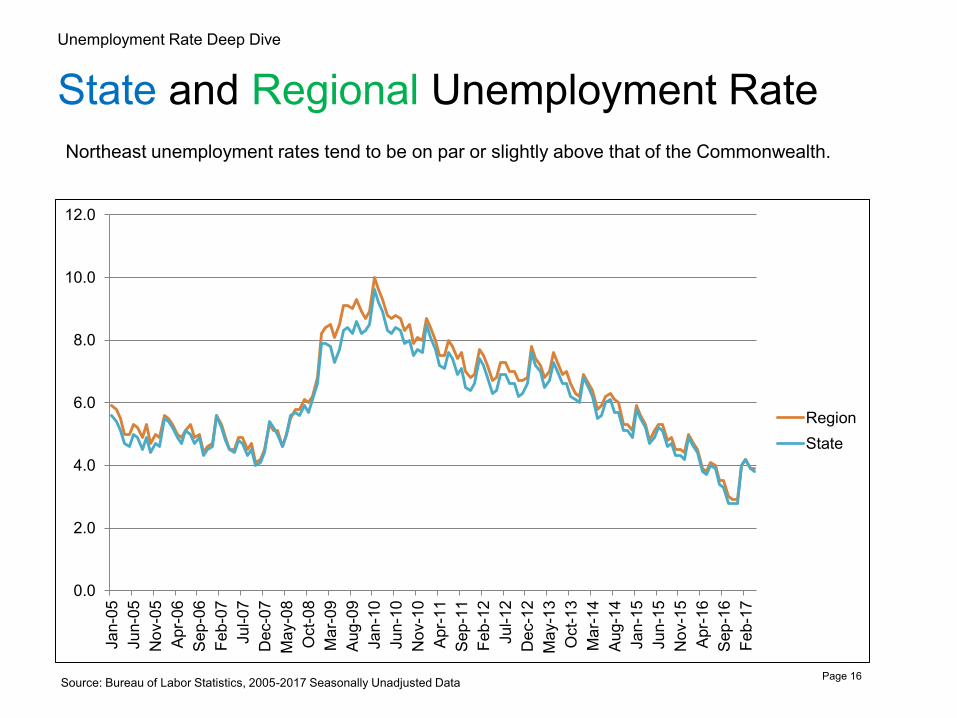
State and Regional Unemployment Rate Unemployment Rate Deep Dive
Northeast unemployment rates tend to be on par or slightly above that of the Commonwealth.
Source: Bureau of Labor Statistics, 2005-2017 Seasonally Unadjusted Data
0.0
2.0
4.0
6.0
8.0
10.0
12.0
Jan-
05Ju
n-05
Nov
-05
Apr-0
6Se
p-06
Feb-
07Ju
l-07
Dec
-07
May
-08
Oct
-08
Mar
-09
Aug-
09Ja
n-10
Jun-
10N
ov-1
0Ap
r-11
Sep-
11Fe
b-12
Jul-1
2D
ec-1
2M
ay-1
3O
ct-1
3M
ar-1
4Au
g-14
Jan-
15Ju
n-15
Nov
-15
Apr-1
6Se
p-16
Feb-
17
RegionState
Page 16
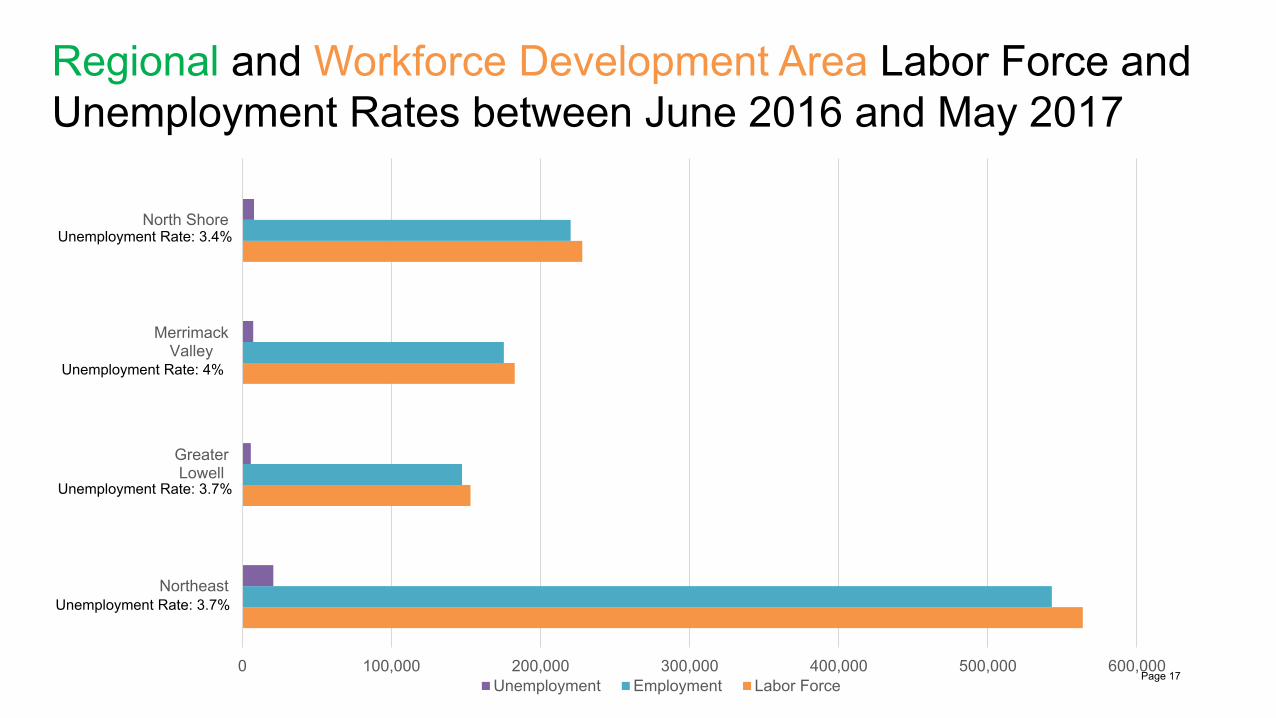
Regional and Workforce Development Area Labor Force and Unemployment Rates between June 2016 and May 2017
Unemployment Rate: 3.4%
Unemployment Rate: 3.7%
Unemployment Rate: 3.7%
0 100,000 200,000 300,000 400,000 500,000 600,000
Northeast
GreaterLowell
MerrimackValley
North Shore
Unemployment Employment Labor Force
Unemployment Rate: 4%
Page 17

Median Wage Northeast regional median wages are the second highest in the commonwealth.
Occupational Employment Statistics Wages, 2015
$36,317 $38,433
$40,646
$53,153
$42,225 $38,601 $38,797
$46,690
$0
$10,000
$20,000
$30,000
$40,000
$50,000
$60,000
Berkshire Cape andIslands
Central GreaterBoston
Northeast Pioneer Valley Southeast State
Annual Median
Page 18
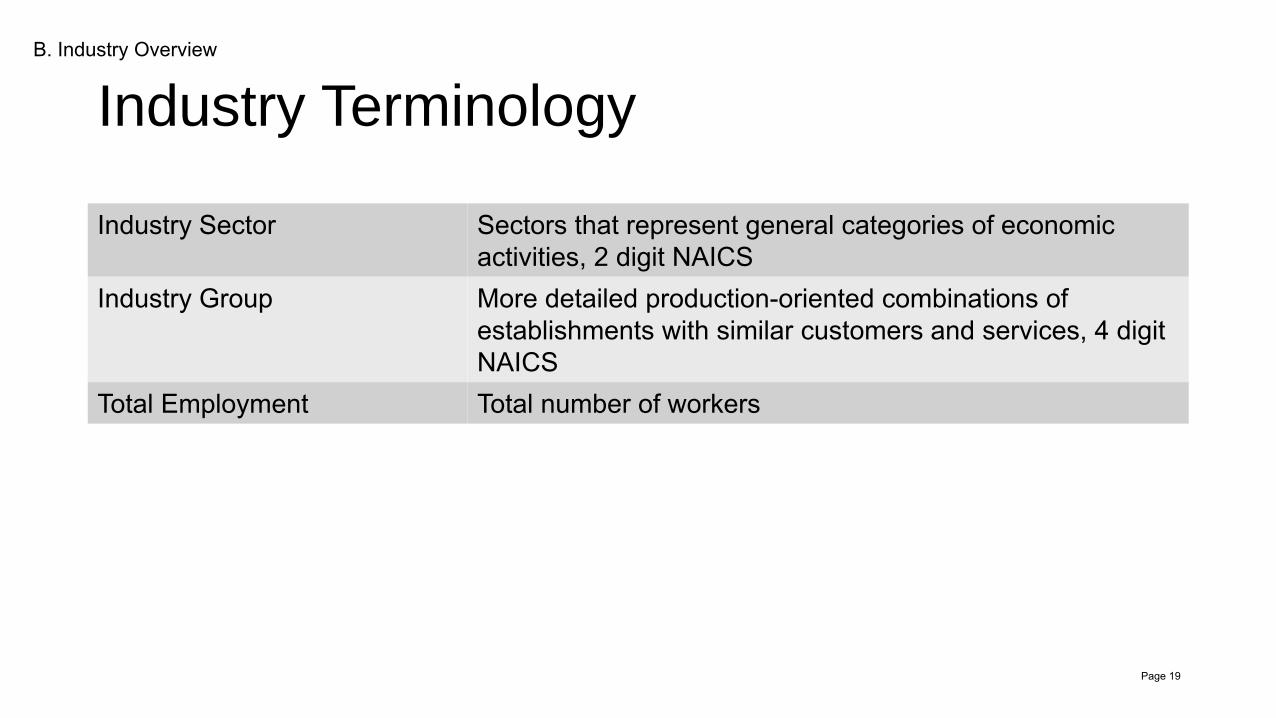
Industry Terminology
Industry Sector Sectors that represent general categories of economic activities, 2 digit NAICS
Industry Group More detailed production-oriented combinations of establishments with similar customers and services, 4 digit NAICS
Total Employment Total number of workers
B. Industry Overview
Page 19
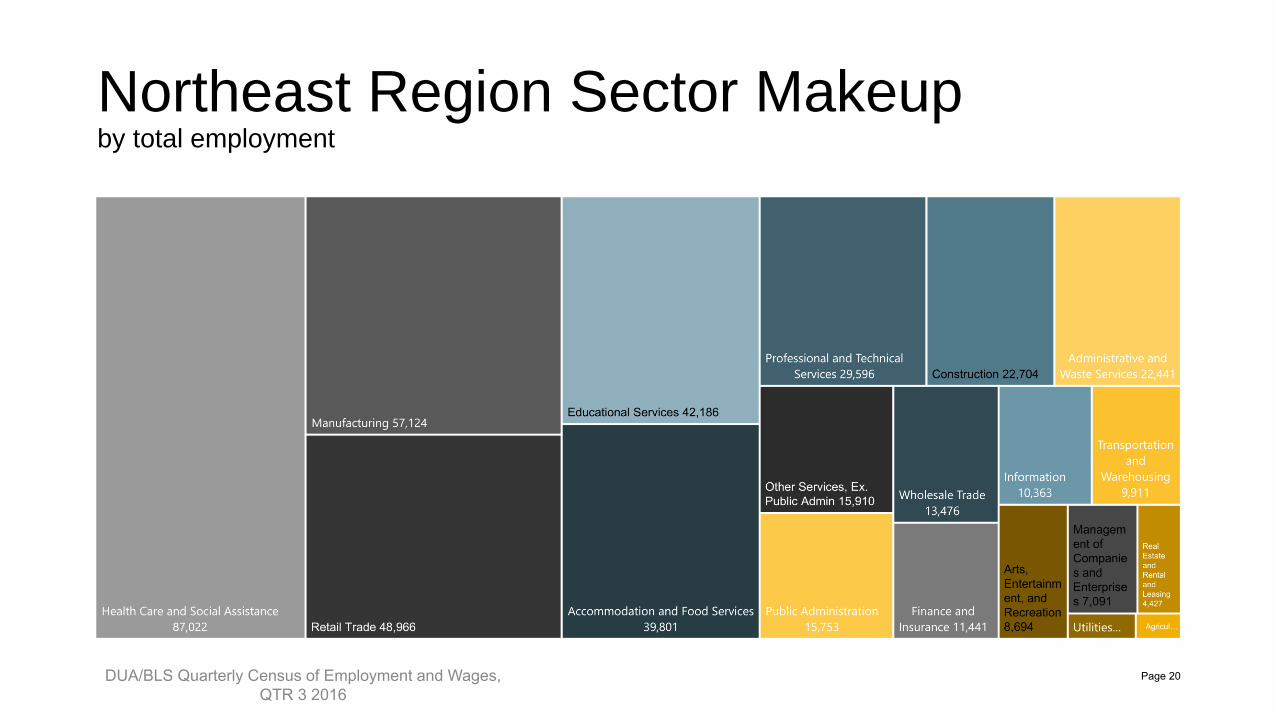
Northeast Region Sector Makeupby total employment
DUA/BLS Quarterly Census of Employment and Wages, QTR 3 2016
Page 20
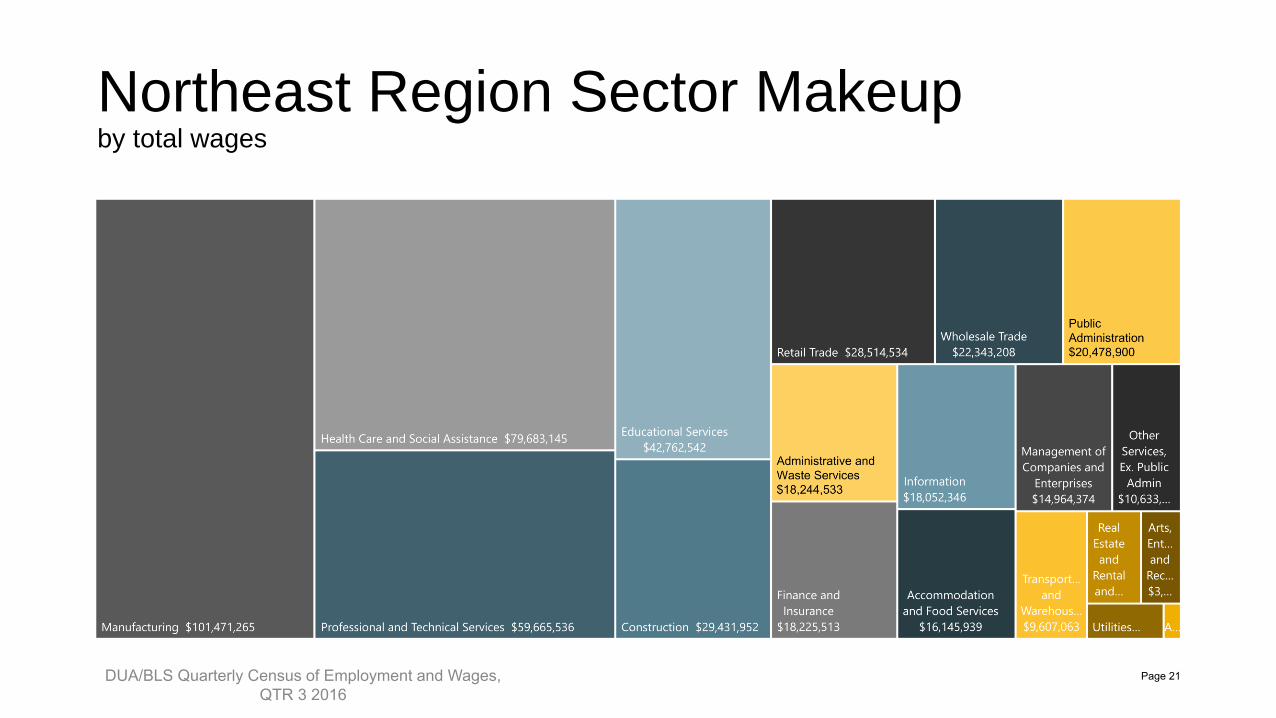
Northeast Region Sector Makeupby total wages
DUA/BLS Quarterly Census of Employment and Wages, QTR 3 2016
Page 21

Top 5 Healthcare Industry Groups
Number of establishments
Employment share
$916
$510
$747
$1,126
$1,666
$795
Largest Employers by 12-
month Job Postings
Employer Postings
Beverly Hospital 407
Eliot Community 314
Kindred Healthcare 274
Vinfen 161
Lahey Clinic, Inc. 151
6,034
118
13
516
72
13,310
13,035
10,740
9,370
8,292
Individual and Family Services
Home Health Care Services
General Medical and Surgical Hospitals
Offices of Physicians
Nursing Care Facilities
Number of Establishments and Total Employment Average weekly wages for the Sector and Industry Groups
DUA/BLS Quarterly Census of Employment and Wages, QTR 3 2016; Conference Board Help Wanted OnLine 12 month totals 2017
Page 22
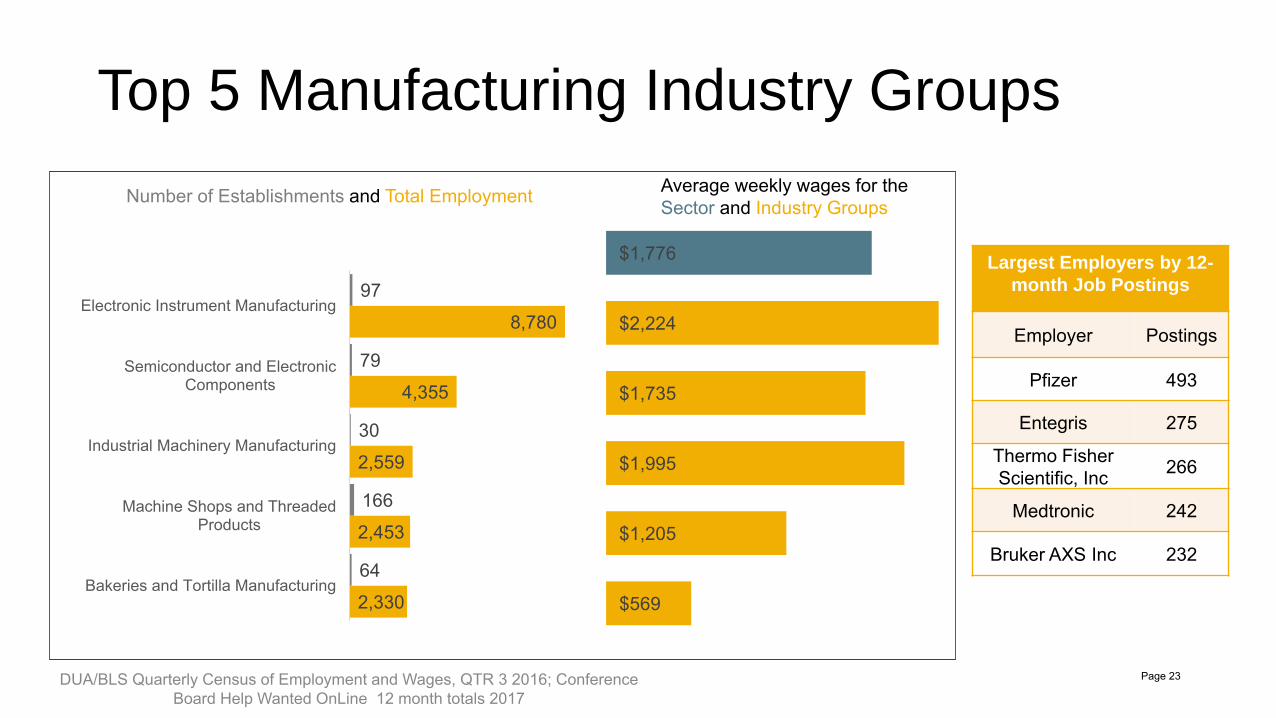
Top 5 Manufacturing Industry Groups
Number of establishments
Employment share
Largest Employers by 12-
month Job Postings
Employer Postings
Pfizer 493
Entegris 275
Thermo Fisher Scientific, Inc 266
Medtronic 242
Bruker AXS Inc 232
97
79
30
166
64
8,780
4,355
2,559
2,453
2,330
Electronic Instrument Manufacturing
Semiconductor and ElectronicComponents
Industrial Machinery Manufacturing
Machine Shops and ThreadedProducts
Bakeries and Tortilla Manufacturing
$1,776
$2,224
$1,735
$1,995
$1,205
$569
Number of Establishments and Total Employment Average weekly wages for the Sector and Industry Groups
DUA/BLS Quarterly Census of Employment and Wages, QTR 3 2016; Conference Board Help Wanted OnLine 12 month totals 2017
Page 23
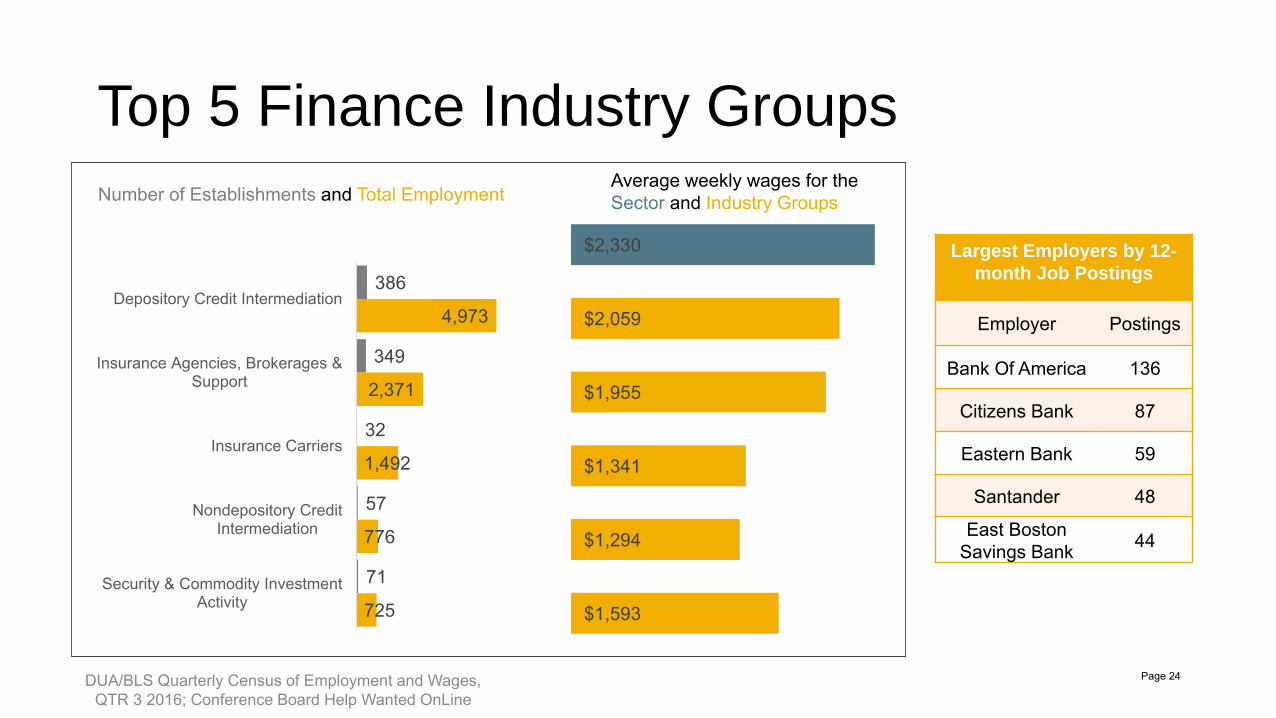
Top 5 Finance Industry Groups
Number of establishments
Employment shareLargest Employers by 12-
month Job Postings
Employer Postings
Bank Of America 136
Citizens Bank 87
Eastern Bank 59
Santander 48
East Boston Savings Bank 44
386
349
32
57
71
4,973
2,371
1,492
776
725
Depository Credit Intermediation
Insurance Agencies, Brokerages &Support
Insurance Carriers
Nondepository CreditIntermediation
Security & Commodity InvestmentActivity $1,593
$1,294
$1,341
$1,955
$2,059
$2,330
Number of Establishments and Total EmploymentAverage weekly wages for the Sector and Industry Groups
DUA/BLS Quarterly Census of Employment and Wages, QTR 3 2016; Conference Board Help Wanted OnLine
Page 24
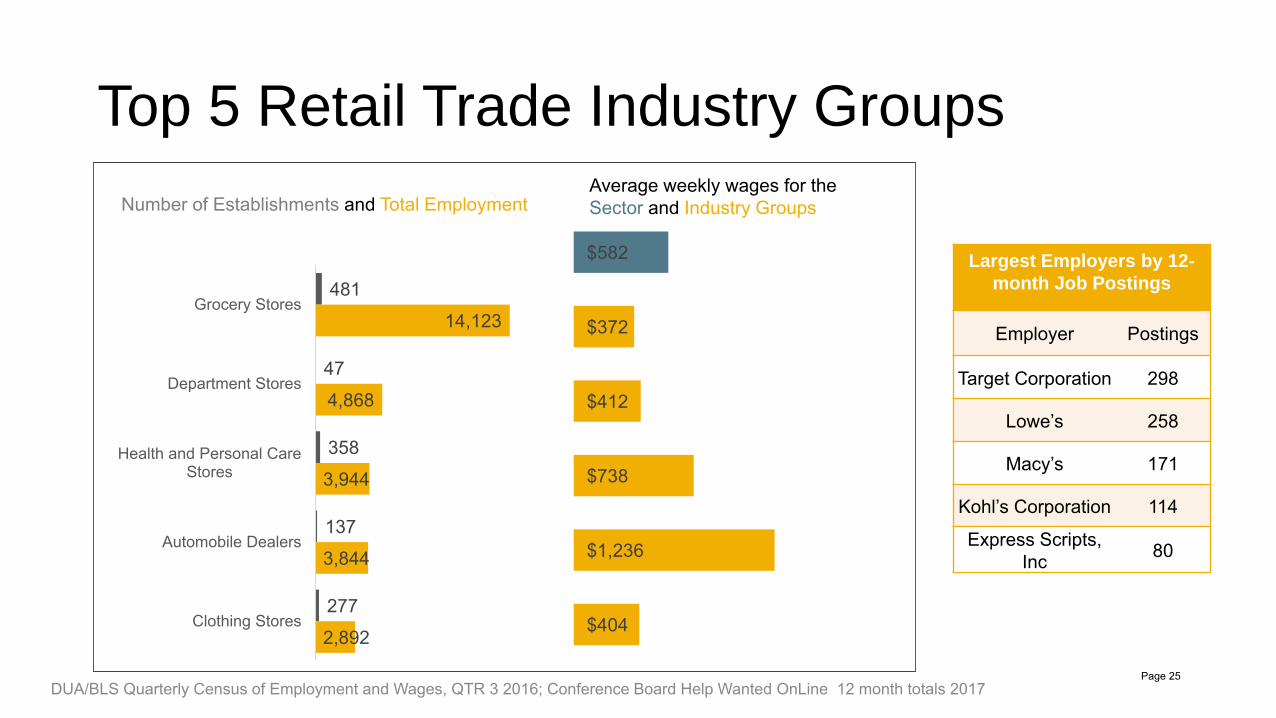
Top 5 Retail Trade Industry Groups
481
47
358
137
277
14,123
4,868
3,944
3,844
2,892
Grocery Stores
Department Stores
Health and Personal CareStores
Automobile Dealers
Clothing Stores
$582
$372
$412
$738
$1,236
$404
Largest Employers by 12-
month Job Postings
Employer Postings
Target Corporation 298
Lowe’s 258
Macy’s 171
Kohl’s Corporation 114
Express Scripts, Inc 80
Number of Establishments and Total EmploymentAverage weekly wages for the Sector and Industry Groups
DUA/BLS Quarterly Census of Employment and Wages, QTR 3 2016; Conference Board Help Wanted OnLine 12 month totals 2017Page 25

Top 5 Professional and Technical Industry Groups
654
154
610
398
334
6,920
5,838
4,398
4,268
2,571
Computer Systems Design and RelServices
Scientific Research andDevelopment Svc
Management & Technical ConsultingSvc
Architectural and EngineeringServices
Other Professional & TechnicalServices
$2,016
$2,437
$2,779
$1,813
$1,838
$1,368
Largest Employers by 12-
month Job Postings
Employer Postings
Netscout Systems, Inc 140
NaviSite, Inc 92
H&R Block 76
Eliot Community 72
Sonus Networks 70
Number of Establishments and Total EmploymentAverage weekly wages for the Sectorand Industry Groups
DUA/BLS Quarterly Census of Employment and Wages, QTR 3 2016; Conference Board Help Wanted OnLine, 12 month totals 2017Page 26
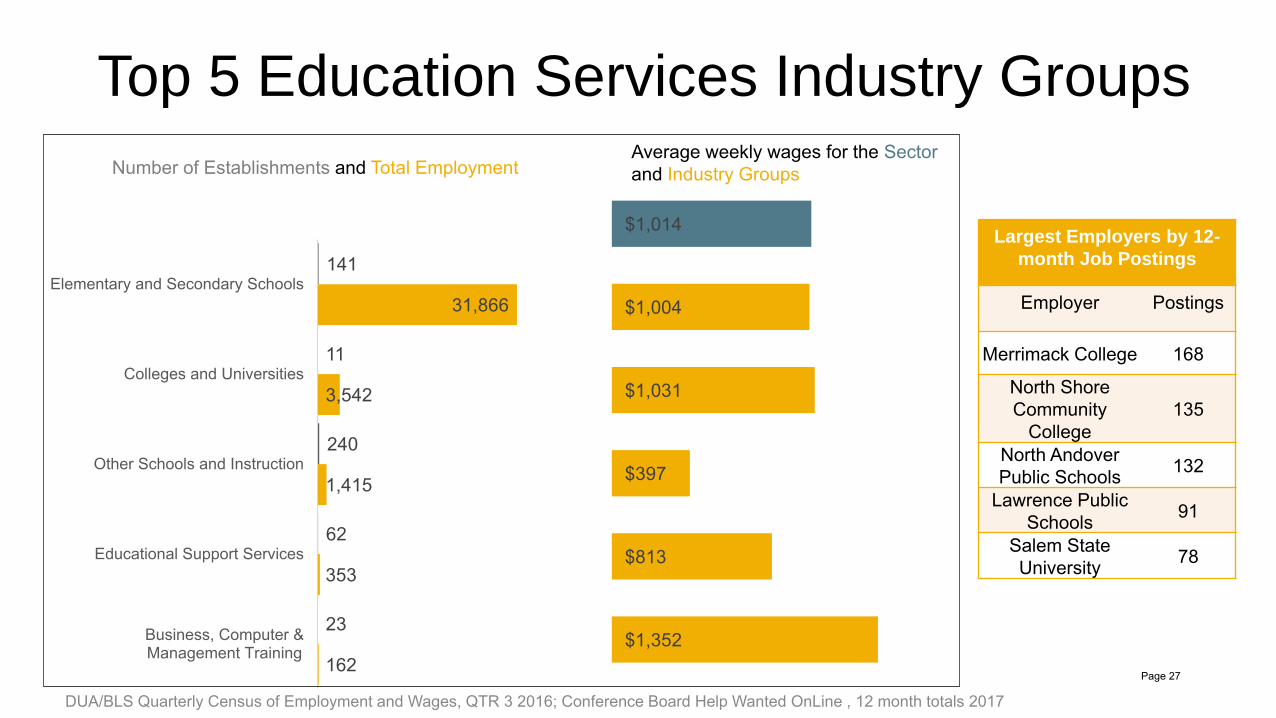
Top 5 Education Services Industry Groups
141
11
240
62
23
31,866
3,542
1,415
353
162
Elementary and Secondary Schools
Colleges and Universities
Other Schools and Instruction
Educational Support Services
Business, Computer &Management Training
$1,014
$1,004
$1,031
$397
$813
$1,352
Largest Employers by 12-
month Job Postings
Employer Postings
Merrimack College 168
North Shore Community
College135
North Andover Public Schools 132
Lawrence Public Schools 91
Salem State University 78
Number of Establishments and Total EmploymentAverage weekly wages for the Sectorand Industry Groups
DUA/BLS Quarterly Census of Employment and Wages, QTR 3 2016; Conference Board Help Wanted OnLine , 12 month totals 2017Page 27

C. Occupation Overview
What jobs are people doing, and what types of work do employers need people to do.
C1: Occupations Indexed by Share of Employment
C2: Occupations Indexed by Employer Demand
C3. Occupations Indexed by Demand Star Ranking
Page 28

Occupation Terminology
Employment Share Number of employees currently working in a specific industry or sector across all employers
Occupation A job or profession, not specific to an industry, defined by SOC code
C1. Occupations Indexed by Share of Employment
Page 29
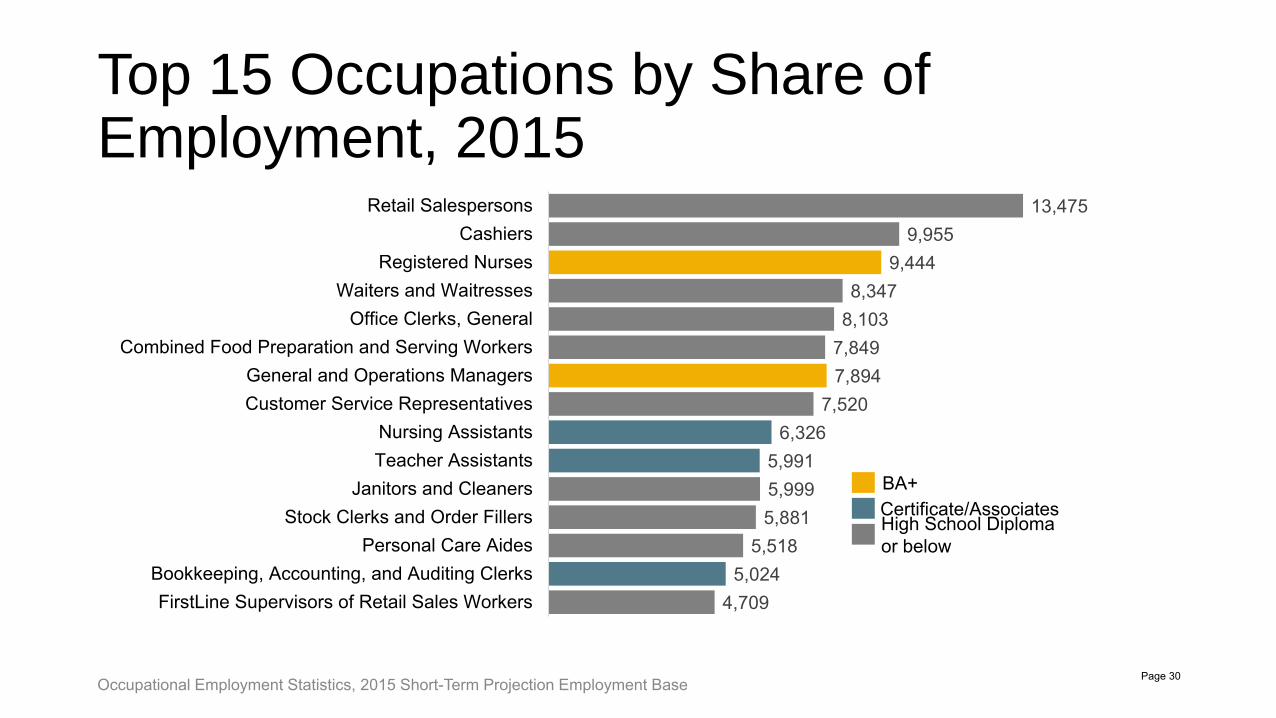
Top 15 Occupations by Share of Employment, 2015
4,7095,024
5,5185,8815,9995,991
6,3267,520
7,8947,8498,1038,347
9,4449,955
13,475
FirstLine Supervisors of Retail Sales WorkersBookkeeping, Accounting, and Auditing Clerks
Personal Care AidesStock Clerks and Order Fillers
Janitors and CleanersTeacher AssistantsNursing Assistants
Customer Service RepresentativesGeneral and Operations Managers
Combined Food Preparation and Serving WorkersOffice Clerks, General
Waiters and WaitressesRegistered Nurses
CashiersRetail Salespersons
BA+Certificate/AssociatesHigh School Diploma or below
Occupational Employment Statistics, 2015 Short-Term Projection Employment Base Page 30
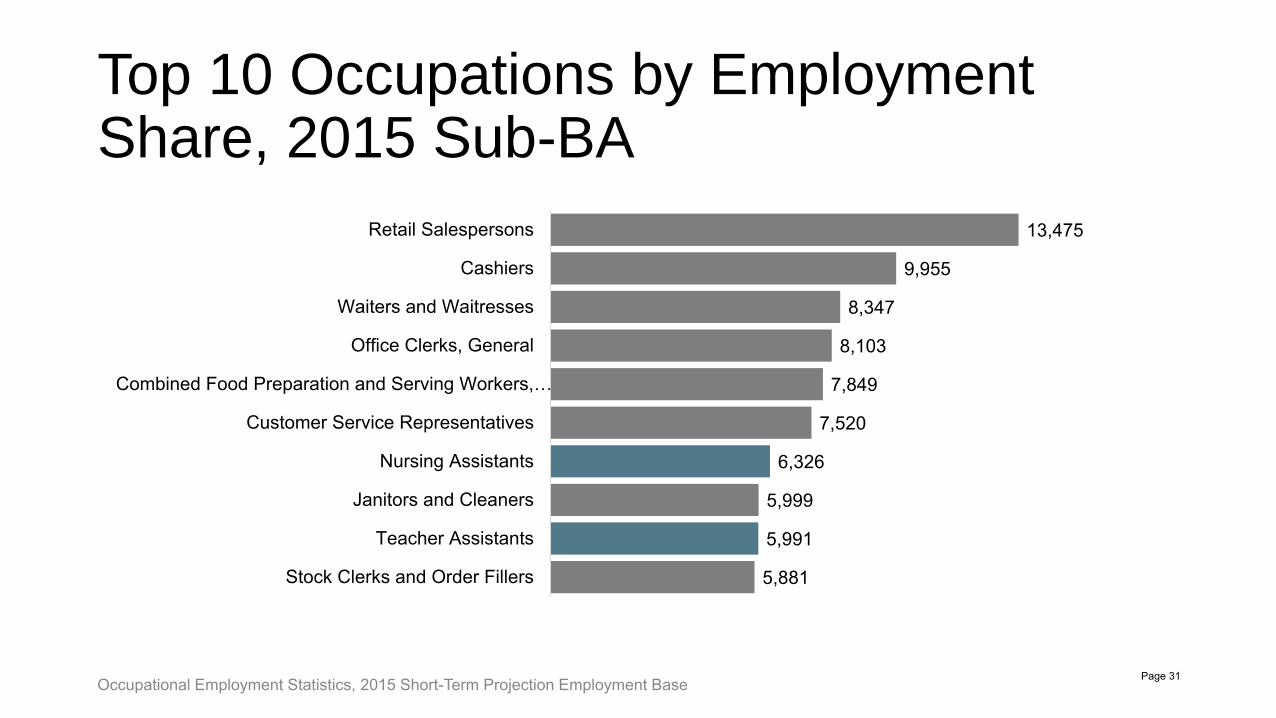
Top 10 Occupations by Employment Share, 2015 Sub-BA
5,881
5,991
5,999
6,326
7,520
7,849
8,103
8,347
9,955
13,475
Stock Clerks and Order Fillers
Teacher Assistants
Janitors and Cleaners
Nursing Assistants
Customer Service Representatives
Combined Food Preparation and Serving Workers,…
Office Clerks, General
Waiters and Waitresses
Cashiers
Retail Salespersons
Occupational Employment Statistics, 2015 Short-Term Projection Employment Base Page 31
Top 10 Occupation by Employment Share, 2015, BA+
2,379
2,430
2,567
2,849
2,898
3,476
3,798
3,816
7,894
9,444
Industrial Engineers
Financial Managers
Sales Representatives, Wholesale andManufacturing, Technical and Scientific…
Middle School Teachers, Except Special andCareer/Technical Education
Software Developers, Systems Software
Accountants and Auditors
Secondary School Teachers, Except Specialand Career/Technical Education
Elementary School Teachers, Except SpecialEducation
General and Operations Managers
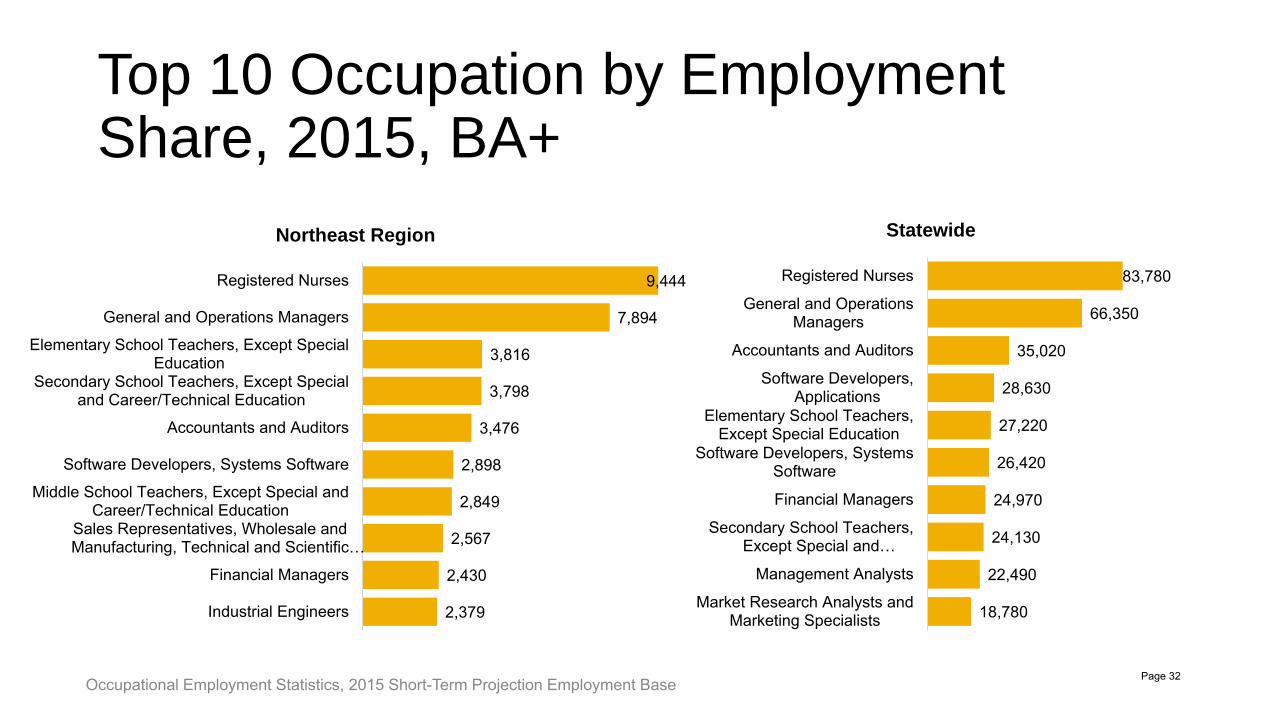
Registered Nurses
Northeast Region
83,780
66,350
35,020
28,630
27,220
26,420
24,970
24,130
22,490
18,780
Registered Nurses
General and OperationsManagers
Accountants and Auditors
Software Developers,Applications
Elementary School Teachers,Except Special Education
Software Developers, SystemsSoftware
Financial Managers
Secondary School Teachers,Except Special and…
Management Analysts
Market Research Analysts andMarketing Specialists
Statewide
Occupational Employment Statistics, 2015 Short-Term Projection Employment Base Page 32
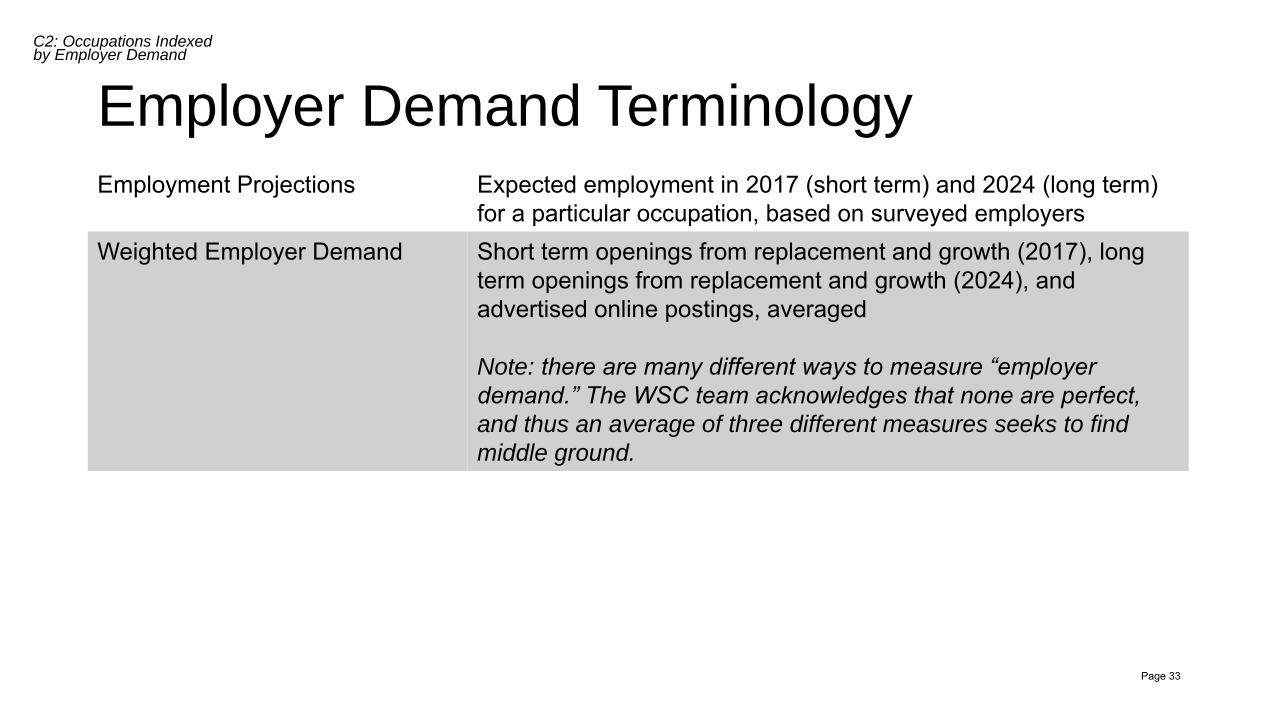
Employer Demand TerminologyEmployment Projections Expected employment in 2017 (short term) and 2024 (long term)
for a particular occupation, based on surveyed employersWeighted Employer Demand Short term openings from replacement and growth (2017), long
term openings from replacement and growth (2024), and advertised online postings, averaged
Note: there are many different ways to measure “employer
demand.” The WSC team acknowledges that none are perfect,
and thus an average of three different measures seeks to find
middle ground.
C2: Occupations Indexed by Employer Demand
Page 33
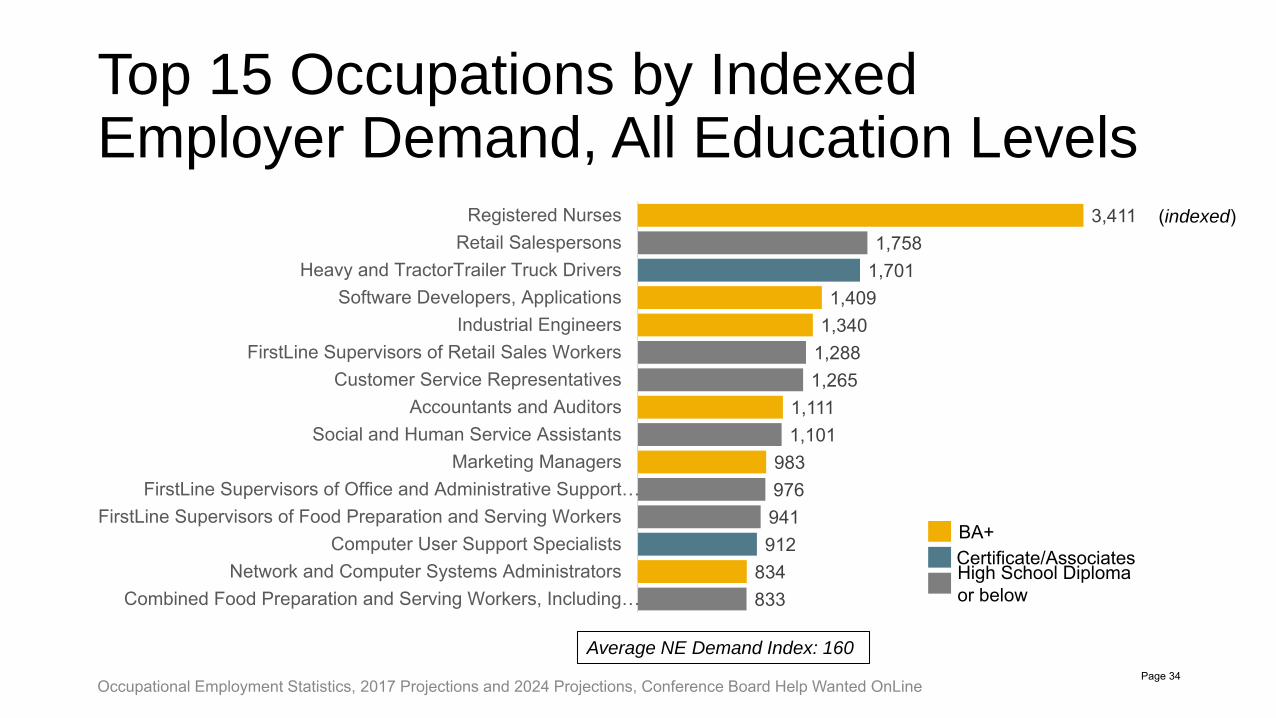
Top 15 Occupations by Indexed Employer Demand, All Education Levels
833834912941976983
1,1011,111
1,2651,2881,3401,409
1,7011,758
3,411
Combined Food Preparation and Serving Workers, Including…Network and Computer Systems Administrators
Computer User Support SpecialistsFirstLine Supervisors of Food Preparation and Serving Workers
FirstLine Supervisors of Office and Administrative Support…Marketing Managers
Social and Human Service AssistantsAccountants and Auditors
Customer Service RepresentativesFirstLine Supervisors of Retail Sales Workers
Industrial EngineersSoftware Developers, Applications
Heavy and TractorTrailer Truck DriversRetail Salespersons
Registered Nurses
BA+Certificate/AssociatesHigh School Diploma or below
Occupational Employment Statistics, 2017 Projections and 2024 Projections, Conference Board Help Wanted OnLine
(indexed)
Average NE Demand Index: 160
Page 34
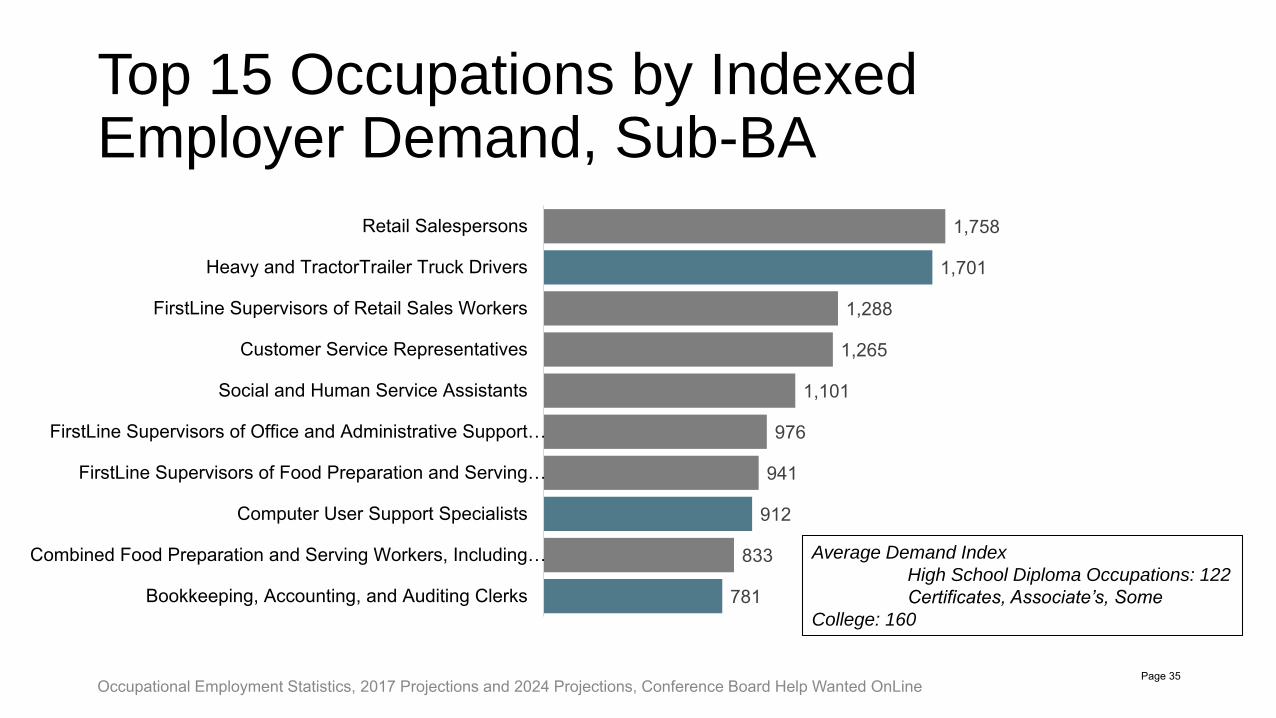
Top 15 Occupations by Indexed Employer Demand, Sub-BA
781
833
912
941
976
1,101
1,265
1,288
1,701
1,758
Bookkeeping, Accounting, and Auditing Clerks
Combined Food Preparation and Serving Workers, Including…
Computer User Support Specialists
FirstLine Supervisors of Food Preparation and Serving…
FirstLine Supervisors of Office and Administrative Support…
Social and Human Service Assistants
Customer Service Representatives
FirstLine Supervisors of Retail Sales Workers
Heavy and TractorTrailer Truck Drivers
Retail Salespersons
Occupational Employment Statistics, 2017 Projections and 2024 Projections, Conference Board Help Wanted OnLine
Average Demand Index
High School Diploma Occupations: 122
Certificates, Associate’s, Some
College: 160
Page 35

Top 15 Occupations Requiring a BA by Indexed Employer Demand
550
675
735
769
834
983
1,111
1,340
1,409
3,411
Medical Scientists, ExceptEpidemiologists
SpeechLanguage Pathologists
Physical Therapists
Medical and Health ServicesManagers
Network and Computer SystemsAdministrators
Marketing Managers
Accountants and Auditors
Industrial Engineers
Software Developers, Applications
Registered Nurses
Northeast Region
6,227
6,706
7,207
7,291
7,766
8,783
9,902
12,472
15,937
27,262
Financial Managers
Medical and Health ServicesManagers
Management Analysts
Network and Computer SystemsAdministrators
Computer Systems Analysts
Medical Scientists, ExceptEpidemiologists
Marketing Managers
Accountants and Auditors
Software Developers, Applications
Registered Nurses
Statewide
Occupational Employment Statistics, 2017 Projections and 2024 Projections, Conference Board Help Wanted OnLine
Average NE Demand Index, BA: 212 Average State Demand Index, BA: 1532
Page 36
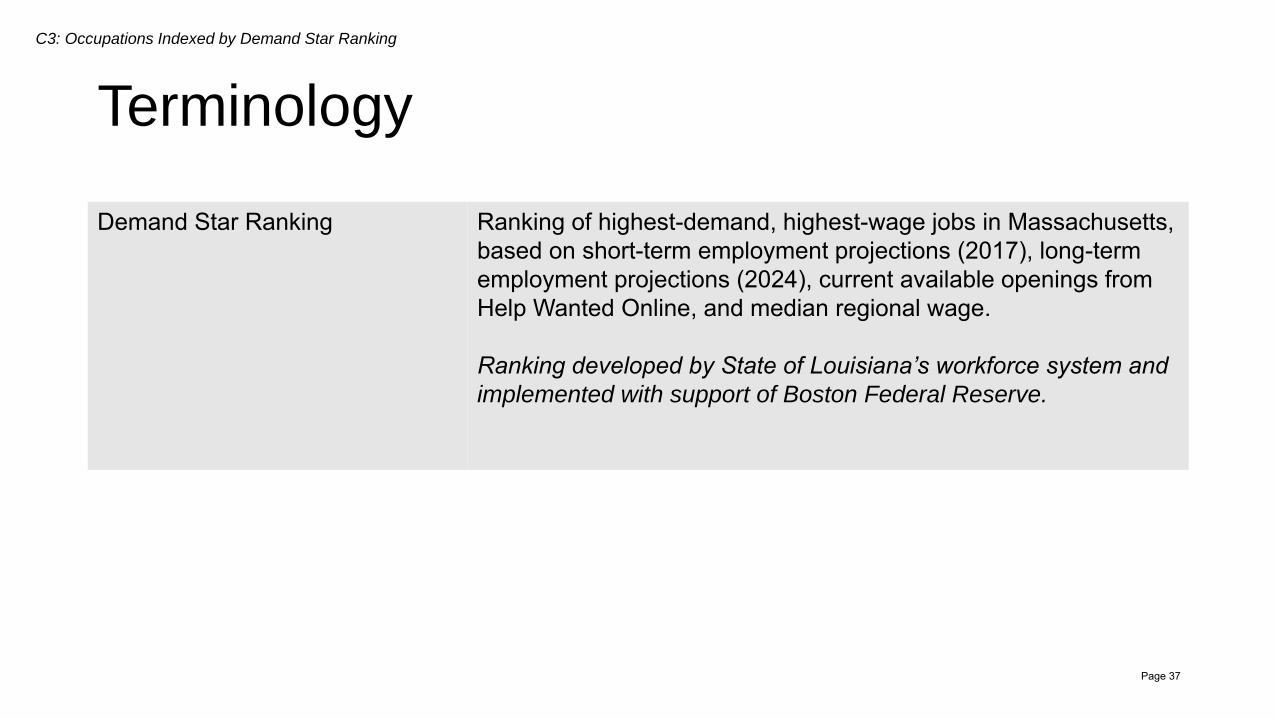
Terminology
Demand Star Ranking Ranking of highest-demand, highest-wage jobs in Massachusetts, based on short-term employment projections (2017), long-term employment projections (2024), current available openings from Help Wanted Online, and median regional wage.
Ranking developed by State of Louisiana’s workforce system and
implemented with support of Boston Federal Reserve.
C3: Occupations Indexed by Demand Star Ranking
Page 37

II.C.1: 4- Star Occupations Requiring a High School Diploma
36Occupational Employment Statistics, 2017 Projections and 2024 Projections, Occupational Employment Statistics Wages, Conference Board Help Wanted OnLine
Occupation Title Primary Industry Indexed Demand Median Wages
Industrial Machinery Mechanics Manufacturing 105 $ 57,983
Maintenance and Repair Workers, General Real Estate and Rental and Leasing 674 $ 43,241
FirstLine Supervisors of Production and Operating Workers Manufacturing 614 $ 64,740
Machinists Manufacturing 212 $ 53,146
Inspectors, Testers, Sorters, Samplers, and Weighers Manufacturing 245 $ 47,060
FirstLine Supervisors of Transportation and MaterialMoving Machine and Vehicle Operators Transportation and Warehousing 285 $ 58,848
Light Truck or Delivery Services Drivers Transportation and Warehousing 622 $ 36,168
Page 38
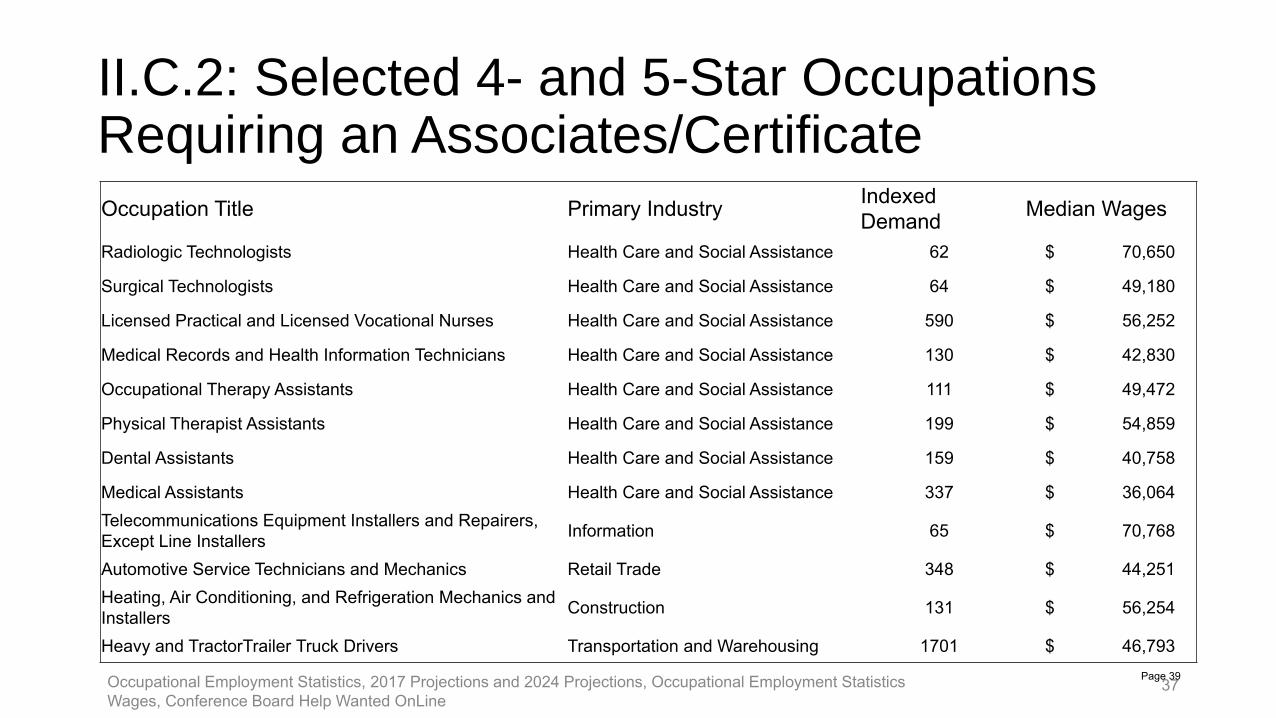
II.C.2: Selected 4- and 5-Star Occupations Requiring an Associates/Certificate
37Occupational Employment Statistics, 2017 Projections and 2024 Projections, Occupational Employment Statistics Wages, Conference Board Help Wanted OnLine
Occupation Title Primary Industry Indexed Demand Median Wages
Radiologic Technologists Health Care and Social Assistance 62 $ 70,650
Surgical Technologists Health Care and Social Assistance 64 $ 49,180
Licensed Practical and Licensed Vocational Nurses Health Care and Social Assistance 590 $ 56,252
Medical Records and Health Information Technicians Health Care and Social Assistance 130 $ 42,830
Occupational Therapy Assistants Health Care and Social Assistance 111 $ 49,472
Physical Therapist Assistants Health Care and Social Assistance 199 $ 54,859
Dental Assistants Health Care and Social Assistance 159 $ 40,758
Medical Assistants Health Care and Social Assistance 337 $ 36,064 Telecommunications Equipment Installers and Repairers, Except Line Installers Information 65 $ 70,768
Automotive Service Technicians and Mechanics Retail Trade 348 $ 44,251 Heating, Air Conditioning, and Refrigeration Mechanics and Installers Construction 131 $ 56,254
Heavy and TractorTrailer Truck Drivers Transportation and Warehousing 1701 $ 46,793 Page 39
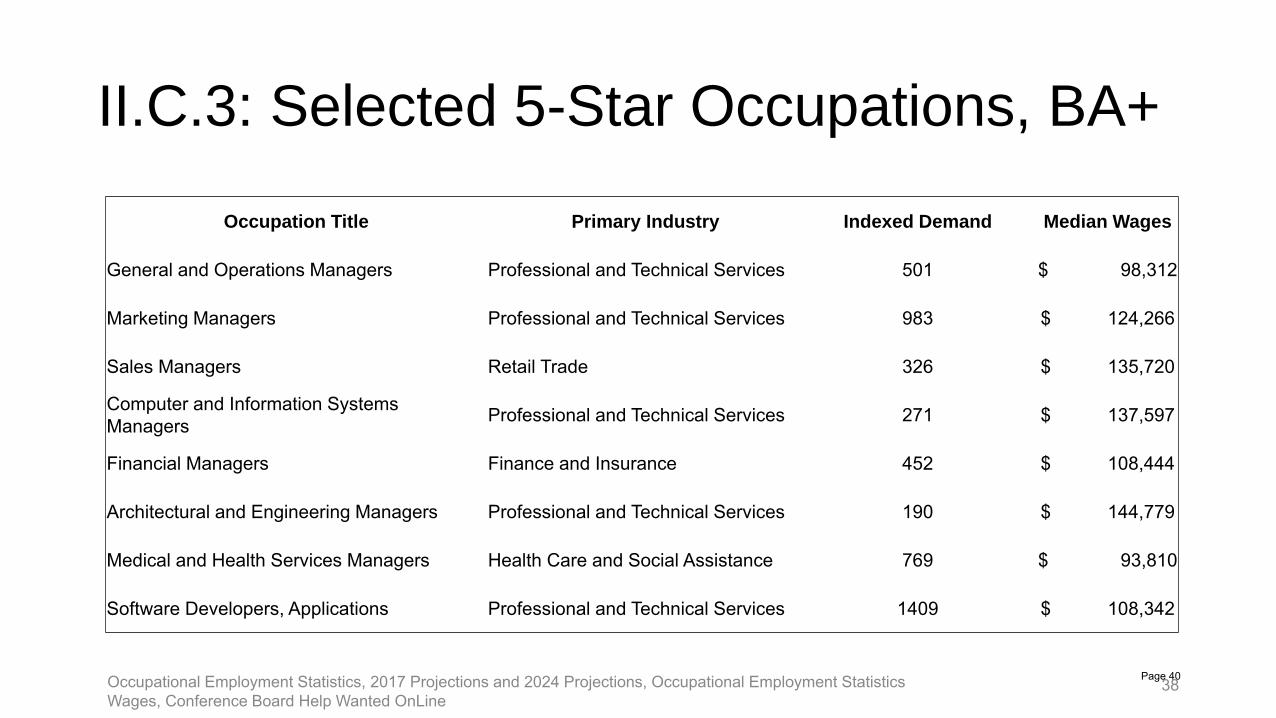
II.C.3: Selected 5-Star Occupations, BA+
38
Occupation Title Primary Industry Indexed Demand Median Wages
General and Operations Managers Professional and Technical Services 501 $ 98,312
Marketing Managers Professional and Technical Services 983 $ 124,266
Sales Managers Retail Trade 326 $ 135,720
Computer and Information Systems Managers Professional and Technical Services 271 $ 137,597
Financial Managers Finance and Insurance 452 $ 108,444
Architectural and Engineering Managers Professional and Technical Services 190 $ 144,779
Medical and Health Services Managers Health Care and Social Assistance 769 $ 93,810
Software Developers, Applications Professional and Technical Services 1409 $ 108,342
Occupational Employment Statistics, 2017 Projections and 2024 Projections, Occupational Employment Statistics Wages, Conference Board Help Wanted OnLine
Page 40
D. Career Pathways
• Projected employment and median earnings for key career pathways important to the region
Page 41

Nursing Career Pathway
26,85228,747
56,252
83,950
102,468
$0
$20,000
$40,000
$60,000
$80,000
$100,000
$120,000
Personal CareAides
NursingAssistants
LicensedPractical and
LicensedVocational
Nurses
RegisteredNurses
NursePractitioners
Median Wages
MastersBachelorsCertificateHigh School DiplomaPersonal Care Aides 5,518
6,826Nursing Assistants 6,326
6,881
Licensed Practical and Licensed Vocational Nurses 3,088
3,365
Registered Nurses 9,444
11,006
Nurse Practitioners515 670
0
2,000
4,000
6,000
8,000
10,000
12,000
1 2 3
Employment
2014 2024
Page 42
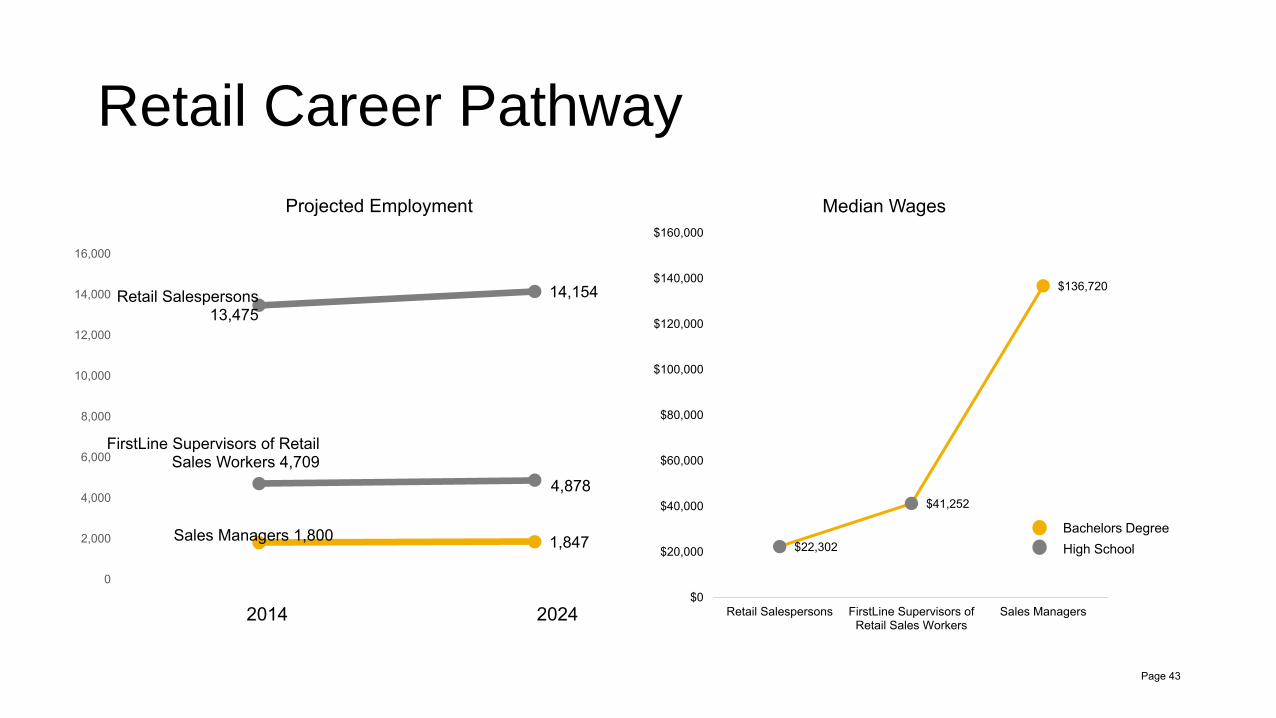
Retail Career Pathway
Retail Salespersons13,475
14,154
FirstLine Supervisors of Retail Sales Workers 4,709
4,878
Sales Managers 1,800 1,847
0
2,000
4,000
6,000
8,000
10,000
12,000
14,000
16,000
Projected Employment
2014 2024
$22,302
$41,252
$136,720
$0
$20,000
$40,000
$60,000
$80,000
$100,000
$120,000
$140,000
$160,000
Retail Salespersons FirstLine Supervisors ofRetail Sales Workers
Sales Managers
Median Wages
Bachelors DegreeHigh School
Page 43
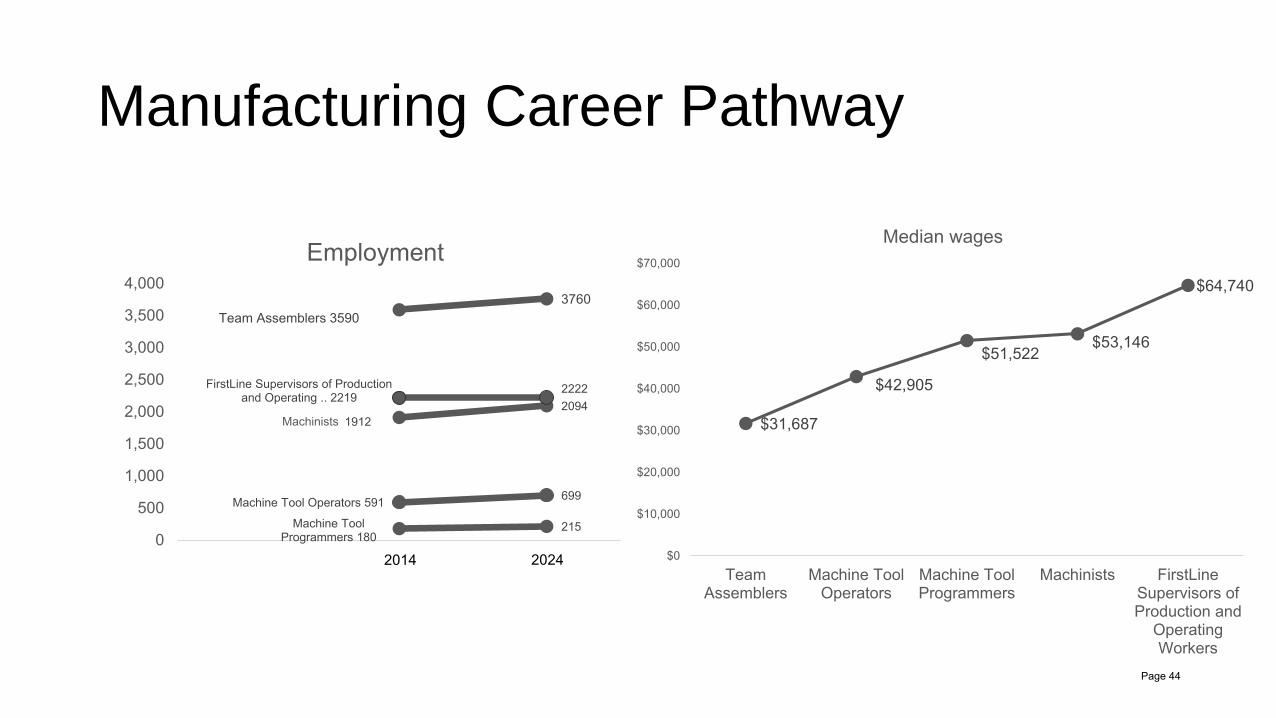
Manufacturing Career Pathway
$31,687
$42,905
$51,522$53,146
$64,740
$0
$10,000
$20,000
$30,000
$40,000
$50,000
$60,000
$70,000
TeamAssemblers
Machine ToolOperators
Machine ToolProgrammers
Machinists FirstLineSupervisors ofProduction and
OperatingWorkers
Median wages
Team Assemblers 35903760
Machine Tool Operators 591 699
Machine Tool Programmers 180
215
19122094
FirstLine Supervisors of Production and Operating .. 2219
2222
0
500
1,000
1,500
2,000
2,500
3,000
3,500
4,000
1 2 3
Employment
2014 2024
Machinists
Page 44
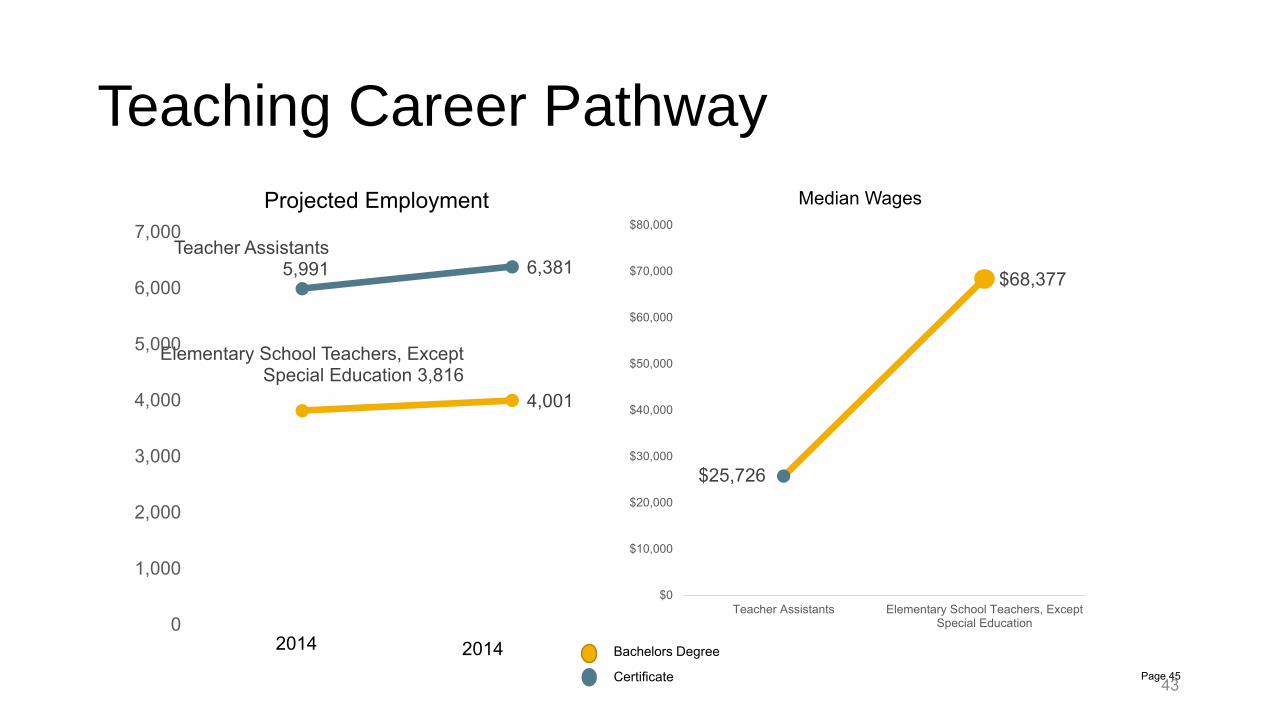
Teaching Career Pathway
43
Teacher Assistants5,991 6,381
Elementary School Teachers, Except Special Education 3,816
4,001
0
1,000
2,000
3,000
4,000
5,000
6,000
7,000Projected Employment
$25,726
$68,377
$0
$10,000
$20,000
$30,000
$40,000
$50,000
$60,000
$70,000
$80,000
Teacher Assistants Elementary School Teachers, ExceptSpecial Education
Median Wages
Bachelors Degree
Certificate
2014 2014Page 45
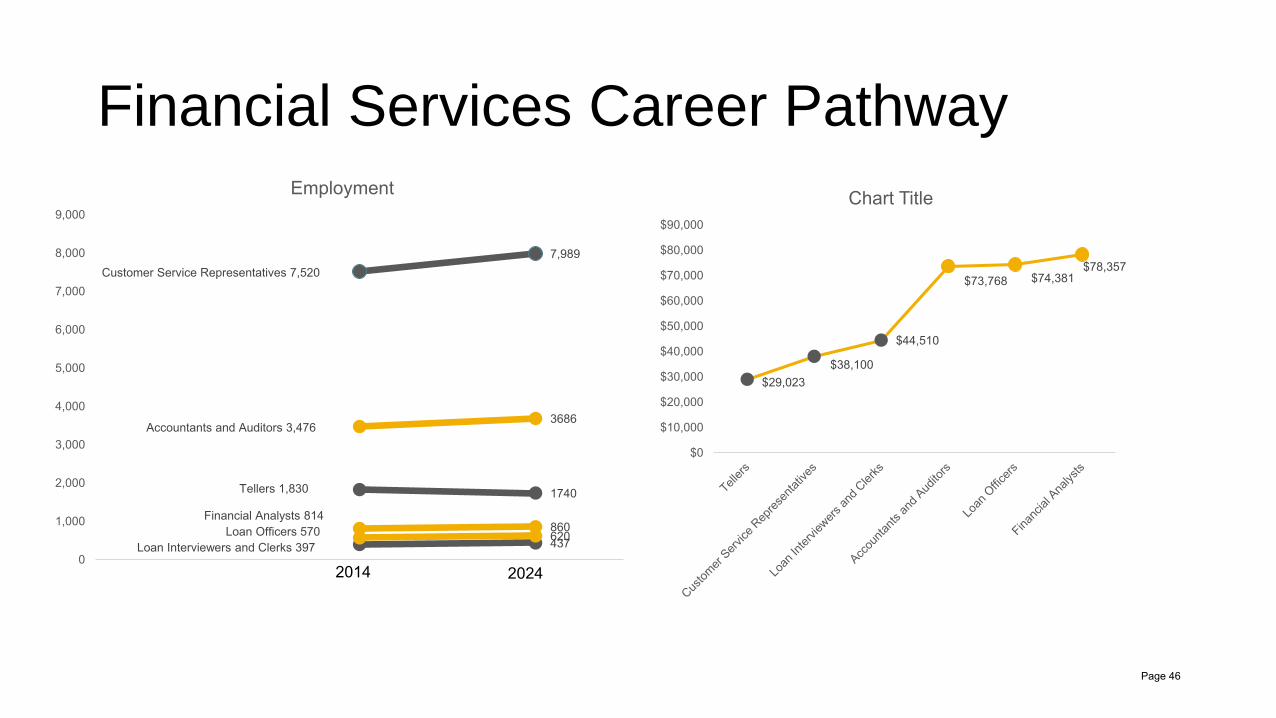
Financial Services Career Pathway
Tellers 1,830 1740
Customer Service Representatives 7,5207,989
Loan Interviewers and Clerks 397 437
Accountants and Auditors 3,4763686
Loan Officers 570 620
Financial Analysts 814860
0
1,000
2,000
3,000
4,000
5,000
6,000
7,000
8,000
9,000
LT Base LT Proj
Employment
2014 2024
$29,023$38,100
$44,510
$73,768 $74,381$78,357
$0
$10,000
$20,000
$30,000
$40,000
$50,000
$60,000
$70,000
$80,000
$90,000
Chart Title
Page 46

Construction Career Pathway
45
261
Construction Laborers 3,0973,226
Carpenters 2,7412,875
Construction Managers 1129 1140
0
500
1,000
1,500
2,000
2,500
3,000
3,500
2014 2024
Employment
Carpenters Helpers
$30,471
$42,237
$54,723$59,726
$92,180
$0
$10,000
$20,000
$30,000
$40,000
$50,000
$60,000
$70,000
$80,000
$90,000
$100,000
Median Annual Wages
Page 47

Industry SummaryConfirming Industry Priorities
• Among key industries, Manufacturing is likely to be under the most demographic pressure as the Northeast workforce ages.
• Manufacturing and Healthcare have the most racially diverse workforces, with nearly one in five workers identifying as non-white. Professional, Scientific, and Technical services has the lowest representation of Hispanics and Latinos, while healthcare has the highest representation.
• In every identified industry, Bachelor’s degree holders make up less than 50% of the workforce. Professional/ scientific/ technical services has the highest percentage of Bachelor’s degree holders, at 47%, while Construction and Transportation offer the most opportunities for those with a high school diploma or below.
Page 48
IV. Supply Gaps
A. Calculating Supply Gap Ratio
B. Calculating Labor Demand & Labor Supply
C. Supply Gap Analysis
Page 49
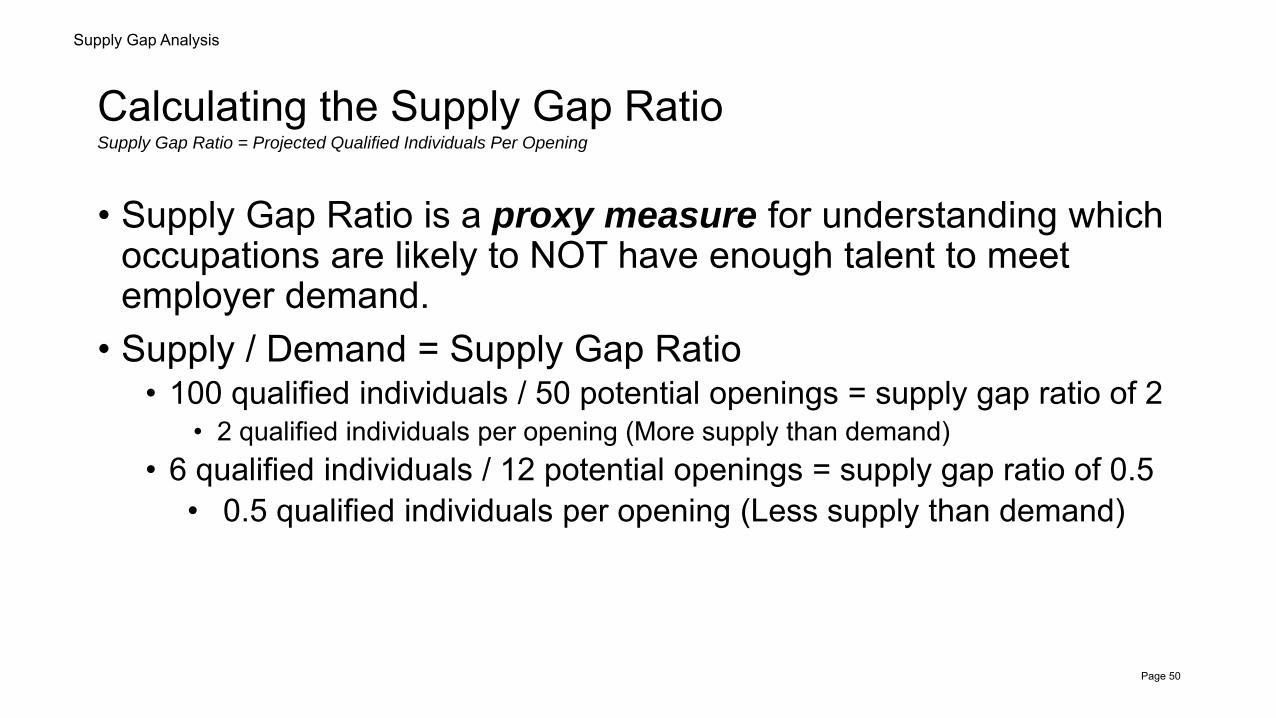
Calculating the Supply Gap Ratio
• Supply Gap Ratio is a proxy measure for understanding which occupations are likely to NOT have enough talent to meet employer demand.
• Supply / Demand = Supply Gap Ratio• 100 qualified individuals / 50 potential openings = supply gap ratio of 2
• 2 qualified individuals per opening (More supply than demand)• 6 qualified individuals / 12 potential openings = supply gap ratio of 0.5
• 0.5 qualified individuals per opening (Less supply than demand)
Supply Gap Analysis
Supply Gap Ratio = Projected Qualified Individuals Per Opening
Page 50
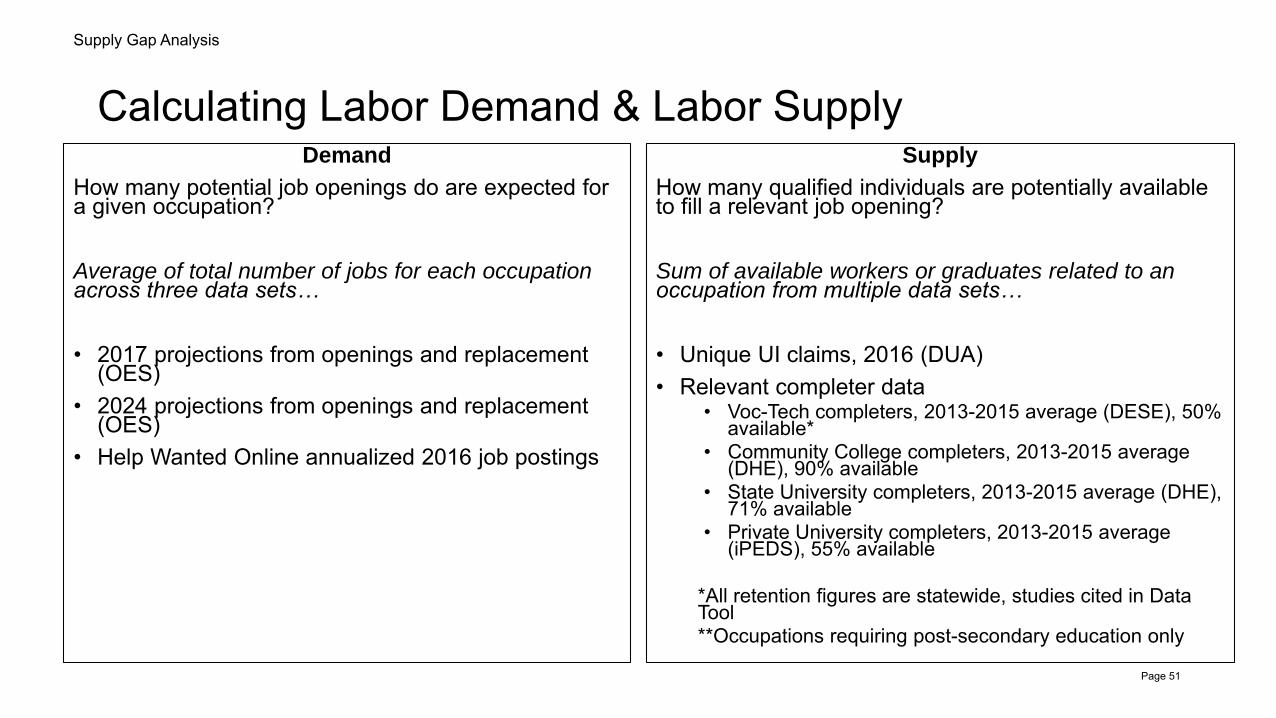
Calculating Labor Demand & Labor SupplyDemand
How many potential job openings do are expected for a given occupation?
Average of total number of jobs for each occupation across three data sets…
• 2017 projections from openings and replacement (OES)
• 2024 projections from openings and replacement (OES)
• Help Wanted Online annualized 2016 job postings
Supply
How many qualified individuals are potentially available to fill a relevant job opening?
Sum of available workers or graduates related to an occupation from multiple data sets…
• Unique UI claims, 2016 (DUA)• Relevant completer data
• Voc-Tech completers, 2013-2015 average (DESE), 50% available*
• Community College completers, 2013-2015 average (DHE), 90% available
• State University completers, 2013-2015 average (DHE), 71% available
• Private University completers, 2013-2015 average (iPEDS), 55% available
*All retention figures are statewide, studies cited in Data Tool**Occupations requiring post-secondary education only
Supply Gap Analysis
Page 51
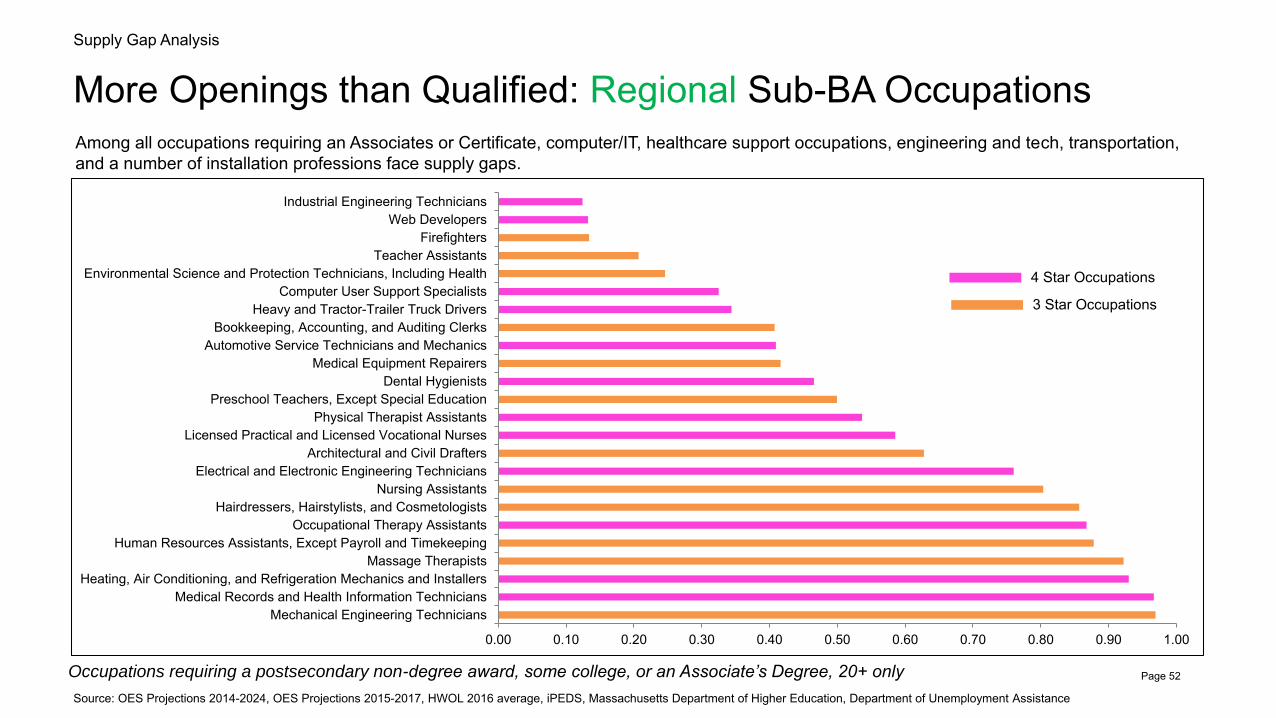
More Openings than Qualified: Regional Sub-BA OccupationsSupply Gap Analysis
Among all occupations requiring an Associates or Certificate, computer/IT, healthcare support occupations, engineering and tech, transportation, and a number of installation professions face supply gaps.
Occupations requiring a postsecondary non-degree award, some college, or an Associate’s Degree, 20+ only
Source: OES Projections 2014-2024, OES Projections 2015-2017, HWOL 2016 average, iPEDS, Massachusetts Department of Higher Education, Department of Unemployment Assistance
4 Star Occupations
3 Star Occupations
0.00 0.10 0.20 0.30 0.40 0.50 0.60 0.70 0.80 0.90 1.00
Mechanical Engineering TechniciansMedical Records and Health Information Technicians
Heating, Air Conditioning, and Refrigeration Mechanics and InstallersMassage Therapists
Human Resources Assistants, Except Payroll and TimekeepingOccupational Therapy Assistants
Hairdressers, Hairstylists, and CosmetologistsNursing Assistants
Electrical and Electronic Engineering TechniciansArchitectural and Civil Drafters
Licensed Practical and Licensed Vocational NursesPhysical Therapist Assistants
Preschool Teachers, Except Special EducationDental Hygienists
Medical Equipment RepairersAutomotive Service Technicians and Mechanics
Bookkeeping, Accounting, and Auditing ClerksHeavy and Tractor-Trailer Truck Drivers
Computer User Support SpecialistsEnvironmental Science and Protection Technicians, Including Health
Teacher AssistantsFirefighters
Web DevelopersIndustrial Engineering Technicians
Page 52
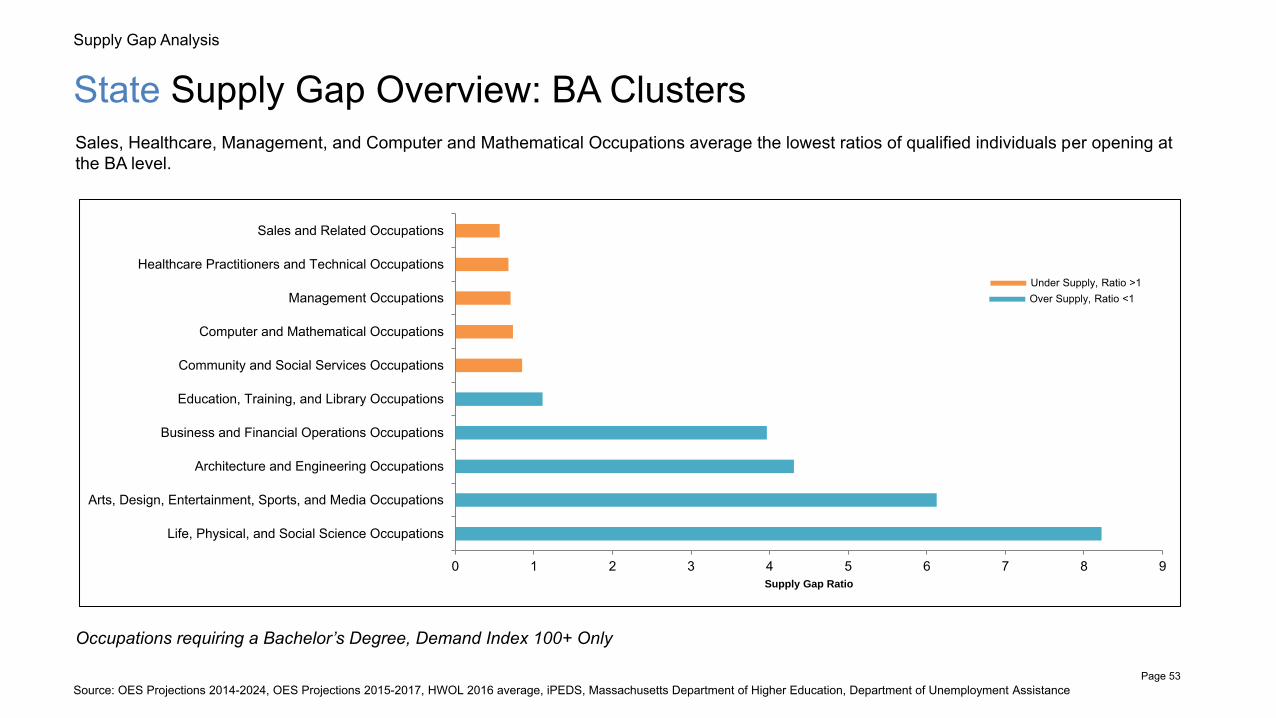
State Supply Gap Overview: BA ClustersSupply Gap Analysis
Sales, Healthcare, Management, and Computer and Mathematical Occupations average the lowest ratios of qualified individuals per opening at the BA level.
Occupations requiring a Bachelor’s Degree, Demand Index 100+ Only
0 1 2 3 4 5 6 7 8 9
Life, Physical, and Social Science Occupations
Arts, Design, Entertainment, Sports, and Media Occupations
Architecture and Engineering Occupations
Business and Financial Operations Occupations
Education, Training, and Library Occupations
Community and Social Services Occupations
Computer and Mathematical Occupations
Management Occupations
Healthcare Practitioners and Technical Occupations
Sales and Related Occupations
Supply Gap Ratio
Source: OES Projections 2014-2024, OES Projections 2015-2017, HWOL 2016 average, iPEDS, Massachusetts Department of Higher Education, Department of Unemployment Assistance
Under Supply, Ratio >1Over Supply, Ratio <1
Page 53

More Openings than Qualified: State BA OccupationsSupply Gap Analysis
Occupations requiring a Bachelor’s Degree, 4 and 5 stars, Demand Index 100+ only
0 0.1 0.2 0.3 0.4 0.5 0.6 0.7 0.8
Computer and Information Systems ManagersDatabase Administrators
Software Developers, Systems SoftwareMiddle School Teachers, Except Special and Career/Technical Education
Accountants and AuditorsManagement Analysts
Architectural and Engineering ManagersIndustrial Engineers
Elementary School Teachers, Except Special EducationConstruction Managers
Sales Representatives, Wholesale and Manufacturing, Technical and Scientific…Human Resources Specialists
Marketing ManagersComputer Systems Analysts
Network and Computer Systems AdministratorsPublic Relations and Fundraising Managers
Human Resources ManagersSales Engineers
Medical and Health Services ManagersSoftware Developers, Applications
Civil EngineersRegistered Nurses
Supply Gap Ratio
A number of 4 and 5 star occupations, largely in STEM fields, are in short supply.
Source: OES Projections 2014-2024, OES Projections 2015-2017, HWOL 2016 average, iPEDS, Massachusetts Department of Higher Education, Department of Unemployment AssistancePage 54

Labor Supply Gap SummarySupply Gap Analysis
Associate’s, Some college, Post-secondary Certificate• In the Northeast Region, a specific set of 3 and 4 star
occupations face supply gaps – most notably in healthcare support, computer support/IT, installation, and transportation fields.
Bachelor’s Degree• Across the State, we expect supply gaps in 4 and 5 star
occupations primarily in STEM fields, with an emphasis on Healthcare and Computer and Mathematical occupations.
Page 55
Merrimack Valley Workforce Investment Board
Local Area Information Related to Adult Education and Literacy
1. ALIGNMENT WITH ADULT EDUCATION AND LITERACY ACTIVITIES
Several years ago, the MVWIB Planning Committee and Board stated that we considered WIA and then WIOA Title II programs the principal source of workforce academic remediation. The Planning Committee reasoned that there was not enough Title I funding to continue being a co-provided of lower level academic and ESOL remediation so the MVWIB instituted a requirement that adults and dislocated workers enrolled in occupational skills programs must be at the 6.9 grade level or higher. For WIOA Title I occupational skills training youth were required to be at 7.9 or higher and have a high school diploma or GED/HiSet.
MVWIB would continue to fund academic remediation at skills training programs to adults and to youth with high school diplomas or GED/HiSet when they were TABE assessed at having below 9th grade skills. There are unfortunately many such individual in Merrimack Valley inner cities.
Without the above mentioned policies, the size of work authorized foreign or Puerto Rican migration into Lawrence, Methuen and Haverhill, and these migrants efforts to gain employment, would result in WIA/WIOA training funds being inordinately dedicated to them. Without the guidelines, small amounts of WIOA Title I training fund would be dedicated to second generation Hispanics and other lower income people.
But from the outset, MVWIB stated that it would waive its 6.9 or 7.9 grade level requirement when specific individuals were recommended for job skills training by WIA/WIOA Title II funded agency directors. These waived-in individuals had to demonstrate outstanding and rapid progress in ESOL or ABE learning and have excellent class attendance. The VWCC director, training provider and MVWIB Executive Director must also all agree on the individuals to be exempted from MVWIB ESOL/ABE level requirements. Roughly twenty of all such instances occur each year.
Going forward, there are currently six (6) adult education and literacy activity directors on the VWCC/MVWIB Partner committee and we will be meeting at least once quarterly to facilitate cross service referrals and the achievement of other partnership goals. We also expect to continue to have an ABE/ESOL contractor housed at our Lawrence Career Center. So we expect continuous improvement within the parameter outlined above.
Page 56
2. . EDUCATIONAL AND SERVICE NEEDS OF PRORITY POPULATIONS
About 75% of the people who we serve are either low-income or in poverty. They have the well-known characteristics of low income people or poor people. Our services are most frequently requested by people with Limited English Proficiency (LEP). Over the past six years, the City of Lawrence, where this situation is most acute, improved its school drop-out rate from about 50% to about 40%. Nevertheless, Lawrence has one of the highest drop-out rates in Massachusetts and continues struggling to rise above being in the lowest 10% of school systems in the state. A similar dynamic exists in parts of Methuen and Haverhill.
Other priority area populations include veterans, physically, mentally, or psycho-socially disabled people, people on varying degrees of public assistance, and released offenders. We strive to serve these people through WIOA and through public and private grants focused on them.
3. PROJECTED NEED FOR ADULT EDUCATION AND ESOL PROGRAMS
Some area employers operate under the MA DOR or IRS radar and the informal economy continues to grow. Many documented and undocumented area residents work for informal economy employers on a temporary or otherwise haphazard basis at below the minimum wage. Many of these individuals will become work-authorized through marriage or family reunification and we have yet to see signs of abatement in their numbers.
Hispanics and other LEP continue to integrate and rise in the US but there continues to be others coming from abroad to take their place. We consequently expect today’s numbers to continue so LEP people will continue to be our priority population for the foreseeable future.
4. CAREER PATHWAYS FOR ABE AND ESOL POPULATIONS
Entry level health care and manufacturing both offer well defined career pathways for area ABE and ESOL populations. We have also had some success with Brownsfield clean-up and lead or asbestos abatement jobs, as well as with some horticultural oness. MVWIB hopes to also grow training into ground water management. People at no less than level 6 ABE/ESOL also make progress as truck drivers and equipment operators but these areas may be sooner impacted by automation and robotics.
Page 57
SECTION II: WORKFORCE BOARD STRATEGIC PLAN
STRATEGIC VISION
The Strategic Plan demonstrates utilization of “business intelligence” to develop data driven strategies based on analysis of Labor Market Information. The Strategic Plan includes strategies for the Board to convene, broker and leverage partnerships with key stakeholders, e.g., WIOA Core Partners, career and technical education, community colleges and other higher education entities, organized labor, and others.
The Strategic Plan develops and/or replicates successful career pathway models and industry sector interventions that involve significant employer engagement activity and includes use of job driven strategies & innovative use of work‐based models of training interventions – OJT, apprenticeship, internship, etc. It describes the role of the board in the development of the region’s comprehensive economic development strategies as well as the coordination of the workforce activities with economic development strategies.
Page 58
Strategic Plan 2011-2016
Revised October 2013
MERRIMACK VALLEY
WORKFORCE INVESTMENT BOARD
Page 59
Overview
During the past three years, the Merrimack Valley Workforce Investment Board (MVWIB) responded to cross-WIB region business and industry workforce needs by actively participating in the following:
-A State Energy Sector Program (SESP) with the Greater Lowell and North Shore WIBs, where the MVWIB itself job placed about thirty new clean energy workers and helped upgrade the skills of thirty incumbent workers. This activity is also part of the MVWIB High Performing WIB three workforce development focus areas.
-A Regional Innovation Grant (RIG) with the Greater Lowell and New Hampshire WIBs where the current MVWIB Deputy Director wrote the Plan and Final Report.
-The Northeast Advanced Manufacturing Collaborative (NAMC), with the Greater Lowell, Metro North and North Shore WIBs as well three Community Colleges and many Career Centers and Vocational High Schools. It is still very much a work in progress but also one of our focus areas.
-MVWIB is an active participant in the Mass Workforce Board Association which regularly addresses cross-WIB employer issues
MVWIB has also budgeted considerable Valley Works Career Center (VWCC) IT staff time to help develop new, Statewide IT systems.
Our Board Chairman, Joseph Bevilacqua, heads one of the largest and most active Chambers of Commerce in Massachusetts and it crosses several WIB regions. He and Governor Patrick are Co- Chairmen of the MA Workforce Investment Board. He, other Board members and the Merrimack Valley Workforce Investment Board Executive Director are in constant contact with area business people and we always try to be responsive to their needs.
Mr. Bevilacqua is also chairman of the Massachusetts Economic Development Council and keeps the MVWIB and staff informed of MA economic development strategies. This document includes charts and document citations that demonstrate the MVWIB’s ability to analyze data relevant to both the workforce and economic development systems.
MVWIB staff members are on the board of the Merrimack Valley Planning Commission (MVPC) and the Merrimack Valley Economic Development Council (MVEDC). We have participated in the development of the following goals for at least the last three years. Their current goals are as follows:
MVPC Economic Development Goals:
*Comprehensive Economic Development Strategy (CEDS)
*Business Incentives and Districts *Data/Technical Assistance *Brownfields Abatement *Small Business Loan Fund
MVEDC Goals:
*I-93 Tri-Town Interstate Completion
* Reinforcing industry clusters as economic drivers
* Strengthening the Partners for Progress
Page 60
The MVEDC is currently headed by David Tibbets, former MA Secretary of Housing and Economic Development. The MVWIB was one of the Board members who voted to select him as head of MVEDC. Since then, we have supported MVEDC organizational goals related to event and project planning via the Merrimack Valley Partners for Progress. The Partners bring together Northern Essex Community College, Middlesex Community College, area Chambers of Commerce as well as the Greater Lowell Workforce Investment Board and MVWIB to work together on more integrated and aligned services to area employers. We have provided LMI information that helped shape its employer focus and also prevented the Partners from entering into a bank worker trainee program with Goldman Sachs because we knew that area small banks thought that Goldman’s reputation was tarnished by the 2008 economic meltdown.
The Merrimack Valley Planning Commission (MVPC) is currently headed by Dennis DiZoglio, a former mayor of the City of Methuen, which abuts Lawrence. We are a member of their leadership team and shared the LMI information which helped shape their September 2012 Clean Energy Action Plan and their 2013 MV Comprehensive Economic Development Strategy (CEDS). The MVWIB Executive Director was one of three members on the Haverhill Garage Development Plan which reinforced MVPC’s Mill Space refurbishment goals. At a March 23, 2013 quarterly board meeting, the MVWIB Executive Director suggested that MVPC board prioritize its many projects in anticipation of ongoing sequester cuts and that is a current work in progress. Deputy Director Barbara Zeimetz or the Executive Director attended virtually all of MVPCs CEDS meetings and directly influenced outcomes. As a result of those efforts MVWPC and MVWIB are now working together to promote local hiring for municipal clean energy updates. A copy of the draft document is in the attachments.
The MVEDC and MVWP both have regions that include communities outside of our Workforce Investment Area (WIA). The Merrimack Valley Workforce Investment Board (MVWIB) serves fifteen cities and towns in the Northeast section of Massachusetts sometimes known as the Lower Merrimack Valley. Its cities and towns consist of: Andover, Amesbury, Boxford, Groveland, Georgetown, Haverhill, Lawrence, Methuen, Merrimac, Newbury, Newburyport, North Andover, Rowley, Salisbury, and West Newbury. The region has an especially diverse population with large cultural, educational and economic differences amongst its constituent communities. Most of our WIA Adult, Dislocated Worker and Youth funds serve low income people and most of them reside in the cities of Lawrence, Haverhill and Methuen
The Merrimack Valley Workforce Investment Board charters and oversees the ValleyWorks Career Center, which has two locations, one in Lawrence and one in Haverhill. ValleyWorks staff consist of City of Lawrence Department of Training and Development employees and State employees from the Commonwealth’s Department of Career Services. ValleyWorks has historically been one of the most visited centers in the State with most on-site Lawrence customers generally being low-income minorities while those visiting the Haverhill site being a mix of low-income and middle class white and minority customers. From 2011 to 2013, about 15,000 individuals per year became ValleyWorks member and about six hundred employers were annually served. The Centers regularly achieved or exceeded its planned performance levels. Apart from a basic dashboard, this package contains several examples of how MVWIB staff keep the Board informed of various situations and of how VWCC and MVWIB staff perform in dealing with them.
In addition to the oversight of the local Career Center, the MVWIB brings additional resources and oversight capacity to this region’s training vendors. We have historically worked with about fifty individual vendors per year using WIA and non-WIA funds. Our non-WIA funding generally comes from CommCorp, other State and Federal departments and from the private sector. We also work
Page 61
with other regions and organizations that have different sets of funding streams and vendors which we subcontract using shared funds.
The MVWIB develops joint strategies and works with vendors and public and private partners to assist the following specific types of individuals, most of whom are low-income, and area businesses and industry types, most of which have a noticeable area presence:
-limited-English speakers -immigrants and refugees -ethnic or racial minorities -veterans -the physically or mentally disabled
- adult and youth ex-offenders -high school graduates and drop-outs -the unemployed or underemployed
-hospitals and medical clinics -long-term care facilities -advanced manufacturers, many of which are defense contractors
-lead and asbestos abatement companies1
-companies in need of specialized IT -trucking and transportation companies -food processing/manufacturers -clean energy companies
The Merrimack Valley Workforce Investment Board (MVWIB) began to develop its last Strategic Plan in September of 2008. That effort responded to the State’s High Performing Workforce Investment Board (HPWB) initiative. (In October 2010, MVWIB received HPWIB certification, in part due to the quality of its Strategic Plan.)
Every effort was made to ensure that we received information from both workforce stakeholders and entities involved in economic development. Stated perspectives reflect the priorities and needs of critical employment sectors in the region, and are aligned with local economic development efforts. They also embrace the three comprehensive workforce priorities outlined by the Governor:
Build the capacity of the workforce system
Address the regions skill gaps in key industries
Enhance the youth pipeline to employment
1] Health Care, 2] Advanced Manufacturing and 3]Green/Life Sciences were chosen as this region’s primary workforce development foci. Massachusetts Job Vacancy Survey indicated that the healthcare field had the most numerous and frequent vacancies. The majority of this region’s manufacturing sector jobs required an Associate’s Degree or higher. Green jobs were hard to track and quantify because their definitions were flexible and they may occur in any type of business or industry. Since then, we’ve found that clean energy and site abatement jobs are more easily defined..
At the time the plan and the HPW paperwork were started, 4.8% of Merrimack Valley WIA residents were unemployed (December 2007). At the time of initial plan development, members used the Massachusetts Job Vacancy Survey2 which was based on fourth quarter of 2007 employment numbers. 7700 employers across the Commonwealth responded to the 2007 survey. It indicated that just 8% of employers thought they would be cutting jobs at their businesses while 30% expected to increase hiring and 53% expected to keep their employment levels about the same.
1 BLS data indicates that the City of Lawrence has more abatement workers per capita than any other municipality in the
United States 2
Massachusetts Job Vacancy Survey, Massachusetts Office of Workforce Development, 4th
Quarter 2007.
Page 62

Unfortunately, that did not happen. Instead, virtually all but high-end scientific and professional services laid-off workers. At the time our strategic plan was developed, we did not know that the MVWIA would have nearly twice as much unemployment for at least the next six years. Nor did we know that our annual WIA funding would drop by over 30% in three years (counting ARRA funds the drop would be greater).
At the time, Board, employer partner, and staff discussions focused on ensuring that employers in critical Merrimack Valley employment sectors would have sufficient numbers of prepared workers to fill anticipated vacancies. We continue to consider this a key goal but we now temper it with the realization that we must help as many residents find good jobs wherever they can using a lot less workforce development money. The following indicates our region’s, and most of our principle cities’ above average underemployment rates in FY2013.
As will later be noted, the UI rate does not fully capture many area residents’ difficult situation. Many more than the State average are disconnected from the labor force and they do not register in UI numbers.
MVWIB plans have been more tentative since the great recession. The economic outlook improves then falters, usually because of world events, the growing national debt, and the political arguments on how to deal with it. The most recent unemployment data as of this writing (7/2013) has Merrimack Valley WIA unemployment increasing year-on-year to 8.5%, while the Massachusetts rate also increased year- on-year to 7.2%)3.
We now consider the Merrimack Valley workforce system’s first priority to be ensuring that the immediate needs of unemployed individuals are met as best possible with reduced funding in an era of unclear global, national, political and regional developments. We focus much of our planning on how to deal with current and future cuts and aim to do our best to attain the performance goals annually provided to the Division of Career Services (DCS).
Due to UI On-line’s belated and imperfect arrival, our short-term plan also consist of ongoing adjustments to the new realities occasioned by it. In this context we are conducting a thoughtful and thorough analysis of the regions’ workforce and employment needs to ensure that diminishing dollars are most effectively spent in facilitating Merrimack Valley residents access to the best jobs they qualify for. But we also continue to strive to support businesses that are creating the products and services that meet and will meet future consumer demands. As majority board members, they were this plan’s the primary shapers.
3 Massachusetts Unemployment Trends for Merrimack Valley Service Delivery Area July 2013
Page 63

We use currently available media news, labor market information, workforce demographics, industry projections and input from employers in key industries to adjust our short- and long-term strategic plan as needed in a quickly changing economic and political landscape. Board, partners and staff also discuss various workforce development funding scenarios and how to react to them appropriately at various staffing and operational levels.
The below roughly illustrates how we use information.
Future workforce development funding levels, how the nation handles the growing deficit, the effective reform of K-12 and college education systems, how well the U.S. competes and leads the global economy, and the long-term impact of UI on-line are all very uncertain. To meet current national, State and regional challenges, the board has voted to create various signposts going forward. Our last strategic plan version built on past success and lessons learned through a number of key initiatives and collaborations. But the past now seems less useful for concrete future planning. To maintain the flexibility current times seem to demand, MVWIB’s newly compiled and updated 2011- 2016 Strategic Plan builds on past goals while offering new guiding principles to shape our reactions to changing events.
Our strategic plan is roughly organized on the basis of the Strategic Principles recently approved by MVWIB through the year 20164. After elaborating on different aspects of those principals, we list goals, activities, and benchmarks designed to measure and evaluate the impact of the Strategic Plan over its remaining three years.
MVWIB 2011-2016 Strategic Plan Principles
Dislocated and ‘Adult’ Workers Principle 1. Continue to focus our regional workforce development job pipeline on advanced manufacturing, entry to low and mid-level health care, green technology and other emerging industries as stated in our High Performing WIB document but do not lessen support to other areas that have job openings and good wages.
Despite the post-2008 economic slowdown, this region’s advance manufacturing companies continue to state that they need skilled machinists and entry level workers to replace aging machinists on the point of retirement and to allow younger in-house personnel to upgrade so that they can fill more senior positions. But formula WIA money has been steadily reduced over the past three years. This region cannot sustain adequate staffing with just WIA formula funds. It has qualified for various National Emergency Grants (NEGs) to provide concentrated services for dislocated workers
4 MVWIB October 10, 2013 Annual Meeting minutes featuring Secretary Goldstein as principle speaker
Page 64
affected by large closings or downsizings in various employment sectors that may not be in advanced manufacturing or our two other stated focus areas.
Without NEG support, all of our VWCC unemployed or incumbent worker services, and all of our employer services would suffer from a cumulative WIA formula funding cut of over 30% from FY 2011 to FY 2014. We cannot concentrate on just advanced manufacturing, entry to low and mid-level health care and green technology but instead need to go to the areas where NEG grants indicate there is most need and where significant NEG financial support is provided.
It may also not be best to direct an inordinate number of unemployed and underemployed customers to those three sectors because each of them is extraordinarily dependent on Federal and State government decisions which may overturned more suddenly than is normally the case with market forces. As far as WIA ITAs go, we plan to instead treat our focus areas as we treat any other business sectors – if LMI information indicates that there are immediate or soon-to-be job offerings, we inform appropriate customers of the same and let them choose.
It is difficult to gauge future regional and Massachusetts advanced manufacturing job numbers. There is an undoubted need to replace aging machinists with younger ones and there may be tens of thousands of manufacturing job openings occurring in a few years. But Massachusetts is expensive compared to other parts of the country and the world. Although fracking may lower the cost of manufacturing in America, New York and New England have little of it. Fracking is also likely to lower worldwide energy costs to the advantage of other manufacturing centers. Robotic technology also seems to be reducing the number of employees needed to manufacture goods.
But there are few obvious MVWIA options to new manufacturing growth and MVWIB strives to be involved in efforts to sustain it. So the MVWIB is an active member of the Northeast Advanced Manufacturing Consortium (NAMC) which replaced the Northeastern Massachusetts Customized Manufacturing Partnership (NMCMF). NAMC has had a rough beginning, in part because the partnership now includes another WIB along with the three that previously formed NMCMF, and also three Community Colleges and at least five vocational school - while again working with just a
$500,000 two year grant.
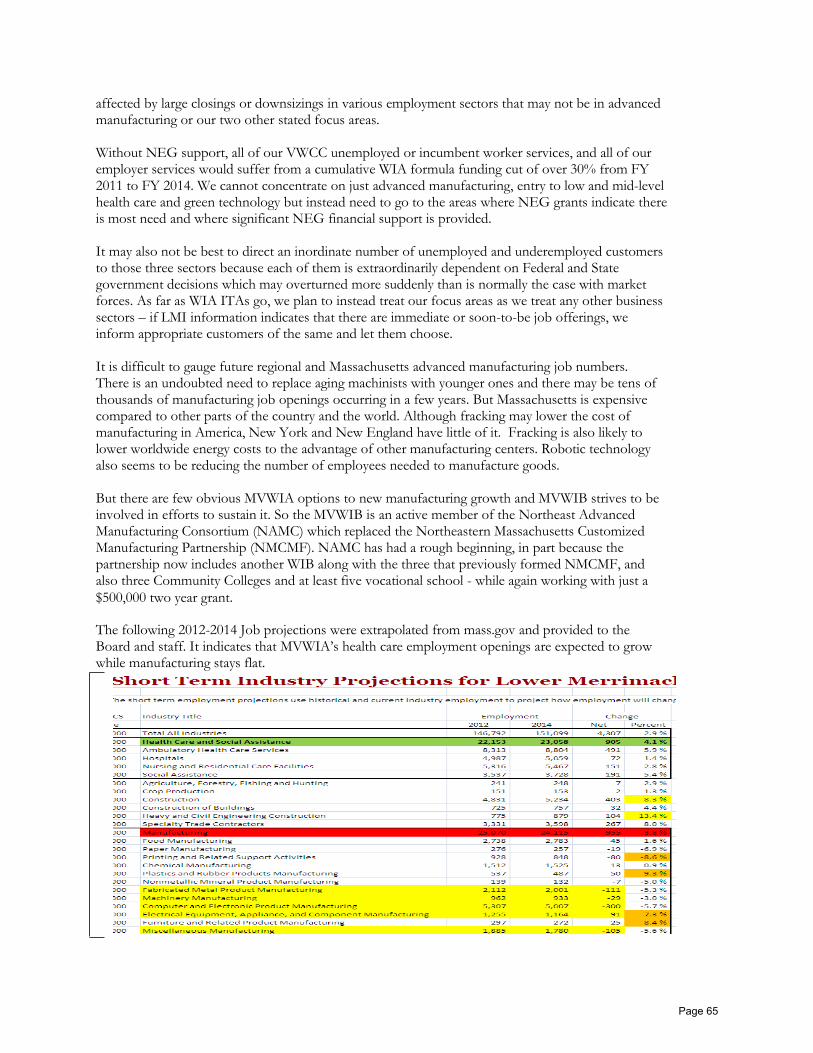
The following 2012-2014 Job projections were extrapolated from mass.gov and provided to the Board and staff. It indicates that MVWIA’s health care employment openings are expected to grow while manufacturing stays flat.
Page 65
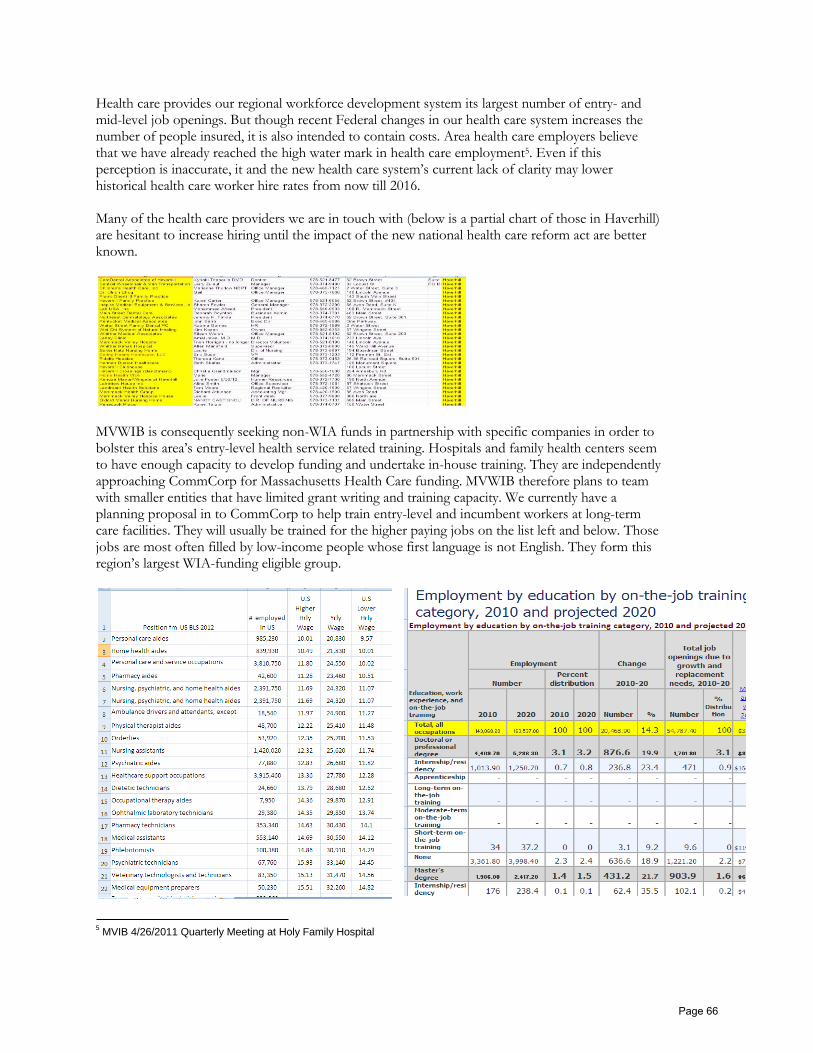
Health care provides our regional workforce development system its largest number of entry- and mid-level job openings. But though recent Federal changes in our health care system increases the number of people insured, it is also intended to contain costs. Area health care employers believe that we have already reached the high water mark in health care employment5. Even if this perception is inaccurate, it and the new health care system’s current lack of clarity may lower historical health care worker hire rates from now till 2016.
Many of the health care providers we are in touch with (below is a partial chart of those in Haverhill) are hesitant to increase hiring until the impact of the new national health care reform act are better known.
MVWIB is consequently seeking non-WIA funds in partnership with specific companies in order to bolster this area’s entry-level health service related training. Hospitals and family health centers seem to have enough capacity to develop funding and undertake in-house training. They are independently approaching CommCorp for Massachusetts Health Care funding. MVWIB therefore plans to team with smaller entities that have limited grant writing and training capacity. We currently have a planning proposal in to CommCorp to help train entry-level and incumbent workers at long-term care facilities. They will usually be trained for the higher paying jobs on the list left and below. Those jobs are most often filled by low-income people whose first language is not English. They form this region’s largest WIA-funding eligible group.
5 MVIB 4/26/2011 Quarterly Meeting at Holy Family Hospital
Page 66
As seen above, among many other sources, the MVWIB uses Bureau of Labor Statistics to help keep track of current health care employment trends, wages, and projected educated and training needs.
The chart indicates that ongoing and numerous entry-level hiring is expected. The MVWIB allocates more WIA funding to healthcare worker training than to any other employment sector. Although we sometimes train people for mid-level health job credentials, many of those are expensive and take more than one year to complete. Current funding levels advise against them and we instead support less expensive and briefer entry-level health care training. But we are concerned that hiring rates may slow in all health sectors and consequently look for increased, health care targeted funding in close cooperation with area employers. That is what we are currently doing with long-term care facilities and what we plan to do with other entities as opportunity presents.
***
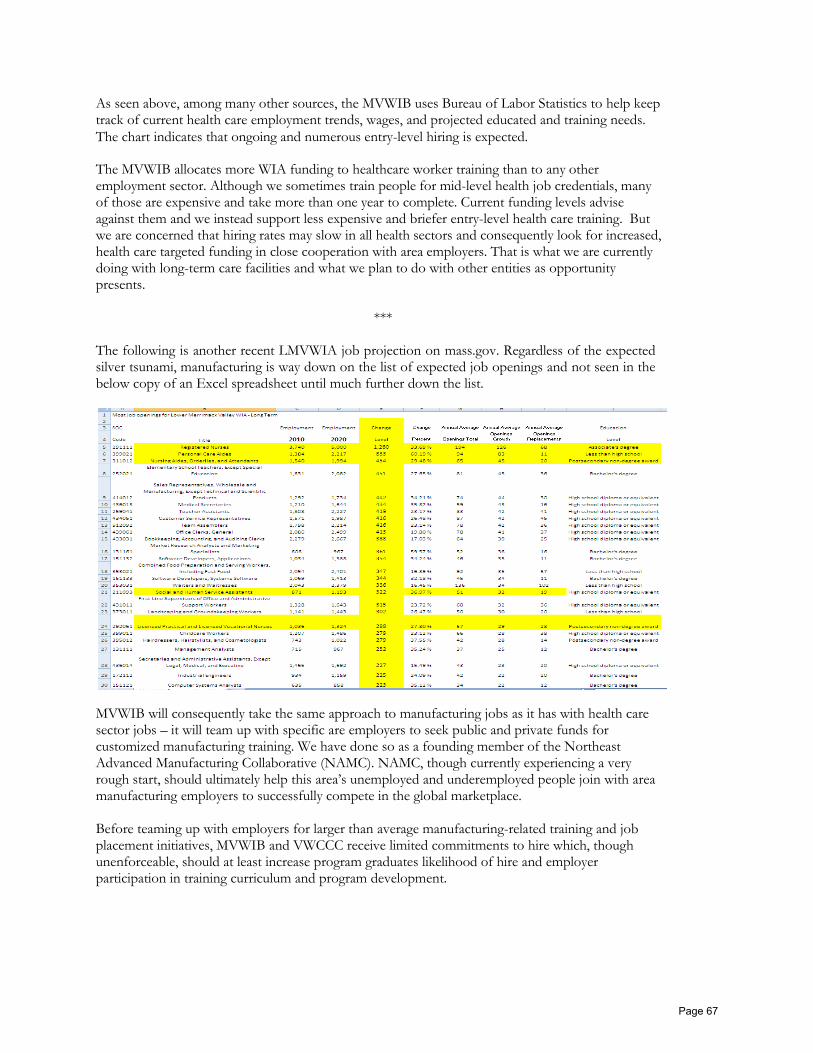
The following is another recent LMVWIA job projection on mass.gov. Regardless of the expected silver tsunami, manufacturing is way down on the list of expected job openings and not seen in the below copy of an Excel spreadsheet until much further down the list.
MVWIB will consequently take the same approach to manufacturing jobs as it has with health care sector jobs – it will team up with specific are employers to seek public and private funds for customized manufacturing training. We have done so as a founding member of the Northeast Advanced Manufacturing Collaborative (NAMC). NAMC, though currently experiencing a very rough start, should ultimately help this area’s unemployed and underemployed people join with area manufacturing employers to successfully compete in the global marketplace.
Before teaming up with employers for larger than average manufacturing-related training and job placement initiatives, MVWIB and VWCCC receive limited commitments to hire which, though unenforceable, should at least increase program graduates likelihood of hire and employer participation in training curriculum and program development.
Page 67
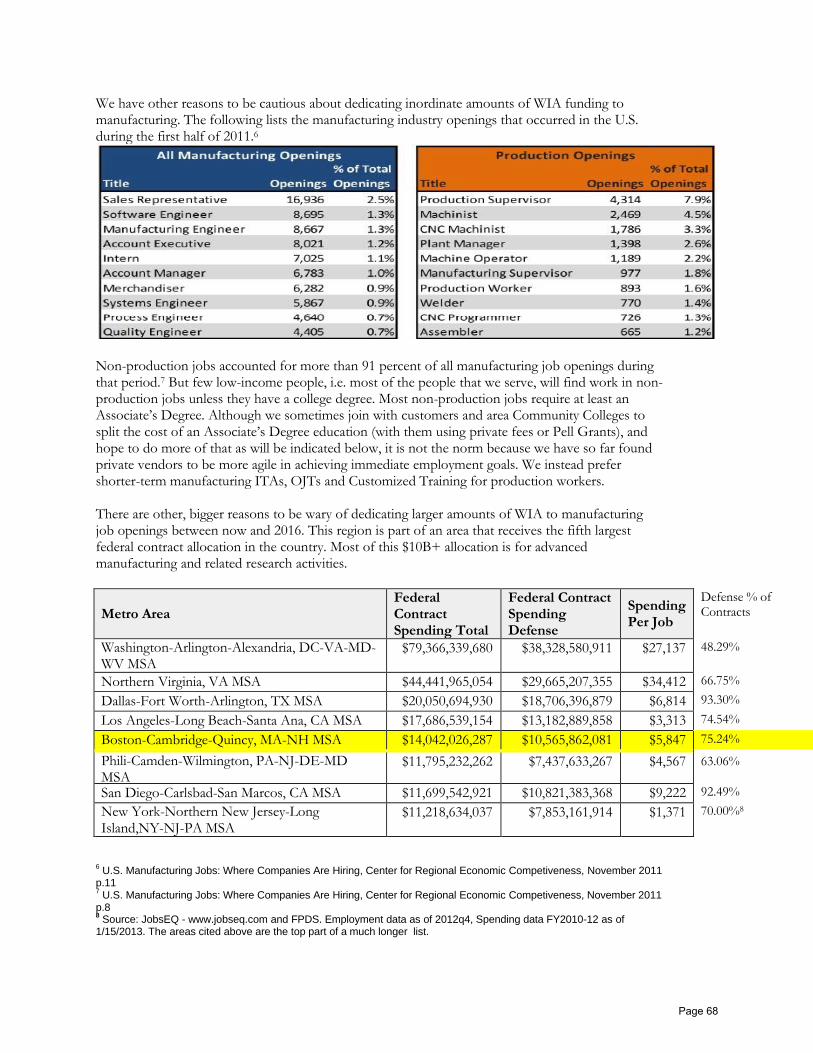
We have other reasons to be cautious about dedicating inordinate amounts of WIA funding to manufacturing. The following lists the manufacturing industry openings that occurred in the U.S. during the first half of 2011.6
Non-production jobs accounted for more than 91 percent of all manufacturing job openings during that period.7 But few low-income people, i.e. most of the people that we serve, will find work in non- production jobs unless they have a college degree. Most non-production jobs require at least an Associate’s Degree. Although we sometimes join with customers and area Community Colleges to split the cost of an Associate’s Degree education (with them using private fees or Pell Grants), and hope to do more of that as will be indicated below, it is not the norm because we have so far found private vendors to be more agile in achieving immediate employment goals. We instead prefer shorter-term manufacturing ITAs, OJTs and Customized Training for production workers.
There are other, bigger reasons to be wary of dedicating larger amounts of WIA to manufacturing job openings between now and 2016. This region is part of an area that receives the fifth largest federal contract allocation in the country. Most of this $10B+ allocation is for advanced manufacturing and related research activities.
6
U.S. Manufacturing Jobs: Where Companies Are Hiring, Center for Regional Economic Competiveness, November 2011 p.11 7
U.S. Manufacturing Jobs: Where Companies Are Hiring, Center for Regional Economic Competiveness, November 2011 p.8 8
Source: JobsEQ - www.jobseq.com and FPDS. Employment data as of 2012q4, Spending data FY2010-12 as of 1/15/2013. The areas cited above are the top part of a much longer list.
Metro Area
Federal Contract Spending Total
Federal Contract Spending Defense
Spending Per Job
Defense % of Contracts
Washington-Arlington-Alexandria, DC-VA-MD- WV MSA
$79,366,339,680 $38,328,580,911 $27,137 48.29%
Northern Virginia, VA MSA $44,441,965,054 $29,665,207,355 $34,412 66.75%
Dallas-Fort Worth-Arlington, TX MSA $20,050,694,930 $18,706,396,879 $6,814 93.30%
Los Angeles-Long Beach-Santa Ana, CA MSA $17,686,539,154 $13,182,889,858 $3,313 74.54%
Boston-Cambridge-Quincy, MA-NH MSA $14,042,026,287 $10,565,862,081 $5,847 75.24%
Phili-Camden-Wilmington, PA-NJ-DE-MD MSA
$11,795,232,262 $7,437,633,267 $4,567 63.06%
San Diego-Carlsbad-San Marcos, CA MSA $11,699,542,921 $10,821,383,368 $9,222 92.49%
New York-Northern New Jersey-Long Island,NY-NJ-PA MSA
$11,218,634,037 $7,853,161,914 $1,371 70.00%8
Page 68

If defense funding continues to go down as needed and as automatically recurs in the Federal sequester, this area’s advanced manufacturing may suffer a significant downturn before 2016. This is somewhat ameliorated by Raytheon, our largest regional employer’s diverse number of foreign defense and other contracts9. But even if the Sequester doesn’t impact this, manufacturing robotics and 3-D printing may reduce the number of manufacturing job openings that will occur as a result of older workers retirement. Though they are likely to keep non-production jobs in MA, if the Commonwealth doesn’t find ways to reduce them, larger companies’ production facilities can simply go to other parts of the country or overseas where there are fewer overhead costs. (Security and quality control issues elsewhere will prevent a total displacement of MA manufacturing, we here are concerned with continuous percentage drops.)
That is not to say that we should not seek to help bolster area manufacturer’s global competiveness. Manufacturing is this region’s greatest wealth producer and may still be the second largest employment sector, though that is hard to see with the increasing number of retail and service staff all around us. Without manufacturing growth we are likely to continue our national decline. But given our uncertain and limited funding situation, and the possibility that ongoing issues will not be significantly addressed and ameliorated in the next three years, we hesitate to allocate large amounts of WIA training funding to manufacturing without at least some employer guarantees between now and 2016. As stated above we will instead seek manufacturer agreements to hire before we persuade large numbers of low-income people to pursue careers in manufacturing.
***
This region has a large number of ‘green’ jobs and is possibly the MA WIA with their greatest number throughout the State. Growing green jobs, especially those related to energy improvement, have been a priority for both President Obama and Governor Patrick. But it is likely that many green jobs depend on subsidies from Federal and MA government. Consequently, though their numbers are likely to grow in the long-term, growth is likely to stop and the sector even shrink if Republicans attain control of both houses of Congress in 2014.
Green sector job growth reduction and possible contraction are concern from now till 2016 both due to politics and because of our national debt’s inordinate growth. Short-term subsidy cuts are possible in virtually all green sectors. But MVWIB has not reduced its non-WIA funded efforts in this area. We have successfully applied for two Environmental Protection Agency Grants and a Clean Energy Sector grant and were also a past member of a CommCorp State Energy Center Grant.
We are currently negotiating an agreement with the Merrimack Valley Planning Commission (MVPC) where we will dedicate WIA and private funds to train prospective and incumbent workers for clean energy municipal infrastructure improvement projects. If successful, this will be a large new initiative. Because of its importance, we include a draft copy of the proposed MVPC MOU in the attachments.
Dislocated and ‘Adult’ Workers Principle 2. Narrow who is considered marketable when unemployment is high and expand who is considered marketable when unemployment is low. This especially applies to people formerly employed in high unemployment sectors while other sectors that require similar skills have lower unemployment.
The board decided that, in this time of relatively high unemployment and relatively fewer contributors to the Federal and Massachusetts tax base, we must focus more of our WIA funds on helping to more quickly grow the number of people able to pay regional, Massachusetts and Federal taxes.
9 Raytheon President’s statement at the MVWIB event we hosted at Merrimack College 11/2012
Page 69
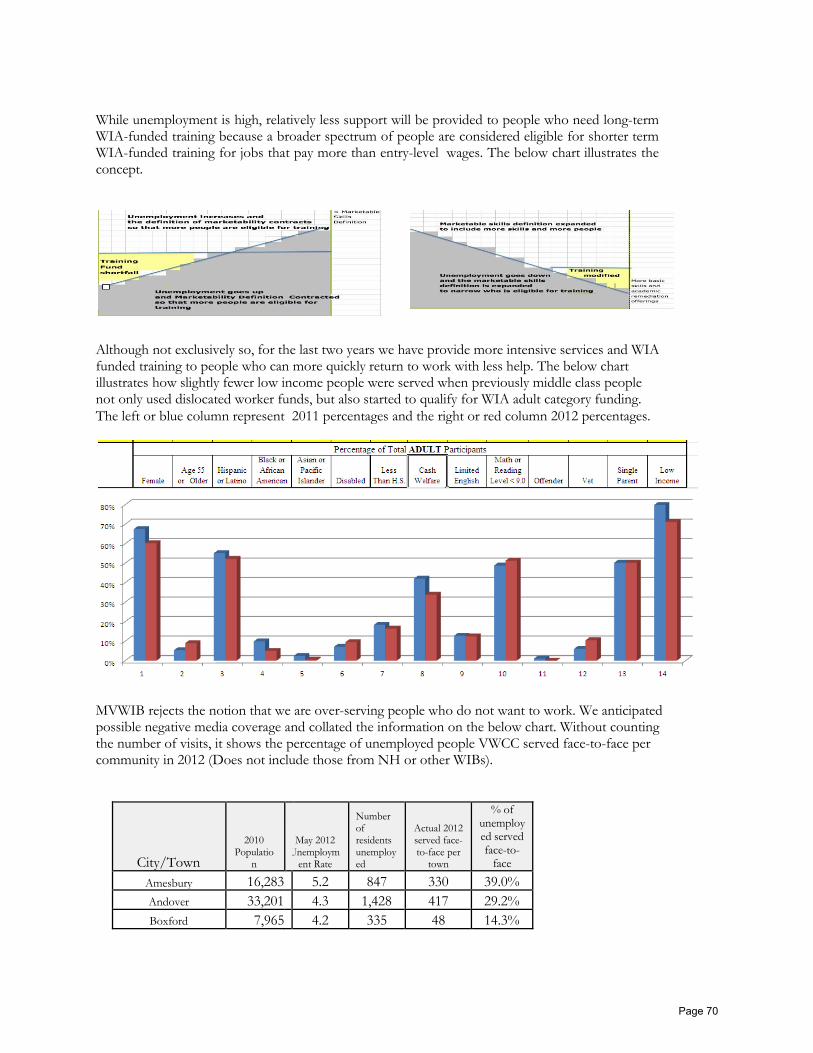
While unemployment is high, relatively less support will be provided to people who need long-term WIA-funded training because a broader spectrum of people are considered eligible for shorter term WIA-funded training for jobs that pay more than entry-level wages. The below chart illustrates the concept.
Although not exclusively so, for the last two years we have provide more intensive services and WIA funded training to people who can more quickly return to work with less help. The below chart illustrates how slightly fewer low income people were served when previously middle class people not only used dislocated worker funds, but also started to qualify for WIA adult category funding.
The left or blue column represent 2011 percentages and the right or red column 2012 percentages.
MVWIB rejects the notion that we are over-serving people who do not want to work. We anticipated possible negative media coverage and collated the information on the below chart. Without counting the number of visits, it shows the percentage of unemployed people VWCC served face-to-face per community in 2012 (Does not include those from NH or other WIBs).
City/Town
2010 Populatio
n
May 2012 Unemploym
ent Rate
Number of residents unemploy ed
Actual 2012 served face- to-face per
town
% of unemploy ed served face-to-
face
Amesbury 16,283 5.2 847 330 39.0%
Andover 33,201 4.3 1,428 417 29.2%
Boxford 7,965 4.2 335 48 14.3%
Page 70

Georgetown 8,183 4.3 352 123 34.9%
Groveland 6,459 4.6 297 115 38.7%
HAVERHILL 60,879 6.4 3,896 2,412 61.9%
LAWRENCE 76,377 13.3 10,158 4,577 45.1%
Merrimac 6,338 2 127 129 101.6%
METHUEN 47,255 7.4 3,497 1,399 40.0%
Newbury 6,666 5.5 367 68 18.5%
Newburyport 17,416 4.3 749 253 33.8%
North Andover 28,352 5.2 1,474 513 34.8%
Rowley 5,856 4.4 258 56 21.7%
Salisbury 8,283 6.1 505 160 31.7%
West Newbury 4,235 4 169 57 33.7%
333,748 24, 459 10,657
Fewer more educated or driven workers will be eligible for WIA services if the unemployment rate goes down significantly before 2016.
Dislocated and ‘Adult’ Workers Principle 3. Focus WIA Title I funds on occupational skills training and not on academic remediation. Encourage WIA Title II recipients to dedicate a part of their academic remediation funding towards preparing adult and family literacy students for occupational skills training.
The Board approved that all dislocated workers and ‘adult’ category people have at least an average 7.9 TABE score average before referral to WIA funded training. During times of high unemployment we cannot afford to train less educated people because their likelihood of finding and keeping a job is less than that of people who have mastered at least junior high level academic skills. (We also question whether increasingly smaller WIA Title I dollars can effectively remediate the significant number of unemployed people who have academic skills above grade 7.9.
City of Lawrence residents have historically received the largest part of our WIA intensive services and WIA Training dollars. Lawrencians over 25 years old have the 2nd lowest labor force participation rate in Massachusetts (75%, MA average 83%)10. Unemployed individuals who are actively seeking employment but are not employed are considered labor market participants. Others are not. So it is possible for an area to have a lower unemployment rate and yet have fewer people working than an area with a higher one.
Under another criteria, Lawrence residents averaged a 71% Labor Force Participation rate from 2007-2011 while 77% of the same ages did so statewide. In either case, the rate was significantly lower. Lawrence’s unemployment rate is typically recorded as being 6% higher than the state average. But its lower Labor Force Participation hides a much higher UI number.
Labor Force Participation Rate of 25-64 Year Old Lawrence and other gateway city residents
10 Employment and Schooling Activities of Youth in Lawrence- Neeta Fogg and Paul Harrington June 2013 pg. 8 for
MVWIB
Page 71
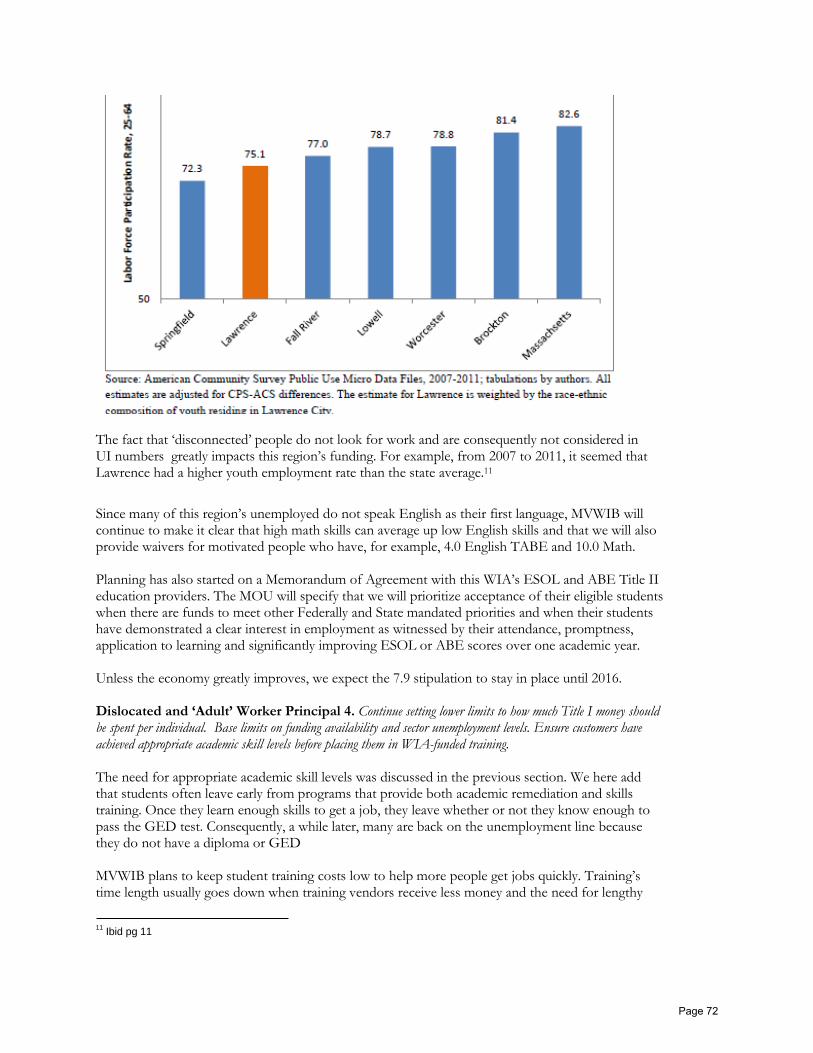
The fact that ‘disconnected’ people do not look for work and are consequently not considered in UI numbers greatly impacts this region’s funding. For example, from 2007 to 2011, it seemed that Lawrence had a higher youth employment rate than the state average.11
Since many of this region’s unemployed do not speak English as their first language, MVWIB will continue to make it clear that high math skills can average up low English skills and that we will also provide waivers for motivated people who have, for example, 4.0 English TABE and 10.0 Math.
Planning has also started on a Memorandum of Agreement with this WIA’s ESOL and ABE Title II education providers. The MOU will specify that we will prioritize acceptance of their eligible students when there are funds to meet other Federally and State mandated priorities and when their students have demonstrated a clear interest in employment as witnessed by their attendance, promptness, application to learning and significantly improving ESOL or ABE scores over one academic year.
Unless the economy greatly improves, we expect the 7.9 stipulation to stay in place until 2016.
Dislocated and ‘Adult’ Worker Principal 4. Continue setting lower limits to how much Title I money should be spent per individual. Base limits on funding availability and sector unemployment levels. Ensure customers have achieved appropriate academic skill levels before placing them in WIA-funded training.
The need for appropriate academic skill levels was discussed in the previous section. We here add that students often leave early from programs that provide both academic remediation and skills training. Once they learn enough skills to get a job, they leave whether or not they know enough to pass the GED test. Consequently, a while later, many are back on the unemployment line because they do not have a diploma or GED
MVWIB plans to keep student training costs low to help more people get jobs quickly. Training’s time length usually goes down when training vendors receive less money and the need for lengthy
11 Ibid pg 11
Page 72
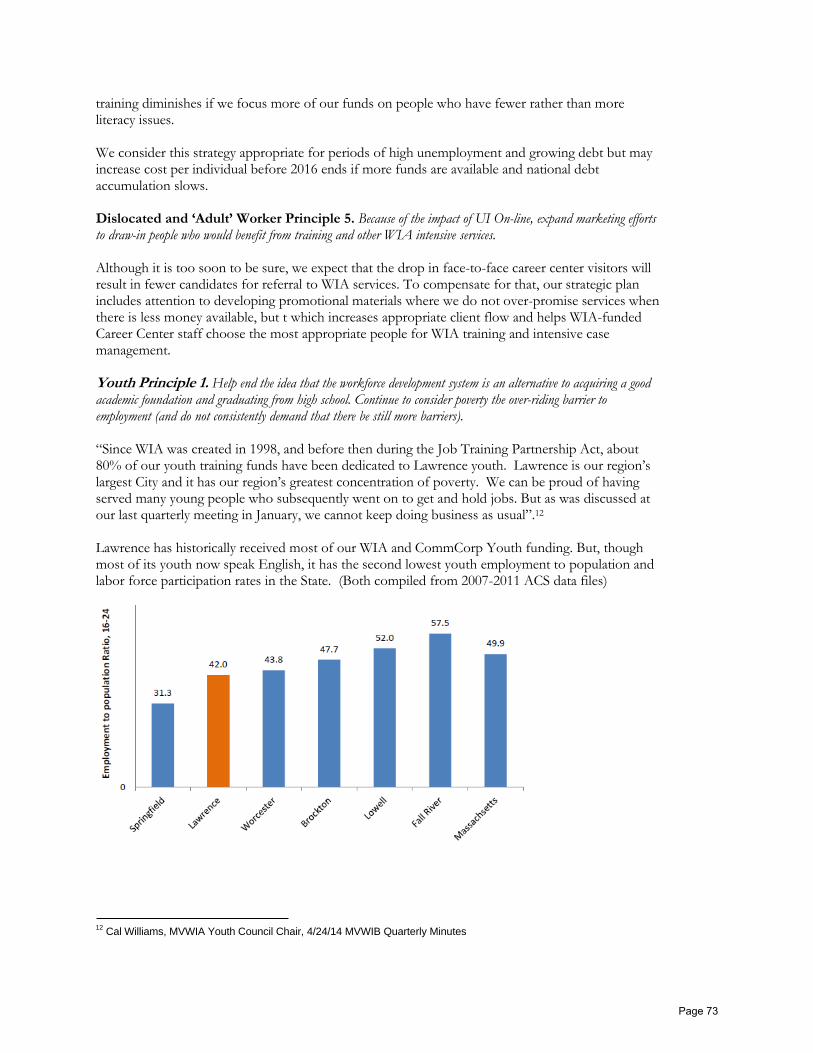
training diminishes if we focus more of our funds on people who have fewer rather than more literacy issues.
We consider this strategy appropriate for periods of high unemployment and growing debt but may increase cost per individual before 2016 ends if more funds are available and national debt accumulation slows.
Dislocated and ‘Adult’ Worker Principle 5. Because of the impact of UI On-line, expand marketing efforts to draw-in people who would benefit from training and other WIA intensive services.
Although it is too soon to be sure, we expect that the drop in face-to-face career center visitors will result in fewer candidates for referral to WIA services. To compensate for that, our strategic plan includes attention to developing promotional materials where we do not over-promise services when there is less money available, but t which increases appropriate client flow and helps WIA-funded Career Center staff choose the most appropriate people for WIA training and intensive case management.
Youth Principle 1. Help end the idea that the workforce development system is an alternative to acquiring a good academic foundation and graduating from high school. Continue to consider poverty the over-riding barrier to employment (and do not consistently demand that there be still more barriers).
“Since WIA was created in 1998, and before then during the Job Training Partnership Act, about 80% of our youth training funds have been dedicated to Lawrence youth. Lawrence is our region’s largest City and it has our region’s greatest concentration of poverty. We can be proud of having served many young people who subsequently went on to get and hold jobs. But as was discussed at our last quarterly meeting in January, we cannot keep doing business as usual”.12
Lawrence has historically received most of our WIA and CommCorp Youth funding. But, though most of its youth now speak English, it has the second lowest youth employment to population and labor force participation rates in the State. (Both compiled from 2007-2011 ACS data files)
12 Cal Williams, MVWIA Youth Council Chair, 4/24/14 MVWIB Quarterly Minutes
Page 73
Most of the kids that don’t work also dropped out of school. An unknown number of those who dropped out of school considered the workforce development system as an alternative to finishing school and getting a high school diploma. The MVWIB’s plan is to help counter the possibility of youth thinking that the workforce development system can lessen the harm to be done by their not completing high school. It is best that they become aware of that fact while in high school or at least while they’re young.
Because of the gravity of the inner city situation, we need to stop using WIA as another chance system for kids who drop out of school. From 2007 to 2011, an average of just 28% of 16 to 19 years old Lawrencians worked at any point in time13. Numbers sometimes hide reality because, from 2007-2011, Massachusetts’ 16 to 24 year olds were recorded as having a higher average unemployment rate of 12.7% than Lawrence youth who had a lower unemployment rate of 12.6%14.
Apart from having nowhere near enough funds to act as alternative to the secondary school system, MVWIB wants to be part of a network that holds inner-city schools accountable for their students’ learning. We plan to focus and promote our help to low-income youth who learn and graduate from high school and want to work. We plan to provide those low-income youth with a larger number of job-skill related, industry –recognized certificates. We will also look for public and private funds to help low-income youth who want to work while also going to college.
Some may say that MVWIB is discriminating against minority youth by insisting that they have a meaningful high school diploma before being able to receive WIA-funded training. But the prejudice of low expectations is worse. Lawrence Public Schools are moreover about 95% Hispanic and accusations of discrimination ignore that we will help the 60% of Hispanic youth who graduate or who have a GED.
Like everyone else, Hispanic youth need positive role models. It is better that younger low-income see older youth being helped for graduating than for not graduating high school. MVWIB supports and will support the LPS Receivers efforts to greatly improve learning and graduation rather than provide a perceived alternative to good school performance.
The old approach did not work. “The average labor force participation rate of 16- to 24-year old youth was 48 percent in Lawrence over the 2007-2011 period”.15 On average, over the 2007-2011 period, only 28% of Lawrence 16-19 year old teens were employed for one hour or more per week..
13 Employment and Schooling Activities of Youth in Lawrence- Neeta Fogg and Paul Harrington June 2013 for MVWIB, p.
25 14
Employment and Schooling Activities of Youth in Lawrence- Neeta Fogg and Paul Harrington June 2013 for MVWIB, p. 25 15
Ibid p. 7
Page 74
Lawrence teens had the second lowest employment to population ratio in the state, second only to Springfield (20%)16.
The Lawrence Public School district is the only Massachusetts district currently in receivership. A large reason for this is its low high school graduation rate. The 2011 adjusted five year cohort graduation rate for Lawrence high schools was just 60.6%. During that period, about 22% of
entering 9th graders graduated together from Lawrence High (LHS) (with an additional 6 percent earning a GED).17
Five years after entering LHS, 40 percent of students had not earned a regular diploma. Andrew Sum has pointed to the statewide consequences of these numbers:
• Dropouts aged 16-24 are much less likely to be engaged in the labor force or be
employed throughout their lives than those who complete high school.
• Teen and young adult female high school dropouts were considerably more likely to have one or more children out of wedlock. Out of wedlock children are more likely to live in poverty.
• 16 to 24 year old high school dropouts are 6 times more likely to be put in jail than their counterparts who finish high school.
• The odds of residing in a household with income below the poverty/near poverty thresholds are sharply higher for young high school dropouts.
• Over their expected working lives, high school dropouts will cost U.S. taxpayers a net loss of about $5,200 per year---every year-- up to the age of 65.18
“Youth without early work experience are less likely to develop these skills and therefore are less employable than those who have been exposed to the world of work and have therefore developed the behavioral traits and soft skills that are a requirement for employment in any job”.19 Many low- income minority youth who worked enough to graduate from high school are not finding jobs because our system often prefers to help low-income minority youth who dropped-out. Both groups of people will ultimately be harmed.
The MVWIB considers disconnected youth one of this region’s, state and nation’s most significant long-term problems. Laws can be passed to make it more difficult for employers to export jobs and, perhaps, to contain college costs. But it takes many years to change the attitudes and habits instilled over generations. Over two years ago, we changed our policies so that MVWIA youth must have a high school diploma or GED to qualify for WIA-funded training. Our strategy posits good public schools in the center of what’s needed for workforce development. It recognizes that the MVWIB, its employer majority and other members, are a junior but very necessary partner in that relationship.
16 Employment and Schooling Activities of Youth in Lawrence- Neeta Fogg and Paul Harrington June 2013 for MVWIB
page 15.
17
Massachusetts Department of Elementary and Secondary Education, “ 5-Year Adjusted Cohort Graduation Rate 2011 Lawrence,”http://profiles.doe.mass.edu/nsc/gradsattendingcollege_dist.
18
Andrew Sum, et.al. “The consequence of Dropping Out of High School: Joblessness and Jailing’s for High School
Dropouts and the High Cost for Taxpayers,” Center for Labor Market Studies, Northeastern University, October, 2009
19
Employment and Schooling Activities of Youth in Lawrence- Neeta Fogg and Paul Harrington June 2013 for MVWIB.
Page 75
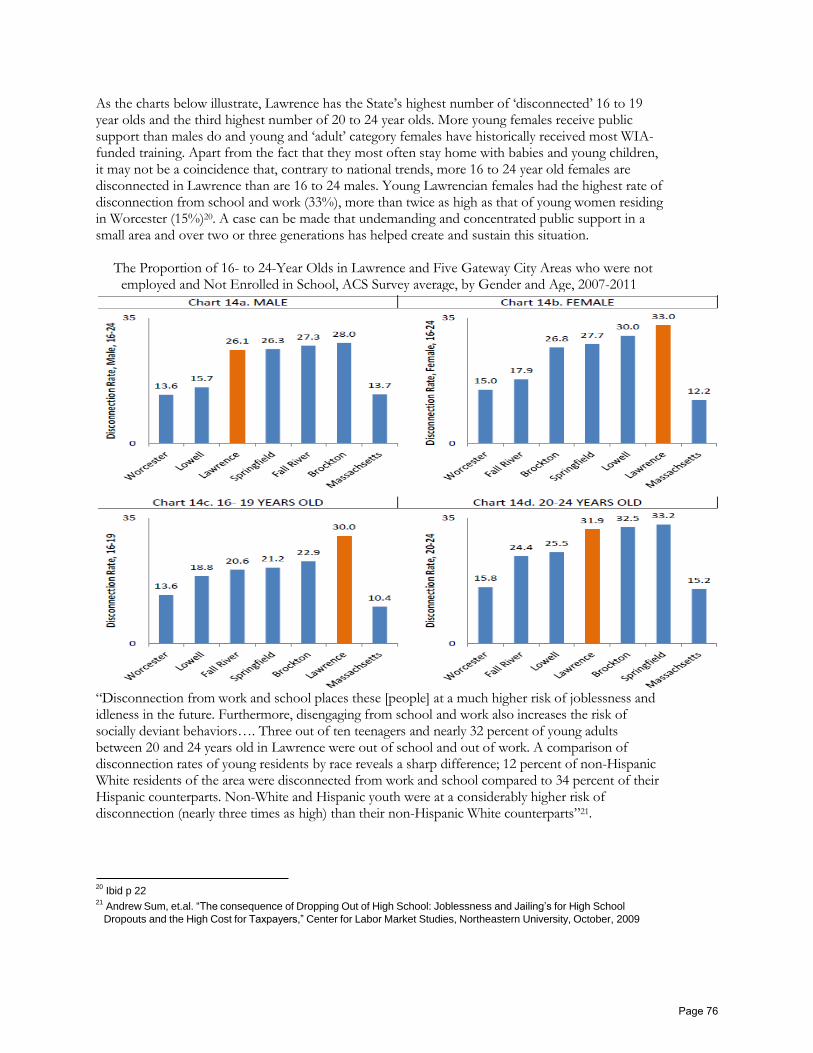
As the charts below illustrate, Lawrence has the State’s highest number of ‘disconnected’ 16 to 19 year olds and the third highest number of 20 to 24 year olds. More young females receive public support than males do and young and ‘adult’ category females have historically received most WIA- funded training. Apart from the fact that they most often stay home with babies and young children, it may not be a coincidence that, contrary to national trends, more 16 to 24 year old females are disconnected in Lawrence than are 16 to 24 males. Young Lawrencian females had the highest rate of disconnection from school and work (33%), more than twice as high as that of young women residing in Worcester (15%)20. A case can be made that undemanding and concentrated public support in a small area and over two or three generations has helped create and sustain this situation.
The Proportion of 16- to 24-Year Olds in Lawrence and Five Gateway City Areas who were not employed and Not Enrolled in School, ACS Survey average, by Gender and Age, 2007-2011
“Disconnection from work and school places these [people] at a much higher risk of joblessness and idleness in the future. Furthermore, disengaging from school and work also increases the risk of socially deviant behaviors…. Three out of ten teenagers and nearly 32 percent of young adults between 20 and 24 years old in Lawrence were out of school and out of work. A comparison of disconnection rates of young residents by race reveals a sharp difference; 12 percent of non-Hispanic White residents of the area were disconnected from work and school compared to 34 percent of their Hispanic counterparts. Non-White and Hispanic youth were at a considerably higher risk of disconnection (nearly three times as high) than their non-Hispanic White counterparts”21.
20 Ibid p 22
21 Andrew Sum, et.al. “The consequence of Dropping Out of High School: Joblessness and Jailing’s for High School
Dropouts and the High Cost for Taxpayers,” Center for Labor Market Studies, Northeastern University, October, 2009
Page 76
To confront this situation, the MVWIB has generally adopted the remedies suggested by Dr. Paul Harrington in the study we commissioned him to do with part of our High Performing WIB $100,000 grant. He suggests “that secondary high schools, local community colleges and workforce development organizations are the best positioned institutions to assist teens and young adults who are disconnected from the labor market.”22
His recommendations are here included verbatim as part of this Strategic Plan. “Reinforcing behaviors like attendance and punctuality can be imbedded into school and community settings. More generally, these organizations must see themselves as responsible for helping build the skills necessary to find and keep a job. What exactly can these organizations do?
• Help teens overcome the challenges of employer screening by demonstrating how screening mechanisms work—teaching young people how to think about on-line applications and to understand the underlying reasons for each question that is posed on the application.
• Provide students with help in acquiring the savvy required to get a job in today’s labor market. Provide coaching and training in work readiness and career exploration and especially in life skills like punctuality, taking direction and initiative so that young people can find and keep a job. Programs in basic job hunting and job retention should be offered to all working age high school students, with a strong emphasis on understanding how employers make their hiring decisions.
• Take responsibility for brokering relationships between young people and local businesses. Employers are sometimes more willing to take some risk in hiring a young person with little or no work experience if they know that the local high school or community college is engaged in screening these youngsters and will support both the job applicant and the employer to make a successful new hire.
• Provide an easily navigated, unified point of entry for employers who are potentially interested in hiring young people for entry level positions. This means offering employers screening services they value along with a chance to support youth programming in other ways in addition to hiring.
• Comprehensive high schools should place a stronger emphasis on attendance and discipline. District leadership should develop methods to closely monitor and manage attendance, punctuality and discipline and self-control issues on a daily basis. Improvements in these areas will sharply bolster credibility with area employers. Indeed, one of the mainstays of success for the state’s CTE programs has been a strong emphasis on managing student behavior—which many believe helped substantially improve CTE MCAS scores over the years.
• Workforce development efforts should include supporting an in-school professional who connects students with employers. Their task is to build long term credible relationships with local employers and work with young people who do not have their own networks into the labor market to find work.
• Use subsidized work programs as springboards into employer paid positions. Young people in subsidized jobs should come away from those positions with job seeking and job readiness skills. This means that there should be competition among students for subsidized jobs and students must pass the signal and screen tests that are found in the unsubsidized sector of the labor market.
• Employers who participate in subsidized work programs must structure the experience in such a way as to reinforce positive work behaviors including attendance self-discipline, initiative and honesty.
• An important idea about creating teen staffing agencies emerged from the Merrimack Valley youth employer focus group. Employers often have short-term projects that require a few days or weeks or work. Youth serving organizations should develop a teen staffing agency model to place young
22 Employment and Schooling Activities of Youth in Lawrence- Neeta Fogg and Paul Harrington June 2013 for MVWIB
page 30
Page 77

people with area employers on a short-term basis. Such teen temp help firms would be located at retail malls or other central locations where a number of employers may be looking for temporary help. Teens who perform well in their temp duties will have the added possibility that an employer will hire them on a more permanent basis or recommend them to another firm for a permanent job”.23
Before commissioning Dr. Harrington, MVWIB had reached many of the same conclusions and had decided to try and to put a career center annex into Lawrence High School. The MVWIB Deputy and Executive Directors had already participated in many of the Receiver’s initial studies and recommendation sessions. The Executive Director had also been Chairman of the Lawrence Superintendent Search Committee that decided not to recommend any applicants for Lawrence School Committee review because of the gravity of Lawrence’s situation. That resulted in the Mayor of Lawrence’s request for Massachusetts Receivership.
In 2012, the MVWIB worked together with President Lane Glenn of Northern Essex Community, Receiver/Superintendent Jeff Riley and VWCC Executive Director Arthur Chilingirian to apply for a U.S. Department of Labor Innovation Grant to place a ValleyWorks annex in Lawrence High. Our proposal was, unfortunately, not funded but, as reflected in the below letter, a part of MVWIB’s strategic plan is to try again as opportunities arise.
23 Employment and Schooling Activities of Youth in Lawrence- Neeta Fogg and Paul Harrington June 2013 for MVWIB
page 31-32
Page 78

Youth Principle 2. Continue to allocate a portion of youth subsidized employment money by lottery while also dedicating a portion to rewarding low-income youth who have maintained good grades/comportment or who have significantly improved them.
“By 2012 older workers in Massachusetts were 1.5 times more likely to be employed than were teens -a partial result of rising employment rates among older workers, but largely a consequence of unprecedented decline in the employment rates of teens”24. In Lawrence, Methuen and Haverhill’s poorest areas, at least 4 out of 10 out-of-school 16-24 year olds are neither employed, nor looking for work.
“Part of the reason young people are more vulnerable to changes in economic conditions is that they are frequently viewed as less productive workers, relative to adults. Indeed, we have seen considerable evidence of firms substituting older workers for young people in even the most low skilled of occupations”25.
As indicated by the below chart “This trend of substituting older workers for teens became particularly pronounced beginning in 2007 with the onset of the ‘Great Recession’26
Employers place great emphasis on trusting the referral sources or the sources of information they use in making their hires. That is one of the reasons why vocational high school have such high graduate employment rates.27 A recent employer survey results indicate that employers often rate teens poorly with respect to their work behaviors or what are sometimes called non-cognitive skills28
In the past, this region’s workforce development system focused its youth workforce development efforts on low-income youth with a variety of additional barriers such as dropping out of school. MVWIB now thinks that the inner-city youth employment situation is bad enough to warrant focusing our efforts on all low-income youth. In order for them to be hired into unsubsidized jobs, we must provide our employer partners with youth that they can rely on. In order to stop the
24 Boosting Teen Employment Prospects- Paul Harrington, Nancy Snyder (CommCorp) pg 9
25 Neeta P. Fogg and Paul E. Harrington, The Increased Presence of Older Workers in the Massachusetts Labor
Market: implications for Workforce Development Policies, Workplace Accommodation, and Universal Design. Commonwealth Corporation, July, 2011 26
Paul E. Harrington and Nancy L. Snyder, “Signaling Success: Boosting Teem Employment Prospects, Prepared for Commonwealth Corporation, Boston, Massachusetts, April 2013 27
Employment and Schooling Activities of Youth in Lawrence- Neeta Fogg and Paul Harrington June 2013 for MVWIB, pg 29 28
Paul E. Harrington and Nancy L. Snyder, “Signaling Success: Boosting Teem Employment Prospects, Prepared for Commonwealth Corporation, Boston, Massachusetts, April 2013
Page 79

perception that misbehaving low-income youth receive more public support than well-performing ones, we must provide well-performing youth with more support.
In a 1990’s study, Christopher Ruhm found that, 6 to 9 years after graduation, those who worked 20 hours per week during their senior high school year had annual earnings that were 22 percent greater than those who did not work. They were employed in higher level occupations than those who did not work in high school and were more likely to have health insurance and participate in an employer pension plan.29
VWCC TABE tests show that many inner-city Hispanic youth with recent, U.S. high school diploma can barely perform at an 8th grade academic level. Those youth are by nature no less intelligent than white or Asian youth. We must do our part to change the inner-city culture and institutionalized low expectation that retard their academic progress. We should especially help low-income the middle skilled minority youth to better compete in the marketplace. Like every other group, most minority youth are middle skilled. If we do not help provide opportunities to low- income youth who have a better chance of qualifying for unsubsidized employment, we may be keeping both them and misbehaving low-income youth poor.
Youth Principle 3. Seek, encourage and counsel economically disadvantaged youth who have a good academic foundation to both work and go to college. Tangibly encourage their dependability as appropriate.
There is also no doubt that education and training is the key to successful employment, especially STEM-related skill acquisition. More than half of all new career ladder jobs require an Associates degree or higher and there is virtually no occupational area that doesn’t require at least some basic computer skills.
The critical challenge facing the MVWIB is ensuring that the workforce development system is responsive to and understands industry needs as they continue to grow and evolve and that workers are prepared with the education and skills to maintain those industries in the Commonwealth.
One of the key priorities in HPW and this updated Strategic Plan is the expansion and development of activities that will support access to higher education and advanced training and retraining for current and future job seekers and employees in the region. It is our current estimate that we cannot reasonably promote college enrollment to everyone. Our country can no longer afford it, employers increasing that their tax dollars are misused in trying to do so and many just look for reliable employees with basic academic skills that they can train.
Although 80% of 2012 high school graduates entered college or certificate programs nationwide, only about 33% percent may graduate from college and an unknown number attain useful certificates. Historically unprecedented low numbers of college graduates currently find work related to their college degrees. The situation is considerably worse for minority students.
Lawrence high school graduates go to college in high numbers. Within 16 months of high school graduation, about 78 percent of the Lawrence graduating class of 2009-10 had enrolled at a post- secondary educational institution. This was greater than the 74 percent statewide college enrollment mean. But most Lawrence graduates were unlikely to complete a degree or certificate program. Most of them a two-year college and the two-year college three year cohort graduation rate averages about
29 Christopher J. Ruhm, “The Extent and Consequences of High School Employment,” Journal of Labor Research, Vol. 16,
No 3. Summer 1995, pp. 293-303
Page 80
16 percent, with the additional three year cohort transfer rate averaging about 22 percent.30 There do not seem to be records of what happens to those who transfer to 4-year colleges.
This MVWIB strategic plan recognizes that all workers may not be college graduate material, but nearly all of them must have or learn basic academic skills and new technologies and ways of doing things. We must develop ways to better propel those who can succeed in college and those cannot. Through different types of education and training we must help develop worthwhile options for all.
“High school attendance and suspension [are] powerful predictors of dropping out of college. So it is no surprise to find that employers’ reluctance to hire young people without a college degree is associated with the same negative behaviors of poor attendance and self-control (as measured by disciplinary suspension) that cause secondary and post-secondary drop-out problems. Indeed, many employers point to poor discipline at school and home as the source of shirking behavior among young people.31
As part of its strategic plan, MVWIB will try to help build a sense of responsibility in all youth and their parents.
Evidence suggests that the labor market highly values a college degree even in bad economic times but additional years of post-high school schooling with no degree or certificate make much less of a difference for both employment and wages. ‘Perhaps the most heavily relied upon signal in the hiring process is the level of educational attainment which is thought to be positively connected to the productive abilities of job seekers. Employers use educational credentials as an indicator - albeit an imperfect one - to determine which applicants are more likely to be productive.32
MVWIB hopes to help guide low-income youth who can succeed in college to enroll in it while they work. “The impact of working while in school is also positive at the post-secondary level— especially among male community college students. Audrey Light finds that among men, those who work while in school are more likely not to drop –out and that they do better academically. Statistical models indicate that the long-term estimated economic gains are more than 25 percent greater than when students don’t work while in-college.33 This also implies that one quarter or more of the net earnings premium associated with earning a college degree may in fact be “the product of working while in school—and not a product of the college degree per se”34.
Zimmer-Gembleck and Mortimer found that students who work for an extended number of weeks while in school, but more limited hours of work (less than 20 hours per week) are substantially more likely to earn a bachelor’s degree than students who do not work or who work more intensively over the course of a week.35
Whenever possible we will try to help appropriate low-income working kids enroll in community college. If kids with good middle-skills attend while they work, they will not only prepare
30 Ibid p. 26
31 Employment and Schooling Activities of Youth in Lawrence- Neeta Fogg and Paul Harrington June 2013 for MVWIB
page 31 32
Ibid p. 28 33
Audrey Light, In-School Work Experience and the Returns to Schooling, Journal of Labor Economics, January
2001 34
Employment and Schooling Activities of Youth in Lawrence- Neeta Fogg and Paul Harrington June 2013 for MVWIB page 28 35
Melanie J. Zimmer-Gembleck and Jeylan T, Mortimer, Review of Educational Research, Winter 2006 pp. 537-566 and
Mortimer Working and Growing Up in America.
Page 81
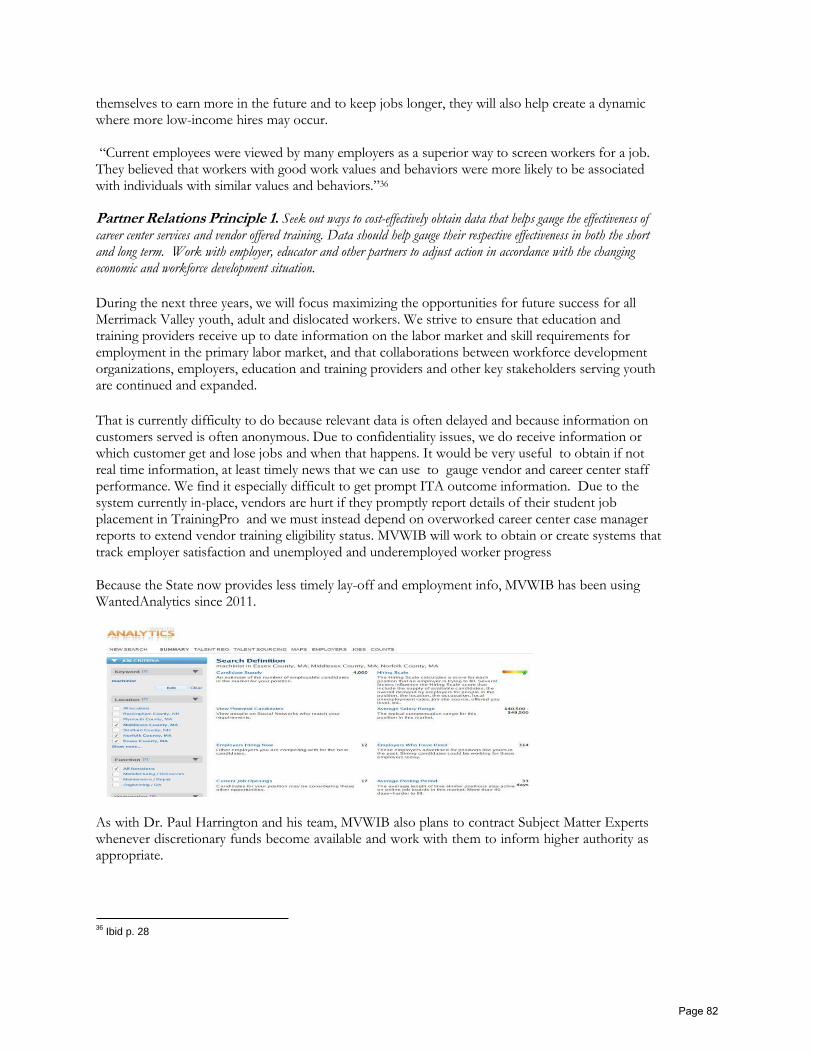
themselves to earn more in the future and to keep jobs longer, they will also help create a dynamic where more low-income hires may occur.
“Current employees were viewed by many employers as a superior way to screen workers for a job. They believed that workers with good work values and behaviors were more likely to be associated with individuals with similar values and behaviors.”36
Partner Relations Principle 1. Seek out ways to cost-effectively obtain data that helps gauge the effectiveness of career center services and vendor offered training. Data should help gauge their respective effectiveness in both the short and long term. Work with employer, educator and other partners to adjust action in accordance with the changing economic and workforce development situation.
During the next three years, we will focus maximizing the opportunities for future success for all Merrimack Valley youth, adult and dislocated workers. We strive to ensure that education and training providers receive up to date information on the labor market and skill requirements for employment in the primary labor market, and that collaborations between workforce development organizations, employers, education and training providers and other key stakeholders serving youth are continued and expanded.
That is currently difficulty to do because relevant data is often delayed and because information on customers served is often anonymous. Due to confidentiality issues, we do receive information or which customer get and lose jobs and when that happens. It would be very useful to obtain if not real time information, at least timely news that we can use to gauge vendor and career center staff performance. We find it especially difficult to get prompt ITA outcome information. Due to the system currently in-place, vendors are hurt if they promptly report details of their student job placement in TrainingPro and we must instead depend on overworked career center case manager reports to extend vendor training eligibility status. MVWIB will work to obtain or create systems that track employer satisfaction and unemployed and underemployed worker progress
Because the State now provides less timely lay-off and employment info, MVWIB has been using WantedAnalytics since 2011.
As with Dr. Paul Harrington and his team, MVWIB also plans to contract Subject Matter Experts whenever discretionary funds become available and work with them to inform higher authority as appropriate.
36 Ibid p. 28
Page 82
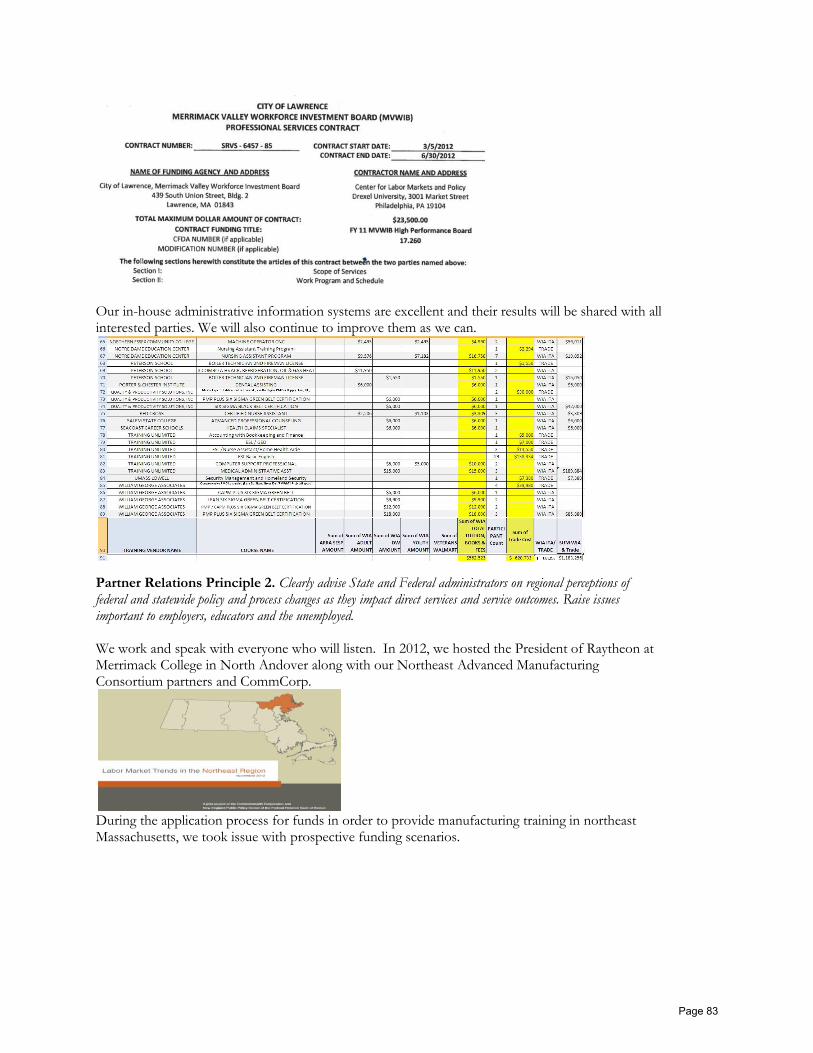
Our in-house administrative information systems are excellent and their results will be shared with all interested parties. We will also continue to improve them as we can.
Partner Relations Principle 2. Clearly advise State and Federal administrators on regional perceptions of federal and statewide policy and process changes as they impact direct services and service outcomes. Raise issues important to employers, educators and the unemployed.
We work and speak with everyone who will listen. In 2012, we hosted the President of Raytheon at Merrimack College in North Andover along with our Northeast Advanced Manufacturing Consortium partners and CommCorp.
During the application process for funds in order to provide manufacturing training in northeast Massachusetts, we took issue with prospective funding scenarios.
Page 83
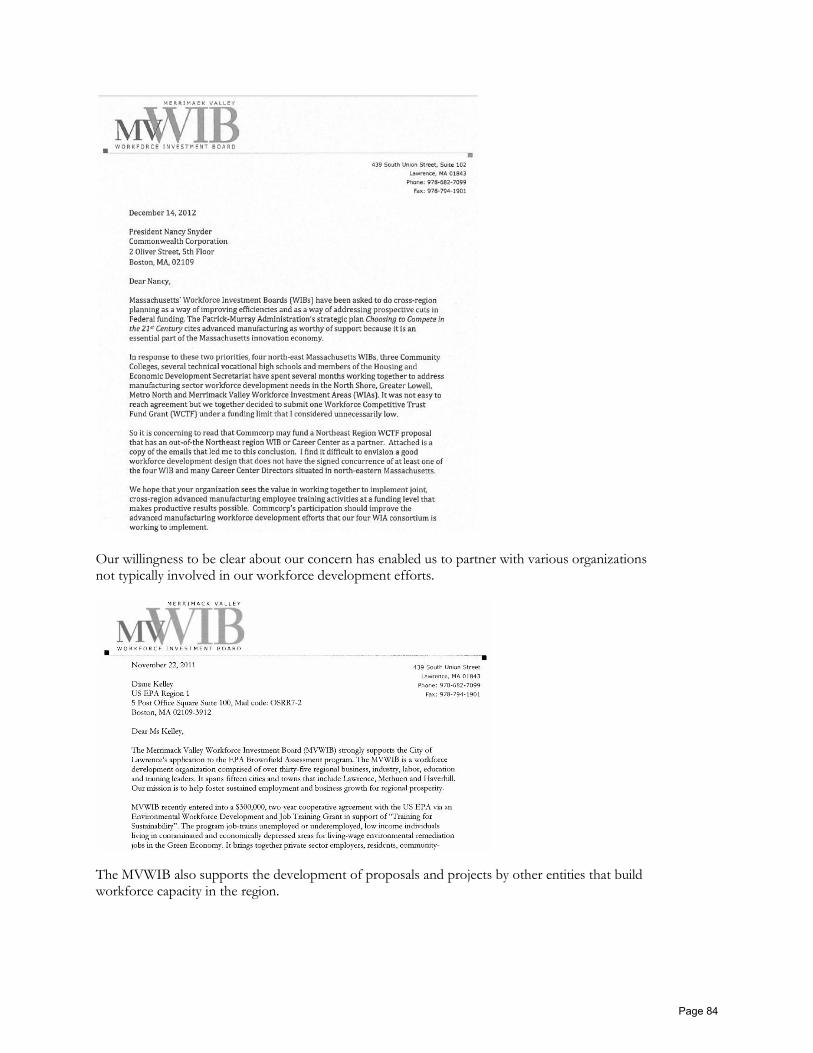
Our willingness to be clear about our concern has enabled us to partner with various organizations not typically involved in our workforce development efforts.
The MVWIB also supports the development of proposals and projects by other entities that build workforce capacity in the region.
Page 84
The WIB has actively worked with local institutions of higher education in support of funding for new curriculum and program offerings in the healthcare and manufacturing sectors. It provides technical assistance and linkage with appropriate training providers for employers seeking funding through the Workforce Training Fund.
The MVWIB is active in creating and strengthening links between the workforce system and educational institutions. A number of activities have focused on ensuring that the region’s youth are receiving information and learning skills that are relevant to the future workplace including educating school staff in the career pathways, job opportunities and workplace-specific skills required in the regions critical and emerging industries. Employers are providing externships for teachers that provide workforce/industry context to academic content. We are also developing close relations with Northern Essex Community College which has a new and very entrepreneurial President who is bound to make it a much more agile player in economic development.
We will work with all public and private officials as constructively as possible in these times of increasingly severe budget cuts and growing uncertainty.
*** The Mission of the Merrimack Valley Workforce Investment Board is reflected in the content of this Strategic Plan: “Through consensus building and coordination the Board will create a leadership framework for the collective action of workforce providers. The Board will serve as the repository of valid, objective, factual information on workforce issues in the Merrimack Valley. The Board will demonstrate the integrity to serve as impartial convener, broker and manger of relationships.”
In keeping with this Mission, the Merrimack Valley WIB will:
Build the Merrimack Valley’s competitive workforce advantage.
Through its oversight of the local workforce system, promote and enhance the region’s economic development strategies
Page 85

Identify opportunities to leverage new private and public investments through collaborations and initiatives designed to improve the local labor supply and ensure that Merrimack Valley businesses have the human capital needed to compete in the national and global economy.
Ensure that opportunities exist for all citizens to engage in and become productive members of the workforce.
Build a demand driven workforce system linking regional workforce investment activities with economic development organizations..
Includes continuous improvement as a priority in all MVWIB activities.
The Merrimack Valley Workforce Investment Board (MVWIB) determined that the Governor’s three required priorities reflect and incorporate other strategic issues and initiatives that had been identified by the Board as priorities in FY’08 planning documents and discussions. The Governor’s priorities are:
Building the capacity of the workforce system
Closing the Skill Gaps in key industries and sectors Enhancing the youth pipeline to education and employment
Within these overarching priorities are additional issues identified by the MVWIB that are incorporated in the activities of the Strategic Plan:
Skill attainment and reemployment of dislocated workers
Older worker employment and retention Enhanced career awareness, support and workforce preparation for at-risk youth
Expanded ABE/ESOL combined with employment preparation activities Skill attainment, re-integration, and employment for ex-offenders
We have identified Strategic Issues:
Strategic Priority: Capacity Building
The Executive Committee and MVWIB staff in consultation with other Board members, workforce stakeholders and state and local officials took responsibility for identifying the objectives and benchmarks which address the strategic priority of building the capacity of the WIB.
Strategic Priority: Addressing the Skills Gap
The Skill Gap issue in the manufacturing and healthcare sectors in the Merrimack Valley have been addressed in our previous discussions.
As we have previously noted the demographics of the region workforce describe a diverse population with overall educational and wage levels that are below the state average. Nearly 66% of unemployed adults accessing services through the Valley Works Career Center are basic skills deficient, meaning their reading and math skills are lower than 9th grade levels. Nearly a third of dislocated workers, meaning formerly employed, were basic skills deficient.
Page 86
Twenty two (22) of the 30 area industry sectors require at least an Associates Degree. Also distressing is that the Merrimack Valley awarded smaller shares of associate’s degrees in engineering and computer science than the other areas of the State.
At the beginning of this decade, the number of degrees awarded in the region had dropped 12% in the previous ten years while increasing statewide by 15% and across the United States by 27%. There is also a disconnect between fields of study and employment opportunities. In the Merrimack Valley, typically only 6% of Bachelors are in Engineering and Computer Science, 42% of college graduates receive degrees in Arts and Humanities. 37
These unfortunate statistics are not unique to the region or Massachusetts but are of genuine concern relative to our future economic vitality. The choice being made by college students also speaks to the need for career awareness and exploration activities for both youth and adults accessing education and training.
Activities are focused on identifying new shorter-term and less expensive education and training options that are relevant to the needs of employers in the region. We will seek to build collaborations between employers and workforce development professionals to ensure that resources are utilized effectively and productively to achieve real results. We will also support programming that is gender neutral and incorporate outreach strategies geared to attracting more male participants in education and training activities.
Strategic Priority: Enhancing the Youth Pipeline
The majority of career ladder jobs being created in the Merrimack Valley require post-secondary education and/or training.
An organizer for the Painters and Allied Trades Union has been actively working with the MVWIB for many years to encourage linkages with the Union and apprenticeships for local youth. We will also be exploring anticipated opportunities through the Plumbing, Heating & Cooling Contractors Association of Greater Boston.
Our Manufacturing Partnership has a strong interest in promoting youth career in the machine tool and customized manufacturing industry. Youth will be recruited for our NAMC manufacturing program
A special emphasis will continue to be engaging more males in Career Center activities and in training program. This is a segment of the population that has been difficult to reach.
MVWIB will increase awareness of the role, resources and workforce information available through the MVWIB in the region.
Activities, Timeframe, Benchmarks/Indicators
Activity: Timeframe Benchmarks/Indicators A. Increase MVWIB profile through media and strategic
Creation of updated press kit and MVWIB fact sheet
37
National Center of Education Statistics, Integrated Post Secondary Education Data System, Tabulation by Center for Labor Market Studies, Northeastern University, March 2008.
Page 87
events. On-going
On-going
Development and dissemination of MVWIB newsletter
Identify key press contacts in each MVWIB city and town.
Identify opportunities to participate in appropriate forums and panels.
B. Retain and expand MVWIB Organizational Memberships on key workforce development advisory groups, committees and Industry organizations.
On-going Memberships on: MV Economic Development
Council Merrimack Valley Planning
Commission CEDS Committee Merrimack Valley Chamber of
Commerce Greater Haverhill Chamber of
Commerce
Gr Newburyport Chamber Amesbury Chamber Salisbury
Chamber Health Care Learning Network Advisory Board
Northeast STEM Advisory Board MV AHEC Advisory Board NECC Occupational Advisory
Board
National Assn of Workforce Boards Mass Workforce Board Assn
C. Expand MVWIB website offerings
On-going
On-going
Regularly update information on web site.
Post monthly and quarterly reports, labor market information, funding opportunities on website.
The MVWIB will promote activities that support and increase the economic vitality of employers and workers in the region.
Activity: Timeframe Benchmarks/Indicators A. The MVWIB will identify and collaborate locally and jointly with other workforce development partners in efforts to expand resources for employers and job seekers.
On-going
On-going
Identify key workforce partners for joint activities.
Advocate for policy and funding changes that will increase resources in the region.
B. The MVWIB will engage in cross regional initiatives including special projects and grant opportunities
On-going The MVWIB will collaborate in at least one cross regional initiative annually.
C. Regularly communicate with local political leaders and other key stakeholders to ensure awareness of workforce
On-going Invite and encourage regional political leaders to attend MVWIB meetings.
Hold legislative breakfast annually in collaboration with ValleyWorks Career
Page 88

development issues and needs. Ongoing Center.
D. The MVWIB will participate in CQI activities that will support the effectiveness of the Board.
Ongoin
On-going
The membership of the MVWIB will participate in planned WIB Institute training.
The MVWIB requires CQI to be an ongoing activity in Career Center operations.
E. The MVWIB will actively recruit members from the identified critical sectors in the region.
On-going The MVWIB ensures that at least one employer from each critical sector is represented on the MVWIB.
F. The MVWIB will engage in activities designed to promote and advocate for policy changes at the state and federal level that will support workforce activities in the region and State.
On-going The MVWIB will participate in joint efforts with local and state partners to advocate for additional workforce resources.
The MVWIB will utilize demographic, labor market information and other relevant data from employers to identify and address education and training needs in key employment sectors.
Activity: Timeframe Benchmarks/Indicators A. Promote development and partnerships with education and training providers focused on development of appropriate coursework for industries.
On-going
On-going
On-going
On-going
On-going
Ensure the participation of educational institutions on industry focus groups.
Creation of new course offerings in collaboration or consultation with employers.
Facilitate employer involvement on curriculum committees and in evaluation of program designs and effectiveness
Facilitate employer partnerships with vocational schools, proprietary schools and trainers.
Require employment involvement in all MVWIB funded skill training activities
B. Articulate opportunities for employment/training in key sectors for “middle skilled” individuals.
On-going
On-going
Work with employers and trainers to identify demand employment opportunities in key sectors requiring less than a college degree.
Provide information to Career Counselors/Training providers, etc.
Page 89

C. Facilitate engagement of employers in the design and development of skill acquisition programs.
On-going
On-going
Continue focus groups in key sectors for employers, education and training providers and other stakeholders.
Facilitate involvement of employers in curriculum development, feedback and evaluation of effectiveness of programs for workers.
D. Better inform customers of their training and education options
FY 2014 Establish list of vetted providers in key skill areas.
Post list on MVWIB website.
E. Support and encourage opportunities for access to post secondary education or further training for the employed.
On-going The MVWIB works with employers to facilitate links with higher education/continued training for employees.
F. Provide incentives for employers to invest in employee learning and development
On-Going The MVWIB ensures that employers are aware of resources available through the WTF, WCTF or other sources for incumbent worker training.
G. Promote utilization of on- line or remote education for employees by employers.
FY 2014 Establish list of providers offering on- line or remote education in key sectors.
H. Ensure youth serving organizations receive information on current and future workforce skills gap, education and training options.
On-going Support, develop, and promote collaborative activities that link skills gap activities to youth pipeline activities.
The MVWIB will ensure the quality and appropriateness of training options and providers.
Activity Timeframe Benchmarks/Indicators A. Utilize vacancy surveys to identify key demand occupations.
On-going
On-going but will be strengthen ed
Identify gaps in education and training in demand occupations.
Provide information to trainers, career counselors, and community based agencies.
B. Analysis of the utilization and performance of current vendors
Annually
On-going
On-going
Report results to MVWIB Planning Committee.
Assess quality and quantity of training opportunities in key sectors (Healthcare, Professional/Technical Services.
Help sustain key providers/programs
Page 90
during this time of severe budget cuts Remove non performing vendors from approved training list.
The MVWIB will create and distribute current labor market and other informational materials to schools, education and training providers, career counselors and other stakeholders.
Activity Timeframe Benchmarks/Indicators A. Identify and disseminate information on job openings, skill requirements, and education and training opportunities on a regular basis.
Ongoing The MVWIB will provide links to all appropriate data sources.
B. Promote and provide informational sessions on the labor market and workforce issues.
Ongoing The MVWIB will provide at least one labor market presentation per year for each school district in the region.
C. Provide information regarding critical and emerging employment sectors and occupations for use by job seekers, students, educators and trainers.
Ongoing Disseminate via MVWIB website and newsletter distribution.
The MVWIB will support and facilitate the expansion of programs providing ABE and ESOL in the region that provide pathways to future employment.
Activity Timeframe Benchmarks/Indicators A. Identify and support successful programs that create pathways for ABE/ESOL participants with Community Colleges and VWCC
Ongoing Work with SABES program project, focused on facilitating transition of ABE/ESOL students to community colleges.
B. Identify and support successful program models that combine ABE/GED/ESOL with occupational skills training.
o Ongoing
o Ongoing
FY2014
Provide Technical Assistance to employers developing proposals.
Support ESOL demo project with collaborating employers.
Create a MOA prioritizing WIA training access to dedicated ABE/ESOL learners who cannot find work
D. Support the inclusion of Career Exploration and Guidance within ABE programs.
o Ongoing Support and promote intention of DOE to add these activities in 5 year plan.
E. Increase the transition of unemployed ABE/ESOL to skill training activities.
o Ongoing Increase percentage of individuals transitioning from ABE/ESOL programs into ITAs or group training.
F. Expand linkage between o Ongoing Require linkage with Career Centers
Page 91
ABE/ESOL programs and Career Centers,
for all MVWIB funded activities for the unemployed or underemployed.
The MVWIB will promote and support activities that will retain or expand employment opportunities for older workers, ex-offenders, people with disabilities and others with perceived barriers to employment.
Activity Timeframe Benchmarks/Indicators A. Identify and develop strategies that will support the hiring and retention of older workers; support employment of people with disabilities; and provide employment opportunities for ex-offenders and other groups with barriers to employment
On-going
On-going
On-going
On-going
On-going
On-going
On-going
On-going
On-going
Build on previous job retention initiatives.
Support collaborative proposal with Operation Able to U.S.DOL.
Provide information to employers on the impact of baby boomer retirements.
Disseminate information on best practices in hiring/retaining older workers.
Seek funding for focused older worker projects within the region.
Participate in forums and events focused on retaining/hiring older workers
Engage in at least one collaborative effort to increase resources for people with disabilities each year.
Ensure employers and employment counselors are aware of tax credits available when hiring individuals in targeted groups.
Provide information and training for staff on assisting individuals with CORI issues to obtain employment.
Youth in the Merrimack Valley Workforce Investment Area will all have access to appropriate services that maximize future employment opportunities.
Activity Timeframe Benchmarks/Indicators
Page 92
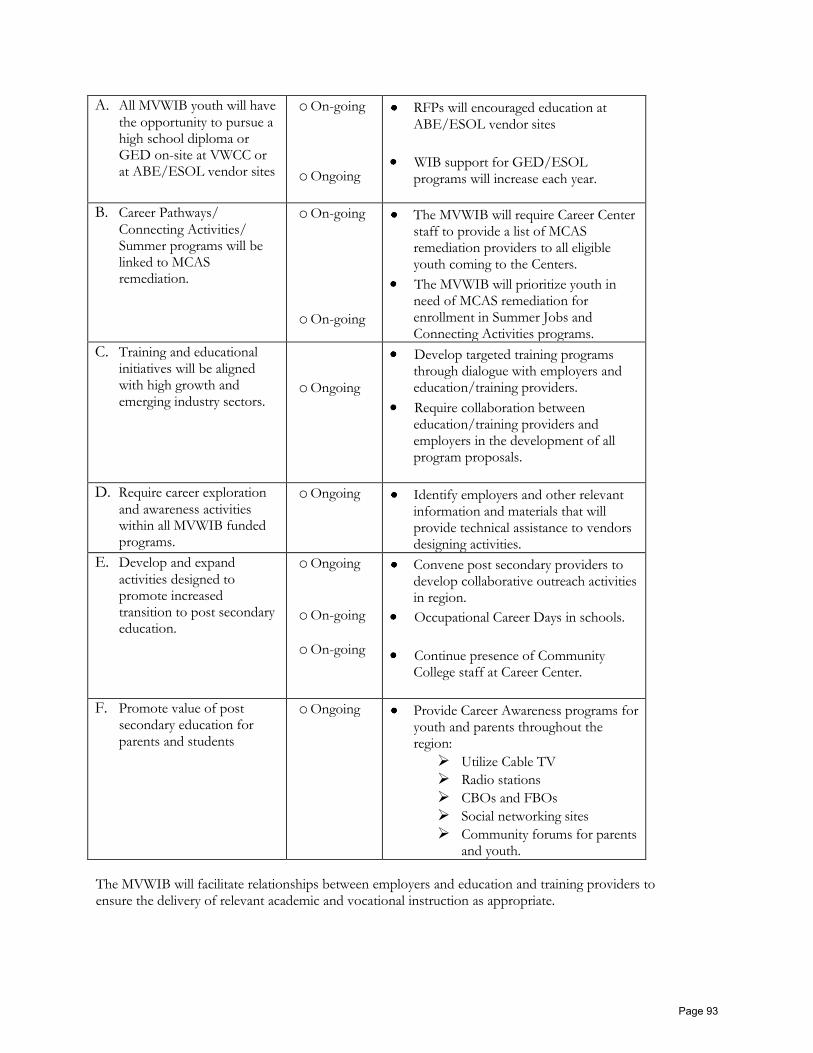
A. All MVWIB youth will have
the opportunity to pursue a high school diploma or GED on-site at VWCC or at ABE/ESOL vendor sites
o On-going
o Ongoing
RFPs will encouraged education at ABE/ESOL vendor sites
WIB support for GED/ESOL programs will increase each year.
B. Career Pathways/
Connecting Activities/ Summer programs will be linked to MCAS remediation.
o On-going
o On-going
The MVWIB will require Career Center staff to provide a list of MCAS remediation providers to all eligible youth coming to the Centers.
The MVWIB will prioritize youth in need of MCAS remediation for enrollment in Summer Jobs and Connecting Activities programs.
C. Training and educational initiatives will be aligned with high growth and emerging industry sectors.
o Ongoing
Develop targeted training programs through dialogue with employers and education/training providers.
Require collaboration between education/training providers and employers in the development of all program proposals.
D. Require career exploration
and awareness activities within all MVWIB funded programs.
o Ongoing Identify employers and other relevant information and materials that will provide technical assistance to vendors designing activities.
E. Develop and expand
activities designed to promote increased transition to post secondary education.
o Ongoing
o On-going
o On-going
Convene post secondary providers to develop collaborative outreach activities in region.
Occupational Career Days in schools.
Continue presence of Community College staff at Career Center.
F. Promote value of post secondary education for parents and students
o Ongoing Provide Career Awareness programs for youth and parents throughout the region:
Utilize Cable TV
Radio stations
CBOs and FBOs
Social networking sites
Community forums for parents and youth.
The MVWIB will facilitate relationships between employers and education and training providers to ensure the delivery of relevant academic and vocational instruction as appropriate.
Page 93
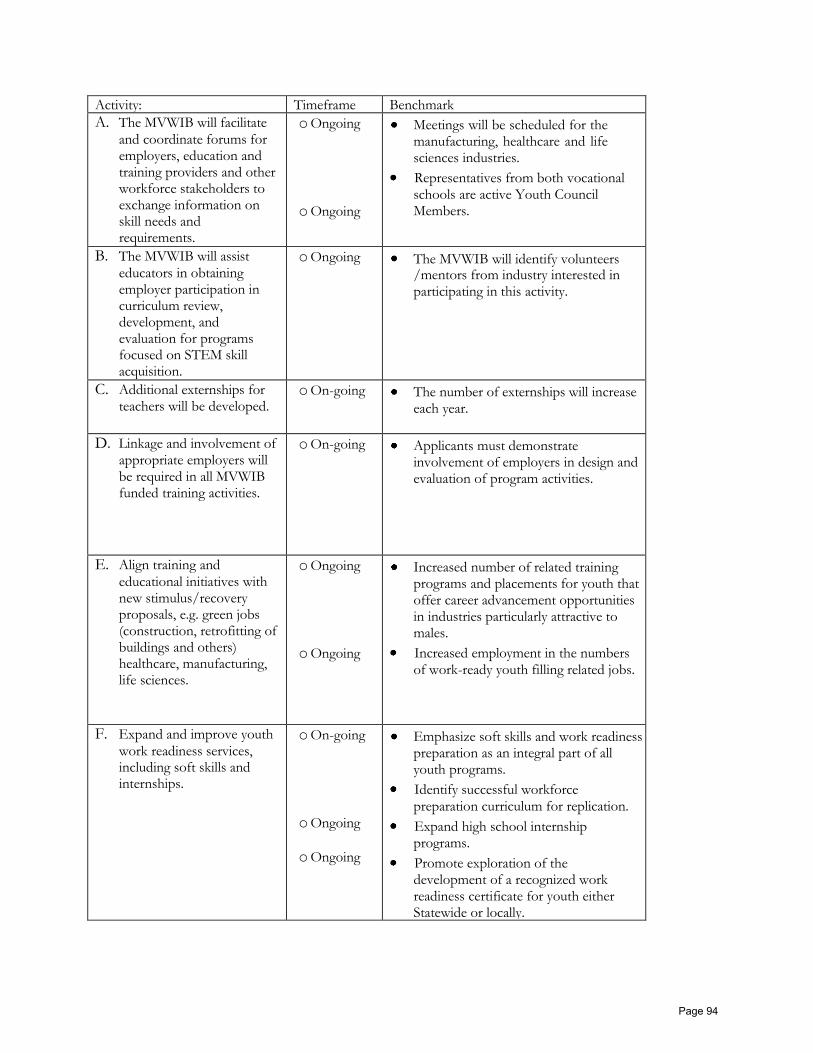
Activity: Timeframe Benchmark
A. The MVWIB will facilitate
and coordinate forums for employers, education and training providers and other workforce stakeholders to exchange information on skill needs and requirements.
o Ongoing
o Ongoing
Meetings will be scheduled for the manufacturing, healthcare and life sciences industries.
Representatives from both vocational schools are active Youth Council Members.
B. The MVWIB will assist
educators in obtaining employer participation in curriculum review, development, and evaluation for programs focused on STEM skill acquisition.
o Ongoing The MVWIB will identify volunteers /mentors from industry interested in participating in this activity.
C. Additional externships for teachers will be developed.
o On-going The number of externships will increase each year.
D. Linkage and involvement of appropriate employers will be required in all MVWIB funded training activities.
o On-going Applicants must demonstrate involvement of employers in design and evaluation of program activities.
E. Align training and
educational initiatives with new stimulus/recovery proposals, e.g. green jobs (construction, retrofitting of buildings and others) healthcare, manufacturing, life sciences.
o Ongoing
o Ongoing
Increased number of related training programs and placements for youth that offer career advancement opportunities in industries particularly attractive to males.
Increased employment in the numbers of work-ready youth filling related jobs.
F. Expand and improve youth
work readiness services, including soft skills and internships.
o On-going
o Ongoing
o Ongoing
Emphasize soft skills and work readiness preparation as an integral part of all youth programs.
Identify successful workforce preparation curriculum for replication.
Expand high school internship programs.
Promote exploration of the development of a recognized work readiness certificate for youth either Statewide or locally.
Page 94

G. Facilitate access to training
and apprenticeship programs for youth in the Merrimack Valley.
o Ongoing
o Ongoing
o Ongoing
Form focus group of representatives from municipalities and the construction and building trades to advise on stimulus bill infrastructure activities and program development.
Encourage hiring requirements for local residents on projects.
Work with NCMP focus group to develop pipeline activities in manufacturing industry.
H. The MVWIB will
continuously monitor and review vendor quality and performance.
o On-going
o
o
o
Quarterly Performance reviews.
Bi Annual on site monitoring.
Program Monitoring reports.
Participant evaluations.
I. The MVWIB will actively
support collaborations of youth serving organizations that provide a continuum of progress toward future employability through integrated programming.
o
o
The MVWIB will research and identify potential models for replication.
The MVWIB will prioritize these models for funding
The MVWIB will support and vendor program options to engage youth, adults and dislocated workers who have significant barriers to employment or are under-employed.
Activity Timeframe Benchmarks/Indicators
A. Support and seek resources
to expand the program options providing ABE/ESOL/GED preparation for youth and adults with less than a high school diploma.
o Ongoing
o Ongoing
Identify potential program models for expansion or development.
Promote and support proposals for additional revenue for services to targeted populations.
B. Examine effectiveness of
One-Stop Career Center services to meet the unique employability needs of adults, dislocated workers and unemployed youth.
o Ongoing
o Ongoing
Increased engagement of older youth, with an emphasis on males in activities at the One-Stop Career Centers.
Partnerships developed with vendor providing new options in vocational training.
C. Increase in numbers of
training options that are more gender neutral.
o Ongoing
o Ongoing
More males enrolled in education and training activities.
More females engaged in training in non-traditional occupations.
Page 95

D. Support development of
non-traditional education models that incorporate educational curriculum and vocational training.
o On-going
o Ongoing
o Ongoing
Continue and expand externship programs to build teacher awareness of “real” job requirements and needed skills.
Support the development of occupational simulations as a teaching and skill development tool.
Convene educators, providers and industry at least once a year for a presentation on MV labor market information and/or roundtable discussion with critical industry employers.
E. Increase outreach and
marketing for youth in places where youth receive services, reside, play, hang- out, etc.
o On-going
o Ongoing
o Ongoing
o Ongoing
MVWIB Youth Council will establish a marketing committee of members and other youth programming stakeholders.
A marketing plan will be developed.
Marketing materials and strategy developed.
Plan executed.
Increase number of at risk youth in region who are aware of and access services at CC.
F. Cultivate role models and
mentors for youth and adults from industry, neighborhoods, and successful graduates of career center programs.
o Mentors will encourage targeted youth to enroll in WIB related programs.
The number of at risk youth participating in career center programs will increase each year.
G. Develop employment pathways for court involved youth and adults.
o Provide CORI-related training to career centers and youth serving organizations to assist youth with criminal records.
Identify models and support development of programming for court involved youth and adults.
Merrimack Valley WIB Strategic Plan Evaluation Method
We work to meet the performance outcomes listed in our Annual Plan. The Merrimack Valley WIB will review progress on its Strategic Plan at least quarterly utilizing the benchmarks, indicators and timeframes delineated in the preceding pages. A status report on the progress made in achieving
Page 96

planned objectives related to the goals and activities will be provided to all MVWIB members at quarterly meeting and will be available to other system stakeholders and interested parties on the MVWIB website bi-annually. In addition the MVWIB provides quarterly reports on the website for all funded activities under the oversight of the WIB including customer utilization statistics and performance data.
Page 97
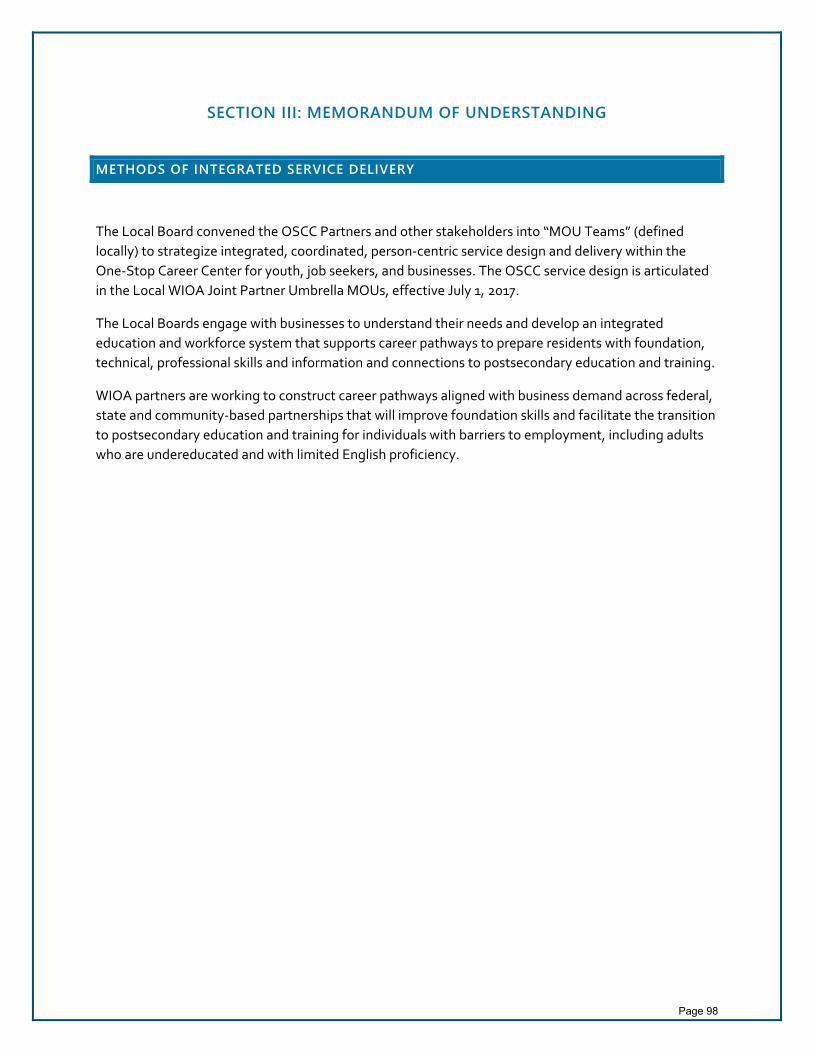
SECTION III: MEMORANDUM OF UNDERSTANDING
METHODS OF INTEGRATED SERVICE DELIVERY
The Local Board convened the OSCC Partners and other stakeholders into “MOU Teams” (defined locally) to strategize integrated, coordinated, person‐centric service design and delivery within the One‐Stop Career Center for youth, job seekers, and businesses. The OSCC service design is articulated in the Local WIOA Joint Partner Umbrella MOUs, effective July 1, 2017.
The Local Boards engage with businesses to understand their needs and develop an integrated education and workforce system that supports career pathways to prepare residents with foundation, technical, professional skills and information and connections to postsecondary education and training.
WIOA partners are working to construct career pathways aligned with business demand across federal, state and community‐based partnerships that will improve foundation skills and facilitate the transition to postsecondary education and training for individuals with barriers to employment, including adults who are undereducated and with limited English proficiency.
Page 98
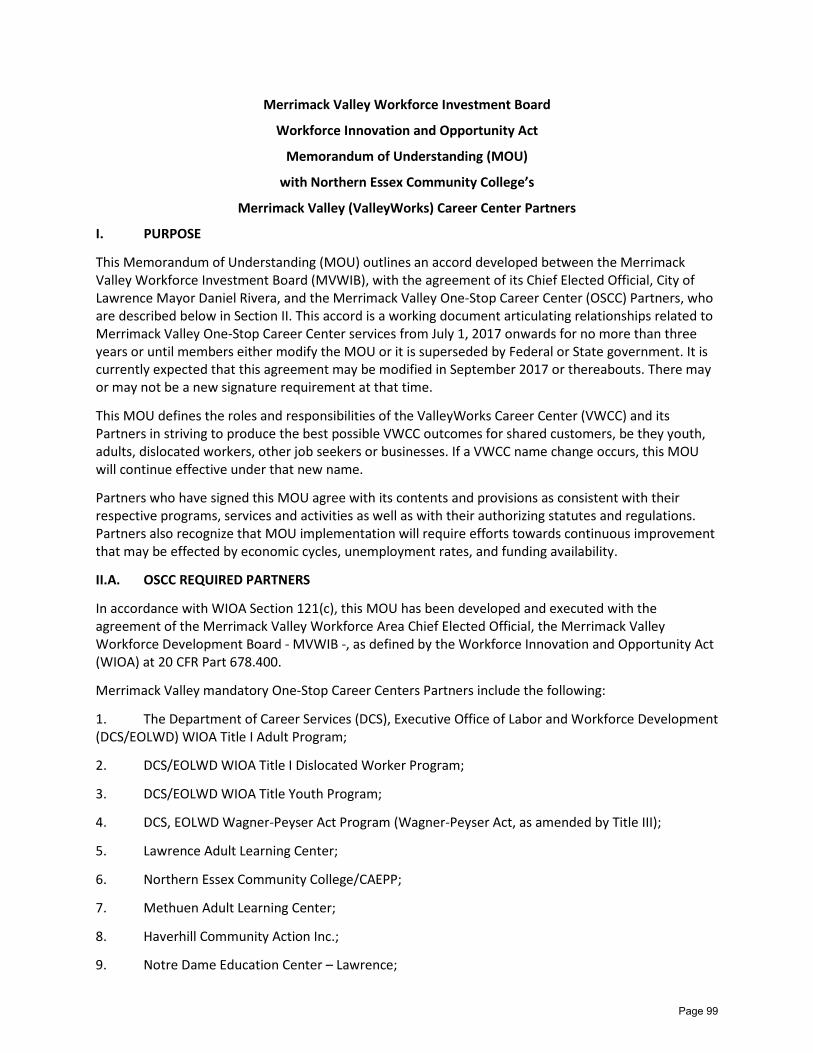
Merrimack Valley Workforce Investment Board
Workforce Innovation and Opportunity Act
Memorandum of Understanding (MOU)
with Northern Essex Community College’s
Merrimack Valley (ValleyWorks) Career Center Partners
I. PURPOSE
This Memorandum of Understanding (MOU) outlines an accord developed between the Merrimack Valley Workforce Investment Board (MVWIB), with the agreement of its Chief Elected Official, City of Lawrence Mayor Daniel Rivera, and the Merrimack Valley One-Stop Career Center (OSCC) Partners, who are described below in Section II. This accord is a working document articulating relationships related to Merrimack Valley One-Stop Career Center services from July 1, 2017 onwards for no more than three years or until members either modify the MOU or it is superseded by Federal or State government. It is currently expected that this agreement may be modified in September 2017 or thereabouts. There may or may not be a new signature requirement at that time.
This MOU defines the roles and responsibilities of the ValleyWorks Career Center (VWCC) and its Partners in striving to produce the best possible VWCC outcomes for shared customers, be they youth, adults, dislocated workers, other job seekers or businesses. If a VWCC name change occurs, this MOU will continue effective under that new name.
Partners who have signed this MOU agree with its contents and provisions as consistent with their respective programs, services and activities as well as with their authorizing statutes and regulations. Partners also recognize that MOU implementation will require efforts towards continuous improvement that may be effected by economic cycles, unemployment rates, and funding availability.
II.A. OSCC REQUIRED PARTNERS
In accordance with WIOA Section 121(c), this MOU has been developed and executed with the agreement of the Merrimack Valley Workforce Area Chief Elected Official, the Merrimack Valley Workforce Development Board - MVWIB -, as defined by the Workforce Innovation and Opportunity Act (WIOA) at 20 CFR Part 678.400.
Merrimack Valley mandatory One-Stop Career Centers Partners include the following:
1. The Department of Career Services (DCS), Executive Office of Labor and Workforce Development (DCS/EOLWD) WIOA Title I Adult Program;
2. DCS/EOLWD WIOA Title I Dislocated Worker Program;
3. DCS/EOLWD WIOA Title Youth Program;
4. DCS, EOLWD Wagner-Peyser Act Program (Wagner-Peyser Act, as amended by Title III);
5. Lawrence Adult Learning Center;
6. Northern Essex Community College/CAEPP;
7. Methuen Adult Learning Center;
8. Haverhill Community Action Inc.;
9. Notre Dame Education Center – Lawrence;
Page 99

10. International Institute of Greater Lawrence;
11. The Vocational Rehabilitation Program (Title I of the Rehabilitation Act of 1973, as amended by Title IV), Massachusetts Rehabilitation Commission (MRC);
12. The Massachusetts Commission for the Blind (MCB), Executive Office of Health and Human Services (EOHHS);
13. The Department of Unemployment Assistance (DUA), Massachusetts’ EOLWD Federal-state unemployment compensation program;
14. DCS/EOLWD’s Trade Adjustment Assistance (TAA) for Workers Programs whose activities are authorized under chapter 2 of Title II of the Trade Act of 1974 (19 U.S.C. 2271 et seq.);
15. The DCS, EOLWD Jobs for Veterans State Grants Program (authorized under 38, U.S.C. 4100 et. seq.);
16. The EOHHS Department of Transitional Assistance (DTA), Temporary Assistance for Needy Families Program (42 U.S.C. 601 et seq.);
17. The DTA, EOHHS Employment and Training Programs funded under the Supplemental Nutrition Assistance Program [SNAP], (Programs authorized under section 6(d)(4) of the Food and Nutrition Act of 2008 (7 U.S.C.2015(d)(4));
18. Senior Community Service Employment Program (Programs authorized under Title V of the Older Americans Act pf 1965 (42 U.S.C. 3056 et seq.));
19. Greater Lawrence Community Action Council, a Community Based Organization (CBO).
II. B. MOU Development Process
To develop this document, partners met about monthly from the January to June 2017. MVWIB convened meetings on the dates decided by a majority of attending partners. Partners could either call in or attend face-to-face meetings. All meetings occurred in the City of Lawrence with the first two meetings occurring at 439 South Union Street and the last four at 255 Essex Street. Meeting minutes were kept for several months. After that, work done on the written MOU served as the meeting record. Most MOU wording decisions were arrived at through consensus but there were a few votes, especially related to Career Center MOU membership.
III.A. DURATION OF THE MOU
WIOA Section 12l(c)(g) requires that this MOU be periodically reviewed to ensure appropriate funding and delivery of services, effectiveness, physical and programmatic accessibility and correlation with updated WIOA regulations. WIOA Regulations Subpart C 20 CFR Part 678.500 further requires MOU renewal following reviews that occur at least once every three years. If no substantial changes occur in this written MOU, it can be extended.
This agreement shall commence on July 1, 2017 and shall terminate on June 30th, 2020 unless either extended, terminated by agreement of all parties, or superseded by Federal or State authority.
III.B. Partner Meeting Schedule
Partners will participate in regularly scheduled quarterly meetings. Separate ad hoc or subcommittee meetings may also be scheduled as needed but all members must be notified of those meeting in a timely way.
Page 100

III.C. Meeting Quorum and Bilateral Agreements with single partners
Quorum will be met if five members or member delegates are in attendance. Changes to Standard Operating Procedures, shared customer definitions, shared customer tracking or anything deemed worthy of review by a majority of members, must be included in meeting agendas for at least a month prior to a final decision being made.
Bilateral agreements between the MVWIB/Career Center and a specific partner, DTA for example, may be executed without consulting all members so long as that bilateral agreement does not directly impact other partners or partner customers in a significant way. Whenever possible, bilateral agreement copies will be shared with partners for comment prior to their release. They will also be included as addendums to this document.
(Information on priority populations is provided below in Section V.)
IV. ASSURANCES
The Merrimack Valley Workforce Development Board (MVWIB) and the Merrimack Valley OSCC Partners agree to the following:
1. Conducting an ongoing assessment of this MOU to incorporate necessary modifications in order to achieve continuous improvements to Merrimack Valley’s one-stop delivery system.
2. Participating in the operation of the one-stop delivery system consistent with the terms of this MOU, the requirements of WIOA, and the requirements of Federal laws authorizing WIOA programs and activities.
3. Updating and further detailing the definition of Partner "shared" customers to create an ever clearer understanding of how multiple providers, services and resources should best support youth, job seekers, and businesses.
4. Refining One-Stop Career Center customer flow and service practices across partner agencies, ensuring continuously improved access and service availability to "shared" customers.
5. Utilizing robust technology tools to scale-up practices and provide more significant supports for individuals with barriers to employment, including basic skills assessment, remediation, and career development, while also recognizing that whatever tools are used must productively connect with statewide data gathering systems and that those statewide stove-pipe systems may limit how robust scale-ups will be. Attempts may be made to jointly purchase or develop regional IT products or processes that will help partners share information or communicate.
6. Tracking and evaluating the outcome of services offered to individuals with barriers to employment, especially shared customers.
7. Using some funds or resources available for programs and activities to maintain the one-stop delivery system, including the infrastructure and shared costs of our two One-Stop Career Centers, by methods mutually agreed upon by State Secretariats, the MVWIB, the Merrimack Valley Chief Elected Official, and the Merrimack Valley OSCC Partners. When no consensus on methods is reached, the Governor, after consultation with the Chief Elected Official, the MVWIB and Massachusetts’ State Workforce Development Board shall determine the portion of funds to be provided (WIOA sec. 121(a) (h) (1) (C)).
8. Provide representation on the MVWIB as requested by the MVWIA CEO and/or, participate in MVWIB ad hoc activities/events or standing committees.
Page 101
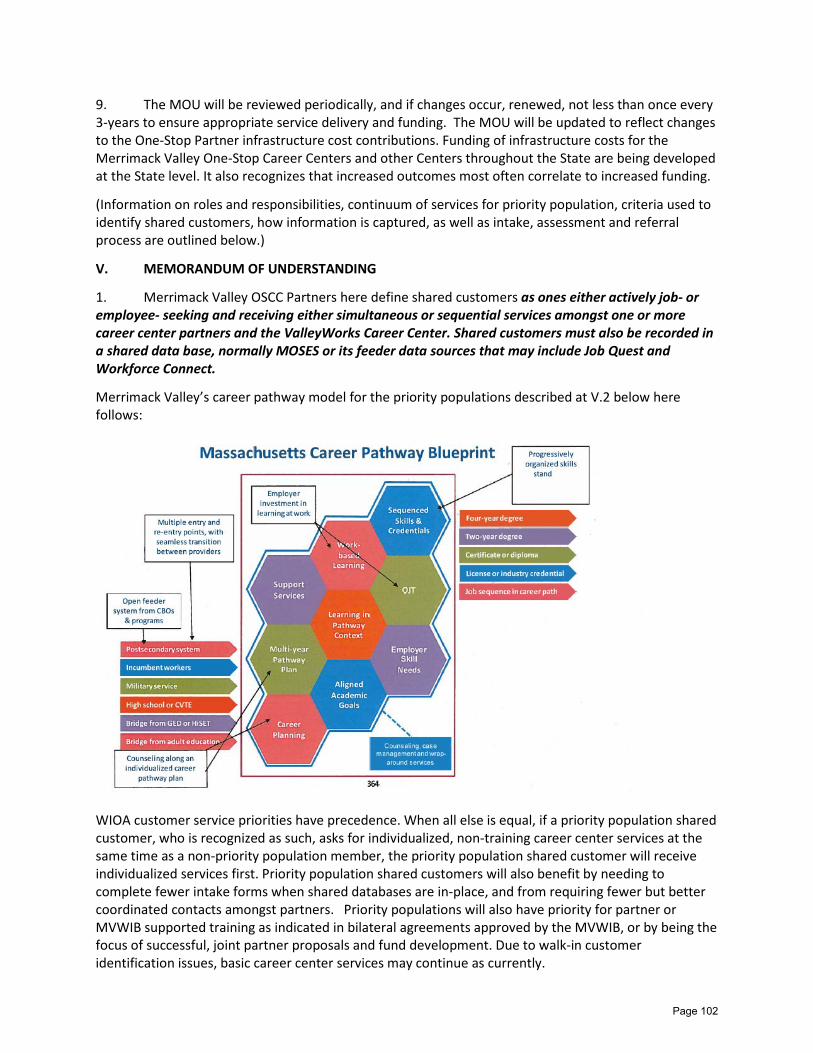
9. The MOU will be reviewed periodically, and if changes occur, renewed, not less than once every 3-years to ensure appropriate service delivery and funding. The MOU will be updated to reflect changes to the One-Stop Partner infrastructure cost contributions. Funding of infrastructure costs for the Merrimack Valley One-Stop Career Centers and other Centers throughout the State are being developed at the State level. It also recognizes that increased outcomes most often correlate to increased funding.
(Information on roles and responsibilities, continuum of services for priority population, criteria used to identify shared customers, how information is captured, as well as intake, assessment and referral process are outlined below.)
V. MEMORANDUM OF UNDERSTANDING
1. Merrimack Valley OSCC Partners here define shared customers as ones either actively job- or employee- seeking and receiving either simultaneous or sequential services amongst one or more career center partners and the ValleyWorks Career Center. Shared customers must also be recorded in a shared data base, normally MOSES or its feeder data sources that may include Job Quest and Workforce Connect.
Merrimack Valley’s career pathway model for the priority populations described at V.2 below here follows:
WIOA customer service priorities have precedence. When all else is equal, if a priority population shared customer, who is recognized as such, asks for individualized, non-training career center services at the same time as a non-priority population member, the priority population shared customer will receive individualized services first. Priority population shared customers will also benefit by needing to complete fewer intake forms when shared databases are in-place, and from requiring fewer but better coordinated contacts amongst partners. Priority populations will also have priority for partner or MVWIB supported training as indicated in bilateral agreements approved by the MVWIB, or by being the focus of successful, joint partner proposals and fund development. Due to walk-in customer identification issues, basic career center services may continue as currently.
Page 102
The MVWIB strives to ensure that WIOA funds are effectively used to increase employment, job retention, and economic prosperity. Because the need is great and funding is not, it is understood that MVWIB limits the occurrence of individual WIOA Title I paid education or skills training to no more than one program every five years, the clock starting at the end of q program. A customer’s assessed education, skills and desire to work also have bearing on MVWIB policies for WIOA Title I training. Regional services will be provided in accordance with regional WIOA WDB policies.
MVWIB WIOA Title I training has learning for employment and job retention as its primary positive outcome. All training enrollees must be able to learn taught material within the time-lines MVWIB develops with contracted training vendors. Supplementary, non-WIOA funds may, however, be available to certain individuals previously enrolled in WIOA Title I training and/or education programs or whose desire to work and stay at a job are more questionable. The MVWIB will continue to set policy and prioritize WIOA Title I training fund allocations amongst customers with barriers as needed to maximize effective use of increasingly limited resources.
2. At a minimum, Merrimack Valley priority populations include unemployment insurance claimants; low-income adults including TANF and SNAP recipients; homeless people; Adult Education participants (Title II); individuals with disabilities (Vocational Rehabilitation Title IV); Veterans; older workers; re-entry populations; and, youth, including youth with barriers to employment. All individuals to be served as shared customers will have demonstrated clear interest in finding, keeping, and aspiring to jobs that correspond to their individual educational and skill levels.
Specialized partner services will be supplemented with career center case management or supportive services as warranted and necessary without duplication amongst the specialized partner service providers and VWCC. To minimize repetitive form completion, we will work to use a secure, non-redundant shared databases to which information can be added and tracked as needed by partners. We currently expect MOSES, JobQuest and Workforce Connect to fulfill this requirement.
The Merrimack Valley contains an increasing number of working poor, other low-income people, disabled people, and others, all of whom have barriers to employment. Job skills training to selected individuals will normally be paid for using WIOA Title I or MRC funds. In recognition that there are insufficient WIOA Title I funds to job train many of them, employment-related academic remediation will normally be conducted by WIOA Title II contractors. WIOA Title II students recommended for Title I training may be enrolled in that training if both the MVWIB, Career Center Director and Training vendor agree.
Other, non-WIOA Title I funds will be sought by MVWIB and OSCC Partners, often in collaboration with each other. Special populations will normally receive primary services from entities whose mission it is to provide those specialized services. Reinforcing career center services will be provided as possible and necessary for employment and job retention. Services to under-employed or unemployed people will focus on helping them find work and stay in jobs. Services will be designed to match the needs of hiring employers.
Balancing the mix of partner services to under-employed or unemployed people will require ongoing discussions and adjustments based on economic conditions, unemployment rates, and workforce development funding. There is little doubt that partners must work together to deal with actual and future funding cuts. Although no level of joint planning and coordinated service delivery can compensate for significantly reduced funding, they can help us better deal with related issues and better serve our shared customers.
3. The continuum of services available for each of our priority populations is based on a customer-focused design or career pathway model as indicated below. OSCC partners will take part in the following:
Page 103

• no less than once every four years, select a career center operator to lead the continuum of services;
• develop a shared vision and culture for the MV OSCCs that acknowledges the key role each individual and all partners play in its success; the vision will also acknowledge that we are continuously balancing different customer interests, including different job seeker and employer interests. Partners will have an ongoing dialogue on how to best to balance What is best for unemployed or underemployed individuals and what is best for employer customers;
• balance and rebalance unemployed, underemployed and employer interests in ways that maximize both individual and corporate responsibility, workforce development; and economic growth;
• strive to improve and attain a seamless delivery system with complimentary activities (i.e. workshop presentation, case management assessment, data entry, etc.) that maximize use of the most talented partner and career center staff members in non-duplicative ways – staff integration is fostered but individual professional expertise and strengths amongst partners’ individual staff members are highlighted and shared;
• work with ABE and ESOL partners to refine customer referrals between WIOA Title II and WIOA Title I systems with complimentary funding opportunities sought to support individual career pathway initiatives and area employers;
• consult with, and form a central leadership team among whom there may be Department of Transitional Assistance, Massachusetts Rehabilitation Commission, and Commission for the Blind staff, and other organization’s staff who may be interested, to help continuously improve the provision of career center services to shared customers;
• strengthen VWCC services to veterans and people with disabilities by balancing compliance with Federal priority guidelines with the well-planned use of staff time in service to unemployed or underemployed individuals and employee-seeking employers;
• coordinate with the Merrimack Valley Workforce Investment Board and other career center partners to attract additional resources to the region, including federal, state, and privately-funded demonstration grants;
• periodically review MOSES data with partners to help continuously improve effective service delivery to unemployed and underemployed customers;
• Along with center staff, ascertain the need for any space design changes to continuously improve the quality and efficient delivery of services to career center and partner customers;
• Share respective partner data to analyze their correlation with OSCC data. Similar, shared data reviews will offered when they provide information that may improve career center services. Subject to applicable legal constraints, including but not necessarily limited to those contained in G. L. 151A and 20 C.F.R. Pt. 603, the parties of this MOU agree to seek increased data sharing with a view to improving the quality of service-delivery to both job-seekers and business-customers. The Party whose data is requested to be shared shall be the judge, in its sole discretion, of the legal constraints governing whether and how its data may be shared. The parties of this MOU also understand that a shared data system is being designed at the state level to fully support the development and implementation of a state-level data system, subject to the foregoing limitations.
The next page shows a figure outlining customer flow across MOU partners for each priority population. As stated above, the description presupposes that we define Shared Customers as ones actively employee-seeking or job seeking and receiving simultaneous or sequential job readiness services amongst one or more career center partners and the career center. Not all partner customers may be ‘Shared’ ones.
Page 104
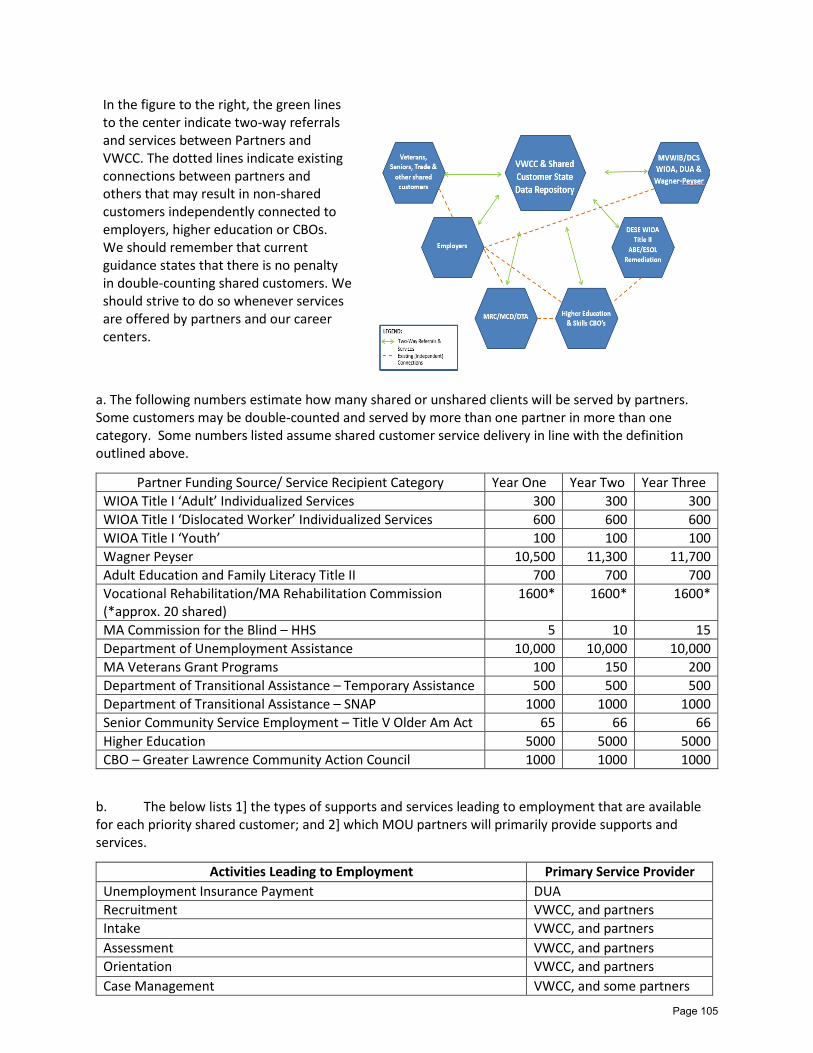
In the figure to the right, the green lines to the center indicate two-way referrals and services between Partners and VWCC. The dotted lines indicate existing connections between partners and others that may result in non-shared customers independently connected to employers, higher education or CBOs. We should remember that current guidance states that there is no penalty in double-counting shared customers. We should strive to do so whenever services are offered by partners and our career centers.
a. The following numbers estimate how many shared or unshared clients will be served by partners. Some customers may be double-counted and served by more than one partner in more than one category. Some numbers listed assume shared customer service delivery in line with the definition outlined above.
Partner Funding Source/ Service Recipient Category Year One Year Two Year Three WIOA Title I ‘Adult’ Individualized Services 300 300 300 WIOA Title I ‘Dislocated Worker’ Individualized Services 600 600 600 WIOA Title I ‘Youth’ 100 100 100 Wagner Peyser 10,500 11,300 11,700 Adult Education and Family Literacy Title II 700 700 700 Vocational Rehabilitation/MA Rehabilitation Commission (*approx. 20 shared)
1600* 1600* 1600*
MA Commission for the Blind – HHS 5 10 15 Department of Unemployment Assistance 10,000 10,000 10,000 MA Veterans Grant Programs 100 150 200 Department of Transitional Assistance – Temporary Assistance 500 500 500 Department of Transitional Assistance – SNAP 1000 1000 1000 Senior Community Service Employment – Title V Older Am Act 65 66 66 Higher Education 5000 5000 5000 CBO – Greater Lawrence Community Action Council 1000 1000 1000
b. The below lists 1] the types of supports and services leading to employment that are available for each priority shared customer; and 2] which MOU partners will primarily provide supports and services.
Activities Leading to Employment Primary Service Provider Unemployment Insurance Payment DUA Recruitment VWCC, and partners Intake VWCC, and partners Assessment VWCC, and partners Orientation VWCC, and partners Case Management VWCC, and some partners
Page 105
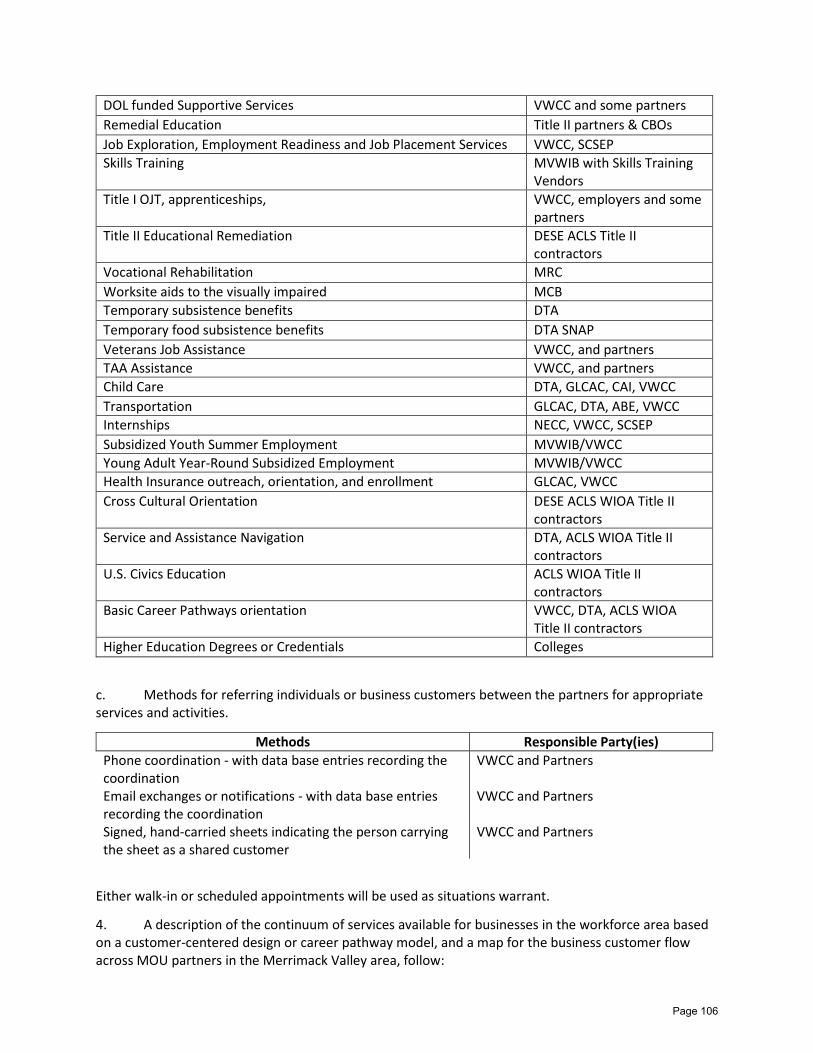
DOL funded Supportive Services VWCC and some partners Remedial Education Title II partners & CBOs Job Exploration, Employment Readiness and Job Placement Services VWCC, SCSEP Skills Training MVWIB with Skills Training
Vendors Title I OJT, apprenticeships, VWCC, employers and some
partners Title II Educational Remediation DESE ACLS Title II
contractors Vocational Rehabilitation MRC Worksite aids to the visually impaired MCB Temporary subsistence benefits DTA Temporary food subsistence benefits DTA SNAP Veterans Job Assistance VWCC, and partners TAA Assistance VWCC, and partners Child Care DTA, GLCAC, CAI, VWCC Transportation GLCAC, DTA, ABE, VWCC Internships NECC, VWCC, SCSEP Subsidized Youth Summer Employment MVWIB/VWCC Young Adult Year-Round Subsidized Employment MVWIB/VWCC Health Insurance outreach, orientation, and enrollment GLCAC, VWCC Cross Cultural Orientation DESE ACLS WIOA Title II
contractors Service and Assistance Navigation DTA, ACLS WIOA Title II
contractors U.S. Civics Education ACLS WIOA Title II
contractors Basic Career Pathways orientation VWCC, DTA, ACLS WIOA
Title II contractors Higher Education Degrees or Credentials Colleges
c. Methods for referring individuals or business customers between the partners for appropriate services and activities.
Methods Responsible Party(ies) Phone coordination - with data base entries recording the coordination
VWCC and Partners
Email exchanges or notifications - with data base entries recording the coordination
VWCC and Partners
Signed, hand-carried sheets indicating the person carrying the sheet as a shared customer
VWCC and Partners
Either walk-in or scheduled appointments will be used as situations warrant.
4. A description of the continuum of services available for businesses in the workforce area based on a customer-centered design or career pathway model, and a map for the business customer flow across MOU partners in the Merrimack Valley area, follow:
Page 106

MVWIB/VWCC and MOU signatories will endeavor to do the following:
• partner with local employers to create solutions to their workforce training needs, while creating training and retraining opportunities for the region's unemployed, underemployed, and incumbent workers;
• generate an increased number of employer-paid training grants with partners and employers; • partner with employer-based unions as desired and appropriate.
5. Merrimack Valley OSCC Partners and the MVWIB recommended that NECC be chosen as OSCC Operator and the MV CEO accepted their recommendation. Apart from two MVWIB/OSCC IT staff and about two hundred computers, NECC has 2,400 computers connected to a shared network and overseen by an IT Department with 10 full-time staff. The IT Department is responsible for maintaining the network, servers, and computers, including installing and upgrading software, ensuring the integrity of the security system, repairing computers and data lines as needed, and tracking the life-cycles of all hardware for scheduled replacement. NECC IT tasks are managed using KACE, a state-of-the art systems management software.
NECC's Learning Accommodations Center ensures that the college complies with Section 504 of the Rehabilitation Act and with the Americans with Disabilities Act. The Learning Accommodations Center works with students facing a variety of physical and learning challenges to ensure that they have access to the services they need to maximize their academic experience at the college. The college is also the Regional Center for Gallaudet University, which has led advancements for the deaf and hard-of-hearing for over 150 years.
As stated by a 12/2/16 EOLWD release “Vocational Rehabilitation, Workforce Boards, One-Stop Career Centers, adult education, community colleges and other partners work together to support long-term progress for individuals along a skills and employment pathway. Several key practices are consistent:
Referral and Co-enrollment Practices for Performance
1. Consumer visits the Career Center and discloses to the worker that they have a disability. The consumer is offered OSCC orientation and assistance with Job Quest Portal. Consumer is asked if he/she is enrolled with VR. If the answer is no, then they should be asked if they would like to be referred to VR.
Page 107
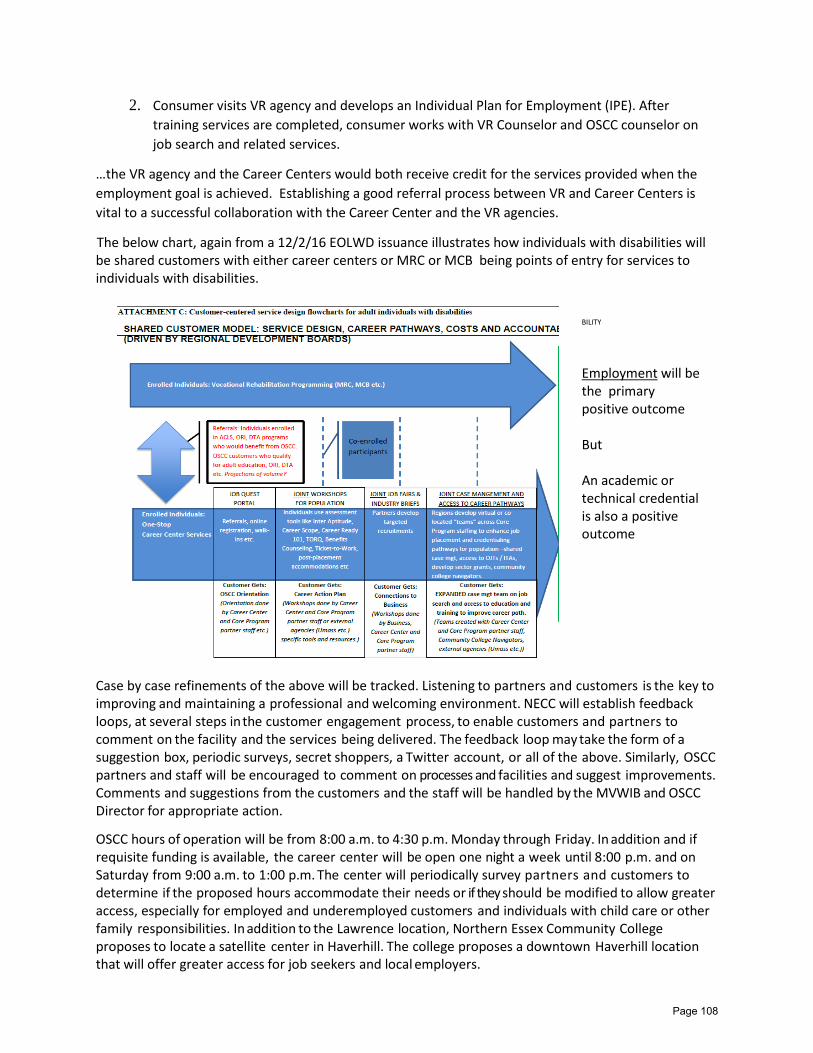
2. Consumer visits VR agency and develops an Individual Plan for Employment (IPE). After training services are completed, consumer works with VR Counselor and OSCC counselor on job search and related services.
…the VR agency and the Career Centers would both receive credit for the services provided when the employment goal is achieved. Establishing a good referral process between VR and Career Centers is vital to a successful collaboration with the Career Center and the VR agencies.
The below chart, again from a 12/2/16 EOLWD issuance illustrates how individuals with disabilities will be shared customers with either career centers or MRC or MCB being points of entry for services to individuals with disabilities.
BILITY
Employment will be the primary positive outcome But An academic or technical credential is also a positive outcome
Case by case refinements of the above will be tracked. Listening to partners and customers is the key to improving and maintaining a professional and welcoming environment. NECC will establish feedback loops, at several steps in the customer engagement process, to enable customers and partners to comment on the facility and the services being delivered. The feedback loop may take the form of a suggestion box, periodic surveys, secret shoppers, a Twitter account, or all of the above. Similarly, OSCC partners and staff will be encouraged to comment on processes and facilities and suggest improvements. Comments and suggestions from the customers and the staff will be handled by the MVWIB and OSCC Director for appropriate action.
OSCC hours of operation will be from 8:00 a.m. to 4:30 p.m. Monday through Friday. In addition and if requisite funding is available, the career center will be open one night a week until 8:00 p.m. and on Saturday from 9:00 a.m. to 1:00 p.m. The center will periodically survey partners and customers to determine if the proposed hours accommodate their needs or if they should be modified to allow greater access, especially for employed and underemployed customers and individuals with child care or other family responsibilities. In addition to the Lawrence location, Northern Essex Community College proposes to locate a satellite center in Haverhill. The college proposes a downtown Haverhill location that will offer greater access for job seekers and local employers.
Page 108

The Lawrence Center is closer to residents of Lawrence, Methuen, Andover, and North Andover; while the satellite would offer greater convenience to residents from Haverhill, Merrimack, Boxford, Georgetown, and Groveland. To ensure that the communities in the north/east sector (i.e. Amesbury, Newburyport, Newbury, West Newbury, Rowley, and Salisbury) have access to services, the college will work with local libraries, not-for-profit organizations, and town and city offices to coordinate service delivery. The college proposes to explore ways to regularly deploy staff in those communities and also use technology tools, such as video conferencing, to deliver workshops. One potential option is scheduling one-on-one career counseling sessions via skype at central locations.
Please note that the above will be influenced by funding negotiations, actual funding, and state-level approval when individual partner staffing is involved. 6. MV OSCC Partner Northern Essex Community College is committed to staff development and training. As one of the college's strategic initiatives for the coming years, the Dean of Academic Innovation and Professional Development has created a comprehensive catalogue of career development and training options, including courses, certificates, and programs offered by NECC, as well as options offered by external providers.
The one-stop career center will adopt the staff development process used by the college, which starts with an initial benchmark profile of each staff person. The college requires all staff to take a Strengths/Quest analysis. As the name implies, the analysis presents a profile that emphasizes the individual's strengths. Examples of identified strengths include: Discipline, Analytical, Context, Relative, and Achiever. The Strengths/Quest profile gathers facts about the individual's education, credentials, work experience, specific skills, interests, and personal, career, and education goals. The next step involves a plan, with a timeline, to identify the professional development opportunities the individual would like to access. VWCC staff will be eligible for a range of professional development options, and, in some cases, may be eligible for college tuition waiver programs for staff and their families. MV OSCC partners will be invited to participate in some of the above activities as financially reasonable and possible.
7. We assure Federal and State authorities that Merrimack Valley OSCC Partners participated in the FY 2017’s competitive selection process for the One-Stop Career Center lead operator and that they will do so again in the future.
8a. Parties of this MOU agree that all required partners have funding responsibility to support and maintain effective and integrated services. Parties to this MOU recognize that shared and infrastructure costs are applicable to all required Partners. To ensure that MVWIB and required Partners can focus on quality services to shared customers, State Level Partners will issue allocations for shared and infrastructure costs to Massachusetts Regional Workforce Areas. State Partners will establish a methodology to ensure that costs are allowable, reasonable, necessary and allocable. As appropriate, State Partners will enter into Inter-agency Service Agreements (ISAs) with the Department of Career Services (DCS), the designated State Workforce Agency (SWA) to issue the local allocations. Local Boards will incorporate those allocations into their integrated budget during annual planning.
8b. VWCC and DTA concluded bilateral negotiations for their local relationship and other partners are encouraged to do so when so guided by their parent Secretariat. They are also encouraged to share contract details with other area career center partners via bi-lateral contracts to be included as addendums to this MOU. Merrimack Valley funding agreements satisfy the requirements of WIOA section 121(h) for purposes of funding the one-stop system in PY 2017 and 18.
The following chart, from a 12/2/16 EOLWD release, illustrates the broad outlines of State or Regional Career Center/Partner process agreements.
Page 109

Employment will be the primary positive outcome But An academic or technical credential is also a positive outcome
8c. DUA will provide information under this agreement to another party to this agreement only: -upon the determination by the DUA Director that the information lawfully may be provided in accordance with applicable law, including, but not limited to, G. L. c. 151A, § 14P and § 46, and 20 C.F.R. Pt. 603; -following approval by DUA of an Application for Unemployment Insurance and/or Wage Reporting Data (there is a current form in the attachments to this agreement which DUA reserves the right to modify in its sole discretion); and -following execution by DUA and an approved applicant of a Data Sharing and Cost Reimbursement Agreement (currently in the forms attached for confidential data and for non-confidential data, which DUA reserves the right to modify in its sole discretion).
DUA will not be bound by any provision of this agreement that does not expressly mention DUA by name. 9. This MOU if effective from July 1, 2017 to June 30, 2020 unless otherwise terminated by agreement of all parties or superseded by Federal or State action. If individuals who sign this MOU resign or otherwise leave their position, its guidelines will be observed by the entities they represented unless terminated by agreement of all parties or otherwise superseded.
11. WIOA Sections 12l(c) (g) requires that this MOU be reviewed not less than once every 3-year period to ensure appropriate funding and delivery of services, effectiveness, physical and programmatic accessibility. WIOA Regulations Subpart C 20 CFR Part 678.500 further requires MOU renewal following the 3-year review if substantial changes have occurred or an extension if changes are just minor. The Merrimack Valley Career Center Partners agree to these requirements.
12. The following provisions are agreed to by all parties insofar as they are consistent with partner services and activities, authorizing statutes, and regulations:
Page 110
a. When two or more customers simultaneously request services, shared customers will receive priority for individualized services over non-shared customers. Service priority implies that individualized service wait times will be shortened for shared customers. b. Partners will sponsor shared customer and staff internships at each other’s’ work sites when such internships enhance customer services and result in more benefits than costs. c. Partners will share staff who have outstanding public presentation, explanatory, motivational, or organizational abilities for short-term customer service events or for staff development when such sharing does not disrupt services at individual partner worksites. Whenever possible, people best at some activity may be used by partners regardless of funding source. d. Insofar as shared customers can be better served as a result of staff development workshops, partners will offer their staff quarterly or biannual staff development workshops explaining who constitutes their primary shared customers and how those customers are served. e. Since WIOA does not require a sequence of services and staff are being familiarized with various types of jobs, intake, assessment, data entry and other preliminary work done at one partner site may be used by career center and partner staff to plan or provide other services. f. Compliance with all applicable Federal regulations is always to be sought while also creatively managing staff and staff time to cost-effectively serve all shared customers.
13. The MOU includes all current requirements as set-forth in WIOA MOU policy guidance dated December 2nd, 2016.
14. The Merrimack Valley MOU reflects an agreement of the MOU Partners to jointly review the WIOA mandated performance metrics for the region or metrics negotiated as part of any shared and infrastructure contract costs between a Merrimack Valley Workforce Investment Board and the mandated OSCC Partners, including incentives and penalties.
The MOU is fully executed when it contains the signatures of the Merrimack Valley Board, OSCC Required Partners, and the Chief Elected Official (CEO) and states the duration for which the MOU is in effect.
As stated above the MOU must be updated not less than once every 3 years to reflect any changes in the signatory official of the Board, One-Stop Partners, and Chief Elected Official (CEO) or changes to infrastructure cost contributions.
VI. COMPETITIVE SELECTION OF ONE STOP CAREER CENTERS
The WIOA Required Partners agree to participate in the selection process of One-Stop Operators as required by WIOA, at least once every 4 years.
VII. PERFORMANCE MEASURES
The Merrimack Valley WIB, our Workforce Development Board, in agreement with the VWCC Required Partners, agree to jointly review the WIOA mandated performance metrics for this workforce area and/or other metrics negotiated as part of any shared costs contract developed by either the Merrimack Valley Workforce Investment Board and the mandated One- Stop Career Center partners or at the State level, including incentives and penalties.
Page 111
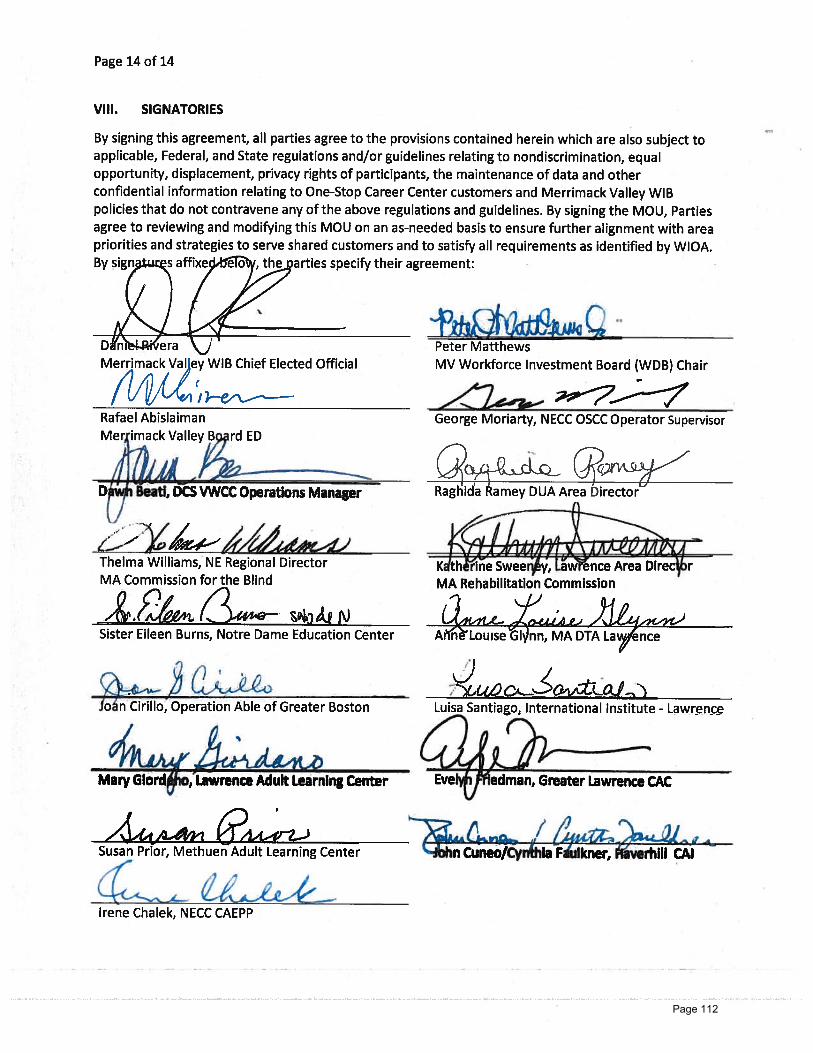
Page 14 of 14
VIII. SIGNATORIES
By signing this agreement, all parties agree to the provisions contained herein which are also subject toapplicable, Federal, and State regulations and/or guidelines relating to nondiscrimination, equalopportunity, displacement, privacy rights of participants, the maintenance of data and otherconfidential information relating to One-Stop Career Center customers and Merrimack Valley WIBpolicies that do not contravene any of the above regulations and guidelines. By signing the MOU, Partiesagree to reviewing and modifying this MOU on an as-needed basis to ensure further alignment with areapriorities and strategies to serve shared customers and to satisfy all requirements as identified by WIOA.By sign.tus affixe&1v, th]?arties specify their agreement:
Peter MatthewsMV Workforce Investment Board (WDB) ChairMerrimack Val ey WIB Chief Elected Official
(
,3--Rafael AbislaimanMer imack Valley B rd ED
41 cii& fr—Beati, DCS VWCC Operations Manager
Thelma Williams, NE Regional DirectorMA Commission for the Blind
/g. N
Sister Eileen Burns, Notre Dame Education Center
fon Cirillo Operation Able of Greater Boston
-?7George Moriarty, NECC 05CC Operator Supervisor
CcRaghida Ramey DUA Area Director
2vK th tine Swee y, aw ence Area Direc rMA Rehabilitation Commission
A n Louise GI nn, MA DTA Laynce
%JA4AL4Mary Glord , Lawrence Aduft Learning Center
%%4i AfrZ)Susan Prior, Methuen Adult Learning Center
/_ 1
-ta-r_Irene Chalek, NECC CAEPP
LtDC__’ o1,ti.&I-Luisa Santiago, International Institute - Lawrenc
man,GateZZAC
/ ia—2In Cuneo/Cynhla Faulkner, verhllI CAl
Page 112
SECTION IV: PARTICIPANT SUMMARIES AND PERFORMANCE INDICATORS
CAREER CENTER PARTICIPANT AND OUTCOME SUMMARIES
PROFILE OF CAREER CENTER CUSTOMERS
A profile of customers served at the One‐Stop Career Centers in the workforce area during Fiscal Year 2017 (July 1, 2016 – June 30, 2017). Profiles and outcomes data are provided for customers who received services at the One‐Stop Career Centers under the WIOA Title I Adult, Dislocated Worker and Youth Programs and the Trade Adjustment and Assistance Program.
WIOA TITLE I ADULT PARTICIPANTS SUMMARY
The Adult program provides job search assistance and training opportunities to unemployed and other job seekers, with priority to public assistance recipients, low‐income individuals, and those that are basic skills deficient and others who face barriers to employment.
WIOA TITLE I DISLOCATED WORKER PARTICIPANTS SUMMARY
The Dislocated Worker program provides job search assistance and training opportunities to individuals experiencing job dislocation resulting from a layoff or business closing or who have exhausted Unemployment Insurance, to help them return quickly to the labor force.
WIOA TITLE I YOUTH PARTICIPANTS SUMMARY
The Youth program provided employment and training activities to provide youth assistance in achieving careers and academic and employment success and provides opportunity for training and supportive services.
WIOA TRADE ADJUSTMENT ASSISTANCE
The Trade Adjustment Assistance (TAA) program assists workers impacted by foreign Trade providing training, employment and case management services, job search and relocation allowances, wage supplements for those 50 or older, and Trade Readjustment Allowances (TRA).
WIOA PRIMARY INDICATORS OF PERFORMANCE
The Primary Indicators of Performance for the WIOA Title I Programs, WIOA Title III, Wagner Peyser and WIOA Title II, Adult Education will be used to measure and evaluate performance for the local area. These are federal performance indicators negotiated with the U.S. Department of Labor and the U.S. Department of Education.
ADDITIONAL PERFORMANCE DATA
Career Center Performance Reports are located at: http://www.mass.gov/massworkforce/ccpr/
Page 113
Total Individuals Served 9,420
GenderMale 4,915 52%Female 4,505 48%
EthnicityWhite 5,309 56%Black or African American 459 5%Hispanic or Latino 3,735 40%American Indian or Alaskan Native 54 1%Asian 280 3%Hawaiian Native or Other Pacific Islander 13 0%Other 3,428 36%
Age18 or under 257 3%19-21 534 6%22-45 4,375 46%46-54 1,980 21%55+ 2,274 24%
EducationLess than High School 989 10%High School Diploma or Equivalent 3,180 34%Some College/Vocational Degree 1,407 15%Associate Degree 778 8%Bachelors Degree 1,709 18%Advanced Degree 798 8%
Self-Identified Persons With Disabilities 396 4%
Unemployment Insurance Claimants 6,351 67%
Veterans 409 4%
Employers Served 1,868
Employers Listing Job Orders 388 21%Employers Receiving Referrals 422 23%Employers Who Hired a Job Seeker Referral 77 4%
PROFILE OF CAREER CENTER CUSTOMERS LOWER MERRIMACK VALLEY WORKFORCE DEVELOPMENT AREA
FISCAL YEAR 2017
Page 114
In-School Out-of-School Total Youth
Total 1 51 52Age 14-18 100% 4% 6%Age 19-21 0% 59% 58%Age 22-21 0% 37% 37%Female 100% 73% 73%Disabled 0% 86% 0%HS Student 0% 0% 0%HS Dropout 0% 4% 4%Limited English 0% 2% 2%Math or Reading Level <9.0 0% 57% 56%Offender 0% 2% 2%Welfare 0% 18% 17%Foster Child 0% 0% 0%Homeless/Runaway 0% 0% 0%Pregnant/Parenting 0% 39% 38%Requires Additional Assistance 100% 84% 85%
Educ., Trng, & Tutoring 0 0 0ABE/GED or Alternative 0 5 5Financial Literacy 0 0 0Summer Employment Opportunity 0 0 0Work Experience/OJT 1 5 6Occupational Skills Trng 1 50 51Leadership Dev/Community Services 0 5 5Mentoring 0 0 0Guidance/Comprehensive Counseling 1 0 1Other (non program) 0 3 3
Total Exits YTD 1 22 23Entered Employments YTD 0 15 15Entered Post-HS Training YTD 0 1 1Placed in Employment/Education Rate 0% 73% 70%Average Wage $0.00 $12.43 $12.43Degree/Certification 0 15 15
Note: Data on entered employments and wages obtained from the participants.
Source: DCS, CCPR http://www.mass.gov/massworkforce/ccpr/fy-2017/
MERRIMACK VALLEY WORKFORCE DEVELOPMENT AREA - FY 2017 - 3RD QUARTER ENDING MARCH 2017
TITLE I YOUTH PARTICIPANT SUMMARY
Participant Characteristics (%)
Enrollments By Activity
Exit and Outcome Summary
Page 115

Title I AdultTitle I Dislocated
WorkerTrade Adjustment
Assistance
Total Participants YTD 72 328 108Female 75% 43% 55%Age 55 or Over 3% 44% 53%Less than High School 7% 15% 19%Limited English 3% 22% 35%Math or Reading Level <9.0 34% 26% 33%Disabled 3% 0% 1%Cash Welfare 27% na naUI Claimant na 93% 91%Offender 0% 0% 0%Veteran 6% 5% 4%Single Parent 61% 16% 12%Low Income 80% na 9%
Total Program Participants YTD 72 328 139
New Program Enrollments 38 250 111New Training Enrollments 31 153 103New & Carry-in Training Enrollments 62 219 128ABE/GED or Equivalent 1 20 20ESL 0 63 63Occupational Skills Training 58 139 53OJT 0 0 0Other. 0 10 10
Total Exits YTD 36 108 26Entered Employments YTD 26 82 16Entered Employment Rate at Exit 74% 77% 54%Average Pre-Wage na na $26.43Average (Post) Wage $15.23 $20.40 $21.78Wage Retention Rate (post/pre-wage) na na 82%Degree/Certification 29 82 na
Note: Data on entered employments and wages obtained from the participants.
Source: DCS, CCPR http://www.mass.gov/massworkforce/ccpr/fy-2017/
MERRIMACK VALLEY WORKFORCE DEVELOPMENT AREA - FY 2017 - 3RD QUARTER ENDING MARCH 201
TITLE I ADULT AND DISLOCATED WORKER, AND TRADE PARTICIPANT SUMMARIES
Participant Characteristics (%)
Enrollments By Activity
Exit and Outcome Summary
Page 116

MERRIMACK VALLEY WORKFORCE DEVELOPMENT AREA
PRIMARY INDICATORS OF PERFORMANCE
FISCAL YEAR 2017 7/1/16 -6/30/17
FISCAL YEAR 2018 7/1/17 – 6/30/18
WIOA TITLE I ADULT Employed 2nd Quarter After Exit 83% 86% Employed 4th Quarter After Exit 75% 77% Median Earnings at 2nd Quarter After Exit $4900 $5200 Credential Attainment Rate Baseline Indicator Measureable Skill Gains Baseline Indicator Effectiveness in Serving Employers Baseline Indicator
WIOA TITLE 1 DISLOCATED WORKER
Employed 2nd Quarter After Exit 84% 86% Employed 4th Quarter After Exit 69.4% 71% Median Earnings at 2nd Quarter After Exit $7500 $7600 Credential Attainment Rate Baseline Indicator Measureable Skill Gains Baseline Indicator Effectiveness in Serving Employers Baseline Indicator
WIOA TITLE 1 YOUTH
Employed 2nd Quarter After Exit 80% 80.5% Employed 4th Quarter After Exit 72% 73% Median Earnings at 2nd Quarter After Exit Credential Attainment Rate Baseline Indicator Measureable Skill Gains Baseline Indicator Effectiveness in Serving Employers Baseline Indicator
WIOA TITLE III WAGNER-PEYSER
Employed 2nd Quarter After Exit 60.0% 64.0% Employed 4th Quarter After Exit 60.0% 62.0% Median Earnings at 2nd Quarter After Exit $5,100.00 $5,500.00
WIOA TITLE II ADULT EDUCATION
Measureable Skill Gains 41.0% 42.0% Goal Setting:
State level performance goals for Title I and Wagner-Peyser programs were negotiated by the Department of Career Services, Executive Office of Labor and Workforce Development (DCS/EOLWD) with the U.S. Department of Labor, Employment and Training Administration. (DOL/ETA).
DCS/EOLWD negotiated performance goals for Title I with each local Workforce Development Board. Local Boards adopt the State Wagner-Peyser goals.
Adult and Community Learning Services, Massachusetts Department of Elementary and Secondary Education (ACLS/DESE) negotiated for Measureable Skill Gains only with the U.S. Department of Education, Office of Career, Technical, and Adult Education (ED/OCTAE). Each provider’s final performance will be assessed against the State goals based on individual local factors.
A Baseline Indicator is one for which States did not propose goals. Data will be collected during FY17 and FY18 that will be used for goal setting beginning in FY19.
Page 117
Related Documents