Merrill Lynch Investment Solutions Audited annual report as at March 31, 2019 Société d’Investissement à Capital Variable R.C.S. Luxembourg B 133.445 No subscription can be received on the basis of these financial statements. Subscriptions may only be accepted on the basis of the current prospectus accompanied by an application form, the key investor information documents, the latest available annual report of the fund and the latest semi-annual report if published thereafter.

Welcome message from author
This document is posted to help you gain knowledge. Please leave a comment to let me know what you think about it! Share it to your friends and learn new things together.
Transcript

Merrill Lynch Investment Solutions
Audited annual reportas at March 31, 2019
Société d’Investissement à Capital Variable
R.C.S. Luxembourg B 133.445
No subscription can be received on the basis of these financial statements. Subscriptions may only beaccepted on the basis of the current prospectus accompanied by an application form, the key investorinformation documents, the latest available annual report of the fund and the latest semi-annual report ifpublished thereafter.


Table of contents Page
Management and Administration 2
Information to the Shareholders 5
Investment Managers’ Report 10
Audit Report 22
Statements of Net Assets as at March 31, 2019 25
Statements of Operations and Changes in Net Assets for the year ended March 31, 2019 28
Statistical information 31
Schedule of Investments as at March 31, 2019 42
Merrill Lynch Investment Solutions – Marshall Wace TOPS UCITS Fund (Market Neutral) 42
Merrill Lynch Investment Solutions – York Event-Driven UCITS Fund 86
Merrill Lynch Investment Solutions – York Asian Event-Driven UCITS Fund 94
Merrill Lynch Investment Solutions – AQR Global Relative Value UCITS Fund 102
Merrill Lynch Investment Solutions – Merrill Lynch WNT Diversified Futures UCITS Fund (in liquidation) 119
Merrill Lynch Investment Solutions – Merrill Lynch Enhanced Equity Volatility Premium Fund 121
Merrill Lynch Investment Solutions – Merrill Lynch MLCX Commodity Enhanced Beta Fund 123
Merrill Lynch Investment Solutions – Merrill Lynch MLCX Commodity Alpha Fund 125
Merrill Lynch Investment Solutions – Zeal Greater China Long Short UCITS Fund 127
Merrill Lynch Investment Solutions – Ramius Merger Arbitrage UCITS Fund 130
Merrill Lynch Investment Solutions – Merrill Lynch Enhanced Cross-Asset Volatility Premium Fund 136
Merrill Lynch Investment Solutions – KLS Fixed Income UCITS Fund 138
Merrill Lynch Investment Solutions – Millburn Diversified UCITS Fund 159
Merrill Lynch Investment Solutions – Global Debt - Credit UCITS Fund 165
Merrill Lynch Investment Solutions – Global Debt - Government UCITS Fund 184
Merrill Lynch Investment Solutions – Global Debt - Securitised UCITS Fund 218
Notes to the financial statements as at March 31, 2019 231
Global Risk Management (Unaudited Information) 248
Additional Information for Investors in the Federal Republic of Germany 250
Securities Financing Transactions Regulation (SFTR) Disclosures (Unaudited) 251
Index Tracking Portfolios (Unaudited) 258
Remuneration Note (Unaudited) 259
1Merrill Lynch Investment Solutions
Audited annual report

Board of Directors of the SICAV
ChairmanMr Claude Kremer,Partner,Arendt & Medernach S.A.,41A, avenue John F. Kennedy,L-2082 Luxembourg,Grand Duchy of Luxembourg
MembersMr Paul Guillaume,Managing Partner,Altra Partners S.A.,370 route de Longwy,L-1940 Luxembourg,Grand Duchy of Luxembourg
Mr Philippe Lopategui,Chief Executive Officer,CM Investment Solutions Limited,2 King Edward Street,London EC1A 1HQ,United Kingdom
Mr Thomas Nummer,TRINOVA S.A.,5 Heienhaff,L-1736 Senningerberg,Grand Duchy of Luxembourg
Management CompanyCM Investment Solutions Limited,Bank of America Merrill Lynch Financial Centre,2 King Edward Street,London EC1A 1HQ,United Kingdom
Registered Office of the SICAVState Street Bank Luxembourg S.C.A.,49, avenue J. F. Kennedy,L-1855 Luxembourg,Grand Duchy of Luxembourg
Depository and Paying AgentState Street Bank Luxembourg S.C.A.,49, avenue J. F. Kennedy,L-1855 Luxembourg,Grand Duchy of Luxembourg
Registrar and Transfer AgentState Street Bank Luxembourg S.C.A.,49, avenue J. F. Kennedy,L-1855 Luxembourg,Grand Duchy of Luxembourg
Administrative, Corporate and Domiciliary AgentState Street Bank Luxembourg S.C.A.,49, avenue J. F. Kennedy,L-1855 Luxembourg,Grand Duchy of Luxembourg
2 Merrill Lynch Investment Solutions
Management and Administration
Audited annual report
Global DistributorCM Investment Solutions Limited,2 King Edward Street,London EC1A 1HQ,United Kingdom
Legal AdviserArendt & Medernach S.A.,41A, avenue J. F. Kennedy,L-2082 Luxembourg,Grand Duchy of Luxembourg
Listing AgentState Street Bank Luxembourg S.C.A.,49, avenue J. F. Kennedy,L-1855 Luxembourg,Grand Duchy of Luxembourg
AuditorPricewaterhouseCoopers, Société coopérative,2, rue Gerhard Mercator,L-2182 Luxembourg,Grand Duchy of Luxembourg
Investment ManagersFor the Sub-Fund Merrill Lynch Investment Solutions –Marshall Wace TOPS UCITS Fund (Market Neutral):Marshall Wace LLP,The Adelphi, 13th Floor,1/11 John Adam Street,London WC2N 6HT,United Kingdom
For the Sub-Funds Merrill Lynch Investment Solutions –York Event-Driven UCITS Fund and Merrill LynchInvestment Solutions – York Asian Event-Driven UCITS Fund:York UCITS Holdings, LLC,767 Fifth Avenue, 17th Floor,New York 10153,USA
Investment Managers (cont.)
For the Sub-Fund Merrill Lynch Investment Solutions –AQR Global Relative Value UCITS Fund:AQR Capital Management LLC,CNH Partners, LLC,Two Greenwich Plaza, 3rd Floor,Greenwich, CT 06830,USA
For the Sub-Fund Merrill Lynch Investment Solutions –Merrill Lynch WNT Diversified Futures UCITS Fund (in liquidation):Winton Capital Management Limited (“Winton”),The Oxford Science Park,Oxford OX4 4GA,United Kingdom
For the Sub-Funds Merrill Lynch Investment Solutions –Merrill Lynch Enhanced Equity Volatility Premium Fund,Merrill Lynch MLCX Commodity Enhanced Beta Fund,Merrill Lynch MLCX Commodity Enhanced Beta ex AgricultureFund1, Merrill Lynch MLCX Commodity Alpha Fund and MerrillLynch Enhanced Cross-Asset Volatility Premium Fund:CM Investment Solutions Limited,Bank of America Merrill Lynch Financial Centre,2 King Edward Street,London EC1A 1HQ,United Kingdom
For the Sub-Fund Merrill Lynch Investment Solutions –Zeal Greater China Long Short UCITS Fund:Zeal Asset Management Limited,Suite 2605, Tower 1, Lippo Centre,89 Queensway,Hong Kong
1 Merrill Lynch MLCX Commodity Enhanced Beta ex Agriculture Fund wasliquidated on June 14, 2018
3Merrill Lynch Investment Solutions
Management and Administration (cont.)
Audited annual report
Investment Managers (cont.)
For the Sub-Fund Merrill Lynch Investment Solutions –Ramius Merger Arbitrage UCITS Fund:Cowen Investment Advisors LLC,599 Lexington Avenue,New York, NY 10022,USA
For the Sub-Fund Merrill Lynch Investment Solutions –KLS Fixed Income UCITS Fund:KLS Diversified Asset Management LP,452 Fifth Avenue,22nd Floor,New York, NY 10018,USA
For the Sub-Fund Merrill Lynch Investment Solutions –Millburn Diversified UCITS Fund:Millburn Ridgefield Corporation,The Millburn Corporation,411 West Putnam Avenue,Greenwich, CT 06830,USA
For the Sub-Funds: Merrill Lynch Investment Solutions–Global Debt - Securitised UCITS Fund, Global Debt -Government UCITS Fund and Global Debt - Credit UCITS Fund:Blackrock Investment Management (UK) Limited,12 Throgmorton Avenue,London, EC2N 2DL,United Kingdom
Investment AdvisorsFor the Sub-Fund Merrill Lynch Investment Solutions –Marshall Wace TOPS UCITS Fund(Market Neutral):Marshall Wace Asia Limited,28/F One IFC One Harbour View Road,Hong KongMarshall Wace North America L.P.,55 Railroad Avenue, Greenwich,Connecticut,USA
For the Sub-Fund Merrill Lynch Investment Solutions –Merrill Lynch Enhanced Equity Volatility Premium Fund:Union Investment Institutional GmbH,Product Management,Wiesenhüttenstraße 10,60329 Frankfurt am Main,Germany
4 Merrill Lynch Investment Solutions
Management and Administration (cont.)
Audited annual report

The annual general meeting of Shareholders is held, each year, at the registered office of the SICAV or at the place specified in theconvening notice on the last Monday of July (at 12 noon Luxembourg time) or the next following Luxembourg Business Day.
The meetings of Shareholders of Shares of a particular Sub-Fund may decide on matters which are relevant only for the Sub-Fundconcerned.
Notices to Shareholders will be published in the Luxemburger Wort and / or in any other newspaper(s) in those countries where theShares are sold, as determined by the Board of Directors.
Audited annual reports are made available on the website www.funds-invest.baml.com/ and for shareholders’ inspection at each ofthe registered offices of the SICAV and of the Custodian Bank. They will be published within four months following the relevantaccounting period, and the latest annual report is made available at least eight days before the annual general meeting. Moreover,unaudited semi-annual reports are made available for shareholders’ inspection at each of the registered offices of the SICAV and ofthe Depositary Bank and will be published within two months following the relevant accounting period.
The financial year ends on March 31 of each year.
The list of changes in the portfolio, for the year ended March 31, 2019, is available at the registered office of the SICAV.
The Portfolio Turnover Rate (PTR), expressed as a percentage, reflects the volume of dealing in the Sub-Fund. It is equal to the totalof purchases and sales of securities netted against the value of the subscriptions and redemptions, over the average net assets ofthe Sub-Fund for the year.
The PTR calculated for the last 12 months are the following:
Sub-Funds PTR %
Merrill Lynch Investment Solutions – Marshall Wace TOPS UCITS Fund (Market Neutral) 1 975.84%
Merrill Lynch Investment Solutions – York Event-Driven UCITS Fund 315.41%
Merrill Lynch Investment Solutions – York Asian Event-Driven UCITS Fund 879.74%
Merrill Lynch Investment Solutions – AQR Global Relative Value UCITS Fund 24.39%
Merrill Lynch Investment Solutions – Merrill Lynch WNT Diversified Futures UCITS Fund (in liquidation) 63.65%
Merrill Lynch Investment Solutions – Merrill Lynch Enhanced Equity Volatility Premium Fund 144.10%
Merrill Lynch Investment Solutions – Merrill Lynch MLCX Commodity Enhanced Beta Fund 148.08%
Merrill Lynch Investment Solutions – Merrill Lynch MLCX Commodity Alpha Fund 45.64%
Merrill Lynch Investment Solutions – Zeal Greater China Long Short UCITS Fund 409.66%
Merrill Lynch Investment Solutions – Ramius Merger Arbitrage UCITS Fund 1 169.69%
Merrill Lynch Investment Solutions – Merrill Lynch Enhanced Cross-Asset Volatility Premium Fund 155.24%
Merrill Lynch Investment Solutions – KLS Fixed Income UCITS Fund 1 720.96%
Merrill Lynch Investment Solutions – Millburn Diversified UCITS Fund (3.50)%
Merrill Lynch Investment Solutions – Global Debt - Credit UCITS Fund 58.78%
Merrill Lynch Investment Solutions – Global Debt - Government UCITS Fund (18.96)%
Merrill Lynch Investment Solutions – Global Debt - Securitised UCITS Fund 24.70%
5Merrill Lynch Investment Solutions
Information to the Shareholders
Audited annual report

The Total Expense Ratio includes all fees but excludes transaction costs and performance fees. For classes launched during the year,fees have been annualised.
The TER calculated for the last 12 months are the following:
Sub-Funds Share Class Currency TER %
Merrill Lynch Investment Solutions –Marshall Wace TOPS UCITS Fund (Market Neutral)
Class EUR B (acc) EUR 1.80%Class EUR B (inc) EUR 1.80%Class EUR C (acc) EUR 2.69%Class EUR C (inc) EUR 2.69%Class EUR G (acc) EUR 1.85%Class EUR X1 (acc)1 EUR 1.20%Class EUR Z (acc) EUR 1.95%Class GBP B (acc) GBP 1.82%Class GBP B (inc) GBP 1.82%Class GBP C (acc) GBP 2.70%Class GBP C (inc) GBP 2.70%Class GBP G (acc) GBP 1.86%Class GBP Management (inc) GBP 0.95%Class GBP Z (acc) GBP 1.95%Class JPY B (acc) JPY 1.81%Class USD B (acc) USD 1.82%Class USD C (acc) USD 2.71%Class USD G (acc) USD 1.86%
Merrill Lynch Investment Solutions –York Event-Driven UCITS Fund
Class AUD E (acc) AUD 1.93%Class CHF A (acc) CHF 1.91%Class CHF E (acc) CHF 1.95%Class CHF F (acc) CHF 3.01%Class EUR A (acc) EUR 1.67%Class EUR C (acc) EUR 2.95%Class EUR E (acc) EUR 1.90%Class EUR F (acc) EUR 2.97%Class EUR Z (acc) EUR 1.94%Class GBP A (acc) GBP 1.92%Class GBP A (inc)2 GBP 1.99%Class GBP D (acc) GBP 1.67%Class GBP E (acc) GBP 2.38%Class GBP E (inc) GBP 1.95%Class GBP F (acc) GBP 3.01%Class GBP Z (acc) GBP 1.98%Class USD A (acc) USD 1.98%Class USD B (acc) USD 1.91%Class USD D (acc)3 USD 2.09%Class USD E (acc) USD 2.14%Class USD F (acc) USD 2.99%Class USD Z (acc) USD 1.97%
Merrill Lynch Investment Solutions –York Asian Event-Driven UCITS Fund
Class CHF D (acc) CHF 1.72%Class EUR B (acc) EUR 1.91%Class EUR C (acc) EUR 2.70%Class EUR D (acc) EUR 1.66%Class GBP C (acc) GBP 2.76%Class USD B (acc) USD 1.97%Class USD D (acc) USD 1.72%
1 Launched on June 12, 20182 Liquidated on December 7, 20183 Liquidated on July 11, 2018
6 Merrill Lynch Investment Solutions
Information to the Shareholders (cont.)
Audited annual report

Sub-Funds Share Class Currency TER %
Merrill Lynch Investment Solutions –AQR Global Relative Value UCITS Fund
Class CHF A (acc) CHF 1.28%Class EUR A (acc) EUR 1.27%Class EUR A (inc) EUR 1.27%Class EUR C (acc) EUR 2.33%Class EUR Z (acc) EUR 1.30%Class GBP A (acc) GBP 1.26%Class GBP A2 (acc) GBP 1.27%Class GBP C (acc)1 GBP 0.05%Class GBP D (acc) GBP 1.28%Class GBP Z (acc) GBP 1.32%Class USD A (acc) USD 1.16%Class USD C (acc) USD 2.33%Class USD D (acc) USD 1.27%Class USD Z (acc) USD 1.19%
Merrill Lynch Investment Solutions –Merrill Lynch WNT Diversified Futures UCITS Fund (in liquidation)
Class EUR B (acc) EUR 1.71%Class EUR D (acc) EUR 1.67%Class EUR Z (acc)2 EUR 1.76%Class GBP Z (acc)3 GBP 1.72%Class USD B (acc) USD 1.65%Class USD C (acc) USD 2.44%Class USD Z (acc) USD 1.69%
Merrill Lynch Investment Solutions –Merrill Lynch Enhanced Equity Volatility Premium Fund
Class EUR A (acc) EUR 0.82%Class EUR B (acc) EUR 1.24%
Merrill Lynch Investment Solutions –Merrill Lynch MLCX Commodity Enhanced Beta Fund
Class EUR B (acc) EUR 0.97%Class EUR C (acc) EUR 2.01%Class EUR E (acc) EUR 0.82%Class USD B (acc) USD 0.91%Class USD C (acc) USD 1.95%
Merrill Lynch Investment Solutions –Merrill Lynch MLCX Commodity Enhanced Beta ex Agriculture Fund4
Class EUR D (acc)4 EUR 0.83%Class USD B (acc)5 USD 0.92%
Merrill Lynch Investment Solutions –Merrill Lynch MLCX Commodity Alpha Fund
Class EUR B (acc) EUR 1.07%Class EUR C (acc) EUR 2.10%Class EUR E (acc) EUR 0.81%Class GBP B (acc) GBP 1.06%Class USD B (acc) USD 1.01%Class USD C (acc) USD 2.05%
Merrill Lynch Investment Solutions –Zeal Greater China Long Short UCITS Fund
Class EUR B (acc) EUR 2.33%Class EUR D (acc) EUR 1.72%Class USD B (acc) USD 2.17%Class USD D (acc) USD 1.66%Class USD Management (acc) USD 0.45%Class USD Z (acc) USD 2.19%
1 Liquidated on November 21, 20182 Liquidated on January 23, 20193 Liquidated on February 7, 20194 Liquidated on June 14, 20185 Liquidated on May 31, 2018
7Merrill Lynch Investment Solutions
Information to the Shareholders (cont.)
Audited annual report

Sub-Funds Share Class Currency TER %
Merrill Lynch Investment Solutions –Ramius Merger Arbitrage UCITS Fund
Class EUR C (acc) EUR 2.56%Class EUR D (acc) EUR 1.46%Class EUR X1 (acc) EUR 0.92%Class EUR X2 (acc)1 EUR 1.06%Class EUR X3 (acc)2 EUR 0.75%Class EUR X4 (acc)3 EUR 1.47%Class GBP D (acc)4 GBP 1.45%Class SEK X1 (acc) SEK 1.47%Class USD B (acc) USD 1.68%Class USD C (acc) USD 2.44%Class USD D (acc) USD 1.42%Class USD Management (acc) USD 0.26%
Merrill Lynch Investment Solutions –Merrill Lynch Enhanced Cross-Asset Volatility Premium Fund
Class EUR A (acc) EUR 0.80%Class EUR B (acc) EUR 1.11%
Merrill Lynch Investment Solutions –KLS Fixed Income UCITS Fund
Class EUR D (acc) EUR 1.42%Class USD B (acc)5 USD 1.97%Class USD C (acc)6 USD 2.76%Class USD D (acc) USD 1.36%Class USD Management (acc) USD 0.45%Class USD X2 (acc) USD 1.07%
Merrill Lynch Investment Solutions –Millburn Diversified UCITS Fund
Class CHF Z (acc) CHF 2.02%Class EUR B (acc) EUR 1.97%Class EUR C (acc) EUR 2.76%Class EUR D (acc) EUR 1.47%Class EUR X2 (acc) EUR 1.07%Class EUR X3 (acc) EUR 1.67%Class EUR X4 (inc) EUR 1.57%Class EUR Y1 (acc)7 EUR 2.28%Class EUR Z (acc) EUR 2.01%Class GBP B (acc) GBP 1.97%Class GBP D (acc) GBP 1.47%Class GBP X4 (inc) GBP 1.57%Class GBP Z (acc) GBP 2.03%Class JPY X5 (acc)8 JPY 1.68%Class USD B (acc) USD 1.91%Class USD C (acc) USD 2.70%Class USD D (acc) USD 1.49%Class USD Management (acc)9 USD 0.45%Class USD X4 (inc) USD 1.52%Class USD Y1 (acc)10 USD 2.28%Class USD Z (acc) USD 1.97%
1 Launched on October 17, 20182 Launched on December 19, 20183 Launched on January 3, 20194 Launched on January 24, 20195 Liquidated on November 29, 20186 Liquidated on November 29, 20187 Launched on July 25, 20188 Launched on June 1, 20189 Liquidated on December 18, 201810 Launched on January 10, 2019
8 Merrill Lynch Investment Solutions
Information to the Shareholders (cont.)
Audited annual report

Sub-Funds Share Class Currency TER %
Merrill Lynch Investment Solutions –Global Debt - Credit UCITS Fund
Class EUR B (acc) EUR 0.49%Class EUR B (inc) EUR 0.49%Class GBP B (inc) GBP 0.49%Class USD B (acc) USD 0.43%Class USD B (inc) USD 0.43%
Merrill Lynch Investment Solutions –Global Debt - Government UCITS Fund
Class EUR B (acc) EUR 0.39%Class EUR B (inc) EUR 0.38%Class GBP B (inc) GBP 0.39%Class USD B (acc) USD 0.33%Class USD B (inc) USD 0.34%
Merrill Lynch Investment Solutions –Global Debt - Securitised UCITS Fund
Class EUR B (acc) EUR 0.45%Class EUR B (inc) EUR 0.45%Class GBP B (inc) GBP 0.45%Class USD B (acc) USD 0.39%Class USD B (inc) USD 0.40%
9Merrill Lynch Investment Solutions
Information to the Shareholders (cont.)
Audited annual report

Merrill Lynch Investment Solutions – Marshall Wace TOPS UCITS Fund (MarketNeutral)
The MSCI AC World Index returned -7.69% (NDLEACWF) in 2018, the worst annual return sincethe Global Financial Crisis in 2008, with losses exceeding those seen during the height of the Euro
Area Crisis in 2011. The weakness in global equities was broad based, with MSCI USA returning -5.04% (NDDLUS Index), MSCIEurope returning -10.59% (NDDLE15 Index), MSCI China returning -18.71% (NDELCHF Index) and MSCI EM returning -10.07%(NDLEEGF Index).
2018 was a year of persistent global growth slowdown. The global composite PMI fell from a near four year high in February(54.8, MPMIGLCA Index), to a near two-year low come year-end (52.7). Some of the most notable declines came from China andEurope, with the Chinese manufacturing PMI ending the year in sub-50 contraction territory (CPMINDX Index), whilst the Germanmanufacturing PMI dropped a full -11.8pts (MPMIDEMA Index).
It was also a year of tight global liquidity, and increasingly hawkish central bank rates policy. On the liquidity front, 2018 saw FedQuantitative Tightening pick up speed, whilst the ECB tapered its Quantitative Easing purchases and announced the end of QEcome year-end. At the same time, the Fed delivered four rate hikes, the most in one year since 2006, and Chinese money supplygrowth dropped to multi-decade lows (CNMS1YOY Index), as authorities continued to tackle domestic financial imbalances. Ontop of this, the USD appreciated +4.4% (DXY Curncy), putting notable pressure on Emerging Market funding.
During the year, a number of negative idiosyncratic crises around the world. Italy’s elections in May 2018 delivered first a populistmajority in parliament and then a populist government of the Five Star Movement and Lega. The decision of this government topursue a higher deficit and confrontation with the EU saw the Italy-Germany 10Y spread rise to multi-year highs, rising to over300bp during Q4.
A number of Emerging Market’s also suffered crises in 2018. Chief amongst these was Turkey, which saw its currency depreciateby over 70% vs the USD (USDTRY BGN Curncy) from the start of the year to mid-August, as a rising USD and slowing growthraised serious questions as to the central bank’s willingness to raise rates to fight inflation. The Central Bank ultimately bit thebullet, bringing the currency somewhat back under control (USDTRY ended the year around 40% higher), however only after about of real market panic.
Finally, the growing US-China trade war was a persistent headwind to equities in 2018, with the US imposing three rounds oftariffs on Chinese goods, totalling more than $250bn, and China retaliating with tariffs on $110bn of US goods.
As of the end of December 2018, the global equity market (as measured by the MSCI AC World Daily TR Net Local Index)exhibited an annual historical volatility of 12.16% (based on daily data). Volatility more than doubled from the levels of 2017 butremains in the lower range if compared with its peak in 2009 (46.42%, based on 1 year rolling daily data).
MSCI AC World returned +7.23% in January (NDLEACWF), the best monthly return since October 2015, as equities regained mostof December’s sharp losses. Gains were led by the US (NDDLUS, +8.18%) and Chinese equity markets (NDELCHF, +11.18%), withEuropean and UK equities lagging the global rebound (NDLEE18 +5.68% and NDDLUK +3.68% respectively). Three key driversbehind January’s equity rally: 1) a significant dovish pivot from the Fed, market strength in January owed a lot to the market’s“bearish overshoot” in late December; 2) the sharp market decline in the final weeks of December saw a number of sentimentindicators hit “extreme bearish” levels. 3) a reduction in key “tail risks” around the world, including easing tensions of the Italiangovernment with the EU, increased expectations that a “no deal Brexit” would be avoided and most significantly for equitymarkets, hopes grew that the US and China would be able to agree a deal to end their ongoing trade war. Global equity marketscontinued their recovery from Q4’s sharp losses in February and March 2019, with MSCI AC World returning +3.07% and +1.58%,respectively. However, in March solid headline returns masked what was a turbulent month for equity markets with two materialbouts of weakness. The ECB marked down their growth and inflation forecasts and the European March PMI data showed theGerman manufacturing sector slowed to levels last seen during the Eurozone crisis in 2012. Two factors helped to offset thenegative growth pressures coming out of Europe, as the Fed delivered another dovish surprise in their March meeting,announcing plans to end their balance sheet roll off and pulling down the FOMC dots to show no more hikes in 2019 and Chinesegrowth data showed tentative signs of growth stabilisation.
10 Merrill Lynch Investment Solutions
Investment Managers’ Report
Audited annual report
Merrill Lynch Investment Solutions – Marshall Wace TOPS UCITS Fund (Market Neutral) (cont.)
Marshall Wace’s proprietary Alpha Regime Indicator (“ARI”) seeks to assess the external risk regime in which the MW TOPSstrategies operate. Across all regions, the ARI oscillated between level 5 and 2 (on a scale of 1 to 5, with 5 being the moststressed), with oscillations in the more stressed area of the indicator during the first and last quarter of 2018, before coming backat level 2 in Q1 of 2019.
The 12 month net return generated by the Fund*was -0.91%. The strategy maintained its targeted low volatility at just around4% over the year (compared to 11.16% for the equity market**). The correlation of the Fund’s* daily returns to those of themarket** was also minimal over the 12 months at just -0.07.
Dealing Terms for the MLIS Marshall Wace TOPS UCITS Fund (Market Neutral)In order to further manage the Fund’s capacity, as of the 8th February 2019, the maximum amount per subscription in the Fundwas lowered to 20,000 EUR or 20,000 GBP or 20,000 USD (or the equivalent amount in Shares based on the last available NAV),subject to the discretion of the Board of Directors (with the agreement of the Investment Manager) to alter or waive this limit.
Merrill Lynch Investment Solutions – York Event-Driven UCITS Fund
Mounting concerns over US/China trade tensions, slowing global growth, the upward trajectory ofUS interest rates, Brexit uncertainty, and tumbling crude prices caused global equity markets todecline sharply at the end of 2018. These issues largely outweighed the positive effects of strongearnings and constructive economic data that drove gains earlier in the year. In the first quarter of
2019, we saw a quick reversal of sentiment and a sharp rebound in markets, as central banks exhibited a dovish tone andUS/China trade negotiations progressed.
Global M&A activity throughout the time period was quite robust. Given the complexity and large size of announced transactions,we were able to deploy capital to situations that offered wide and attractive spreads. As a result, our Arbitrage portfoliocontributed positively to performance, as several of our transactions, including Aetna/CVS, Express Scripts/Cigna,Monsanto/Bayer, and Shire/Takeda Pharmaceutical, successfully closed. These gains were partially offset by our positions in NXPSemiconductors/Qualcomm, as Qualcomm walked away from the transaction after failing to secure Chinese regulatory approval,and MEG Energy/Husky Energy, after Husky walked away from the deal following the expiration of the tender offer.
Our Special Situations portfolio slightly detracted from performance as a number of idiosyncratic events negatively impacted theportfolio. Coty traded lower after reporting results that disappointed investors two quarters in a row. Dycom Industries pulledback on poor earnings due to ongoing permitting problems across the country related to Verizon 50 city fiber expansion. Ourposition in Nissan/Renault detracted on continued concerns over the outlook for global automotive production driven by weakChinese and European demand, as well as the arrest of Carlos Ghosn, Chairman of Nissan and CEO of Renault, who was accusedof misreporting income and other fraudulent activities. These losses were partially offset by a few positive events, such as thesuccessful completion of Dell Technologies’ (the tracking stock of VMware) reverse merger transaction with private companyDell.
Looking forward, we are constructive on the global event-driven opportunity set, as the renewed level of investor andmanagement confidence has led to a resurgence of corporate activity, which had slowed during Q4 2018. M&A activity in the firstquarter of 2019 has been strong due to a variety of factors, such as industry disruption, the need for growth, and arbitragebetween private and public valuations. We are constructive as this activity has been broad across sectors and driven by bothstrategic and private equity buyers. Furthermore, in Europe, we believe Brexit uncertainty has resulted in a pent up M&A pipeline,and once there is resolution, we believe that we will see a significant uptick in activity in the region. We are not necessarilyconcerned about what the outcome will be (soft or hard exit), as we believe in either scenario the market will be relieved thatthere is clarity and ready to reengage. Additionally, we are most constructive on event-driven opportunities in Europe and Asiamoving forward, given that these markets lag their US counterparts in terms of maturity and efficiency. As these regions continueto develop their corporate governance, we are seeing increased corporate activity as newly incentivized management teamsstrive to deliver value to a more demanding shareholder base.
* Class B USD Acc**As measured by the MSCI AC World Daily TR Net Local Index
11Merrill Lynch Investment Solutions
Investment Managers’ Report (cont.)
Audited annual report

Merrill Lynch Investment Solutions – York Asian Event-Driven UCITS Fund
Asian markets generally declined throughout 2018 driven by concerns regarding US/China tradetensions, slowing global growth, and rising rates. However, in the first quarter of 2019, we saw asharp reversal of investor sentiment and markets quickly recovered most of the previous year’slosses as central banks exhibited a dovish tone and US/China trade negotiations progressed.
Top contributors for the period encompassed a number of M&A transactions, including our positions in Clarion, which wasacquired by Faurecia, NTT Urban, which was acquired by its parent, and our spread position in the Shire/Takeda Pharmaceuticaldeal. We identified each of these targets as attractive takeover candidates and built positions before official deals wereannounced. Additional contributors included Hitachi Chemical, which moved higher on news that its parent planned to acceleratethe reorganization of the group, including the sale of the subsidiary, and Toshiba Corp, which advanced after the companycompleted the sale of its memory chip business and announced its first share buyback in the company’s history.
Renesas Electronics was the largest detractor from performance due to a number of events, including issuing guidance materiallybelow consensus, announcing an acquisition of Integrated Device Technology at a higher-than-expected price, and announcingplans earlier in 2019 that they would look to potentially shutter a number of manufacturing plants over the summer. BrillianceChina Automotive moved lower following news that BMW would increase its stake in their joint venture agreement under newlyproposed laws regulating domestic production of foreign automakers, and the company subsequently failed to provide clarityover how it would use these proceeds. NXP Semiconductors detracted as Qualcomm walked away from the deal to buy thecompany after failing to secure Chinese regulatory approval. Nintendo declined on disappointing Q1 Switch sales data andoutlook provided for hardware in its Q3 results, as well as a lack of meaningful new products released at the 2018 ElectronicEntertainment Expo. Our arbitrage position in Alpine Electronics/Alps Electric detracted after a disappointing product launch byApple, which Alps Electric has large exposure to.
We remain very constructive on the opportunity set in Asia, particularly in Japan, as corporate governance reform has spurredactivity. During Q1 2019, there have been a number of meaningful developments that we believe could be signaling the beginningof a wave of corporate change and that Japan should no longer be considered a “value trap”. Shareholder pressure at bothOlympus and LIXIL successfully resulted in changes to their boards and senior management teams. Additionally, Itochu was ableto increase its ownership in Descente, setting the stage for a hostile takeover, which has historically been very rare in Japan’sconsensus-driven market. We believe that these events are incremental indications of how Japan’s Corporate Governance Codeand Stewardship Code are having a meaningful impact on corporate behavior. We are also encouraged by the recent positivechange in sentiment in China, driven by indications of government support for the economy through stimulus, as well assignificantly better-than-expected loan data for the first 3 months of the year. With increasing corporate activity in the region andmacro tail risk subsiding, we have been increasing gross exposure; however, we will continue to maintain our low net betaexposure positioning to minimize directional market risk.
Merrill Lynch Investment Solutions – AQR Global Relative Value UCITS Fund
The AQR Global Relative Value UCITS Fund (the “Sub-Fund”) investment objective is to producehigh risk-adjusted returns while maintaining a low long term average correlation to traditionalmarkets. The Sub-Fund seeks to achieve its investment objective by providing exposure to ninesub-strategies: Long/Short Equity, Equity Market Neutral, Dedicated Short Bias, Global Macro,Managed Futures, Emerging Markets, Event Driven, Convertible and Volatility Arbitrage, and FixedIncome Relative Value.
For the year ended 31 March 2019, the Sub-Fund’s Class A shares returned -15.2%. The Class Ashares are denominated in U.S. dollars, which is the reference currency of the Sub-Fund.
Equity oriented and macro strategies, accounting for six of the nine sub-strategies, generatednegative returns, while the three arbitrage strategies contributed positively. Equity oriented strategies were the primary source oflosses, specifically Dedicated Short Bias and Equity Market Neutral. Negative returns in Dedicated Short Bias were driven bymarket-neutral stock selection strategies, largely within investor sentiment themes applied to the U.S. Losses within EquityMarket Neutral were driven by valuation themes, primarily within the U.S. portfolio, as investors showed abnormal enthusiasm forexpensive stocks. Long/Short Equity’s more modest detraction occurred largely in the last quarter of 2018 which saw widespreadreversals within and across industries.
12 Merrill Lynch Investment Solutions
Investment Managers’ Report (cont.)
Audited annual report

Merrill Lynch Investment Solutions – AQR Global Relative Value UCITS Fund (cont.)
Macro strategies detracted mainly due to Global Macro with losses primarily driven by relative value equity index and fixedincome directional sub-strategies. Emerging Markets’ detraction was almost entirely due to the stock selection strategies asvaluation and momentum themes struggled over the period, while Managed Futures was negatively impacted by sharp trendreversals in currencies.
Finally, all three arbitrage strategies experienced positive performance with Event Driven being the sole positive contributor ofany meaningful magnitude. Strong returns from merger arbitrage were due to a low rate of deal failures. Merger gains were smalland broad across deals with 146 deals completed out of the 214 held over the period. Of those, only eleven deals experiencedadverse terminations.
There have been no material changes to the Sub-Fund’s investment strategy or objectives during the year ended 31 March 2019.
Merrill Lynch Investment Solutions – Merrill Lynch WNT Diversified Futures UCITS Fund (in liquidation)
The information below is a draft investment advisor report that Winton Capital Management Limited (“Winton”) has provided toassist with preparing the Financial Statements of the Merrill Lynch WNT Diversified Futures UCITS Fund (in liquidation) (the“Sub-Fund”). Please note that:
The commentary is based on internal performance estimates and the Sub-Fund’s official valuation/NAV calculation is theresponsibility of the Sub-Fund’s administrator, not Winton.
1. The Sub-Fund is solely responsible for the use of this commentary in connection with the Sub-Fund’s Financial Statementsand Winton will not provide any further comments to, or review of, the Sub-Fund’s Financial Statements.
2. Winton does not approve, authorise the use or distribution thereof, or otherwise endorse or make any representationsregarding the Sub-Fund’s Financial Statements that may be prepared on the basis of this commentary.
3. Winton does not take any responsibility for the accuracy or completeness of the contents of the Sub-Fund’s FinancialStatements and disclaims any liability for any direct, indirect, consequential or other losses or damages, including loss ofprofits, incurred by you or by any third party that may arise from any reliance on the Sub-Fund’s Financial Statements.
PerformanceThe Sub-Fund performance was -0.08% from for the period as seen from the USD B shareclass of the WNT Diversified FuturesFund (in liquidation).
US-China trade tensions, tightening US monetary policy and a sharp equity selloff in the final quarter of 2018 were the headlinestories in financial markets over the review period. Global equity indices still ended the 12 months slightly higher than where theystarted, as a positive return from the US market offset falls in Japanese and European stocks. Yields on government bonds alsomostly fell, particularly in Germany, while the US dollar appreciated against most major currencies.
The Sub-Fund’s positioning in fixed income was profitable over the course of the 12 months, while exposure to currencies andequities led to losses.
Bond futures led the Sub-Fund’s positive performance in fixed income, with gains in German, Australian and Japanesegovernment bonds accounting for the largest share of profits. Results were, however, mixed in the US, with profits from fallingshort-dated Treasuries failing to offset losses from their longer-dated counterparts. In short-term interest rates, the Sub-Fundprofited from short exposure to Euribor futures.
Currencies were the biggest detractor from performance amid some large moves in emerging markets. The Turkish lira, Russianrouble and South African rand all posted some sharp falls against the US dollar during the 12 months, though the Sub-Fund’slosses in these markets were limited due to relatively small positions. Developed market currencies also contributed negatively toperformance overall, particularly positioning in the British pound, which was whipsawed over the first six months of the reviewperiod, depreciating against the US dollar while the Sub-Fund was long and vice versa. These losses were partly offset by profitsin the euro, with the Sub-Fund benefiting from short exposure versus the dollar during the second half of 2018.
13Merrill Lynch Investment Solutions
Investment Managers’ Report (cont.)
Audited annual report

Merrill Lynch Investment Solutions – Merrill Lynch WNT Diversified Futures UCITS Fund (in liquidation)(cont.)
Equities also proved challenging for the Sub-Fund’s performance over the 12 months due to losses in stock index futures, wherelong positioning in Japanese and European indices weighed on returns. Long-short equity systems, meanwhile, were flat, with theindustrials and communication services sectors cancelling out profits from consumer discretionary stocks.
Merrill Lynch Investment Solutions – Merrill Lynch Enhanced Equity Volatility Premium Fund
The MLIS Enhanced Equity Volatility Premium Fund (ISIN: LU0994402526, Bloomberg: MLEVP02 LX Equity) returned +2,0% netduring the reporting period, compared with the EuroStoxx 50 Index which returned -0.3% until the end of March 2019. Thestrategy’s volatility of 8,5% was again below the volatility of the EuroStoxx 50 Index.
European Stocks were driven by political topics like the Italian elections, the never ending discussions on Brexit, but alsoeconomic topics like the Trade War China vs. US, uncertainty around future Central Bank Policies and the strong Euro (for most ofthe 12 month period).
The Fund showed a relatively stable performance with minor drawdowns throughout the whole reporting period. Until end ofSeptember most options in the fund matured worthless. Due to the market turbulences starting in October the number of shortput options maturing in the money increased significantly. During the period of the downturn in European equities in the lastquarter 2018 the fund also achieved a relative stable performance. At this time it payed off that the fund is invested only inEuroStoxx 50, the same strategy on S&P 500 would have looked much worse. As the Equity market recovered with the beginningof 2019, the fund could not participate in the market recovery due to some call options ending in the money at maturity.
At the beginning of February a change in the funds guidelines became effective. The greater possibility of active managementdecisions gives us greater flexibility. Before that active decisions were subject to certain criteria which had to be fulfilled.Throughout the reporting period active management decisions were only made after the strong sell off in December– for the restof the time we felt fine with the systematic approach defining the strikes of the options.
Merrill Lynch Investment Solutions – Merrill Lynch MLCX Commodity Enhanced Beta Fund
Commodities were down this period (01 April 2018 – 31 March 2019) as the BCOM TR Index fell by 5.25%. The main positiveperformers this period were Lean Hogs, Live Cattle and Wheat, while Soybean Meal, Coffee and Soybeans underperformed.Elsewhere, equities and bonds were up in the same period by 9.50% and 4.56% as measured by the S&P 500 and ML Bond index.
The Petroleum sector saw wild swings this period, as Brent rallied up to $86/bbl before plummeting down to $50/bbl andsubsequently recovered a little to end the period with a loss of 2.68%. WTI has done worse in the same period and fell by 7.39%,as US production increased with a steady pace and helped the US become a net-exporter of Energy for the first time. The rapidcorrection of prices in the last quarter of 2018 can be explained by various factors. Most importantly by the fact that supply anddemand moved into an imbalance, as US crude production reached record highs and the global economic slowdown reduceddemand (forecasts). Furthermore, the strong dollar put additional pressure on dollar-denominated Oil prices, as the DXY Indexincreased by 7.79%. More recently, strict OPEC+ output cuts have helped to stabilise prices and explain the rally over the last fewweeks. US inventories have recovered from the extremely low levels last year at the same time, but are still below 5-year seasonalaverages.
Agricultural products moved lower during the period (BCOMAG TR down by -16.3%) with the biggest underperformers beingCoffee and the Soybean products. The Soybean products (all down between -11% and -21%) specifically suffered in the springand summer of 2018, when the US-China trade war rhetoric peaked and China announced a 25% tariff on US Soybean imports.This sent forecasted demand for US Soybeans lower and consequently explains the drop of prices. Since July 2018, prices haverecovered slightly, but are far off the highs seen in March and April. Lean Hogs have been the best performer this period(+35.15%). Most of the Lean Hogs price increases occurred in March 2019 on the back of a Swine Flu outbreak in China, whichhas already reduced the Chinese pig herd by more than 15%.
Base Metals posted a slightly negative performance in the period (BCOMIN TR -3.1%). Some of this negative performance can beexplained by the global economic slowdown and specifically by the poor data coming out of China, which is the most importantconsumer of these metals. The aforementioned Dollar-strength also put pressure on prices.
14 Merrill Lynch Investment Solutions
Investment Managers’ Report (cont.)
Audited annual report

Merrill Lynch Investment Solutions – Merrill Lynch MLCX Commodity Enhanced Beta Fund (cont.)
The MLCX03 TR Index (the Index underlying the MLCX Commodity Enhanced Beta Fund) overall lost 2.71% in the period,outperforming its benchmark (BCOM TR index) by +2.55%.
Merrill Lynch Investment Solutions – Merrill Lynch MLCX Commodity Alpha Fund
The MLCX Commodity Fund’s Class USB B (acc) shares were up by +10.38% in the period from April 2018 to March 2019,outperforming the cash market by +10.03%.
Main contributors to the strategy were Natural Gas and Soybeans. Lean Hogs and Gasoline were the worst performers in thisperiod. Overall, 13 out of 23 commodities contributed positively.
Natural Gas was the most volatile component this year and was affected by wild price swings of futures and time spreads in therecent winter. Initially, the component contributed negatively, when Natural Gas prices spiked, but benefitted from thesubsequent reversal and ended up being the best contributor. For Natural Gas the strategy was short the January and long theMarch contract in most of November and was hurt by the harsh rally in Natural Gas prices (+41%), which occurred on the back oflow US inventories (the lowest they have been in 15 year during the same time of the year) and US temperatures surprisinglyfalling below expectations. In this environment, the forward curve moved into a steep backwardation and especially the Januarycontract (which the strategy was short) outperformed as it usually is the most affected by the winter season and has the highestwinter risk premium embedded. Then in December, the winter premium almost completely disappeared from the forward curve,following a complete reversal of weather conditions. December saw much warmer temperatures than expected and future pricesfell more than 36% during the month. This price decline has helped the Natural Gas component more than recover the losses itexperienced in the previous month. For most of the month, the strategy was short the March contract and long the April contractand benefitted from a flattening of the forward curve (less backwardated), as the front-dated contract prices fell significantlymore than the prices of longer dated contracts.
The Lean Hogs component was the worst contributor to the strategy’s overall performance. Lean Hog prices were subject to wildswings in 2018 and 2019 and saw three major price spikes of +40% or more during the period. The last two spikes (September2018 and March 2019) were both caused by an outbreak of the African Swine Flu in China, which has significantly reduced pigherd size and subsequently increased demand for US Lean Hogs. Each of the spike came along with an outperformance of thefront-dated futures (which the strategy is short), because demand surges and panic buying are usually focused on the front of thecurve, while longer-dated futures (which the strategy is long) usually react less violently.
Merrill Lynch Investment Solutions – Zeal Greater China Long Short UCITS Fund
2018 was a tough year for Chinese equities. Shadowed by the escalating trade tensions betweenChina and the US, the market experienced big swings whenever any news and rumors on thenegotiation came out. That being said, in the past few months, the two countries have been
showing signs of progress in the trade talks. On top of that, China’s supportive policies on liquidity management andinfrastructure investment stimulus are taking effect. Business confidence is gradually being restored and the market has been onan uptrend since 2019.
The recently announced March Manufacturing Purchasing Managers’ Index (PMI) beat the market consensus of 49.6% andrebounded to 50.5% from 49.2% in February1 . We think the rebound was not only driven by inventory restocking, but also gradualpick-up in domestic manufacturing demand. The strong manufacturing data shows that the real economy recovery was fasterand stronger than expected. From the end of 2018 to the beginning of 2019, many companies decided to adopt a conservativeapproach and kept low inventory levels against a backdrop of economic uncertainty. But from our recent on-the-ground research,we saw a turnaround in business confidence and manufacturers have had a gradual recovery in productions and sales. We expectbusinesses to procure more aggressively in the coming months which may push some of the domestic demand indicators higher.Upstream sectors saw a slow and steady recovery in March, with industrial products, including coal, aluminum, and oil pricesrising.
In our view, this round of recovery will not only last longer, but will likely evolve into a self-sustained recovery. Unlike previousstimulus packages that focused on infrastructure spending, China’s stimulus measures this time target primarily its private1 Source: CICC Research, as of March 2019
15Merrill Lynch Investment Solutions
Investment Managers’ Report (cont.)
Audited annual report

Merrill Lynch Investment Solutions – Zeal Greater China Long Short UCITS Fund (cont.)
sector, which contributes close to two-thirds of China’s GDP and accounts for over 80% of total urban employment2. The threemajor contributing measures are as follows. First, the Ministry of Finance promised to reduce the total burden of tax and fees byRmb 2 trillion (around 2% of projected 2019 GDP) 2. Second, The PBoC has significantly lowered banks’ funding cost and beenconducting regulatory reforms to ensure that new loans go to private companies. Third, China has decided to adopt the OECD’scompetitive neutrality framework as a guiding principle for SOE reforms, pledging to improve the business environment forprivate companies. If executed effectively, these stimulus measures may help corporates replenish cash flow and increase urbanconsumers’ purchasing power, leading to rising private investment and revitalized consumer demand. We see a virtuous cycletaking place and expect a self-sustained growth recovery in the coming quarters.
Despite our optimism in the economy, we remain prudent. We notice that the recent stock rally is partly driven by the earlyliquidity from policy easing that wasn’t filtered through to the economy, but instead locked in the financial system. In March, themedium-and-long-term loans increased significantly, indicating that liquidity is slowly turning into credit, which may weaken theliquidity of the stock market marginally. However, the operating environment of certain individual companies is believed tobenefit from the improved credit environment; therefore, the performance of these companies may outperform the market.Because of the marginally tightened liquidity in the stock market, beta may begin to take a back seat as alpha stock-pickingbecomes more important. And as fundamentally-driven investors, we continue to look for long-term winners that have the rightbusinesses, right management teams and whose stock prices are trading at reasonable valuations.
Merrill Lynch Investment Solutions – Ramius Merger Arbitrage UCITS Fund
Performance CommentaryOver the fiscal year ending March 31, 2019, the Fund delivered positive absolute performance andalso outperformed the HFRX Merger Arbitrage Index, an index of alternative investment managersoperating under private partnership structures that are generally less regulated than UCITS funds.
The Shire/Takeda transaction was the largest positive contributor for the year. The deal had the hallmarks of situations that ourinvestment process thrives on: The spread carried a significant excess risk premium due to its sheer size, which catered to ourconcentrated style of portfolio construction; it traded in a wide range which was conducive to our active trading approach andenabled us to effectively buy the spread multiple times over the life of the deal; Shire and Takeda securities traded on severalexchanges and had liquid options markets; and fundamentally the deal had interesting but answerable research questions andrisks to address, such that our research process was able to add substantial value as we built conviction in the trade. Interestingly,2019 has begun with two new large transactions in the pharmaceutical sector, and we look forward to further applying ourexperience in this vertical.
The most significant detractor for the year was our investment in NXP Semiconductors-Qualcomm. We suffered losses on thisposition in April and May of 2018 but were able to recover some ground by trading the position in June as news swung from wildlypositive (a false report that China had approved the deal) back to its current state of limbo. Qualcomm and NXP did not receiveChinese regulatory approval by their self-imposed July 25th termination date, the deal was terminated, and NXP received a$2 billion termination fee. The parties were adamant that the process had turned political and that the deal was a casualty of theU.S.-China trade dispute.
Looking forward, we continue to view merger arbitrage as valuable diversifying exposure in an uncertain market and are excitedfor the opportunity set in front of us.
Merrill Lynch Investment Solutions – Merrill Lynch Enhanced Cross-Asset Volatility Premium Fund
The MLIS Enhanced Cross Asset Volatility Premium Fund (ISIN: LU1468410664, Bloomberg: MLCAVEB LX Equity) returned-2,3% net during the reporting period.
Global markets were driven by political topics like the Italian elections, the never ending discussions on Brexit, but also economictopics like the Trade War China vs. US, uncertainty around future Central Bank Policies and the strong Euro (for most of the12 month period). Volatility in most asset classes experienced at least one short term volatility spike which had a negative impacton the fund performance.2 Source: HSBC Global Research, as of April 2019
16 Merrill Lynch Investment Solutions
Investment Managers’ Report (cont.)
Audited annual report
Merrill Lynch Investment Solutions – Merrill Lynch Enhanced Cross-Asset Volatility Premium Fund (cont.)
At the beginning of the reporting period the Union Investment Cycle Navigator was in phase 6 of the business cycle. From Aprilto the first half of May the Fund performance was positive, the drop during the last week of May reflected theflight-to-safety-rally in government bonds due to the Government crisis in Italy. After a positive performance from June toSeptember the fund could recover, which resulted in a loss of 4.6% in the third quarter. We also got a new signal from ourBusiness Cycle Navigator which turned positive in September and switched from phase 6 to phase 5. As a result we increased ourexposure to Equity and FX Volatility while Commodity and Fixed Income Volatility was still at a balanced level.
In October we saw a big drawdown in most asset classes. The turbulences in the US Stock and High yield market lead to adrawdown in the Fund’s performance of 3.9% in October. The Cycle Navigator switched again at the end of November in phase6. Due to the market sell off in December the volatility in most asset classes finished the year 2018 at very high levels comparedto last year’s average.
The new year started with risk on for most asset classes. All global equity indices and most commodities gained significantly inJanuary while credit spreads became tighter. The Fund’s performance could benefit from the recovery in risky assets resulting ina decline in volatility. Because of the strong performance of Equity and Commodity Volatility Indices the Cross Asset VolatilityFund experienced in January 2019 the best monthly return since inception and a strong recovery from the drawdowns at the yearend. At the beginning of the year a weakening in some macro-economic data pushed the Cycle Navigator into phase 7 whichrepresents a very defensive allocation. In line with market performance the macro-economic and financial market data improvedduring the next weeks and by the end of February 2019 the Cycle Navigator switched into phase 5 which meant for the fund ahigher allocation to the different short volatility indices. A positive performance in February was followed by a drop in Marchwhich was caused by discussions around the FED rate hike cycle and some weak macro data at the end of the reporting period.
Merrill Lynch Investment Solutions – KLS Fixed Income UCITS Fund
The KLS Fixed Income UCITS Fund returned +0.16% net of fees and expenses over the 12-monthperiod starting in April 2018. In terms of Fund performance, the structured products portfolio hadpositive performance with contributions from both CMBS and Resi. Returns for the credit portionof the portfolio were modestly negative over the 12-month period, while the rates book was flat.
As of quarter end, roughly 80% of risk exposure was allocated to US and non-US rates themes, with the remaining 20% incorporate credit and structured products.
Rates Markets and PositioningThe past year has been a tale of two halves for most global rates markets. The 2nd and 3rd quarters of 2018 were characterizedby generally rising bond yields, especially in the US. The Federal Reserve hiked rates in June and September and committed to afurther hike in December as the labor market remained tight and core inflation stayed close to its 2% target. By the 4th quarter,however, tighter financial conditions in China began to have a measurable impact on growth in Asia, which quickly spread toEurope. Disappointing earnings from several large US multinationals in November finally brought the sell-off to the US to finishthe year, and when the Fed followed through on its pledge to hike rates again in December risk markets sold off aggressively toclose out 2018.
In emerging markets, strength in the first quarter of 2018 gave way to waves of weakness throughout the rest of the year. Astronger dollar and higher US interest rates pressured most countries, led by Argentina and Turkey. The slowdown in China andfears over ongoing trade tensions with the US added to worries, especially in the 4th quarter.
Returns for the rates portfolio were mixed over the past year. Emerging markets remain an overall positive, as the volatility of lastyear allowed some of our largest long and short risk positions to be meaningful contributors to returns. Developed markets sawgains in our systematic and currency strategies but losses in strategies focused on US rates.
Looking ahead in emerging markets, we remain optimistic about the opportunity set as divergences in policies and fundamentalshave persisted across a number of large economies, which typically bodes well for our core relative value strategies. In developedmarkets, we have been frustrated by the rock bottom levels of volatility in rates and especially currency markets, but we areencouraged by the fact that such periods have often sown the seeds of their own end—which we hope to witness in the quartersahead.
17Merrill Lynch Investment Solutions
Investment Managers’ Report (cont.)
Audited annual report

Merrill Lynch Investment Solutions – KLS Fixed Income UCITS Fund (cont.)
US Credit Markets and PositioningThe Corporate Credit exposure in the UCITS Fund is focused on a combination of higher quality, non-cyclical investments as wellas some higher yielding lower rated names. We are also cautious on secularly-challenged industries such as Retail and Energy. Wehave transitioned some of the portfolio from low yielding names to names that offer increased yield and potential capital gains.The recent tightening that has occurred in the 1Q of 2019 has allowed us to reduce the size of the portfolio and capitalize somesignificant appreciation in the portfolio. We will focus on the new issue market as well as continue to monitor high yield to rebuildthe portfolio as opportunities present themselves.
During the past 12 months, the Credit portion of the portfolio benefited from strength in names in Business Services, IndustrialServices & Leisure, which was partially offset by weakness in Healthcare and Aerospace.
At quarter end, the KLS UCITS credit exposure included 19 positions/issuers with credit ratings that range from CCC+ to BB. Withan average position size of $713,000, we have approximately 3% of UCITS risk invested in corporate credit assets. The currentweighted average yield and duration of the portfolio is 8.94% and 4.5, respectively. Investment exposure continues to be broadlyspread across sectors that are generally more defensive in nature including Waste Management, Healthcare, Education, andPackaging.
Structured Products PositioningThe KLS structured book had positive contributions across every sector, led by CMBS and Resi. We continue to be very active inthese sectors as we remain constructive on fundamentals and see inefficiencies in both markets. With the strong rally seen inQ1 of 2019, we realized some of our gains and await better entry points, particularly for some higher beta names. We are alsoclosely watching the market dynamics in CLOs and may potentially add on weakness given the sector has generally lagged otherspread products.
Looking AheadAfter a snap back in risk assets to start the year that rivaled the speed of the sell-off in Q4, global markets enter Q2 with lessanxiety but with a number of questions about global growth still unanswered. As investors gain more clarity on those and otherissues, we expect volatility to remain supported and, as always, we will look to capitalize on the dislocations that result from it.
Merrill Lynch Investment Solutions – Millburn Diversified UCITS Fund
The Fund was profitable during the period under review due almost entirely to profits from tradingenergy and interest rate futures. Elsewhere, profits from trading grain futures, soft commodity futures and currency forwards fellfractionally short of the losses generated from trading metal and equity futures. Trading of livestock futures was nearly flat.
Energy prices experienced a volatile round trip during the year as evidenced by the price of Brent crude oil, which rose fromaround $69 per barrel at the start of April to over $86/barrel in early October before plunging to under $50/barrel in December,finally rebounding back to about $69/barrel at the end of March. The initial price run-up reflected the OPEC/non-OPEC productioncontrol agreement, the U.S. decision to pull out of the JCPOA agreement and re-impose sanctions on Iran, the implosion of theVenezuelan economy, and Libyan production difficulties. The subsequent collapse in oil prices during October-December2018 reflected the fact that Saudi Arabia, Russia and the U.S. had all raised production to contain the price increases--each above11mb/d and near record levels; that global growth and hence energy demand was slowing; and that the U.S. had unexpectedlyprovided generous 180 day waivers to the Iran sanctions for several countries. After Christmas, however, energy prices reboundeddue to a renewal of OPEC+ production cuts that were running above target in early 2019 and as the U.S. tightened sanctions onVenezuelan and Iranian exports. Overall trading of Brent Crude, WTI crude and RBOB gasoline were profitable over the period. Along natural gas position was also profitable in November as seasonal demand pushed this price higher. On the other hand,trading of heating oil and London gas oil were each slightly unprofitable.
Monetary policy also rode a rollercoaster during the fiscal year. Initially signs of expanding synchronized global growth and risinginflation prompted central banks, led by the Federal Reserve, to shift from accommodative to neutral or tighter policy. By the lastquarter of 2018, however, slowing global growth, slackening inflation pressures, persistent uncertainties around Brexit andU.S.-China trade negotiations, collapsing oil prices, and increased equity and credit market volatility globally triggered anunexpectedly dovish pivot by global central banks—especially the Federal Reserve and ECB. This environment and periodiceconomic and political turmoil in a variety of emerging markets, including Turkey, Brazil, Argentina, Mexico and Indonesia and in
18 Merrill Lynch Investment Solutions
Investment Managers’ Report (cont.)
Audited annual report

Merrill Lynch Investment Solutions – Millburn Diversified UCITS Fund (cont.)
Europe, especially in Italy, Spain, France and Germany triggered capital flight and safe haven demand for government paper thatproduced profits on long German, French, British, Japanese, and Australian interest rate futures positions. Long positions inU.S. long bond futures were also profitable. There were losses on long Italian futures positions, particularly in May after unsettlingItalian election results. Trading of U.S. 5- and 10-year note futures were also unprofitable.
Ample supplies and trade uncertainties weighed on grain prices, and short corn, wheat and soybean positions were profitable,especially in June. A short coffee trade was slightly profitable too.
The U.S. dollar advanced solidly early in the period and long dollar positions were profitable. Thereafter, however, the dollar tradedvolatilely in a 4% range as uncertainty about monetary policy, growth, inflation, trade tensions and local political conflicts cloudedthe outlook and whipsawed traders. Long dollar trades versus the currencies of Brazil, Turkey, India, Sweden, Norway and the eurowere profitable, particularly in 2018. Later, short dollar trades relative to Brazil, Turkey and India were also profitable. On the otherhand, long dollar trades versus the currencies of Australia, New Zealand, Japan, Switzerland and South Africa, and trading of theMexican peso, Russian ruble and Colombian peso versus the dollar posted largely offsetting losses. Trading of the euro versusother European currencies was also unprofitable.
Equity markets were also buffeted by the vacillating growth, inflation and monetary policy perspectives, and trading of stockindex futures was mixed and marginally unprofitable overall. Trading of German, British, Korean, Australian, Japanese andCanadian equity futures, countries whose economies are heavily trade-dependent, were particularly unprofitable. Trading of theEURO STOXX, S&P 500 and U.S. Mid-Cap indices also posted losses. Meanwhile, trading of Dutch, French, Hong Kong, Taiwanese,Singaporean, NASDAQ, Russell, EAFE and emerging market stock futures registered partially offsetting gains.
A volatile dollar and varying global growth and trade outlooks, especially for China, negatively impacted metal markets. Trading ofcopper, gold, aluminum and silver were each unprofitable.
Merrill Lynch Investment Solutions – Global Debt - Credit UCITS Fund
For the year ending 31 March 2019 the portfolio has modestly outperformed its benchmark on a gross-of-fee basis. Defensivesecurity selection during the risk-on rally in January 2018 partially detracted from performance.
The Bloomberg Barclays Global Aggregate Credit Index delivered a total return of 5.16% on a US dollar-hedged basis for the yearending 31 March 2019. The average option adjusted spread (OAS) moderately tightened in April before further widening in Mayand June. Robust corporate earnings in both US and Europe, as well as temporary ease of tension on trade war between US andChina helped the broader credit market in April. The initial strength quickly faded however, as geopolitical risks took the spotlightin May and June, with a political crisis unfolding in Italy and renewing fears of US protectionism. Economic fundamentalsremained strong in the quarter however, and global indicators continued to point toward synchronized global growth.
In the third quarter although overall G7 growth seemed to be robust and above trend, solid near-term global growth was stuntedand overshadowed by prevalent and heightened geopolitical uncertainty, namely protectionism, impacting global fixed incomemarkets. Trade tensions between the US and China continued to be persistent, as further tariffs were implemented by bothcountries on one another’s goods throughout the period. On the other hand, developments were made in agreements surroundingNAFTA between the US, Canada and Mexico at the end of the quarter. Central banks were quieter this quarter and, as widelyexpected, the Federal Open Market Committee (FOMC) raised the target federal funds rate by 25bps to a new range of2%-2.25% in September. Robust economic fundamentals, a growing return of global inflows into high grade bonds, and astronger outlook for quantitative tightening have all combined to produce a supportive backdrop toward a steady grind tighter incredit spreads over the quarter.
In the fourth quarter the average option-adjusted spread widened to its widest level in two-and-a-half years. The collapse in oilprices over the quarter contributed to energy companies registering the worst performance by sector. The Aa-rated sector wasthe most robust rating category and short-dated bonds were the strongest performers in the risk-off environment, with bondsmaturing in 1-3 years delivering better excess returns than any other portion of the credit curve. Our overweight to credit versusthe government-related portion of the index detracted as the flight-to-quality supported the government-related names.
19Merrill Lynch Investment Solutions
Investment Managers’ Report (cont.)
Audited annual report

Merrill Lynch Investment Solutions – Global Debt - Credit UCITS Fund (cont.)
The new year started positively for global credit after 2018 saw the asset class suffer its worst year since 2011. The averageoption-adjusted spread tightened and recovered much of the fourth-quarter widening. The rebound in oil prices supported strongexcess returns from energy sectors such as refining, independent energy and midstream, while home construction and gamingalso performed strongly. Lower-rated bonds outperformed, with the Baa-rated sector returning 2.93% and A-rated sector 1.98%,while Aa-rated bonds lagged relatively with 1.34%. As the market experienced a V-shaped rebound in 2019, our pro-cyclical biascontributed to performance. Specifically, an overweight exposure to consumer cyclicals, particularly to automotive, services andgaming and to technology issuers generated alpha. However, underweights to capital goods, transportation and energy off-setsome of the gains.
Portfolio PositioningFrom a portfolio positioning standpoint, we continue to have a pro-cyclical bias and are overweight credit versusgovernment-related names. The portfolio continues to be overweight Consumer Cyclical and Technology names and underweightFinancials and Energy.
Market OutlookMarch was another strong month for credit, culminating in an exceptional first quarter. European credit saw its best quarterlyperformance since the eurozone crisis in 2012, while US high yield saw the best quarterly performance. since fourth quarter2011. The dovish outlook from central banks has led investors to reach for yield, with retail funds seeing strong inflows over thequarter. This was more evident in the US where investment grade funds saw $29B of inflows and high yield saw $15B of inflows.The strong inflow picture has been reflected in market technicals, with very well subscribed deals and very low new issuepremiums. However, fundamentals continue to show only marginal improvement, with debt funded M&A continuing, and firmsperceived to be behind their deleveraging plans.
Merrill Lynch Investment Solutions – Global Debt - Government UCITS Fund
For the year ending 31 March 2019 the portfolio has tracked in line with its index, which is the fund’s investment objective.
Global Bond Market ReviewThe second quarter of 2018 saw less accommodative monetary policy gather pace and increased steps made toward tighteningas the Federal Reserve (Fed) hiked rates and the European Central Bank (ECB) declared the end of its quantitative easing andasset purchase programme by year end. Global economic activity indicators continued to point to above-trend growth, albeitlargely driven by the U.S. as the Eurozone published mixed data, and the emerging markets continued to be rocked by themarket’s risk off sentiment, tighter global funding condition and a strengthening US dollar. However, it was politics andgeopolitical risk that dominated headlines throughout the quarter, as an onslaught of news and risk events gave rise to increasingmarket uncertainty.
The third quarter of 2018 was largely characterised by further economic strength in the US and the related strain in EmergingMarkets (EM). Buoyant economic data and faster wage growth have both paved the way for further US Fed normalisation throughrate hikes and its balance sheet unwind. The withdrawal of global liquidity, coupled with idiosyncratic developments in countrieslike Argentina and Turkey, has weighed on sentiment for EM. While EM Countries with significant external financing requirementshave been most susceptible, the weakness has spread across emerging markets. Trade wars have also continued to escalate withthe US imposing tariffs on a further $US 200 billion worth of Chinese imports, marking a significant development which was notjust earmarked by rhetoric or threats.
Major sovereign bond markets began the fourth quarter selling off amid a still-rosy economic outlook and expectations ofcontinued US tightening. That mood soon changed as softer earnings, escalating trade tensions, political uncertainties and signsof weakening global growth drove a strong rally in benchmark yields over the rest of the quarter. The 10-year US Treasury yieldfell 38 basis points (bps) to 2.68%, its lowest level for 10 months. The 10-year Japanese government bond yield briefly turnednegative for the first time since 2017 before closing just above zero, a fall over the quarter of 13 bps. The 10-year yield inGermany fell 23 bps to 0.24% and in the UK fell 29 bps to 1.28%.
After 2018 delivered the unusual outcome of both global equities and global bonds suffering negative returns, 2019 began inmuch more upbeat fashion, with many asset classes rebounding strongly in an environment of low volatility. A steady rally ingovernment bonds accelerated into a marked repricing in March after the Fed delivered a dovish surprise at its meeting and
20 Merrill Lynch Investment Solutions
Investment Managers’ Report (cont.)
Audited annual report

Merrill Lynch Investment Solutions – Global Debt - Government UCITS Fund (cont.)
European manufacturing activity slumped far more than feared. Benchmark 10-year yields fell sharply across major sovereignmarkets over the quarter, by 27 bps to 2.41% in the US and by 28 bps to 1.00% in the UK. The 10-year yield in Japan began theyear barely in positive territory and fell to -0.08% at the end of March. In Germany, the epicentre of Europe’s manufacturingdownturn, the 10-year bund yield fell by 31 bps to -0.07%. The rally took yields to levels not seen since December 2017 andSeptember 2017, respectively, in the US and UK; yields in Japan and Germany fell to their lowest since the autumn of 2016.
Merrill Lynch Investment Solutions – Global Debt - Securitised UCITS Fund
For the year ending 31 March 2019 the portfolio performed in line with its benchmark. The portfolio maintained an up-in-coupontilt in an effort to try to capture static term premia. This position detracted from performance, particularly in the second quarter,but then benefitted from the steeper 5/30 curve later in the year and in the first quarter of 2019.
The Bloomberg Barclays Global Aggregate Securitized 100% USD Hedged Index returned 4.56%. The bulk of this performancecame from the US mortgage portion of the index. The Bloomberg Barclays Agency MBS Index as measured by BloombergBarclays posted a total return of 4.42% for the period under review.
Portfolio PositioningIn terms of security selection, we preferred owning specified pooled over TBAs given our outlook for elevated vol as the Fedreduced its balance sheet. Seasoned pools are a good way to shorten duration and reduce convexity exposure with minimalpay-up volatility. The downside is that bonds can be negative carry until solidly in discount space, since speeds in these cohortsare generally turnover driven.
Market OutlookWith the Fed putting rate hikes on hold and implicitly selling the basis later this year by reinvesting treasury maturities, mortgagerates are about 40 basis points below last year’s average, leaving about a third of the universe refinancible. This is boostingaffordability and net supply while spreads and rate implied volatilities near the tight end of the cycle range, which aren’t veryconducive to mortgages in the medium term. But with total carry near recent highs, underperformance will be muted, especiallyif we see other risk assets underperform given mortgages’ relative liquidity and a Fed backstop. We saw an example of this inMarch as the basis held in well despite rates breaking below 15-month lows. That said, there were material differences inperformance between agencies, as lower coupons and Ginnies meaningfully outperformed reflecting a defensive move awayfrom convexity. With few macro catalysts and policy shifts on the horizon, we would expect the mantra of defensive carry toremain the primary driver of near-term performance.
Note: The figures stated in this report are historical and not necessarily indicative of future performance.
21Merrill Lynch Investment Solutions
Investment Managers’ Report (cont.)
Audited annual report

PricewaterhouseCoopers, Société coopérative, 2 rue Gerhard Mercator, B.P. 1443, L-1014 Luxembourg T : +352 494848 1, F : +352 494848 2900, www.pwc.lu Cabinet de révision agréé. Expert-comptable (autorisation gouvernementale n°10028256) R.C.S. Luxembourg B 65 477 - TVA LU25482518
Audit report
To the Shareholders of
Merrill Lynch Investment Solutions
Our opinion
In our opinion, the accompanying financial statements give a true and fair view of the financial position
of Merrill Lynch Investment Solutions and of each of its sub-funds (the “Fund”) as at 31 March 2019,
and of the results of their operations and changes in their net assets for the year then ended in
accordance with Luxembourg legal and regulatory requirements relating to the preparation and
presentation of the financial statements.
What we have audited
The Fund’s financial statements comprise:
the statement of net assets as at 31 March 2019;
the schedule of investments as at 31 March 2019;
the statement of operations and changes in net assets for the year then ended; and
the notes to the financial statements, which include a summary of significant accounting policies.
Basis for opinion
We conducted our audit in accordance with the Law of 23 July 2016 on the audit profession (Law of
23 July 2016) and with International Standards on Auditing (ISAs) as adopted for Luxembourg by the
“Commission de Surveillance du Secteur Financier” (CSSF). Our responsibilities under the Law of
23 July 2016 and ISAs as adopted for Luxembourg by the CSSF are further described in the
“Responsibilities of the “Réviseur d’entreprises agréé” for the audit of the financial statements” section
of our report.
We believe that the audit evidence we have obtained is sufficient and appropriate to provide a basis for
our opinion.
We are independent of the Fund in accordance with the International Ethics Standards Board for
Accountants’ Code of Ethics for Professional Accountants (IESBA Code) as adopted for Luxembourg
by the CSSF together with the ethical requirements that are relevant to our audit of the financial
statements. We have fulfilled our other ethical responsibilities under those ethical requirements.
Other information
The Board of Directors of the Fund is responsible for the other information. The other information
comprises the information stated in the annual report but does not include the financial statements and
our audit report thereon.
Our opinion on the financial statements does not cover the other information and we do not express any
form of assurance conclusion thereon.

23
In connection with our audit of the financial statements, our responsibility is to read the other information
identified above and, in doing so, consider whether the other information is materially inconsistent with
the financial statements or our knowledge obtained in the audit, or otherwise appears to be materially
misstated. If, based on the work we have performed, we conclude that there is a material misstatement
of this other information, we are required to report that fact. We have nothing to report in this regard.
Responsibilities of the Board of Directors of the Fund for the financial statements
The Board of Directors of the Fund is responsible for the preparation and fair presentation of the financial
statements in accordance with Luxembourg legal and regulatory requirements relating to the preparation
and presentation of the financial statements, and for such internal control as the Board of Directors of
the Fund determines is necessary to enable the preparation of financial statements that are free from
material misstatement, whether due to fraud or error.
In preparing the financial statements, the Board of Directors of the Fund is responsible for assessing
the Fund’s ability to continue as a going concern, disclosing, as applicable, matters related to going
concern and using the going concern basis of accounting unless the Board of Directors of the Fund
either intends to liquidate the Fund or to cease operations, or has no realistic alternative but to do so.
Responsibilities of the “Réviseur d’entreprises agréé” for the audit of the financial statements
The objectives of our audit are to obtain reasonable assurance about whether the financial statements
as a whole are free from material misstatement, whether due to fraud or error, and to issue an audit
report that includes our opinion. Reasonable assurance is a high level of assurance, but is not a
guarantee that an audit conducted in accordance with the Law of 23 July 2016 and with ISAs as adopted
for Luxembourg by the CSSF will always detect a material misstatement when it exists. Misstatements
can arise from fraud or error and are considered material if, individually or in the aggregate, they could
reasonably be expected to influence the economic decisions of users taken on the basis of these
financial statements.
As part of an audit in accordance with the Law of 23 July 2016 and with ISAs as adopted for Luxembourg
by the CSSF, we exercise professional judgment and maintain professional scepticism throughout the
audit. We also:
identify and assess the risks of material misstatement of the financial statements, whether due to
fraud or error, design and perform audit procedures responsive to those risks, and obtain audit
evidence that is sufficient and appropriate to provide a basis for our opinion. The risk of not detecting
a material misstatement resulting from fraud is higher than for one resulting from error, as fraud may
involve collusion, forgery, intentional omissions, misrepresentations, or the override of internal
control;
obtain an understanding of internal control relevant to the audit in order to design audit procedures
that are appropriate in the circumstances, but not for the purpose of expressing an opinion on the
effectiveness of the Fund’s internal control;
evaluate the appropriateness of accounting policies used and the reasonableness of accounting
estimates and related disclosures made by the Board of Directors of the Fund;

24
conclude on the appropriateness of Board of Directors of the Fund’s use of the going concern basis
of accounting and, based on the audit evidence obtained, whether a material uncertainty exists
related to events or conditions that may cast significant doubt on the Fund’s or any of its sub-funds’
ability to continue as a going concern. If we conclude that a material uncertainty exists, we are
required to draw attention in our report of the “Réviseur d’Entreprises Agréé” to the related
disclosures in the financial statements or, if such disclosures are inadequate, to modify our opinion.
Our conclusions are based on the audit evidence obtained up to the date of our report of the
“Réviseur d’Entreprises Agréé”. However, future events or conditions may cause the Fund or any of
its sub-funds (except for Merrill Lynch Investment Solutions – Merrill Lynch WNT Diversified Futures
UCITS Fund where a decision to liquidate exists) to cease to continue as a going concern;
evaluate the overall presentation, structure and content of the financial statements, including the
disclosures, and whether the financial statements represent the underlying transactions and events
in a manner that achieves fair presentation.
We communicate with those charged with governance regarding, among other matters, the planned
scope and timing of the audit and significant audit findings, including any significant deficiencies in
internal control that we identify during our audit.
PricewaterhouseCoopers, Société coopérative
Represented by
Régis Malcourant
Luxembourg, 28 June 2019

Sub-Funds Notes
Merrill LynchInvestmentSolutions –
Marshall WaceTOPS UCITS Fund(Market Neutral)
USD
Merrill LynchInvestment
Solutions – YorkEvent-Driven
UCITS FundEUR
Merrill LynchInvestment
Solutions – YorkAsian Event-Driven
UCITS FundEUR
Merrill LynchInvestment
Solutions – AQRGlobal Relative
Value UCITS FundUSD
Merrill LynchInvestment
Solutions – MerrillLynch WNT
Diversified FuturesUCITS Fund (in
liquidation)USD
Merrill LynchInvestment
Solutions – MerrillLynch EnhancedEquity Volatility
Premium FundEUR
Merrill LynchInvestment
Solutions – MerrillLynch MLCXCommodity
Enhanced BetaFundUSD
AssetsInvestments in securities at cost 1 453 155 430 43 181 635 70 168 040 254 237 676 2 760 000 124 906 722 28 287 780Investments in securities at market value 2.2 1 470 979 578 45 709 913 72 137 777 267 645 294 - 7 682 7 649Reverse repurchase agreements at market value 2.2 - - - - 2 760 000 124 900 000 28 280 000Market value of the to be announced securities contracts 2.9 - - - - - - -Unrealised appreciation on futures contracts 2.5 14 880 75 611 5 125 9 496 911 - - -Unrealised appreciation on forward foreign exchange contracts 2.7 3 722 935 334 882 260 359 9 314 772 15 651 - 969Options bought at market value 2.6 - 43 124 284 946 18 695 - 24 970 -Unrealised appreciation on swaps contracts 2.3 - - - 7 101 - - 451 844Contracts for difference at market value 2.4 132 001 914 1 076 783 2 408 498 17 155 194 - - -Cash at bank 2.11 500 098 249 5 247 431 15 326 880 154 397 871 472 040 6 577 135 742 297Due from broker 8 745 770 277 9 138 158 33 453 758 182 109 186 678 709 725 000 280 000Receivable for Fund shares issued 319 779 - 1 062 517 56 219 863 - 50 207 -Receivable on securities sold 311 957 284 422 156 3 818 387 2 135 040 - - -Receivable on options sold - - - - - 287 648 -Receivable on swaps sold - - - 349 655 - - -Receivable on spot exchange 36 333 837 - 11 62 474 803 1 322 435 - -Dividends receivable 2.12 810 339 141 458 264 553 - - - -Upfront payments received on swap transactions 2.3 - - - 322 399 - - -Interest receivable on bonds 2.12 71 970 - - 205 284 978 104 10 308Other assets - - - - 15 636 - 10Total Assets 3 202 081 042 62 189 516 129 022 811 761 852 068 5 265 449 132 572 746 29 773 077
LiabilitiesBank overdraft 2.11 85 538 083 64 263 155 10 884 108 - - -Due to broker 8 35 441 919 720 921 - 24 246 902 217 642 - 430 000Market value of short position of the to be announced securities contracts 2.9 - - - - - - -Unrealised depreciation on futures contracts 2.5 2 218 127 477 900 535 806 4 071 619 - - -Unrealised depreciation on forward foreign exchange contracts 2.7 41 934 369 680 299 1 093 841 13 254 051 31 761 - 157 083Options sold at market value 2.6 - - 43 537 532 743 - 609 117 -Unrealised depreciation on swaps contracts 2.3 - - - 316 776 - - -Upfront payments paid on swap transactions 2.3 - - - 3 347 691 - - -Contracts for difference at market value 2.4 22 058 283 281 295 3 230 052 5 824 482 - - -Payable for Fund shares redeemed 3 220 310 50 337 - 2 808 666 - 857 511 38Payable on securities purchased 258 913 706 1 684 499 6 868 909 246 562 - - -Payable on options purchased - - 14 592 1 960 - - -Payable on spot exchange 36 331 127 - - 62 413 909 1 322 302 - -Investment management and distributor fees payable 3 3 332 384 83 295 119 305 495 767 5 568 68 001 14 642Performance fees payable 3 - 25 122 - - - - -"Taxe d'abonnement" payable 7 93 391 4 842 2 868 16 776 249 3 193 801Operating and administrative fees payable 4 670 299 18 434 36 812 73 969 1 837 59 813 3 438Interest payable on swaps contracts 2.3 - - - 53 121 - - -Other liabilities 2 621 367 3 588 1 684 - 4 100 7 251 2 722Total Liabilities 492 373 365 4 094 795 11 947 561 128 589 102 1 583 459 1 604 886 608 724
Net assets at the end of year 2 709 707 677 58 094 721 117 075 250 633 262 966 3 681 990 130 967 860 29 164 353
25Merrill Lynch Investment Solutions
Statements of Net Assets as at March 31, 2019(expressed in the Sub-Fund’s currency)
The accompanying notes form an integral part of these financial statements.Audited annual report
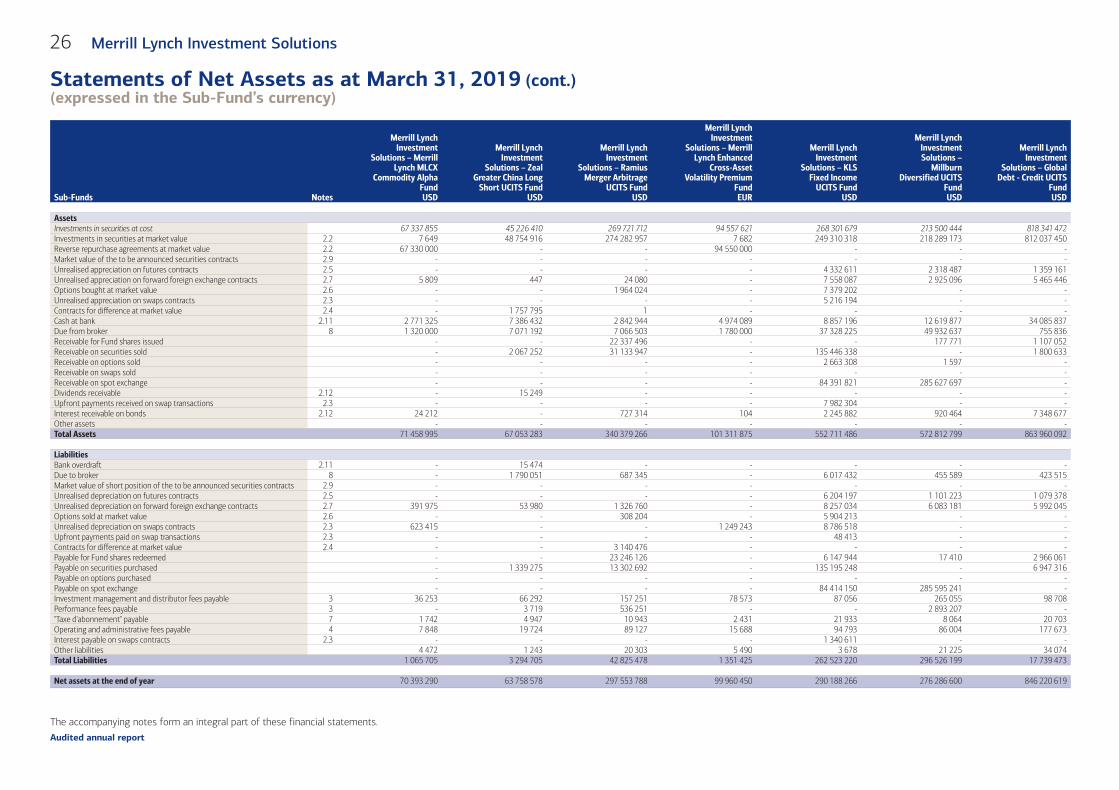
Sub-Funds Notes
Merrill LynchInvestment
Solutions – MerrillLynch MLCX
Commodity AlphaFundUSD
Merrill LynchInvestment
Solutions – ZealGreater China Long
Short UCITS FundUSD
Merrill LynchInvestment
Solutions – RamiusMerger Arbitrage
UCITS FundUSD
Merrill LynchInvestment
Solutions – MerrillLynch Enhanced
Cross-AssetVolatility Premium
FundEUR
Merrill LynchInvestment
Solutions – KLSFixed Income
UCITS FundUSD
Merrill LynchInvestmentSolutions –
MillburnDiversified UCITS
FundUSD
Merrill LynchInvestment
Solutions – GlobalDebt - Credit UCITS
FundUSD
AssetsInvestments in securities at cost 67 337 855 45 226 410 269 721 712 94 557 621 268 301 679 213 500 444 818 341 472Investments in securities at market value 2.2 7 649 48 754 916 274 282 957 7 682 249 310 318 218 289 173 812 037 450Reverse repurchase agreements at market value 2.2 67 330 000 - - 94 550 000 - - -Market value of the to be announced securities contracts 2.9 - - - - - - -Unrealised appreciation on futures contracts 2.5 - - - - 4 332 611 2 318 487 1 359 161Unrealised appreciation on forward foreign exchange contracts 2.7 5 809 447 24 080 - 7 558 087 2 925 096 5 465 446Options bought at market value 2.6 - - 1 964 024 - 7 379 202 - -Unrealised appreciation on swaps contracts 2.3 - - - - 5 216 194 - -Contracts for difference at market value 2.4 - 1 757 795 1 - - - -Cash at bank 2.11 2 771 325 7 386 432 2 842 944 4 974 089 8 857 196 12 619 877 34 085 837Due from broker 8 1 320 000 7 071 192 7 066 503 1 780 000 37 328 225 49 932 637 755 836Receivable for Fund shares issued - - 22 337 496 - - 177 771 1 107 052Receivable on securities sold - 2 067 252 31 133 947 - 135 446 338 - 1 800 633Receivable on options sold - - - - 2 663 308 1 597 -Receivable on swaps sold - - - - - - -Receivable on spot exchange - - - - 84 391 821 285 627 697 -Dividends receivable 2.12 - 15 249 - - - - -Upfront payments received on swap transactions 2.3 - - - - 7 982 304 - -Interest receivable on bonds 2.12 24 212 - 727 314 104 2 245 882 920 464 7 348 677Other assets - - - - - - -Total Assets 71 458 995 67 053 283 340 379 266 101 311 875 552 711 486 572 812 799 863 960 092
LiabilitiesBank overdraft 2.11 - 15 474 - - - - -Due to broker 8 - 1 790 051 687 345 - 6 017 432 455 589 423 515Market value of short position of the to be announced securities contracts 2.9 - - - - - - -Unrealised depreciation on futures contracts 2.5 - - - - 6 204 197 1 101 223 1 079 378Unrealised depreciation on forward foreign exchange contracts 2.7 391 975 53 980 1 326 760 - 8 257 034 6 083 181 5 992 045Options sold at market value 2.6 - - 308 204 - 5 904 213 - -Unrealised depreciation on swaps contracts 2.3 623 415 - - 1 249 243 8 786 518 - -Upfront payments paid on swap transactions 2.3 - - - - 48 413 - -Contracts for difference at market value 2.4 - - 3 140 476 - - - -Payable for Fund shares redeemed - - 23 246 126 - 6 147 944 17 410 2 966 061Payable on securities purchased - 1 339 275 13 302 692 - 135 195 248 - 6 947 316Payable on options purchased - - - - - - -Payable on spot exchange - - - - 84 414 150 285 595 241 -Investment management and distributor fees payable 3 36 253 66 292 157 251 78 573 87 056 265 055 98 708Performance fees payable 3 - 3 719 536 251 - - 2 893 207 -"Taxe d'abonnement" payable 7 1 742 4 947 10 943 2 431 21 933 8 064 20 703Operating and administrative fees payable 4 7 848 19 724 89 127 15 688 94 793 86 004 177 673Interest payable on swaps contracts 2.3 - - - - 1 340 611 - -Other liabilities 4 472 1 243 20 303 5 490 3 678 21 225 34 074Total Liabilities 1 065 705 3 294 705 42 825 478 1 351 425 262 523 220 296 526 199 17 739 473
Net assets at the end of year 70 393 290 63 758 578 297 553 788 99 960 450 290 188 266 276 286 600 846 220 619
26 Merrill Lynch Investment Solutions
Statements of Net Assets as at March 31, 2019 (cont.)(expressed in the Sub-Fund’s currency)
The accompanying notes form an integral part of these financial statements.Audited annual report

Sub-Funds Notes
Merrill LynchInvestment
Solutions – GlobalDebt - Government
UCITS FundUSD
Merrill LynchInvestment
Solutions – GlobalDebt - Securitised
UCITS FundUSD
CombinedEUR
AssetsInvestments in securities at cost 5 108 859 955 735 810 826 8 585 118 875Investments in securities at market value 2.2 5 153 192 126 730 098 181 8 333 696 067Reverse repurchase agreements at market value 2.2 - - 307 057 437Market value of the to be announced securities contracts 2.9 - 34 359 870 30 600 591Unrealised appreciation on futures contracts 2.5 - 677 472 16 295 930Unrealised appreciation on forward foreign exchange contracts 2.7 42 835 292 2 356 076 66 709 874Options bought at market value 2.6 - - 8 698 298Unrealised appreciation on swaps contracts 2.3 - - 5 059 611Contracts for difference at market value 2.4 - - 137 888 736Cash at bank 2.11 31 636 247 22 102 535 725 038 941Due from broker 8 150 000 375 000 965 022 809Receivable for Fund shares issued 5 689 288 892 539 78 366 144Receivable on securities sold 34 195 375 1 918 180 468 070 134Receivable on options sold - - 2 663 739Receivable on swaps sold - - 311 400Receivable on spot exchange 51 954 457 17 949 146 481 349 278Dividends receivable 2.12 - 1 1 141 273Upfront payments received on swap transactions 2.3 - - 7 404 331Interest receivable on bonds 2.12 27 111 996 2 690 269 36 835 963Other assets - - 13 935Total Assets 5 346 764 781 813 419 269 11 672 224 491
LiabilitiesBank overdraft 2.11 - - 85 950 935Due to broker 8 30 000 781 269 63 533 560Market value of short position of the to be announced securities contracts 2.9 - 224 007 199 499Unrealised depreciation on futures contracts 2.5 - - 14 090 262Unrealised depreciation on forward foreign exchange contracts 2.7 41 061 569 4 885 623 111 714 079Options sold at market value 2.6 - - 6 665 926Unrealised depreciation on swaps contracts 2.3 - - 9 920 830Upfront payments paid on swap transactions 2.3 - - 3 024 590Contracts for difference at market value 2.4 - - 31 140 366Payable for Fund shares redeemed 14 587 750 1 744 553 49 664 145Payable on securities purchased 27 937 836 47 630 057 446 429 709Payable on options purchased - - 16 338Payable on spot exchange 51 966 801 17 974 110 481 316 700Investment management and distributor fees payable 3 203 371 63 618 4 647 498Performance fees payable 3 - - 3 085 664"Taxe d'abonnement" payable 7 127 512 18 110 302 959Operating and administrative fees payable 4 1 098 202 156 152 2 338 767Interest payable on swaps contracts 2.3 - - 1 242 629Other liabilities 184 483 26 606 2 622 370Total Liabilities 137 197 524 73 504 105 1 317 906 826
Net assets at the end of year 5 209 567 257 739 915 164 10 354 317 665
27Merrill Lynch Investment Solutions
Statements of Net Assets as at March 31, 2019 (cont.)(expressed in the Sub-Fund’s currency)
The accompanying notes form an integral part of these financial statements.Audited annual report

Sub-Funds Notes
Merrill LynchInvestmentSolutions –
Marshall WaceTOPS UCITS Fund(Market Neutral)
USD
Merrill LynchInvestment
Solutions – YorkEvent-Driven UCITS
FundEUR
Merrill LynchInvestment
Solutions – YorkAsian Event-Driven
UCITS FundEUR
Merrill LynchInvestment
Solutions – AQRGlobal Relative
Value UCITS FundUSD
Merrill LynchInvestment
Solutions – MerrillLynch WNT
Diversified FuturesUCITS Fund (in
liquidation)USD
Merrill LynchInvestment
Solutions – MerrillLynch EnhancedEquity Volatility
Premium FundEUR
Merrill LynchInvestment
Solutions – MerrillLynch MLCXCommodity
Enhanced BetaFundUSD
Net assets at the beginning of the year 3 615 083 142 88 131 763 141 477 272 1 973 314 851 250 683 906 103 138 930 17 645 184IncomeDividends, net 2.12 22 117 417 818 825 2 147 839 6 498 - - -Interest on bonds, net 2.12 - 153 416 200 672 7 417 261 1 843 455 - 145 350Interest on swaps 2.3 - - 5 613 2 466 515 - - -Bank interest 2.12 25 841 874 66 639 658 492 5 523 869 506 084 - 260 916Other income 2.12 - - - - - - -Total Income 47 959 291 1 038 880 3 012 616 15 414 143 2 349 539 - 406 266ExpensesInvestment management and distributor fees 3 51 665 032 1 235 253 1 741 733 12 117 842 1 739 943 392 610 123 105Performance fees 3 7 007 948 25 826 - - - - -“Taxe d’abonnement” 7 472 981 22 605 13 050 111 991 14 114 12 044 2 371Operating and administrative fees 4 10 327 795 298 889 555 551 1 806 843 685 564 348 004 36 467Professional fees 5 15 770 802 - - - - - -Interest, bank charges and transaction costs 6 554 553 15 025 93 362 1 128 570 115 880 15 044 -Interest on swaps 2.3 - - - - - - -Interest expense on reverse repurchase agreements 2.8 - - - - - 192 079 -Director fees 12 44 010 932 1 853 15 964 2 132 1 504 193Other expenses 1 377 979 136 171 31 590 985 221 20 639 449 316 992Total Expenses 87 221 100 1 734 701 2 437 139 16 166 431 2 578 272 1 410 601 163 128Net Income/(Expenses) (39 261 809) (695 821) 575 477 (752 288) (228 733) (1 410 601) 243 138Net realised gain/(loss) on:- Sales of investments 2.10 4 740 234 3 563 893 (6 645 809) 2 078 931 (54 160) (1 086) (2 303)- To be announced securities contracts 2.9 - - - - - - -- Futures contracts 2.5 (6 382 480) 706 695 198 427 (28 462 806) 858 554 - -- Forward foreign exchange contracts and foreign exchange translation 2.7, 2.11 (280 445 722) 446 755 (5 765 501) (156 158 299) (26 117 116) - (1 560 797)- Options 2.6 21 110 (136 931) (866 786) (133 707) - 3 846 499 -- Swaps contracts 2.3 - - - (3 629 343) - - (1 273 078)- Contracts for difference 2.4 (5 222 577) 2 534 541 10 791 772 (302 916 049) (661 191) - -Total realised gain/(loss) (287 289 435) 7 114 953 (2 287 897) (489 221 273) (25 973 913) 3 845 413 (2 836 178)Net realised result for the year (326 551 244) 6 419 132 (1 712 420) (489 973 561) (26 202 646) 2 434 812 (2 593 040)Change in net unrealised appreciation/(depreciation) on :- Investments 2.2 39 227 388 1 128 209 3 293 966 (11 105 711) 94 267 32 572 1 211- To be announced securities contracts 2.9 - - - - - - -- Futures contracts 2.5 (3 073 745) (1 477 807) (1 136 163) 1 627 093 (347 169) - -- Forward foreign exchange contracts 2.7 (56 676 270) (681 823) (181 875) (10 157 780) 447 012 - (129 705)- Options 2.6 (1 967) 135 816 90 507 87 983 - (10 898) -- Swaps contracts 2.3 - - - (460 894) - - 417 641- Contracts for difference 2.4 (54 761 586) (2 758 203) (4 103 677) 132 241 095 660 496 - -Change in net unrealised appreciation/(depreciation) (75 286 180) (3 653 808) (2 037 242) 112 231 786 854 606 21 674 289 147Net change in net assets as a result of operations (401 837 424) 2 765 324 (3 749 662) (377 741 775) (25 348 040) 2 456 486 (2 303 893)Subscriptions 587 720 514 10 486 695 41 284 215 238 879 898 30 898 424 51 317 871 27 309 461Redemptions (1 091 258 555) (43 289 061) (61 936 575) (1 200 994 252) (252 552 300) (25 945 427) (13 486 399)Distributions 11 - - - (195 756) - - -Movements in capital (503 538 041) (32 802 366) (20 652 360) (962 310 110) (221 653 876) 25 372 444 13 823 062Exchange differences on the net assets as at March 31, 2019 - - - - - - -Net assets at the end of the year 2 709 707 677 58 094 721 117 075 250 633 262 966 3 681 990 130 967 860 29 164 353
28 Merrill Lynch Investment Solutions
Statements of Operations and Changes in Net Assets for the year ended March 31, 2019(expressed in the Sub-Fund’s currency)
The accompanying notes form an integral part of these financial statements.Audited annual report
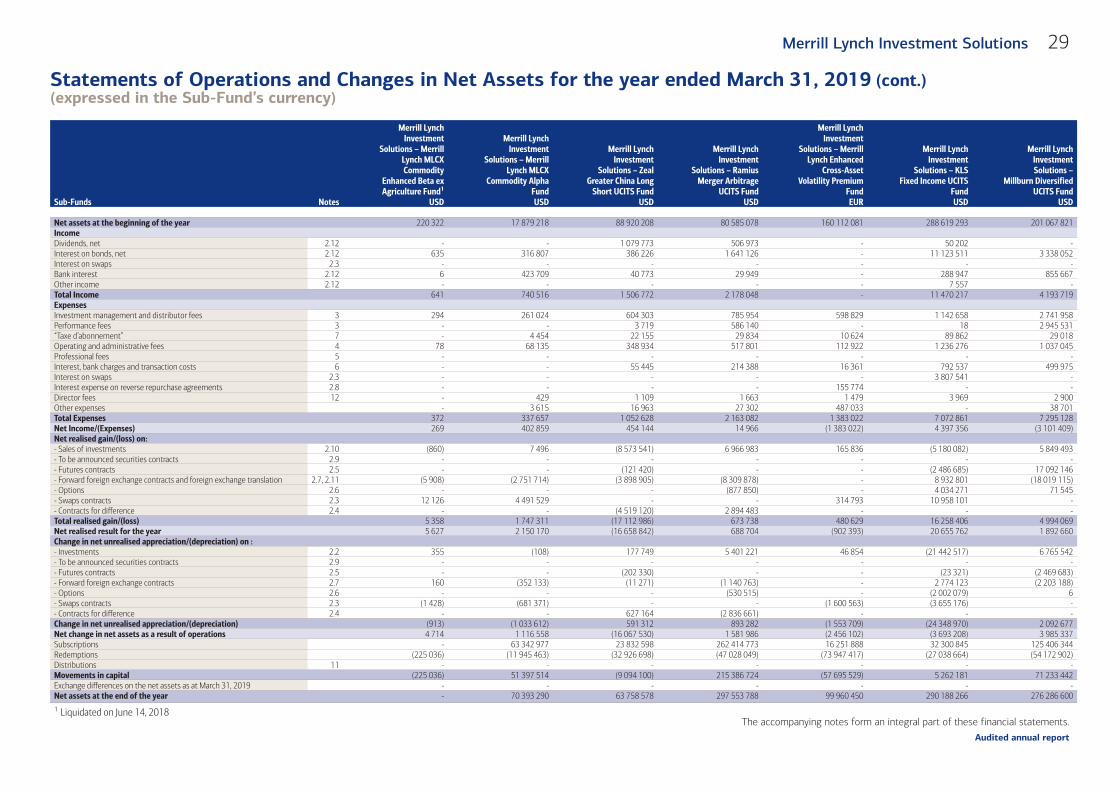
Sub-Funds Notes
Merrill LynchInvestment
Solutions – MerrillLynch MLCXCommodity
Enhanced Beta exAgriculture Fund1
USD
Merrill LynchInvestment
Solutions – MerrillLynch MLCX
Commodity AlphaFundUSD
Merrill LynchInvestment
Solutions – ZealGreater China Long
Short UCITS FundUSD
Merrill LynchInvestment
Solutions – RamiusMerger Arbitrage
UCITS FundUSD
Merrill LynchInvestment
Solutions – MerrillLynch Enhanced
Cross-AssetVolatility Premium
FundEUR
Merrill LynchInvestment
Solutions – KLSFixed Income UCITS
FundUSD
Merrill LynchInvestmentSolutions –
Millburn DiversifiedUCITS Fund
USD
Net assets at the beginning of the year 220 322 17 879 218 88 920 208 80 585 078 160 112 081 288 619 293 201 067 821IncomeDividends, net 2.12 - - 1 079 773 506 973 - 50 202 -Interest on bonds, net 2.12 635 316 807 386 226 1 641 126 - 11 123 511 3 338 052Interest on swaps 2.3 - - - - - - -Bank interest 2.12 6 423 709 40 773 29 949 - 288 947 855 667Other income 2.12 - - - - - 7 557 -Total Income 641 740 516 1 506 772 2 178 048 - 11 470 217 4 193 719ExpensesInvestment management and distributor fees 3 294 261 024 604 303 785 954 598 829 1 142 658 2 741 958Performance fees 3 - - 3 719 586 140 - 18 2 945 531“Taxe d’abonnement” 7 - 4 454 22 155 29 834 10 624 89 862 29 018Operating and administrative fees 4 78 68 135 348 934 517 801 112 922 1 236 276 1 037 045Professional fees 5 - - - - - - -Interest, bank charges and transaction costs 6 - - 55 445 214 388 16 361 792 537 499 975Interest on swaps 2.3 - - - - - 3 807 541 -Interest expense on reverse repurchase agreements 2.8 - - - - 155 774 - -Director fees 12 - 429 1 109 1 663 1 479 3 969 2 900Other expenses - 3 615 16 963 27 302 487 033 - 38 701Total Expenses 372 337 657 1 052 628 2 163 082 1 383 022 7 072 861 7 295 128Net Income/(Expenses) 269 402 859 454 144 14 966 (1 383 022) 4 397 356 (3 101 409)Net realised gain/(loss) on:- Sales of investments 2.10 (860) 7 496 (8 573 541) 6 966 983 165 836 (5 180 082) 5 849 493- To be announced securities contracts 2.9 - - - - - - -- Futures contracts 2.5 - - (121 420) - - (2 486 685) 17 092 146- Forward foreign exchange contracts and foreign exchange translation 2.7, 2.11 (5 908) (2 751 714) (3 898 905) (8 309 878) - 8 932 801 (18 019 115)- Options 2.6 - - - (877 850) - 4 034 271 71 545- Swaps contracts 2.3 12 126 4 491 529 - - 314 793 10 958 101 -- Contracts for difference 2.4 - - (4 519 120) 2 894 483 - - -Total realised gain/(loss) 5 358 1 747 311 (17 112 986) 673 738 480 629 16 258 406 4 994 069Net realised result for the year 5 627 2 150 170 (16 658 842) 688 704 (902 393) 20 655 762 1 892 660Change in net unrealised appreciation/(depreciation) on :- Investments 2.2 355 (108) 177 749 5 401 221 46 854 (21 442 517) 6 765 542- To be announced securities contracts 2.9 - - - - - - -- Futures contracts 2.5 - - (202 330) - - (23 321) (2 469 683)- Forward foreign exchange contracts 2.7 160 (352 133) (11 271) (1 140 763) - 2 774 123 (2 203 188)- Options 2.6 - - - (530 515) - (2 002 079) 6- Swaps contracts 2.3 (1 428) (681 371) - - (1 600 563) (3 655 176) -- Contracts for difference 2.4 - - 627 164 (2 836 661) - - -Change in net unrealised appreciation/(depreciation) (913) (1 033 612) 591 312 893 282 (1 553 709) (24 348 970) 2 092 677Net change in net assets as a result of operations 4 714 1 116 558 (16 067 530) 1 581 986 (2 456 102) (3 693 208) 3 985 337Subscriptions - 63 342 977 23 832 598 262 414 773 16 251 888 32 300 845 125 406 344Redemptions (225 036) (11 945 463) (32 926 698) (47 028 049) (73 947 417) (27 038 664) (54 172 902)Distributions 11 - - - - - - -Movements in capital (225 036) 51 397 514 (9 094 100) 215 386 724 (57 695 529) 5 262 181 71 233 442Exchange differences on the net assets as at March 31, 2019 - - - - - - -Net assets at the end of the year - 70 393 290 63 758 578 297 553 788 99 960 450 290 188 266 276 286 600
1 Liquidated on June 14, 2018
29Merrill Lynch Investment Solutions
Statements of Operations and Changes in Net Assets for the year ended March 31, 2019 (cont.)(expressed in the Sub-Fund’s currency)
The accompanying notes form an integral part of these financial statements.Audited annual report

Sub-Funds Notes
Merrill LynchInvestment
Solutions – GlobalDebt - Credit UCITS
FundUSD
Merrill LynchInvestment
Solutions – GlobalDebt - Government
UCITS FundUSD
Merrill LynchInvestment
Solutions – GlobalDebt - Securitised
UCITS FundUSD
CombinedEUR
Net assets at the beginning of the year 1 208 909 344 1 771 143 440 679 454 311 8 780 211 048IncomeDividends, net 2.12 - - - 24 127 927Interest on bonds, net 2.12 28 638 547 40 823 377 21 084 531 104 353 418Interest on swaps 2.3 - - - 2 202 269Bank interest 2.12 100 718 83 835 59 843 31 020 825Other income 2.12 245 - - 6 956Total Income 28 739 510 40 907 212 21 144 374 161 711 395ExpensesInvestment management and distributor fees 3 1 531 264 1 582 669 759 691 70 816 398Performance fees 3 - - - 9 418 684“Taxe d’abonnement” 7 101 140 351 273 70 345 1 215 803Operating and administrative fees 4 2 978 193 9 140 208 2 006 092 28 204 148Professional fees 5 - - - 14 045 334Interest, bank charges and transaction costs 6 29 349 - 5 643 3 165 876Interest on swaps 2.3 - - - 3 394 891Interest expense on reverse repurchase agreements 2.8 - - - 347 853Director fees 12 13 541 41 159 9 068 127 017Other expenses - 12 280 - 3 316 104Total Expenses 4 653 487 11 127 589 2 850 839 134 052 108Net Income/(Expenses) 24 086 023 29 779 623 18 293 535 27 659 287Net realised gain/(loss) on:- Sales of investments 2.10 (30 971 511) (3 889 078) (6 956 574) (34 964 367)- To be announced securities contracts 2.9 - - 489 122 435 608- Futures contracts 2.5 406 997 - 654 468 (15 503 395)- Forward foreign exchange contracts and foreign exchange translation 2.7, 2.11 (6 503 687) 29 608 223 (11 893 150) (430 249 811)- Options 2.6 - - - 5 621 539- Swaps contracts 2.3 - - - 9 730 150- Contracts for difference 2.4 - - - (263 134 912)Total realised gain/(loss) (37 068 201) 25 719 145 (17 706 134) (728 065 188)Net realised result for the year (12 982 178) 55 498 768 587 401 (700 405 901)Change in net unrealised appreciation/(depreciation) on :- Investments 2.2 5 634 885 17 344 496 848 704 42 735 095- To be announced securities contracts 2.9 - - 208 437 185 632- Futures contracts 2.5 22 323 - 459 601 (6 185 347)- Forward foreign exchange contracts 2.7 (1 227 970) 2 241 693 (3 944 844) (63 543 737)- Options 2.6 - - - (1 965 536)- Swaps contracts 2.3 - - - (5 506 217)- Contracts for difference 2.4 - - - 60 761 147Change in net unrealised appreciation/(depreciation) 4 429 238 19 586 189 (2 428 102) 26 481 037Net change in net assets as a result of operations (8 552 940) 75 084 957 (1 840 701) (673 924 864)Subscriptions 333 327 194 4 109 645 864 200 422 730 5 494 666 848Redemptions (687 236 410) (746 209 986) (137 964 981) (4 037 450 715)Distributions 11 (226 569) (97 018) (156 195) (601 628)Movements in capital (354 135 785) 3 363 338 860 62 301 554 1 456 614 505Exchange differences on the net assets as at March 31, 2019 - - - 791 416 976Net assets at the end of the year 846 220 619 5 209 567 257 739 915 164 10 354 317 665
30 Merrill Lynch Investment Solutions
Statements of Operations and Changes in Net Assets for the year ended March 31, 2019 (cont.)(expressed in the Sub-Fund’s currency)
The accompanying notes form an integral part of these financial statements.Audited annual report
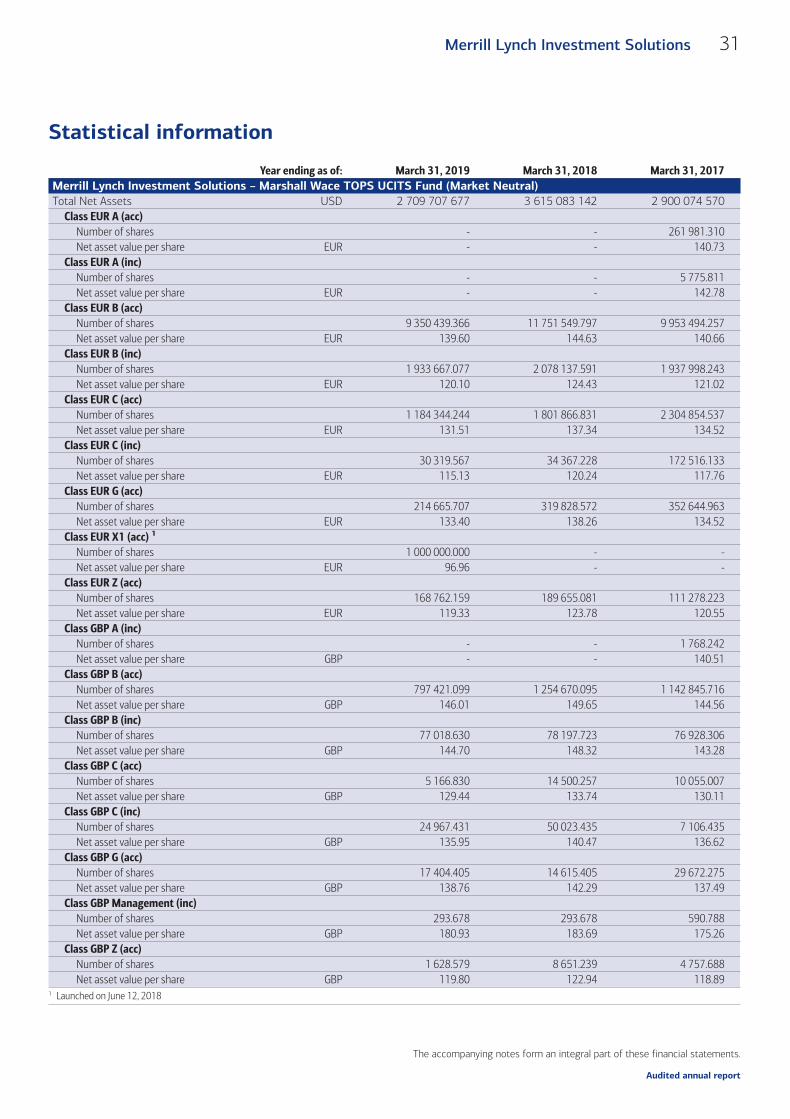
Year ending as of: March 31, 2019 March 31, 2018 March 31, 2017Merrill Lynch Investment Solutions – Marshall Wace TOPS UCITS Fund (Market Neutral)Total Net Assets USD 2 709 707 677 3 615 083 142 2 900 074 570
Class EUR A (acc)Number of shares - - 261 981.310Net asset value per share EUR - - 140.73
Class EUR A (inc)Number of shares - - 5 775.811Net asset value per share EUR - - 142.78
Class EUR B (acc)Number of shares 9 350 439.366 11 751 549.797 9 953 494.257Net asset value per share EUR 139.60 144.63 140.66
Class EUR B (inc)Number of shares 1 933 667.077 2 078 137.591 1 937 998.243Net asset value per share EUR 120.10 124.43 121.02
Class EUR C (acc)Number of shares 1 184 344.244 1 801 866.831 2 304 854.537Net asset value per share EUR 131.51 137.34 134.52
Class EUR C (inc)Number of shares 30 319.567 34 367.228 172 516.133Net asset value per share EUR 115.13 120.24 117.76
Class EUR G (acc)Number of shares 214 665.707 319 828.572 352 644.963Net asset value per share EUR 133.40 138.26 134.52
Class EUR X1 (acc) 1
Number of shares 1 000 000.000 - -Net asset value per share EUR 96.96 - -
Class EUR Z (acc)Number of shares 168 762.159 189 655.081 111 278.223Net asset value per share EUR 119.33 123.78 120.55
Class GBP A (inc)Number of shares - - 1 768.242Net asset value per share GBP - - 140.51
Class GBP B (acc)Number of shares 797 421.099 1 254 670.095 1 142 845.716Net asset value per share GBP 146.01 149.65 144.56
Class GBP B (inc)Number of shares 77 018.630 78 197.723 76 928.306Net asset value per share GBP 144.70 148.32 143.28
Class GBP C (acc)Number of shares 5 166.830 14 500.257 10 055.007Net asset value per share GBP 129.44 133.74 130.11
Class GBP C (inc)Number of shares 24 967.431 50 023.435 7 106.435Net asset value per share GBP 135.95 140.47 136.62
Class GBP G (acc)Number of shares 17 404.405 14 615.405 29 672.275Net asset value per share GBP 138.76 142.29 137.49
Class GBP Management (inc)Number of shares 293.678 293.678 590.788Net asset value per share GBP 180.93 183.69 175.26
Class GBP Z (acc)Number of shares 1 628.579 8 651.239 4 757.688Net asset value per share GBP 119.80 122.94 118.89
1 Launched on June 12, 2018
31Merrill Lynch Investment Solutions
Statistical information
The accompanying notes form an integral part of these financial statements.
Audited annual report

Year ending as of: March 31, 2019 March 31, 2018 March 31, 2017Merrill Lynch Investment Solutions – Marshall Wace TOPS UCITS Fund (Market Neutral) (cont.)
Class JPY B (acc)Number of shares 23 876 650.228 20 387 137.726 -Net asset value per share JPY 965.22 998.33 -
Class USD A (acc)Number of shares - - 41 767.365Net asset value per share USD - - 140.52
Class USD B (acc)Number of shares 1 456 200.868 1 808 024.855 2 760 064.053Net asset value per share USD 151.74 153.13 146.48
Class USD C (acc)Number of shares 231 734.475 313 218.077 355 139.550Net asset value per share USD 134.54 136.87 131.85
Class USD G (acc)Number of shares 38 826.103 44 004.655 48 049.802Net asset value per share USD 142.04 143.40 137.21
Merrill Lynch Investment Solutions – York Event-Driven UCITS FundTotal Net Assets EUR 58 094 721 88 131 763 138 921 403
Class AUD E (acc)Number of shares 1 322.180 1 856.185 2 598.833Net asset value per share AUD 90.93 91.44 87.00
Class CHF A (acc)Number of shares 50.000 50.000 50.000Net asset value per share CHF 81.70 84.66 82.98
Class CHF E (acc)Number of shares 2 591.724 3 769.314 4 861.914Net asset value per share CHF 86.59 89.74 88.00
Class CHF F (acc)Number of shares 25 479.013 44 083.028 65 608.448Net asset value per share CHF 99.03 103.70 102.77
Class EUR A (acc)Number of shares 67 212.832 830.642 1 416.506Net asset value per share EUR 119.94 124.17 121.14
Class EUR B (acc)Number of shares - - 3 017.373Net asset value per share EUR - - 128.64
Class EUR C (acc)Number of shares 2 579.884 3 134.884 4 833.884Net asset value per share EUR 116.04 120.94 119.21
Class EUR D (acc)Number of shares - - 10.000Net asset value per share EUR - - 136.97
Class EUR E (acc)Number of shares 60 016.448 159 510.080 200 786.104Net asset value per share EUR 113.19 116.74 113.90
Class EUR F (acc)Number of shares 52 828.569 83 277.306 133 291.291Net asset value per share EUR 102.85 107.19 105.66
Class EUR Z (acc)Number of shares 8 407.040 14 909.991 20 665.814Net asset value per share EUR 106.70 110.09 107.44
Class GBP A (acc)Number of shares 975.138 975.138 1 297.516Net asset value per share GBP 124.40 127.03 122.89
32 Merrill Lynch Investment Solutions
Statistical information (cont.)
The accompanying notes form an integral part of these financial statements.
Audited annual report

Year ending as of: March 31, 2019 March 31, 2018 March 31, 2017Merrill Lynch Investment Solutions – York Event-Driven UCITS Fund (cont.)
Class GBP A (inc) 1
Number of shares - 7 151.000 7 161.000Net asset value per share GBP - 126.90 122.77
Class GBP B (acc)Number of shares - - 10.000Net asset value per share GBP - - 129.76
Class GBP B (inc)Number of shares - - 10.000Net asset value per share GBP - - 130.25
Class GBP C (inc)Number of shares - - 10.000Net asset value per share GBP - - 121.70
Class GBP D (acc)Number of shares 1 445.537 1 445.537 1 455.537Net asset value per share GBP 141.21 143.84 138.81
Class GBP E (acc)Number of shares 0.012 1 943.199 2 699.901Net asset value per share GBP 107.71 118.31 114.46
Class GBP E (inc)Number of shares 1 331.990 1 706.990 10 873.309Net asset value per share GBP 108.81 111.12 107.50
Class GBP F (acc)Number of shares 2 932.504 4 098.741 9 905.456Net asset value per share GBP 102.91 106.19 103.79
Class GBP Z (acc)Number of shares 8 625.431 11 755.161 19 331.355Net asset value per share GBP 108.65 111.00 107.42
Class USD A (acc)Number of shares 3 173.458 85 216.534 124 376.902Net asset value per share USD 126.15 126.63 122.17
Class USD B (acc)Number of shares 55 384.000 56 334.000 61 344.000Net asset value per share USD 137.22 137.61 131.26
Class USD C (acc)Number of shares - - 10.000Net asset value per share USD - - 121.61
Class USD D (acc) 2
Number of shares - 1 925.607 1 935.607Net asset value per share USD - 145.80 139.32
Class USD E (acc)Number of shares 2 799.835 21 197.863 61 108.477Net asset value per share USD 120.12 120.45 114.89
Class USD F (acc)Number of shares 240 167.006 352 490.735 526 063.518Net asset value per share USD 110.66 112.13 108.07
Class USD Z (acc)Number of shares 13 071.964 11 236.795 41 849.251Net asset value per share USD 85.47 85.74 82.49
Merrill Lynch Investment Solutions – York Asian Event-Driven UCITS FundTotal Net Assets EUR 117 075 250 141 477 272 91 981 008
1 Liquidated on December 7, 20182 Liquidated on July 11, 2018
33Merrill Lynch Investment Solutions
Statistical information (cont.)
The accompanying notes form an integral part of these financial statements.
Audited annual report

Year ending as of: March 31, 2019 March 31, 2018 March 31, 2017Merrill Lynch Investment Solutions – York Asian Event-Driven UCITS Fund (cont.)
Class CHF D (acc)Number of shares 25 000.000 25 000.000 25 000.000Net asset value per share CHF 123.47 128.69 107.42
Class EUR B (acc)Number of shares 116 331.797 122 106.497 22 289.916Net asset value per share EUR 128.94 134.16 114.13
Class EUR C (acc)Number of shares 46.261 46.261 10.001Net asset value per share EUR 94.07 98.64 111.48
Class EUR D (acc)Number of shares 589 645.195 656 893.560 469 413.110Net asset value per share EUR 141.35 146.71 122.05
Class GBP C (acc)Number of shares 143.992 70.000 80.000Net asset value per share GBP 131.33 136.34 115.93
Class USD A (acc)Number of shares - - 10.000Net asset value per share USD - - 120.11
Class USD B (acc)Number of shares 65 320.039 22 502.940 104 302.047Net asset value per share USD 139.59 141.12 117.67
Class USD C (acc)Number of shares - - 10.002Net asset value per share USD - - 114.92
Class USD D (acc)Number of shares 58 198.754 189 135.633 156 727.464Net asset value per share USD 150.90 152.13 123.85
Merrill Lynch Investment Solutions – AQR Global Relative Value UCITS FundTotal Net Assets USD 633 262 966 1 973 314 851 1 516 828 275
Class CHF A (acc)Number of shares 670 484.921 210 095.761 240 214.815Net asset value per share CHF 88.91 108.22 112.80
Class EUR A (acc)Number of shares 2 896 761.914 6 636 695.809 4 999 635.303Net asset value per share EUR 98.32 119.42 124.02
Class EUR A (inc)Number of shares 1 170 149.945 2 046 492.827 2 033 685.327Net asset value per share EUR 98.03 119.15 123.92
Class EUR C (acc)Number of shares 25 975.619 70 272.810 77 528.549Net asset value per share EUR 91.38 112.15 117.64
Class EUR Z (acc)Number of shares 100 301.686 172 719.198 30 069.501Net asset value per share EUR 79.94 97.13 100.99
Class GBP A (acc)Number of shares 529 313.387 2 564 252.685 2 049 391.635Net asset value per share GBP 103.26 123.90 127.49
Class GBP A2 (acc)Number of shares 126 718.491 295 805.211 538 779.327Net asset value per share GBP 96.53 115.83 119.19
34 Merrill Lynch Investment Solutions
Statistical information (cont.)
The accompanying notes form an integral part of these financial statements.
Audited annual report
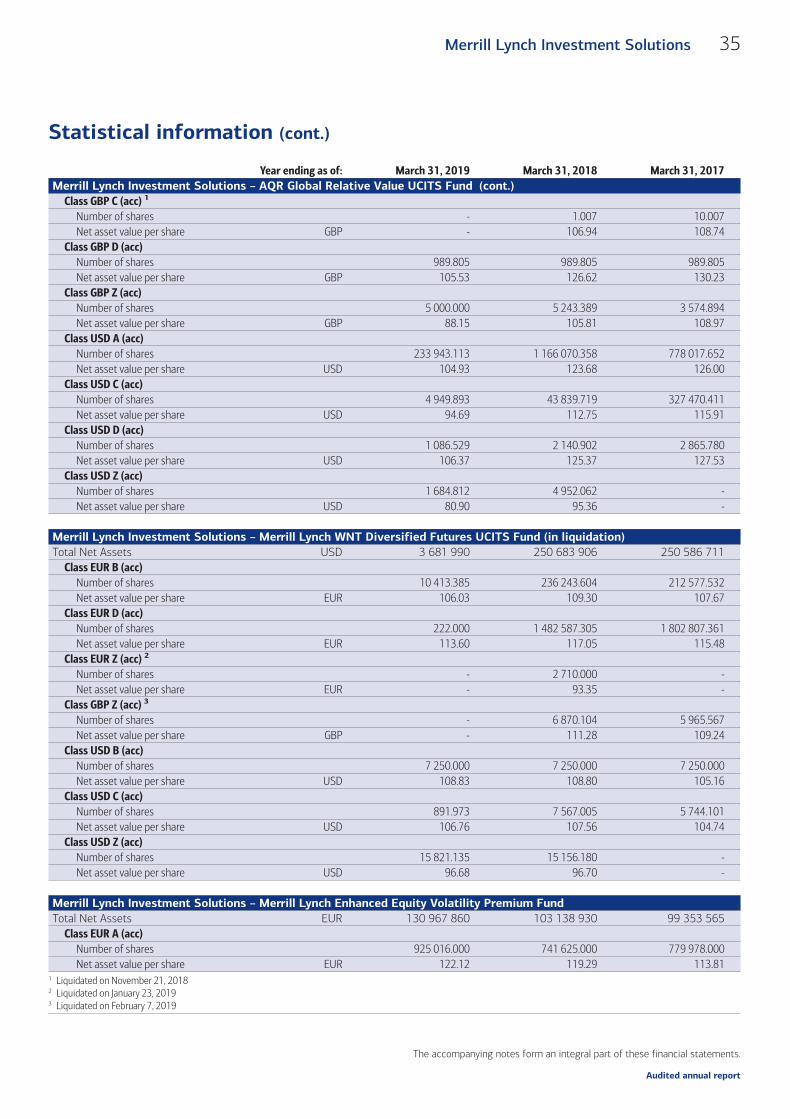
Year ending as of: March 31, 2019 March 31, 2018 March 31, 2017Merrill Lynch Investment Solutions – AQR Global Relative Value UCITS Fund (cont.)
Class GBP C (acc) 1
Number of shares - 1.007 10.007Net asset value per share GBP - 106.94 108.74
Class GBP D (acc)Number of shares 989.805 989.805 989.805Net asset value per share GBP 105.53 126.62 130.23
Class GBP Z (acc)Number of shares 5 000.000 5 243.389 3 574.894Net asset value per share GBP 88.15 105.81 108.97
Class USD A (acc)Number of shares 233 943.113 1 166 070.358 778 017.652Net asset value per share USD 104.93 123.68 126.00
Class USD C (acc)Number of shares 4 949.893 43 839.719 327 470.411Net asset value per share USD 94.69 112.75 115.91
Class USD D (acc)Number of shares 1 086.529 2 140.902 2 865.780Net asset value per share USD 106.37 125.37 127.53
Class USD Z (acc)Number of shares 1 684.812 4 952.062 -Net asset value per share USD 80.90 95.36 -
Merrill Lynch Investment Solutions – Merrill Lynch WNT Diversified Futures UCITS Fund (in liquidation)Total Net Assets USD 3 681 990 250 683 906 250 586 711
Class EUR B (acc)Number of shares 10 413.385 236 243.604 212 577.532Net asset value per share EUR 106.03 109.30 107.67
Class EUR D (acc)Number of shares 222.000 1 482 587.305 1 802 807.361Net asset value per share EUR 113.60 117.05 115.48
Class EUR Z (acc) 2
Number of shares - 2 710.000 -Net asset value per share EUR - 93.35 -
Class GBP Z (acc) 3
Number of shares - 6 870.104 5 965.567Net asset value per share GBP - 111.28 109.24
Class USD B (acc)Number of shares 7 250.000 7 250.000 7 250.000Net asset value per share USD 108.83 108.80 105.16
Class USD C (acc)Number of shares 891.973 7 567.005 5 744.101Net asset value per share USD 106.76 107.56 104.74
Class USD Z (acc)Number of shares 15 821.135 15 156.180 -Net asset value per share USD 96.68 96.70 -
Merrill Lynch Investment Solutions – Merrill Lynch Enhanced Equity Volatility Premium FundTotal Net Assets EUR 130 967 860 103 138 930 99 353 565
Class EUR A (acc)Number of shares 925 016.000 741 625.000 779 978.000Net asset value per share EUR 122.12 119.29 113.81
1 Liquidated on November 21, 20182 Liquidated on January 23, 20193 Liquidated on February 7, 2019
35Merrill Lynch Investment Solutions
Statistical information (cont.)
The accompanying notes form an integral part of these financial statements.
Audited annual report

Year ending as of: March 31, 2019 March 31, 2018 March 31, 2017Merrill Lynch Investment Solutions – Merrill Lynch Enhanced Equity Volatility Premium Fund (cont.)
Class EUR B (acc)Number of shares 150 209.268 124 799.020 93 934.824Net asset value per share EUR 119.87 117.56 112.67
Merrill Lynch Investment Solutions – Merrill Lynch MLCX Commodity Enhanced Beta FundTotal Net Assets USD 29 164 353 17 645 184 24 227 325
Class EUR B (acc)Number of shares 301.016 665.031 665.031Net asset value per share EUR 61.32 65.75 61.48
Class EUR C (acc)Number of shares 146.168 146.168 146.336Net asset value per share EUR 56.16 60.85 57.50
Class EUR E (acc)Number of shares 212 436.421 101 434.973 162 667.252Net asset value per share EUR 116.10 124.31 116.07
Class GBP B (acc)Number of shares - - 1 608.390Net asset value per share GBP - - 57.57
Class SEK C (acc)Number of shares - - 5 435.647Net asset value per share SEK - - 548.43
Class USD B (acc)Number of shares 7 966.469 9 972.912 14 407.037Net asset value per share USD 69.03 71.68 65.39
Class USD C (acc)Number of shares 14 319.753 20 810.517 43 030.116Net asset value per share USD 62.21 65.27 60.16
Merrill Lynch Investment Solutions – Merrill Lynch MLCX Commodity Enhanced Beta ex Agriculture FundTotal Net Assets USD - 220 322 85 739 556
Class EUR D (acc) 1
Number of shares - 895.000 998 810.000Net asset value per share EUR - 85.83 80.17
Class USD B (acc) 2
Number of shares - 1 800.000 1 500.000Net asset value per share USD - 69.91 63.66
Merrill Lynch Investment Solutions – Merrill Lynch MLCX Commodity Alpha FundTotal Net Assets USD 70 393 290 17 879 218 21 434 702
Class EUR B (acc)Number of shares 63 232.621 20 071.566 4 206.950Net asset value per share EUR 141.77 131.65 125.55
Class EUR C (acc)Number of shares 355.517 773.007 2 687.066Net asset value per share EUR 125.72 117.99 113.69
Class EUR E (acc)Number of shares 352 163.562 48 339.412 66 710.125Net asset value per share EUR 118.18 109.51 104.18
Class GBP B (acc)Number of shares 24 615.251 16 893.344 64 892.118Net asset value per share GBP 149.29 137.08 129.63
1 Liquidated on June 14, 20182 Liquidated on May 31, 2018
36 Merrill Lynch Investment Solutions
Statistical information (cont.)
The accompanying notes form an integral part of these financial statements.
Audited annual report

Year ending as of: March 31, 2019 March 31, 2018 March 31, 2017Merrill Lynch Investment Solutions – Merrill Lynch MLCX Commodity Alpha Fund (cont.)
Class USD B (acc)Number of shares 55 833.429 32 857.439 18 328.555Net asset value per share USD 153.66 138.43 129.10
Class USD C (acc)Number of shares 1 312.488 1 711.453 1 943.314Net asset value per share USD 134.68 122.60 115.53
Merrill Lynch Investment Solutions – Zeal Greater China Long Short UCITS FundTotal Net Assets USD 63 758 578 88 920 208 37 721 896
Class EUR B (acc)Number of shares 5 000.000 32 896.805 -Net asset value per share EUR 86.76 100.81 -
Class EUR D (acc)Number of shares 99 569.003 246 329.939 9 295.008Net asset value per share EUR 83.21 96.21 103.00
Class USD B (acc)Number of shares 31 860.330 859.313 859.313Net asset value per share USD 114.80 129.59 107.67
Class USD D (acc)Number of shares 127 874.084 124 942.142 56 152.197Net asset value per share USD 117.23 131.53 108.81
Class USD Management (acc)Number of shares 269 122.059 269 122.059 265 587.289Net asset value per share USD 130.68 144.85 114.62
Class USD Z (acc)Number of shares 1 317.595 1 317.595 500.000Net asset value per share USD 114.77 129.46 107.53
Merrill Lynch Investment Solutions – Ramius Merger Arbitrage UCITS FundTotal Net Assets USD 297 553 788 80 585 078 41 632 508
Class EUR C (acc)Number of shares 12 685.590 541.675 130.000Net asset value per share EUR 104.74 100.00 100.74
Class EUR D (acc)Number of shares 822 622.731 115 086.861 22 310.734Net asset value per share EUR 108.12 101.79 101.43
Class EUR X1 (acc)Number of shares 139 023.000 130 197.000 -Net asset value per share EUR 104.94 98.50 -
Class EUR X2 (acc) 1
Number of shares 246 102.154 - -Net asset value per share EUR 102.26 - -
Class EUR X3 (acc) 2
Number of shares 565 234.869 - -Net asset value per share EUR 101.23 - -
Class EUR X4 (acc) 3
Number of shares 146 200.000 - -Net asset value per share EUR 101.78 - -
1 Launched on October 17, 20182 Launched on December 19, 20183 Launched on January 3, 2019
37Merrill Lynch Investment Solutions
Statistical information (cont.)
The accompanying notes form an integral part of these financial statements.
Audited annual report

Year ending as of: March 31, 2019 March 31, 2018 March 31, 2017Merrill Lynch Investment Solutions – Ramius Merger Arbitrage UCITS Fund (cont.)
Class GBP D (acc) 1
Number of shares 30 000.000 - -Net asset value per share GBP 100.69 - -
Class SEK X1 (acc)Number of shares 646 478.893 566 468.226 -Net asset value per share SEK 104.51 98.37 -
Class USD B (acc)Number of shares 22 941.769 1 031.268 1 031.268Net asset value per share USD 115.04 106.83 104.57
Class USD C (acc)Number of shares 35.000 10.000 10.000Net asset value per share USD 113.06 105.61 103.98
Class USD D (acc)Number of shares 174 844.538 102 461.798 74 863.408Net asset value per share USD 117.61 107.96 105.16
Class USD Management (acc)Number of shares 293 017.873 293 018.873 293 017.873Net asset value per share USD 123.44 110.95 106.53
Merrill Lynch Investment Solutions – Merrill Lynch Enhanced Cross-Asset Volatility Premium FundTotal Net Assets EUR 99 960 450 160 112 081 107 266 708
Class EUR A (acc)Number of shares 993 188.724 1 422 863.000 1 007 930.000Net asset value per share EUR 100.50 102.61 106.42
Class EUR B (acc)Number of shares 1 617.372 149 844.044 -Net asset value per share EUR 91.80 94.20 -
Merrill Lynch Investment Solutions – KLS Fixed Income UCITS FundTotal Net Assets USD 290 188 266 288 619 293 55 584 302
Class EUR D (acc)Number of shares 294 167.003 240 793.380 -Net asset value per share EUR 94.74 97.39 -
Class USD B (acc) 2
Number of shares - 10.000 10.000Net asset value per share USD - 100.31 100.32
Class USD C (acc) 3
Number of shares - 10.000 10.000Net asset value per share USD - 99.29 100.11
Class USD D (acc)Number of shares 71 348.135 80 515.465 31 935.181Net asset value per share USD 100.95 100.79 100.42
Class USD Management (acc)Number of shares 1 475 324.295 1 495 224.793 519 900.498Net asset value per share USD 103.21 102.09 100.74
Class USD X2 (acc)Number of shares 1 000 000.000 1 000 000.000 -Net asset value per share USD 99.46 99.00 -
Merrill Lynch Investment Solutions – Millburn Diversified UCITS FundTotal Net Assets USD 276 286 600 201 067 821 42 673 412
1 Launched on January 24, 20192 Liquidated on November 29, 20183 Launched on November 29,2018
38 Merrill Lynch Investment Solutions
Statistical information (cont.)
The accompanying notes form an integral part of these financial statements.
Audited annual report

Year ending as of: March 31, 2019 March 31, 2018 March 31, 2017Merrill Lynch Investment Solutions – Millburn Diversified UCITS Fund (cont.)
Class CHF Z (acc)Number of shares 750.000 150.000 -Net asset value per share CHF 107.86 101.61 -
Class EUR B (acc)Number of shares 662 416.505 309 134.348 -Net asset value per share EUR 101.63 94.89 -
Class EUR C (acc)Number of shares 17 336.930 20 790.574 -Net asset value per share EUR 102.02 95.14 -
Class EUR D (acc)Number of shares 283 836.371 479 648.756 -Net asset value per share EUR 107.22 99.37 -
Class EUR X2 (acc)Number of shares 156 956.429 156 956.429 -Net asset value per share EUR 103.36 95.55 -
Class EUR X3 (acc)Number of shares 41 000.000 51 000.000 -Net asset value per share EUR 101.19 94.41 -
Class EUR X4 (inc)Number of shares 73 532.000 64 766.000 -Net asset value per share EUR 103.79 96.56 -
Class EUR Y1 (acc) 1
Number of shares 7 500.000 - -Net asset value per share EUR 106.80 - -
Class EUR Z (acc)Number of shares 6 943.483 9 868.046 -Net asset value per share EUR 99.14 93.17 -
Class GBP B (acc)Number of shares 10 959.407 1 914.317 -Net asset value per share GBP 104.60 96.87 -
Class GBP D (acc)Number of shares 16 786.459 17 442.682 -Net asset value per share GBP 105.29 96.62 -
Class GBP X4 (inc)Number of shares 271 867.500 266 449.500 -Net asset value per share GBP 105.43 97.26 -
Class GBP Z (acc)Number of shares 21 022.026 1 936.330 -Net asset value per share GBP 100.23 93.19 -
Class JPY X5 (acc) 2
Number of shares 6 264 429.084 - -Net asset value per share JPY 1 067.46 - -
Class USD B (acc)Number of shares 119 895.456 155 723.700 10.000Net asset value per share USD 109.94 100.12 103.01
Class USD C (acc)Number of shares 8 845.193 22 048.112 1 390.392Net asset value per share USD 108.43 99.53 102.93
Class USD D (acc)Number of shares 2 076.764 42 799.724 155 822.561Net asset value per share USD 112.08 101.78 103.20
1 Launched on July 25, 20182 Launched on June 1, 2018
39Merrill Lynch Investment Solutions
Statistical information (cont.)
The accompanying notes form an integral part of these financial statements.
Audited annual report
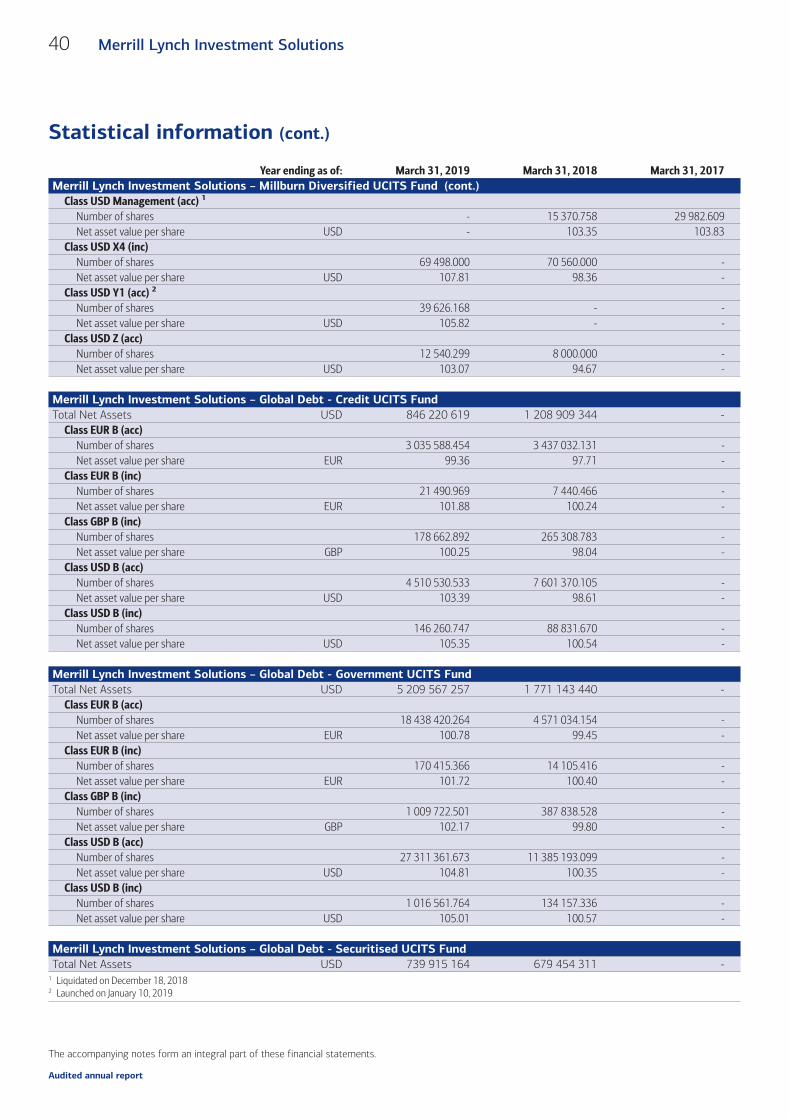
Year ending as of: March 31, 2019 March 31, 2018 March 31, 2017Merrill Lynch Investment Solutions – Millburn Diversified UCITS Fund (cont.)
Class USD Management (acc) 1
Number of shares - 15 370.758 29 982.609Net asset value per share USD - 103.35 103.83
Class USD X4 (inc)Number of shares 69 498.000 70 560.000 -Net asset value per share USD 107.81 98.36 -
Class USD Y1 (acc) 2
Number of shares 39 626.168 - -Net asset value per share USD 105.82 - -
Class USD Z (acc)Number of shares 12 540.299 8 000.000 -Net asset value per share USD 103.07 94.67 -
Merrill Lynch Investment Solutions – Global Debt - Credit UCITS FundTotal Net Assets USD 846 220 619 1 208 909 344 -
Class EUR B (acc)Number of shares 3 035 588.454 3 437 032.131 -Net asset value per share EUR 99.36 97.71 -
Class EUR B (inc)Number of shares 21 490.969 7 440.466 -Net asset value per share EUR 101.88 100.24 -
Class GBP B (inc)Number of shares 178 662.892 265 308.783 -Net asset value per share GBP 100.25 98.04 -
Class USD B (acc)Number of shares 4 510 530.533 7 601 370.105 -Net asset value per share USD 103.39 98.61 -
Class USD B (inc)Number of shares 146 260.747 88 831.670 -Net asset value per share USD 105.35 100.54 -
Merrill Lynch Investment Solutions – Global Debt - Government UCITS FundTotal Net Assets USD 5 209 567 257 1 771 143 440 -
Class EUR B (acc)Number of shares 18 438 420.264 4 571 034.154 -Net asset value per share EUR 100.78 99.45 -
Class EUR B (inc)Number of shares 170 415.366 14 105.416 -Net asset value per share EUR 101.72 100.40 -
Class GBP B (inc)Number of shares 1 009 722.501 387 838.528 -Net asset value per share GBP 102.17 99.80 -
Class USD B (acc)Number of shares 27 311 361.673 11 385 193.099 -Net asset value per share USD 104.81 100.35 -
Class USD B (inc)Number of shares 1 016 561.764 134 157.336 -Net asset value per share USD 105.01 100.57 -
Merrill Lynch Investment Solutions – Global Debt - Securitised UCITS FundTotal Net Assets USD 739 915 164 679 454 311 -
1 Liquidated on December 18, 20182 Launched on January 10, 2019
40 Merrill Lynch Investment Solutions
Statistical information (cont.)
The accompanying notes form an integral part of these financial statements.
Audited annual report

Year ending as of: March 31, 2019 March 31, 2018 March 31, 2017Merrill Lynch Investment Solutions – Global Debt - Securitised UCITS Fund (cont.)
Class EUR B (acc)Number of shares 2 364 348.684 1 934 012.541 -Net asset value per share EUR 98.98 97.99 -
Class EUR B (inc)Number of shares 17 912.923 3 907.520 -Net asset value per share EUR 101.14 100.21 -
Class GBP B (inc)Number of shares 169 814.008 159 579.977 -Net asset value per share GBP 99.79 98.35 -
Class USD B (acc)Number of shares 4 289 812.127 4 253 970.729 -Net asset value per share USD 102.98 98.89 -
Class USD B (inc)Number of shares 107 860.933 31 670.928 -Net asset value per share USD 104.52 100.44 -
41Merrill Lynch Investment Solutions
Statistical information (cont.)
The accompanying notes form an integral part of these financial statements.
Audited annual report

Quantity DescriptionQuotation
CurrencyCostUSD
Marketvalue USD
% of netassets
Transferable securities and money market instruments admitted to an official exchange listing or dealt in on another regulated market
Shares3 939 191 A2A SpA EUR 6 767 008 7 194 205 0.27
210 414 AAR Corp. USD 7 304 155 6 840 559 0.252 668 Abeona Therapeutics, Inc. USD 21 280 19 636 0.00
605 ABIOMED, Inc. USD 173 068 172 782 0.013 703 AC Immune S.A. USD 16 887 18 700 0.005 382 Acacia Communications, Inc. USD 283 849 308 658 0.012 380 Accelerate Diagnostics, Inc. USD 48 609 50 028 0.00
59 005 ACEA SpA EUR 979 609 998 444 0.04269 056 Acorda Therapeutics, Inc. USD 3 883 013 3 575 754 0.13
2 228 Addus HomeCare Corp. USD 140 807 141 679 0.0163 029 Adient, Inc. USD 919 343 816 856 0.03
5 662 Adobe, Inc. USD 1 479 790 1 508 866 0.066 958 Advance Auto Parts, Inc. USD 1 171 515 1 186 548 0.04
82 074 Advanced Drainage Systems, Inc. USD 2 091 354 2 115 047 0.08151 111 Aegon NV - Reg USD 724 002 723 822 0.03
31 393 AG Mortgage Investment Trust, Inc. USD 537 684 528 658 0.02426 841 Agilent Technologies, Inc. USD 29 017 570 34 309 480 1.27
2 206 Air Products & Chemicals, Inc. USD 360 369 421 258 0.025 856 Akebia Therapeutics, Inc. USD 50 947 47 961 0.004 952 Aktore International Group, Inc. USD 105 491 106 617 0.009 902 Akzo Nobel NV - ADR USD 301 157 292 505 0.01
323 Alarm.com Hldg., Inc. USD 20 769 20 963 0.0013 767 Albany International Corp. - A USD 1 006 773 985 580 0.04
1 378 Allakos, Inc. USD 52 389 55 809 0.0049 182 Allegro Merger Corp. USD 471 164 490 836 0.0225 795 Allscripts Healthcare Solutions, Inc. USD 246 856 246 084 0.01
2 931 Ally Financial, Inc. USD 80 541 80 573 0.002 400 Alpha & Omega Semiconductor Ltd. USD 26 275 27 624 0.00
15 476 Alphabet, Inc. - A USD 18 216 752 18 213 550 0.671 570 Alphabet, Inc. - C USD 1 846 280 1 842 097 0.072 784 Altair Engineering, Inc. - A USD 98 253 102 479 0.00
117 962 Altice USA, Inc. - A USD 2 525 082 2 533 824 0.0995 983 Altra Industrial Motion Corp. USD 3 476 393 2 980 272 0.11
1 349 Amazon.com, Inc. USD 2 376 184 2 402 232 0.091 610 AMC Networks, Inc. - A USD 91 354 91 384 0.00
733 Amedisys, Inc. USD 90 202 90 350 0.003 600 American Renal Associates Hldg., Inc. USD 35 192 22 104 0.00
30 068 American Superconductor Corp. USD 387 832 386 674 0.012 269 American Woodmark Corp. USD 184 192 187 487 0.01
194 989 Americold Realty Trust USD 5 410 945 5 949 114 0.22249 868 Ameris Bancorp USD 9 646 245 8 582 966 0.32
4 353 Amicus Therapeutics, Inc. USD 58 241 59 201 0.0098 714 Amneal Pharmaceuticals, Inc. USD 1 309 107 1 398 777 0.05
2 635 Andersons, Inc. USD 86 160 84 926 0.00179 202 ANGI Homeservices, Inc. - A USD 2 882 588 2 766 879 0.10
1 776 ANI Pharmaceuticals, Inc. USD 118 604 125 279 0.00124 652 Anima Hldg. SpA 144A EUR 508 506 510 034 0.02
42 Merrill Lynch Investment Solutions
Merrill Lynch Investment Solutions – Marshall WaceTOPS UCITS Fund (Market Neutral)Schedule of Investments as at March 31, 2019(expressed in USD)
The accompanying notes form an integral part of these financial statements.
Audited annual report

Quantity DescriptionQuotation
CurrencyCostUSD
Marketvalue USD
% of netassets
Transferable securities and money market instruments admitted to an official exchange listing or dealt in on another regulated market (cont.)
Shares (cont.)17 089 Ansys, Inc. USD 3 029 419 3 122 331 0.12
452 002 Antares Pharma, Inc. USD 1 696 189 1 369 566 0.05104 427 Antero Resources Corp. USD 877 082 922 090 0.03
8 541 Apollo Commercial Real Estate Finance, Inc. USD 157 353 155 446 0.011 922 Apollo Medical Hldg., Inc. USD 37 807 35 211 0.00
13 367 Appian Corp. USD 476 328 460 226 0.021 508 Aqua America, Inc. USD 55 026 54 952 0.004 504 Aquantia Corp. USD 39 075 40 806 0.00
23 612 Aramark USD 698 619 697 735 0.0312 123 ArcelorMittal- Reg USD 257 723 247 067 0.0111 028 Arch Coal, Inc. USD 1 021 871 1 006 526 0.0483 435 Archrock, Inc. USD 837 986 815 994 0.03
121 697 Arcosa, Inc. USD 4 046 425 3 717 843 0.142 235 Ares Capital Corp. USD 38 231 38 308 0.005 834 Ares Management Corp. - A USD 135 123 135 407 0.012 207 Argo Group International USD 156 301 155 947 0.01
12 798 Arlington Asset Investment Corp. - A USD 105 564 101 872 0.0084 000 ARMOUR Residential REIT, Inc. USD 1 692 844 1 640 520 0.0638 400 Armstrong World Industries, Inc. USD 2 857 626 3 049 728 0.11
5 927 Artisan Partners Asset Management, Inc. - A USD 149 783 149 183 0.0113 874 Arvinas Hldg. Co. LLC USD 196 456 204 780 0.0171 133 ASGN, Inc. USD 4 513 539 4 516 234 0.1715 078 Ashford Hospitality Trust, Inc. USD 72 826 71 620 0.00
4 516 Ashland Global Hldg., Inc. USD 347 634 352 835 0.015 512 Aspen Technology, Inc. USD 505 647 574 681 0.02
60 964 Assembly Biosciences, Inc. USD 2 038 786 1 200 381 0.0412 622 Assicurazioni Generali SpA EUR 227 879 233 848 0.01
6 313 Assurant, Inc. USD 623 219 599 167 0.0237 596 ASTM SpA EUR 792 272 1 023 706 0.04
2 918 Astronics Corp. USD 89 503 95 477 0.0043 008 Asure Software, Inc. USD 242 917 262 779 0.01
264 141 At Home Group, Inc. USD 5 882 942 4 717 558 0.1711 300 Atento S.A. USD 40 264 40 793 0.00
143 951 Atlas Air Worldwide Hldg., Inc. USD 6 812 249 7 278 163 0.2749 447 Audentes Therapeutics, Inc. USD 1 582 317 1 929 422 0.0779 267 Autogrill SpA EUR 732 878 763 217 0.03
6 302 Avalara, Inc. USD 310 155 351 589 0.0119 389 Avanos Medical, Inc. USD 855 563 827 523 0.03
428 180 Avaya Hldg. Corp. USD 6 573 839 7 206 269 0.27156 053 Avid Bioservices, Inc. USD 663 714 663 225 0.02
6 832 Avid Technology, Inc. USD 48 190 50 898 0.0024 576 AVX Corp. USD 407 292 426 148 0.02
234 223 AXA Equitable Hldg., Inc. USD 4 758 894 4 717 251 0.171 637 Axis Capital Hldg. Ltd. USD 92 180 89 675 0.00
73 286 AxoGen, Inc. USD 1 561 352 1 543 403 0.06172 279 Banca Farmafactoring SpA 144A EUR 1 050 775 1 049 431 0.04
2 378 Banca Generali SpA EUR 59 942 59 224 0.00
43Merrill Lynch Investment Solutions
Merrill Lynch Investment Solutions – Marshall WaceTOPS UCITS Fund (Market Neutral)Schedule of Investments as at March 31, 2019 (cont.)(expressed in USD)
The accompanying notes form an integral part of these financial statements.
Audited annual report
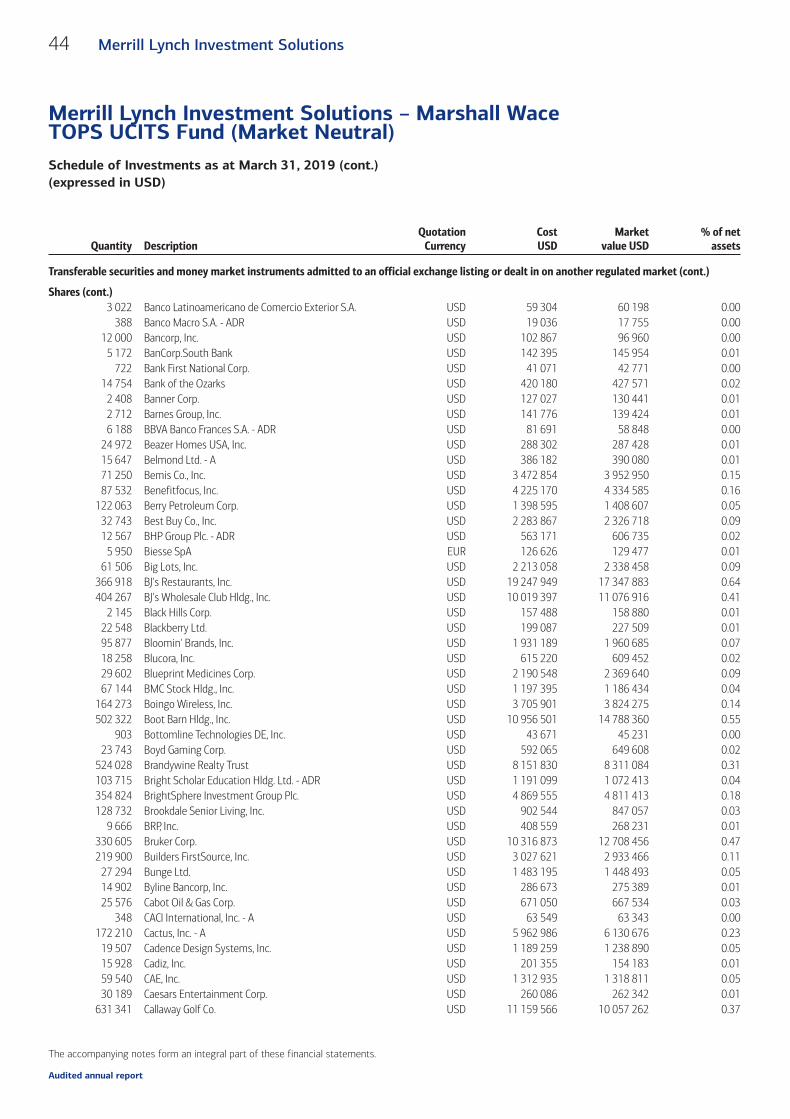
Quantity DescriptionQuotation
CurrencyCostUSD
Marketvalue USD
% of netassets
Transferable securities and money market instruments admitted to an official exchange listing or dealt in on another regulated market (cont.)
Shares (cont.)3 022 Banco Latinoamericano de Comercio Exterior S.A. USD 59 304 60 198 0.00
388 Banco Macro S.A. - ADR USD 19 036 17 755 0.0012 000 Bancorp, Inc. USD 102 867 96 960 0.00
5 172 BanCorp.South Bank USD 142 395 145 954 0.01722 Bank First National Corp. USD 41 071 42 771 0.00
14 754 Bank of the Ozarks USD 420 180 427 571 0.022 408 Banner Corp. USD 127 027 130 441 0.012 712 Barnes Group, Inc. USD 141 776 139 424 0.016 188 BBVA Banco Frances S.A. - ADR USD 81 691 58 848 0.00
24 972 Beazer Homes USA, Inc. USD 288 302 287 428 0.0115 647 Belmond Ltd. - A USD 386 182 390 080 0.0171 250 Bemis Co., Inc. USD 3 472 854 3 952 950 0.1587 532 Benefitfocus, Inc. USD 4 225 170 4 334 585 0.16
122 063 Berry Petroleum Corp. USD 1 398 595 1 408 607 0.0532 743 Best Buy Co., Inc. USD 2 283 867 2 326 718 0.0912 567 BHP Group Plc. - ADR USD 563 171 606 735 0.02
5 950 Biesse SpA EUR 126 626 129 477 0.0161 506 Big Lots, Inc. USD 2 213 058 2 338 458 0.09
366 918 BJ's Restaurants, Inc. USD 19 247 949 17 347 883 0.64404 267 BJ's Wholesale Club Hldg., Inc. USD 10 019 397 11 076 916 0.41
2 145 Black Hills Corp. USD 157 488 158 880 0.0122 548 Blackberry Ltd. USD 199 087 227 509 0.0195 877 Bloomin' Brands, Inc. USD 1 931 189 1 960 685 0.0718 258 Blucora, Inc. USD 615 220 609 452 0.0229 602 Blueprint Medicines Corp. USD 2 190 548 2 369 640 0.0967 144 BMC Stock Hldg., Inc. USD 1 197 395 1 186 434 0.04
164 273 Boingo Wireless, Inc. USD 3 705 901 3 824 275 0.14502 322 Boot Barn Hldg., Inc. USD 10 956 501 14 788 360 0.55
903 Bottomline Technologies DE, Inc. USD 43 671 45 231 0.0023 743 Boyd Gaming Corp. USD 592 065 649 608 0.02
524 028 Brandywine Realty Trust USD 8 151 830 8 311 084 0.31103 715 Bright Scholar Education Hldg. Ltd. - ADR USD 1 191 099 1 072 413 0.04354 824 BrightSphere Investment Group Plc. USD 4 869 555 4 811 413 0.18128 732 Brookdale Senior Living, Inc. USD 902 544 847 057 0.03
9 666 BRP, Inc. USD 408 559 268 231 0.01330 605 Bruker Corp. USD 10 316 873 12 708 456 0.47219 900 Builders FirstSource, Inc. USD 3 027 621 2 933 466 0.11
27 294 Bunge Ltd. USD 1 483 195 1 448 493 0.0514 902 Byline Bancorp, Inc. USD 286 673 275 389 0.0125 576 Cabot Oil & Gas Corp. USD 671 050 667 534 0.03
348 CACI International, Inc. - A USD 63 549 63 343 0.00172 210 Cactus, Inc. - A USD 5 962 986 6 130 676 0.23
19 507 Cadence Design Systems, Inc. USD 1 189 259 1 238 890 0.0515 928 Cadiz, Inc. USD 201 355 154 183 0.0159 540 CAE, Inc. USD 1 312 935 1 318 811 0.0530 189 Caesars Entertainment Corp. USD 260 086 262 342 0.01
631 341 Callaway Golf Co. USD 11 159 566 10 057 262 0.37
44 Merrill Lynch Investment Solutions
Merrill Lynch Investment Solutions – Marshall WaceTOPS UCITS Fund (Market Neutral)Schedule of Investments as at March 31, 2019 (cont.)(expressed in USD)
The accompanying notes form an integral part of these financial statements.
Audited annual report

Quantity DescriptionQuotation
CurrencyCostUSD
Marketvalue USD
% of netassets
Transferable securities and money market instruments admitted to an official exchange listing or dealt in on another regulated market (cont.)
Shares (cont.)906 Cantel Medical Corp. USD 60 781 60 602 0.00
1 513 Capri Hldg. Ltd. USD 69 498 69 220 0.00234 236 Carbonite, Inc. USD 5 788 920 5 811 395 0.21
3 824 Care.com, Inc. USD 72 801 75 562 0.001 897 Carel Industries SpA 144A EUR 16 154 20 877 0.00
32 645 Cargurus, Inc. USD 1 263 146 1 307 759 0.055 875 Carnival Corp. USD 327 339 297 980 0.01
101 433 Carnival Plc. - ADR USD 5 495 781 5 052 378 0.19131 726 Carrols Restaurant Group, Inc. USD 1 435 589 1 313 308 0.05
10 838 CastLight Health, Inc. - B USD 41 017 40 642 0.001 200 CBIZ, Inc. USD 24 122 24 288 0.00
681 205 CBL & Associates Properties, Inc. USD 1 287 581 1 055 868 0.0464 124 CBRE Group, Inc. - A USD 3 159 921 3 170 932 0.12
3 845 CDW Corp. USD 335 540 370 543 0.0120 992 Celgene Corp. USD 1 796 867 1 980 385 0.07
1 405 Centene Corp. USD 73 190 74 605 0.00451 019 CenterState Bank Corp. USD 10 579 634 10 738 762 0.40
43 593 Central Garden & Pet Co USD 1 374 873 1 114 237 0.0445 243 Central Garden & Pet Co. USD 1 258 462 1 051 900 0.0415 882 Central Puerto S.A. - ADR USD 162 211 145 956 0.0112 178 Century Communities, Inc. USD 297 698 291 907 0.0111 679 Ceridian HCM Hldg., Inc. USD 589 789 599 133 0.02
202 282 Cerved Group SpA EUR 2 117 878 2 012 392 0.073 888 Charles Schwab Corp. USD 163 241 166 251 0.01
66 716 Cheesecake Factory, Inc. USD 3 073 117 3 263 747 0.122 933 Chefs' Warehouse, Inc. USD 89 129 91 070 0.00
221 875 Chemical Financial Corp. USD 9 728 354 9 132 375 0.3445 994 ChemoCentryx, Inc. USD 487 663 638 857 0.02
7 772 China Unicom Hong Kong Ltd. - ADR USD 100 168 99 482 0.002 596 Chipotle Mexican Grill, Inc. USD 1 756 761 1 843 965 0.07
125 262 Chuy's Hldg., Inc. USD 2 798 991 2 852 216 0.11354 276 Cia Brasileira de Distribuicao - Pref USD 7 982 363 8 247 545 0.30
1 528 Cia de Saneamento Basico do Estado de Sao Paulo - ADR USD 16 314 16 166 0.00173 014 Cia Paranaense de Energia - ADR USD 1 648 076 1 605 570 0.06
1 355 CIRCOR International, Inc. USD 43 959 44 173 0.006 639 Cision Ltd. USD 91 486 91 419 0.005 641 Citizens Financial Group, Inc. USD 183 474 183 332 0.017 230 CNH Industrial NV EUR 74 459 73 583 0.00
154 828 CNH Industrial NV USD 1 600 158 1 579 246 0.0616 681 Codexis, Inc. USD 344 485 342 461 0.01
9 283 Cognizant Technology Solutions Corp. - A USD 666 022 672 553 0.03158 369 Columbia Sportswear Co. USD 14 923 159 16 498 882 0.61155 599 CommVault Systems, Inc. USD 10 125 706 10 073 479 0.37
2 983 Conagra Brands, Inc. USD 75 518 82 748 0.00114 710 CONMED Corp. USD 8 844 293 9 541 578 0.35
39 589 ConnectOne Bancorp, Inc. USD 816 670 779 903 0.03288 610 Conn's, Inc. USD 7 222 945 6 597 625 0.24
45Merrill Lynch Investment Solutions
Merrill Lynch Investment Solutions – Marshall WaceTOPS UCITS Fund (Market Neutral)Schedule of Investments as at March 31, 2019 (cont.)(expressed in USD)
The accompanying notes form an integral part of these financial statements.
Audited annual report

Quantity DescriptionQuotation
CurrencyCostUSD
Marketvalue USD
% of netassets
Transferable securities and money market instruments admitted to an official exchange listing or dealt in on another regulated market (cont.)
Shares (cont.)15 205 Constellium NV - A USD 121 429 121 336 0.0028 774 Construction Partners, Inc. USD 264 871 367 444 0.0121 154 Container Store Group, Inc. USD 141 344 186 155 0.0152 384 Continental Building Products, Inc. USD 1 518 643 1 298 599 0.0524 252 Control4 Corp. USD 422 372 410 586 0.02
2 853 Cooper Cos., Inc. USD 825 616 844 973 0.0378 921 Corcept Therapeutics, Inc. USD 936 147 926 533 0.0314 708 Cornerstone OnDemand, Inc. USD 812 539 805 704 0.03
967 Corporate Office Properties Trust USD 22 929 26 399 0.001 064 CorVel Corp. USD 68 600 69 415 0.00
45 Costco Wholesale Corp. USD 10 356 10 896 0.008 562 Cott Corp. USD 128 792 125 091 0.008 178 Covanta Hldg. Corp. USD 141 334 141 561 0.01
12 950 Covia Hldg. Corp. USD 75 867 72 390 0.002 022 Cracker Barrel Old Country Store, Inc. USD 326 118 326 775 0.011 892 Crinetics Pharmaceuticals, Inc. USD 42 687 43 062 0.00
182 042 Criteo S.A. - ADR USD 4 829 160 3 646 301 0.13759 942 Crocs, Inc. USD 19 197 297 19 568 506 0.72
1 846 Cubic Corp. USD 111 476 103 819 0.00289 Curtiss-Wright Corp. USD 36 042 32 755 0.00
219 683 Cushman & Wakefield Plc. USD 3 967 194 3 910 357 0.1425 914 Cutera, Inc. USD 428 674 457 641 0.02
6 317 CVB Financial Corp. USD 131 216 132 973 0.012 556 CVR Energy, Inc. USD 105 709 105 307 0.00
14 227 Cymabay Therapeutics, Inc. USD 179 484 188 935 0.01202 228 Cypress Semiconductor Corp. USD 3 039 602 3 017 242 0.11
98 400 Dana, Inc. USD 1 748 782 1 745 616 0.0611 805 Darden Restaurants, Inc. USD 1 393 637 1 433 953 0.0540 726 Dave & Buster's Entertainment, Inc. USD 2 082 276 2 031 006 0.08
315 778 Davide Campari-Milano SpA EUR 3 150 649 3 102 499 0.112 160 DaVita, Inc. USD 116 345 117 266 0.002 259 Deciphera Pharmaceuticals, Inc. USD 54 021 52 431 0.005 391 Deckers Outdoor Corp. USD 793 463 792 423 0.03
796 Delphi Technologies Plc. USD 15 349 15 331 0.002 431 Denali Therapeutics, Inc. USD 50 093 56 448 0.00
31 653 Devon Energy Corp. USD 935 790 998 969 0.0448 875 DFB Healthcare Acquisitions Corp. USD 475 065 488 261 0.02
7 661 DiamondPeak Hldg. Corp. USD 76 683 76 763 0.0060 377 DiaSorin SpA EUR 5 621 167 6 081 149 0.22
184 654 Dicerna Pharmaceuticals, Inc. USD 2 053 196 2 705 181 0.1093 995 Dillard's, Inc. - A USD 7 416 752 6 769 520 0.2598 063 Diodes, Inc. USD 3 563 383 3 402 786 0.1329 084 Discover Financial Services USD 2 057 802 2 069 617 0.08
1 926 Discovery, Inc. - C USD 49 743 48 959 0.0031 017 DMC Global, Inc. USD 1 454 006 1 539 684 0.06
7 953 doBank SpA 144A EUR 117 058 106 714 0.0053 632 Dollar General Corp. USD 6 243 546 6 398 298 0.24
46 Merrill Lynch Investment Solutions
Merrill Lynch Investment Solutions – Marshall WaceTOPS UCITS Fund (Market Neutral)Schedule of Investments as at March 31, 2019 (cont.)(expressed in USD)
The accompanying notes form an integral part of these financial statements.
Audited annual report

Quantity DescriptionQuotation
CurrencyCostUSD
Marketvalue USD
% of netassets
Transferable securities and money market instruments admitted to an official exchange listing or dealt in on another regulated market (cont.)
Shares (cont.)16 390 Dollar Tree, Inc. USD 1 637 575 1 721 606 0.06
7 708 Donnelley Financial Solutions, Inc. USD 117 782 114 695 0.0012 065 Dropbox, Inc. - A USD 266 882 263 017 0.0113 369 DryShips, Inc. USD 61 965 61 765 0.00
6 517 Dunkin' Brands Group, Inc. USD 492 167 489 427 0.0224 595 DXP Enterprises, Inc. USD 1 003 587 957 237 0.0421 200 Dynavax Technologies Corp. USD 201 824 154 972 0.01
123 465 Dynex Capital, Inc. USD 728 443 751 902 0.03121 351 E*TRADE Financial Corp. USD 5 763 894 5 634 327 0.21
11 911 Eagle BanCorp., Inc. USD 594 184 597 932 0.0210 772 Eagle Pharmaceuticals, Inc. USD 537 861 543 878 0.02
202 364 eBay, Inc. USD 7 401 631 7 515 799 0.28207 510 Ebix, Inc. USD 10 728 491 10 244 769 0.38
33 951 Echo Global Logistics, Inc. USD 804 049 841 306 0.032 374 Edwards Lifesciences Corp. USD 425 434 454 217 0.02
55 017 eGain Corp. USD 614 313 574 928 0.0255 328 Electronic Arts, Inc. USD 5 362 766 5 622 985 0.21
121 172 Elf Beauty, Inc. USD 1 207 854 1 284 423 0.053 249 Ellie Mae, Inc. USD 320 276 320 644 0.01
67 174 EMCOR Group, Inc. USD 4 919 018 4 909 076 0.1813 053 Emerald Expositions Events, Inc. USD 156 414 165 773 0.0153 294 Enanta Pharmaceuticals, Inc. USD 5 178 425 5 090 643 0.19
343 352 Enav SpA 144A EUR 1 732 298 1 872 918 0.0758 400 Encore Capital Group, Inc. USD 1 789 960 1 590 232 0.06
9 914 Endava Plc. - ADR USD 238 552 272 635 0.0111 519 Endurance International Group Hldg., Inc. USD 82 168 83 513 0.00
987 209 Enel SpA EUR 5 856 514 6 322 813 0.235 537 Energy Recovery, Inc. USD 47 358 48 338 0.00
211 656 Enerplus Corp. USD 1 807 705 1 780 027 0.072 396 555 Eni SpA EUR 40 806 893 42 393 565 1.56
1 580 Ensign Group, Inc. USD 77 671 80 880 0.00667 Enstar Group Ltd. USD 114 132 116 058 0.00
371 943 Entercom Communications Corp. - A USD 2 096 135 1 952 701 0.0741 795 Enterprise Financial Services Corp. USD 1 723 991 1 703 982 0.0653 663 Epizyme, Inc. USD 566 666 664 885 0.0213 534 Equity Commonwealth USD 450 439 442 426 0.02
129 983 ERG SpA EUR 2 576 158 2 462 200 0.097 665 Eros International Plc. USD 75 118 70 058 0.001 272 Esperion Therapeutics, Inc. USD 50 950 51 071 0.003 488 Essent Group Ltd. USD 152 836 151 554 0.018 951 Essential Properties Realty Trust, Inc. USD 162 173 174 724 0.013 279 Estee Lauder Cos, Inc. - A USD 534 293 542 838 0.02
16 112 Etsy, Inc. USD 1 107 968 1 083 049 0.04464 257 Everi Hldg., Inc. USD 3 805 251 4 883 984 0.18432 049 Evolent Health, Inc. - A USD 6 778 093 5 435 176 0.20
2 272 EW Scripps Co. - A USD 47 652 47 712 0.0024 376 Exponent, Inc. USD 1 338 834 1 406 983 0.05
47Merrill Lynch Investment Solutions
Merrill Lynch Investment Solutions – Marshall WaceTOPS UCITS Fund (Market Neutral)Schedule of Investments as at March 31, 2019 (cont.)(expressed in USD)
The accompanying notes form an integral part of these financial statements.
Audited annual report

Quantity DescriptionQuotation
CurrencyCostUSD
Marketvalue USD
% of netassets
Transferable securities and money market instruments admitted to an official exchange listing or dealt in on another regulated market (cont.)
Shares (cont.)520 318 Express, Inc. USD 2 630 261 2 226 961 0.08338 571 Extended Stay America, Inc. USD 5 925 927 6 077 349 0.22313 792 Extraction Oil & Gas, Inc. USD 1 352 882 1 327 340 0.05
342 FactSet Research Systems, Inc. USD 82 662 84 908 0.00310 979 Falck Renewables SpA EUR 763 203 1 129 606 0.04
94 163 Falcon Minerals Corp. USD 1 016 890 832 401 0.0338 280 Far Point Acquisition Corp. USD 389 265 398 112 0.0288 527 Far Point Acquisition Corp. USD 860 482 880 844 0.03
107 535 Farfetch Ltd. - A USD 2 887 400 2 893 767 0.116 342 Ferrari NV EUR 836 730 850 973 0.03
97 524 FGL Hldg. USD 809 256 767 514 0.0335 828 Fiat Chrysler Automobiles NV EUR 529 759 533 925 0.0227 795 Fidelity National Financial USD 1 024 636 1 015 907 0.04
126 180 Fidelity National Information Services, Inc. USD 13 893 182 14 270 958 0.53950 385 Fincantieri SpA EUR 1 279 173 1 169 585 0.04
14 560 First American Financial Corp. USD 712 501 749 840 0.033 820 First Busey Corp. USD 91 188 93 208 0.00
10 093 First Financial Bankshares, Inc. USD 571 459 583 174 0.02278 132 First Hawaiian, Inc. USD 7 294 849 7 245 339 0.27
4 003 First Interstate BancSystem, Inc. - A USD 156 527 159 399 0.017 359 First Merchants Corp. USD 300 639 271 179 0.011 199 Flex Ltd. USD 11 334 11 990 0.00
139 059 Floor & Décor Hldg., Inc. - A USD 5 313 703 5 732 012 0.212 481 Focus Financial Partners, Inc. - A USD 80 597 88 423 0.00
82 014 Ford Motor Co. USD 713 563 720 083 0.0340 058 Fossil Group, Inc. USD 584 602 549 596 0.02
6 857 Fox Corp. - A USD 251 085 251 720 0.0115 334 Fox Corp. - B USD 587 862 550 184 0.0211 206 Frank's International NV USD 68 672 69 589 0.00
104 749 Fresenius Medical Care AG & Co KGaA - ADR USD 3 888 936 4 245 477 0.162 121 Freshpet, Inc. USD 82 549 89 697 0.00
361 143 FrontDoor, Inc. USD 11 004 121 12 430 542 0.46142 737 Funko, Inc. - A USD 2 779 441 3 100 248 0.11
25 574 G1 Therapeutics, Inc. USD 490 223 424 528 0.0210 120 Galapagos NV - ADR USD 1 138 657 1 191 934 0.0446 279 Gates Industrial Corp. Plc. USD 742 563 663 641 0.02
7 301 Genco Shipping & Trading Ltd. USD 55 697 54 465 0.0019 200 Generac Hldg., Inc. USD 993 915 983 616 0.04
457 881 Genpact Ltd. USD 14 319 800 16 108 254 0.598 917 GeoPark Ltd. USD 155 973 154 175 0.01
77 882 G-III Apparel Group Ltd. USD 2 945 289 3 112 165 0.12133 957 Global Medical, Inc. USD 1 347 028 1 315 458 0.05
8 322 Global Net Lease, Inc. USD 159 607 157 286 0.012 253 Globant S.A. USD 161 475 160 864 0.01
79 332 Globus Medical, Inc. - A USD 3 720 499 3 919 794 0.1565 302 Golden Ocean Group Ltd. USD 423 108 311 491 0.0138 949 Gopro, Inc. - A USD 252 773 253 168 0.01
48 Merrill Lynch Investment Solutions
Merrill Lynch Investment Solutions – Marshall WaceTOPS UCITS Fund (Market Neutral)Schedule of Investments as at March 31, 2019 (cont.)(expressed in USD)
The accompanying notes form an integral part of these financial statements.
Audited annual report

Quantity DescriptionQuotation
CurrencyCostUSD
Marketvalue USD
% of netassets
Transferable securities and money market instruments admitted to an official exchange listing or dealt in on another regulated market (cont.)
Shares (cont.)8 201 Gossamer Bio, Inc. USD 151 469 177 716 0.01
202 859 Gran Tierra Energy, Inc. USD 463 743 460 490 0.022 520 Granite USD 120 942 120 658 0.00
283 650 Gray Television, Inc. USD 5 859 968 6 058 764 0.22523 953 GreenSky, Inc. - A USD 6 069 105 6 779 952 0.25
37 310 GreenTree Hospitality Group Ltd. - ADR USD 443 999 515 997 0.02214 382 Greif, Inc. - A USD 10 508 451 8 843 257 0.33
4 767 Greif, Inc. - B USD 213 412 233 059 0.0120 513 Griffon Corp. USD 321 912 379 080 0.0186 115 Grifols S.A. - ADR USD 1 668 627 1 731 773 0.06
4 087 Gritstone Oncology, Inc. USD 50 616 54 357 0.0081 319 Group 1 Automotive, Inc. USD 5 010 488 5 261 339 0.1952 018 Grupo Aeroportuario del Centro Norte SAB de CV - ADR USD 2 369 405 2 345 492 0.09
726 Grupo Aeroportuario del Pacifico SAB de CV - ADR USD 64 542 64 592 0.0013 314 Grupo Aeroportuario del Sureste SAB de CV - ADR USD 2 208 901 2 153 673 0.0823 979 Grupo Financiero Galicia S.A. - ADR USD 702 254 611 944 0.02
1 102 GS Acquisition Hldg. Corp. USD 11 243 11 560 0.001 375 GTT Communications, Inc. USD 45 148 47 712 0.00
125 252 H&E Equipment Services, Inc. USD 2 851 637 3 145 078 0.12236 209 Habit Restaurants, Inc. - A USD 2 840 393 2 555 781 0.09
1 841 Haemonetics Corp. USD 156 828 161 051 0.0110 276 Halozyme Therapeutics, Inc. USD 170 954 165 444 0.01
6 959 Hamilton Lane, Inc. - A USD 299 478 303 273 0.01116 110 Hanger, Inc. USD 2 328 216 2 211 895 0.08
51 901 Harsco Corp. USD 1 088 216 1 046 324 0.0443 977 Health Insurance Innovations, Inc. - A USD 1 419 712 1 179 463 0.04
2 407 Heartland Financial USA, Inc. USD 102 505 102 659 0.0014 961 HEICO Corp. USD 1 251 094 1 419 350 0.05
356 522 Helix Energy Solutions Group, Inc. USD 2 481 416 2 820 089 0.10678 628 Hera SpA EUR 2 320 748 2 456 680 0.09132 174 Herc Hldg. Inc. USD 5 186 447 5 152 143 0.19
4 191 Heritage Insurance Hldg. USD 61 775 61 189 0.00203 Heron Therapeutics, Inc. USD 4 776 4 961 0.00
163 942 Hertz Global Hldg., Inc. USD 2 781 710 2 847 673 0.11365 908 Hibbett Sports, Inc. USD 7 545 319 8 346 361 0.31
41 520 Hilton Worldwide Hldg., Inc. USD 3 481 012 3 450 727 0.1372 368 HMS Hldg. Corp. USD 2 416 214 2 142 816 0.0877 136 Hollysys Automation Technologies Ltd. USD 1 619 569 1 615 228 0.06
3 762 HomeStreet, Inc. USD 96 505 99 129 0.00367 Host Hotels & Resorts, Inc. USD 7 090 6 936 0.00
89 369 Hostess Brands, Inc. USD 1 078 767 1 117 112 0.04199 482 Houghton Mifflin Harcourt Co. USD 1 684 752 1 450 234 0.05
25 884 Hub Group, Inc. - A USD 1 122 614 1 057 361 0.0418 048 Hudson Ltd. - A USD 253 156 248 160 0.0121 316 ICF International, Inc. USD 1 595 891 1 621 721 0.06
4 290 ICON Plc. USD 570 195 585 928 0.0210 427 II-VI, Inc. USD 389 125 388 301 0.01
49Merrill Lynch Investment Solutions
Merrill Lynch Investment Solutions – Marshall WaceTOPS UCITS Fund (Market Neutral)Schedule of Investments as at March 31, 2019 (cont.)(expressed in USD)
The accompanying notes form an integral part of these financial statements.
Audited annual report
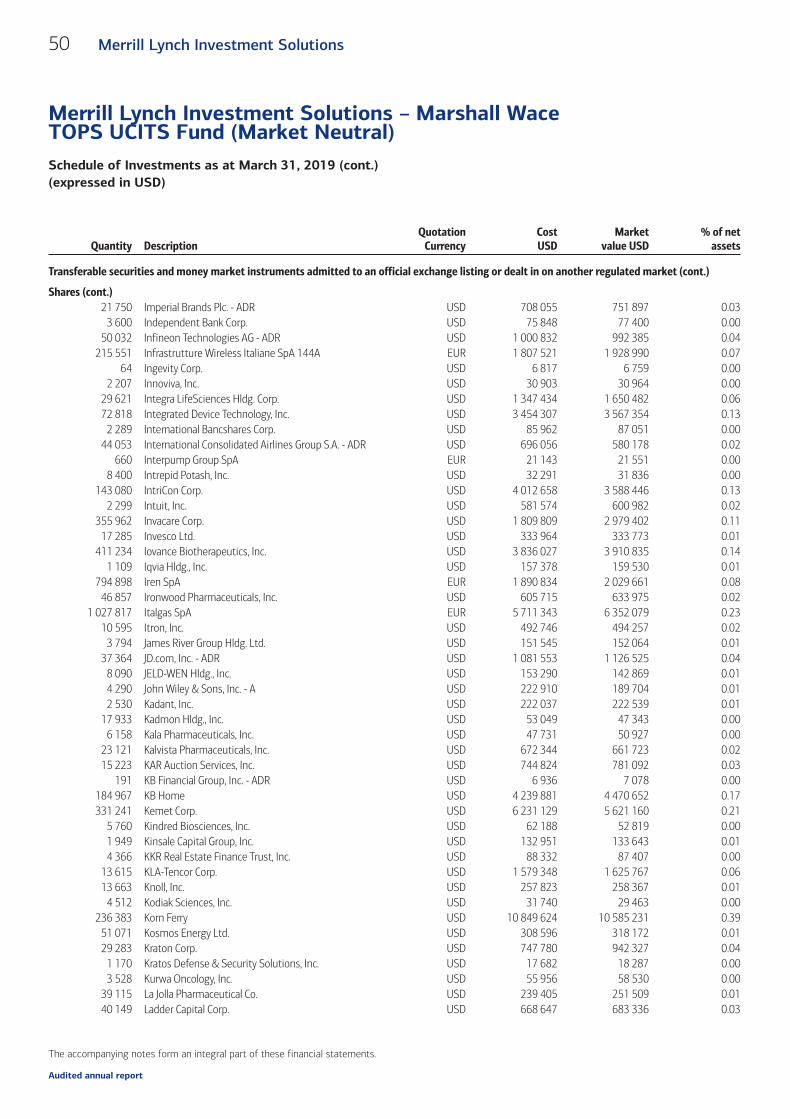
Quantity DescriptionQuotation
CurrencyCostUSD
Marketvalue USD
% of netassets
Transferable securities and money market instruments admitted to an official exchange listing or dealt in on another regulated market (cont.)
Shares (cont.)21 750 Imperial Brands Plc. - ADR USD 708 055 751 897 0.03
3 600 Independent Bank Corp. USD 75 848 77 400 0.0050 032 Infineon Technologies AG - ADR USD 1 000 832 992 385 0.04
215 551 Infrastrutture Wireless Italiane SpA 144A EUR 1 807 521 1 928 990 0.0764 Ingevity Corp. USD 6 817 6 759 0.00
2 207 Innoviva, Inc. USD 30 903 30 964 0.0029 621 Integra LifeSciences Hldg. Corp. USD 1 347 434 1 650 482 0.0672 818 Integrated Device Technology, Inc. USD 3 454 307 3 567 354 0.13
2 289 International Bancshares Corp. USD 85 962 87 051 0.0044 053 International Consolidated Airlines Group S.A. - ADR USD 696 056 580 178 0.02
660 Interpump Group SpA EUR 21 143 21 551 0.008 400 Intrepid Potash, Inc. USD 32 291 31 836 0.00
143 080 IntriCon Corp. USD 4 012 658 3 588 446 0.132 299 Intuit, Inc. USD 581 574 600 982 0.02
355 962 Invacare Corp. USD 1 809 809 2 979 402 0.1117 285 Invesco Ltd. USD 333 964 333 773 0.01
411 234 Iovance Biotherapeutics, Inc. USD 3 836 027 3 910 835 0.141 109 Iqvia Hldg., Inc. USD 157 378 159 530 0.01
794 898 Iren SpA EUR 1 890 834 2 029 661 0.0846 857 Ironwood Pharmaceuticals, Inc. USD 605 715 633 975 0.02
1 027 817 Italgas SpA EUR 5 711 343 6 352 079 0.2310 595 Itron, Inc. USD 492 746 494 257 0.02
3 794 James River Group Hldg. Ltd. USD 151 545 152 064 0.0137 364 JD.com, Inc. - ADR USD 1 081 553 1 126 525 0.04
8 090 JELD-WEN Hldg., Inc. USD 153 290 142 869 0.014 290 John Wiley & Sons, Inc. - A USD 222 910 189 704 0.012 530 Kadant, Inc. USD 222 037 222 539 0.01
17 933 Kadmon Hldg., Inc. USD 53 049 47 343 0.006 158 Kala Pharmaceuticals, Inc. USD 47 731 50 927 0.00
23 121 Kalvista Pharmaceuticals, Inc. USD 672 344 661 723 0.0215 223 KAR Auction Services, Inc. USD 744 824 781 092 0.03
191 KB Financial Group, Inc. - ADR USD 6 936 7 078 0.00184 967 KB Home USD 4 239 881 4 470 652 0.17331 241 Kemet Corp. USD 6 231 129 5 621 160 0.21
5 760 Kindred Biosciences, Inc. USD 62 188 52 819 0.001 949 Kinsale Capital Group, Inc. USD 132 951 133 643 0.014 366 KKR Real Estate Finance Trust, Inc. USD 88 332 87 407 0.00
13 615 KLA-Tencor Corp. USD 1 579 348 1 625 767 0.0613 663 Knoll, Inc. USD 257 823 258 367 0.01
4 512 Kodiak Sciences, Inc. USD 31 740 29 463 0.00236 383 Korn Ferry USD 10 849 624 10 585 231 0.39
51 071 Kosmos Energy Ltd. USD 308 596 318 172 0.0129 283 Kraton Corp. USD 747 780 942 327 0.04
1 170 Kratos Defense & Security Solutions, Inc. USD 17 682 18 287 0.003 528 Kurwa Oncology, Inc. USD 55 956 58 530 0.00
39 115 La Jolla Pharmaceutical Co. USD 239 405 251 509 0.0140 149 Ladder Capital Corp. USD 668 647 683 336 0.03
50 Merrill Lynch Investment Solutions
Merrill Lynch Investment Solutions – Marshall WaceTOPS UCITS Fund (Market Neutral)Schedule of Investments as at March 31, 2019 (cont.)(expressed in USD)
The accompanying notes form an integral part of these financial statements.
Audited annual report

Quantity DescriptionQuotation
CurrencyCostUSD
Marketvalue USD
% of netassets
Transferable securities and money market instruments admitted to an official exchange listing or dealt in on another regulated market (cont.)
Shares (cont.)2 695 Lakeland Financial Corp. USD 116 803 121 868 0.00
978 Lancaster Colony Corp. USD 151 875 153 243 0.01464 017 Laredo Petroleum, Inc. USD 1 449 330 1 433 813 0.05
42 946 Legacytexas Financial Group USD 1 646 790 1 605 751 0.062 330 Leidos Hldg., Inc. USD 146 387 149 330 0.01
84 815 LeMaitre Vascular, Inc. USD 2 420 583 2 629 265 0.10290 592 Leonardo SpA EUR 3 328 079 3 380 377 0.13
12 606 Levi Strauss & Co. - A USD 282 500 296 871 0.01293 939 LexinFintech Hldg. Ltd. - ADR USD 3 169 902 3 086 359 0.11
44 733 LGI Homes, Inc. USD 2 505 764 2 694 716 0.101 112 Liberty Broadband - C USD 102 928 102 015 0.00
19 437 Liberty Expedia Hldg. - A USD 789 449 831 904 0.0318 864 Liberty Global Plc. - C USD 418 384 456 697 0.02
226 278 Liberty Latin America Ltd. - A USD 3 941 995 4 376 217 0.16389 Liberty Latin America Ltd. - C USD 7 721 7 566 0.00
25 413 Liberty Media Corp-Liberty SiriusXM - C USD 1 019 073 971 793 0.041 887 Liberty Oilfield Services, Inc. - A USD 27 753 29 041 0.001 619 Ligand Pharmaceuticals, Inc. USD 198 054 203 524 0.01
382 563 Limelight Networks, Inc. USD 1 588 352 1 235 678 0.059 Lincoln Electric Hldg., Inc. USD 733 755 0.00
86 631 Lindblad Expeditions Hldg. USD 1 278 761 1 321 123 0.051 062 Lions Gate Entertainment Corp. - A USD 17 215 16 610 0.00
18 289 Liquidia Technologies, Inc. USD 210 323 208 129 0.01164 Live Nation Entertainment, Inc. USD 8 945 10 421 0.00
16 960 Live Oak Bancshares, Inc. USD 260 839 247 786 0.015 123 Logitech International S.A. - Reg USD 181 830 201 539 0.01
317 Lukoil PJSC - ADR USD 27 121 28 343 0.0051 029 Lululemon Athletica, Inc. USD 8 448 391 8 362 122 0.31
126 663 Luminex Corp. USD 3 079 032 2 914 516 0.119 579 Luxoft Holding, Inc. USD 551 083 562 383 0.02
10 308 Lyft, Inc. - A USD 835 387 807 013 0.032 440 MacroGenics, Inc. USD 44 120 43 871 0.00
69 449 Macy's, Inc. USD 1 653 509 1 668 859 0.062 133 Magellan Health, Inc. USD 145 403 140 607 0.01
27 311 Magnolia Oil & Gas Corp. USD 339 610 327 732 0.01303 992 Maire Tecnimont SpA EUR 1 334 649 1 159 182 0.04
69 896 Malibu Boats, Inc. - A USD 3 303 132 2 766 484 0.1084 672 Mammoth Energy Services, Inc. USD 1 905 143 1 409 789 0.05
259 283 Manitowoc Co., Inc. USD 4 050 482 4 254 834 0.1626 595 ManTech International Corp. - A USD 1 432 658 1 436 662 0.05
3 860 Marcus & Millichap, Inc. USD 149 482 157 218 0.016 955 Marcus Corp. USD 282 889 278 548 0.01
119 295 MarineMax, Inc. USD 2 291 676 2 285 692 0.086 000 Masimo Corp. USD 750 260 829 680 0.03
41 582 McDonald's Corp. USD 7 754 492 7 896 422 0.291 354 Medidata Solutions, Inc. USD 102 824 99 167 0.003 600 Medifast, Inc. USD 477 994 459 180 0.02
51Merrill Lynch Investment Solutions
Merrill Lynch Investment Solutions – Marshall WaceTOPS UCITS Fund (Market Neutral)Schedule of Investments as at March 31, 2019 (cont.)(expressed in USD)
The accompanying notes form an integral part of these financial statements.
Audited annual report

Quantity DescriptionQuotation
CurrencyCostUSD
Marketvalue USD
% of netassets
Transferable securities and money market instruments admitted to an official exchange listing or dealt in on another regulated market (cont.)
Shares (cont.)32 053 Mediobanca Banca di Credito Finanziario SpA EUR 326 054 333 346 0.01
1 582 Medpace Hldg., Inc. USD 85 689 93 291 0.0088 527 Megalith Financial Acquisition Corp. - A USD 844 548 883 499 0.03
8 149 Mellanox Technologies Ltd. USD 938 020 964 516 0.04120 842 Merit Medical Systems, Inc. USD 6 805 322 7 471 661 0.28
4 204 Mersana Therapeutics, Inc. USD 21 129 22 113 0.00177 438 Mesa Air Group, Inc. USD 1 612 831 1 479 833 0.05
622 Mesa Laboratories, Inc. USD 143 244 143 371 0.015 017 Meta Financial Group, Inc. USD 95 234 98 735 0.001 717 MGM Growth Properties LLC - A USD 51 710 55 373 0.00
45 353 MGM Resorts International USD 1 176 192 1 163 758 0.0413 695 MGP Ingredients, Inc. USD 1 056 597 1 056 569 0.04
1 361 Mid-America Apartment Communities, Inc. USD 148 104 148 798 0.01603 249 MiMedx Group, Inc. USD 1 374 872 2 117 404 0.08
762 Mirati Therapeutics, Inc. USD 56 392 55 855 0.0039 482 Mitek Systems, Inc. USD 439 368 483 260 0.02
538 842 Mitsubishi UFJ Financial Group, Inc. - ADR USD 2 786 554 2 667 268 0.10110 941 Mix Telematis Ltd. - ADR USD 1 917 858 1 849 386 0.07
3 587 MMC Norilsk Nickel PJSC - ADR USD 77 680 75 417 0.0047 692 Mobile Mini, Inc. USD 1 693 456 1 618 666 0.0620 341 Model N, Inc. USD 353 455 356 781 0.01
290 015 Moelic & Co. - A USD 12 269 532 12 067 524 0.45500 768 Moncler SpA EUR 19 890 733 20 197 359 0.75
58 337 Monster Beverage Corp. USD 3 416 857 3 184 033 0.121 267 MorphoSys AG - ADR USD 33 081 28 761 0.00
30 081 Mosaic Acquisition Corp. USD 306 537 310 436 0.011 194 Motorola Solutions, Inc. USD 166 287 167 661 0.011 469 MSA Safety, Inc. USD 147 159 151 895 0.01
91 MSCI, Inc. USD 17 497 18 094 0.00165 114 MyoKardia, Inc. USD 8 088 348 8 584 277 0.32
2 010 Nateria, Inc. USD 39 379 41 446 0.0070 007 National General Hldg. Corp. USD 1 706 364 1 661 266 0.06
1 383 National Storage Affiliates Trust USD 39 021 39 429 0.0072 547 Natus Medical, Inc. USD 1 945 349 1 841 243 0.07
491 280 NCI Building Systems, Inc. USD 5 006 392 3 026 285 0.1120 109 Nebula Acquisition Corp. USD 202 234 206 117 0.01
454 Nektar Therapeutics USD 18 427 15 254 0.002 394 Nelnet, Inc. - A USD 130 101 131 838 0.01
53 267 Neogen Corp. USD 3 049 159 3 056 993 0.1164 984 NeoGenomics, Inc. USD 1 255 888 1 329 573 0.0515 037 NeoPhotonics Corp. USD 104 876 94 583 0.00
3 337 NetApp, Inc. USD 218 958 231 388 0.014 800 Netgear, Inc. USD 172 452 158 976 0.01
45 823 Neurocrine Biosciences, Inc. USD 3 752 973 4 037 006 0.155 123 Nevro Corp. USD 310 351 320 239 0.01
20 835 New Frontier Corp. USD 209 910 211 475 0.01126 182 New Gold, Inc. USD 143 850 108 643 0.00
52 Merrill Lynch Investment Solutions
Merrill Lynch Investment Solutions – Marshall WaceTOPS UCITS Fund (Market Neutral)Schedule of Investments as at March 31, 2019 (cont.)(expressed in USD)
The accompanying notes form an integral part of these financial statements.
Audited annual report
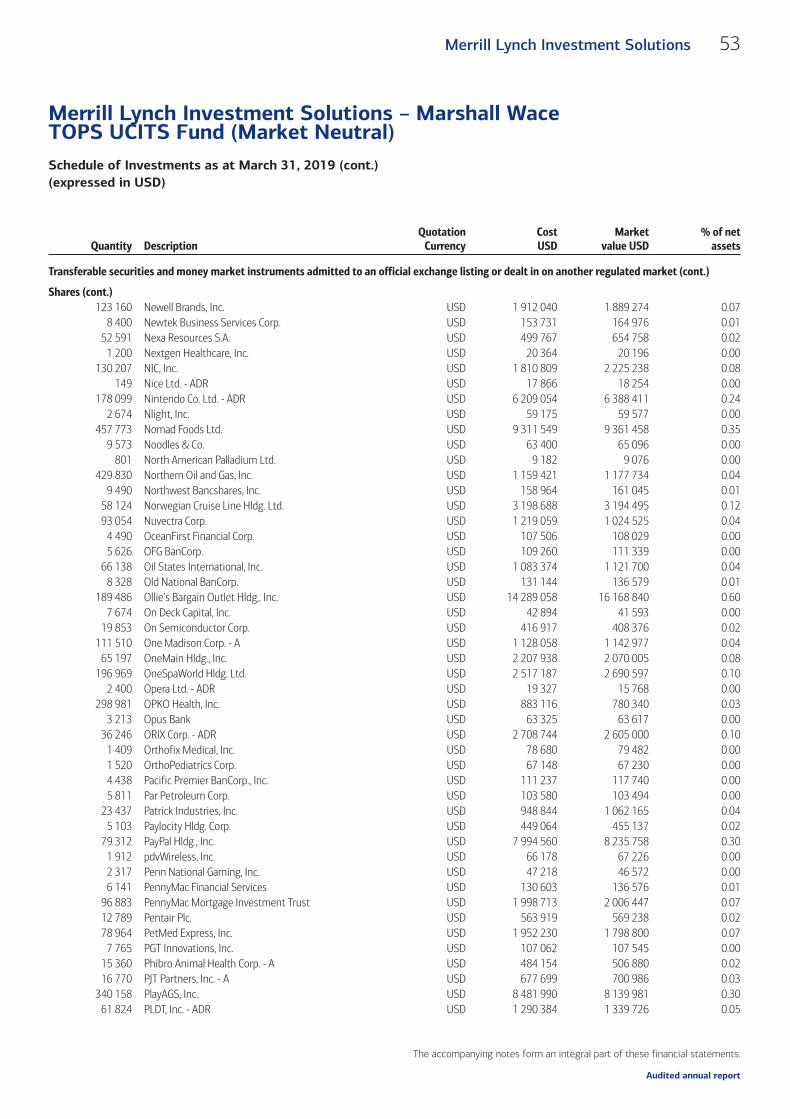
Quantity DescriptionQuotation
CurrencyCostUSD
Marketvalue USD
% of netassets
Transferable securities and money market instruments admitted to an official exchange listing or dealt in on another regulated market (cont.)
Shares (cont.)123 160 Newell Brands, Inc. USD 1 912 040 1 889 274 0.07
8 400 Newtek Business Services Corp. USD 153 731 164 976 0.0152 591 Nexa Resources S.A. USD 499 767 654 758 0.02
1 200 Nextgen Healthcare, Inc. USD 20 364 20 196 0.00130 207 NIC, Inc. USD 1 810 809 2 225 238 0.08
149 Nice Ltd. - ADR USD 17 866 18 254 0.00178 099 Nintendo Co. Ltd. - ADR USD 6 209 054 6 388 411 0.24
2 674 Nlight, Inc. USD 59 175 59 577 0.00457 773 Nomad Foods Ltd. USD 9 311 549 9 361 458 0.35
9 573 Noodles & Co. USD 63 400 65 096 0.00801 North American Palladium Ltd. USD 9 182 9 076 0.00
429 830 Northern Oil and Gas, Inc. USD 1 159 421 1 177 734 0.049 490 Northwest Bancshares, Inc. USD 158 964 161 045 0.01
58 124 Norwegian Cruise Line Hldg. Ltd. USD 3 198 688 3 194 495 0.1293 054 Nuvectra Corp. USD 1 219 059 1 024 525 0.04
4 490 OceanFirst Financial Corp. USD 107 506 108 029 0.005 626 OFG BanCorp. USD 109 260 111 339 0.00
66 138 Oil States International, Inc. USD 1 083 374 1 121 700 0.048 328 Old National BanCorp. USD 131 144 136 579 0.01
189 486 Ollie's Bargain Outlet Hldg,. Inc. USD 14 289 058 16 168 840 0.607 674 On Deck Capital, Inc. USD 42 894 41 593 0.00
19 853 On Semiconductor Corp. USD 416 917 408 376 0.02111 510 One Madison Corp. - A USD 1 128 058 1 142 977 0.04
65 197 OneMain Hldg., Inc. USD 2 207 938 2 070 005 0.08196 969 OneSpaWorld Hldg. Ltd. USD 2 517 187 2 690 597 0.10
2 400 Opera Ltd. - ADR USD 19 327 15 768 0.00298 981 OPKO Health, Inc. USD 883 116 780 340 0.03
3 213 Opus Bank USD 63 325 63 617 0.0036 246 ORIX Corp. - ADR USD 2 708 744 2 605 000 0.10
1 409 Orthofix Medical, Inc. USD 78 680 79 482 0.001 520 OrthoPediatrics Corp. USD 67 148 67 230 0.004 438 Pacific Premier BanCorp., Inc. USD 111 237 117 740 0.005 811 Par Petroleum Corp. USD 103 580 103 494 0.00
23 437 Patrick Industries, Inc. USD 948 844 1 062 165 0.045 103 Paylocity Hldg. Corp. USD 449 064 455 137 0.02
79 312 PayPal Hldg., Inc. USD 7 994 560 8 235 758 0.301 912 pdvWireless, Inc. USD 66 178 67 226 0.002 317 Penn National Gaming, Inc. USD 47 218 46 572 0.006 141 PennyMac Financial Services USD 130 603 136 576 0.01
96 883 PennyMac Mortgage Investment Trust USD 1 998 713 2 006 447 0.0712 789 Pentair Plc. USD 563 919 569 238 0.0278 964 PetMed Express, Inc. USD 1 952 230 1 798 800 0.07
7 765 PGT Innovations, Inc. USD 107 062 107 545 0.0015 360 Phibro Animal Health Corp. - A USD 484 154 506 880 0.0216 770 PJT Partners, Inc. - A USD 677 699 700 986 0.03
340 158 PlayAGS, Inc. USD 8 481 990 8 139 981 0.3061 824 PLDT, Inc. - ADR USD 1 290 384 1 339 726 0.05
53Merrill Lynch Investment Solutions
Merrill Lynch Investment Solutions – Marshall WaceTOPS UCITS Fund (Market Neutral)Schedule of Investments as at March 31, 2019 (cont.)(expressed in USD)
The accompanying notes form an integral part of these financial statements.
Audited annual report

Quantity DescriptionQuotation
CurrencyCostUSD
Marketvalue USD
% of netassets
Transferable securities and money market instruments admitted to an official exchange listing or dealt in on another regulated market (cont.)
Shares (cont.)203 PNC Financial Services Group, Inc. USD 26 025 24 900 0.00
5 077 Polarityte, Inc. USD 60 233 54 324 0.009 727 Popular, Inc. USD 474 378 507 068 0.023 816 Poste Italiane SpA 144A EUR 37 354 37 158 0.00
117 497 PPDAI Group, Inc. - ADR USD 489 518 444 139 0.0250 805 PRA Health Sciences, Inc. USD 5 327 998 5 603 283 0.21
5 868 Precision BioSciences, Inc. USD 102 123 105 331 0.004 774 Precision Drilling Corp. USD 11 747 11 410 0.00
159 396 Presidio, Inc. USD 2 430 456 2 359 061 0.092 158 PriceSmart, Inc. USD 129 156 127 063 0.014 643 Primoris Services Corp. USD 96 895 96 017 0.005 348 Principia Biopharma, Inc. USD 174 942 181 832 0.01
18 117 Progress Software Corp. USD 716 225 803 851 0.031 416 Proofpoint, Inc. USD 170 440 171 945 0.01
18 162 ProPetro Hldg. Corp. USD 367 579 409 371 0.029 581 Prospect Capital Corp. USD 62 730 62 468 0.002 143 PTC, Inc. USD 175 081 197 542 0.011 809 QAD, Inc. - A USD 75 859 77 914 0.00
38 461 QEP Resources, Inc. USD 310 392 299 611 0.0119 325 QIWI Plc. - ADR USD 270 285 278 087 0.01
2 705 QTS Realty Trust, Inc. - A USD 119 880 121 698 0.009 877 Quanex Building Products Corp. USD 156 333 156 946 0.01
23 097 Quantenna Communications, Inc. USD 550 922 561 950 0.029 765 Quarate Retail, Inc. USD 156 022 156 045 0.01
165 690 Quidel Corp. USD 9 308 193 10 847 724 0.40317 037 QuinStreet, Inc. USD 4 256 614 4 245 125 0.16
693 Ra Pharmaceuticals, Inc. USD 15 509 15 523 0.002 920 Radius Health, Inc. USD 54 911 58 225 0.00
203 868 Ralph Lauren Corp. USD 24 528 550 26 437 602 0.9813 798 Raven Industries, Inc. USD 513 475 529 429 0.02
877 RBC Bearings, Inc. USD 111 175 111 528 0.00430 711 Realogy Hldg Corp. USD 7 078 112 4 910 105 0.18
43 952 Red Hat, Inc. USD 7 897 575 8 030 030 0.306 181 Red Lion Hotels Corp. USD 50 297 49 942 0.00
421 088 Red Rock Resorts, Inc. - A USD 10 665 535 10 885 125 0.4052 524 Redwood Trust, Inc. USD 829 307 848 263 0.03
144 061 Regions Financial Corp. USD 1 993 887 2 038 463 0.085 359 Reinsurance Group of America, Inc. USD 748 944 760 871 0.033 960 Renasant Corp. USD 131 314 134 046 0.01
45 272 Repsol S.A. - ADR USD 764 017 773 246 0.0346 826 Resolute Forest Products, Inc. USD 421 730 369 925 0.01
4 821 Revance Therapeutics, Inc. USD 74 751 75 979 0.0024 073 Rexford Industrial Realty, Inc. USD 821 371 862 054 0.03
1 951 Rhytm Pharmaceuticals, Inc. USD 59 720 53 477 0.00688 333 Rigel Pharmaceuticals, Inc. USD 1 464 511 1 769 016 0.07
2 240 RLI Corp. USD 157 408 160 720 0.0127 251 Rocket Pharmaceuticals, Inc. USD 426 289 477 983 0.02
54 Merrill Lynch Investment Solutions
Merrill Lynch Investment Solutions – Marshall WaceTOPS UCITS Fund (Market Neutral)Schedule of Investments as at March 31, 2019 (cont.)(expressed in USD)
The accompanying notes form an integral part of these financial statements.
Audited annual report

Quantity DescriptionQuotation
CurrencyCostUSD
Marketvalue USD
% of netassets
Transferable securities and money market instruments admitted to an official exchange listing or dealt in on another regulated market (cont.)
Shares (cont.)16 017 Rollins, Inc. USD 603 555 666 628 0.0245 818 Rubius Therapeutics, Inc. USD 746 095 829 306 0.03
2 326 RYB Education, Inc. - ADR USD 18 438 15 352 0.001 591 Ryman Hospitality Properties USD 131 813 130 844 0.01
12 642 S&P Global, Inc. USD 2 542 415 2 661 773 0.1059 018 Saban Capital Acquisition Corp. - A USD 598 443 606 705 0.02
218 662 Safe Bulkers, Inc. USD 631 296 319 247 0.01554 378 Saipem SpA EUR 2 929 914 2 935 009 0.11
8 006 Sandstorm Gold, Ltd. USD 45 101 43 873 0.0056 570 Saras SpA EUR 111 404 104 871 0.00
2 275 Saul Centers, Inc. USD 113 663 116 867 0.006 668 Sberbank of Russia PJSC - ADR USD 84 873 87 884 0.00
202 191 Schneider National, Inc. - B USD 4 412 541 4 256 121 0.162 975 Schnitzer Steel Industries, Inc. - A USD 71 386 71 400 0.00
58 907 Seadrill Ltd. - ADR USD 519 262 489 517 0.022 006 SeaWorld Entertainment, Inc. USD 48 279 51 675 0.006 157 Select Energy Services, Inc. - A USD 68 578 74 007 0.00
285 213 Select Medical Hldg. Corp. USD 5 003 630 4 018 651 0.154 069 Senior Housing Properties Trust USD 47 909 47 933 0.00
80 271 Sentinel Energy Services, Inc. - A USD 821 085 809 132 0.0373 254 Seres Therapeutics, Inc. USD 474 993 503 255 0.02
3 149 Shake Shack, Inc. - A USD 182 320 186 263 0.012 418 Shenandoah Telecommunications Co. USD 110 293 107 262 0.00
70 974 Shoe Carnival, Inc. USD 2 616 350 2 415 245 0.091 081 ShotSpotter, Inc. USD 42 594 41 727 0.00
60 658 Shutterfly, Inc. USD 2 432 783 2 465 141 0.0943 888 Siemens AG - ADR USD 2 416 108 2 358 980 0.09
1 675 Sientra, Inc. USD 20 097 14 371 0.0016 069 Silicon Motion Technology Corp. - ADR USD 632 976 636 975 0.02
6 068 Simply Good Foods Co. USD 121 640 124 940 0.006 617 SINA Corp. USD 465 105 391 991 0.01
396 236 Sirius XM Hldg., Inc. USD 2 329 868 2 246 658 0.0873 826 Six Flags Entertainment Corp. USD 3 768 088 3 643 313 0.13
2 477 SJW Group USD 156 929 152 930 0.0162 719 Skechers U.S.A., Inc. - A USD 2 067 178 2 107 986 0.08
379 886 Skyline Champion Corp. USD 7 727 830 7 217 834 0.2783 693 SkyWest, Inc. USD 4 530 650 4 543 693 0.17
4 483 319 Snam SpA EUR 19 645 756 23 051 117 0.8511 974 Snap, Inc. - A USD 129 406 131 953 0.0115 708 Societa Cattolica di Assicurazioni SC EUR 151 433 150 185 0.01
153 966 Societa Iniziative Autostradali e Servizi SpA EUR 2 389 698 2 669 278 0.108 885 Solaredge Technologies, Inc. USD 331 122 334 787 0.01
53 130 Solid Biosciences, Inc. USD 556 147 488 796 0.026 506 Sonos, Inc. USD 63 961 66 947 0.00
88 673 Sotheby's USD 3 553 502 3 347 406 0.129 425 Southwest Airlines Co. USD 469 096 489 252 0.027 916 Spark Therapeutics, Inc. USD 898 618 901 474 0.03
55Merrill Lynch Investment Solutions
Merrill Lynch Investment Solutions – Marshall WaceTOPS UCITS Fund (Market Neutral)Schedule of Investments as at March 31, 2019 (cont.)(expressed in USD)
The accompanying notes form an integral part of these financial statements.
Audited annual report

Quantity DescriptionQuotation
CurrencyCostUSD
Marketvalue USD
% of netassets
Transferable securities and money market instruments admitted to an official exchange listing or dealt in on another regulated market (cont.)
Shares (cont.)1 055 SPS Commerce, Inc. USD 112 372 111 893 0.00
61 023 SPX Corp. USD 2 208 619 2 122 990 0.0847 956 SPX Flow, Inc. USD 1 574 653 1 529 796 0.06
1 369 374 SRC Energy, Inc. USD 6 320 668 7 011 195 0.2687 396 St Joe Co. USD 1 256 740 1 441 160 0.05
121 581 STAAR Surgical Co. USD 4 486 980 4 156 854 0.155 428 STAG Industrial, Inc. USD 156 251 160 940 0.01
536 409 Star Bulk Carriers Corp. USD 4 142 377 3 529 571 0.1378 105 Starbucks Corp. USD 5 610 146 5 806 326 0.21
5 912 Steel Dynamics, Inc. USD 222 623 208 516 0.0111 215 Steelcase, Inc. - A USD 173 567 163 178 0.01
6 525 Stitch Fix, Inc. - A USD 184 455 184 201 0.01769 910 STMicroelectronics NV EUR 11 660 153 11 394 022 0.42
25 667 Stora Enso OYJ - ADR USD 325 841 313 137 0.0187 119 Sumitomo Mitsui Financial Group, Inc. - ADR USD 604 073 612 447 0.0286 551 Superior Energy Services, Inc. USD 437 492 404 193 0.02
3 530 Superior Industries International, Inc. USD 18 127 16 803 0.00265 261 Supernus Pharmaceuticals, Inc. USD 9 996 574 9 294 745 0.34
4 438 SVMK, Inc. USD 67 413 80 816 0.0035 376 Switch, Inc. - A USD 366 635 364 727 0.0172 428 Syneos Health, Inc. USD 3 495 848 3 748 873 0.14
6 000 Takeda Pharmaceutical Co Ltd. JPY 238 276 245 074 0.0168 641 Takeda Pharmaceutical Co. Ltd. - ADR USD 1 363 743 1 398 217 0.05
375 Take-Two Interactive Software, Inc. USD 34 879 35 389 0.001 542 Talend S.A. - ADR USD 77 010 77 979 0.001 288 Tapestry, Inc. USD 41 618 41 847 0.00
88 898 TCF Financial Corp. USD 1 995 810 1 839 300 0.078 367 Technogym SpA 144A EUR 107 442 103 062 0.00
1 108 779 Telecom Italia SpA EUR 626 797 630 464 0.0219 368 Teleflex, Inc. USD 5 465 246 5 852 235 0.22
220 261 Tenable Hldg., Inc. USD 6 381 918 6 973 463 0.2649 025 Tenet Healthcare Corp. USD 1 321 406 1 413 881 0.0520 527 Tennant Co USD 1 277 487 1 274 521 0.0589 753 Terex Corp. USD 2 864 916 2 883 764 0.11
1 821 767 Terna Rete Elettrica Nazionale SpA EUR 11 341 462 11 553 384 0.4320 651 Texas Roadhouse, Inc. USD 1 232 949 1 284 286 0.05
3 267 Thermo Fisher Scientific,, Inc.. USD 882 203 894 243 0.031 756 Thermon Group Hldg., Inc. USD 43 751 43 040 0.00
364 Tidewater, Inc. USD 8 202 8 441 0.00429 603 Tim Participacoes S.A. - ADR USD 6 750 865 6 478 413 0.24824 919 Tivity Health, Inc. USD 18 457 464 14 485 578 0.53
1 486 Tokio Marine Hldg., Inc. - ADR USD 71 047 72 064 0.0040 252 TopBuild Corp. USD 2 526 138 2 609 135 0.10
1 802 Total System Services, Inc. USD 167 240 171 208 0.0158 668 TPG Pace Hldg. Corp. - A USD 591 496 600 760 0.02
228 595 TPG RE Finance Trust, Inc. USD 4 504 375 4 480 462 0.172 923 TPI Composites, Inc. USD 86 680 83 656 0.00
56 Merrill Lynch Investment Solutions
Merrill Lynch Investment Solutions – Marshall WaceTOPS UCITS Fund (Market Neutral)Schedule of Investments as at March 31, 2019 (cont.)(expressed in USD)
The accompanying notes form an integral part of these financial statements.
Audited annual report

Quantity DescriptionQuotation
CurrencyCostUSD
Marketvalue USD
% of netassets
Transferable securities and money market instruments admitted to an official exchange listing or dealt in on another regulated market (cont.)
Shares (cont.)8 644 Transportadora de Gas del Sur S.A. - B USD 135 692 113 755 0.00
12 473 TransUnion USD 782 771 833 695 0.0316 781 Travelport Worldwide Ltd USD 266 254 263 965 0.0124 490 Trex Co, Inc. USD 1 532 014 1 506 625 0.0611 892 TRI Pointe Group, Inc. USD 153 016 150 315 0.0128 213 Tribune Media Co. - A USD 1 251 115 1 301 748 0.0552 859 TriNet Group, Inc. USD 2 987 924 3 157 797 0.1237 666 Triple-S Management Corp. - B USD 695 618 859 538 0.0368 268 TriState Capital Hldg., Inc. USD 1 362 189 1 394 715 0.0516 659 Triumph Group, Inc. USD 323 808 317 521 0.01
489 839 Trivago NV - ADR USD 2 717 081 2 116 104 0.086 852 Tronox Hldg Plc. - A USD 90 200 90 104 0.001 950 Trupanion, Inc. USD 57 775 63 843 0.00
37 243 Tupperware Brands Corp. USD 1 011 403 952 676 0.0475 416 Turkcell Iletisim Hizmetleri AS - ADR USD 429 502 404 230 0.02
1 467 098 Turquoise Hill Resources Ltd. USD 2 671 336 2 435 383 0.0916 990 Two Harbors Investment Corp. USD 229 700 229 875 0.01
5 097 Tyler Technologies, Inc. USD 939 975 1 041 827 0.048 019 Ulta Salon Cosmetics & Fragrance, Inc. USD 2 736 429 2 796 466 0.101 144 Ultimate Software Group, Inc. USD 378 743 377 669 0.01
487 548 Umpqua Hldg. Corp. USD 8 448 615 8 044 542 0.3044 685 UniCredit SpA EUR 519 479 573 395 0.02
925 251 Unipol Gruppo SpA EUR 3 981 903 4 612 796 0.17201 875 Unit Corp. USD 3 124 034 2 874 700 0.11
9 884 Up Fintech Hldg. Ltd. - ADR USD 105 485 127 899 0.014 914 UPM-Kymmene OYJ - ADR USD 139 453 143 292 0.013 600 US Xpress Enterprises, Inc. - A USD 28 353 23 796 0.00
39 525 USANA Health Sciences, Inc. USD 4 066 208 3 314 962 0.122 022 USG Corp. USD 87 578 87 553 0.00
15 233 Vail Resorts, Inc. USD 3 273 661 3 310 131 0.12189 967 Vantage Energy Acquisition Corp. - A USD 1 923 632 1 941 463 0.07
1 200 Varian Medical Systems, Inc. USD 166 038 170 064 0.0178 690 VectoIQ Acquisition Corp. USD 754 637 786 900 0.0310 238 Vectrus, Inc. USD 360 230 272 228 0.01
912 911 Veon Ltd. USD 1 971 888 1 907 984 0.0796 798 Vera Bradley, Inc. USD 1 306 545 1 282 573 0.0513 543 Veracyte, Inc. USD 272 956 338 846 0.01
129 649 Vericel Corp. USD 2 444 212 2 270 154 0.0866 089 Verint Systems, Inc. USD 3 824 087 3 956 088 0.15
107 216 Veritex Hldg., Inc. USD 2 860 865 2 596 772 0.10518 Veritiv Corp. USD 13 621 13 634 0.00
203 732 Verra Mobility Corp. USD 2 103 751 2 424 411 0.095 419 Verso Corp. - A USD 115 489 116 075 0.00
26 609 Versum Materials, Inc. USD 1 308 686 1 338 699 0.053 505 Viacom, Inc. - A USD 121 491 113 737 0.00
25 333 Viacom, Inc. - B USD 692 635 711 097 0.0326 697 VICI Properties, Inc. USD 557 471 584 130 0.02
57Merrill Lynch Investment Solutions
Merrill Lynch Investment Solutions – Marshall WaceTOPS UCITS Fund (Market Neutral)Schedule of Investments as at March 31, 2019 (cont.)(expressed in USD)
The accompanying notes form an integral part of these financial statements.
Audited annual report

Quantity DescriptionQuotation
CurrencyCostUSD
Marketvalue USD
% of netassets
Transferable securities and money market instruments admitted to an official exchange listing or dealt in on another regulated market (cont.)
Shares (cont.)58 377 Victory Capital Hldg., Inc. - A USD 623 586 876 823 0.0341 986 Viewray, Inc. USD 305 961 310 277 0.01
5 338 Virtu Financial, Inc. - A USD 129 446 126 777 0.0125 347 Virtusa Corp. USD 1 278 644 1 354 797 0.05
904 Visteon Corp. USD 61 240 60 884 0.00231 Vonage Hldg. Corp. USD 2 234 2 319 0.00
43 846 Voya Financial, Inc. USD 2 160 813 2 190 546 0.0899 834 W&T Offshore, Inc. USD 544 501 688 855 0.03
3 604 WABCO Hldg., Inc. USD 492 487 475 115 0.0219 499 Walt Disney Co. USD 2 160 013 2 164 974 0.0873 019 Warrior Met Coal, Inc. USD 2 104 785 2 219 778 0.08
61 Waters Corp. USD 14 645 15 354 0.0026 150 WaVe Life Sciences Ltd. USD 942 624 1 015 927 0.04
893 Webster Financial Corp. USD 45 251 45 248 0.002 610 Weis Markets, Inc. USD 106 394 106 514 0.001 628 WellCare Health Plans, Inc. USD 436 942 439 153 0.021 629 WesBanco, Inc. USD 63 407 64 753 0.00
33 658 Wesco Aircraft Hldg., Inc. USD 275 595 295 854 0.01122 445 Western Alliance Bancorp USD 5 127 251 5 025 143 0.19
35 704 Willscot Corp. USD 359 386 395 957 0.0130 928 Wingstop, Inc. USD 2 245 203 2 351 456 0.09
1 478 Winnebago Industries, Inc. USD 45 712 46 040 0.00146 866 Wintrust Financial Corp. USD 10 519 721 9 888 488 0.37
33 299 Wix.com Ltd. USD 3 800 556 4 023 518 0.15118 452 Wolverine World Wide, Inc. USD 4 209 535 4 232 290 0.16
862 World Acceptance Corp. USD 96 333 100 966 0.008 174 WPX Energy, Inc. USD 101 815 107 161 0.00
28 950 WSFS Financial Corp. USD 1 240 065 1 117 470 0.049 935 Xencor, Inc. USD 311 675 308 581 0.013 842 Xeris Pharmaceuticals, Inc. USD 38 303 38 574 0.00
12 734 Yatra Online, Inc. USD 65 128 62 524 0.0083 052 Yext, Inc. USD 1 782 008 1 815 517 0.0716 017 Yum! Brands, Inc. USD 1 589 987 1 598 657 0.0631 042 Zayo Group Hldg., Inc. USD 821 303 882 214 0.03
9 311 ZIOPHARM Oncology, Inc. USD 36 543 35 847 0.00
Total Shares 1 452 597 918 1 470 249 299 54.26
Warrants6 755 Alta Mesa Resources, Inc. USD 16 467 250 0.00
32 558 Altus Midstream Co. - A USD 50 465 17 907 0.0099 430 Churchill Capital Corp. USD 162 646 326 130 0.0133 141 Magnolia Oil & Gas Corp. USD 87 495 112 348 0.0145 959 One Madison Corp. USD 45 959 52 853 0.0029 509 Saban Capital Acquisition Corp. USD 33 935 97 0.0026 757 Sentinel Energy Services, Inc. USD 0 17 660 0.0056 527 Target Hospitality Corp. USD 66 587 87 617 0.00
58 Merrill Lynch Investment Solutions
Merrill Lynch Investment Solutions – Marshall WaceTOPS UCITS Fund (Market Neutral)Schedule of Investments as at March 31, 2019 (cont.)(expressed in USD)
The accompanying notes form an integral part of these financial statements.
Audited annual report

Quantity DescriptionQuotation
CurrencyCostUSD
Marketvalue USD
% of netassets
Transferable securities and money market instruments admitted to an official exchange listing or dealt in on another regulated market (cont.)
Warrants (cont.)19 556 TPG Pace Hldg. Corp. USD 33 318 27 965 0.0026 932 Verra Mobility Corp. USD 53 984 80 796 0.00
Total Warrants 550 856 723 623 0.02
Other transferable securities
Shares15 371 A Schulman, Inc. (a) USD 6 656 6 656 0.00
Total Shares 6 656 6 656 0.00
Warrants158 Kenmare Resources Plc. (a) GBP 0 0 0.00
Total Warrants 0 0 0.00
Total Investments 1 453 155 430 1 470 979 578 54.28
(a) These securities are fair valued. See Notes 2.2.6 and 10.
59Merrill Lynch Investment Solutions
Merrill Lynch Investment Solutions – Marshall WaceTOPS UCITS Fund (Market Neutral)Schedule of Investments as at March 31, 2019 (cont.)(expressed in USD)
The accompanying notes form an integral part of these financial statements.
Audited annual report

Industrial classification of investments(as a percentage of net assets as at March 31, 2019) %
Retail 6.39Software 3.60Apparel 3.34Healthcare-Products 3.19Banks 2.99Oil & Gas 2.52Internet 2.51Commercial Services 2.15Pharmaceuticals 1.89Electronics 1.68Computers 1.62Diversified Financial Services 1.33Engineering & Construction 1.26Electric 1.22REITS 1.17Healthcare-Services 1.16Biotechnology 1.11Gas 1.08Semiconductors 0.99Leisure Time 0.95Media 0.93Insurance 0.77Machinery-Diversified 0.74Food 0.70Entertainment 0.65Transportation 0.65Building Materials 0.59Home Builders 0.57Aerospace/Defense 0.52Lodging 0.51Packaging & Containers 0.49Telecommunications 0.49Real Estate 0.45Oil & Gas Services 0.42Holding Companies-Diversified 0.36Toys/Games/Hobbies 0.35Distribution/Wholesale 0.29Beverages 0.27Airlines 0.26Auto Parts & Equipment 0.22Investment Companies 0.19Miscellaneous Manufacturing 0.15Chemicals 0.14Energy-Alternate Sources 0.14Mining 0.13Coal 0.12Housewares 0.11Machinery-Construction & Mining 0.11Agriculture 0.09Household Products/Wares 0.09Auto Manufacturers 0.08
Industrial classification of investments(as a percentage of net assets as at March 31, 2019) %
Metal Fabricate/Hardware 0.08Cosmetics/Personal Care 0.07Food Service 0.06Storage/Warehousing 0.06Electrical Components & Equipment 0.05Savings & Loans 0.05Shipbuilding 0.04Environmental Control 0.03Forest Products & Paper 0.03Private Equity 0.03Iron/Steel 0.02Office Furnishings 0.02Water 0.01Hand/Machine Tools 0.00Home Furnishings 0.00Multi-National 0.00Pipelines 0.00
54.28Geographical classification of investments(as a percentage of net assets as at March 31, 2019) %
United States 43.16Italy 6.03United Kingdom 0.86Brazil 0.62Canada 0.57Japan 0.52Switzerland 0.45Germany 0.37China 0.31Israel 0.20Mexico 0.17France 0.13Greece 0.13Netherlands 0.11Bahamas 0.10Spain 0.09South Africa 0.07Bermuda 0.05Philippines 0.05Puerto Rico 0.05Argentina 0.04Belgium 0.04Australia 0.02Finland 0.02Ireland 0.02Taiwan 0.02Turkey 0.02Chile 0.01Cyprus 0.01Hong Kong 0.01
60 Merrill Lynch Investment Solutions
Merrill Lynch Investment Solutions – Marshall WaceTOPS UCITS Fund (Market Neutral)Schedule of Investments as at March 31, 2019 (cont.)(expressed in USD)
The accompanying notes form an integral part of these financial statements.
Audited annual report

Geographical classification of investments(as a percentage of net assets as at March 31, 2019) %
Luxembourg 0.01Monaco 0.01Norway 0.01India 0.00Panama 0.00
Geographical classification of investments(as a percentage of net assets as at March 31, 2019) %
Russia 0.00South Korea 0.00
54.28
Underlyingnature
Currencycontract Details Market
Maturitydate
Number ofcontracts
bought
Number ofcontracts
soldCommitment
USD
Unrealisedappreciation/
(depreciation)USD
Futures contractsIndex EUR Amsterdam Index Euronext EQF 18/04/2019 – 7 869 373 (3 621)Index EUR CAC 40 10 Euro Index Euronext Paris 18/04/2019 – 33 2 000 363 (4 988)Index EUR DAX Index Eurex Deutschland 21/06/2019 – 2 657 064 (3 503)Index EUR Euro Stoxx 50 Index Eurex Deutschland 21/06/2019 – 736 27 362 684 (213 922)Index GBP FTSE 100 Index ICE Futures Europe 21/06/2019 – 15 1 416 676 (5 542)
Index USD FTSE China A50 IndexSingapore Exchange(was SIMEX) 29/04/2019 – 2 801 37 617 430 (1 443 544)
Index EUR FTSE MIB Index Borsa Italiana S.P.A 21/06/2019 – 4 471 058 (1 840)
Index HKD Hang Seng IndexHong Kong FuturesExchange 29/04/2019 – 8 1 507 576 (21 916)
Index HKD HSCEI IndexHong Kong FuturesExchange 29/04/2019 – 43 3 168 326 (19 116)
Index EUR IBEX 35 IndexBolsas Y MercadosEspanoles 18/04/2019 – 1 104 407 (157)
Index SGD MSCI Singapore IndexSingapore Exchange(was SIMEX) 29/04/2019 31 – 835 135 1 744
Index USD MSCI Taiwan IndexSingapore Exchange(was SIMEX) 29/04/2019 – 11 432 630 (2 436)
Index USDNasdaq 100 E-MiniIndex
Chicago MercantileExchange 21/06/2019 – 50 7 498 500 (184 390)
Index JPY Nikkei 225 Index Osaka Exchange 13/06/2019 – 2 387 586 5 213Index JPY Nikkei 225 Index Singapore Exchange 13/06/2019 – 6 582 057 (3 742)Index SEK OMXS30 Index NASDAQ OMX Nordic 17/04/2019 – 10 169 186 1 016
Index USD Russell 2000 Mini IndexChicago MercantileExchange 21/06/2019 – 240 18 715 200 (149 845)
Index USDS&P 500 AnnualDividend Index
Chicago MercantileExchange 17/12/2021 – 4 60 900 1 350
Index USD S&P 500 E-Mini IndexChicago MercantileExchange 21/06/2019 – 179 25 690 975 (48 202)
Index USDS&P E-Mini IndustrialSector Index
Chicago MercantileExchange 21/06/2019 – 8 616 480 (3 360)
Index USDS&P MidCap 400 E-MiniIndex
Chicago MercantileExchange 21/06/2019 – 38 7 322 600 (59 560)
Index CAD S&P TSX 60 Index Montreal Exchange 20/06/2019 – 7 1 011 999 766
Index USD SGX Nifty 50 IndexSingapore Exchange(was SIMEX) 25/04/2019 – 118 2 769 224 (48 443)
Index AUD SPI 200 IndexAustralian StockExchange 20/06/2019 10 – 1 101 753 4 791
Total Futures contracts 142 369 182 (2 203 247)
61Merrill Lynch Investment Solutions
Merrill Lynch Investment Solutions – Marshall WaceTOPS UCITS Fund (Market Neutral)Schedule of Investments as at March 31, 2019 (cont.)(expressed in USD)
The accompanying notes form an integral part of these financial statements.
Audited annual report
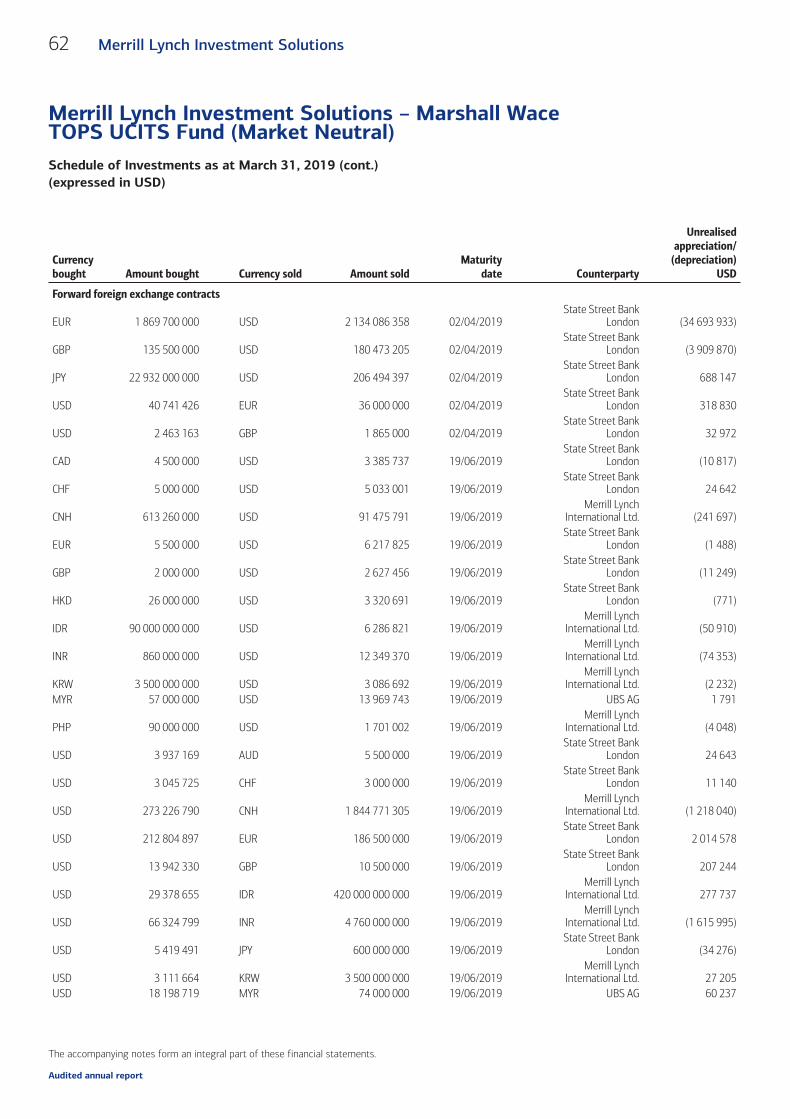
Currencybought Amount bought Currency sold Amount sold
Maturitydate Counterparty
Unrealisedappreciation/
(depreciation)USD
Forward foreign exchange contracts
EUR 1 869 700 000 USD 2 134 086 358 02/04/2019State Street Bank
London (34 693 933)
GBP 135 500 000 USD 180 473 205 02/04/2019State Street Bank
London (3 909 870)
JPY 22 932 000 000 USD 206 494 397 02/04/2019State Street Bank
London 688 147
USD 40 741 426 EUR 36 000 000 02/04/2019State Street Bank
London 318 830
USD 2 463 163 GBP 1 865 000 02/04/2019State Street Bank
London 32 972
CAD 4 500 000 USD 3 385 737 19/06/2019State Street Bank
London (10 817)
CHF 5 000 000 USD 5 033 001 19/06/2019State Street Bank
London 24 642
CNH 613 260 000 USD 91 475 791 19/06/2019Merrill Lynch
International Ltd. (241 697)
EUR 5 500 000 USD 6 217 825 19/06/2019State Street Bank
London (1 488)
GBP 2 000 000 USD 2 627 456 19/06/2019State Street Bank
London (11 249)
HKD 26 000 000 USD 3 320 691 19/06/2019State Street Bank
London (771)
IDR 90 000 000 000 USD 6 286 821 19/06/2019Merrill Lynch
International Ltd. (50 910)
INR 860 000 000 USD 12 349 370 19/06/2019Merrill Lynch
International Ltd. (74 353)
KRW 3 500 000 000 USD 3 086 692 19/06/2019Merrill Lynch
International Ltd. (2 232)MYR 57 000 000 USD 13 969 743 19/06/2019 UBS AG 1 791
PHP 90 000 000 USD 1 701 002 19/06/2019Merrill Lynch
International Ltd. (4 048)
USD 3 937 169 AUD 5 500 000 19/06/2019State Street Bank
London 24 643
USD 3 045 725 CHF 3 000 000 19/06/2019State Street Bank
London 11 140
USD 273 226 790 CNH 1 844 771 305 19/06/2019Merrill Lynch
International Ltd. (1 218 040)
USD 212 804 897 EUR 186 500 000 19/06/2019State Street Bank
London 2 014 578
USD 13 942 330 GBP 10 500 000 19/06/2019State Street Bank
London 207 244
USD 29 378 655 IDR 420 000 000 000 19/06/2019Merrill Lynch
International Ltd. 277 737
USD 66 324 799 INR 4 760 000 000 19/06/2019Merrill Lynch
International Ltd. (1 615 995)
USD 5 419 491 JPY 600 000 000 19/06/2019State Street Bank
London (34 276)
USD 3 111 664 KRW 3 500 000 000 19/06/2019Merrill Lynch
International Ltd. 27 205USD 18 198 719 MYR 74 000 000 19/06/2019 UBS AG 60 237
62 Merrill Lynch Investment Solutions
Merrill Lynch Investment Solutions – Marshall WaceTOPS UCITS Fund (Market Neutral)Schedule of Investments as at March 31, 2019 (cont.)(expressed in USD)
The accompanying notes form an integral part of these financial statements.
Audited annual report
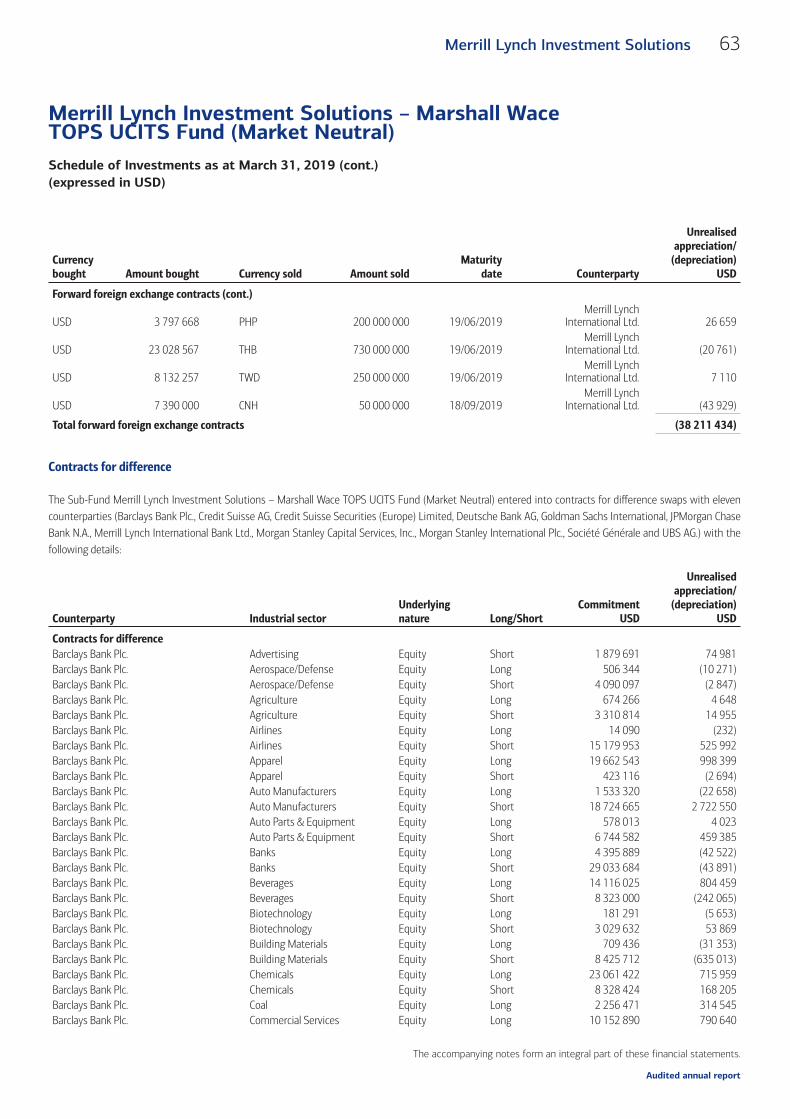
Currencybought Amount bought Currency sold Amount sold
Maturitydate Counterparty
Unrealisedappreciation/
(depreciation)USD
Forward foreign exchange contracts (cont.)
USD 3 797 668 PHP 200 000 000 19/06/2019Merrill Lynch
International Ltd. 26 659
USD 23 028 567 THB 730 000 000 19/06/2019Merrill Lynch
International Ltd. (20 761)
USD 8 132 257 TWD 250 000 000 19/06/2019Merrill Lynch
International Ltd. 7 110
USD 7 390 000 CNH 50 000 000 18/09/2019Merrill Lynch
International Ltd. (43 929)
Total forward foreign exchange contracts (38 211 434)
Contracts for difference
The Sub-Fund Merrill Lynch Investment Solutions – Marshall Wace TOPS UCITS Fund (Market Neutral) entered into contracts for difference swaps with elevencounterparties (Barclays Bank Plc., Credit Suisse AG, Credit Suisse Securities (Europe) Limited, Deutsche Bank AG, Goldman Sachs International, JPMorgan ChaseBank N.A., Merrill Lynch International Bank Ltd., Morgan Stanley Capital Services, Inc., Morgan Stanley International Plc., Société Générale and UBS AG.) with thefollowing details:
Counterparty Industrial sectorUnderlyingnature Long/Short
CommitmentUSD
Unrealisedappreciation/
(depreciation)USD
Contracts for differenceBarclays Bank Plc. Advertising Equity Short 1 879 691 74 981Barclays Bank Plc. Aerospace/Defense Equity Long 506 344 (10 271)Barclays Bank Plc. Aerospace/Defense Equity Short 4 090 097 (2 847)Barclays Bank Plc. Agriculture Equity Long 674 266 4 648Barclays Bank Plc. Agriculture Equity Short 3 310 814 14 955Barclays Bank Plc. Airlines Equity Long 14 090 (232)Barclays Bank Plc. Airlines Equity Short 15 179 953 525 992Barclays Bank Plc. Apparel Equity Long 19 662 543 998 399Barclays Bank Plc. Apparel Equity Short 423 116 (2 694)Barclays Bank Plc. Auto Manufacturers Equity Long 1 533 320 (22 658)Barclays Bank Plc. Auto Manufacturers Equity Short 18 724 665 2 722 550Barclays Bank Plc. Auto Parts & Equipment Equity Long 578 013 4 023Barclays Bank Plc. Auto Parts & Equipment Equity Short 6 744 582 459 385Barclays Bank Plc. Banks Equity Long 4 395 889 (42 522)Barclays Bank Plc. Banks Equity Short 29 033 684 (43 891)Barclays Bank Plc. Beverages Equity Long 14 116 025 804 459Barclays Bank Plc. Beverages Equity Short 8 323 000 (242 065)Barclays Bank Plc. Biotechnology Equity Long 181 291 (5 653)Barclays Bank Plc. Biotechnology Equity Short 3 029 632 53 869Barclays Bank Plc. Building Materials Equity Long 709 436 (31 353)Barclays Bank Plc. Building Materials Equity Short 8 425 712 (635 013)Barclays Bank Plc. Chemicals Equity Long 23 061 422 715 959Barclays Bank Plc. Chemicals Equity Short 8 328 424 168 205Barclays Bank Plc. Coal Equity Long 2 256 471 314 545Barclays Bank Plc. Commercial Services Equity Long 10 152 890 790 640
63Merrill Lynch Investment Solutions
Merrill Lynch Investment Solutions – Marshall WaceTOPS UCITS Fund (Market Neutral)Schedule of Investments as at March 31, 2019 (cont.)(expressed in USD)
The accompanying notes form an integral part of these financial statements.
Audited annual report

Counterparty Industrial sectorUnderlyingnature Long/Short
CommitmentUSD
Unrealisedappreciation/
(depreciation)USD
Contracts for difference (cont.)Barclays Bank Plc. Commercial Services Equity Short 535 729 (14 855)Barclays Bank Plc. Computers Equity Long 7 753 298 (189 344)Barclays Bank Plc. Cosmetics/Personal Care Equity Short 1 399 812 (37 702)Barclays Bank Plc. Distribution/Wholesale Equity Long 578 621 (2 975)Barclays Bank Plc. Distribution/Wholesale Equity Short 129 617 (10 957)Barclays Bank Plc. Diversified Financial Services Equity Long 7 288 196 (38 589)Barclays Bank Plc. Diversified Financial Services Equity Short 13 761 554 523 257Barclays Bank Plc. Electric Equity Long 1 881 804 (21 354)Barclays Bank Plc. Electric Equity Short 3 840 206 (116 926)Barclays Bank Plc. Electrical Components &
EquipmentEquity Long 10 575 752 (388 287)
Barclays Bank Plc. Electrical Components &Equipment
Equity Short 677 689 8 157
Barclays Bank Plc. Electronics Equity Long 12 913 939 (137 683)Barclays Bank Plc. Electronics Equity Short 5 261 053 23 199Barclays Bank Plc. Energy-Alternate Sources Equity Short 3 799 269 (1 355 590)Barclays Bank Plc. Engineering & Construction Equity Long 8 080 862 715 045Barclays Bank Plc. Engineering & Construction Equity Short 12 160 612 (1 538 503)Barclays Bank Plc. Entertainment Equity Short 1 263 995 (70 929)Barclays Bank Plc. Food Equity Long 469 407 (1 998)Barclays Bank Plc. Food Equity Short 13 108 801 (264 643)Barclays Bank Plc. Food Service Equity Long 269 198 46Barclays Bank Plc. Food Service Equity Short 82 368 (4 459)Barclays Bank Plc. Forest Products & Paper Equity Long 5 639 613 (59 871)Barclays Bank Plc. Forest Products & Paper Equity Short 579 245 24 949Barclays Bank Plc. Gas Equity Short 1 481 392 115 185Barclays Bank Plc. Hand/Machine Tools Equity Short 1 582 126 (11 195)Barclays Bank Plc. Healthcare-Products Equity Long 12 779 984 168 543Barclays Bank Plc. Healthcare-Products Equity Short 922 119 39 898Barclays Bank Plc. Healthcare-Services Equity Long 1 448 639 13 293Barclays Bank Plc. Healthcare-Services Equity Short 2 174 000 106 756Barclays Bank Plc. Home Builders Equity Long 1 652 482 2 760Barclays Bank Plc. Home Builders Equity Short 38 648 7 315Barclays Bank Plc. Home Furnishings Equity Long 1 071 661 14 011Barclays Bank Plc. Insurance Equity Long 17 455 243 242 105Barclays Bank Plc. Insurance Equity Short 197 145 (4 447)Barclays Bank Plc. Internet Equity Long 3 983 760 224 781Barclays Bank Plc. Internet Equity Short 13 949 762 1 167 407Barclays Bank Plc. Investment Companies Equity Short 579 928 215Barclays Bank Plc. Iron/Steel Equity Long 4 219 755 511 094Barclays Bank Plc. Iron/Steel Equity Short 211 844 2 751Barclays Bank Plc. Leisure Time Equity Long 1 153 118 18 916Barclays Bank Plc. Leisure Time Equity Short 156 264 (2 257)Barclays Bank Plc. Lodging Equity Long 359 279 (16 928)Barclays Bank Plc. Lodging Equity Short 4 870 992 (93 782)Barclays Bank Plc. Machinery-Construction &
MiningEquity Short 3 325 060 98 914
Barclays Bank Plc. Machinery-Diversified Equity Long 1 635 188 20 692
64 Merrill Lynch Investment Solutions
Merrill Lynch Investment Solutions – Marshall WaceTOPS UCITS Fund (Market Neutral)Schedule of Investments as at March 31, 2019 (cont.)(expressed in USD)
The accompanying notes form an integral part of these financial statements.
Audited annual report
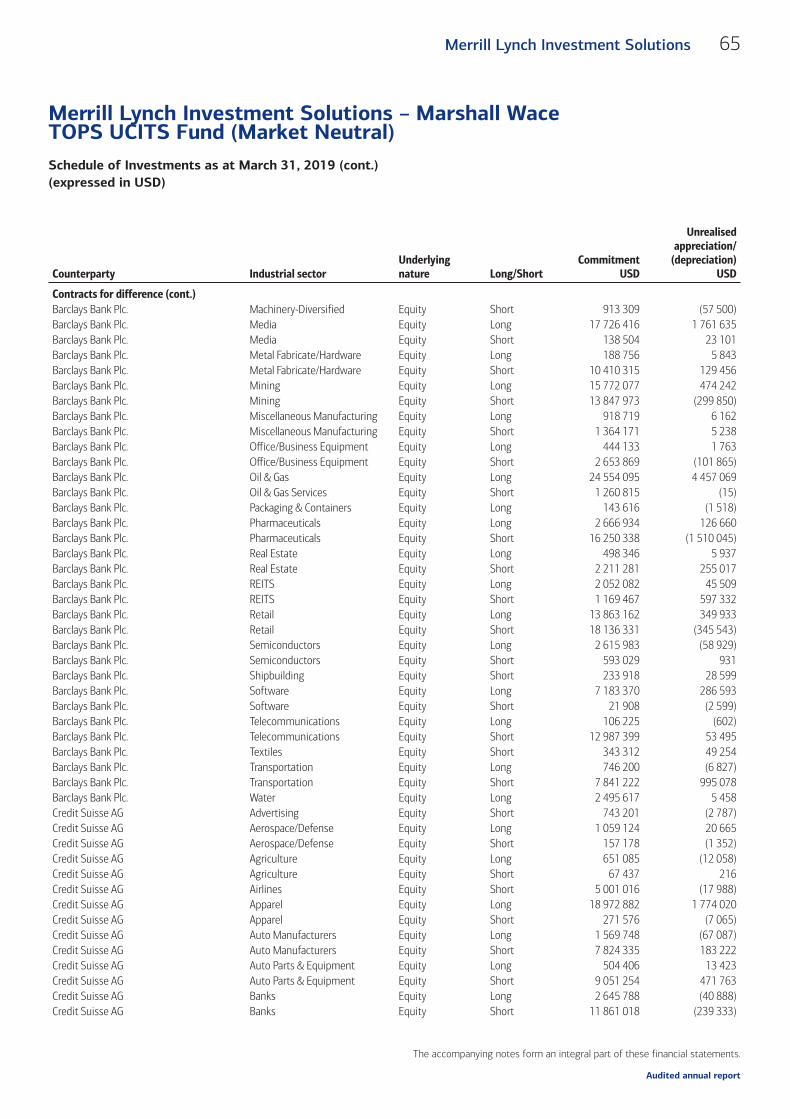
Counterparty Industrial sectorUnderlyingnature Long/Short
CommitmentUSD
Unrealisedappreciation/
(depreciation)USD
Contracts for difference (cont.)Barclays Bank Plc. Machinery-Diversified Equity Short 913 309 (57 500)Barclays Bank Plc. Media Equity Long 17 726 416 1 761 635Barclays Bank Plc. Media Equity Short 138 504 23 101Barclays Bank Plc. Metal Fabricate/Hardware Equity Long 188 756 5 843Barclays Bank Plc. Metal Fabricate/Hardware Equity Short 10 410 315 129 456Barclays Bank Plc. Mining Equity Long 15 772 077 474 242Barclays Bank Plc. Mining Equity Short 13 847 973 (299 850)Barclays Bank Plc. Miscellaneous Manufacturing Equity Long 918 719 6 162Barclays Bank Plc. Miscellaneous Manufacturing Equity Short 1 364 171 5 238Barclays Bank Plc. Office/Business Equipment Equity Long 444 133 1 763Barclays Bank Plc. Office/Business Equipment Equity Short 2 653 869 (101 865)Barclays Bank Plc. Oil & Gas Equity Long 24 554 095 4 457 069Barclays Bank Plc. Oil & Gas Services Equity Short 1 260 815 (15)Barclays Bank Plc. Packaging & Containers Equity Long 143 616 (1 518)Barclays Bank Plc. Pharmaceuticals Equity Long 2 666 934 126 660Barclays Bank Plc. Pharmaceuticals Equity Short 16 250 338 (1 510 045)Barclays Bank Plc. Real Estate Equity Long 498 346 5 937Barclays Bank Plc. Real Estate Equity Short 2 211 281 255 017Barclays Bank Plc. REITS Equity Long 2 052 082 45 509Barclays Bank Plc. REITS Equity Short 1 169 467 597 332Barclays Bank Plc. Retail Equity Long 13 863 162 349 933Barclays Bank Plc. Retail Equity Short 18 136 331 (345 543)Barclays Bank Plc. Semiconductors Equity Long 2 615 983 (58 929)Barclays Bank Plc. Semiconductors Equity Short 593 029 931Barclays Bank Plc. Shipbuilding Equity Short 233 918 28 599Barclays Bank Plc. Software Equity Long 7 183 370 286 593Barclays Bank Plc. Software Equity Short 21 908 (2 599)Barclays Bank Plc. Telecommunications Equity Long 106 225 (602)Barclays Bank Plc. Telecommunications Equity Short 12 987 399 53 495Barclays Bank Plc. Textiles Equity Short 343 312 49 254Barclays Bank Plc. Transportation Equity Long 746 200 (6 827)Barclays Bank Plc. Transportation Equity Short 7 841 222 995 078Barclays Bank Plc. Water Equity Long 2 495 617 5 458Credit Suisse AG Advertising Equity Short 743 201 (2 787)Credit Suisse AG Aerospace/Defense Equity Long 1 059 124 20 665Credit Suisse AG Aerospace/Defense Equity Short 157 178 (1 352)Credit Suisse AG Agriculture Equity Long 651 085 (12 058)Credit Suisse AG Agriculture Equity Short 67 437 216Credit Suisse AG Airlines Equity Short 5 001 016 (17 988)Credit Suisse AG Apparel Equity Long 18 972 882 1 774 020Credit Suisse AG Apparel Equity Short 271 576 (7 065)Credit Suisse AG Auto Manufacturers Equity Long 1 569 748 (67 087)Credit Suisse AG Auto Manufacturers Equity Short 7 824 335 183 222Credit Suisse AG Auto Parts & Equipment Equity Long 504 406 13 423Credit Suisse AG Auto Parts & Equipment Equity Short 9 051 254 471 763Credit Suisse AG Banks Equity Long 2 645 788 (40 888)Credit Suisse AG Banks Equity Short 11 861 018 (239 333)
65Merrill Lynch Investment Solutions
Merrill Lynch Investment Solutions – Marshall WaceTOPS UCITS Fund (Market Neutral)Schedule of Investments as at March 31, 2019 (cont.)(expressed in USD)
The accompanying notes form an integral part of these financial statements.
Audited annual report
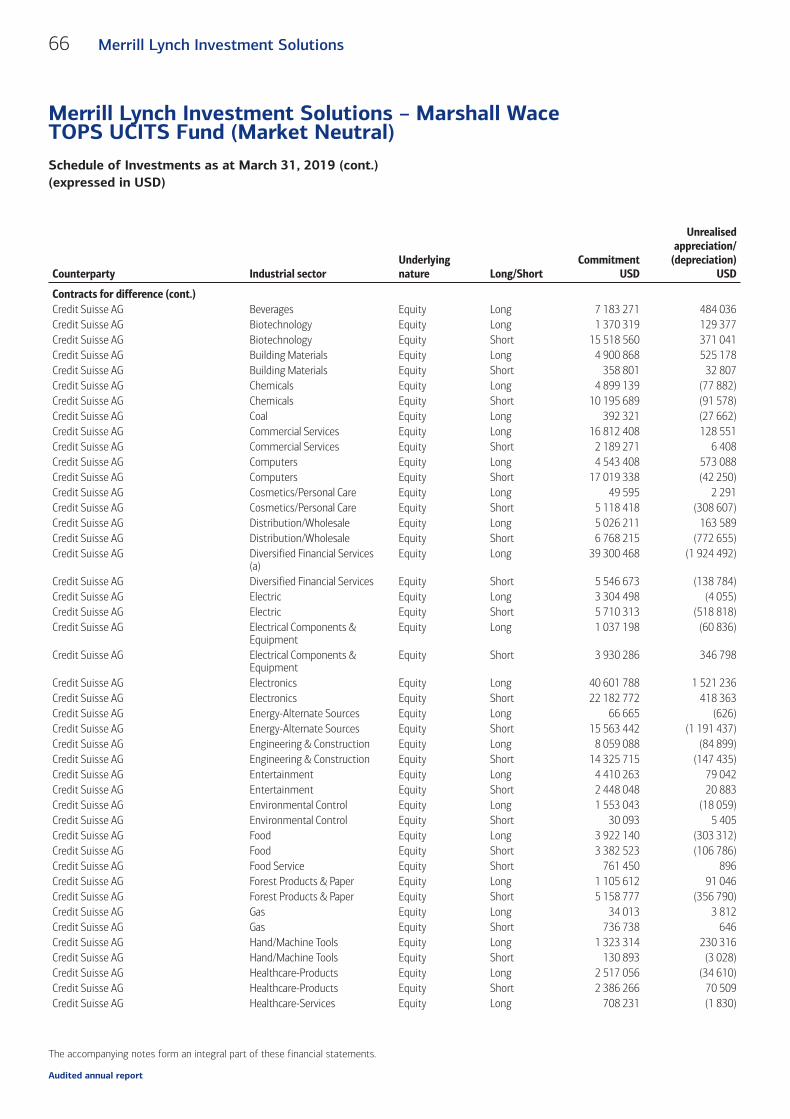
Counterparty Industrial sectorUnderlyingnature Long/Short
CommitmentUSD
Unrealisedappreciation/
(depreciation)USD
Contracts for difference (cont.)Credit Suisse AG Beverages Equity Long 7 183 271 484 036Credit Suisse AG Biotechnology Equity Long 1 370 319 129 377Credit Suisse AG Biotechnology Equity Short 15 518 560 371 041Credit Suisse AG Building Materials Equity Long 4 900 868 525 178Credit Suisse AG Building Materials Equity Short 358 801 32 807Credit Suisse AG Chemicals Equity Long 4 899 139 (77 882)Credit Suisse AG Chemicals Equity Short 10 195 689 (91 578)Credit Suisse AG Coal Equity Long 392 321 (27 662)Credit Suisse AG Commercial Services Equity Long 16 812 408 128 551Credit Suisse AG Commercial Services Equity Short 2 189 271 6 408Credit Suisse AG Computers Equity Long 4 543 408 573 088Credit Suisse AG Computers Equity Short 17 019 338 (42 250)Credit Suisse AG Cosmetics/Personal Care Equity Long 49 595 2 291Credit Suisse AG Cosmetics/Personal Care Equity Short 5 118 418 (308 607)Credit Suisse AG Distribution/Wholesale Equity Long 5 026 211 163 589Credit Suisse AG Distribution/Wholesale Equity Short 6 768 215 (772 655)Credit Suisse AG Diversified Financial Services
(a)Equity Long 39 300 468 (1 924 492)
Credit Suisse AG Diversified Financial Services Equity Short 5 546 673 (138 784)Credit Suisse AG Electric Equity Long 3 304 498 (4 055)Credit Suisse AG Electric Equity Short 5 710 313 (518 818)Credit Suisse AG Electrical Components &
EquipmentEquity Long 1 037 198 (60 836)
Credit Suisse AG Electrical Components &Equipment
Equity Short 3 930 286 346 798
Credit Suisse AG Electronics Equity Long 40 601 788 1 521 236Credit Suisse AG Electronics Equity Short 22 182 772 418 363Credit Suisse AG Energy-Alternate Sources Equity Long 66 665 (626)Credit Suisse AG Energy-Alternate Sources Equity Short 15 563 442 (1 191 437)Credit Suisse AG Engineering & Construction Equity Long 8 059 088 (84 899)Credit Suisse AG Engineering & Construction Equity Short 14 325 715 (147 435)Credit Suisse AG Entertainment Equity Long 4 410 263 79 042Credit Suisse AG Entertainment Equity Short 2 448 048 20 883Credit Suisse AG Environmental Control Equity Long 1 553 043 (18 059)Credit Suisse AG Environmental Control Equity Short 30 093 5 405Credit Suisse AG Food Equity Long 3 922 140 (303 312)Credit Suisse AG Food Equity Short 3 382 523 (106 786)Credit Suisse AG Food Service Equity Short 761 450 896Credit Suisse AG Forest Products & Paper Equity Long 1 105 612 91 046Credit Suisse AG Forest Products & Paper Equity Short 5 158 777 (356 790)Credit Suisse AG Gas Equity Long 34 013 3 812Credit Suisse AG Gas Equity Short 736 738 646Credit Suisse AG Hand/Machine Tools Equity Long 1 323 314 230 316Credit Suisse AG Hand/Machine Tools Equity Short 130 893 (3 028)Credit Suisse AG Healthcare-Products Equity Long 2 517 056 (34 610)Credit Suisse AG Healthcare-Products Equity Short 2 386 266 70 509Credit Suisse AG Healthcare-Services Equity Long 708 231 (1 830)
66 Merrill Lynch Investment Solutions
Merrill Lynch Investment Solutions – Marshall WaceTOPS UCITS Fund (Market Neutral)Schedule of Investments as at March 31, 2019 (cont.)(expressed in USD)
The accompanying notes form an integral part of these financial statements.
Audited annual report

Counterparty Industrial sectorUnderlyingnature Long/Short
CommitmentUSD
Unrealisedappreciation/
(depreciation)USD
Contracts for difference (cont.)Credit Suisse AG Holding
Companies-DiversifiedEquity Long 782 234 26 829
Credit Suisse AG Home Builders Equity Long 23 726 316 (1 164 709)Credit Suisse AG Home Furnishings Equity Long 12 745 315 233 908Credit Suisse AG Home Furnishings Equity Short 163 246 6 720Credit Suisse AG Household Products/Wares Equity Long 1 138 836 23 451Credit Suisse AG Household Products/Wares Equity Short 196 620 6 562Credit Suisse AG Insurance Equity Long 5 426 030 43 356Credit Suisse AG Insurance Equity Short 126 741 (526)Credit Suisse AG Internet Equity Long 10 411 756 851 910Credit Suisse AG Internet Equity Short 29 314 355 342 809Credit Suisse AG Investment Companies Equity Short 811 158 (6 377)Credit Suisse AG Iron/Steel Equity Long 5 194 493 (129 053)Credit Suisse AG Iron/Steel Equity Short 6 363 155 451 773Credit Suisse AG Leisure Time Equity Long 6 992 349 906 458Credit Suisse AG Leisure Time Equity Short 596 859 12 440Credit Suisse AG Lodging Equity Short 13 277 071 (91 174)Credit Suisse AG Machinery-Construction &
MiningEquity Long 1 190 295 (98 547)
Credit Suisse AG Machinery-Construction &Mining
Equity Short 77 781 5 930
Credit Suisse AG Machinery-Diversified Equity Long 22 485 971Credit Suisse AG Machinery-Diversified Equity Short 5 149 968 (213 356)Credit Suisse AG Media Equity Short 6 634 048 (1 079 159)Credit Suisse AG Metal Fabricate/Hardware Equity Long 1 199 271 74 774Credit Suisse AG Metal Fabricate/Hardware Equity Short 3 578 688 (161 413)Credit Suisse AG Mining Equity Long 13 484 490 430 551Credit Suisse AG Mining Equity Short 3 732 857 121 613Credit Suisse AG Miscellaneous Manufacturing Equity Long 3 203 624 (348 331)Credit Suisse AG Miscellaneous Manufacturing Equity Short 1 831 825 11 801Credit Suisse AG Oil & Gas Equity Long 6 070 475 137 531Credit Suisse AG Oil & Gas Equity Short 9 189 272 179 894Credit Suisse AG Oil & Gas Services Equity Long 2 471 860 372 720Credit Suisse AG Oil & Gas Services Equity Short 14 149 (753)Credit Suisse AG Packaging & Containers Equity Long 952 273 9 371Credit Suisse AG Packaging & Containers Equity Short 1 271 464 (6 110)Credit Suisse AG Pharmaceuticals Equity Long 16 184 629 185 110Credit Suisse AG Pharmaceuticals Equity Short 21 602 122 937 268Credit Suisse AG Pipelines Equity Long 69 441 (3 471)Credit Suisse AG Pipelines Equity Short 344 770 (49 225)Credit Suisse AG Private Equity Equity Long 13 655 902 1 978 663Credit Suisse AG Real Estate Equity Long 18 274 097 1 299 180Credit Suisse AG Real Estate Equity Short 2 483 132 (87 105)Credit Suisse AG REITS Equity Short 1 825 453 21 337Credit Suisse AG Retail Equity Long 13 298 225 602 466Credit Suisse AG Retail Equity Short 20 657 657 (794 255)Credit Suisse AG Savings & Loans Equity Short 82 487 108Credit Suisse AG Semiconductors Equity Long 79 459 014 566 604
67Merrill Lynch Investment Solutions
Merrill Lynch Investment Solutions – Marshall WaceTOPS UCITS Fund (Market Neutral)Schedule of Investments as at March 31, 2019 (cont.)(expressed in USD)
The accompanying notes form an integral part of these financial statements.
Audited annual report

Counterparty Industrial sectorUnderlyingnature Long/Short
CommitmentUSD
Unrealisedappreciation/
(depreciation)USD
Contracts for difference (cont.)Credit Suisse AG Semiconductors Equity Short 15 525 571 (151 169)Credit Suisse AG Shipbuilding Equity Short 6 136 750 677 555Credit Suisse AG Software Equity Long 3 304 385 260 594Credit Suisse AG Software Equity Short 18 026 941 (1 692 661)Credit Suisse AG Telecommunications Equity Long 5 589 689 201 254Credit Suisse AG Telecommunications Equity Short 23 543 320 139 959Credit Suisse AG Transportation Equity Long 716 651 18 820Credit Suisse AG Transportation Equity Short 24 556 223 124 922Credit Suisse AG Water Equity Long 239 203 806Credit Suisse Securities (Europe) Limited Aerospace/Defense Equity Short 70 755 1 105Credit Suisse Securities (Europe) Limited Agriculture Equity Short 31 343 (12)Credit Suisse Securities (Europe) Limited Airlines Equity Short 9 (1)Credit Suisse Securities (Europe) Limited Auto Manufacturers Equity Short 2 560 030 49 675Credit Suisse Securities (Europe) Limited Auto Parts & Equipment Equity Short 46 027 215Credit Suisse Securities (Europe) Limited Banks Equity Short 125 (10)Credit Suisse Securities (Europe) Limited Building Materials Equity Long 16 -Credit Suisse Securities (Europe) Limited Building Materials Equity Short 172 (28)Credit Suisse Securities (Europe) Limited Chemicals Equity Short 717 915 43 772Credit Suisse Securities (Europe) Limited Coal Equity Short 154 146 (1 280)Credit Suisse Securities (Europe) Limited Commercial Services Equity Short 1 631 (312)Credit Suisse Securities (Europe) Limited Computers Equity Short 518 497 7 285Credit Suisse Securities (Europe) Limited Diversified Financial Services Equity Short 264 420 (29 703)Credit Suisse Securities (Europe) Limited Electric Equity Short 82 486 (1 699)Credit Suisse Securities (Europe) Limited Electrical Components &
EquipmentEquity Short 73 950 2 786
Credit Suisse Securities (Europe) Limited Electronics Equity Short 1 376 558 (184 229)Credit Suisse Securities (Europe) Limited Energy-Alternate Sources Equity Short 4 -Credit Suisse Securities (Europe) Limited Entertainment Equity Short 15 290 (1 427)Credit Suisse Securities (Europe) Limited Environmental Control Equity Short 21 943 950Credit Suisse Securities (Europe) Limited Food Equity Short 46 329 (696)Credit Suisse Securities (Europe) Limited Future Index Derivatives Long 1 700 511 109 282Credit Suisse Securities (Europe) Limited Future Index Derivatives Short 305 259 1 657Credit Suisse Securities (Europe) Limited Healthcare-Services Equity Short 535 (105)Credit Suisse Securities (Europe) Limited Home Furnishings Equity Short 196 719 2 965Credit Suisse Securities (Europe) Limited Insurance Equity Short 13 1Credit Suisse Securities (Europe) Limited Internet Equity Short 19 353 (579)Credit Suisse Securities (Europe) Limited Iron/Steel Equity Short 398 205 1 925Credit Suisse Securities (Europe) Limited Machinery-Diversified Equity Short 78 829 (5 925)Credit Suisse Securities (Europe) Limited Media Equity Short 108 806 5 921Credit Suisse Securities (Europe) Limited Metal Fabricate/Hardware Equity Short 50 371 383Credit Suisse Securities (Europe) Limited Mining Equity Short 892 369 34 566Credit Suisse Securities (Europe) Limited Miscellaneous Manufacturing Equity Short 293 099 3 366Credit Suisse Securities (Europe) Limited Oil & Gas Equity Short 3 -Credit Suisse Securities (Europe) Limited Pharmaceuticals Equity Short 809 558 (52 499)Credit Suisse Securities (Europe) Limited Real Estate Equity Short 94 326 (3 280)Credit Suisse Securities (Europe) Limited Semiconductors Equity Short 31 (1)Credit Suisse Securities (Europe) Limited Shipbuilding Equity Short 81 514 (5 133)
68 Merrill Lynch Investment Solutions
Merrill Lynch Investment Solutions – Marshall WaceTOPS UCITS Fund (Market Neutral)Schedule of Investments as at March 31, 2019 (cont.)(expressed in USD)
The accompanying notes form an integral part of these financial statements.
Audited annual report

Counterparty Industrial sectorUnderlyingnature Long/Short
CommitmentUSD
Unrealisedappreciation/
(depreciation)USD
Contracts for difference (cont.)Credit Suisse Securities (Europe) Limited Software Equity Short 728 782 (64 052)Credit Suisse Securities (Europe) Limited Telecommunications Equity Short 242 565 (5 722)Credit Suisse Securities (Europe) Limited Transportation Equity Short 4 -Credit Suisse Securities (Europe) Limited Water Equity Short 29 (2)Deutsche Bank AG Advertising (a) Equity Long 3 009 -Deutsche Bank AG Advertising Equity Short 1 592 334 (55 335)Deutsche Bank AG Agriculture Equity Long 470 289 (193)Deutsche Bank AG Agriculture Equity Short 44 220 144Deutsche Bank AG Airlines Equity Short 4 054 526 428 831Deutsche Bank AG Apparel Equity Long 9 004 589 381 793Deutsche Bank AG Apparel Equity Short 171 604 (10 426)Deutsche Bank AG Auto Manufacturers Equity Long 1 184 638 (165 768)Deutsche Bank AG Auto Manufacturers Equity Short 8 405 605 (61 465)Deutsche Bank AG Auto Parts & Equipment Equity Long 1 266 177 (1 269)Deutsche Bank AG Auto Parts & Equipment Equity Short 13 677 493 338 498Deutsche Bank AG Banks Equity Long 4 227 296 32 630Deutsche Bank AG Banks Equity Short 44 291 152 2 093 127Deutsche Bank AG Beverages Equity Long 89 082 3 566Deutsche Bank AG Beverages Equity Short 143 244 (625)Deutsche Bank AG Biotechnology Equity Long 742 214 5 692Deutsche Bank AG Biotechnology Equity Short 2 512 917 (32 805)Deutsche Bank AG Building Materials Equity Long 2 479 922 15 125Deutsche Bank AG Building Materials Equity Short 4 868 305 177Deutsche Bank AG Chemicals Equity Long 123 127 (4 330)Deutsche Bank AG Chemicals Equity Short 14 705 724 (1 041 164)Deutsche Bank AG Coal Equity Long 1 789 496 7 327Deutsche Bank AG Commercial Services Equity Long 13 628 171 620 107Deutsche Bank AG Commercial Services Equity Short 6 772 093 (112 006)Deutsche Bank AG Computers Equity Long 8 558 024 151 196Deutsche Bank AG Computers Equity Short 930 729 4 093Deutsche Bank AG Cosmetics/Personal Care Equity Long 1 203 198 (15 684)Deutsche Bank AG Cosmetics/Personal Care Equity Short 3 456 451 (127 971)Deutsche Bank AG Distribution/Wholesale Equity Long 2 658 107 26 954Deutsche Bank AG Distribution/Wholesale Equity Short 190 380 (935)Deutsche Bank AG Diversified Financial Services Equity Long 9 639 673 (313 422)Deutsche Bank AG Diversified Financial Services Equity Short 3 679 988 (22 338)Deutsche Bank AG Electric Equity Long 1 778 316 (132 586)Deutsche Bank AG Electrical Components &
EquipmentEquity Long 413 706 (2 631)
Deutsche Bank AG Electrical Components &Equipment
Equity Short 453 919 86 561
Deutsche Bank AG Electronics Equity Long 4 179 555 (309 547)Deutsche Bank AG Electronics Equity Short 16 077 535 (532 992)Deutsche Bank AG Energy-Alternate Sources Equity Long 31 895 (1 502)Deutsche Bank AG Engineering & Construction Equity Long 7 096 703 (200 956)Deutsche Bank AG Engineering & Construction Equity Short 1 697 066 76 429Deutsche Bank AG Entertainment Equity Long 3 624 632 670 863
69Merrill Lynch Investment Solutions
Merrill Lynch Investment Solutions – Marshall WaceTOPS UCITS Fund (Market Neutral)Schedule of Investments as at March 31, 2019 (cont.)(expressed in USD)
The accompanying notes form an integral part of these financial statements.
Audited annual report

Counterparty Industrial sectorUnderlyingnature Long/Short
CommitmentUSD
Unrealisedappreciation/
(depreciation)USD
Contracts for difference (cont.)Deutsche Bank AG Entertainment Equity Short 3 931 839 (54 972)Deutsche Bank AG Environmental Control Equity Long 575 347 1 144Deutsche Bank AG Environmental Control Equity Short 20 888 46Deutsche Bank AG Food Equity Long 456 686 84Deutsche Bank AG Food Equity Short 12 053 687 (103 499)Deutsche Bank AG Food Service Equity Long 424 392 (64 464)Deutsche Bank AG Food Service Equity Short 760 499 (25 348)Deutsche Bank AG Hand/Machine Tools Equity Long 464 471 48 730Deutsche Bank AG Hand/Machine Tools Equity Short 3 308 776 (178 300)Deutsche Bank AG Healthcare-Products Equity Long 1 250 513 (29 420)Deutsche Bank AG Healthcare-Products Equity Short 1 651 022 (25 788)Deutsche Bank AG Healthcare-Services Equity Long 2 587 740 (96 704)Deutsche Bank AG Healthcare-Services Equity Short 8 018 160 (705 660)Deutsche Bank AG Holding
Companies-DiversifiedEquity Long 38 644 (770)
Deutsche Bank AG HoldingCompanies-Diversified
Equity Short 299 945 6 882
Deutsche Bank AG Home Builders Equity Long 1 001 364 7 139Deutsche Bank AG Home Builders Equity Short 6 483 730 55 977Deutsche Bank AG Home Furnishings Equity Short 395 745 3 781Deutsche Bank AG Household Products/Wares Equity Long 8 471 665Deutsche Bank AG Household Products/Wares Equity Short 1 313 318 (33 037)Deutsche Bank AG Housewares Equity Long 2 616 386 (43 392)Deutsche Bank AG Insurance Equity Long 12 353 826 36 668Deutsche Bank AG Insurance Equity Short 7 174 514 587 156Deutsche Bank AG Internet Equity Long 10 954 726 325 685Deutsche Bank AG Internet Equity Short 7 811 106 60 185Deutsche Bank AG Investment Companies Equity Short 294 986 15 893Deutsche Bank AG Iron/Steel Equity Short 9 822 683 (648 677)Deutsche Bank AG Leisure Time Equity Long 9 778 621 (111 544)Deutsche Bank AG Lodging Equity Long 163 885 (1 328)Deutsche Bank AG Lodging Equity Short 2 315 288 (5 507)Deutsche Bank AG Machinery-Construction &
MiningEquity Long 482 541 (5 515)
Deutsche Bank AG Machinery-Construction &Mining
Equity Short 890 311 (19 335)
Deutsche Bank AG Machinery-Diversified Equity Long 2 563 441 (86 169)Deutsche Bank AG Machinery-Diversified Equity Short 10 166 186 (26 821)Deutsche Bank AG Media Equity Long 3 925 528 (11 255)Deutsche Bank AG Media Equity Short 1 237 295 43 241Deutsche Bank AG Metal Fabricate/Hardware Equity Long 87 045 (4 209)Deutsche Bank AG Metal Fabricate/Hardware Equity Short 8 166 134 512 446Deutsche Bank AG Mining Equity Long 27 783 403 433 128Deutsche Bank AG Mining Equity Short 6 629 621 (95 439)Deutsche Bank AG Miscellaneous Manufacturing Equity Long 9 766 080 (624 845)Deutsche Bank AG Miscellaneous Manufacturing Equity Short 2 368 280 90 035Deutsche Bank AG Office/Business Equipment Equity Long 1 839 888 12 922Deutsche Bank AG Oil & Gas Equity Long 10 879 505 (22 603)
70 Merrill Lynch Investment Solutions
Merrill Lynch Investment Solutions – Marshall WaceTOPS UCITS Fund (Market Neutral)Schedule of Investments as at March 31, 2019 (cont.)(expressed in USD)
The accompanying notes form an integral part of these financial statements.
Audited annual report

Counterparty Industrial sectorUnderlyingnature Long/Short
CommitmentUSD
Unrealisedappreciation/
(depreciation)USD
Contracts for difference (cont.)Deutsche Bank AG Oil & Gas Equity Short 962 749 12 922Deutsche Bank AG Oil & Gas Services Equity Long 528 116 (36 426)Deutsche Bank AG Packaging & Containers Equity Long 366 617 10 811Deutsche Bank AG Packaging & Containers Equity Short 10 410 027 (202 830)Deutsche Bank AG Pharmaceuticals Equity Long 6 312 482 475 801Deutsche Bank AG Pharmaceuticals Equity Short 1 568 311 (138 643)Deutsche Bank AG Real Estate Equity Long 4 244 203 97 947Deutsche Bank AG Real Estate Equity Short 1 627 133 91 513Deutsche Bank AG REITS Equity Long 586 914 2 395Deutsche Bank AG REITS Equity Short 939 869 9 977Deutsche Bank AG Retail Equity Long 17 915 300 (509 534)Deutsche Bank AG Retail Equity Short 8 223 113 (201 439)Deutsche Bank AG Semiconductors Equity Long 1 857 579 (76 260)Deutsche Bank AG Semiconductors Equity Short 1 845 818 128 946Deutsche Bank AG Shipbuilding Equity Long 38 191 287Deutsche Bank AG Shipbuilding Equity Short 6 603 645Deutsche Bank AG Software (a) Equity Long 23 425 645 (148 091)Deutsche Bank AG Software Equity Short 2 506 817 26 941Deutsche Bank AG Telecommunications Equity Short 17 588 440 (524 409)Deutsche Bank AG Toys/Games/Hobbies Equity Long 7 299 417 247 020Deutsche Bank AG Transportation Equity Long 3 368 656 55 091Deutsche Bank AG Transportation Equity Short 9 475 941 201 640Goldman Sachs International Advertising Equity Long 147 402 (18 843)Goldman Sachs International Advertising Equity Short 952 116 (2 686)Goldman Sachs International Aerospace/Defense Equity Long 1 682 889 6 447Goldman Sachs International Aerospace/Defense Equity Short 2 003 714 (52 125)Goldman Sachs International Agriculture Equity Long 17 655 198 910 672Goldman Sachs International Agriculture Equity Short 9 762 925 (331 381)Goldman Sachs International Airlines Equity Long 6 479 587 (418 328)Goldman Sachs International Airlines Equity Short 10 513 735 219 583Goldman Sachs International Apparel Equity Long 5 890 979 347 357Goldman Sachs International Apparel Equity Short 7 244 496 (260 312)Goldman Sachs International Auto Manufacturers Equity Short 22 684 342 (742 278)Goldman Sachs International Auto Parts & Equipment Equity Long 371 245 (1 149)Goldman Sachs International Auto Parts & Equipment Equity Short 16 438 834 1 237 788Goldman Sachs International Banks Equity Long 3 072 421 (10 387)Goldman Sachs International Banks Equity Short 53 660 136 722 527Goldman Sachs International Beverages Equity Long 21 197 814 639 903Goldman Sachs International Beverages Equity Short 10 302 348 (518 756)Goldman Sachs International Biotechnology Equity Short 52 659 247 (2 361 327)Goldman Sachs International Building Materials Equity Long 5 164 337 109 480Goldman Sachs International Building Materials Equity Short 22 117 692 (2 161 689)Goldman Sachs International Chemicals Equity Long 6 513 973 (140 350)Goldman Sachs International Chemicals Equity Short 19 834 787 1 051 617Goldman Sachs International Coal Equity Long 798 629 2 428Goldman Sachs International Coal Equity Short 90 478 1 087Goldman Sachs International Commercial Services Equity Long 3 619 100 67 724
71Merrill Lynch Investment Solutions
Merrill Lynch Investment Solutions – Marshall WaceTOPS UCITS Fund (Market Neutral)Schedule of Investments as at March 31, 2019 (cont.)(expressed in USD)
The accompanying notes form an integral part of these financial statements.
Audited annual report

Counterparty Industrial sectorUnderlyingnature Long/Short
CommitmentUSD
Unrealisedappreciation/
(depreciation)USD
Contracts for difference (cont.)Goldman Sachs International Commercial Services Equity Short 40 111 373 (128 910)Goldman Sachs International Computers Equity Long 1 151 572 31 996Goldman Sachs International Computers Equity Short 26 126 079 (1 370 823)Goldman Sachs International Cosmetics/Personal Care Equity Long 83 751 1 789Goldman Sachs International Cosmetics/Personal Care Equity Short 11 205 298 (353 094)Goldman Sachs International Distribution/Wholesale Equity Long 455 033 12 986Goldman Sachs International Distribution/Wholesale Equity Short 2 993 018 (289 902)Goldman Sachs International Diversified Financial Services Equity Long 3 669 354 47 812Goldman Sachs International Diversified Financial Services Equity Short 9 161 196 263 569Goldman Sachs International Electric Equity Long 686 098 9 170Goldman Sachs International Electric Equity Short 8 566 424 226 446Goldman Sachs International Electrical Components &
EquipmentEquity Long 784 514 402
Goldman Sachs International Electrical Components &Equipment (a)
Equity Short 3 309 938 22 613
Goldman Sachs International Electronics Equity Long 6 098 284 (164 159)Goldman Sachs International Electronics Equity Short 39 341 032 2 315 947Goldman Sachs International Energy-Alternate Sources Equity Long 101 (6)Goldman Sachs International Energy-Alternate Sources Equity Short 9 051 970 (1 250 936)Goldman Sachs International Engineering & Construction Equity Long 22 528 403 219 017Goldman Sachs International Engineering & Construction Equity Short 22 086 744 2 705 935Goldman Sachs International Entertainment Equity Short 10 032 242 (303 334)Goldman Sachs International Environmental Control Equity Long 1 965 493 (97 412)Goldman Sachs International Environmental Control Equity Short 3 208 177 (373 762)Goldman Sachs International Equity Fund Equity Long 9 032 134 118 007Goldman Sachs International Equity Fund Equity Short 8 944 495 (615 466)Goldman Sachs International Food Equity Long 13 578 720 671 208Goldman Sachs International Food Equity Short 46 683 775 1 508 328Goldman Sachs International Forest Products & Paper Equity Long 5 691 240 (608 847)Goldman Sachs International Forest Products & Paper Equity Short 1 555 444 (7 223)Goldman Sachs International Gas Equity Long 9 427 1 096Goldman Sachs International Gas Equity Short 11 388 108 (491 110)Goldman Sachs International Hand/Machine Tools Equity Long 947 490 36 618Goldman Sachs International Healthcare-Products Equity Long 1 070 802 (15 063)Goldman Sachs International Healthcare-Products Equity Short 4 372 934 274 911Goldman Sachs International Healthcare-Services Equity Long 967 666 93 796Goldman Sachs International Healthcare-Services Equity Short 3 307 361 (121 878)Goldman Sachs International Holding
Companies-DiversifiedEquity Short 2 101 313 (314 754)
Goldman Sachs International Home Builders Equity Long 126 243 2 926Goldman Sachs International Home Builders Equity Short 6 019 931 (15 827)Goldman Sachs International Home Furnishings Equity Long 2 213 913 13 132Goldman Sachs International Home Furnishings Equity Short 3 701 065 163 606Goldman Sachs International Household Products/Wares Equity Short 538 264 (8 960)Goldman Sachs International Housewares Equity Short 10 786 011 (32 420)Goldman Sachs International Insurance Equity Long 65 451 994 2 262 867Goldman Sachs International Insurance Equity Short 22 770 782 (652 974)Goldman Sachs International Internet Equity Long 2 073 735 117 905
72 Merrill Lynch Investment Solutions
Merrill Lynch Investment Solutions – Marshall WaceTOPS UCITS Fund (Market Neutral)Schedule of Investments as at March 31, 2019 (cont.)(expressed in USD)
The accompanying notes form an integral part of these financial statements.
Audited annual report

Counterparty Industrial sectorUnderlyingnature Long/Short
CommitmentUSD
Unrealisedappreciation/
(depreciation)USD
Contracts for difference (cont.)Goldman Sachs International Internet Equity Short 61 384 878 (1 003 001)Goldman Sachs International Iron/Steel Equity Long 3 058 992 (44 784)Goldman Sachs International Iron/Steel Equity Short 7 249 453 289 088Goldman Sachs International Leisure Time Equity Long 5 938 962 (451 115)Goldman Sachs International Leisure Time Equity Short 103 497 2 327Goldman Sachs International Lodging Equity Long 354 947 (5 309)Goldman Sachs International Lodging Equity Short 3 657 231 (43 885)Goldman Sachs International Machinery-Construction &
MiningEquity Long 1 124 595 15 074
Goldman Sachs International Machinery-Construction &Mining
Equity Short 167 867 377 049
Goldman Sachs International Machinery-Diversified Equity Long 1 926 372 109 343Goldman Sachs International Machinery-Diversified Equity Short 15 978 484 (467 157)Goldman Sachs International Media Equity Long 11 987 273 96 728Goldman Sachs International Media Equity Short 2 879 005 (210 161)Goldman Sachs International Metal Fabricate/Hardware Equity Long 2 893 886 160 417Goldman Sachs International Metal Fabricate/Hardware Equity Short 2 988 082 257 658Goldman Sachs International Mining Equity Long 3 071 342 (178 092)Goldman Sachs International Mining Equity Short 51 294 470 (481 288)Goldman Sachs International Miscellaneous Manufacturing Equity Long 92 662 21 330Goldman Sachs International Miscellaneous Manufacturing Equity Short 17 267 369 (437 396)Goldman Sachs International Office/Business Equipment Equity Long 737 866 (12 339)Goldman Sachs International Oil & Gas Equity Long 8 483 682 (174 318)Goldman Sachs International Oil & Gas Equity Short 63 365 365 (270 003)Goldman Sachs International Oil & Gas Services Equity Long 1 970 575 244 966Goldman Sachs International Oil & Gas Services Equity Short 9 386 602 (1 455 293)Goldman Sachs International Packaging & Containers Equity Long 1 344 720 86 352Goldman Sachs International Packaging & Containers Equity Short 1 520 038 (25 865)Goldman Sachs International Pharmaceuticals Equity Long 11 820 309 359 881Goldman Sachs International Pharmaceuticals Equity Short 55 325 760 869 837Goldman Sachs International Pipelines Equity Long 5 831 956 135 230Goldman Sachs International Pipelines Equity Short 16 767 994 (2 562 269)Goldman Sachs International Private Equity Equity Long 1 251 942 18 454Goldman Sachs International Private Equity Equity Short 8 999 093 (296 652)Goldman Sachs International Real Estate Equity Long 21 163 074 518 830Goldman Sachs International Real Estate Equity Short 9 398 027 (1 304 981)Goldman Sachs International REITS Equity Long 4 557 310 257 697Goldman Sachs International REITS Equity Short 37 021 574 (1 122 282)Goldman Sachs International Retail Equity Long 12 373 024 (34 850)Goldman Sachs International Retail Equity Short 99 617 994 (1 205 066)Goldman Sachs International Savings & Loans Equity Short 1 307 863 64 927Goldman Sachs International Semiconductors Equity Long 9 448 100 348 850Goldman Sachs International Semiconductors Equity Short 37 437 886 (31 464)Goldman Sachs International Shipbuilding Equity Long 144 444 20 057Goldman Sachs International Shipbuilding Equity Short 813 053 120 082Goldman Sachs International Software Equity Long 9 557 546 327 537Goldman Sachs International Software Equity Short 39 141 997 (7 719 303)
73Merrill Lynch Investment Solutions
Merrill Lynch Investment Solutions – Marshall WaceTOPS UCITS Fund (Market Neutral)Schedule of Investments as at March 31, 2019 (cont.)(expressed in USD)
The accompanying notes form an integral part of these financial statements.
Audited annual report

Counterparty Industrial sectorUnderlyingnature Long/Short
CommitmentUSD
Unrealisedappreciation/
(depreciation)USD
Contracts for difference (cont.)Goldman Sachs International Telecommunications Equity Long 1 399 606 46 477Goldman Sachs International Telecommunications Equity Short 106 496 478 232 776Goldman Sachs International Textiles Equity Long 9 893 (229)Goldman Sachs International Toys/Games/Hobbies Equity Short 9 544 (548)Goldman Sachs International Transportation Equity Long 1 622 937 (62 786)Goldman Sachs International Transportation Equity Short 30 842 958 1 355 553Goldman Sachs International Trucking & Leasing Equity Short 6 515 027 77 127Goldman Sachs International Water Equity Long 29 -Goldman Sachs International Water Equity Short 3 099 077 (504 798)JPMorgan Chase Bank N.A. Advertising Equity Long 331 072 8 967JPMorgan Chase Bank N.A. Advertising Equity Short 300 829 (406)JPMorgan Chase Bank N.A. Aerospace/Defense Equity Long 874 363 41 577JPMorgan Chase Bank N.A. Aerospace/Defense Equity Short 4 034 572 623 980JPMorgan Chase Bank N.A. Agriculture Equity Long 1 726 435 (32 441)JPMorgan Chase Bank N.A. Agriculture Equity Short 6 373 217 261 998JPMorgan Chase Bank N.A. Airlines Equity Long 4 679 813 151 230JPMorgan Chase Bank N.A. Airlines Equity Short 21 106 355 1 176 527JPMorgan Chase Bank N.A. Apparel Equity Long 4 144 047 643 944JPMorgan Chase Bank N.A. Apparel Equity Short 4 493 430 (211 953)JPMorgan Chase Bank N.A. Auto Manufacturers Equity Long 9 577 191 (42 825)JPMorgan Chase Bank N.A. Auto Manufacturers Equity Short 74 552 678 (3 105 740)JPMorgan Chase Bank N.A. Auto Parts & Equipment Equity Long 2 442 341 (86 665)JPMorgan Chase Bank N.A. Auto Parts & Equipment Equity Short 7 811 347 441 732JPMorgan Chase Bank N.A. Banks Equity Long 18 425 841 (62 979)JPMorgan Chase Bank N.A. Banks Equity Short 84 699 775 3 316 684JPMorgan Chase Bank N.A. Beverages Equity Long 4 626 283 396 243JPMorgan Chase Bank N.A. Beverages Equity Short 7 689 514 (879 233)JPMorgan Chase Bank N.A. Biotechnology Equity Long 2 633 809 159 042JPMorgan Chase Bank N.A. Biotechnology Equity Short 3 907 846 44 952JPMorgan Chase Bank N.A. Building Materials Equity Long 25 480 533 502 830JPMorgan Chase Bank N.A. Building Materials Equity Short 1 477 805 (134 290)JPMorgan Chase Bank N.A. Chemicals Equity Long 15 243 368 53 809JPMorgan Chase Bank N.A. Chemicals Equity Short 10 556 921 (247 302)JPMorgan Chase Bank N.A. Coal Equity Long 41 251 892JPMorgan Chase Bank N.A. Coal Equity Short 28 559 (615)JPMorgan Chase Bank N.A. Commercial Services Equity Long 6 450 940 86 329JPMorgan Chase Bank N.A. Commercial Services Equity Short 8 062 787 (454 632)JPMorgan Chase Bank N.A. Computers Equity Long 4 766 486 89 139JPMorgan Chase Bank N.A. Computers Equity Short 3 365 561 (236 390)JPMorgan Chase Bank N.A. Cosmetics/Personal Care Equity Long 2 994 758 18 966JPMorgan Chase Bank N.A. Cosmetics/Personal Care Equity Short 650 033 (1 411)JPMorgan Chase Bank N.A. Distribution/Wholesale Equity Long 698 186 (23 783)JPMorgan Chase Bank N.A. Distribution/Wholesale Equity Short 20 061 959 (2 900 541)JPMorgan Chase Bank N.A. Diversified Financial Services Equity Long 10 007 548 (46 110)JPMorgan Chase Bank N.A. Diversified Financial Services Equity Short 4 939 949 (80 228)JPMorgan Chase Bank N.A. Electric Equity Long 1 580 904 6 634JPMorgan Chase Bank N.A. Electric Equity Short 7 691 806 (285 904)
74 Merrill Lynch Investment Solutions
Merrill Lynch Investment Solutions – Marshall WaceTOPS UCITS Fund (Market Neutral)Schedule of Investments as at March 31, 2019 (cont.)(expressed in USD)
The accompanying notes form an integral part of these financial statements.
Audited annual report

Counterparty Industrial sectorUnderlyingnature Long/Short
CommitmentUSD
Unrealisedappreciation/
(depreciation)USD
Contracts for difference (cont.)JPMorgan Chase Bank N.A. Electrical Components &
EquipmentEquity Long 843 338 (169 375)
JPMorgan Chase Bank N.A. Electrical Components &Equipment (a)
Equity Short 11 503 936 1 602 344
JPMorgan Chase Bank N.A. Electronics Equity Long 4 623 050 362 070JPMorgan Chase Bank N.A. Electronics Equity Short 14 441 400 (1 617 225)JPMorgan Chase Bank N.A. Energy-Alternate Sources Equity Long 208 338 (6 183)JPMorgan Chase Bank N.A. Energy-Alternate Sources Equity Short 12 783 385 (2 225 721)JPMorgan Chase Bank N.A. Engineering & Construction Equity Long 34 380 297 198 567JPMorgan Chase Bank N.A. Engineering & Construction Equity Short 18 179 031 (41 469)JPMorgan Chase Bank N.A. Entertainment Equity Long 4 903 900 (26 402)JPMorgan Chase Bank N.A. Entertainment Equity Short 4 671 830 35 102JPMorgan Chase Bank N.A. Environmental Control Equity Long 740 565 26 466JPMorgan Chase Bank N.A. Environmental Control Equity Short 1 731 719 (207 260)JPMorgan Chase Bank N.A. Equity Fund Equity Short 7 248 904 (95 714)JPMorgan Chase Bank N.A. Food Equity Long 6 986 637 35 143JPMorgan Chase Bank N.A. Food Equity Short 27 507 735 (943 610)JPMorgan Chase Bank N.A. Food Service Equity Short 96 708 2 792JPMorgan Chase Bank N.A. Forest Products & Paper Equity Long 31 220 246 (1 347 492)JPMorgan Chase Bank N.A. Forest Products & Paper Equity Short 873 170 (10 798)JPMorgan Chase Bank N.A. Gas Equity Long 2 543 058 151 871JPMorgan Chase Bank N.A. Gas Equity Short 5 295 303 498 445JPMorgan Chase Bank N.A. Hand/Machine Tools Equity Short 441 769 (17 883)JPMorgan Chase Bank N.A. Healthcare-Products Equity Long 12 481 993 175 917JPMorgan Chase Bank N.A. Healthcare-Products Equity Short 6 132 326 (368 407)JPMorgan Chase Bank N.A. Healthcare-Services Equity Long 6 592 840 1 381 354JPMorgan Chase Bank N.A. Healthcare-Services Equity Short 1 596 363 152 514JPMorgan Chase Bank N.A. Holding
Companies-DiversifiedEquity Long 6 728 491 246 117
JPMorgan Chase Bank N.A. HoldingCompanies-Diversified
Equity Short 192 350 (999)
JPMorgan Chase Bank N.A. Home Builders Equity Long 904 647 (23 191)JPMorgan Chase Bank N.A. Home Builders Equity Short 1 728 950 64 521JPMorgan Chase Bank N.A. Home Furnishings Equity Short 1 125 395 (4 904)JPMorgan Chase Bank N.A. Household Products/Wares Equity Short 2 921 151 (229 364)JPMorgan Chase Bank N.A. Insurance Equity Long 16 891 141 (177 513)JPMorgan Chase Bank N.A. Insurance Equity Short 8 167 389 (138 828)JPMorgan Chase Bank N.A. Internet Equity Long 2 765 236 217 621JPMorgan Chase Bank N.A. Internet Equity Short 10 609 043 150 359JPMorgan Chase Bank N.A. Investment Companies Equity Long 8 611 912 1 431 567JPMorgan Chase Bank N.A. Investment Companies Equity Short 642 552 (11 366)JPMorgan Chase Bank N.A. Iron/Steel Equity Long 8 407 768 (144 902)JPMorgan Chase Bank N.A. Iron/Steel Equity Short 17 890 523 1 470 042JPMorgan Chase Bank N.A. Leisure Time Equity Long 4 098 019 447 597JPMorgan Chase Bank N.A. Leisure Time Equity Short 2 567 936 (134 357)JPMorgan Chase Bank N.A. Lodging Equity Long 229 887 (1 125)JPMorgan Chase Bank N.A. Lodging Equity Short 10 975 047 (250 815)
75Merrill Lynch Investment Solutions
Merrill Lynch Investment Solutions – Marshall WaceTOPS UCITS Fund (Market Neutral)Schedule of Investments as at March 31, 2019 (cont.)(expressed in USD)
The accompanying notes form an integral part of these financial statements.
Audited annual report
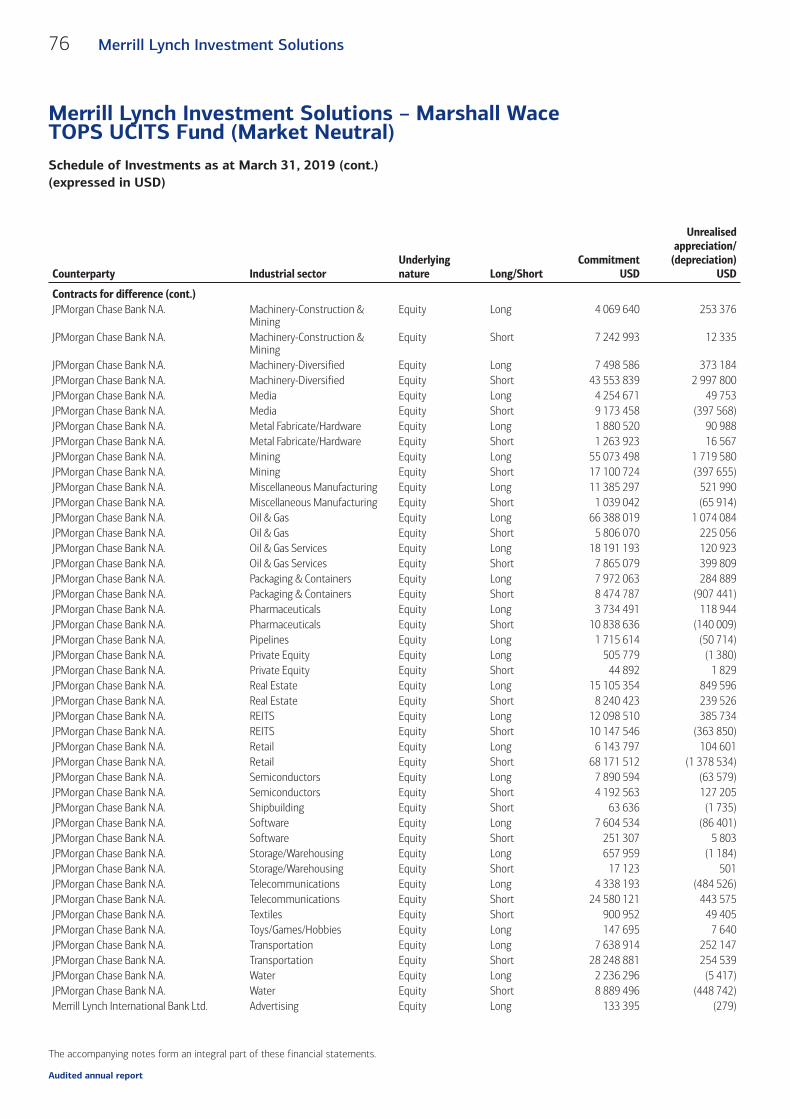
Counterparty Industrial sectorUnderlyingnature Long/Short
CommitmentUSD
Unrealisedappreciation/
(depreciation)USD
Contracts for difference (cont.)JPMorgan Chase Bank N.A. Machinery-Construction &
MiningEquity Long 4 069 640 253 376
JPMorgan Chase Bank N.A. Machinery-Construction &Mining
Equity Short 7 242 993 12 335
JPMorgan Chase Bank N.A. Machinery-Diversified Equity Long 7 498 586 373 184JPMorgan Chase Bank N.A. Machinery-Diversified Equity Short 43 553 839 2 997 800JPMorgan Chase Bank N.A. Media Equity Long 4 254 671 49 753JPMorgan Chase Bank N.A. Media Equity Short 9 173 458 (397 568)JPMorgan Chase Bank N.A. Metal Fabricate/Hardware Equity Long 1 880 520 90 988JPMorgan Chase Bank N.A. Metal Fabricate/Hardware Equity Short 1 263 923 16 567JPMorgan Chase Bank N.A. Mining Equity Long 55 073 498 1 719 580JPMorgan Chase Bank N.A. Mining Equity Short 17 100 724 (397 655)JPMorgan Chase Bank N.A. Miscellaneous Manufacturing Equity Long 11 385 297 521 990JPMorgan Chase Bank N.A. Miscellaneous Manufacturing Equity Short 1 039 042 (65 914)JPMorgan Chase Bank N.A. Oil & Gas Equity Long 66 388 019 1 074 084JPMorgan Chase Bank N.A. Oil & Gas Equity Short 5 806 070 225 056JPMorgan Chase Bank N.A. Oil & Gas Services Equity Long 18 191 193 120 923JPMorgan Chase Bank N.A. Oil & Gas Services Equity Short 7 865 079 399 809JPMorgan Chase Bank N.A. Packaging & Containers Equity Long 7 972 063 284 889JPMorgan Chase Bank N.A. Packaging & Containers Equity Short 8 474 787 (907 441)JPMorgan Chase Bank N.A. Pharmaceuticals Equity Long 3 734 491 118 944JPMorgan Chase Bank N.A. Pharmaceuticals Equity Short 10 838 636 (140 009)JPMorgan Chase Bank N.A. Pipelines Equity Long 1 715 614 (50 714)JPMorgan Chase Bank N.A. Private Equity Equity Long 505 779 (1 380)JPMorgan Chase Bank N.A. Private Equity Equity Short 44 892 1 829JPMorgan Chase Bank N.A. Real Estate Equity Long 15 105 354 849 596JPMorgan Chase Bank N.A. Real Estate Equity Short 8 240 423 239 526JPMorgan Chase Bank N.A. REITS Equity Long 12 098 510 385 734JPMorgan Chase Bank N.A. REITS Equity Short 10 147 546 (363 850)JPMorgan Chase Bank N.A. Retail Equity Long 6 143 797 104 601JPMorgan Chase Bank N.A. Retail Equity Short 68 171 512 (1 378 534)JPMorgan Chase Bank N.A. Semiconductors Equity Long 7 890 594 (63 579)JPMorgan Chase Bank N.A. Semiconductors Equity Short 4 192 563 127 205JPMorgan Chase Bank N.A. Shipbuilding Equity Short 63 636 (1 735)JPMorgan Chase Bank N.A. Software Equity Long 7 604 534 (86 401)JPMorgan Chase Bank N.A. Software Equity Short 251 307 5 803JPMorgan Chase Bank N.A. Storage/Warehousing Equity Long 657 959 (1 184)JPMorgan Chase Bank N.A. Storage/Warehousing Equity Short 17 123 501JPMorgan Chase Bank N.A. Telecommunications Equity Long 4 338 193 (484 526)JPMorgan Chase Bank N.A. Telecommunications Equity Short 24 580 121 443 575JPMorgan Chase Bank N.A. Textiles Equity Short 900 952 49 405JPMorgan Chase Bank N.A. Toys/Games/Hobbies Equity Long 147 695 7 640JPMorgan Chase Bank N.A. Transportation Equity Long 7 638 914 252 147JPMorgan Chase Bank N.A. Transportation Equity Short 28 248 881 254 539JPMorgan Chase Bank N.A. Water Equity Long 2 236 296 (5 417)JPMorgan Chase Bank N.A. Water Equity Short 8 889 496 (448 742)Merrill Lynch International Bank Ltd. Advertising Equity Long 133 395 (279)
76 Merrill Lynch Investment Solutions
Merrill Lynch Investment Solutions – Marshall WaceTOPS UCITS Fund (Market Neutral)Schedule of Investments as at March 31, 2019 (cont.)(expressed in USD)
The accompanying notes form an integral part of these financial statements.
Audited annual report

Counterparty Industrial sectorUnderlyingnature Long/Short
CommitmentUSD
Unrealisedappreciation/
(depreciation)USD
Contracts for difference (cont.)Merrill Lynch International Bank Ltd. Advertising Equity Short 966 633 (80 420)Merrill Lynch International Bank Ltd. Aerospace/Defense Equity Long 10 909 434 (1 495 680)Merrill Lynch International Bank Ltd. Aerospace/Defense Equity Short 95 142 676Merrill Lynch International Bank Ltd. Agriculture Equity Long 9 332 274 104 969Merrill Lynch International Bank Ltd. Agriculture Equity Short 119 920 (6 836)Merrill Lynch International Bank Ltd. Airlines Equity Long 241 611 (3 561)Merrill Lynch International Bank Ltd. Airlines Equity Short 2 849 229 335 684Merrill Lynch International Bank Ltd. Apparel Equity Long 15 882 604 486 652Merrill Lynch International Bank Ltd. Auto Manufacturers Equity Long 6 759 117 95 843Merrill Lynch International Bank Ltd. Auto Manufacturers Equity Short 411 106 115 155Merrill Lynch International Bank Ltd. Auto Parts & Equipment Equity Long 34 006 980 5 464 288Merrill Lynch International Bank Ltd. Auto Parts & Equipment Equity Short 4 647 997 125 586Merrill Lynch International Bank Ltd. Banks Equity Long 19 265 468 (1 078 703)Merrill Lynch International Bank Ltd. Banks Equity Short 2 229 677 196 983Merrill Lynch International Bank Ltd. Beverages Equity Long 4 999 877 131 493Merrill Lynch International Bank Ltd. Beverages Equity Short 7 248 202Merrill Lynch International Bank Ltd. Biotechnology Equity Short 1 888 427 183 162Merrill Lynch International Bank Ltd. Building Materials Equity Long 3 705 299 491 564Merrill Lynch International Bank Ltd. Building Materials Equity Short 16 615 384 (483 428)Merrill Lynch International Bank Ltd. Chemicals Equity Long 2 157 472 19 613Merrill Lynch International Bank Ltd. Chemicals Equity Short 2 776 015 (41 125)Merrill Lynch International Bank Ltd. Coal Equity Short 539 041 (4 051)Merrill Lynch International Bank Ltd. Commercial Services Equity Long 7 788 020 (34 691)Merrill Lynch International Bank Ltd. Commercial Services Equity Short 6 536 694 274 216Merrill Lynch International Bank Ltd. Computers Equity Long 5 514 953 103 859Merrill Lynch International Bank Ltd. Computers Equity Short 1 744 507 (507 336)Merrill Lynch International Bank Ltd. Distribution/Wholesale Equity Short 1 060 878 5 255Merrill Lynch International Bank Ltd. Diversified Financial Services Equity Long 5 090 520 149 292Merrill Lynch International Bank Ltd. Diversified Financial Services Equity Short 2 112 791 31 883Merrill Lynch International Bank Ltd. Electric Equity Long 16 793 053 703 444Merrill Lynch International Bank Ltd. Electric Equity Short 98 104 1 409Merrill Lynch International Bank Ltd. Electrical Components &
EquipmentEquity Long 1 406 183 (62 097)
Merrill Lynch International Bank Ltd. Electrical Components &Equipment
Equity Short 122 127 (5 767)
Merrill Lynch International Bank Ltd. Electronics Equity Short 593 632 (16 298)Merrill Lynch International Bank Ltd. Energy-Alternate Sources Equity Long 400 212 43 564Merrill Lynch International Bank Ltd. Energy-Alternate Sources Equity Short 49 568 (3 837)Merrill Lynch International Bank Ltd. Engineering & Construction Equity Long 11 245 428 (70 724)Merrill Lynch International Bank Ltd. Engineering & Construction Equity Short 8 736 519 (1 774 406)Merrill Lynch International Bank Ltd. Entertainment Equity Short 837 208 46 376Merrill Lynch International Bank Ltd. Environmental Control Equity Short 141 029 (13 439)Merrill Lynch International Bank Ltd. Equity Fund Equity Short 163 842 (1 527)Merrill Lynch International Bank Ltd. Food Equity Long 5 327 905 (58 130)Merrill Lynch International Bank Ltd. Food Equity Short 7 647 535 679 745Merrill Lynch International Bank Ltd. Food Service Equity Short 10 515 328 (26 479)Merrill Lynch International Bank Ltd. Hand/Machine Tools Equity Short 263 111 81
77Merrill Lynch Investment Solutions
Merrill Lynch Investment Solutions – Marshall WaceTOPS UCITS Fund (Market Neutral)Schedule of Investments as at March 31, 2019 (cont.)(expressed in USD)
The accompanying notes form an integral part of these financial statements.
Audited annual report

Counterparty Industrial sectorUnderlyingnature Long/Short
CommitmentUSD
Unrealisedappreciation/
(depreciation)USD
Contracts for difference (cont.)Merrill Lynch International Bank Ltd. Healthcare-Products Equity Long 1 044 177 7 984Merrill Lynch International Bank Ltd. Healthcare-Services Equity Long 17 501 702Merrill Lynch International Bank Ltd. Healthcare-Services Equity Short 2 591 868 (157 326)Merrill Lynch International Bank Ltd. Holding
Companies-DiversifiedEquity Long 2 423 731 (247 887)
Merrill Lynch International Bank Ltd. HoldingCompanies-Diversified
Equity Short 509 056 21 804
Merrill Lynch International Bank Ltd. Home Builders Equity Long 454 171 4 614Merrill Lynch International Bank Ltd. Home Furnishings Equity Long 13 296 702 492 441Merrill Lynch International Bank Ltd. Home Furnishings Equity Short 281 231 7 431Merrill Lynch International Bank Ltd. Household Products/Wares Equity Short 2 299 131 54 916Merrill Lynch International Bank Ltd. Housewares Equity Long 2 769 871 (364 476)Merrill Lynch International Bank Ltd. Insurance Equity Long 1 239 172 (29 139)Merrill Lynch International Bank Ltd. Insurance Equity Short 1 559 390 (46 615)Merrill Lynch International Bank Ltd. Internet Equity Short 408 285 (16 143)Merrill Lynch International Bank Ltd. Investment Companies Equity Long 3 892 381 73 395Merrill Lynch International Bank Ltd. Iron/Steel Equity Long 6 395 071 194 604Merrill Lynch International Bank Ltd. Iron/Steel Equity Short 17 584 305 725 554Merrill Lynch International Bank Ltd. Leisure Time Equity Long 908 982 161 252Merrill Lynch International Bank Ltd. Machinery-Construction &
MiningEquity Long 1 042 378 (9 097)
Merrill Lynch International Bank Ltd. Machinery-Diversified Equity Long 3 232 919 205 810Merrill Lynch International Bank Ltd. Machinery-Diversified Equity Short 1 031 128 47 755Merrill Lynch International Bank Ltd. Media Equity Long 2 038 491 (41 024)Merrill Lynch International Bank Ltd. Media Equity Short 32 808 (3 311)Merrill Lynch International Bank Ltd. Metal Fabricate/Hardware Equity Long 22 116 2 700Merrill Lynch International Bank Ltd. Metal Fabricate/Hardware Equity Short 3 264 514 (98 843)Merrill Lynch International Bank Ltd. Mining Equity Long 17 944 755 123 617Merrill Lynch International Bank Ltd. Mining Equity Short 3 021 893 41 489Merrill Lynch International Bank Ltd. Miscellaneous Manufacturing Equity Long 4 917 061 (17 916)Merrill Lynch International Bank Ltd. Miscellaneous Manufacturing Equity Short 12 812 412Merrill Lynch International Bank Ltd. Office/Business Equipment Equity Long 385 878 (60 896)Merrill Lynch International Bank Ltd. Oil & Gas Equity Long 32 292 657 336 288Merrill Lynch International Bank Ltd. Oil & Gas Equity Short 10 124 013 (158)Merrill Lynch International Bank Ltd. Pharmaceuticals Equity Long 12 087 188 227 062Merrill Lynch International Bank Ltd. Pharmaceuticals Equity Short 1 935 825 (364 021)Merrill Lynch International Bank Ltd. Pipelines Equity Long 4 096 139 (26 204)Merrill Lynch International Bank Ltd. Pipelines Equity Short 29 -Merrill Lynch International Bank Ltd. Private Equity Equity Long 934 322 109 935Merrill Lynch International Bank Ltd. Real Estate Equity Short 59 140 (2 479)Merrill Lynch International Bank Ltd. REITS Equity Long 310 353 (475)Merrill Lynch International Bank Ltd. REITS Equity Short 364 366 (24 841)Merrill Lynch International Bank Ltd. Retail Equity Long 3 395 658 45 524Merrill Lynch International Bank Ltd. Retail Equity Short 13 489 763 (39 229)Merrill Lynch International Bank Ltd. Semiconductors Equity Long 1 721 948 (99 406)Merrill Lynch International Bank Ltd. Semiconductors Equity Short 544 687 1 536Merrill Lynch International Bank Ltd. Shipbuilding Equity Short 442 219 (14 685)Merrill Lynch International Bank Ltd. Software Equity Long 14 498 662 1 204 708
78 Merrill Lynch Investment Solutions
Merrill Lynch Investment Solutions – Marshall WaceTOPS UCITS Fund (Market Neutral)Schedule of Investments as at March 31, 2019 (cont.)(expressed in USD)
The accompanying notes form an integral part of these financial statements.
Audited annual report

Counterparty Industrial sectorUnderlyingnature Long/Short
CommitmentUSD
Unrealisedappreciation/
(depreciation)USD
Contracts for difference (cont.)Merrill Lynch International Bank Ltd. Software Equity Short 3 796 326 (392 405)Merrill Lynch International Bank Ltd. Telecommunications Equity Long 4 268 947 (224 685)Merrill Lynch International Bank Ltd. Telecommunications Equity Short 3 841 848 59 273Merrill Lynch International Bank Ltd. Transportation Equity Long 414 263 10 301Merrill Lynch International Bank Ltd. Transportation Equity Short 109 252 1 005Morgan Stanley Capital Services, Inc. Coal Equity Long 645 624 72 740Morgan Stanley Capital Services, Inc. Diversified Financial Services Equity Short 111 900 (22 162)Morgan Stanley Capital Services, Inc. Pharmaceuticals Equity Short 1 899 960 (538 209)Morgan Stanley Capital Services, Inc. Pipelines Equity Long 439 790 8 103Morgan Stanley Capital Services, Inc. Pipelines Equity Short 11 616 534 (809 037)Morgan Stanley Capital Services, Inc. Real Estate Equity Long 741 651 17 379Morgan Stanley Capital Services, Inc. Retail Equity Long 111 826 4 008Morgan Stanley Capital Services, Inc. Telecommunications Equity Short 4 217 250 (233 253)Morgan Stanley Capital Services, Inc. Transportation Equity Short 565 546 (21 979)Morgan Stanley International Plc. Advertising Equity Short 879 200 (99 328)Morgan Stanley International Plc. Aerospace/Defense Equity Long 9 044 (431)Morgan Stanley International Plc. Aerospace/Defense Equity Short 1 908 885 101 213Morgan Stanley International Plc. Agriculture Equity Short 5 651 598 (1 189 556)Morgan Stanley International Plc. Airlines Equity Long 1 018 799 50 547Morgan Stanley International Plc. Airlines Equity Short 598 905 12 158Morgan Stanley International Plc. Apparel Equity Short 160 317 5 512Morgan Stanley International Plc. Auto Manufacturers Equity Long 1 943 (30)Morgan Stanley International Plc. Auto Manufacturers Equity Short 2 598 098 20 715Morgan Stanley International Plc. Auto Parts & Equipment Equity Long 678 197 (17 146)Morgan Stanley International Plc. Auto Parts & Equipment Equity Short 312 690 3 224Morgan Stanley International Plc. Banks Equity Long 8 349 100 190 346Morgan Stanley International Plc. Banks Equity Short 9 230 100 492 115Morgan Stanley International Plc. Beverages Equity Long 2 233 673 79 607Morgan Stanley International Plc. Beverages Equity Short 499 (55)Morgan Stanley International Plc. Biotechnology Equity Long 51 297 (113)Morgan Stanley International Plc. Biotechnology Equity Short 1 173 502 (136 553)Morgan Stanley International Plc. Building Materials Equity Long 2 115 586 61 504Morgan Stanley International Plc. Building Materials Equity Short 6 (1)Morgan Stanley International Plc. Chemicals Equity Long 745 768 (18 583)Morgan Stanley International Plc. Chemicals Equity Short 2 922 914 8 067Morgan Stanley International Plc. Coal Equity Short 333 668 (8 334)Morgan Stanley International Plc. Commercial Services Equity Long 16 164 023 1 882 443Morgan Stanley International Plc. Commercial Services Equity Short 2 650 804 62 464Morgan Stanley International Plc. Computers Equity Long 4 491 744 (514 788)Morgan Stanley International Plc. Computers Equity Short 510 016 20 924Morgan Stanley International Plc. Cosmetics/Personal Care Equity Long 859 386 28 224Morgan Stanley International Plc. Cosmetics/Personal Care Equity Short 781 206 (90 452)Morgan Stanley International Plc. Distribution/Wholesale Equity Long 36 409 114Morgan Stanley International Plc. Distribution/Wholesale Equity Short 39 419 (6 897)Morgan Stanley International Plc. Diversified Financial Services Equity Long 2 264 563 (17)Morgan Stanley International Plc. Diversified Financial Services Equity Short 434 151 (5 697)Morgan Stanley International Plc. Electric Equity Long 9 370 473 604 940
79Merrill Lynch Investment Solutions
Merrill Lynch Investment Solutions – Marshall WaceTOPS UCITS Fund (Market Neutral)Schedule of Investments as at March 31, 2019 (cont.)(expressed in USD)
The accompanying notes form an integral part of these financial statements.
Audited annual report

Counterparty Industrial sectorUnderlyingnature Long/Short
CommitmentUSD
Unrealisedappreciation/
(depreciation)USD
Contracts for difference (cont.)Morgan Stanley International Plc. Electric Equity Short 1 494 367 (539)Morgan Stanley International Plc. Electrical Components &
EquipmentEquity Short 52 973 2 084
Morgan Stanley International Plc. Electronics Equity Short 193 815 (12 933)Morgan Stanley International Plc. Energy-Alternate Sources Equity Short 694 516 (12 502)Morgan Stanley International Plc. Engineering & Construction Equity Long 4 028 304 (17 174)Morgan Stanley International Plc. Engineering & Construction Equity Short 1 176 750 64 742Morgan Stanley International Plc. Entertainment Equity Long 21 197 1 095Morgan Stanley International Plc. Entertainment Equity Short 812 422 142 416Morgan Stanley International Plc. Environmental Control Equity Long 8 932 652 792 368Morgan Stanley International Plc. Environmental Control Equity Short 211 894 7 887Morgan Stanley International Plc. Equity Fund Equity Short 215 786 10 491Morgan Stanley International Plc. Food Equity Long 4 461 231 152 312Morgan Stanley International Plc. Food Equity Short 18 272 256 (1 254 881)Morgan Stanley International Plc. Forest Products & Paper Equity Short 150 322 (746)Morgan Stanley International Plc. Future Index Derivatives Long 12 231 498 381 138Morgan Stanley International Plc. Gas Equity Long 158 049 24 397Morgan Stanley International Plc. Healthcare-Products Equity Long 128 837 1 176Morgan Stanley International Plc. Healthcare-Products Equity Short 197 810 (4 475)Morgan Stanley International Plc. Healthcare-Services Equity Long 9 285 024 (283 758)Morgan Stanley International Plc. Healthcare-Services Equity Short 513 941 (14 704)Morgan Stanley International Plc. Holding
Companies-DiversifiedEquity Long 1 829 864 (43 864)
Morgan Stanley International Plc. Home Builders Equity Long 1 278 698 33 611Morgan Stanley International Plc. Home Furnishings Equity Long 121 060 931Morgan Stanley International Plc. Home Furnishings Equity Short 291 524 (20 680)Morgan Stanley International Plc. Housewares Equity Short 837 (120)Morgan Stanley International Plc. Insurance Equity Long 3 093 847 (9 337)Morgan Stanley International Plc. Insurance Equity Short 586 058 24 038Morgan Stanley International Plc. Internet Equity Long 392 652 5 427Morgan Stanley International Plc. Internet Equity Short 1 267 861 212 962Morgan Stanley International Plc. Iron/Steel Equity Short 1 054 820 22 218Morgan Stanley International Plc. Machinery-Construction &
MiningEquity Long 825 172 (42 410)
Morgan Stanley International Plc. Machinery-Diversified Equity Long 146 864 2 043Morgan Stanley International Plc. Machinery-Diversified Equity Short 628 485 (36 226)Morgan Stanley International Plc. Media Equity Long 10 339 71Morgan Stanley International Plc. Media Equity Short 604 519 (54 584)Morgan Stanley International Plc. Metal Fabricate/Hardware Equity Long 2 639 499 6 617Morgan Stanley International Plc. Metal Fabricate/Hardware Equity Short 417 254 (7 992)Morgan Stanley International Plc. Mining Equity Long 17 901 330Morgan Stanley International Plc. Mining Equity Short 227 489 346Morgan Stanley International Plc. Miscellaneous Manufacturing Equity Long 316 348 (41 904)Morgan Stanley International Plc. Miscellaneous Manufacturing Equity Short 296 874 762Morgan Stanley International Plc. Oil & Gas Equity Long 11 988 793 (703 471)Morgan Stanley International Plc. Oil & Gas Equity Short 285 079 (6 946)Morgan Stanley International Plc. Oil & Gas Services Equity Short 1 488 664 75 013Morgan Stanley International Plc. Packaging & Containers Equity Long 57 878 627
80 Merrill Lynch Investment Solutions
Merrill Lynch Investment Solutions – Marshall WaceTOPS UCITS Fund (Market Neutral)Schedule of Investments as at March 31, 2019 (cont.)(expressed in USD)
The accompanying notes form an integral part of these financial statements.
Audited annual report

Counterparty Industrial sectorUnderlyingnature Long/Short
CommitmentUSD
Unrealisedappreciation/
(depreciation)USD
Contracts for difference (cont.)Morgan Stanley International Plc. Pharmaceuticals Equity Long 7 782 002 (307 168)Morgan Stanley International Plc. Pharmaceuticals Equity Short 12 836 866 869 516Morgan Stanley International Plc. Private Equity Equity Long 28 889 326Morgan Stanley International Plc. Real Estate Equity Long 8 469 387 170 343Morgan Stanley International Plc. Real Estate Equity Short 301 370 1 516Morgan Stanley International Plc. REITS Equity Long 461 002 (2 213)Morgan Stanley International Plc. REITS Equity Short 95 407 (4 474)Morgan Stanley International Plc. Retail Equity Long 3 224 666 30 946Morgan Stanley International Plc. Retail Equity Short 10 938 832 16 142Morgan Stanley International Plc. Semiconductors Equity Long 3 477 222 (31 242)Morgan Stanley International Plc. Semiconductors Equity Short 1 840 939 23 733Morgan Stanley International Plc. Software Equity Long 2 411 436 58 871Morgan Stanley International Plc. Software Equity Short 1 320 457 (110 954)Morgan Stanley International Plc. Storage/Warehousing Equity Short 5 708 (86)Morgan Stanley International Plc. Telecommunications Equity Long 8 163 858 (73 975)Morgan Stanley International Plc. Telecommunications Equity Short 5 190 092 41 145Morgan Stanley International Plc. Textiles Equity Long 2 912 994 7 459Morgan Stanley International Plc. Transportation Equity Long 2 566 962 57 348Morgan Stanley International Plc. Transportation Equity Short 101 542 (6 449)Morgan Stanley International Plc. Water Equity Long 1 034 833 71 566Société Générale Agriculture Equity Long 31 749 6 945Société Générale Airlines Equity Short 193 552 (444)Société Générale Apparel Equity Long 2 320 908 361 199Société Générale Auto Manufacturers Equity Long 5 158 723 82 803Société Générale Auto Parts & Equipment Equity Long 371 949 371 949Société Générale Banks Equity Long 442 066 49 090Société Générale Beverages Equity Long 149 753 1 823Société Générale Building Materials Equity Long 324 209 11 647Société Générale Chemicals Equity Long 4 768 082 431 568Société Générale Commercial Services Equity Long 122 253 (6 647)Société Générale Commercial Services Equity Short 487 080 (39 092)Société Générale Computers Equity Long 3 901 337 75 232Société Générale Cosmetics/Personal Care Equity Long 50 561 (2 056)Société Générale Cosmetics/Personal Care Equity Short 125 029 5 381Société Générale Diversified Financial Services Equity Long 7 851 312 1 219 553Société Générale Electric Equity Long 6 851 696 944 997Société Générale Electrical Components &
EquipmentEquity Long 1 965 489 201 454
Société Générale Engineering & Construction Equity Long 292 644 11 395Société Générale Entertainment Equity Long 76 274 13 544Société Générale Food Equity Long 817 078 19 735Société Générale Forest Products & Paper Equity Long 14 153 065 (2 113 538)Société Générale Gas Equity Long 1 175 714 43 646Société Générale Household Products/Wares Equity Long 521 587 2 366Société Générale Insurance Equity Long 2 058 568 10 062Société Générale Iron/Steel Equity Long 2 083 (73)Société Générale Leisure Time Equity Long 256 928 50 471
81Merrill Lynch Investment Solutions
Merrill Lynch Investment Solutions – Marshall WaceTOPS UCITS Fund (Market Neutral)Schedule of Investments as at March 31, 2019 (cont.)(expressed in USD)
The accompanying notes form an integral part of these financial statements.
Audited annual report

Counterparty Industrial sectorUnderlyingnature Long/Short
CommitmentUSD
Unrealisedappreciation/
(depreciation)USD
Contracts for difference (cont.)Société Générale Machinery-Construction &
MiningEquity Short 62 088 3 150
Société Générale Machinery-Diversified Equity Long 398 996 11 120Société Générale Machinery-Diversified Equity Short 479 488 (42 031)Société Générale Media Equity Long 1 080 310 66 488Société Générale Miscellaneous Manufacturing Equity Long 1 382 147Société Générale Miscellaneous Manufacturing Equity Short 75 049 (3 304)Société Générale Oil & Gas Equity Long 1 091 894 112 848Société Générale Pharmaceuticals Equity Long 1 415 978 (65 749)Société Générale Pharmaceuticals Equity Short 60 666 6 560Société Générale Real Estate Equity Long 6 386 539 497 474Société Générale REITS Equity Long 332 588 (2 479)Société Générale Retail Equity Long 314 126 25 784Société Générale Retail Equity Short 1 217 049 (160 438)Société Générale Semiconductors Equity Short 8 534 (1 464)Société Générale Software Equity Long 3 841 511 36 649UBS AG Advertising Equity Short 3 942 645 (417 509)UBS AG Aerospace/Defense Equity Long 97 973 (816)UBS AG Aerospace/Defense Equity Short 444 765 8 577UBS AG Agriculture Equity Long 2 364 314 (39 869)UBS AG Agriculture Equity Short 16 277 567 (5 484 815)UBS AG Airlines Equity Short 20 023 984 133 487UBS AG Apparel Equity Long 14 095 377 1 880 489UBS AG Apparel Equity Short 3 283 675 (97 429)UBS AG Auto Manufacturers Equity Short 20 859 227 (282 392)UBS AG Auto Parts & Equipment Equity Long 12 336 979 2 002 693UBS AG Auto Parts & Equipment Equity Short 6 739 760 553 325UBS AG Banks Equity Long 11 819 471 316 559UBS AG Banks Equity Short 16 880 376 273 107UBS AG Beverages Equity Long 3 484 796 90 646UBS AG Beverages Equity Short 3 611 283 (267 526)UBS AG Biotechnology Equity Short 2 159 016 94 776UBS AG Building Materials Equity Long 30 957 761 4 447 679UBS AG Building Materials Equity Short 5 124 932 177 350UBS AG Chemicals Equity Long 3 383 072 8 999UBS AG Chemicals Equity Short 26 260 493 1 298 118UBS AG Coal Equity Long 2 137 998 50 870UBS AG Coal Equity Short 700 477 (5 125)UBS AG Commercial Services Equity Long 8 053 784 (69 094)UBS AG Commercial Services Equity Short 14 481 811 100 321UBS AG Computers Equity Long 1 026 219 103 710UBS AG Computers Equity Short 26 034 433 (96 532)UBS AG Cosmetics/Personal Care Equity Long 78 834 561UBS AG Cosmetics/Personal Care Equity Short 574 896 123 640UBS AG Distribution/Wholesale Equity Long 7 956 471 (314 794)UBS AG Distribution/Wholesale Equity Short 4 294 418 40 747UBS AG Diversified Financial Services Equity Long 2 244 007 113 671
82 Merrill Lynch Investment Solutions
Merrill Lynch Investment Solutions – Marshall WaceTOPS UCITS Fund (Market Neutral)Schedule of Investments as at March 31, 2019 (cont.)(expressed in USD)
The accompanying notes form an integral part of these financial statements.
Audited annual report

Counterparty Industrial sectorUnderlyingnature Long/Short
CommitmentUSD
Unrealisedappreciation/
(depreciation)USD
Contracts for difference (cont.)UBS AG Diversified Financial Services Equity Short 20 014 609 (796 992)UBS AG Electric Equity Long 17 783 635 333 486UBS AG Electric Equity Short 5 418 882 129 969UBS AG Electrical Components &
EquipmentEquity Long 2 216 155 (16 496)
UBS AG Electrical Components &Equipment (a)
Equity Short 1 191 602 4 624
UBS AG Electronics Equity Long 15 760 331 1 175 948UBS AG Electronics Equity Short 12 363 769 29 174UBS AG Energy-Alternate Sources Equity Long 74 338 2 128UBS AG Energy-Alternate Sources Equity Short 16 300 042 (2 688 985)UBS AG Engineering & Construction Equity Long 15 491 044 114 110UBS AG Engineering & Construction Equity Short 7 524 771 171 696UBS AG Entertainment Equity Long 2 817 117 81 784UBS AG Entertainment Equity Short 8 949 695 188 963UBS AG Environmental Control Equity Long 2 365 892 84 688UBS AG Environmental Control Equity Short 52 483 (4 160)UBS AG Food Equity Long 1 203 328 33 210UBS AG Food Equity Short 24 336 925 (990 828)UBS AG Food Service Equity Long 49 912 (1 276)UBS AG Forest Products & Paper Equity Long 47 861 (1 749)UBS AG Forest Products & Paper Equity Short 81 604 3 365UBS AG Gas Equity Long 2 081 432 5 115UBS AG Gas Equity Short 23 975 (548)UBS AG Hand/Machine Tools Equity Long 14 546 1 007UBS AG Healthcare-Products Equity Long 551 736 24 622UBS AG Healthcare-Products Equity Short 5 938 186 (250 439)UBS AG Healthcare-Services Equity Long 5 942 343 372 801UBS AG Healthcare-Services Equity Short 1 926 631 3 893UBS AG Holding
Companies-DiversifiedEquity Long 25 964 (219)
UBS AG HoldingCompanies-Diversified
Equity Short 3 511 610 (310 528)
UBS AG Home Builders Equity Long 6 969 534 (32 132)UBS AG Home Furnishings Equity Long 14 203 787 260 932UBS AG Home Furnishings Equity Short 7 275 546 159 171UBS AG Household Products/Wares Equity Short 4 537 335 (91 180)UBS AG Insurance Equity Short 546 298 (19 893)UBS AG Internet Equity Long 603 050 39 461UBS AG Internet Equity Short 20 698 415 (628 235)UBS AG Iron/Steel Equity Long 11 311 473 25 166UBS AG Iron/Steel Equity Short 1 203 147 24 693UBS AG Leisure Time Equity Long 1 512 366 (41 715)UBS AG Leisure Time Equity Short 3 686 190 72 780UBS AG Lodging Equity Long 9 114 379 (470 304)UBS AG Lodging Equity Short 9 621 515 (79 085)UBS AG Machinery-Construction &
MiningEquity Long 15 519 370 3 795 483
83Merrill Lynch Investment Solutions
Merrill Lynch Investment Solutions – Marshall WaceTOPS UCITS Fund (Market Neutral)Schedule of Investments as at March 31, 2019 (cont.)(expressed in USD)
The accompanying notes form an integral part of these financial statements.
Audited annual report

Counterparty Industrial sectorUnderlyingnature Long/Short
CommitmentUSD
Unrealisedappreciation/
(depreciation)USD
Contracts for difference (cont.)UBS AG Machinery-Diversified Equity Long 20 097 655 3 838 980UBS AG Machinery-Diversified Equity Short 6 679 216 (174 072)UBS AG Media Equity Long 1 230 052 182 339UBS AG Media Equity Short 3 854 696 15 093UBS AG Metal Fabricate/Hardware Equity Long 3 629 328 521 874UBS AG Metal Fabricate/Hardware Equity Short 31 945 (628)UBS AG Mining Equity Long 8 179 197 156 104UBS AG Mining Equity Short 9 457 563 (243 053)UBS AG Miscellaneous Manufacturing Equity Long 2 320 326 (164 082)UBS AG Miscellaneous Manufacturing Equity Short 6 070 404 (108 344)UBS AG Oil & Gas Equity Long 9 933 814 146 548UBS AG Oil & Gas Equity Short 17 565 888 (168 728)UBS AG Oil & Gas Services Equity Long 24 586 016 6 246 944UBS AG Oil & Gas Services Equity Short 60 500 (657)UBS AG Packaging & Containers Equity Long 184 175 28 892UBS AG Packaging & Containers Equity Short 1 186 328 9 437UBS AG Pharmaceuticals Equity Long 6 848 256 532 546UBS AG Pharmaceuticals Equity Short 28 450 401 1 531 890UBS AG Pipelines Equity Long 1 940 063 41 244UBS AG Pipelines Equity Short 26 945 709 (1 301 960)UBS AG Private Equity Equity Short 169 708 (13 726)UBS AG Real Estate Equity Long 37 065 521 3 555 515UBS AG Real Estate Equity Short 3 268 974 (60 375)UBS AG REITS Equity Long 2 720 331 (6 718)UBS AG REITS Equity Short 4 487 448 (13 473)UBS AG Retail Equity Long 6 836 203 (130 767)UBS AG Retail Equity Short 30 825 112 (1 351 120)UBS AG Semiconductors Equity Long 7 723 934UBS AG Semiconductors Equity Short 10 124 864 (1 731 493)UBS AG Shipbuilding Equity Short 907 653 54 771UBS AG Software Equity Long 2 865 774 68 941UBS AG Software Equity Short 25 018 985 (1 852 994)UBS AG Swap Index - Diversified Derivatives Short 122 825 169 (17 881 859)UBS AG Telecommunications Equity Long 702 397 7 808UBS AG Telecommunications Equity Short 57 403 489 1 730 087UBS AG Textiles Equity Long 1 045 836 9 927UBS AG Toys/Games/Hobbies Equity Short 33 595 857 5 071 956UBS AG Transportation Equity Long 9 906 667 436 758UBS AG Transportation Equity Short 13 359 156 (172 590)
Total 6 554 133 685 27 235 038
(a) These securities are fair valued. See Notes 2.2.6 and 10.
84 Merrill Lynch Investment Solutions
Merrill Lynch Investment Solutions – Marshall WaceTOPS UCITS Fund (Market Neutral)Schedule of Investments as at March 31, 2019 (cont.)(expressed in USD)
The accompanying notes form an integral part of these financial statements.
Audited annual report
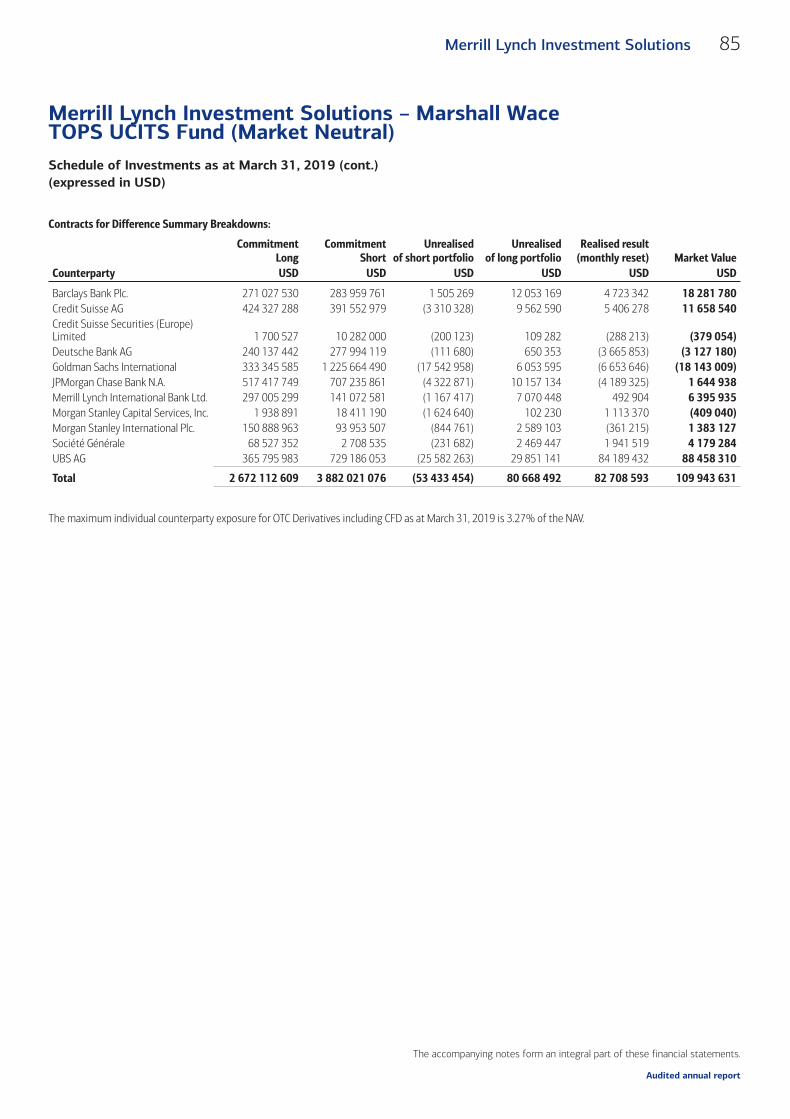
Contracts for Difference Summary Breakdowns:
CommitmentLong
CommitmentShort
Unrealisedof short portfolio
Unrealisedof long portfolio
Realised result(monthly reset) Market Value
Counterparty USD USD USD USD USD USD
Barclays Bank Plc. 271 027 530 283 959 761 1 505 269 12 053 169 4 723 342 18 281 780Credit Suisse AG 424 327 288 391 552 979 (3 310 328) 9 562 590 5 406 278 11 658 540Credit Suisse Securities (Europe)Limited 1 700 527 10 282 000 (200 123) 109 282 (288 213) (379 054)Deutsche Bank AG 240 137 442 277 994 119 (111 680) 650 353 (3 665 853) (3 127 180)Goldman Sachs International 333 345 585 1 225 664 490 (17 542 958) 6 053 595 (6 653 646) (18 143 009)JPMorgan Chase Bank N.A. 517 417 749 707 235 861 (4 322 871) 10 157 134 (4 189 325) 1 644 938Merrill Lynch International Bank Ltd. 297 005 299 141 072 581 (1 167 417) 7 070 448 492 904 6 395 935Morgan Stanley Capital Services, Inc. 1 938 891 18 411 190 (1 624 640) 102 230 1 113 370 (409 040)Morgan Stanley International Plc. 150 888 963 93 953 507 (844 761) 2 589 103 (361 215) 1 383 127Société Générale 68 527 352 2 708 535 (231 682) 2 469 447 1 941 519 4 179 284UBS AG 365 795 983 729 186 053 (25 582 263) 29 851 141 84 189 432 88 458 310
Total 2 672 112 609 3 882 021 076 (53 433 454) 80 668 492 82 708 593 109 943 631
The maximum individual counterparty exposure for OTC Derivatives including CFD as at March 31, 2019 is 3.27% of the NAV.
85Merrill Lynch Investment Solutions
Merrill Lynch Investment Solutions – Marshall WaceTOPS UCITS Fund (Market Neutral)Schedule of Investments as at March 31, 2019 (cont.)(expressed in USD)
The accompanying notes form an integral part of these financial statements.
Audited annual report

Nominalvalue/
Quantity DescriptionQuotation
CurrencyCostEUR
Marketvalue EUR
% of netassets
Transferable securities and money market instruments admitted to an official exchange listing or dealt in on another regulated market
Bonds47 000 Lehman Brothers Hldg., Inc. (Defaulted) 0.000% 09/11/2009 EUR 0 1 058 0.00
750 000 Lehman Brothers Hldg., Inc. (Defaulted) 0.000% 10/05/2012 EUR 0 16 875 0.03200 000 Lehman Brothers Hldg., Inc. (Defaulted) 5.375% 17/10/2012 EUR 0 4 500 0.01
99 000 Lehman Brothers Hldg., Inc. Escrow 1.000% 30/12/2016 USD 0 1 675 0.003 836 000 Lehman Brothers Hldg., Inc. Escrow 1.000% 30/12/2016 USD 0 64 910 0.115 770 000 Lehman Brothers Hldg., Inc. Escrow 1.000% 27/09/2027 USD 9 98 149 0.171 380 000 Lehman Brothers Hldg., Inc. Escrow 1.000% Perpetual USD 106 23 351 0.04
758 000 Lehman Brothers Hldg., Inc. Escrow 1.000% Perpetual USD 0 12 826 0.02935 000 Lehman Brothers Hldg., Inc. Escrow 1.000% Perpetual USD 0 15 821 0.03
13 410 000 Lehman Brothers Hldg., Inc. Escrow 1.000% Perpetual USD (993) 226 914 0.3965 000 Lehman Brothers Hldg., Inc. Escrow 1.000% Perpetual USD 0 1 100 0.00
3 777 000 Lehman Brothers Hldg., Inc. Escrow 1.000% Perpetual USD (81) 63 912 0.1111 776 000 Lehman Brothers Hldg., Inc. Escrow 1.000% Perpetual USD (392) 199 264 0.35
4 188 000 Lehman Brothers Hldg., Inc. Escrow 1.000% Perpetual USD 0 70 866 0.1233 000 Lehman Brothers Hldg., Inc. Escrow 1.000% Perpetual USD 916 559 0.00
Total Bonds (435) 801 780 1.38
Shares8 286 Assurant, Inc. USD 716 356 700 382 1.21
11 493 AstraZeneca Plc. - ADR USD 355 126 413 824 0.7112 191 CBS Corp. - B USD 519 944 516 042 0.89
9 059 Celgene Corp. USD 705 037 761 122 1.3124 578 Centene Corp. USD 1 161 314 1 162 303 2.00
7 676 China Biologic Products Hldg., Inc. USD 558 328 623 801 1.07151 087 China Vanke Co. Ltd. - H HKD 513 577 565 656 0.97
9 461 Cie Financiere Richemont S.A. - Reg CHF 673 217 613 730 1.0621 325 DowDuPont, Inc. USD 996 009 1 012 456 1.74
5 540 DowDuPont, Inc. USD 176 839 177 965 0.319 994 Elanco Animal Health, Inc. USD 257 729 285 441 0.497 065 FMC Corp. USD 419 031 483 353 0.83
12 769 GCP Applied Technologies, Inc. USD 333 931 336 610 0.5873 606 Hitachi Chemical Ltd. JPY 1 144 800 1 452 189 2.5014 593 Hitachi Construction Machinery Co. Ltd. JPY 333 555 344 856 0.5934 993 Hitachi High-Technologies Corp. JPY 1 123 625 1 276 874 2.2019 851 Hitachi Ltd. JPY 551 470 572 613 0.9933 464 Hitachi Metals Ltd. JPY 309 383 346 265 0.60
438 Hyundai Mobis Co. Ltd. KRW 57 406 71 651 0.12162 727 JXTG Hldg., Inc. JPY 799 662 663 176 1.14
2 402 Knorr-Bremse AG EUR 199 064 212 649 0.375 213 Kone OYJ - B EUR 231 539 234 377 0.40
13 315 Koninklijke DSM NV EUR 1 177 045 1 293 685 2.2362 507 Koninklijke KPN NV EUR 170 221 176 645 0.30
7 776 Kyowa Hakko Kirin Co. Ltd. JPY 123 463 150 787 0.2629 102 Livent Corp. USD 358 732 318 273 0.55
635 Madison Square Garden Co. - A USD 162 273 165 772 0.2822 374 Mitsubishi Estate Co. Ltd. JPY 331 389 361 040 0.62
86 Merrill Lynch Investment Solutions
Merrill Lynch Investment Solutions – York Event-DrivenUCITS FundSchedule of Investments as at March 31, 2019(expressed in EUR)
The accompanying notes form an integral part of these financial statements.
Audited annual report

Nominalvalue/
Quantity DescriptionQuotation
CurrencyCostEUR
Marketvalue EUR
% of netassets
Transferable securities and money market instruments admitted to an official exchange listing or dealt in on another regulated market (cont.)
Shares (cont.)27 513 Nexon Ltd. JPY 347 848 383 863 0.66
1 893 Nintendo Co. Ltd. JPY 477 516 480 703 0.8329 603 NTT Data Corp. JPY 296 656 290 831 0.5010 768 NuVasive, Inc. USD 531 057 544 610 0.9464 400 Oi S.A. - ADR USD 105 763 107 826 0.19
4 800 Olympus Corp. JPY 43 705 46 423 0.089 658 Outsourcing, Inc. JPY 110 887 106 152 0.181 806 Pan Pacific International Hldg. Corp. JPY 96 460 106 515 0.185 081 Panalpina Welttransport Hldg. AG - Reg CHF 673 448 753 349 1.30
61 392 Perspecta, Inc. USD 1 217 139 1 105 532 1.9028 377 PG&E Corp. USD 183 039 449 847 0.77
325 400 PICC Property & Casualty Ltd. - H HKD 303 064 329 302 0.577 052 Pioneer Natural Resources Co. USD 852 535 956 387 1.65
13 659 Red Hat, Inc. USD 2 076 436 2 222 469 3.8317 387 Renesas Electronics Corp. JPY 79 461 71 628 0.12
4 054 Schibsted ASA - A NOK 140 420 141 960 0.2416 835 Schibsted ASA - B NOK 522 584 537 980 0.9310 851 Scout24 AG EUR 477 296 500 882 0.86
5 345 Siemens AG - Reg EUR 518 186 512 799 0.8833 954 SNC-Lavalin Group, Inc. CAD 1 053 711 767 550 1.3248 942 Sony Financial Hldg., Inc. JPY 786 145 822 246 1.4231 057 Synovus Financial Corp. USD 954 294 950 366 1.64
3 275 Telenet Group Hldg. NV EUR 128 716 140 432 0.2421 589 Toshiba Plant Systems & Services Corp. JPY 375 117 340 991 0.5927 464 Toshiba TEC Corp. JPY 668 284 679 514 1.17
5 942 Ultimate Software Group, Inc. USD 1 744 141 1 747 012 3.017 117 Voya Financial, Inc. USD 316 028 316 663 0.54
11 504 WABCO Hldg., Inc. USD 1 397 811 1 350 646 2.32800 WellCare Health Plans, Inc. USD 181 206 192 190 0.33
313 125 Yahoo Japan Corp. JPY 809 256 682 773 1.1716 510 Yara International ASA NOK 608 255 602 379 1.04
5 042 ZOZO, Inc. JPY 85 178 84 627 0.15
Total Shares 32 621 707 33 619 984 57.87
Supranationals, Governments and Local Public Authorities, Debt Instruments11 000 000 United States Treasury Bill 0.000% 04/04/2019 USD 9 711 017 9 794 573 16.86
Total Supranationals, Governments and Local PublicAuthorities, Debt Instruments 9 711 017 9 794 573 16.86
Investment funds20 225 Altaba, Inc. USD 833 198 1 335 065 2.30
Total Investment funds 833 198 1 335 065 2.30
87Merrill Lynch Investment Solutions
Merrill Lynch Investment Solutions – York Event-DrivenUCITS FundSchedule of Investments as at March 31, 2019 (cont.)(expressed in EUR)
The accompanying notes form an integral part of these financial statements.
Audited annual report

Nominalvalue/
Quantity DescriptionQuotation
CurrencyCostEUR
Marketvalue EUR
% of netassets
Other transferable securities
Bonds8 164 000 Motors Liquidation Co. 8.375% 15/07/2033 (a) USD 0 1 0.00
Total Bonds 0 1 0.00
Shares711 931 AMR Corp. (a) USD 16 148 158 510 0.27
Total Shares 16 148 158 510 0.27
Warrants80 923 Motors Liquidation Co. (a) USD 0 0 0.00
Total Warrants 0 0 0.00
Total Investments 43 181 635 45 709 913 78.68
(a) These securities are fair valued. See Notes 2.2.6 and 10.
88 Merrill Lynch Investment Solutions
Merrill Lynch Investment Solutions – York Event-DrivenUCITS FundSchedule of Investments as at March 31, 2019 (cont.)(expressed in EUR)
The accompanying notes form an integral part of these financial statements.
Audited annual report

Industrial classification of investments(as a percentage of net assets as at March 31, 2019) %
Sovereign 16.86Chemicals 9.23Software 7.50Insurance 3.74Oil & Gas 2.79Pharmaceuticals 2.53Auto Parts & Equipment 2.44Computers 2.40Healthcare-Services 2.33Equity Fund 2.30Media 2.30Electronics 2.20Internet 2.18Engineering & Construction 1.91Banks 1.64Real Estate 1.59Machinery-Construction & Mining 1.58Biotechnology 1.31Transportation 1.30Miscellaneous Manufacturing 1.25Retail 1.24Office/Business Equipment 1.17Healthcare-Products 1.02Diversified Financial Services 1.00Toys/Games/Hobbies 0.83Electric 0.77Iron/Steel 0.60Mining 0.55Telecommunications 0.49Machinery-Diversified 0.40Energy-Alternate Sources 0.38Entertainment 0.28Airlines 0.27Commercial Services 0.18Semiconductors 0.12
78.68
Geographical classification of investments(as a percentage of net assets as at March 31, 2019) %
United States 47.93Japan 15.95China 2.61Netherlands 2.53Switzerland 2.36Norway 2.21Germany 2.11Canada 1.32United Kingdom 0.71Finland 0.40Belgium 0.24Brazil 0.19South Korea 0.12
78.68
Underlyingnature
Currencycontract Details Market
Maturitydate
Number ofcontracts
bought
Number ofcontracts
soldCommitment
EUR
Unrealisedappreciation/
(depreciation)EUR
Futures contractsIndex EUR Euro Stoxx 50 Index Eurex Deutschland 21/06/2019 – 158 5 169 760 (105 054)
Index USD FTSE China A50 IndexSingapore Exchange(was SIMEX) 29/04/2019 – 6 70 134 (3 473)
Index JPY Nikkei 225 Index Osaka Exchange 13/06/2019 – 25 4 266 485 63 762
89Merrill Lynch Investment Solutions
Merrill Lynch Investment Solutions – York Event-DrivenUCITS FundSchedule of Investments as at March 31, 2019 (cont.)(expressed in EUR)
The accompanying notes form an integral part of these financial statements.
Audited annual report

Underlyingnature
Currencycontract Details Market
Maturitydate
Number ofcontracts
bought
Number ofcontracts
soldCommitment
EUR
Unrealisedappreciation/
(depreciation)EUR
Futures contracts (cont.)
Index USD S&P 500 E-Mini IndexChicago MercantileExchange 21/06/2019 – 100 12 636 596 (369 373)
Index JPY Topix Index Osaka Exchange 13/06/2019 – 13 1 665 236 11 849
Total Futures contracts 23 808 211 (402 289)
Currencybought Amount bought Currency sold Amount sold
Maturitydate Counterparty
Unrealisedappreciation/
(depreciation)EUR
Forward foreign exchange contracts
AUD 123 462 EUR 76 867 19/06/2019State Street Bank and
Trust Co. 839
CHF 2 845 994 EUR 2 507 177 19/06/2019State Street Bank and
Trust Co. 39 891
EUR 1 129 AUD 1 814 19/06/2019State Street Bank and
Trust Co. (12)
EUR 825 428 CAD 1 250 000 19/06/2019State Street Bank and
Trust Co. (4 020)
EUR 1 448 275 CHF 1 641 775 19/06/2019State Street Bank and
Trust Co. (21 058)
EUR 439 660 CNH 3 357 684 19/06/2019State Street Bank and
Trust Co. (2 297)
EUR 115 764 GBP 100 000 19/06/2019State Street Bank and
Trust Co. 28
EUR 10 129 317 JPY 1 278 000 000 19/06/2019State Street Bank and
Trust Co. (148 581)
EUR 512 945 NOK 5 000 000 19/06/2019State Street Bank and
Trust Co. (2 305)
EUR 42 278 364 USD 48 319 930 19/06/2019State Street Bank and
Trust Co. (473 378)
GBP 2 909 375 EUR 3 395 812 19/06/2019State Street Bank and
Trust Co. (28 607)
HKD 1 331 316 USD 170 000 19/06/2019State Street Bank and
Trust Co. (5)
USD 37 825 106 EUR 33 176 772 19/06/2019State Street Bank and
Trust Co. 289 527
USD 439 723 GBP 333 000 19/06/2019State Street Bank and
Trust Co. 3 648
USD 676 713 HKD 5 300 000 19/06/2019State Street Bank and
Trust Co. (36)
USD 155 896 JPY 17 100 000 19/06/2019State Street Bank and
Trust Co. 410
USD 99 159 KRW 112 000 000 19/06/2019Merrill Lynch International
Ltd. 404
USD 186 507 NOK 1 600 000 19/06/2019State Street Bank and
Trust Co. 135
Total forward foreign exchange contracts (345 417)
90 Merrill Lynch Investment Solutions
Merrill Lynch Investment Solutions – York Event-DrivenUCITS FundSchedule of Investments as at March 31, 2019 (cont.)(expressed in EUR)
The accompanying notes form an integral part of these financial statements.
Audited annual report

Short/Long Currency Description
Put/Call
StrikePrice
Maturitydate Quantity
Marketvalue EUR
CommitmentEUR
OptionsLong EUR ThyssenKrupp AG Call 14.0000 21/06/2019 13 200 3 696 -Long EUR ThyssenKrupp AG Call 12.0000 21/06/2019 13 200 12 936 -Long USD VanEck Vectors Semiconductor Put 100.0000 17/05/2019 19 700 26 492 -
Total Options 43 124 -
Morgan Stanley and Co., Inc. is the counterparty to these options.
Contracts for difference
The Sub-Fund Merrill Lynch Investment Solutions – York Event-Driven UCITS Fund entered into contracts for difference swaps with nine counterparties (Bank ofAmerica N.A., Barclays Bank Plc., Citibank N.A., Credit Suisse Securities (Europe) Limited, Deutsche Bank AG, Goldman Sachs International, JPMorgan Chase BankN.A., Morgan Stanley Capital Services, Inc. and UBS AG.) with the following details:
Counterparty Industrial sectorUnderlyingnature Long/Short
CommitmentEUR
Unrealisedappreciation/
(depreciation)EUR
Contracts for differenceBank of America N.A. Diversified Financial Services Equity Long 247 952 35 555Bank of America N.A. Machinery-Construction &
MiningEquity Short 325 277 5 836
Barclays Bank Plc. Healthcare-Products Equity Short 185 243 (10 687)Barclays Bank Plc. REITS Equity Long 677 793 (231 203)Barclays Bank Plc. Retail Equity Long 152 042 10 651Citibank N.A. Engineering & Construction Equity Long 1 835 927 246 186Citibank N.A. Insurance Equity Long 866 055 (89 864)Citibank N.A. Insurance Equity Short 310 512 (83)Citibank N.A. Iron/Steel Equity Short 194 536 2 136Citibank N.A. Mining Equity Long 366 728 12 632Citibank N.A. Mining Equity Short 497 718 (13 537)Citibank N.A. Oil & Gas Equity Short 163 842 8 602Citibank N.A. Real Estate Equity Long 249 141 3 867Credit Suisse Securities (Europe) Limited Engineering & Construction Equity Long 326 529 20 562Credit Suisse Securities (Europe) Limited Forest Products & Paper Equity Long 156 968 (7 793)Credit Suisse Securities (Europe) Limited Healthcare-Services Equity Short 284 499 (24 735)Credit Suisse Securities (Europe) Limited Pharmaceuticals Equity Long 301 732 17 824Deutsche Bank AG Swap Index - Diversified Derivatives Short 622 064 (77 966)Goldman Sachs International Auto Parts & Equipment Equity Short 15 797 1 851Goldman Sachs International Beverages Equity Long 458 926 53 506Goldman Sachs International Building Materials Equity Long 300 390 18 303Goldman Sachs International Chemicals Equity Short 194 416 4 993Goldman Sachs International Electrical Components &
EquipmentEquity Short 38 238 1 977
Goldman Sachs International Electronics Equity Short 41 613 3 411Goldman Sachs International Media Equity Long 704 889 60 302Goldman Sachs International Oil & Gas Equity Long 326 864 21 002Goldman Sachs International Real Estate Equity Short 360 538 (25 297)Goldman Sachs International Semiconductors Equity Short 184 441 (5 419)Goldman Sachs International Swap Index - Diversified Derivatives Short 72 059 (1 700)JPMorgan Chase Bank N.A. Auto Parts & Equipment Equity Short 7 329 878
91Merrill Lynch Investment Solutions
Merrill Lynch Investment Solutions – York Event-DrivenUCITS FundSchedule of Investments as at March 31, 2019 (cont.)(expressed in EUR)
The accompanying notes form an integral part of these financial statements.
Audited annual report

Counterparty Industrial sectorUnderlyingnature Long/Short
CommitmentEUR
Unrealisedappreciation/
(depreciation)EUR
Contracts for difference (cont.)JPMorgan Chase Bank N.A. Insurance Equity Long 636 161 (6 264)JPMorgan Chase Bank N.A. Insurance Equity Short 515 182 (2 890)JPMorgan Chase Bank N.A. Packaging & Containers Equity Short 101 997 2 779Morgan Stanley Capital Services, Inc. Apparel Equity Short 451 426 (43 015)Morgan Stanley Capital Services, Inc. Banks Equity Short 78 494 10 644Morgan Stanley Capital Services, Inc. Biotechnology Equity Short 330 606 8 702Morgan Stanley Capital Services, Inc. Chemicals Equity Long 812 160 61 540Morgan Stanley Capital Services, Inc. Chemicals Equity Short 133 219 7 052Morgan Stanley Capital Services, Inc. Closed-end Fund Equity Long 3 900 765 939 519Morgan Stanley Capital Services, Inc. Distribution/Wholesale Equity Short 124 707 5 838Morgan Stanley Capital Services, Inc. Electric Equity Long 1 209 491 92 142Morgan Stanley Capital Services, Inc. Electronics Equity Long 241 976 (22 022)Morgan Stanley Capital Services, Inc. Equity Fund Equity Short 523 498 (15 045)Morgan Stanley Capital Services, Inc. Healthcare-Products Equity Short 280 783 10 287Morgan Stanley Capital Services, Inc. Healthcare-Services Equity Short 73 800 (4 922)Morgan Stanley Capital Services, Inc. Internet Equity Short 3 350 347 (797 964)Morgan Stanley Capital Services, Inc. Oil & Gas Equity Short 253 084 (8 318)Morgan Stanley Capital Services, Inc. Pharmaceuticals Equity Long 2 988 761 442 057Morgan Stanley Capital Services, Inc. REITS Equity Short 543 561 (1 972)Morgan Stanley Capital Services, Inc. Retail Equity Long 384 002 24 244Morgan Stanley Capital Services, Inc. Retail Equity Short 953 207 (5 422)Morgan Stanley Capital Services, Inc. Semiconductors Equity Short 1 422 210 (23 313)Morgan Stanley Capital Services, Inc. Swap Index - Diversified Derivatives Short 4 419 660 (139 131)Morgan Stanley Capital Services, Inc. Telecommunications Equity Short 678 809 24 330Morgan Stanley Capital Services, Inc. Transportation Equity Short 179 271 (1 790)UBS AG Banks Equity Long 568 634 (26 163)UBS AG Banks Equity Short 225 234 17 893UBS AG Building Materials Equity Long 247 010 2 645UBS AG Chemicals Equity Short 98 676 8 074UBS AG Commercial Services Equity Long 293 374 30 022UBS AG Computers Equity Long 394 912 3 205UBS AG Electronics Equity Short 219 769 7 454UBS AG Mining Equity Long 545 856 11 062UBS AG Mining Equity Short 545 507 (11 627)UBS AG Miscellaneous Manufacturing Equity Long 730 232 60 018UBS AG Retail Equity Long 192 549 (4 808)UBS AG Semiconductors Equity Short 187 701 (9 756)UBS AG Transportation Equity Long 430 710 57 027
Total 39 737 399 743 902
Contracts for Difference Summary Breakdowns:
CommitmentLong
CommitmentShort
Unrealisedof short portfolio
Unrealisedof long portfolio
Realised result(monthly reset) Market Value
Counterparty EUR EUR EUR EUR EUR EUR
Bank of America N.A. 247 952 325 277 5 836 35 555 (5 865) 35 526Barclays Bank Plc. 829 835 185 243 (10 687) (220 552) 29 611 (201 628)
92 Merrill Lynch Investment Solutions
Merrill Lynch Investment Solutions – York Event-DrivenUCITS FundSchedule of Investments as at March 31, 2019 (cont.)(expressed in EUR)
The accompanying notes form an integral part of these financial statements.
Audited annual report
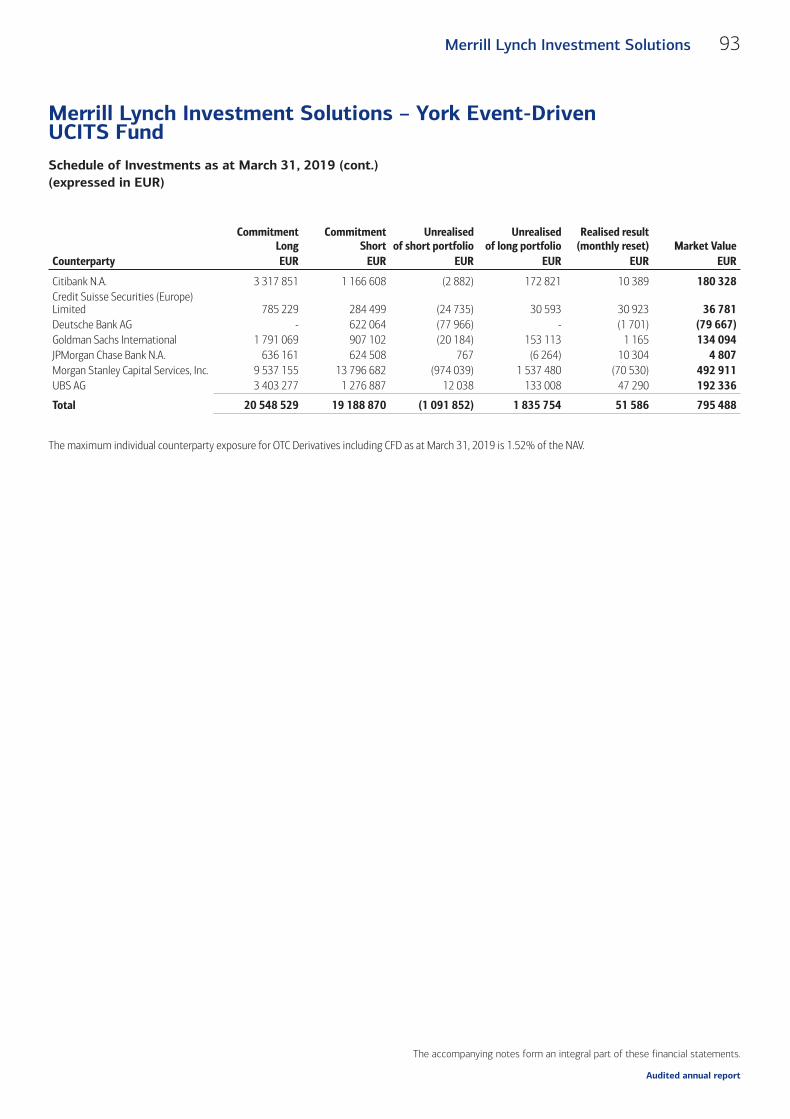
CommitmentLong
CommitmentShort
Unrealisedof short portfolio
Unrealisedof long portfolio
Realised result(monthly reset) Market Value
Counterparty EUR EUR EUR EUR EUR EUR
Citibank N.A. 3 317 851 1 166 608 (2 882) 172 821 10 389 180 328Credit Suisse Securities (Europe)Limited 785 229 284 499 (24 735) 30 593 30 923 36 781Deutsche Bank AG - 622 064 (77 966) - (1 701) (79 667)Goldman Sachs International 1 791 069 907 102 (20 184) 153 113 1 165 134 094JPMorgan Chase Bank N.A. 636 161 624 508 767 (6 264) 10 304 4 807Morgan Stanley Capital Services, Inc. 9 537 155 13 796 682 (974 039) 1 537 480 (70 530) 492 911UBS AG 3 403 277 1 276 887 12 038 133 008 47 290 192 336
Total 20 548 529 19 188 870 (1 091 852) 1 835 754 51 586 795 488
The maximum individual counterparty exposure for OTC Derivatives including CFD as at March 31, 2019 is 1.52% of the NAV.
93Merrill Lynch Investment Solutions
Merrill Lynch Investment Solutions – York Event-DrivenUCITS FundSchedule of Investments as at March 31, 2019 (cont.)(expressed in EUR)
The accompanying notes form an integral part of these financial statements.
Audited annual report

Nominalvalue/
Quantity DescriptionQuotation
CurrencyCostEUR
Marketvalue EUR
% of netassets
Transferable securities and money market instruments admitted to an official exchange listing or dealt in on another regulated market
Shares121 372 Ajinomoto Co., Inc. JPY 1 731 683 1 727 571 1.48
3 017 400 AviChina Industry & Technology Co. Ltd. - H HKD 1 638 104 1 715 071 1.47114 376 Bilibili, Inc. - ADR USD 1 869 967 1 930 289 1.65594 000 Brilliance China Automotive Hldg. Ltd. HKD 516 850 524 297 0.45
20 000 CanSino Biologics, Inc. - H 144A HKD 50 198 78 509 0.0755 942 China Biologic Products Hldg., Inc. USD 3 996 365 4 546 207 3.88
364 000 China Forestry Hldg. Co. Ltd. (a) EUR 118 350 0 0.00366 508 China Gas Hldg. Ltd. HKD 1 098 012 1 147 635 0.98404 500 China Railway Construction Corp. Ltd. - H HKD 506 972 471 762 0.40630 400 China Taiping Insurance Hldg Ltd. HKD 1 602 251 1 673 568 1.43
2 788 000 China Tower Corp. Ltd. - H 144A HKD 583 041 575 673 0.49812 000 China Unicom Hong Kong Ltd. HKD 907 745 916 623 0.78
1 034 807 China Vanke Co. Ltd. - H HKD 3 517 531 3 874 224 3.311 977 CJ Logistics Corp. KRW 283 657 256 714 0.22
777 106 Consun Pharmaceutical Group Ltd. HKD 727 329 507 825 0.4313 600 Dai Nippon Printing Ltd. JPY 282 170 289 656 0.2512 957 Electronic Arts, Inc. USD 1 175 460 1 172 748 1.00
1 369 Fast Retailing Ltd. JPY 574 146 573 122 0.4993 726 Fujitsu General Ltd. JPY 1 099 839 1 180 977 1.0129 825 GDS Hldg Ltd. - ADR USD 937 197 947 993 0.8144 073 Hitachi Construction Machinery Co. Ltd. JPY 998 910 1 041 516 0.8957 019 Hitachi Ltd. JPY 1 573 442 1 644 744 1.41
216 978 Hitachi Metals Ltd. JPY 2 007 839 2 245 154 1.927 298 Hyundai Mobis Co. Ltd. KRW 1 133 798 1 193 862 1.02
86 393 Ibiden Ltd. JPY 1 067 049 1 169 214 1.0046 954 Japan Aviation Electronics Industry Ltd. JPY 561 020 582 190 0.5079 072 JD.com, Inc. - ADR USD 1 990 871 2 123 187 1.81
212 173 kabu.com Securities Ltd. JPY 921 066 949 193 0.8168 495 Leopalace21 Corp. JPY 123 278 121 798 0.10
2 098 400 Maanshan Iron & Steel Co. Ltd. - H HKD 922 757 914 178 0.7816 486 Maxell Hldg Ltd. JPY 209 219 208 259 0.1814 800 Mixi, Inc. JPY 304 164 304 615 0.2633 712 NEC Networks & System Integration Corp. JPY 655 941 725 601 0.62
8 619 NHN Entertainment Corp. KRW 567 447 598 473 0.51300 Nintendo Co. Ltd. JPY 69 930 76 181 0.07
192 156 NTT Data Corp. JPY 1 934 470 1 887 814 1.61121 374 Outsourcing, Inc. JPY 1 450 628 1 334 031 1.14
30 413 Pan Pacific International Hldg. Corp. JPY 1 633 978 1 793 712 1.532 163 100 PICC Property & Casualty Ltd. - H HKD 2 030 624 2 189 036 1.87
144 800 Rakuten, Inc. JPY 1 138 661 1 221 010 1.0420 772 Rohm Ltd. JPY 1 214 729 1 153 233 0.9915 193 Seibu Hldg., Inc. JPY 236 254 236 790 0.2042 078 Square Enix Hldg. Co Ltd. JPY 1 185 851 1 313 640 1.1217 100 Sumitomo Mitsui Financial Group, Inc. JPY 540 938 533 297 0.4616 999 TDK Corp. JPY 1 120 167 1 185 856 1.01
142 197 Toshiba Plant Systems & Services Corp. JPY 2 337 472 2 245 951 1.92
94 Merrill Lynch Investment Solutions
Merrill Lynch Investment Solutions – York AsianEvent-Driven UCITS FundSchedule of Investments as at March 31, 2019(expressed in EUR)
The accompanying notes form an integral part of these financial statements.
Audited annual report
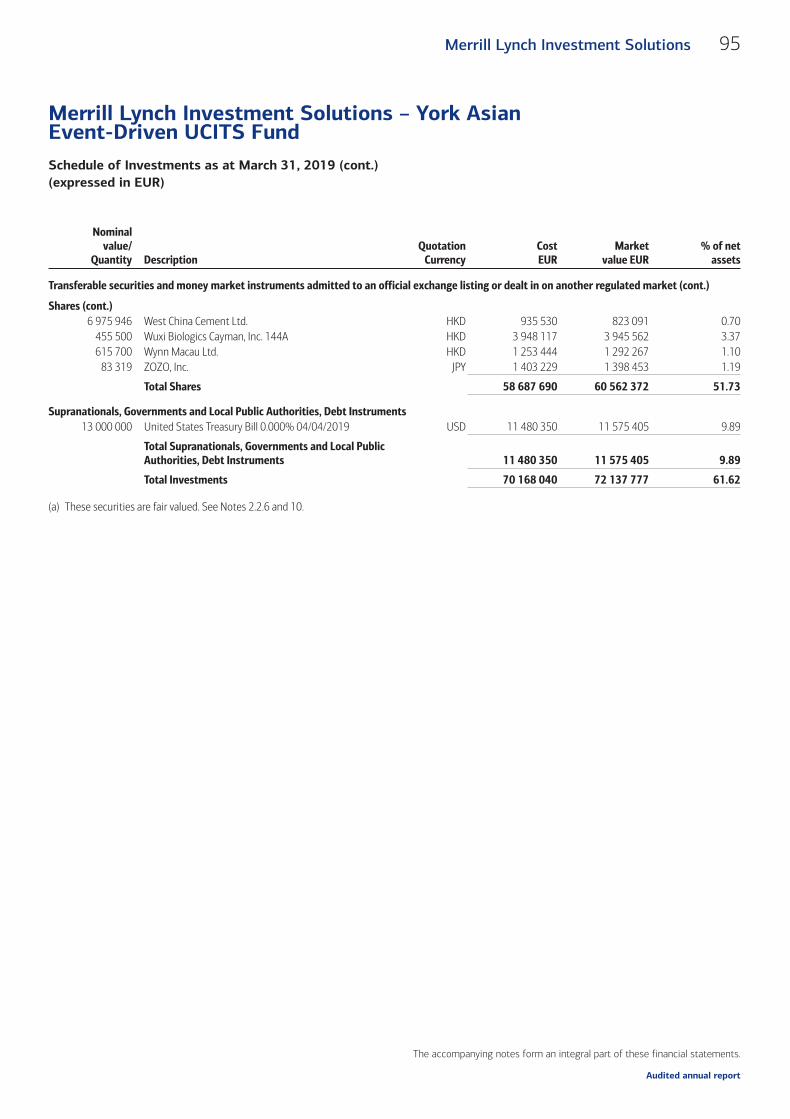
Nominalvalue/
Quantity DescriptionQuotation
CurrencyCostEUR
Marketvalue EUR
% of netassets
Transferable securities and money market instruments admitted to an official exchange listing or dealt in on another regulated market (cont.)
Shares (cont.)6 975 946 West China Cement Ltd. HKD 935 530 823 091 0.70
455 500 Wuxi Biologics Cayman, Inc. 144A HKD 3 948 117 3 945 562 3.37615 700 Wynn Macau Ltd. HKD 1 253 444 1 292 267 1.10
83 319 ZOZO, Inc. JPY 1 403 229 1 398 453 1.19
Total Shares 58 687 690 60 562 372 51.73
Supranationals, Governments and Local Public Authorities, Debt Instruments13 000 000 United States Treasury Bill 0.000% 04/04/2019 USD 11 480 350 11 575 405 9.89
Total Supranationals, Governments and Local PublicAuthorities, Debt Instruments 11 480 350 11 575 405 9.89
Total Investments 70 168 040 72 137 777 61.62
(a) These securities are fair valued. See Notes 2.2.6 and 10.
95Merrill Lynch Investment Solutions
Merrill Lynch Investment Solutions – York AsianEvent-Driven UCITS FundSchedule of Investments as at March 31, 2019 (cont.)(expressed in EUR)
The accompanying notes form an integral part of these financial statements.
Audited annual report
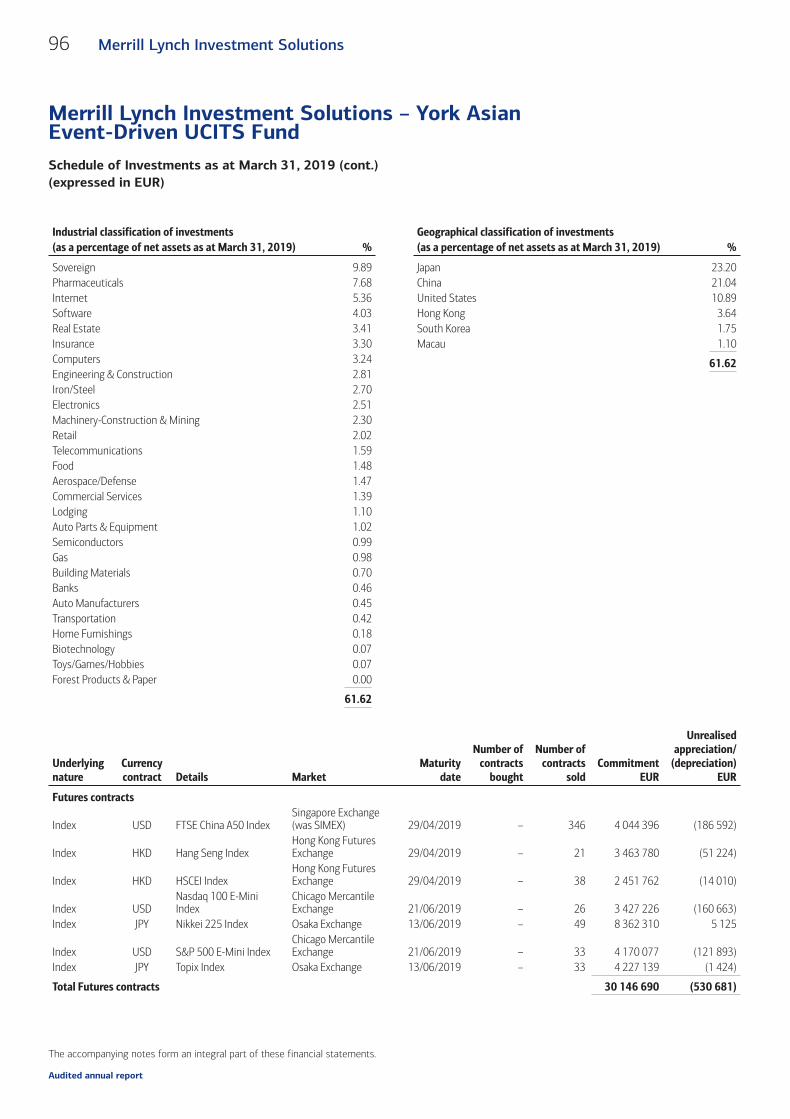
Industrial classification of investments(as a percentage of net assets as at March 31, 2019) %
Sovereign 9.89Pharmaceuticals 7.68Internet 5.36Software 4.03Real Estate 3.41Insurance 3.30Computers 3.24Engineering & Construction 2.81Iron/Steel 2.70Electronics 2.51Machinery-Construction & Mining 2.30Retail 2.02Telecommunications 1.59Food 1.48Aerospace/Defense 1.47Commercial Services 1.39Lodging 1.10Auto Parts & Equipment 1.02Semiconductors 0.99Gas 0.98Building Materials 0.70Banks 0.46Auto Manufacturers 0.45Transportation 0.42Home Furnishings 0.18Biotechnology 0.07Toys/Games/Hobbies 0.07Forest Products & Paper 0.00
61.62
Geographical classification of investments(as a percentage of net assets as at March 31, 2019) %
Japan 23.20China 21.04United States 10.89Hong Kong 3.64South Korea 1.75Macau 1.10
61.62
Underlyingnature
Currencycontract Details Market
Maturitydate
Number ofcontracts
bought
Number ofcontracts
soldCommitment
EUR
Unrealisedappreciation/
(depreciation)EUR
Futures contracts
Index USD FTSE China A50 IndexSingapore Exchange(was SIMEX) 29/04/2019 – 346 4 044 396 (186 592)
Index HKD Hang Seng IndexHong Kong FuturesExchange 29/04/2019 – 21 3 463 780 (51 224)
Index HKD HSCEI IndexHong Kong FuturesExchange 29/04/2019 – 38 2 451 762 (14 010)
Index USDNasdaq 100 E-MiniIndex
Chicago MercantileExchange 21/06/2019 – 26 3 427 226 (160 663)
Index JPY Nikkei 225 Index Osaka Exchange 13/06/2019 – 49 8 362 310 5 125
Index USD S&P 500 E-Mini IndexChicago MercantileExchange 21/06/2019 – 33 4 170 077 (121 893)
Index JPY Topix Index Osaka Exchange 13/06/2019 – 33 4 227 139 (1 424)
Total Futures contracts 30 146 690 (530 681)
96 Merrill Lynch Investment Solutions
Merrill Lynch Investment Solutions – York AsianEvent-Driven UCITS FundSchedule of Investments as at March 31, 2019 (cont.)(expressed in EUR)
The accompanying notes form an integral part of these financial statements.
Audited annual report
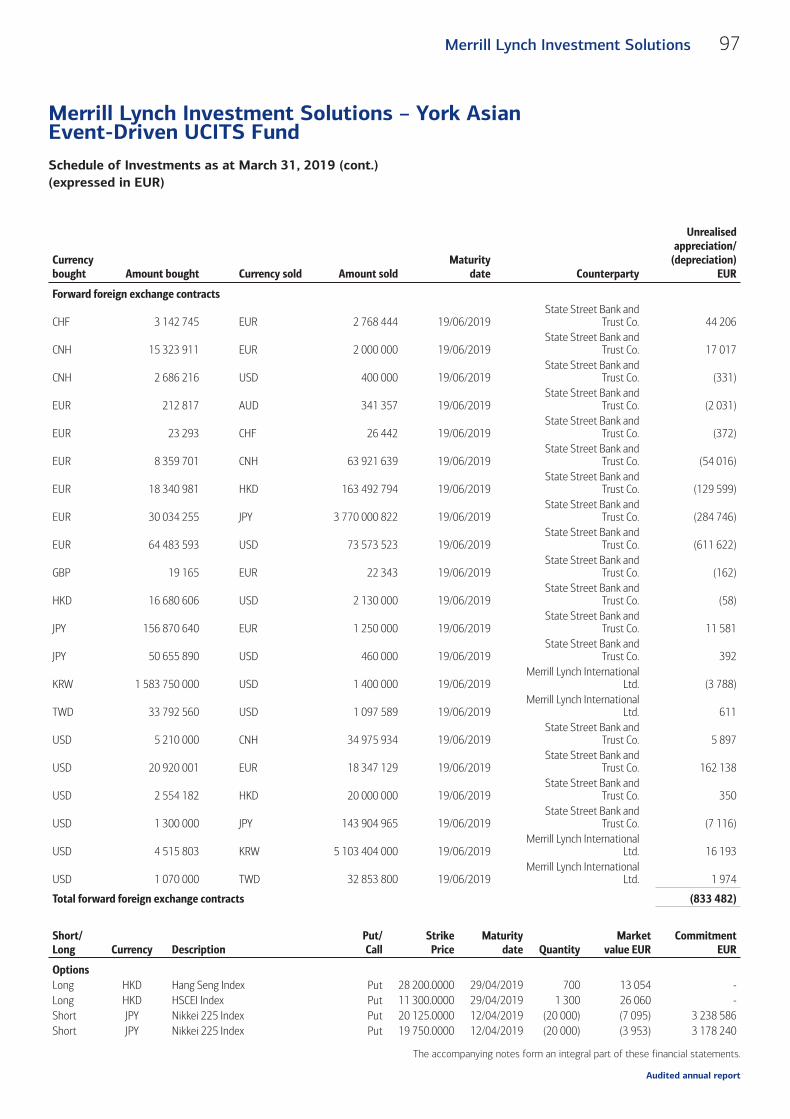
Currencybought Amount bought Currency sold Amount sold
Maturitydate Counterparty
Unrealisedappreciation/
(depreciation)EUR
Forward foreign exchange contracts
CHF 3 142 745 EUR 2 768 444 19/06/2019State Street Bank and
Trust Co. 44 206
CNH 15 323 911 EUR 2 000 000 19/06/2019State Street Bank and
Trust Co. 17 017
CNH 2 686 216 USD 400 000 19/06/2019State Street Bank and
Trust Co. (331)
EUR 212 817 AUD 341 357 19/06/2019State Street Bank and
Trust Co. (2 031)
EUR 23 293 CHF 26 442 19/06/2019State Street Bank and
Trust Co. (372)
EUR 8 359 701 CNH 63 921 639 19/06/2019State Street Bank and
Trust Co. (54 016)
EUR 18 340 981 HKD 163 492 794 19/06/2019State Street Bank and
Trust Co. (129 599)
EUR 30 034 255 JPY 3 770 000 822 19/06/2019State Street Bank and
Trust Co. (284 746)
EUR 64 483 593 USD 73 573 523 19/06/2019State Street Bank and
Trust Co. (611 622)
GBP 19 165 EUR 22 343 19/06/2019State Street Bank and
Trust Co. (162)
HKD 16 680 606 USD 2 130 000 19/06/2019State Street Bank and
Trust Co. (58)
JPY 156 870 640 EUR 1 250 000 19/06/2019State Street Bank and
Trust Co. 11 581
JPY 50 655 890 USD 460 000 19/06/2019State Street Bank and
Trust Co. 392
KRW 1 583 750 000 USD 1 400 000 19/06/2019Merrill Lynch International
Ltd. (3 788)
TWD 33 792 560 USD 1 097 589 19/06/2019Merrill Lynch International
Ltd. 611
USD 5 210 000 CNH 34 975 934 19/06/2019State Street Bank and
Trust Co. 5 897
USD 20 920 001 EUR 18 347 129 19/06/2019State Street Bank and
Trust Co. 162 138
USD 2 554 182 HKD 20 000 000 19/06/2019State Street Bank and
Trust Co. 350
USD 1 300 000 JPY 143 904 965 19/06/2019State Street Bank and
Trust Co. (7 116)
USD 4 515 803 KRW 5 103 404 000 19/06/2019Merrill Lynch International
Ltd. 16 193
USD 1 070 000 TWD 32 853 800 19/06/2019Merrill Lynch International
Ltd. 1 974
Total forward foreign exchange contracts (833 482)
Short/Long Currency Description
Put/Call
StrikePrice
Maturitydate Quantity
Marketvalue EUR
CommitmentEUR
OptionsLong HKD Hang Seng Index Put 28 200.0000 29/04/2019 700 13 054 -Long HKD HSCEI Index Put 11 300.0000 29/04/2019 1 300 26 060 -Short JPY Nikkei 225 Index Put 20 125.0000 12/04/2019 (20 000) (7 095) 3 238 586Short JPY Nikkei 225 Index Put 19 750.0000 12/04/2019 (20 000) (3 953) 3 178 240
97Merrill Lynch Investment Solutions
Merrill Lynch Investment Solutions – York AsianEvent-Driven UCITS FundSchedule of Investments as at March 31, 2019 (cont.)(expressed in EUR)
The accompanying notes form an integral part of these financial statements.
Audited annual report

Short/Long Currency Description
Put/Call
StrikePrice
Maturitydate Quantity
Marketvalue EUR
CommitmentEUR
Options (cont.)Short JPY Nikkei 225 Index Put 19 875.0000 12/04/2019 (10 000) (2 399) 1 599 177Short JPY Nikkei 225 Index Put 19 500.0000 12/04/2019 (14 000) (1 885) 2 196 606Short JPY Nikkei 225 Index Put 19 250.0000 12/04/2019 (10 000) (924) 1 548 889Long JPY Nikkei 225 Index Put 20 500.0000 12/04/2019 10 000 6 490 -Long JPY Nikkei 225 Index Put 20 750.0000 12/04/2019 14 000 13 753 -Long JPY Nikkei 225 Index Put 21 125.0000 12/04/2019 10 000 18 533 -Long JPY Nikkei 225 Index Put 21 000.0000 12/04/2019 20 000 29 998 -Long JPY Nikkei 225 Index Put 21 375.0000 12/04/2019 20 000 56 046 -Short JPY Nikkei 225 Index Put 19 500.0000 10/05/2019 (28 000) (18 200) 4 393 212Short JPY Nikkei 225 Index Put 19 750.0000 10/05/2019 (10 000) (8 271) 1 589 120Long JPY Nikkei 225 Index Put 21 000.0000 10/05/2019 10 000 28 938 -Long JPY Nikkei 225 Index Put 20 750.0000 10/05/2019 14 000 31 423 -Long JPY Nikkei 225 Index Put 20 875.0000 10/05/2019 14 000 35 678 -Short USD S&P 500 Index Put 2 570.0000 18/04/2019 (700) (810) 1 602 173Long USD S&P 500 Index Put 2 680.0000 18/04/2019 700 2 431 -Long USD S&P 500 Index Put 2 735.0000 18/04/2019 700 4 925 -Long USD VanEck Vectors Semiconductor Put 100.0000 17/05/2019 13 100 17 617 -
Total Options 241 409 19 346 003
Morgan Stanley and Co., Inc. is the counterparty to these options.
Contracts for difference
The Sub-Fund Merrill Lynch Investment Solutions – York Asian Event-Driven UCITS Fund entered into contracts for difference swaps with eight counterparties(Bank of America N.A., Citibank N.A., Credit Suisse Securities (Europe) Limited, Goldman Sachs International, JPMorgan Chase Bank N.A., Macquarie Bank Limited,Morgan Stanley Capital Services, Inc. and UBS AG.) with the following details:
Counterparty Industrial sectorUnderlyingnature Long/Short
CommitmentEUR
Unrealisedappreciation/
(depreciation)EUR
Contracts for differenceBank of America N.A. Auto Manufacturers Equity Short 207 017 569Bank of America N.A. Auto Parts & Equipment Equity Long 1 809 549 41 892Bank of America N.A. Healthcare-Products Equity Long 312 273 26 401Bank of America N.A. Insurance Equity Long 5 510 536 (261 005)Bank of America N.A. Internet Equity Long 4 509 802 (353 917)Bank of America N.A. Iron/Steel Equity Short 65 029 (4 351)Bank of America N.A. Machinery-Construction &
MiningEquity Short 991 135 16 917
Bank of America N.A. Miscellaneous Manufacturing Equity Short 1 165 802 59 496Bank of America N.A. Real Estate Equity Long 2 404 354 138 003Bank of America N.A. Retail Equity Long 1 595 206 140 110Bank of America N.A. Semiconductors Equity Long 1 672 717 (330 355)Bank of America N.A. Semiconductors Equity Short 91 750 (10 241)Citibank N.A. Banks Equity Long 1 810 403 (140 956)Citibank N.A. Banks Equity Short 515 502 23 778Citibank N.A. Chemicals Equity Short 251 508 31 872Citibank N.A. Commercial Services Equity Short 643 479 (29 386)
98 Merrill Lynch Investment Solutions
Merrill Lynch Investment Solutions – York AsianEvent-Driven UCITS FundSchedule of Investments as at March 31, 2019 (cont.)(expressed in EUR)
The accompanying notes form an integral part of these financial statements.
Audited annual report

Counterparty Industrial sectorUnderlyingnature Long/Short
CommitmentEUR
Unrealisedappreciation/
(depreciation)EUR
Contracts for difference (cont.)Citibank N.A. Cosmetics/Personal Care Equity Short 1 221 031 (169 460)Citibank N.A. Electronics Equity Long 7 389 105 256 257Citibank N.A. Electronics Equity Short 488 308 (22 675)Citibank N.A. Engineering & Construction Equity Short 32 827 3 788Citibank N.A. Hand/Machine Tools Equity Short 1 542 493 (45 049)Citibank N.A. Insurance Equity Short 1 489 547 317 555Citibank N.A. Iron/Steel Equity Short 1 296 145 13 584Citibank N.A. Machinery-Diversified Equity Short 1 255 759 (83 064)Citibank N.A. Mining Equity Long 609 407 20 991Citibank N.A. Mining Equity Short 1 231 873 (18 027)Citibank N.A. Oil & Gas Equity Long 4 300 346 (1 287 949)Citibank N.A. Oil & Gas Equity Short 1 090 489 56 439Citibank N.A. Telecommunications Equity Short 1 482 291 (41 294)Credit Suisse Securities (Europe) Limited Apparel Equity Short 131 860 (4 547)Credit Suisse Securities (Europe) Limited Chemicals Equity Long 8 256 522 1 617 111Credit Suisse Securities (Europe) Limited Commercial Services Equity Short 548 403 33 987Credit Suisse Securities (Europe) Limited Electrical Components &
EquipmentEquity Short 1 138 686 48 722
Credit Suisse Securities (Europe) Limited Electronics Equity Short 301 584 (911)Credit Suisse Securities (Europe) Limited Office/Business Equipment Equity Long 4 869 051 (122 695)Credit Suisse Securities (Europe) Limited Pharmaceuticals Equity Long 1 004 468 143 461Credit Suisse Securities (Europe) Limited Pharmaceuticals Equity Short 273 078 17 521Credit Suisse Securities (Europe) Limited Toys/Games/Hobbies Equity Long 3 110 478 20 984Goldman Sachs International Auto Parts & Equipment Equity Short 553 003 39 058Goldman Sachs International Beverages Equity Long 3 079 786 384 625Goldman Sachs International Chemicals Equity Short 1 285 039 32 580Goldman Sachs International Distribution/Wholesale Equity Short 144 650 23 787Goldman Sachs International Electrical Components &
EquipmentEquity Short 251 106 11 335
Goldman Sachs International Electronics Equity Short 270 224 17 621Goldman Sachs International Engineering & Construction Equity Long 2 087 270 (6 400)Goldman Sachs International Engineering & Construction Equity Short 11 864 1 197Goldman Sachs International Iron/Steel Equity Short 107 453 (7 195)Goldman Sachs International Pharmaceuticals Equity Short 472 073 2 649Goldman Sachs International Retail Equity Short 609 160 (37 279)Goldman Sachs International Semiconductors Equity Short 1 316 947 8 505JPMorgan Chase Bank N.A. Auto Parts & Equipment Equity Long 554 637 (44 175)JPMorgan Chase Bank N.A. Auto Parts & Equipment Equity Short 120 014 10 175JPMorgan Chase Bank N.A. Banks Equity Short 1 151 250 (24 104)JPMorgan Chase Bank N.A. Building Materials Equity Short 627 522 (26 194)JPMorgan Chase Bank N.A. Commercial Services Equity Short 629 238 (102 356)JPMorgan Chase Bank N.A. Computers Equity Short 580 729 (99 528)JPMorgan Chase Bank N.A. Electronics Equity Long 1 911 393 (30 093)JPMorgan Chase Bank N.A. Electronics Equity Short 1 526 682 (89 006)JPMorgan Chase Bank N.A. Engineering & Construction Equity Short 109 768 14 768JPMorgan Chase Bank N.A. Future Index Derivatives Short 2 664 241 (3 026)JPMorgan Chase Bank N.A. Insurance Equity Short 3 126 749 110 153
99Merrill Lynch Investment Solutions
Merrill Lynch Investment Solutions – York AsianEvent-Driven UCITS FundSchedule of Investments as at March 31, 2019 (cont.)(expressed in EUR)
The accompanying notes form an integral part of these financial statements.
Audited annual report

Counterparty Industrial sectorUnderlyingnature Long/Short
CommitmentEUR
Unrealisedappreciation/
(depreciation)EUR
Contracts for difference (cont.)JPMorgan Chase Bank N.A. Iron/Steel Equity Short 580 792 (39 079)JPMorgan Chase Bank N.A. Oil & Gas Equity Long 968 103 (124 538)JPMorgan Chase Bank N.A. Pharmaceuticals Equity Short 1 476 882 43 223JPMorgan Chase Bank N.A. Real Estate Equity Short 2 633 814 (208 622)JPMorgan Chase Bank N.A. Retail Equity Long 575 303 (318)JPMorgan Chase Bank N.A. Retail Equity Short 200 535 (598)Morgan Stanley Capital Services, Inc. Banks Equity Short 1 752 380 242 038Morgan Stanley Capital Services, Inc. Chemicals Equity Short 2 653 712 (219 530)Morgan Stanley Capital Services, Inc. Closed-end Fund Equity Long 2 674 288 553 791Morgan Stanley Capital Services, Inc. Computers Equity Short 854 795 (5 295)Morgan Stanley Capital Services, Inc. Distribution/Wholesale Equity Short 795 545 40 977Morgan Stanley Capital Services, Inc. Electronics Equity Long 2 172 563 84 182Morgan Stanley Capital Services, Inc. Electronics Equity Short 1 444 669 9 549Morgan Stanley Capital Services, Inc. Engineering & Construction Equity Short 13 1Morgan Stanley Capital Services, Inc. Equity Fund Equity Short 2 147 623 (59 012)Morgan Stanley Capital Services, Inc. Home Furnishings Equity Long 1 740 526 (81 933)Morgan Stanley Capital Services, Inc. Insurance Equity Short 113 099 1 852Morgan Stanley Capital Services, Inc. Internet Equity Short 2 828 313 (149 887)Morgan Stanley Capital Services, Inc. Oil & Gas Equity Short 1 681 783 96 130Morgan Stanley Capital Services, Inc. Pharmaceuticals Equity Long 1 381 626 (45 813)Morgan Stanley Capital Services, Inc. Pharmaceuticals Equity Short 292 202 (8 057)Morgan Stanley Capital Services, Inc. Real Estate Equity Short 1 463 634 (23 720)Morgan Stanley Capital Services, Inc. REITS Equity Short 814 394 (99 129)Morgan Stanley Capital Services, Inc. Retail Equity Short 1 824 646 46 335Morgan Stanley Capital Services, Inc. Semiconductors Equity Short 3 866 673 (50 811)Morgan Stanley Capital Services, Inc. Software Equity Long 2 555 670 114 971Morgan Stanley Capital Services, Inc. Software Equity Short 283 400 (17 685)UBS AG Chemicals Equity Short 1 197 402 30 927UBS AG Commercial Services Equity Long 1 088 556 57 112UBS AG Electronics Equity Short 1 213 363 (97 403)UBS AG Engineering & Construction Equity Short 598 498 4 697UBS AG Internet Equity Short 642 959 (17 939)UBS AG Iron/Steel Equity Long 601 081 51 153UBS AG Lodging Equity Short 250 443 10 278UBS AG Mining Equity Long 1 915 010 (183 284)UBS AG Mining Equity Short 909 016 (19 320)UBS AG Real Estate Equity Short 615 771 (27 169)UBS AG Semiconductors Equity Short 1 518 452 (51 971)UBS AG Swap Index - Diversified Derivatives Long 1 767 424 47 795UBS AG Swap Index - Diversified Derivatives Short 1 778 655 (74 485)
Total 143 684 224 120 066
100 Merrill Lynch Investment Solutions
Merrill Lynch Investment Solutions – York AsianEvent-Driven UCITS FundSchedule of Investments as at March 31, 2019 (cont.)(expressed in EUR)
The accompanying notes form an integral part of these financial statements.
Audited annual report

Contracts for Difference Summary Breakdowns:
CommitmentLong
CommitmentShort
Unrealisedof short portfolio
Unrealisedof long portfolio
Realised result(monthly reset) Market Value
Counterparty EUR EUR EUR EUR EUR EUR
Bank of America N.A. 17 814 437 2 520 733 62 390 (598 871) 88 445 (448 036)Citibank N.A. 14 109 261 12 541 252 38 061 (1 151 657) (470 201) (1 583 797)Credit Suisse Securities (Europe)Limited 17 240 519 2 393 611 94 772 1 658 861 133 933 1 887 566Goldman Sachs International 5 167 056 5 021 519 92 258 378 225 (245 385) 225 098JPMorgan Chase Bank N.A. 4 009 436 15 428 216 (414 194) (199 124) (77 090) (690 408)Morgan Stanley Capital Services, Inc. 10 524 673 22 816 881 (196 244) 625 198 (133 120) 295 834UBS AG 5 372 071 8 724 559 (242 385) (27 224) (238 202) (507 811)
Total 74 237 453 69 446 771 (565 342) 685 408 (941 620) (821 554)
The maximum individual counterparty exposure for OTC Derivatives including CFD as at March 31, 2019 is 6.67% of the NAV.
101Merrill Lynch Investment Solutions
Merrill Lynch Investment Solutions – York AsianEvent-Driven UCITS FundSchedule of Investments as at March 31, 2019 (cont.)(expressed in EUR)
The accompanying notes form an integral part of these financial statements.
Audited annual report

Nominalvalue/
Quantity DescriptionQuotation
CurrencyCostUSD
Marketvalue USD
% of netassets
Transferable securities and money market instruments admitted to an official exchange listing or dealt in on another regulated market
Bonds250 000 8x8, Inc. 144A 0.500% 01/02/2024 USD 250 611 255 275 0.04
1 500 000 Ares Capital Corp. 4.625% 01/03/2024 USD 1 470 396 1 488 750 0.23450 000 Benefitfocus, Inc. 144A 1.250% 15/12/2023 USD 450 000 514 935 0.08
1 050 000 Chegg, Inc. 144A 0.125% 15/03/2025 USD 1 050 000 1 034 424 0.161 525 000 Deutsche Bank AG 1.000% 01/05/2023 USD 1 539 117 1 434 888 0.231 125 000 Exact Sciences Corp. 0.375% 15/03/2027 USD 1 119 421 1 144 999 0.18
675 000 GOL Equity Finance S.A. 144A 3.750% 15/07/2024 USD 675 000 633 706 0.101 275 000 iQIYI, Inc. 144A 2.000% 01/04/2025 USD 1 275 000 1 326 000 0.21
125 000 LivePerson, Inc. 144A 0.750% 01/03/2024 USD 125 000 128 600 0.021 100 000 Micron Technology, Inc. 2.125% 15/02/2033 USD 1 808 564 4 150 740 0.66
13 622 000 Novellus Systems, Inc. 2.625% 15/05/2041 USD 57 185 228 75 195 404 11.87875 000 Pluralsight, Inc. 144A 0.375% 01/03/2024 USD 875 000 933 833 0.15
Total Bonds 67 823 337 88 241 554 13.93
Shares5 925 American Electric Power Co, Inc. USD 296 250 304 841 0.054 474 Bemis Co., Inc. USD 246 562 248 217 0.04
15 975 Colfax Corp. USD 1 617 047 2 126 752 0.341 325 Danaher Corp. USD 1 325 000 1 395 212 0.22
236 902 Genworth Financial, Inc. - A USD 888 020 907 335 0.1412 754 Intrexon Corp. USD 96 020 67 086 0.01
868 Tesla, Inc. USD 263 430 242 918 0.04
Total Shares 4 732 329 5 292 361 0.84
Supranationals, Governments and Local Public Authorities, Debt Instruments18 000 000 United States Treasury Bill 0.000% 25/04/2019 USD 17 970 900 17 971 935 2.8430 000 000 United States Treasury Bill 0.000% 09/05/2019 USD 29 922 417 29 925 108 4.7219 490 000 United States Treasury Bill 0.000% 30/05/2019 USD 19 411 902 19 414 856 3.0730 000 000 United States Treasury Bill 0.000% 06/06/2019 USD 29 864 700 29 870 200 4.7230 000 000 United States Treasury Bill 0.000% 13/06/2019 USD 29 849 377 29 856 205 4.7116 300 000 United States Treasury Bill 0.000% 15/08/2019 USD 16 149 134 16 153 291 2.5510 000 000 United States Treasury Bill 0.000% 05/09/2019 USD 9 893 807 9 896 969 1.5610 000 000 United States Treasury Bill 0.000% 12/09/2019 USD 9 888 617 9 892 147 1.5611 000 000 United States Treasury Bill 0.000% 19/09/2019 USD 10 871 987 10 876 168 1.72
Total Supranationals, Governments and Local PublicAuthorities, Debt Instruments 173 822 841 173 856 879 27.45
Other transferable securities
Bonds3 250 000 SunEdison, Inc. (Defaulted) 0.250% 15/01/2020 USD 1 576 659 65 000 0.018 050 000 SunEdison, Inc. (Defaulted) 2.000% 01/10/2018 USD 5 716 512 161 000 0.031 425 000 SunEdison, Inc. (Defaulted) 2.750% 01/01/2021 USD 565 998 28 500 0.00
Total Bonds 7 859 169 254 500 0.04
Total Investments 254 237 676 267 645 294 42.26
102 Merrill Lynch Investment Solutions
Merrill Lynch Investment Solutions – AQR GlobalRelative Value UCITS FundSchedule of Investments as at March 31, 2019(expressed in USD)
The accompanying notes form an integral part of these financial statements.
Audited annual report
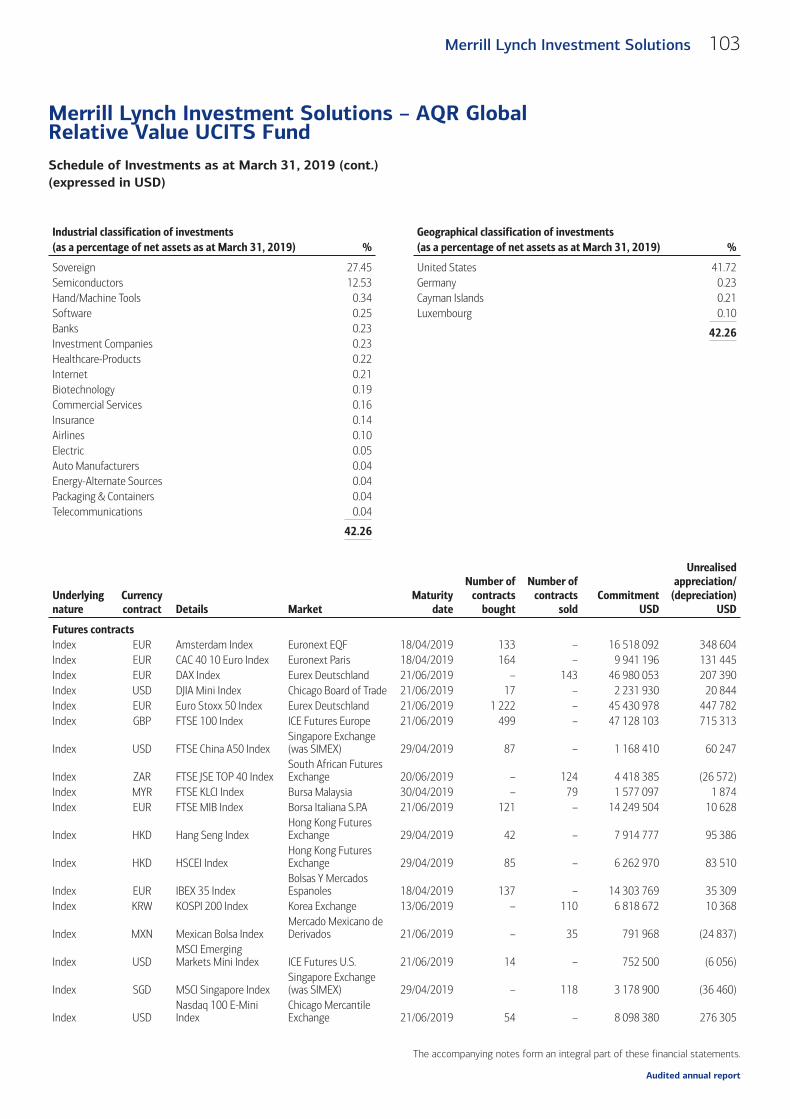
Industrial classification of investments(as a percentage of net assets as at March 31, 2019) %
Sovereign 27.45Semiconductors 12.53Hand/Machine Tools 0.34Software 0.25Banks 0.23Investment Companies 0.23Healthcare-Products 0.22Internet 0.21Biotechnology 0.19Commercial Services 0.16Insurance 0.14Airlines 0.10Electric 0.05Auto Manufacturers 0.04Energy-Alternate Sources 0.04Packaging & Containers 0.04Telecommunications 0.04
42.26
Geographical classification of investments(as a percentage of net assets as at March 31, 2019) %
United States 41.72Germany 0.23Cayman Islands 0.21Luxembourg 0.10
42.26
Underlyingnature
Currencycontract Details Market
Maturitydate
Number ofcontracts
bought
Number ofcontracts
soldCommitment
USD
Unrealisedappreciation/
(depreciation)USD
Futures contractsIndex EUR Amsterdam Index Euronext EQF 18/04/2019 133 – 16 518 092 348 604Index EUR CAC 40 10 Euro Index Euronext Paris 18/04/2019 164 – 9 941 196 131 445Index EUR DAX Index Eurex Deutschland 21/06/2019 – 143 46 980 053 207 390Index USD DJIA Mini Index Chicago Board of Trade 21/06/2019 17 – 2 231 930 20 844Index EUR Euro Stoxx 50 Index Eurex Deutschland 21/06/2019 1 222 – 45 430 978 447 782Index GBP FTSE 100 Index ICE Futures Europe 21/06/2019 499 – 47 128 103 715 313
Index USD FTSE China A50 IndexSingapore Exchange(was SIMEX) 29/04/2019 87 – 1 168 410 60 247
Index ZAR FTSE JSE TOP 40 IndexSouth African FuturesExchange 20/06/2019 – 124 4 418 385 (26 572)
Index MYR FTSE KLCI Index Bursa Malaysia 30/04/2019 – 79 1 577 097 1 874Index EUR FTSE MIB Index Borsa Italiana S.P.A 21/06/2019 121 – 14 249 504 10 628
Index HKD Hang Seng IndexHong Kong FuturesExchange 29/04/2019 42 – 7 914 777 95 386
Index HKD HSCEI IndexHong Kong FuturesExchange 29/04/2019 85 – 6 262 970 83 510
Index EUR IBEX 35 IndexBolsas Y MercadosEspanoles 18/04/2019 137 – 14 303 769 35 309
Index KRW KOSPI 200 Index Korea Exchange 13/06/2019 – 110 6 818 672 10 368
Index MXN Mexican Bolsa IndexMercado Mexicano deDerivados 21/06/2019 – 35 791 968 (24 837)
Index USDMSCI EmergingMarkets Mini Index ICE Futures U.S. 21/06/2019 14 – 752 500 (6 056)
Index SGD MSCI Singapore IndexSingapore Exchange(was SIMEX) 29/04/2019 – 118 3 178 900 (36 460)
Index USDNasdaq 100 E-MiniIndex
Chicago MercantileExchange 21/06/2019 54 – 8 098 380 276 305
103Merrill Lynch Investment Solutions
Merrill Lynch Investment Solutions – AQR GlobalRelative Value UCITS FundSchedule of Investments as at March 31, 2019 (cont.)(expressed in USD)
The accompanying notes form an integral part of these financial statements.
Audited annual report

Underlyingnature
Currencycontract Details Market
Maturitydate
Number ofcontracts
bought
Number ofcontracts
soldCommitment
USD
Unrealisedappreciation/
(depreciation)USD
Futures contracts (cont.)Index JPY Nikkei 225 Index Osaka Exchange 13/06/2019 – 4 775 173 (9 125)Index SEK OMXS30 Index NASDAQ OMX Nordic 17/04/2019 295 – 4 990 984 17 105
Index USDRussell 2000 MiniIndex
Chicago MercantileExchange 21/06/2019 255 – 19 884 900 43 942
Index USD S&P 500 E-Mini IndexChicago MercantileExchange 21/06/2019 – 564 80 948 100 (1 202 349)
Index USDS&P MidCap400 E-Mini Index
Chicago MercantileExchange 21/06/2019 1 – 192 700 1 150
Index CAD S&P TSX 60 Index Montreal Exchange 20/06/2019 223 – 32 239 395 127 589
Index THB SET 50 IndexThailand FuturesExchange 27/06/2019 – 427 2 928 654 (4 143)
Index AUD SPI 200 IndexAustralian StockExchange 20/06/2019 53 – 5 839 289 (8 684)
Index CHF Swiss Market Index Eurex Deutschland 21/06/2019 – 180 16 948 087 (161 611)Index JPY Topix Index Osaka Exchange 13/06/2019 – 93 13 531 779 38 849
Interest rate AUD10 Year AustralianTreasury Bond
Australian StockExchange 17/06/2019 424 – 41 631 681 832 226
Interest rate CAD10 Year Government ofCanada Bond Montreal Exchange 19/06/2019 29 – 3 002 133 (22 535)
Interest rate JPY10 Year JapanGovernment Bond Osaka Exchange 13/06/2019 142 – 196 492 027 491 492
Interest rate USD10 Year US TreasuryNote Chicago Board of Trade 19/06/2019 – 976 120 642 750 (851 504)
Interest rate USD2 Year US TreasuryNote Chicago Board of Trade 28/06/2019 5 – 1 064 414 (715)
Interest rate CAD3 Month CanadianBanker's Acceptance Montreal Exchange 17/06/2019 – 35 6 416 034 (2 189)
Interest rate CAD3 Month CanadianBanker's Acceptance Montreal Exchange 16/09/2019 – 144 26 408 174 (25 585)
Interest rate CAD3 Month CanadianBanker's Acceptance Montreal Exchange 16/12/2019 – 138 25 307 833 (35 290)
Interest rate CAD3 Month CanadianBanker's Acceptance Montreal Exchange 16/03/2020 – 123 22 566 189 (38 550)
Interest rate EUR 3 Month Euribor ICE Futures Europe 17/06/2019 6 – 1 689 496 70Interest rate EUR 3 Month Euribor ICE Futures Europe 16/09/2019 – 29 8 165 898 (1 235)Interest rate EUR 3 Month Euribor ICE Futures Europe 16/12/2019 – 22 6 194 819 (1 109)Interest rate EUR 3 Month Euribor ICE Futures Europe 16/03/2020 – 6 1 689 243 (123)Interest rate EUR 3 Month Euribor ICE Futures Europe 15/06/2020 74 – 20 829 848 23 608Interest rate EUR 3 Month Euribor ICE Futures Europe 14/09/2020 73 – 20 542 216 27 811Interest rate EUR 3 Month Euribor ICE Futures Europe 14/12/2020 62 – 17 439 852 27 720Interest rate EUR 3 Month Euribor ICE Futures Europe 15/03/2021 33 – 9 278 333 11 593Interest rate CHF 3 Month Euroswiss ICE Futures Europe 16/09/2019 – 1 252 887 (50)Interest rate CHF 3 Month Euroswiss ICE Futures Europe 16/12/2019 4 – 1 011 547 527Interest rate CHF 3 Month Euroswiss ICE Futures Europe 16/03/2020 6 – 1 517 170 979
Interest rate AUD3 Year AustralianTreasury Bond
Australian StockExchange 17/06/2019 529 – 42 674 138 229 776
Interest rate USD5 Year US TreasuryNote Chicago Board of Trade 28/06/2019 135 – 15 594 609 121 924
Interest rate AUD90 Day Australian BankBill
Australian StockExchange 13/06/2019 85 – 60 135 080 40 901
104 Merrill Lynch Investment Solutions
Merrill Lynch Investment Solutions – AQR GlobalRelative Value UCITS FundSchedule of Investments as at March 31, 2019 (cont.)(expressed in USD)
The accompanying notes form an integral part of these financial statements.
Audited annual report

Underlyingnature
Currencycontract Details Market
Maturitydate
Number ofcontracts
bought
Number ofcontracts
soldCommitment
USD
Unrealisedappreciation/
(depreciation)USD
Futures contracts (cont.)
Interest rate AUD90 Day Australian BankBill
Australian StockExchange 12/09/2019 256 – 181 161 648 150 703
Interest rate AUD90 Day Australian BankBill
Australian StockExchange 12/12/2019 269 – 190 394 001 185 596
Interest rate AUD90 Day Australian BankBill
Australian StockExchange 12/03/2020 204 – 144 402 207 89 063
Interest rate USD 90 Day EurodollarChicago MercantileExchange 17/06/2019 – 58 14 128 800 (9 350)
Interest rate USD 90 Day EurodollarChicago MercantileExchange 16/09/2019 – 96 23 401 200 10 212
Interest rate USD 90 Day EurodollarChicago MercantileExchange 16/12/2019 – 144 35 109 000 10 498
Interest rate USD 90 Day EurodollarChicago MercantileExchange 16/03/2020 – 104 25 382 500 23 861
Interest rate USD 90 Day EurodollarChicago MercantileExchange 15/06/2020 202 – 49 338 500 118 290
Interest rate USD 90 Day EurodollarChicago MercantileExchange 14/09/2020 241 – 58 897 388 168 315
Interest rate USD 90 Day EurodollarChicago MercantileExchange 14/12/2020 264 – 64 528 200 213 577
Interest rate USD 90 Day EurodollarChicago MercantileExchange 15/03/2021 272 – 66 500 600 200 758
Interest rate GBP 90 Day Sterling ICE Futures Europe 19/06/2019 107 – 17 281 031 25 655Interest rate GBP 90 Day Sterling ICE Futures Europe 18/09/2019 424 – 68 485 008 130 492Interest rate GBP 90 Day Sterling ICE Futures Europe 18/12/2019 447 – 72 185 435 153 115Interest rate GBP 90 Day Sterling ICE Futures Europe 18/03/2020 350 – 56 523 885 102 653Interest rate GBP 90 Day Sterling ICE Futures Europe 17/06/2020 49 – 7 911 748 12 975Interest rate GBP 90 Day Sterling ICE Futures Europe 16/09/2020 46 – 7 424 358 11 519Interest rate GBP 90 Day Sterling ICE Futures Europe 16/12/2020 43 – 6 937 709 10 699Interest rate GBP 90 Day Sterling ICE Futures Europe 17/03/2021 37 – 5 968 150 12 330Interest rate EUR Euro BTP Eurex Deutschland 06/06/2019 54 – 7 838 143 54 425Interest rate EUR Euro OAT Eurex Deutschland 06/06/2019 58 – 10 541 180 293 199Interest rate EUR German Euro BOBL Eurex Deutschland 06/06/2019 240 – 35 835 979 284 459Interest rate EUR German Euro BUND Eurex Deutschland 06/06/2019 643 – 119 612 493 2 261 538Interest rate EUR German Euro BUXL Eurex Deutschland 06/06/2019 6 – 1 278 028 64 586Interest rate EUR German Euro SCHATZ Eurex Deutschland 06/06/2019 281 – 35 330 443 47 996Interest rate GBP Long Gilt ICE Futures Europe 26/06/2019 – 566 95 037 671 (1 603 547)Interest rate USD US Long Bond Chicago Board of Trade 19/06/2019 60 – 8 893 125 236 020Interest rate USD US Ultra Long Bond Chicago Board of Trade 19/06/2019 30 – 4 977 188 142 110
Total Futures contracts 2 481 896 734 5 425 292
Currencybought Amount bought Currency sold Amount sold
Maturitydate Counterparty
Unrealisedappreciation/
(depreciation)USD
Forward foreign exchange contractsAUD 148 484 000 USD 105 929 617 19/06/2019 Citibank N.A. (302 788)BRL 32 414 000 USD 8 481 605 19/06/2019 Citibank N.A. (197 811)
105Merrill Lynch Investment Solutions
Merrill Lynch Investment Solutions – AQR GlobalRelative Value UCITS FundSchedule of Investments as at March 31, 2019 (cont.)(expressed in USD)
The accompanying notes form an integral part of these financial statements.
Audited annual report
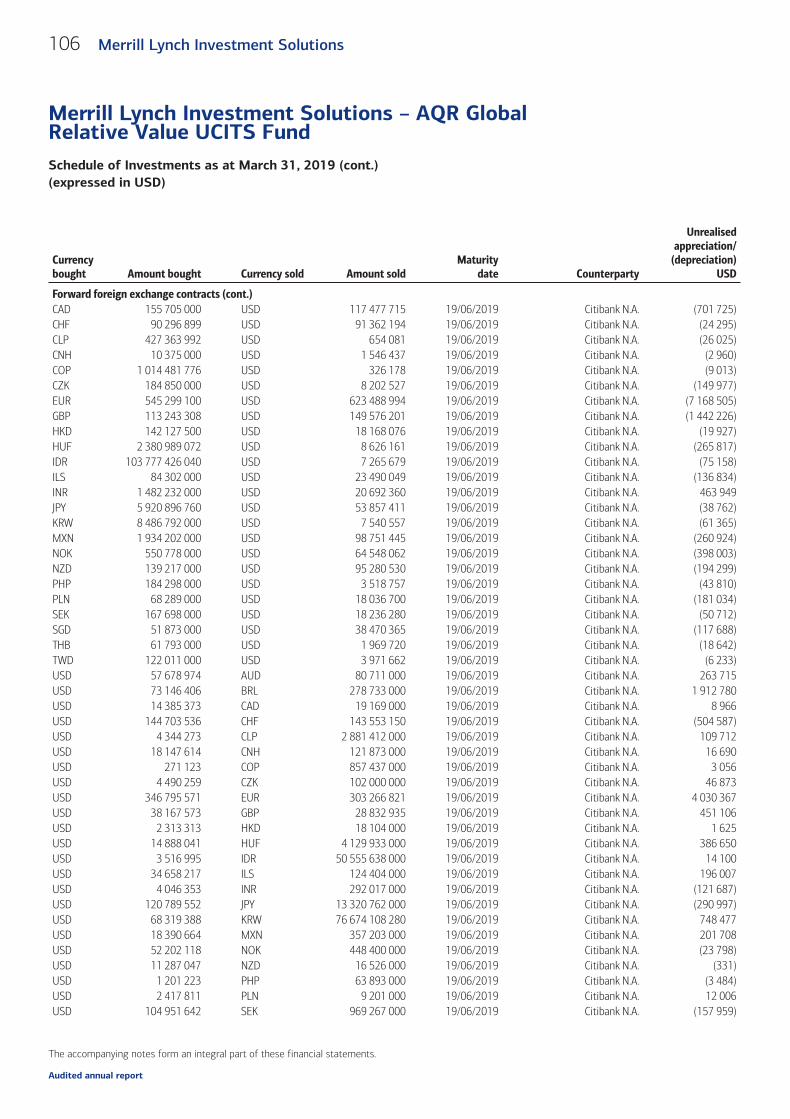
Currencybought Amount bought Currency sold Amount sold
Maturitydate Counterparty
Unrealisedappreciation/
(depreciation)USD
Forward foreign exchange contracts (cont.)CAD 155 705 000 USD 117 477 715 19/06/2019 Citibank N.A. (701 725)CHF 90 296 899 USD 91 362 194 19/06/2019 Citibank N.A. (24 295)CLP 427 363 992 USD 654 081 19/06/2019 Citibank N.A. (26 025)CNH 10 375 000 USD 1 546 437 19/06/2019 Citibank N.A. (2 960)COP 1 014 481 776 USD 326 178 19/06/2019 Citibank N.A. (9 013)CZK 184 850 000 USD 8 202 527 19/06/2019 Citibank N.A. (149 977)EUR 545 299 100 USD 623 488 994 19/06/2019 Citibank N.A. (7 168 505)GBP 113 243 308 USD 149 576 201 19/06/2019 Citibank N.A. (1 442 226)HKD 142 127 500 USD 18 168 076 19/06/2019 Citibank N.A. (19 927)HUF 2 380 989 072 USD 8 626 161 19/06/2019 Citibank N.A. (265 817)IDR 103 777 426 040 USD 7 265 679 19/06/2019 Citibank N.A. (75 158)ILS 84 302 000 USD 23 490 049 19/06/2019 Citibank N.A. (136 834)INR 1 482 232 000 USD 20 692 360 19/06/2019 Citibank N.A. 463 949JPY 5 920 896 760 USD 53 857 411 19/06/2019 Citibank N.A. (38 762)KRW 8 486 792 000 USD 7 540 557 19/06/2019 Citibank N.A. (61 365)MXN 1 934 202 000 USD 98 751 445 19/06/2019 Citibank N.A. (260 924)NOK 550 778 000 USD 64 548 062 19/06/2019 Citibank N.A. (398 003)NZD 139 217 000 USD 95 280 530 19/06/2019 Citibank N.A. (194 299)PHP 184 298 000 USD 3 518 757 19/06/2019 Citibank N.A. (43 810)PLN 68 289 000 USD 18 036 700 19/06/2019 Citibank N.A. (181 034)SEK 167 698 000 USD 18 236 280 19/06/2019 Citibank N.A. (50 712)SGD 51 873 000 USD 38 470 365 19/06/2019 Citibank N.A. (117 688)THB 61 793 000 USD 1 969 720 19/06/2019 Citibank N.A. (18 642)TWD 122 011 000 USD 3 971 662 19/06/2019 Citibank N.A. (6 233)USD 57 678 974 AUD 80 711 000 19/06/2019 Citibank N.A. 263 715USD 73 146 406 BRL 278 733 000 19/06/2019 Citibank N.A. 1 912 780USD 14 385 373 CAD 19 169 000 19/06/2019 Citibank N.A. 8 966USD 144 703 536 CHF 143 553 150 19/06/2019 Citibank N.A. (504 587)USD 4 344 273 CLP 2 881 412 000 19/06/2019 Citibank N.A. 109 712USD 18 147 614 CNH 121 873 000 19/06/2019 Citibank N.A. 16 690USD 271 123 COP 857 437 000 19/06/2019 Citibank N.A. 3 056USD 4 490 259 CZK 102 000 000 19/06/2019 Citibank N.A. 46 873USD 346 795 571 EUR 303 266 821 19/06/2019 Citibank N.A. 4 030 367USD 38 167 573 GBP 28 832 935 19/06/2019 Citibank N.A. 451 106USD 2 313 313 HKD 18 104 000 19/06/2019 Citibank N.A. 1 625USD 14 888 041 HUF 4 129 933 000 19/06/2019 Citibank N.A. 386 650USD 3 516 995 IDR 50 555 638 000 19/06/2019 Citibank N.A. 14 100USD 34 658 217 ILS 124 404 000 19/06/2019 Citibank N.A. 196 007USD 4 046 353 INR 292 017 000 19/06/2019 Citibank N.A. (121 687)USD 120 789 552 JPY 13 320 762 000 19/06/2019 Citibank N.A. (290 997)USD 68 319 388 KRW 76 674 108 280 19/06/2019 Citibank N.A. 748 477USD 18 390 664 MXN 357 203 000 19/06/2019 Citibank N.A. 201 708USD 52 202 118 NOK 448 400 000 19/06/2019 Citibank N.A. (23 798)USD 11 287 047 NZD 16 526 000 19/06/2019 Citibank N.A. (331)USD 1 201 223 PHP 63 893 000 19/06/2019 Citibank N.A. (3 484)USD 2 417 811 PLN 9 201 000 19/06/2019 Citibank N.A. 12 006USD 104 951 642 SEK 969 267 000 19/06/2019 Citibank N.A. (157 959)
106 Merrill Lynch Investment Solutions
Merrill Lynch Investment Solutions – AQR GlobalRelative Value UCITS FundSchedule of Investments as at March 31, 2019 (cont.)(expressed in USD)
The accompanying notes form an integral part of these financial statements.
Audited annual report

Currencybought Amount bought Currency sold Amount sold
Maturitydate Counterparty
Unrealisedappreciation/
(depreciation)USD
Forward foreign exchange contracts (cont.)USD 1 337 613 SGD 1 805 000 19/06/2019 Citibank N.A. 3 074USD 170 356 THB 5 405 000 19/06/2019 Citibank N.A. (303)USD 20 290 856 TWD 623 116 000 19/06/2019 Citibank N.A. 39 221USD 33 416 592 ZAR 480 541 000 19/06/2019 Citibank N.A. 404 690ZAR 221 469 000 USD 15 470 711 19/06/2019 Citibank N.A. (256 372)
Total forward foreign exchange contracts (3 939 279)
Short/Long Currency Description
Put/Call
StrikePrice
Maturitydate Quantity
Marketvalue USD
CommitmentUSD
OptionsShort USD 10 Year US Treasury Note Call 124.5000 26/04/2019 (22 000) (8 937) 2 739 000*Short USD 10 Year US Treasury Note Call 124.0000 26/04/2019 (11 000) (7 047) 1 364 000*Short USD 10 Year US Treasury Note Call 125.0000 26/04/2019 (22 000) (5 500) 2 750 000*Short USD 10 Year US Treasury Note Call 124.5000 24/05/2019 (21 000) (13 125) 2 614 500*Short USD 10 Year US Treasury Note Call 125.0000 24/05/2019 (21 000) (9 516) 2 625 000*Short USD 10 Year US Treasury Note Call 124.0000 24/05/2019 (10 000) (8 437) 1 240 000*Short USD 10 Year US Treasury Note Put 124.0000 26/04/2019 (32 000) (13 500) 3 968 000Short USD 10 Year US Treasury Note Put 123.5000 26/04/2019 (22 000) (4 813) 2 717 000Short USD 10 Year US Treasury Note Put 123.5000 24/05/2019 (22 000) (9 281) 2 717 000Short USD 10 Year US Treasury Note Put 124.0000 24/05/2019 (12 000) (7 500) 1 488 000Short USD 10 Year US Treasury Note Put 123.0000 24/05/2019 (22 000) (5 844) 2 706 000Short EUR Euro Stoxx 50 Index Call 3 300.0000 18/04/2019 (80) (6 369) 296 432*Short EUR Euro Stoxx 50 Index Call 3 275.0000 18/04/2019 (40) (4 042) 147 093*Short EUR Euro Stoxx 50 Index Call 3 250.0000 17/05/2019 (70) (7 608) 255 448*Short EUR Euro Stoxx 50 Index Call 3 325.0000 17/05/2019 (100) (5 771) 373 348*Short EUR Euro Stoxx 50 Index Call 3 225.0000 17/05/2019 (30) (3 864) 108 636*Short EUR Euro Stoxx 50 Index Put 3 275.0000 18/04/2019 (140) (3 301) 514 827Short EUR Euro Stoxx 50 Index Put 3 250.0000 18/04/2019 (170) (3 131) 620 375Short EUR Euro Stoxx 50 Index Put 3 225.0000 18/04/2019 (150) (2 173) 543 179Short EUR Euro Stoxx 50 Index Put 3 200.0000 18/04/2019 (100) (1 134) 359 312Short EUR Euro Stoxx 50 Index Put 3 300.0000 18/04/2019 (30) (910) 111 162Short EUR Euro Stoxx 50 Index Put 3 150.0000 18/04/2019 (100) (719) 353 698Short EUR Euro Stoxx 50 Index Put 3 175.0000 18/04/2019 (40) (359) 142 602Short EUR Euro Stoxx 50 Index Put 3 275.0000 17/05/2019 (100) (6 266) 367 733Short EUR Euro Stoxx 50 Index Put 3 250.0000 17/05/2019 (100) (5 322) 364 926Short EUR Euro Stoxx 50 Index Put 3 200.0000 17/05/2019 (130) (5 007) 467 106Short EUR Euro Stoxx 50 Index Put 3 150.0000 17/05/2019 (140) (3 914) 495 177Short EUR Euro Stoxx 50 Index Put 3 225.0000 17/05/2019 (70) (3 168) 253 483Short EUR Euro Stoxx 50 Index Put 3 175.0000 17/05/2019 (60) (1 967) 213 903Short EUR Euro Stoxx 50 Index Put 3 100.0000 17/05/2019 (90) (1 829) 313 275Short EUR Euro Stoxx 50 Index Put 3 125.0000 17/05/2019 (60) (1 428) 210 534Short EUR Euro Stoxx 50 Index Put 3 050.0000 17/05/2019 (30) (448) 102 741Short EUR Euro-Bund Options Futures OGBL Call 164.0000 26/04/2019 (800 000) (13 250) 147 317 905*Short EUR Euro-Bund Options Futures OGBL Call 164.5000 26/04/2019 (900 000) (13 238) 166 237 925*Short EUR Euro-Bund Options Futures OGBL Call 165.0000 26/04/2019 (900 000) (10 611) 166 743 208*Short EUR Euro-Bund Options Futures OGBL Call 165.5000 26/04/2019 (1 100 000) (10 128) 204 414 821*Short EUR Euro-Bund Options Futures OGBL Call 166.5000 24/05/2019 (400 000) 135 74 781 802*
107Merrill Lynch Investment Solutions
Merrill Lynch Investment Solutions – AQR GlobalRelative Value UCITS FundSchedule of Investments as at March 31, 2019 (cont.)(expressed in USD)
The accompanying notes form an integral part of these financial statements.
Audited annual report
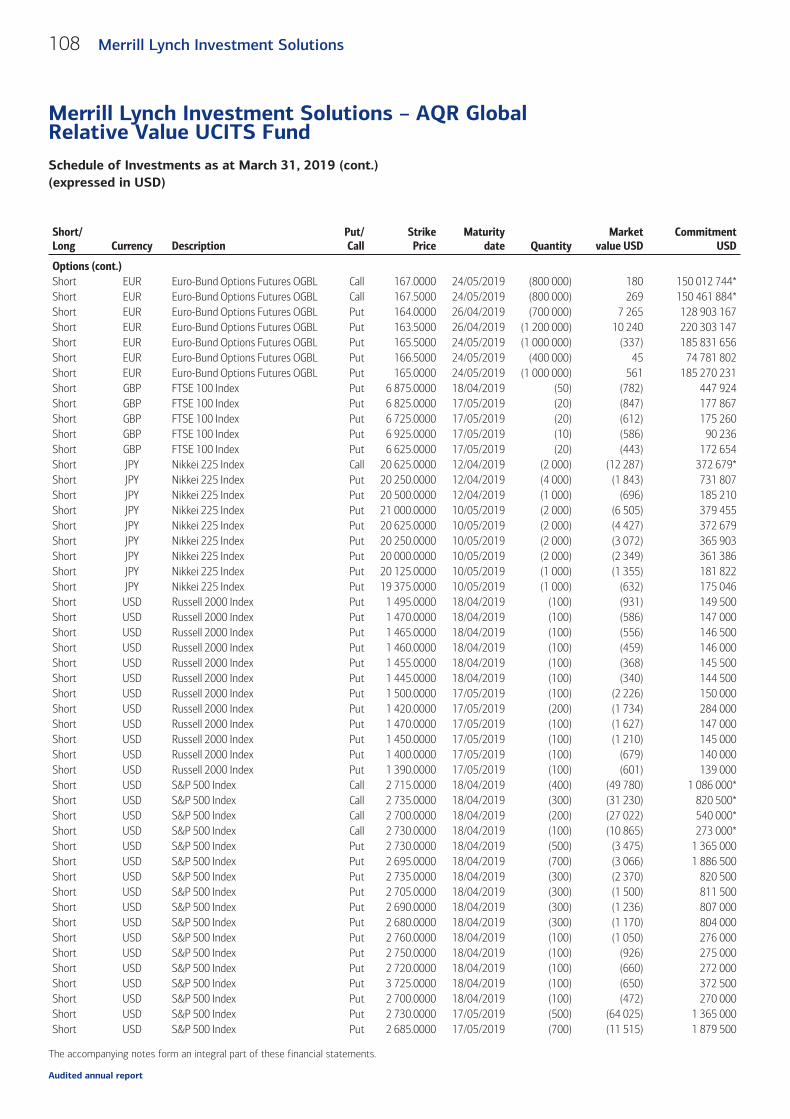
Short/Long Currency Description
Put/Call
StrikePrice
Maturitydate Quantity
Marketvalue USD
CommitmentUSD
Options (cont.)Short EUR Euro-Bund Options Futures OGBL Call 167.0000 24/05/2019 (800 000) 180 150 012 744*Short EUR Euro-Bund Options Futures OGBL Call 167.5000 24/05/2019 (800 000) 269 150 461 884*Short EUR Euro-Bund Options Futures OGBL Put 164.0000 26/04/2019 (700 000) 7 265 128 903 167Short EUR Euro-Bund Options Futures OGBL Put 163.5000 26/04/2019 (1 200 000) 10 240 220 303 147Short EUR Euro-Bund Options Futures OGBL Put 165.5000 24/05/2019 (1 000 000) (337) 185 831 656Short EUR Euro-Bund Options Futures OGBL Put 166.5000 24/05/2019 (400 000) 45 74 781 802Short EUR Euro-Bund Options Futures OGBL Put 165.0000 24/05/2019 (1 000 000) 561 185 270 231Short GBP FTSE 100 Index Put 6 875.0000 18/04/2019 (50) (782) 447 924Short GBP FTSE 100 Index Put 6 825.0000 17/05/2019 (20) (847) 177 867Short GBP FTSE 100 Index Put 6 725.0000 17/05/2019 (20) (612) 175 260Short GBP FTSE 100 Index Put 6 925.0000 17/05/2019 (10) (586) 90 236Short GBP FTSE 100 Index Put 6 625.0000 17/05/2019 (20) (443) 172 654Short JPY Nikkei 225 Index Call 20 625.0000 12/04/2019 (2 000) (12 287) 372 679*Short JPY Nikkei 225 Index Put 20 250.0000 12/04/2019 (4 000) (1 843) 731 807Short JPY Nikkei 225 Index Put 20 500.0000 12/04/2019 (1 000) (696) 185 210Short JPY Nikkei 225 Index Put 21 000.0000 10/05/2019 (2 000) (6 505) 379 455Short JPY Nikkei 225 Index Put 20 625.0000 10/05/2019 (2 000) (4 427) 372 679Short JPY Nikkei 225 Index Put 20 250.0000 10/05/2019 (2 000) (3 072) 365 903Short JPY Nikkei 225 Index Put 20 000.0000 10/05/2019 (2 000) (2 349) 361 386Short JPY Nikkei 225 Index Put 20 125.0000 10/05/2019 (1 000) (1 355) 181 822Short JPY Nikkei 225 Index Put 19 375.0000 10/05/2019 (1 000) (632) 175 046Short USD Russell 2000 Index Put 1 495.0000 18/04/2019 (100) (931) 149 500Short USD Russell 2000 Index Put 1 470.0000 18/04/2019 (100) (586) 147 000Short USD Russell 2000 Index Put 1 465.0000 18/04/2019 (100) (556) 146 500Short USD Russell 2000 Index Put 1 460.0000 18/04/2019 (100) (459) 146 000Short USD Russell 2000 Index Put 1 455.0000 18/04/2019 (100) (368) 145 500Short USD Russell 2000 Index Put 1 445.0000 18/04/2019 (100) (340) 144 500Short USD Russell 2000 Index Put 1 500.0000 17/05/2019 (100) (2 226) 150 000Short USD Russell 2000 Index Put 1 420.0000 17/05/2019 (200) (1 734) 284 000Short USD Russell 2000 Index Put 1 470.0000 17/05/2019 (100) (1 627) 147 000Short USD Russell 2000 Index Put 1 450.0000 17/05/2019 (100) (1 210) 145 000Short USD Russell 2000 Index Put 1 400.0000 17/05/2019 (100) (679) 140 000Short USD Russell 2000 Index Put 1 390.0000 17/05/2019 (100) (601) 139 000Short USD S&P 500 Index Call 2 715.0000 18/04/2019 (400) (49 780) 1 086 000*Short USD S&P 500 Index Call 2 735.0000 18/04/2019 (300) (31 230) 820 500*Short USD S&P 500 Index Call 2 700.0000 18/04/2019 (200) (27 022) 540 000*Short USD S&P 500 Index Call 2 730.0000 18/04/2019 (100) (10 865) 273 000*Short USD S&P 500 Index Put 2 730.0000 18/04/2019 (500) (3 475) 1 365 000Short USD S&P 500 Index Put 2 695.0000 18/04/2019 (700) (3 066) 1 886 500Short USD S&P 500 Index Put 2 735.0000 18/04/2019 (300) (2 370) 820 500Short USD S&P 500 Index Put 2 705.0000 18/04/2019 (300) (1 500) 811 500Short USD S&P 500 Index Put 2 690.0000 18/04/2019 (300) (1 236) 807 000Short USD S&P 500 Index Put 2 680.0000 18/04/2019 (300) (1 170) 804 000Short USD S&P 500 Index Put 2 760.0000 18/04/2019 (100) (1 050) 276 000Short USD S&P 500 Index Put 2 750.0000 18/04/2019 (100) (926) 275 000Short USD S&P 500 Index Put 2 720.0000 18/04/2019 (100) (660) 272 000Short USD S&P 500 Index Put 3 725.0000 18/04/2019 (100) (650) 372 500Short USD S&P 500 Index Put 2 700.0000 18/04/2019 (100) (472) 270 000Short USD S&P 500 Index Put 2 730.0000 17/05/2019 (500) (64 025) 1 365 000Short USD S&P 500 Index Put 2 685.0000 17/05/2019 (700) (11 515) 1 879 500
108 Merrill Lynch Investment Solutions
Merrill Lynch Investment Solutions – AQR GlobalRelative Value UCITS FundSchedule of Investments as at March 31, 2019 (cont.)(expressed in USD)
The accompanying notes form an integral part of these financial statements.
Audited annual report

Short/Long Currency Description
Put/Call
StrikePrice
Maturitydate Quantity
Marketvalue USD
CommitmentUSD
Options (cont.)Short USD S&P 500 Index Put 2 720.0000 17/05/2019 (500) (11 005) 1 360 000Short USD S&P 500 Index Put 2 750.0000 17/05/2019 (300) (7 755) 825 000Short USD S&P 500 Index Put 2 770.0000 17/05/2019 (200) (6 028) 554 000Short USD S&P 500 Index Put 2 665.0000 17/05/2019 (400) (5 680) 1 066 000Short USD S&P 500 Index Put 2 700.0000 17/05/2019 (300) (5 250) 810 000Short USD S&P 500 Index Put 2 735.0000 17/05/2019 (200) (4 870) 547 000Short USD S&P 500 Index Put 2 640.0000 17/05/2019 (400) (4 560) 1 056 000Short USD S&P 500 Index Put 2 675.0000 17/05/2019 (300) (4 395) 802 500Short USD S&P 500 Index Put 2 600.0000 17/05/2019 (400) (3 376) 1 040 000Short USD S&P 500 Index Put 2 635.0000 17/05/2019 (200) (3 130) 527 000Short USD S&P 500 Index Put 2 595.0000 17/05/2019 (300) (2 745) 778 500Short USD S&P 500 Index Put 2 630.0000 17/05/2019 (200) (2 090) 526 000Short USD S&P 500 Index Put 2 705.0000 17/05/2019 (100) (1 910) 270 500Short USD S&P 500 Index Put 2 670.0000 17/05/2019 (100) (1 390) 267 000
Total Options (514 048) 1 919 031 210
* The commitment on short call positions is unlimited.
Merrill Lynch, Pierce Fenner & Smith, Inc. is the counterparty to these options.
Notional Pay Receive CurrencyMaturity
date Counterparty
Unrealisedappreciation/depreciation
USDCommitment
USD
Credit default swaps64 224 000 Fixed 1% Markit
CDX.NA.IG.32v1USD 20/06/2024 Merrill Lynch, Pierce,
Fenner and Smith,Inc. (109 970) -
18 863 000 Fixed 5% Markit ItraxxEurope CrossoverSeries 31v1
EUR 20/06/2024 Merrill Lynch, Pierce,Fenner and Smith,
Inc. (7 370) -(2 939 000) Markit CDX.NA.HY.32v1 Fixed 5% USD 20/06/2024 Merrill Lynch, Pierce,
Fenner and Smith,Inc. (199 436) 2 939 000
(16 022 000) Markit Itraxx EuropeSeries 31v1
Fixed 1% EUR 20/06/2024 Merrill Lynch, Pierce,Fenner and Smith,
Inc. 7 101 16 022 000
Total Credit default swaps (309 675) 18 961 000
Contracts for difference
The Sub-Fund Merrill Lynch Investment Solutions – AQR Global Relative Value UCITS Fund entered into contracts for difference swaps with six counterparties (Bankof America N.A., Deutsche Bank AG, Goldman Sachs International, JPMorgan Chase Bank N.A., Merrill Lynch International Bank Ltd. and Morgan Stanley InternationalPlc.) with the following details:
Counterparty Industrial sectorUnderlyingnature Long/Short
CommitmentUSD
Unrealisedappreciation/
(depreciation)USD
Contracts for differenceBank of America N.A. Swap Index - Diversified Derivatives Short 4 995 636 (101 803)
109Merrill Lynch Investment Solutions
Merrill Lynch Investment Solutions – AQR GlobalRelative Value UCITS FundSchedule of Investments as at March 31, 2019 (cont.)(expressed in USD)
The accompanying notes form an integral part of these financial statements.
Audited annual report

Counterparty Industrial sectorUnderlyingnature Long/Short
CommitmentUSD
Unrealisedappreciation/
(depreciation)USD
Contracts for difference (cont.)Deutsche Bank AG Advertising Bond Long 983 527 (53 270)Deutsche Bank AG Advertising Equity Short 799 396 97 011Deutsche Bank AG Aerospace/Defense Bond Long 3 338 707 507 159Deutsche Bank AG Aerospace/Defense Equity Long 1 061 379 (18 225)Deutsche Bank AG Aerospace/Defense Equity Short 2 519 222 (301 703)Deutsche Bank AG Agriculture Equity Short 1 412 189 (14 825)Deutsche Bank AG Airlines Equity Short 764 280 41 889Deutsche Bank AG Apparel Equity Long 408 407 5 552Deutsche Bank AG Auto Manufacturers Bond Long 818 438 (98 983)Deutsche Bank AG Auto Manufacturers Equity Short 659 630 81 480Deutsche Bank AG Banks Bond Long 132 340 (17 782)Deutsche Bank AG Banks Equity Long 1 912 063 (132 716)Deutsche Bank AG Banks Equity Short 622 341 19 118Deutsche Bank AG Beverages Equity Long 489 672 (3 718)Deutsche Bank AG Biotechnology Bond Long 5 628 754 (641 651)Deutsche Bank AG Biotechnology Bond Short 2 200 768 74 848Deutsche Bank AG Biotechnology Equity Long 754 715 (20 957)Deutsche Bank AG Biotechnology Equity Short 1 403 809 (104 452)Deutsche Bank AG Commercial Services Bond Long 15 327 359 1 290 596Deutsche Bank AG Commercial Services Equity Long 2 133 156 (99 191)Deutsche Bank AG Commercial Services Equity Short 14 890 205 (498 121)Deutsche Bank AG Computers Bond Long 1 445 235 12 022Deutsche Bank AG Computers Equity Short 714 342 (25 720)Deutsche Bank AG Distribution/Wholesale Equity Long 2 097 089 (14 691)Deutsche Bank AG Diversified Financial Services Equity Long 10 026 633 1 205 957Deutsche Bank AG Diversified Financial Services Equity Short 8 536 185 (87 733)Deutsche Bank AG Electric Equity Long 1 839 177 (2 824)Deutsche Bank AG Electric Equity Short 213 277 (13 286)Deutsche Bank AG Electronics Bond Long 2 371 716 218 230Deutsche Bank AG Electronics Bond Short 262 764 (1 321)Deutsche Bank AG Electronics Equity Long 950 632 (62 499)Deutsche Bank AG Electronics Equity Short 2 641 224 470 987Deutsche Bank AG Engineering & Construction Bond Long 1 539 646 142 958Deutsche Bank AG Engineering & Construction Equity Long 710 901 17 130Deutsche Bank AG Engineering & Construction Equity Short 683 773 (69 046)Deutsche Bank AG Entertainment Equity Long 640 943 6 587Deutsche Bank AG Entertainment Equity Short 3 808 922 11 590Deutsche Bank AG Food Equity Long 1 239 648 103 489Deutsche Bank AG Food Equity Short 317 666 (3 553)Deutsche Bank AG Forest Products & Paper Equity Long 394 968 (11 417)Deutsche Bank AG Gas Equity Long 809 409 (21 107)Deutsche Bank AG Hand/Machine Tools Equity Long 379 421 78 626Deutsche Bank AG Hand/Machine Tools Equity Short 2 107 636 (374 411)Deutsche Bank AG Healthcare-Products Bond Long 1 167 774 29 769Deutsche Bank AG Healthcare-Products Equity Long 3 708 975 96 293Deutsche Bank AG Healthcare-Products Equity Short 1 424 247 11 341Deutsche Bank AG Healthcare-Services Equity Long 8 151 352 (70 070)
110 Merrill Lynch Investment Solutions
Merrill Lynch Investment Solutions – AQR GlobalRelative Value UCITS FundSchedule of Investments as at March 31, 2019 (cont.)(expressed in USD)
The accompanying notes form an integral part of these financial statements.
Audited annual report

Counterparty Industrial sectorUnderlyingnature Long/Short
CommitmentUSD
Unrealisedappreciation/
(depreciation)USD
Contracts for difference (cont.)Deutsche Bank AG Healthcare-Services Equity Short 2 668 369 220 611Deutsche Bank AG Home Builders Equity Long 4 447 902 (153 878)Deutsche Bank AG Insurance Bond Long 2 608 424 312 497Deutsche Bank AG Insurance Equity Long 1 446 603 (41 523)Deutsche Bank AG Insurance Equity Short 4 738 536 52 885Deutsche Bank AG Internet Bond Long 27 512 446 6 598 023Deutsche Bank AG Internet Bond Short 1 616 160 35 412Deutsche Bank AG Internet Equity Long 4 424 795 87 626Deutsche Bank AG Internet Equity Short 81 868 099 (644 089)Deutsche Bank AG Investment Companies Bond Long 1 601 191 2 519Deutsche Bank AG Investment Companies Equity Long 55 250 224 (4 044 422)Deutsche Bank AG Investment Companies Equity Short 821 826 21 448Deutsche Bank AG Iron/Steel Bond Long 10 270 499 2 446 700Deutsche Bank AG Iron/Steel Equity Long 3 164 038 (48 960)Deutsche Bank AG Iron/Steel Equity Short 8 052 831 (624 650)Deutsche Bank AG Leisure Time Equity Short 550 160 46 117Deutsche Bank AG Lodging Bond Long 8 172 763 (1 940 481)Deutsche Bank AG Lodging Equity Long 54 259 278Deutsche Bank AG Lodging Equity Short 5 022 881 637 484Deutsche Bank AG Machinery-Diversified Equity Short 2 140 462 16 856Deutsche Bank AG Media Bond Long 3 676 719 182 083Deutsche Bank AG Media Equity Short 7 684 613 (1 297 492)Deutsche Bank AG Mining Bond Long 402 943 (51 143)Deutsche Bank AG Mining Equity Long 9 081 062 364 575Deutsche Bank AG Mining Equity Short 106 956 2 155Deutsche Bank AG Miscellaneous Manufacturing Equity Short 461 817 22 175Deutsche Bank AG Oil & Gas Bond Long 5 096 268 311 726Deutsche Bank AG Oil & Gas Bond Short 335 290 (6 415)Deutsche Bank AG Oil & Gas Equity Long 5 278 979 23 927Deutsche Bank AG Oil & Gas Equity Short 760 526 90 688Deutsche Bank AG Oil & Gas Services Bond Long 2 947 286 (1 155 948)Deutsche Bank AG Oil & Gas Services Bond Short 396 508 108 009Deutsche Bank AG Oil & Gas Services Equity Long 44 893 124Deutsche Bank AG Oil & Gas Services Equity Short 4 827 578 732 954Deutsche Bank AG Packaging & Containers Equity Short 1 355 313 (103 629)Deutsche Bank AG Pharmaceuticals Bond Long 3 183 473 (115 698)Deutsche Bank AG Pharmaceuticals Bond Short 853 398 7 918Deutsche Bank AG Pharmaceuticals Equity Long 595 444 (45 713)Deutsche Bank AG Pharmaceuticals Equity Short 1 120 618 (21 278)Deutsche Bank AG Private Equity Bond Long 3 027 678 (220 930)Deutsche Bank AG Private Equity Equity Long 1 628 773 (30 587)Deutsche Bank AG Private Equity Equity Short 215 233 16 047Deutsche Bank AG REITS Bond Long 8 720 785 (357 284)Deutsche Bank AG REITS Equity Short 2 000 286 (30 496)Deutsche Bank AG Retail Bond Long 2 877 354 (135 196)Deutsche Bank AG Retail Equity Long 3 760 368 1 654Deutsche Bank AG Retail Equity Short 3 882 903 236 421
111Merrill Lynch Investment Solutions
Merrill Lynch Investment Solutions – AQR GlobalRelative Value UCITS FundSchedule of Investments as at March 31, 2019 (cont.)(expressed in USD)
The accompanying notes form an integral part of these financial statements.
Audited annual report

Counterparty Industrial sectorUnderlyingnature Long/Short
CommitmentUSD
Unrealisedappreciation/
(depreciation)USD
Contracts for difference (cont.)Deutsche Bank AG Semiconductors Bond Long 53 359 786 9 563 115Deutsche Bank AG Semiconductors Equity Long 828 520 4 176Deutsche Bank AG Semiconductors Equity Short 126 108 451 15 734 498Deutsche Bank AG Software Bond Long 9 777 127 2 184 008Deutsche Bank AG Software Bond Short 1 276 181 (17 912)Deutsche Bank AG Software Equity Long 3 549 490 (1 143)Deutsche Bank AG Software Equity Short 13 499 217 (1 894 116)Deutsche Bank AG Telecommunications Bond Long 1 655 972 104 269Deutsche Bank AG Telecommunications Bond Short 394 001 4 726Deutsche Bank AG Telecommunications Equity Long 2 134 815 (27 227)Deutsche Bank AG Telecommunications Equity Short 744 008 (21 098)Deutsche Bank AG Transportation Bond Long 5 944 985 (165 730)Deutsche Bank AG Transportation Bond Short 199 477 (6 654)Deutsche Bank AG Transportation Equity Long 1 441 953 (164 995)Deutsche Bank AG Transportation Equity Short 2 146 660 253 695Deutsche Bank AG Water Equity Short 1 106 656 62 143Goldman Sachs International Advertising Equity Long 2 752 280 (105 596)Goldman Sachs International Aerospace/Defense Equity Long 29 533 979 1 620 288Goldman Sachs International Aerospace/Defense Equity Short 33 087 502 (103 596)Goldman Sachs International Agriculture Equity Long 6 204 560 54 411Goldman Sachs International Airlines Equity Long 5 354 587 (76 784)Goldman Sachs International Airlines Equity Short 3 467 415 (69 419)Goldman Sachs International Apparel Equity Long 9 806 210 (46 604)Goldman Sachs International Apparel Equity Short 10 655 713 (145 654)Goldman Sachs International Auto Manufacturers Equity Long 5 982 350 166 738Goldman Sachs International Auto Manufacturers Equity Short 6 970 802 141 400Goldman Sachs International Auto Parts & Equipment Equity Long 17 909 487 (786 610)Goldman Sachs International Auto Parts & Equipment Equity Short 8 053 295 231 856Goldman Sachs International Banks Equity Long 42 863 686 (2 048 389)Goldman Sachs International Banks Equity Short 48 864 278 2 847 359Goldman Sachs International Beverages Equity Long 6 414 987 (239 277)Goldman Sachs International Beverages Equity Short 6 083 948 (296 708)Goldman Sachs International Biotechnology Equity Long 36 947 409 72 048Goldman Sachs International Biotechnology Equity Short 18 619 516 (1 014 572)Goldman Sachs International Building Materials Equity Long 20 637 682 563 886Goldman Sachs International Building Materials Equity Short 2 361 216 (14 821)Goldman Sachs International Chemicals Equity Long 38 061 640 (1 941 650)Goldman Sachs International Chemicals Equity Short 28 415 064 377 667Goldman Sachs International Coal Equity Long 892 012 (69 225)Goldman Sachs International Coal Equity Short 528 408 7 009Goldman Sachs International Commercial Services Equity Long 30 870 659 633 484Goldman Sachs International Commercial Services Equity Short 47 517 210 (1 766 002)Goldman Sachs International Computers Equity Long 32 519 229 (2 778 685)Goldman Sachs International Computers Equity Short 11 396 142 (220 749)Goldman Sachs International Cosmetics/Personal Care Equity Long 601 790 15 900Goldman Sachs International Cosmetics/Personal Care Equity Short 1 211 759 141 931Goldman Sachs International Distribution/Wholesale Equity Long 7 595 905 122 929
112 Merrill Lynch Investment Solutions
Merrill Lynch Investment Solutions – AQR GlobalRelative Value UCITS FundSchedule of Investments as at March 31, 2019 (cont.)(expressed in USD)
The accompanying notes form an integral part of these financial statements.
Audited annual report

Counterparty Industrial sectorUnderlyingnature Long/Short
CommitmentUSD
Unrealisedappreciation/
(depreciation)USD
Contracts for difference (cont.)Goldman Sachs International Distribution/Wholesale Equity Short 9 566 940 (305 698)Goldman Sachs International Diversified Financial Services Equity Long 26 044 984 (300 088)Goldman Sachs International Diversified Financial Services Equity Short 38 853 075 (377 432)Goldman Sachs International Electric Equity Long 49 389 444 (357 487)Goldman Sachs International Electric Equity Short 37 092 195 (72 378)Goldman Sachs International Electrical Components &
EquipmentEquity Long 1 550 084 (53 888)
Goldman Sachs International Electrical Components &Equipment
Equity Short 15 209 439 539 554
Goldman Sachs International Electronics Equity Long 31 600 866 1 101 737Goldman Sachs International Electronics Equity Short 26 596 657 (52 188)Goldman Sachs International Energy-Alternate Sources Equity Short 5 081 540 (295 960)Goldman Sachs International Engineering & Construction Equity Long 9 555 769 144 125Goldman Sachs International Engineering & Construction Equity Short 7 542 237 287 119Goldman Sachs International Entertainment Equity Long 4 556 715 (374 082)Goldman Sachs International Entertainment Equity Short 5 199 290 (109 788)Goldman Sachs International Environmental Control Equity Long 8 470 650 374 448Goldman Sachs International Environmental Control Equity Short 2 292 606 (251 116)Goldman Sachs International Food Equity Long 31 444 389 1 852 891Goldman Sachs International Food Equity Short 46 455 534 (39 196)Goldman Sachs International Food Service Equity Long 100 559 (123)Goldman Sachs International Forest Products & Paper Equity Long 3 181 092 (267 502)Goldman Sachs International Forest Products & Paper Equity Short 394 725 14 548Goldman Sachs International Future Index Derivatives Short 2 723 681 50 260Goldman Sachs International Gas Equity Long 8 132 595 (28 649)Goldman Sachs International Gas Equity Short 8 730 299 (131 228)Goldman Sachs International Hand/Machine Tools Equity Long 1 212 235 10 158Goldman Sachs International Hand/Machine Tools Equity Short 2 819 867 (50 602)Goldman Sachs International Healthcare-Products Equity Long 30 565 466 (109 350)Goldman Sachs International Healthcare-Products Equity Short 34 037 468 187 994Goldman Sachs International Healthcare-Services Equity Long 23 209 572 737 673Goldman Sachs International Healthcare-Services Equity Short 10 668 220 191 434Goldman Sachs International Holding
Companies-DiversifiedEquity Long 1 028 487 (40 891)
Goldman Sachs International HoldingCompanies-Diversified
Equity Short 303 224 (74 819)
Goldman Sachs International Home Builders Equity Long 11 662 299 31 700Goldman Sachs International Home Builders Equity Short 1 670 345 66 453Goldman Sachs International Home Furnishings Equity Long 2 350 079 (30 287)Goldman Sachs International Home Furnishings Equity Short 4 052 580 111 414Goldman Sachs International Household Products/Wares Equity Long 1 156 197 31 913Goldman Sachs International Household Products/Wares Equity Short 2 420 421 (51 693)Goldman Sachs International Housewares Equity Long 2 093 544 (188 239)Goldman Sachs International Housewares Equity Short 6 128 911 175 791Goldman Sachs International Index Future Swap -
DiversifiedDerivatives Long 7 244 632 43 418
Goldman Sachs International Index Future Swap -Diversified
Derivatives Short 12 103 (65)
113Merrill Lynch Investment Solutions
Merrill Lynch Investment Solutions – AQR GlobalRelative Value UCITS FundSchedule of Investments as at March 31, 2019 (cont.)(expressed in USD)
The accompanying notes form an integral part of these financial statements.
Audited annual report

Counterparty Industrial sectorUnderlyingnature Long/Short
CommitmentUSD
Unrealisedappreciation/
(depreciation)USD
Contracts for difference (cont.)Goldman Sachs International Insurance Equity Long 55 798 820 (449 877)Goldman Sachs International Insurance Equity Short 29 963 834 (97 374)Goldman Sachs International Internet Equity Long 22 127 821 1 165 809Goldman Sachs International Internet Equity Short 13 577 405 202 690Goldman Sachs International Investment Companies Equity Short 129 016 (12 405)Goldman Sachs International Iron/Steel Equity Long 6 127 873 41 414Goldman Sachs International Iron/Steel Equity Short 4 174 354 (60 425)Goldman Sachs International Leisure Time Equity Long 14 732 329 316 254Goldman Sachs International Leisure Time Equity Short 1 169 784 46 502Goldman Sachs International Lodging Equity Long 10 516 632 (333 690)Goldman Sachs International Lodging Equity Short 6 344 843 45 245Goldman Sachs International Machinery-Construction &
MiningEquity Long 6 653 669 (183 151)
Goldman Sachs International Machinery-Construction &Mining
Equity Short 5 116 244 (579 961)
Goldman Sachs International Machinery-Diversified Equity Long 17 345 000 448 720Goldman Sachs International Machinery-Diversified Equity Short 30 655 656 423 126Goldman Sachs International Media Equity Long 30 963 081 877 766Goldman Sachs International Media Equity Short 23 330 960 (220 621)Goldman Sachs International Metal Fabricate/Hardware Equity Long 2 178 113 16 051Goldman Sachs International Metal Fabricate/Hardware Equity Short 649 980 29 876Goldman Sachs International Mining Equity Long 15 961 505 490 422Goldman Sachs International Mining Equity Short 17 203 154 (888 816)Goldman Sachs International Miscellaneous Manufacturing Equity Long 13 332 820 25 483Goldman Sachs International Miscellaneous Manufacturing Equity Short 8 159 274 (71 880)Goldman Sachs International Office Furnishings Equity Long 1 772 755 (56 438)Goldman Sachs International Office/Business Equipment Equity Long 9 704 651 346 188Goldman Sachs International Oil & Gas Equity Long 50 080 023 (1 746 261)Goldman Sachs International Oil & Gas Equity Short 17 924 835 2 176 394Goldman Sachs International Oil & Gas Services Equity Long 13 513 690 577 471Goldman Sachs International Oil & Gas Services Equity Short 6 141 600 4 320Goldman Sachs International Packaging & Containers Equity Long 13 101 619 304 149Goldman Sachs International Packaging & Containers Equity Short 7 459 035 (102 855)Goldman Sachs International Pharmaceuticals Equity Long 37 567 913 205 871Goldman Sachs International Pharmaceuticals Equity Short 22 336 827 1 229 087Goldman Sachs International Pipelines Equity Long 2 536 361 13 578Goldman Sachs International Pipelines Equity Short 10 186 261 (385 944)Goldman Sachs International Real Estate Equity Long 874 261 630 013Goldman Sachs International Real Estate Equity Short 107 926 5 629Goldman Sachs International REITS Equity Long 2 873 989 8 944Goldman Sachs International REITS Equity Short 443 317 (12 469)Goldman Sachs International Retail Equity Long 57 361 003 2 089 749Goldman Sachs International Retail Equity Short 31 652 400 (1 400 854)Goldman Sachs International Savings & Loans Equity Long 3 976 (367)Goldman Sachs International Savings & Loans Equity Short 2 689 615 504 336Goldman Sachs International Semiconductors Equity Long 39 324 131 1 338 257Goldman Sachs International Semiconductors Equity Short 30 744 386 (535 822)
114 Merrill Lynch Investment Solutions
Merrill Lynch Investment Solutions – AQR GlobalRelative Value UCITS FundSchedule of Investments as at March 31, 2019 (cont.)(expressed in USD)
The accompanying notes form an integral part of these financial statements.
Audited annual report

Counterparty Industrial sectorUnderlyingnature Long/Short
CommitmentUSD
Unrealisedappreciation/
(depreciation)USD
Contracts for difference (cont.)Goldman Sachs International Shipbuilding Equity Long 2 816 677 89 581Goldman Sachs International Shipbuilding Equity Short 2 510 945 173 922Goldman Sachs International Software Equity Long 29 225 263 1 206 685Goldman Sachs International Software Equity Short 43 203 338 (1 335 543)Goldman Sachs International Swap Index - Diversified Derivatives Short 2 466 513 89 358Goldman Sachs International Telecommunications Equity Long 46 066 740 (809 471)Goldman Sachs International Telecommunications Equity Short 30 049 324 (1 613 375)Goldman Sachs International Textiles Equity Long 1 080 849 24 332Goldman Sachs International Textiles Equity Short 1 500 176 19 992Goldman Sachs International Toys/Games/Hobbies Equity Short 689 779 66 168Goldman Sachs International Transportation Equity Long 9 163 192 (124 477)Goldman Sachs International Transportation Equity Short 9 486 145 213 548Goldman Sachs International Trucking & Leasing Equity Long 508 548 1 979Goldman Sachs International Water Equity Long 3 926 113 26 749Goldman Sachs International Water Equity Short 1 894 292 (7 812)JPMorgan Chase Bank N.A. Airlines Equity Long 563 080 (28 417)JPMorgan Chase Bank N.A. Banks Equity Long 433 246 5 834JPMorgan Chase Bank N.A. Banks Equity Short 190 231 (3 105)JPMorgan Chase Bank N.A. Biotechnology Equity Short 243 980 16 698JPMorgan Chase Bank N.A. Chemicals Equity Long 429 000 (4 874)JPMorgan Chase Bank N.A. Coal Equity Long 9 851 129JPMorgan Chase Bank N.A. Distribution/Wholesale Equity Long 1 027 192 4 115JPMorgan Chase Bank N.A. Engineering & Construction Equity Long 468 006 (31 140)JPMorgan Chase Bank N.A. Food Equity Long 269 432 (34 227)JPMorgan Chase Bank N.A. Holding
Companies-DiversifiedEquity Short 135 674 (12 035)
JPMorgan Chase Bank N.A. Household Products/Wares Equity Long 240 594 (1 361)JPMorgan Chase Bank N.A. Mining Equity Short 113 675 3 959JPMorgan Chase Bank N.A. Telecommunications Equity Long 49 930 (1 395)JPMorgan Chase Bank N.A. Telecommunications Equity Short 2 089 941 1 998Merrill Lynch International Bank Ltd. Advertising Equity Long 580 536 11 404Merrill Lynch International Bank Ltd. Advertising Equity Short 1 003 688 (23 946)Merrill Lynch International Bank Ltd. Aerospace/Defense Equity Long 1 284 470 22 078Merrill Lynch International Bank Ltd. Aerospace/Defense Equity Short 1 474 271 (33 499)Merrill Lynch International Bank Ltd. Agriculture Equity Long 1 225 867 31 300Merrill Lynch International Bank Ltd. Agriculture Equity Short 572 883 (8 870)Merrill Lynch International Bank Ltd. Airlines Equity Long 5 672 573 65 863Merrill Lynch International Bank Ltd. Airlines Equity Short 291 446 25 460Merrill Lynch International Bank Ltd. Apparel Equity Long 1 079 854 15 362Merrill Lynch International Bank Ltd. Apparel Equity Short 2 199 064 (126 133)Merrill Lynch International Bank Ltd. Auto Manufacturers Equity Long 18 329 024 320 974Merrill Lynch International Bank Ltd. Auto Manufacturers Equity Short 5 192 421 (136 520)Merrill Lynch International Bank Ltd. Auto Parts & Equipment Equity Long 12 835 635 (20 900)Merrill Lynch International Bank Ltd. Auto Parts & Equipment Equity Short 10 897 865 32 332Merrill Lynch International Bank Ltd. Banks Equity Long 14 069 669 (26 141)Merrill Lynch International Bank Ltd. Banks Equity Short 9 403 128 47 516Merrill Lynch International Bank Ltd. Beverages Equity Long 1 552 457 54 564
115Merrill Lynch Investment Solutions
Merrill Lynch Investment Solutions – AQR GlobalRelative Value UCITS FundSchedule of Investments as at March 31, 2019 (cont.)(expressed in USD)
The accompanying notes form an integral part of these financial statements.
Audited annual report

Counterparty Industrial sectorUnderlyingnature Long/Short
CommitmentUSD
Unrealisedappreciation/
(depreciation)USD
Contracts for difference (cont.)Merrill Lynch International Bank Ltd. Beverages Equity Short 5 667 595 (195 209)Merrill Lynch International Bank Ltd. Biotechnology Bond Long 1 572 468 18 708Merrill Lynch International Bank Ltd. Biotechnology Equity Long 3 776 946 (28 599)Merrill Lynch International Bank Ltd. Biotechnology Equity Short 963 612 (13 478)Merrill Lynch International Bank Ltd. Building Materials Equity Long 3 640 728 71 155Merrill Lynch International Bank Ltd. Building Materials Equity Short 3 194 545 (104 749)Merrill Lynch International Bank Ltd. Chemicals Equity Long 3 155 407 50 526Merrill Lynch International Bank Ltd. Chemicals Equity Short 17 555 194 (2 919)Merrill Lynch International Bank Ltd. Commercial Services Equity Long 1 745 145 120 522Merrill Lynch International Bank Ltd. Commercial Services Equity Short 2 681 510 (24 876)Merrill Lynch International Bank Ltd. Computers Equity Long 6 199 905 132 297Merrill Lynch International Bank Ltd. Computers Equity Short 3 587 451 (31 827)Merrill Lynch International Bank Ltd. Cosmetics/Personal Care Equity Long 3 850 331 34 318Merrill Lynch International Bank Ltd. Cosmetics/Personal Care Equity Short 2 504 056 (35 323)Merrill Lynch International Bank Ltd. Distribution/Wholesale Equity Long 9 611 644 (202 587)Merrill Lynch International Bank Ltd. Diversified Financial Services Bond Long 21 616 197 936 740Merrill Lynch International Bank Ltd. Diversified Financial Services Equity Long 1 057 415 19 881Merrill Lynch International Bank Ltd. Diversified Financial Services Equity Short 3 732 729 2 171Merrill Lynch International Bank Ltd. Electric Equity Long 11 068 291 (17 422)Merrill Lynch International Bank Ltd. Electric Equity Short 3 483 016 104 834Merrill Lynch International Bank Ltd. Electrical Components &
EquipmentEquity Long 1 646 247 59 275
Merrill Lynch International Bank Ltd. Electrical Components &Equipment
Equity Short 3 992 543 68 411
Merrill Lynch International Bank Ltd. Electronics Equity Long 2 707 785 13 195Merrill Lynch International Bank Ltd. Electronics Equity Short 6 214 912 (182 410)Merrill Lynch International Bank Ltd. Energy-Alternate Sources Equity Short 211 243 (8 902)Merrill Lynch International Bank Ltd. Engineering & Construction
(a)Equity Long 11 244 762 70 475
Merrill Lynch International Bank Ltd. Engineering & Construction Equity Short 6 221 722 (36 526)Merrill Lynch International Bank Ltd. Entertainment Equity Long 2 808 852 (4 711)Merrill Lynch International Bank Ltd. Environmental Control Equity Long 896 487 37 103Merrill Lynch International Bank Ltd. Food Bond Long 1 069 023 (3 628)Merrill Lynch International Bank Ltd. Food Equity Long 13 362 518 71 210Merrill Lynch International Bank Ltd. Food Equity Short 7 269 096 54 721Merrill Lynch International Bank Ltd. Food Service Equity Long 1 202 313 59 590Merrill Lynch International Bank Ltd. Food Service Equity Short 612 782 15 923Merrill Lynch International Bank Ltd. Forest Products & Paper Equity Long 2 611 845 14 872Merrill Lynch International Bank Ltd. Gas Equity Long 1 942 975 (37 028)Merrill Lynch International Bank Ltd. Hand/Machine Tools Equity Long 1 386 981 (29 814)Merrill Lynch International Bank Ltd. Hand/Machine Tools Equity Short 1 809 450 (73 676)Merrill Lynch International Bank Ltd. Healthcare-Products Equity Long 8 546 161 184 086Merrill Lynch International Bank Ltd. Healthcare-Products Equity Short 5 862 695 (63 516)Merrill Lynch International Bank Ltd. Healthcare-Services Bond Long 330 080 (10 480)Merrill Lynch International Bank Ltd. Healthcare-Services Equity Short 986 682 (16 602)Merrill Lynch International Bank Ltd. Home Builders Equity Long 2 943 147 (19 977)Merrill Lynch International Bank Ltd. Home Builders Equity Short 387 650 1 160Merrill Lynch International Bank Ltd. Home Furnishings Equity Long 3 396 024 13 221
116 Merrill Lynch Investment Solutions
Merrill Lynch Investment Solutions – AQR GlobalRelative Value UCITS FundSchedule of Investments as at March 31, 2019 (cont.)(expressed in USD)
The accompanying notes form an integral part of these financial statements.
Audited annual report

Counterparty Industrial sectorUnderlyingnature Long/Short
CommitmentUSD
Unrealisedappreciation/
(depreciation)USD
Contracts for difference (cont.)Merrill Lynch International Bank Ltd. Home Furnishings Equity Short 250 499 (6 136)Merrill Lynch International Bank Ltd. Household Products/Wares Equity Short 1 368 289 (38 511)Merrill Lynch International Bank Ltd. Index Future Swap -
DiversifiedDerivatives Long 9 520 316 92 158
Merrill Lynch International Bank Ltd. Index Future Swap -Diversified
Derivatives Short 3 909 928 (37 607)
Merrill Lynch International Bank Ltd. Insurance Equity Long 20 429 817 167 544Merrill Lynch International Bank Ltd. Insurance Equity Short 1 810 192 (8 123)Merrill Lynch International Bank Ltd. Internet Equity Long 417 911 905Merrill Lynch International Bank Ltd. Internet Equity Short 17 298 004 (501 658)Merrill Lynch International Bank Ltd. Iron/Steel Equity Long 3 655 586 (21 147)Merrill Lynch International Bank Ltd. Iron/Steel Equity Short 2 927 037 38 225Merrill Lynch International Bank Ltd. Leisure Time Equity Short 6 057 445 (294 533)Merrill Lynch International Bank Ltd. Lodging Equity Long 526 043 13 985Merrill Lynch International Bank Ltd. Machinery-Construction &
MiningEquity Long 4 321 052 72 274
Merrill Lynch International Bank Ltd. Machinery-Construction &Mining
Equity Short 459 260 (5 793)
Merrill Lynch International Bank Ltd. Machinery-Diversified Equity Long 1 679 323 23 865Merrill Lynch International Bank Ltd. Machinery-Diversified Equity Short 10 554 575 (311 791)Merrill Lynch International Bank Ltd. Media Equity Long 813 085 4 142Merrill Lynch International Bank Ltd. Media Equity Short 4 436 088 (226 868)Merrill Lynch International Bank Ltd. Metal Fabricate/Hardware Equity Long 1 267 103 32 891Merrill Lynch International Bank Ltd. Metal Fabricate/Hardware Equity Short 4 881 000 (21 500)Merrill Lynch International Bank Ltd. Mining Equity Long 892 488 44 594Merrill Lynch International Bank Ltd. Mining Equity Short 21 397 271 (985 584)Merrill Lynch International Bank Ltd. Miscellaneous Manufacturing Equity Long 678 780 6 350Merrill Lynch International Bank Ltd. Miscellaneous Manufacturing Equity Short 41 956 (939)Merrill Lynch International Bank Ltd. Office/Business Equipment Equity Long 713 308 7 856Merrill Lynch International Bank Ltd. Office/Business Equipment Equity Short 3 459 088 (77 158)Merrill Lynch International Bank Ltd. Oil & Gas Equity Long 5 944 511 (25 054)Merrill Lynch International Bank Ltd. Oil & Gas Services Equity Long 808 308 5 335Merrill Lynch International Bank Ltd. Oil & Gas Services Equity Short 4 289 176 (90 705)Merrill Lynch International Bank Ltd. Packaging & Containers Equity Long 1 235 037 (15 869)Merrill Lynch International Bank Ltd. Pharmaceuticals Bond Long 15 189 913 (120 751)Merrill Lynch International Bank Ltd. Pharmaceuticals Equity Long 20 479 892 499 011Merrill Lynch International Bank Ltd. Pharmaceuticals Equity Short 22 235 791 6 409 502Merrill Lynch International Bank Ltd. Pipelines Equity Short 2 498 121 (77 298)Merrill Lynch International Bank Ltd. Retail Equity Long 4 798 875 75 461Merrill Lynch International Bank Ltd. Retail Equity Short 15 850 253 (240 363)Merrill Lynch International Bank Ltd. Semiconductors Equity Long 535 187 9 888Merrill Lynch International Bank Ltd. Semiconductors Equity Short 4 961 715 95 188Merrill Lynch International Bank Ltd. Software Equity Long 5 113 622 100 919Merrill Lynch International Bank Ltd. Software Equity Short 2 988 156 50 666Merrill Lynch International Bank Ltd. Swap Index - Diversified Derivatives Long 7 713 082 621 050Merrill Lynch International Bank Ltd. Swap Index - Diversified Derivatives Short 4 012 745 (292 208)Merrill Lynch International Bank Ltd. Telecommunications Equity Long 11 547 751 54 484Merrill Lynch International Bank Ltd. Telecommunications Equity Short 6 428 617 (9 799)
117Merrill Lynch Investment Solutions
Merrill Lynch Investment Solutions – AQR GlobalRelative Value UCITS FundSchedule of Investments as at March 31, 2019 (cont.)(expressed in USD)
The accompanying notes form an integral part of these financial statements.
Audited annual report

Counterparty Industrial sectorUnderlyingnature Long/Short
CommitmentUSD
Unrealisedappreciation/
(depreciation)USD
Contracts for difference (cont.)Merrill Lynch International Bank Ltd. Toys/Games/Hobbies Equity Long 1 448 896 13 548Merrill Lynch International Bank Ltd. Toys/Games/Hobbies Equity Short 1 723 062 (58 429)Merrill Lynch International Bank Ltd. Transportation Bond Long 297 454 (301)Merrill Lynch International Bank Ltd. Transportation Equity Long 9 192 517 77 989Merrill Lynch International Bank Ltd. Transportation Equity Short 11 790 223 (211 913)Merrill Lynch International Bank Ltd. Water Equity Short 82 297 (788)Morgan Stanley International Plc. Index Future Swap -
DiversifiedDerivatives Long 10 865 940 (1 362)
Morgan Stanley International Plc. Index Future Swap -Diversified
Derivatives Short 4 518 479 (17 261)
Morgan Stanley International Plc. Swap Index - Diversified Derivatives Short 2 361 864 (20 681)
Total 3 167 078 520 36 861 486
(a) These securities are fair valued. See Notes 2.2.6 and 10.
Contracts for Difference Summary Breakdowns:
CommitmentLong
CommitmentShort
Unrealisedof short portfolio
Unrealisedof long portfolio
Realised result(monthly reset) Market Value
Counterparty USD USD USD USD USD USD
Bank of America N.A. - 4 995 636 (101 803) - - (101 803)Deutsche Bank AG 318 429 853 322 936 890 12 948 506 15 931 709 (11 725 021) 17 155 194Goldman Sachs International 1 066 737 527 857 044 843 (2 167 858) 4 276 074 (4 159 517) (2 051 301)JPMorgan Chase Bank N.A. 3 490 331 2 773 501 7 515 (91 336) 15 036 (68 785)Merrill Lynch International Bank Ltd. 309 239 619 263 684 037 2 329 424 3 768 559 (9 631 041) (3 533 058)Morgan Stanley International Plc. 10 865 940 6 880 343 (37 942) (1 362) (30 231) (69 535)
Total 1 708 763 270 1 458 315 250 12 977 842 23 883 644 (25 530 774) 11 330 712
The maximum individual counterparty exposure for OTC Derivatives including CFD as at March 31, 2019 is 5.88% of the NAV.
118 Merrill Lynch Investment Solutions
Merrill Lynch Investment Solutions – AQR GlobalRelative Value UCITS FundSchedule of Investments as at March 31, 2019 (cont.)(expressed in USD)
The accompanying notes form an integral part of these financial statements.
Audited annual report

Nominalvalue Description
QuotationCurrency
CostUSD
Marketvalue USD
% of netassets
Reverse Repurchase Agreement2 760 000 MLI Winton Basket 2.550% 03/04/2019 USD 2 760 000 2 760 000 74.96
Total Reverse Repurchase Agreement 2 760 000 2 760 000 74.96
Total Investments 2 760 000 2 760 000 74.96
Currencybought Amount bought Currency sold Amount sold
Maturitydate Counterparty
Unrealisedappreciation/
(depreciation)USD
Forward foreign exchange contracts
BRL 753 780 USD 200 000 02/04/2019Merrill Lynch International
Ltd. (6 311)
USD 200 000 BRL 768 210 02/04/2019Merrill Lynch International
Ltd. 2 603
EUR 1 364 658 USD 1 544 543 30/04/2019State Street Bank and
Trust Co. (8 619)
PHP 5 263 000 USD 100 000 30/04/2019Merrill Lynch International
Ltd. (344)
RUB 6 464 350 USD 100 000 30/04/2019Merrill Lynch International
Ltd. (2 063)
USD 276 593 EUR 245 189 30/04/2019State Street Bank and
Trust Co. 632
USD 100 000 PHP 5 264 000 30/04/2019Merrill Lynch International
Ltd. 325
USD 100 000 RUB 6 542 500 30/04/2019Merrill Lynch International
Ltd. 879
BRL 389 720 USD 100 000 03/05/2019Merrill Lynch International
Ltd. (41)
USD 100 000 BRL 397 000 03/05/2019Merrill Lynch International
Ltd. (1 827)
IDR 2 879 900 000 USD 200 000 29/05/2019Merrill Lynch International
Ltd. 86
USD 200 000 IDR 2 872 600 000 29/05/2019Merrill Lynch International
Ltd. 421
INR 55 862 050 USD 800 000 31/05/2019Merrill Lynch International
Ltd. (805)
USD 800 000 INR 55 595 000 31/05/2019Merrill Lynch International
Ltd. 4 626
CNH 2 000 000 USD 297 473 19/06/2019Merrill Lynch International
Ltd. 64
EUR 307 411 NOK 3 000 000 19/06/2019Merrill Lynch International
Ltd. (1 965)
EUR 116 140 PLN 500 000 19/06/2019Merrill Lynch International
Ltd. 531
EUR 283 903 SEK 3 000 000 19/06/2019Merrill Lynch International
Ltd. (4 447)
NOK 3 000 000 EUR 307 635 19/06/2019Merrill Lynch International
Ltd. 1 713
PLN 500 000 EUR 114 391 19/06/2019Merrill Lynch International
Ltd. 1 446
SEK 3 000 000 EUR 286 598 19/06/2019Merrill Lynch International
Ltd. 1 402
119Merrill Lynch Investment Solutions
Merrill Lynch Investment Solutions – Merrill Lynch WNTDiversified Futures UCITS Fund (in liquidation)Schedule of Investments as at March 31, 2019(expressed in USD)
The accompanying notes form an integral part of these financial statements.
Audited annual report

Currencybought Amount bought Currency sold Amount sold
Maturitydate Counterparty
Unrealisedappreciation/
(depreciation)USD
Forward foreign exchange contracts (cont.)
TRY 500 000 USD 86 806 19/06/2019Merrill Lynch International
Ltd. (4 202)
USD 297 676 CNH 2 000 000 19/06/2019Merrill Lynch International
Ltd. 138
USD 83 389 TRY 500 000 19/06/2019Merrill Lynch International
Ltd. 785
USD 136 291 ZAR 2 000 000 19/06/2019Merrill Lynch International
Ltd. (1 104)
ZAR 2 000 000 USD 137 427 19/06/2019Merrill Lynch International
Ltd. (33)
Total forward foreign exchange contracts (16 110)
The maximum individual counterparty exposure for OTC Derivatives including CFD as at March 31, 2019 is 0.00% of the NAV.
120 Merrill Lynch Investment Solutions
Merrill Lynch Investment Solutions – Merrill Lynch WNTDiversified Futures UCITS Fund (in liquidation)Schedule of Investments as at March 31, 2019 (cont.)(expressed in USD)
The accompanying notes form an integral part of these financial statements.
Audited annual report

Nominalvalue Description
QuotationCurrency
CostEUR
Marketvalue EUR
% of netassets
Transferable securities and money market instruments admitted to an official exchange listing or dealt in on another regulated market
Supranationals, Governments and Local Public Authorities, Debt Instruments1 000 Bundesrepublik Deutschland Bundesanleihe - Reg 1.500%
15/02/2023EUR 991 1 081 0.00
1 000 Bundesrepublik Deutschland Bundesanleihe - Reg 1.500%15/05/2023
EUR 988 1 085 0.00
1 000 Bundesrepublik Deutschland Bundesanleihe - Reg 2.000%15/08/2023
EUR 1 006 1 112 0.00
1 000 Bundesrepublik Deutschland Bundesanleihe - Reg 5.625%04/01/2028
EUR 1 244 1 517 0.00
1 000 Bundesrepublik Deutschland Bundesanleihe - Reg 6.250%04/01/2024
EUR 1 192 1 324 0.00
1 000 Bundesrepublik Deutschland Bundesanleihe - Reg 6.500%04/07/2027
EUR 1 301 1 563 0.00
Total Supranationals, Governments and Local PublicAuthorities, Debt Instruments 6 722 7 682 0.00
Reverse Repurchase Agreement124 900 000 Union Weekly (0.418)% 03/04/2019 EUR 124 900 000 124 900 000 95.37
Total Reverse Repurchase Agreement 124 900 000 124 900 000 95.37
Total Investments 124 906 722 124 907 682 95.37
121Merrill Lynch Investment Solutions
Merrill Lynch Investment Solutions – Merrill LynchEnhanced Equity Volatility Premium FundSchedule of Investments as at March 31, 2019(expressed in EUR)
The accompanying notes form an integral part of these financial statements.
Audited annual report

Industrial classification of investments(as a percentage of net assets as at March 31, 2019) %
Reverse Repurchase Agreements 95.37Sovereign 0.00
95.37
Geographical classification of investments(as a percentage of net assets as at March 31, 2019) %
Germany 95.37
95.37
Short/Long Currency Description
Put/Call
StrikePrice
Maturitydate Quantity
Marketvalue EUR
CommitmentEUR
OptionsShort EUR Euro Stoxx 50 Index Call 3 441.2040 04/04/2019 (14 854) (6 829) 51 115 644*Short EUR Euro Stoxx 50 Index Call 3 475.7112 11/04/2019 (14 782) (7 333) 51 377 963*Short EUR Euro Stoxx 50 Index Call 3 502.0960 18/04/2019 (14 575) (7 753) 51 043 049*Short EUR Euro Stoxx 50 Index Call 3 453.1016 25/04/2019 (14 759) (73 699) 50 964 326*Short EUR Euro Stoxx 50 Index Put 3 176.4960 04/04/2019 (14 854) (8 104) 47 183 672Long EUR Euro Stoxx 50 Index Put 2 845.6110 04/04/2019 14 854 14 -Short EUR Euro Stoxx 50 Index Put 3 208.3488 11/04/2019 (14 782) (94 876) 47 425 812Long EUR Euro Stoxx 50 Index Put 2 874.1458 11/04/2019 14 782 1 827 -Short EUR Euro Stoxx 50 Index Put 3 232.7040 18/04/2019 (14 575) (214 662) 47 116 661Long EUR Euro Stoxx 50 Index Put 2 895.9640 18/04/2019 14 575 10 257 -Short EUR Euro Stoxx 50 Index Put 3 187.4784 25/04/2019 (14 759) (195 861) 47 043 994Long EUR Euro Stoxx 50 Index Put 2 855.4494 25/04/2019 14 759 12 872 -
Total Options (584 147) 393 271 121
* The commitment on short call positions is unlimited.
Merrill Lynch International Ltd is the counterparty to these options.
The maximum individual counterparty exposure for OTC Derivatives including CFD as at March 31, 2019 is 0.11% of the NAV.
122 Merrill Lynch Investment Solutions
Merrill Lynch Investment Solutions – Merrill LynchEnhanced Equity Volatility Premium FundSchedule of Investments as at March 31, 2019 (cont.)(expressed in EUR)
The accompanying notes form an integral part of these financial statements.
Audited annual report
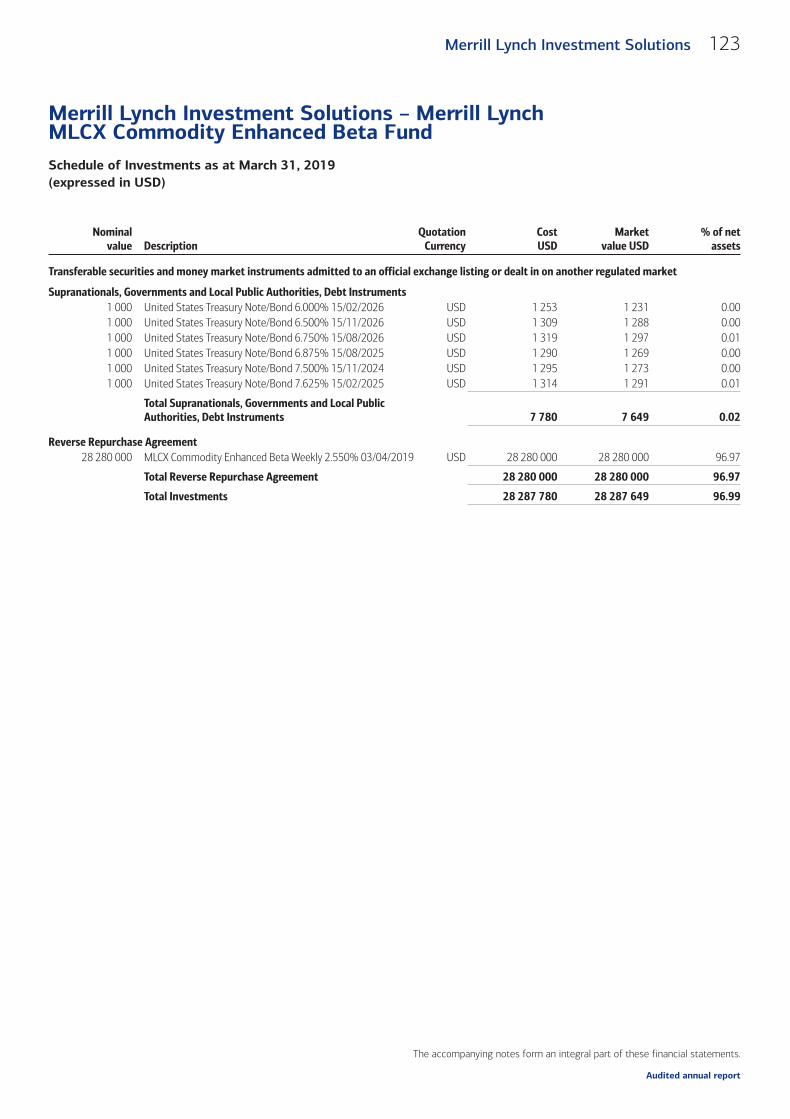
Nominalvalue Description
QuotationCurrency
CostUSD
Marketvalue USD
% of netassets
Transferable securities and money market instruments admitted to an official exchange listing or dealt in on another regulated market
Supranationals, Governments and Local Public Authorities, Debt Instruments1 000 United States Treasury Note/Bond 6.000% 15/02/2026 USD 1 253 1 231 0.001 000 United States Treasury Note/Bond 6.500% 15/11/2026 USD 1 309 1 288 0.001 000 United States Treasury Note/Bond 6.750% 15/08/2026 USD 1 319 1 297 0.011 000 United States Treasury Note/Bond 6.875% 15/08/2025 USD 1 290 1 269 0.001 000 United States Treasury Note/Bond 7.500% 15/11/2024 USD 1 295 1 273 0.001 000 United States Treasury Note/Bond 7.625% 15/02/2025 USD 1 314 1 291 0.01
Total Supranationals, Governments and Local PublicAuthorities, Debt Instruments 7 780 7 649 0.02
Reverse Repurchase Agreement28 280 000 MLCX Commodity Enhanced Beta Weekly 2.550% 03/04/2019 USD 28 280 000 28 280 000 96.97
Total Reverse Repurchase Agreement 28 280 000 28 280 000 96.97
Total Investments 28 287 780 28 287 649 96.99
123Merrill Lynch Investment Solutions
Merrill Lynch Investment Solutions – Merrill LynchMLCX Commodity Enhanced Beta FundSchedule of Investments as at March 31, 2019(expressed in USD)
The accompanying notes form an integral part of these financial statements.
Audited annual report

Industrial classification of investments(as a percentage of net assets as at March 31, 2019) %
Reverse Repurchase Agreements 96.97Sovereign 0.02
96.99
Geographical classification of investments(as a percentage of net assets as at March 31, 2019) %
United States 96.99
96.99
Currencybought Amount bought Currency sold Amount sold
Maturitydate Counterparty
Unrealisedappreciation/
(depreciation)USD
Forward foreign exchange contracts
EUR 25 098 350 USD 28 405 298 30/04/2019State Street Bank and Trust
Co. (157 083)
USD 555 755 EUR 492 924 30/04/2019State Street Bank and Trust
Co. 969
Total forward foreign exchange contracts (156 114)
Notional Pay Receive CurrencyMaturity
date Counterparty
Unrealisedappreciation/depreciation
USDCommitment
USD
Total return swaps
28 681 020ICE BofAML Commodity indexeXtra 03 Index USD 1 Month LIBOR USD 09/12/2019
Merrill LynchInternational Ltd. 451 844 29 132 865
Total return swaps 451 844 29 132 865
The maximum individual counterparty exposure for OTC Derivatives including CFD as at March 31, 2019 is 0.42% of the NAV.
124 Merrill Lynch Investment Solutions
Merrill Lynch Investment Solutions – Merrill LynchMLCX Commodity Enhanced Beta FundSchedule of Investments as at March 31, 2019 (cont.)(expressed in USD)
The accompanying notes form an integral part of these financial statements.
Audited annual report

Nominalvalue Description
QuotationCurrency
CostUSD
Marketvalue USD
% of netassets
Transferable securities and money market instruments admitted to an official exchange listing or dealt in on another regulated market
Supranationals, Governments and Local Public Authorities, Debt Instruments1 000 United States Treasury Note/Bond 6.000% 15/02/2026 USD 1 267 1 231 0.001 000 United States Treasury Note/Bond 6.500% 15/11/2026 USD 1 324 1 288 0.001 000 United States Treasury Note/Bond 6.750% 15/08/2026 USD 1 332 1 297 0.011 000 United States Treasury Note/Bond 6.875% 15/08/2025 USD 1 303 1 269 0.001 000 United States Treasury Note/Bond 7.500% 15/11/2024 USD 1 305 1 273 0.001 000 United States Treasury Note/Bond 7.625% 15/02/2025 USD 1 324 1 291 0.00
Total Supranationals, Governments and Local PublicAuthorities, Debt Instruments 7 855 7 649 0.01
Reverse Repurchase Agreement67 330 000 MLCX Commodity Alpha Weekly 2.550% 03/04/2019 USD 67 330 000 67 330 000 95.65
Total Reverse Repurchase Agreement 67 330 000 67 330 000 95.65
Total Investments 67 337 855 67 337 649 95.66
125Merrill Lynch Investment Solutions
Merrill Lynch Investment Solutions – Merrill LynchMLCX Commodity Alpha FundSchedule of Investments as at March 31, 2019(expressed in USD)
The accompanying notes form an integral part of these financial statements.
Audited annual report
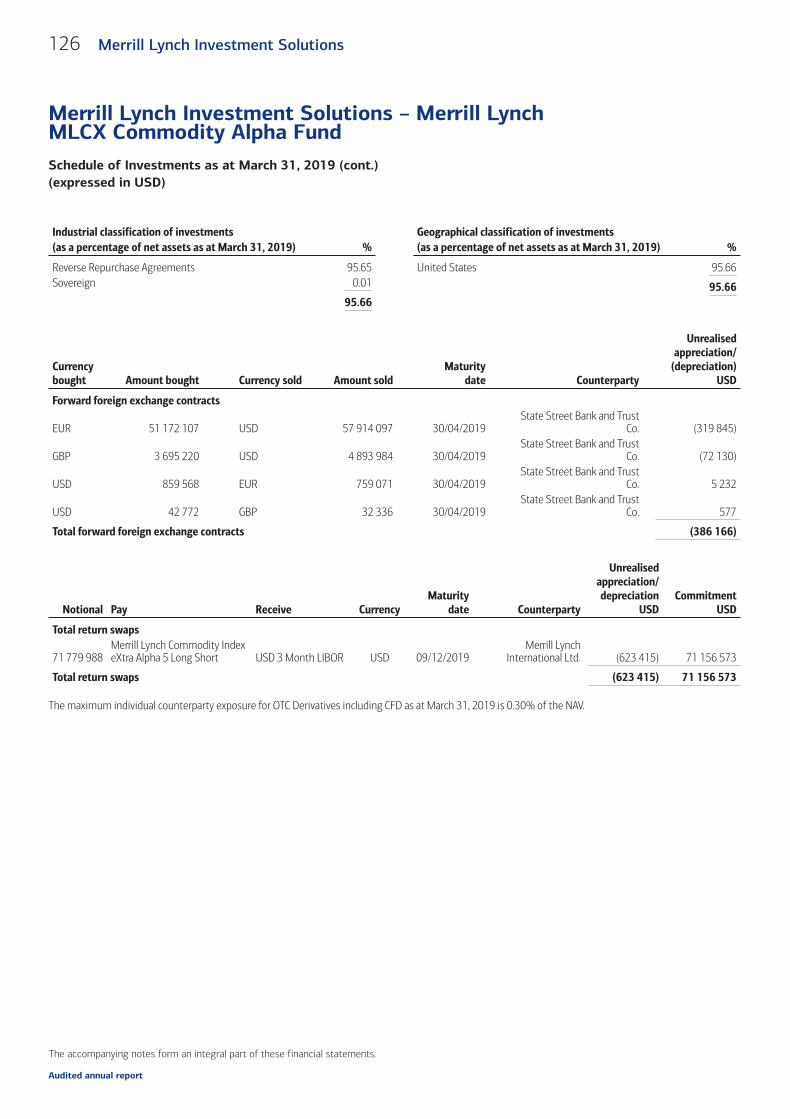
Industrial classification of investments(as a percentage of net assets as at March 31, 2019) %
Reverse Repurchase Agreements 95.65Sovereign 0.01
95.66
Geographical classification of investments(as a percentage of net assets as at March 31, 2019) %
United States 95.66
95.66
Currencybought Amount bought Currency sold Amount sold
Maturitydate Counterparty
Unrealisedappreciation/
(depreciation)USD
Forward foreign exchange contracts
EUR 51 172 107 USD 57 914 097 30/04/2019State Street Bank and Trust
Co. (319 845)
GBP 3 695 220 USD 4 893 984 30/04/2019State Street Bank and Trust
Co. (72 130)
USD 859 568 EUR 759 071 30/04/2019State Street Bank and Trust
Co. 5 232
USD 42 772 GBP 32 336 30/04/2019State Street Bank and Trust
Co. 577
Total forward foreign exchange contracts (386 166)
Notional Pay Receive CurrencyMaturity
date Counterparty
Unrealisedappreciation/depreciation
USDCommitment
USD
Total return swaps
71 779 988Merrill Lynch Commodity IndexeXtra Alpha 5 Long Short USD 3 Month LIBOR USD 09/12/2019
Merrill LynchInternational Ltd. (623 415) 71 156 573
Total return swaps (623 415) 71 156 573
The maximum individual counterparty exposure for OTC Derivatives including CFD as at March 31, 2019 is 0.30% of the NAV.
126 Merrill Lynch Investment Solutions
Merrill Lynch Investment Solutions – Merrill LynchMLCX Commodity Alpha FundSchedule of Investments as at March 31, 2019 (cont.)(expressed in USD)
The accompanying notes form an integral part of these financial statements.
Audited annual report

Nominalvalue/
Quantity DescriptionQuotation
CurrencyCostUSD
Marketvalue USD
% of netassets
Transferable securities and money market instruments admitted to an official exchange listing or dealt in on another regulated market
Shares313 000 Anhui Conch Cement Co. Ltd. - H HKD 1 779 528 1 911 904 3.00257 000 ANTA Sports Products Ltd. HKD 1 500 269 1 748 266 2.74
8 212 000 China Tower Corp. Ltd. - H 144A HKD 1 974 760 1 903 941 2.99639 000 China Vanke Co. Ltd. - H HKD 2 185 686 2 686 259 4.21
3 012 000 CIFI Hldg. Group Co. Ltd. HKD 2 220 750 2 282 995 3.58576 000 CSPC Pharmaceutical Group Ltd. HKD 1 009 028 1 071 293 1.68
30 271 Ctrip.com International Ltd. - ADR USD 1 156 457 1 322 540 2.07266 000 Galaxy Entertainment Group Ltd. HKD 1 876 626 1 811 184 2.84
2 636 000 Kingboard Laminates Hldg. Ltd. HKD 3 127 013 2 770 336 4.351 428 000 Logan Property Hldg. Ltd. HKD 1 753 978 2 364 856 3.711 216 000 Longfor Group Hldg. Ltd. HKD 3 372 383 4 283 136 6.72
269 100 Shenzhou International Group Hldg. Ltd. HKD 2 111 064 3 606 306 5.6668 000 Shimao Property Hldg. Ltd. HKD 207 363 212 664 0.33
151 000 Silergy Corp. TWD 2 295 436 2 253 695 3.54146 000 Techtronic Industries Co. Ltd. HKD 937 391 981 089 1.54321 500 Wuxi Biologics Cayman, Inc. 144A HKD 3 185 533 3 126 966 4.90693 200 Wynn Macau Ltd. HKD 1 759 907 1 633 666 2.56
2 291 500 Xtep International Hldg. Ltd. HKD 1 650 408 1 637 630 2.5723 077 Zai Lab Ltd. - ADR USD 658 109 681 002 1.07
Total Shares 34 761 689 38 289 728 60.06
Supranationals, Governments and Local Public Authorities, Debt Instruments2 300 000 United States Treasury Bill 0.000% 18/04/2019 USD 2 297 447 2 297 431 3.603 000 000 United States Treasury Bill 0.000% 25/04/2019 USD 2 995 313 2 995 323 4.702 200 000 United States Treasury Bill 0.000% 13/06/2019 USD 2 189 325 2 189 455 3.433 000 000 United States Treasury Bill 0.000% 27/06/2019 USD 2 982 636 2 982 979 4.68
Total Supranationals, Governments and Local PublicAuthorities, Debt Instruments 10 464 721 10 465 188 16.41
Total Investments 45 226 410 48 754 916 76.47
127Merrill Lynch Investment Solutions
Merrill Lynch Investment Solutions – Zeal Greater ChinaLong Short UCITS FundSchedule of Investments as at March 31, 2019(expressed in USD)
The accompanying notes form an integral part of these financial statements.
Audited annual report

Industrial classification of investments(as a percentage of net assets as at March 31, 2019) %
Real Estate 18.55Sovereign 16.41Pharmaceuticals 6.58Apparel 5.66Lodging 5.40Retail 5.31Chemicals 4.35Electronics 3.54Building Materials 3.00Engineering & Construction 2.99Internet 2.07Hand/Machine Tools 1.54Biotechnology 1.07
76.47
Geographical classification of investments(as a percentage of net assets as at March 31, 2019) %
China 48.44United States 16.41Hong Kong 9.06Macau 2.56
76.47
Currencybought Amount bought Currency sold Amount sold
Maturitydate Counterparty
Unrealisedappreciation/
(depreciation)USD
Forward foreign exchange contracts
EUR 8 628 820 USD 9 765 725 30/04/2019State Street Bank and Trust
Co. (53 980)
USD 81 822 EUR 72 301 30/04/2019State Street Bank and Trust
Co. 447
Total forward foreign exchange contracts (53 533)
Contracts for difference
The Sub-Fund Merrill Lynch Investment Solutions – Zeal Greater China Long Short UCITS Fund entered into contracts for difference swaps with two counterparties(Merrill Lynch International Bank Ltd. and Morgan Stanley International Plc.) with the following details:
Counterparty Industrial sectorUnderlyingnature Long/Short
CommitmentUSD
Unrealisedappreciation/
(depreciation)USD
Contracts for differenceMerrill Lynch International Bank Ltd. Auto Manufacturers Equity Short 2 533 451 129 325Merrill Lynch International Bank Ltd. Banks Equity Short 3 103 036 13 800Merrill Lynch International Bank Ltd. Coal Equity Short 657 858 (11 911)Merrill Lynch International Bank Ltd. Internet Equity Short 2 524 328 (37 217)Merrill Lynch International Bank Ltd. Miscellaneous Manufacturing Equity Short 964 974 (120)Merrill Lynch International Bank Ltd. Retail Equity Short 626 223 6 037Merrill Lynch International Bank Ltd. Software Equity Short 649 347 7 486Morgan Stanley International Plc. Banks Equity Long 1 017 688 168 323Morgan Stanley International Plc. Beverages Equity Long 1 175 265 299 388Morgan Stanley International Plc. Chemicals Equity Long 2 058 200 292 837Morgan Stanley International Plc. Electronics Equity Long 3 145 023 770 193Morgan Stanley International Plc. Internet Equity Short 401 571 13 466Morgan Stanley International Plc. Software Equity Long 1 133 484 152 957
128 Merrill Lynch Investment Solutions
Merrill Lynch Investment Solutions – Zeal Greater ChinaLong Short UCITS FundSchedule of Investments as at March 31, 2019 (cont.)(expressed in USD)
The accompanying notes form an integral part of these financial statements.
Audited annual report

Counterparty Industrial sectorUnderlyingnature Long/Short
CommitmentUSD
Unrealisedappreciation/
(depreciation)USD
Contracts for difference (cont.)Morgan Stanley International Plc. Telecommunications Equity Short 412 958 45 768Morgan Stanley International Plc. Textiles Equity Long 1 513 088 (79 107)
Total 21 916 494 1 771 225
Contracts for Difference Summary Breakdowns:
CommitmentLong
CommitmentShort
Unrealisedof short portfolio
Unrealisedof long portfolio
Realised result(monthly reset) Market Value
Counterparty USD USD USD USD USD USD
Merrill Lynch International Bank Ltd. - 11 059 217 107 400 - (7 665) 99 735Morgan Stanley International Plc. 10 042 748 814 529 59 234 1 604 591 (5 765) 1 658 060
Total 10 042 748 11 873 746 166 634 1 604 591 (13 430) 1 757 795
The maximum individual counterparty exposure for OTC Derivatives including CFD as at March 31, 2019 is 0.75% of the NAV.
129Merrill Lynch Investment Solutions
Merrill Lynch Investment Solutions – Zeal Greater ChinaLong Short UCITS FundSchedule of Investments as at March 31, 2019 (cont.)(expressed in USD)
The accompanying notes form an integral part of these financial statements.
Audited annual report

Nominalvalue/
Quantity DescriptionQuotation
CurrencyCostUSD
Marketvalue USD
% of netassets
Transferable securities and money market instruments admitted to an official exchange listing or dealt in on another regulated market
Bonds6 610 000 Deck Chassis Acquisition, Inc. 144A 10.000% 15/06/2023 USD 6 987 137 6 998 338 2.35
14 037 000 First Data Corp. 144A 5.750% 15/01/2024 USD 14 463 723 14 433 545 4.85958 000 Inmarsat Finance Plc. 144A 6.500% 01/10/2024 USD 1 003 505 1 005 900 0.34
6 981 000 Multi-Color Corp. 144A 4.875% 01/11/2025 USD 7 070 380 7 207 882 2.42985 000 Multi-Color Corp. 144A 6.125% 01/12/2022 USD 1 015 146 1 014 550 0.34
3 000 000 Travelport Corporate Finance Plc. 144A 6.000% 15/03/2026 USD 3 038 924 3 240 000 1.0914 438 000 Tribune Media Co 5.875% 15/07/2022 USD 14 667 984 14 735 784 4.95
339 000 USG Corp. 144A 5.500% 01/03/2025 USD 342 817 344 255 0.124 809 000 Versum Materials, Inc. 144A 5.500% 30/09/2024 USD 5 039 438 5 055 461 1.70
Total Bonds 53 629 054 54 035 715 18.16
Shares26 331 Avaya Hldg. Corp. USD 460 546 443 151 0.15
262 360 Bemis Co., Inc. USD 12 769 362 14 555 733 4.89200 068 BioScrip, Inc. USD 458 481 400 136 0.13
846 Bristol-Myers Squibb Co. USD 38 933 40 363 0.01135 055 Caesars Entertainment Corp. USD 1 133 494 1 173 628 0.39
45 539 Cars.com, Inc. USD 1 028 657 1 038 289 0.3514 264 Celgene Corp. USD 1 240 211 1 345 666 0.4594 651 Earthport Plc. GBP 45 482 45 017 0.02
321 500 First Data Corp. - A USD 7 932 032 8 445 805 2.84394 636 Genworth Financial, Inc. - A USD 1 552 262 1 511 456 0.51
84 856 Integrated Device Technology, Inc. USD 4 103 107 4 157 095 1.409 098 Jack in the Box, Inc. USD 706 059 737 484 0.25
199 327 Luxoft Holding, Inc. USD 11 495 937 11 702 488 3.9372 463 Magellan Health, Inc. USD 4 665 732 4 776 761 1.61
853 653 Maxwell Technologies, Inc. USD 3 870 655 3 815 829 1.28209 457 Mellanox Technologies Ltd. USD 24 691 225 24 791 330 8.33119 022 Nielsen Hldg. Plc. USD 2 977 686 2 817 251 0.95163 322 Red Hat, Inc. USD 29 229 505 29 838 929 10.03193 257 Spark Therapeutics, Inc. USD 21 891 443 22 008 107 7.40
73 000 SunTrust Banks, Inc. USD 4 418 607 4 325 250 1.4543 752 Ultimate Software Group, Inc. USD 14 532 910 14 443 848 4.8531 756 WABCO Hldg., Inc. USD 4 163 759 4 186 393 1.41
7 100 WellCare Health Plans, Inc. USD 1 803 829 1 915 225 0.64129 500 Worldpay, Inc. - A USD 13 848 954 14 698 250 4.94
Total Shares 169 058 868 173 213 484 58.21
Supranationals, Governments and Local Public Authorities, Debt Instruments100 000 United States Treasury Bill 0.000% 04/04/2019 USD 99 980 99 980 0.03
5 000 000 United States Treasury Bill 0.000% 11/04/2019 USD 4 996 750 4 996 702 1.6840 000 000 United States Treasury Bill 0.000% 23/04/2019 USD 39 941 632 39 941 594 13.42
130 Merrill Lynch Investment Solutions
Merrill Lynch Investment Solutions – Ramius MergerArbitrage UCITS FundSchedule of Investments as at March 31, 2019(expressed in USD)
The accompanying notes form an integral part of these financial statements.
Audited annual report
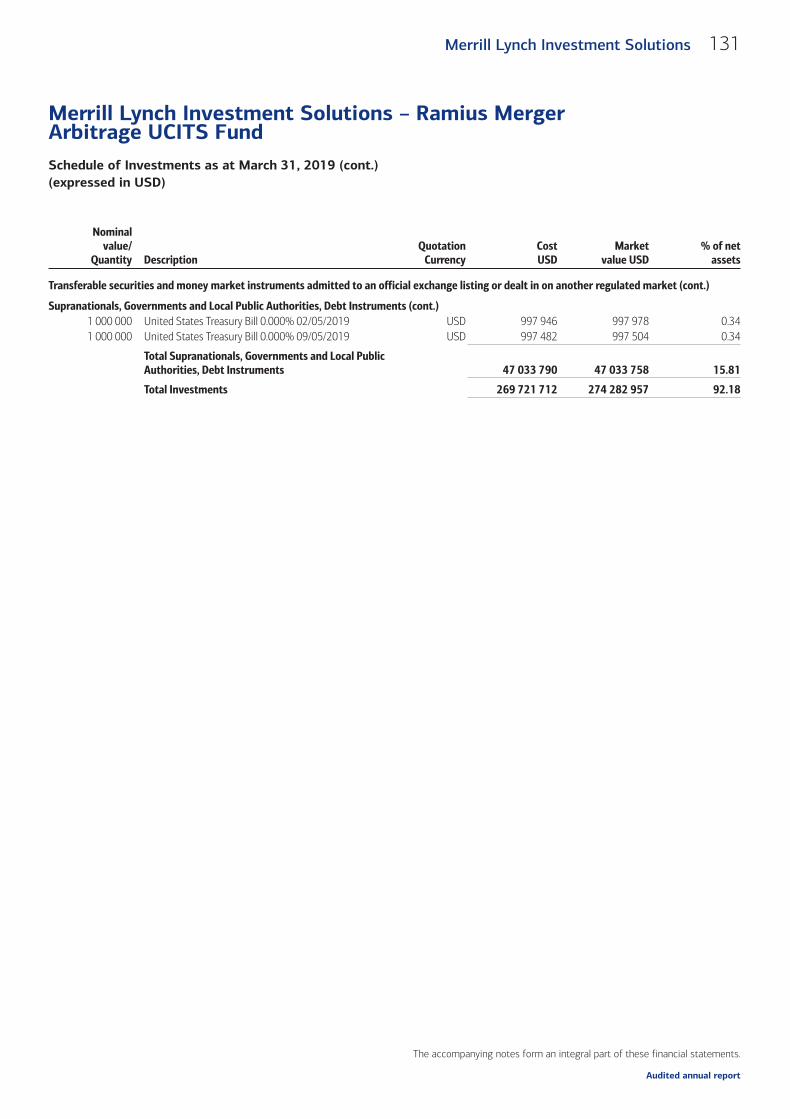
Nominalvalue/
Quantity DescriptionQuotation
CurrencyCostUSD
Marketvalue USD
% of netassets
Transferable securities and money market instruments admitted to an official exchange listing or dealt in on another regulated market (cont.)
Supranationals, Governments and Local Public Authorities, Debt Instruments (cont.)1 000 000 United States Treasury Bill 0.000% 02/05/2019 USD 997 946 997 978 0.341 000 000 United States Treasury Bill 0.000% 09/05/2019 USD 997 482 997 504 0.34
Total Supranationals, Governments and Local PublicAuthorities, Debt Instruments 47 033 790 47 033 758 15.81
Total Investments 269 721 712 274 282 957 92.18
131Merrill Lynch Investment Solutions
Merrill Lynch Investment Solutions – Ramius MergerArbitrage UCITS FundSchedule of Investments as at March 31, 2019 (cont.)(expressed in USD)
The accompanying notes form an integral part of these financial statements.
Audited annual report

Industrial classification of investments(as a percentage of net assets as at March 31, 2019) %
Software 22.72Sovereign 15.81Semiconductors 9.73Biotechnology 7.85Packaging & Containers 7.65Commercial Services 5.89Computers 5.21Media 4.95Auto Manufacturers 2.35Healthcare-Services 2.25Chemicals 1.70Banks 1.45Auto Parts & Equipment 1.41Diversified Financial Services 1.11Insurance 0.51Lodging 0.39Internet 0.35Telecommunications 0.34Retail 0.25Pharmaceuticals 0.14Building Materials 0.12
92.18
Geographical classification of investments(as a percentage of net assets as at March 31, 2019) %
United States 78.47Israel 8.33Switzerland 3.93United Kingdom 1.45
92.18
Currencybought Amount bought Currency sold Amount sold
Maturitydate Counterparty
Unrealisedappreciation/
(depreciation)USD
Forward foreign exchange contracts
EUR 202 814 648 USD 229 536 339 30/04/2019State Street Bank and Trust
Co. (1 268 280)
GBP 2 996 075 USD 3 968 028 30/04/2019State Street Bank and Trust
Co. (58 480)
SEK 67 712 289 USD 7 304 005 30/04/2019State Street Bank and Trust
Co. 11 560
USD 2 864 256 EUR 2 533 936 30/04/2019State Street Bank and Trust
Co. 12 312
USD 80 527 SEK 743 422 30/04/2019State Street Bank and Trust
Co. 208
Total forward foreign exchange contracts (1 302 680)
Short/Long Currency Description
Put/Call
StrikePrice
Maturitydate Quantity
Marketvalue USD
CommitmentUSD
OptionsLong USD Avaya Hldg. Corp. Call 17.5000 18/04/2019 23 900 22 705 -Long USD Avaya Hldg. Corp. Call 17.5000 17/05/2019 47 900 65 623 -Long USD BB&T Corp. Put 47.0000 21/06/2019 6 900 14 007 -Long USD Bristol-Myers Squibb Co. Call 60.0000 18/04/2019 21 200 424 -Long USD Bristol-Myers Squibb Co. Call 50.0000 17/05/2019 119 700 119 700 -Long USD Denbury Resources, Inc. Call 2.5000 21/06/2019 25 300 5 060 -Long USD Denbury Resources, Inc. Call 2.0000 21/06/2019 34 000 12 580 -
132 Merrill Lynch Investment Solutions
Merrill Lynch Investment Solutions – Ramius MergerArbitrage UCITS FundSchedule of Investments as at March 31, 2019 (cont.)(expressed in USD)
The accompanying notes form an integral part of these financial statements.
Audited annual report

Short/Long Currency Description
Put/Call
StrikePrice
Maturitydate Quantity
Marketvalue USD
CommitmentUSD
Options (cont.)Long USD Denbury Resources, Inc. Call 2.5000 17/01/2020 32 400 16 200 -Long USD Fifth Third Bancorp Put 25.0000 17/05/2019 14 400 10 512 -Long USD Fiserv, Inc. Put 75.0000 21/06/2019 21 600 7 020 -Long USD Harris Corp. Put 140.0000 17/05/2019 14 000 15 400 -Long USD II-VI, Inc. Put 30.0000 18/04/2019 21 600 2 160 -Long USD KLA-Tencor Corp. Put 90.0000 21/06/2019 16 400 7 380 -Long USD KLA-Tencor Corp. Put 95.0000 21/06/2019 30 400 21 280 -Long USD Kraft Heinz Co. Call 35.0000 19/07/2019 24 100 20 967 -Long USD Kraft Heinz Co. Call 37.5000 18/10/2019 24 100 20 726 -Long USD Luxoft Hldg., Inc. Put 45.0000 19/07/2019 34 700 1 735 -Long USD Nexstar Media Group, Inc. Put 95.0000 18/04/2019 12 000 2 400 -Long USD Nexstar Media Group, Inc. Put 85.0000 18/04/2019 23 800 9 520 -Long USD Nexstar Media Group, Inc. Put 75.0000 17/05/2019 9 400 1 880 -Long USD Nexstar Media Group, Inc. Put 85.0000 17/05/2019 11 900 4 284 -Long USD Nielsen Hldg. Plc. Call 27.0000 18/04/2019 12 100 6 050 -Long USD Nielsen Hldg. Plc. Call 25.0000 21/06/2019 47 900 71 850 -Long USD Nielsen Hldg. Plc. Put 23.0000 18/04/2019 23 900 26 290 -Long USD Nielsen Hldg. Plc. Put 23.0000 17/05/2019 12 000 17 160 -Long USD Nielsen Hldg. Plc. Put 25.0000 17/05/2019 47 900 122 145 -Long USD Red Hat, Inc. Put 175.0000 21/06/2019 23 800 45 458 -Long USD Red Hat, Inc. Put 150.0000 20/09/2019 43 200 97 200 -Short USD S&P 500 Index Put 2 700.0000 18/04/2019 (47 000) (230 300) 126 900 000Long USD S&P 500 Index Put 2 600.0000 18/04/2019 23 500 37 365 -Long USD S&P 500 Index Put 2 800.0000 18/04/2019 23 500 435 220 -Short USD S&P 500 Index Put 2 700.0000 26/04/2019 (9 600) (77 856) 25 920 000Long USD S&P 500 Index Put 2 600.0000 26/04/2019 4 800 14 880 -Long USD S&P 500 Index Put 2 800.0000 26/04/2019 4 800 114 528 -Long USD Spark Therapeutics, Inc. Call 115.0000 18/04/2019 13 200 660 -Long USD Spark Therapeutics, Inc. Put 75.0000 18/04/2019 14 100 2 115 -Long USD Spark Therapeutics, Inc. Put 70.0000 18/04/2019 48 100 4 810 -Long USD Spark Therapeutics, Inc. Put 110.0000 18/04/2019 9 400 4 888 -Long USD Spark Therapeutics, Inc. Put 100.0000 18/04/2019 14 600 5 110 -Long USD Spark Therapeutics, Inc. Put 50.0000 18/04/2019 237 500 11 875 -Long USD Spark Therapeutics, Inc. Put 60.0000 18/04/2019 240 400 12 020 -Long USD Spark Therapeutics, Inc. Put 55.0000 18/04/2019 533 700 26 685 -Long USD Spark Therapeutics, Inc. Put 105.0000 18/04/2019 48 100 28 860 -Long USD Spark Therapeutics, Inc. Put 65.0000 20/09/2019 700 88 -Long USD SPDR S&P 500 Trust ETF Call 287.0000 05/04/2019 10 000 2 600 -Long USD SPDR S&P 500 Trust ETF Call 289.0000 05/04/2019 76 200 4 572 -Long USD SPDR S&P 500 Trust ETF Call 286.0000 12/04/2019 9 200 9 752 -Long USD SPDR S&P 500 Trust ETF Call 287.0000 12/04/2019 13 800 11 040 -Long USD SPDR S&P 500 Trust ETF Call 285.0000 12/04/2019 20 700 31 257 -Long USD Symantec Corp. Put 21.0000 18/04/2019 36 100 3 429 -Long USD Symantec Corp. Put 22.0000 18/04/2019 18 100 3 982 -Long USD Technology Select Sector SPDR Fund Put 71.0000 21/06/2019 32 300 47 804 -Long USD Technology Select Sector SPDR Fund Put 70.0000 21/06/2019 71 800 87 596 -Short USD Tesla, Inc. Put 225.0000 29/03/2019 (4 800) (48) 1 080 000Long USD Tesla, Inc. Put 245.0000 29/03/2019 4 800 48 -Long USD T-Mobile US, Inc. Put 70.0000 17/05/2019 6 100 21 533 -Long USD T-Mobile US, Inc. Put 65.0000 17/05/2019 23 400 32 994 -
133Merrill Lynch Investment Solutions
Merrill Lynch Investment Solutions – Ramius MergerArbitrage UCITS FundSchedule of Investments as at March 31, 2019 (cont.)(expressed in USD)
The accompanying notes form an integral part of these financial statements.
Audited annual report
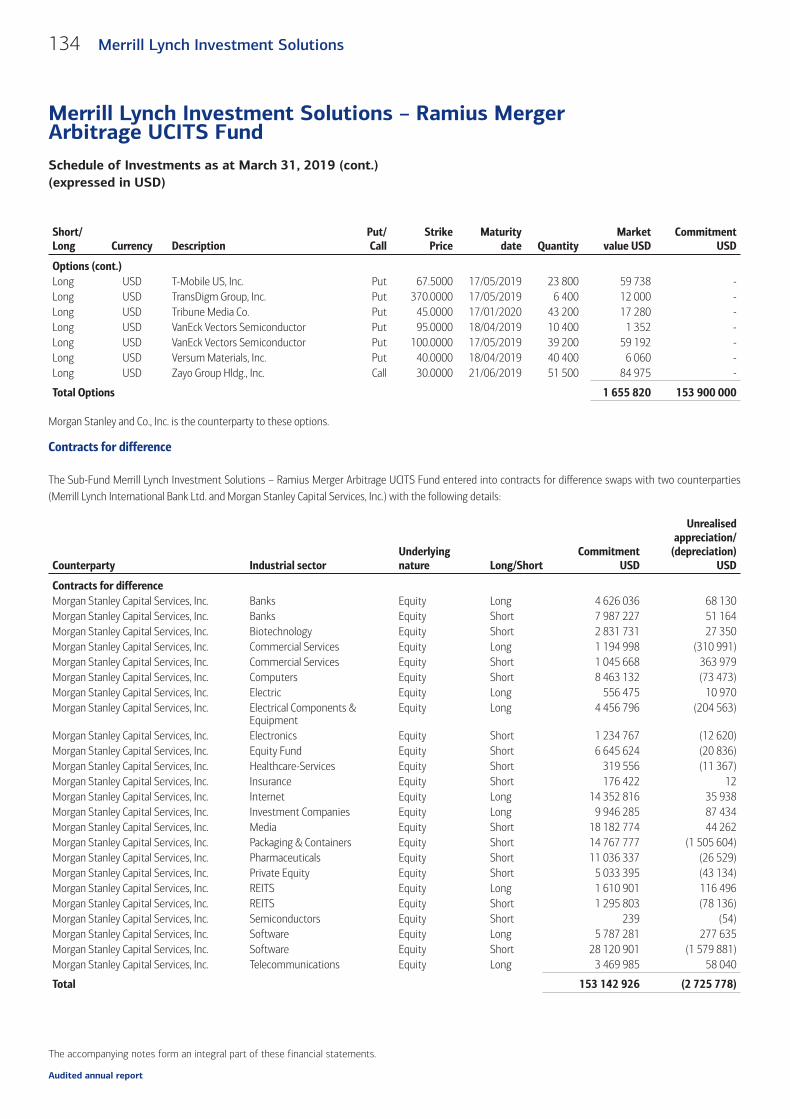
Short/Long Currency Description
Put/Call
StrikePrice
Maturitydate Quantity
Marketvalue USD
CommitmentUSD
Options (cont.)Long USD T-Mobile US, Inc. Put 67.5000 17/05/2019 23 800 59 738 -Long USD TransDigm Group, Inc. Put 370.0000 17/05/2019 6 400 12 000 -Long USD Tribune Media Co. Put 45.0000 17/01/2020 43 200 17 280 -Long USD VanEck Vectors Semiconductor Put 95.0000 18/04/2019 10 400 1 352 -Long USD VanEck Vectors Semiconductor Put 100.0000 17/05/2019 39 200 59 192 -Long USD Versum Materials, Inc. Put 40.0000 18/04/2019 40 400 6 060 -Long USD Zayo Group Hldg., Inc. Call 30.0000 21/06/2019 51 500 84 975 -
Total Options 1 655 820 153 900 000
Morgan Stanley and Co., Inc. is the counterparty to these options.
Contracts for difference
The Sub-Fund Merrill Lynch Investment Solutions – Ramius Merger Arbitrage UCITS Fund entered into contracts for difference swaps with two counterparties(Merrill Lynch International Bank Ltd. and Morgan Stanley Capital Services, Inc.) with the following details:
Counterparty Industrial sectorUnderlyingnature Long/Short
CommitmentUSD
Unrealisedappreciation/
(depreciation)USD
Contracts for differenceMorgan Stanley Capital Services, Inc. Banks Equity Long 4 626 036 68 130Morgan Stanley Capital Services, Inc. Banks Equity Short 7 987 227 51 164Morgan Stanley Capital Services, Inc. Biotechnology Equity Short 2 831 731 27 350Morgan Stanley Capital Services, Inc. Commercial Services Equity Long 1 194 998 (310 991)Morgan Stanley Capital Services, Inc. Commercial Services Equity Short 1 045 668 363 979Morgan Stanley Capital Services, Inc. Computers Equity Short 8 463 132 (73 473)Morgan Stanley Capital Services, Inc. Electric Equity Long 556 475 10 970Morgan Stanley Capital Services, Inc. Electrical Components &
EquipmentEquity Long 4 456 796 (204 563)
Morgan Stanley Capital Services, Inc. Electronics Equity Short 1 234 767 (12 620)Morgan Stanley Capital Services, Inc. Equity Fund Equity Short 6 645 624 (20 836)Morgan Stanley Capital Services, Inc. Healthcare-Services Equity Short 319 556 (11 367)Morgan Stanley Capital Services, Inc. Insurance Equity Short 176 422 12Morgan Stanley Capital Services, Inc. Internet Equity Long 14 352 816 35 938Morgan Stanley Capital Services, Inc. Investment Companies Equity Long 9 946 285 87 434Morgan Stanley Capital Services, Inc. Media Equity Short 18 182 774 44 262Morgan Stanley Capital Services, Inc. Packaging & Containers Equity Short 14 767 777 (1 505 604)Morgan Stanley Capital Services, Inc. Pharmaceuticals Equity Short 11 036 337 (26 529)Morgan Stanley Capital Services, Inc. Private Equity Equity Short 5 033 395 (43 134)Morgan Stanley Capital Services, Inc. REITS Equity Long 1 610 901 116 496Morgan Stanley Capital Services, Inc. REITS Equity Short 1 295 803 (78 136)Morgan Stanley Capital Services, Inc. Semiconductors Equity Short 239 (54)Morgan Stanley Capital Services, Inc. Software Equity Long 5 787 281 277 635Morgan Stanley Capital Services, Inc. Software Equity Short 28 120 901 (1 579 881)Morgan Stanley Capital Services, Inc. Telecommunications Equity Long 3 469 985 58 040
Total 153 142 926 (2 725 778)
134 Merrill Lynch Investment Solutions
Merrill Lynch Investment Solutions – Ramius MergerArbitrage UCITS FundSchedule of Investments as at March 31, 2019 (cont.)(expressed in USD)
The accompanying notes form an integral part of these financial statements.
Audited annual report

Contracts for Difference Summary Breakdowns:
CommitmentLong
CommitmentShort
Unrealisedof short portfolio
Unrealisedof long portfolio
Realised result(monthly reset) Market Value
Counterparty USD USD USD USD USD USD
Morgan Stanley Capital Services, Inc. 46 001 573 107 141 353 (2 864 867) 139 089 (414 697) (3 140 475)
Total 46 001 573 107 141 353 (2 864 867) 139 089 (414 697) (3 140 475)
The maximum individual counterparty exposure for OTC Derivatives including CFD as at March 31, 2019 is 0.60% of the NAV.
135Merrill Lynch Investment Solutions
Merrill Lynch Investment Solutions – Ramius MergerArbitrage UCITS FundSchedule of Investments as at March 31, 2019 (cont.)(expressed in USD)
The accompanying notes form an integral part of these financial statements.
Audited annual report

Nominalvalue Description
QuotationCurrency
CostEUR
Marketvalue EUR
% of netassets
Transferable securities and money market instruments admitted to an official exchange listing or dealt in on another regulated market
Supranationals, Governments and Local Public Authorities, Debt Instruments1 000 Bundesrepublik Deutschland Bundesanleihe - Reg 1.500%
15/02/2023EUR 1 076 1 080 0.00
1 000 Bundesrepublik Deutschland Bundesanleihe - Reg 1.500%15/05/2023
EUR 1 080 1 085 0.00
1 000 Bundesrepublik Deutschland Bundesanleihe - Reg 2.000%15/08/2023
EUR 1 106 1 112 0.00
1 000 Bundesrepublik Deutschland Bundesanleihe - Reg 5.625%04/01/2028
EUR 1 496 1 517 0.00
1 000 Bundesrepublik Deutschland Bundesanleihe - Reg 6.250%04/01/2024
EUR 1 321 1 324 0.00
1 000 Bundesrepublik Deutschland Bundesanleihe - Reg 6.500%04/07/2027
EUR 1 542 1 564 0.01
Total Supranationals, Governments and Local PublicAuthorities, Debt Instruments 7 621 7 682 0.01
Reverse Repurchase Agreement94 550 000 Union II Weekly (0.418)% 03/04/2019 EUR 94 550 000 94 550 000 94.59
Total Reverse Repurchase Agreement 94 550 000 94 550 000 94.59
Total Investments 94 557 621 94 557 682 94.60
136 Merrill Lynch Investment Solutions
Merrill Lynch Investment Solutions – Merrill LynchEnhanced Cross-Asset Volatility Premium FundSchedule of Investments as at March 31, 2019(expressed in EUR)
The accompanying notes form an integral part of these financial statements.
Audited annual report

Industrial classification of investments(as a percentage of net assets as at March 31, 2019) %
Reverse Repurchase Agreements 94.59Sovereign 0.01
94.60
Geographical classification of investments(as a percentage of net assets as at March 31, 2019) %
Germany 94.60
94.60
Notional Pay Receive CurrencyMaturity
date Counterparty
Unrealisedappreciation/depreciation
EURCommitment
EUR
Total return swaps
(101 038 018)BofAML Cross-AssetVolatility Premium VI Index
EUR 1 MonthEURIBOR EUR 18/02/2020
Merrill LynchInternational Ltd. (1 249 243) 99 788 775
Total return swaps (1 249 243) 99 788 775
The maximum individual counterparty exposure for OTC Derivatives including CFD as at March 31, 2019 is 0.02% of the NAV.
137Merrill Lynch Investment Solutions
Merrill Lynch Investment Solutions – Merrill LynchEnhanced Cross-Asset Volatility Premium FundSchedule of Investments as at March 31, 2019 (cont.)(expressed in EUR)
The accompanying notes form an integral part of these financial statements.
Audited annual report
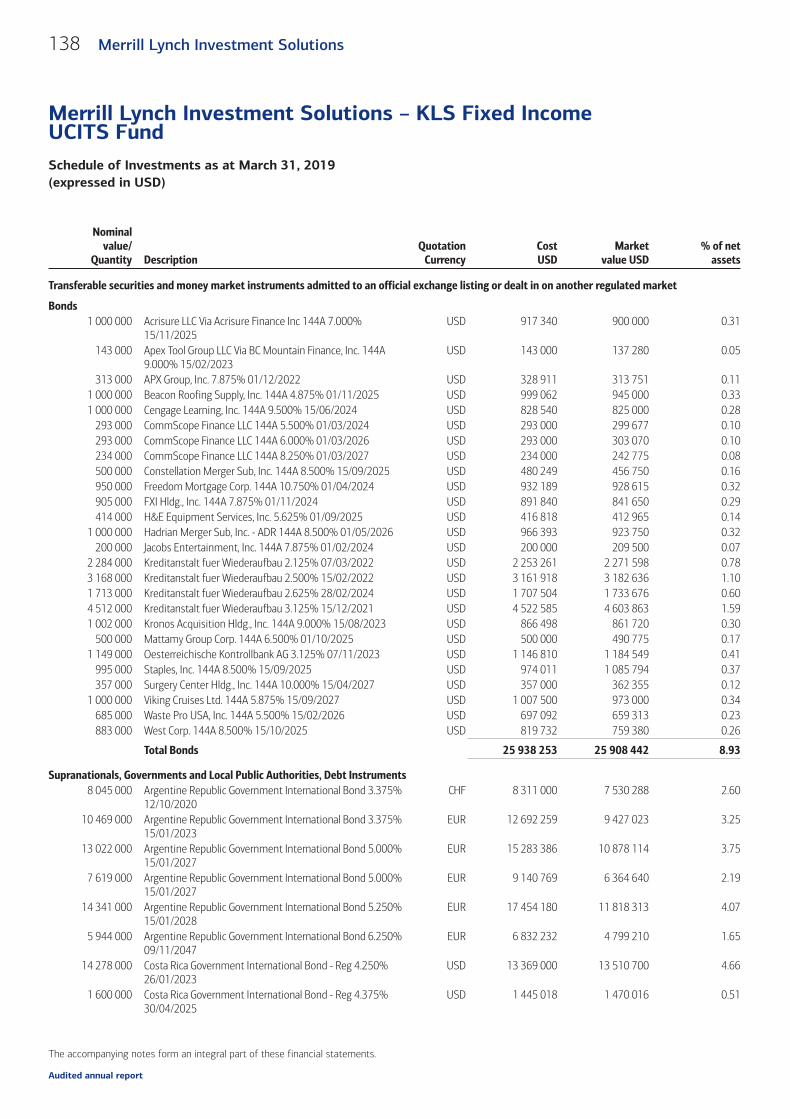
Nominalvalue/
Quantity DescriptionQuotation
CurrencyCostUSD
Marketvalue USD
% of netassets
Transferable securities and money market instruments admitted to an official exchange listing or dealt in on another regulated market
Bonds1 000 000 Acrisure LLC Via Acrisure Finance Inc 144A 7.000%
15/11/2025USD 917 340 900 000 0.31
143 000 Apex Tool Group LLC Via BC Mountain Finance, Inc. 144A9.000% 15/02/2023
USD 143 000 137 280 0.05
313 000 APX Group, Inc. 7.875% 01/12/2022 USD 328 911 313 751 0.111 000 000 Beacon Roofing Supply, Inc. 144A 4.875% 01/11/2025 USD 999 062 945 000 0.331 000 000 Cengage Learning, Inc. 144A 9.500% 15/06/2024 USD 828 540 825 000 0.28
293 000 CommScope Finance LLC 144A 5.500% 01/03/2024 USD 293 000 299 677 0.10293 000 CommScope Finance LLC 144A 6.000% 01/03/2026 USD 293 000 303 070 0.10234 000 CommScope Finance LLC 144A 8.250% 01/03/2027 USD 234 000 242 775 0.08500 000 Constellation Merger Sub, Inc. 144A 8.500% 15/09/2025 USD 480 249 456 750 0.16950 000 Freedom Mortgage Corp. 144A 10.750% 01/04/2024 USD 932 189 928 615 0.32905 000 FXI Hldg., Inc. 144A 7.875% 01/11/2024 USD 891 840 841 650 0.29414 000 H&E Equipment Services, Inc. 5.625% 01/09/2025 USD 416 818 412 965 0.14
1 000 000 Hadrian Merger Sub, Inc. - ADR 144A 8.500% 01/05/2026 USD 966 393 923 750 0.32200 000 Jacobs Entertainment, Inc. 144A 7.875% 01/02/2024 USD 200 000 209 500 0.07
2 284 000 Kreditanstalt fuer Wiederaufbau 2.125% 07/03/2022 USD 2 253 261 2 271 598 0.783 168 000 Kreditanstalt fuer Wiederaufbau 2.500% 15/02/2022 USD 3 161 918 3 182 636 1.101 713 000 Kreditanstalt fuer Wiederaufbau 2.625% 28/02/2024 USD 1 707 504 1 733 676 0.604 512 000 Kreditanstalt fuer Wiederaufbau 3.125% 15/12/2021 USD 4 522 585 4 603 863 1.591 002 000 Kronos Acquisition Hldg., Inc. 144A 9.000% 15/08/2023 USD 866 498 861 720 0.30
500 000 Mattamy Group Corp. 144A 6.500% 01/10/2025 USD 500 000 490 775 0.171 149 000 Oesterreichische Kontrollbank AG 3.125% 07/11/2023 USD 1 146 810 1 184 549 0.41
995 000 Staples, Inc. 144A 8.500% 15/09/2025 USD 974 011 1 085 794 0.37357 000 Surgery Center Hldg., Inc. 144A 10.000% 15/04/2027 USD 357 000 362 355 0.12
1 000 000 Viking Cruises Ltd. 144A 5.875% 15/09/2027 USD 1 007 500 973 000 0.34685 000 Waste Pro USA, Inc. 144A 5.500% 15/02/2026 USD 697 092 659 313 0.23883 000 West Corp. 144A 8.500% 15/10/2025 USD 819 732 759 380 0.26
Total Bonds 25 938 253 25 908 442 8.93
Supranationals, Governments and Local Public Authorities, Debt Instruments8 045 000 Argentine Republic Government International Bond 3.375%
12/10/2020CHF 8 311 000 7 530 288 2.60
10 469 000 Argentine Republic Government International Bond 3.375%15/01/2023
EUR 12 692 259 9 427 023 3.25
13 022 000 Argentine Republic Government International Bond 5.000%15/01/2027
EUR 15 283 386 10 878 114 3.75
7 619 000 Argentine Republic Government International Bond 5.000%15/01/2027
EUR 9 140 769 6 364 640 2.19
14 341 000 Argentine Republic Government International Bond 5.250%15/01/2028
EUR 17 454 180 11 818 313 4.07
5 944 000 Argentine Republic Government International Bond 6.250%09/11/2047
EUR 6 832 232 4 799 210 1.65
14 278 000 Costa Rica Government International Bond - Reg 4.250%26/01/2023
USD 13 369 000 13 510 700 4.66
1 600 000 Costa Rica Government International Bond - Reg 4.375%30/04/2025
USD 1 445 018 1 470 016 0.51
138 Merrill Lynch Investment Solutions
Merrill Lynch Investment Solutions – KLS Fixed IncomeUCITS FundSchedule of Investments as at March 31, 2019(expressed in USD)
The accompanying notes form an integral part of these financial statements.
Audited annual report

Nominalvalue/
Quantity DescriptionQuotation
CurrencyCostUSD
Marketvalue USD
% of netassets
Transferable securities and money market instruments admitted to an official exchange listing or dealt in on another regulated market (cont.)
Supranationals, Governments and Local Public Authorities, Debt Instruments (cont.)3 280 000 European Investment Bank 2.875% 15/12/2021 USD 3 279 809 3 325 725 1.155 560 000 European Investment Bank 2.875% 15/08/2023 USD 5 537 455 5 677 176 1.962 298 000 European Investment Bank 3.125% 14/12/2023 USD 2 293 295 2 376 385 0.821 626 000 Hellenic Republic Government Bond 144A 3.875%
12/03/2029EUR 1 817 262 1 844 237 0.64
3 397 000 Hellenic Republic Government Bond - Reg 144A 3.375%15/02/2025
EUR 3 812 710 3 886 409 1.34
7 974 000 Hellenic Republic Treasury Bill 0.000% 14/06/2019 EUR 9 222 570 8 932 689 3.081 200 000 Hellenic Republic Treasury Bill 0.000% 02/08/2019 EUR 1 375 314 1 342 899 0.467 000 000 Hellenic Republic Treasury Bill 0.000% 30/08/2019 EUR 7 935 413 7 826 671 2.702 000 000 Hellenic Republic Treasury Bill 0.000% 13/03/2020 EUR 2 245 475 2 221 993 0.772 187 000 International Bank for Reconstruction & Development 3.000%
27/09/2023USD 2 178 966 2 253 295 0.78
10 508 000 Montenegro Government International Bond - Reg 3.375%21/04/2025
EUR 12 772 518 12 064 231 4.16
3 200 000 Montenegro Government International Bond - Reg 3.875%18/03/2020
EUR 4 031 413 3 671 378 1.27
7 392 000 Turkey Government International Bond 7.500% 07/11/2019 USD 7 579 745 7 429 019 2.563 500 000 United States Treasury Bill 0.000% 16/04/2019 USD 3 496 469 3 496 547 1.20
100 000 United States Treasury Bill 0.000% 30/04/2019 USD 99 806 99 807 0.03100 000 United States Treasury Bill 0.000% 09/05/2019 USD 99 741 99 750 0.03
7 000 000 United States Treasury Bill 0.000% 23/05/2019 USD 6 975 668 6 976 289 2.40100 000 United States Treasury Bill 0.000% 18/07/2019 USD 99 271 99 292 0.03100 000 United States Treasury Bill 0.000% 25/07/2019 USD 99 217 99 245 0.03100 000 United States Treasury Bill 0.000% 01/08/2019 USD 99 166 99 197 0.03
10 422 276 United States Treasury Inflation Indexed Bonds 0.875%15/01/2029
USD 10 747 950 10 753 518 3.71
2 867 000 United States Treasury Note/Bond 2.625% 15/05/2021 USD 2 866 840 2 887 047 0.99
Total Supranationals, Governments and Local PublicAuthorities, Debt Instruments 173 193 917 153 261 103 52.82
Asset Backed & Mortgage Backed Securities2 360 000 AIG CLO 2018-1 Ltd. 144A FRN 20/01/2032 USD 2 132 862 2 285 587 0.791 381 000 Bank of America Merrill Lynch Commercial Mortgage Trust
2017-BNK9 144A 3.367% 15/11/2054USD 895 667 915 254 0.32
939 000 Citigroup Commercial Mortgage Trust 2015-GC33 144A FRN10/09/2058
USD 729 015 763 088 0.26
618 858 Civic Mortgage LLC 2018-1 144A 4.858% 25/06/2022 USD 618 858 617 279 0.21467 000 COMM 2014-CCRE16 Mortgage Trust 144A 3.220%
10/04/2047USD 307 612 287 705 0.10
763 000 COMM 2014-CCRE21 Mortgage Trust 144A 3.000%10/12/2047
USD 547 019 582 742 0.20
3 155 000 COMM 2015-CCRE27 Mortgage Trust 144A 3.250%10/10/2048
USD 2 233 601 2 361 791 0.81
757 000 COMM 2015-LC21 Mortgage Trust 144A 3.250% 10/07/2048 USD 532 483 554 691 0.191 580 000 Connecticut Avenue Securities Trust 2019-R02 144A FRN
25/08/2031USD 1 580 000 1 590 329 0.55
139Merrill Lynch Investment Solutions
Merrill Lynch Investment Solutions – KLS Fixed IncomeUCITS FundSchedule of Investments as at March 31, 2019 (cont.)(expressed in USD)
The accompanying notes form an integral part of these financial statements.
Audited annual report

Nominalvalue/
Quantity DescriptionQuotation
CurrencyCostUSD
Marketvalue USD
% of netassets
Transferable securities and money market instruments admitted to an official exchange listing or dealt in on another regulated market (cont.)
Asset Backed & Mortgage Backed Securities (cont.)2 000 000 Dryden 62 Euro CLO 2017 BV 144A FRN 15/07/2031 EUR 2 354 900 2 145 001 0.741 580 000 Fannie Mae Connecticut Avenue Securities FRN 25/03/2031 USD 1 558 624 1 566 683 0.542 810 000 Fannie Mae Pool FRN 25/01/2031 USD 2 772 888 2 843 634 0.983 400 138 Fannie Mae REMICS FRN 25/12/2045 USD 698 912 719 201 0.253 000 000 FCT Noria 2018-1 FRN 25/06/2038 EUR 3 506 549 3 394 243 1.17
987 000 GS Mortgage Securities Trust 2013-GCJ14 144A FRN10/08/2046
USD 815 143 841 054 0.29
2 055 000 GS Mortgage Securities Trust 2014-GC20 FRN 10/04/2047 USD 1 714 479 1 768 085 0.61740 000 GS Mortgage Securities Trust 2018-F10 144A FRN
10/07/2051USD 544 230 552 627 0.19
1 473 000 JPMBB Commercial Mortgage Securities Trust 2013-C12 144AFRN 15/07/2045
USD 1 143 195 1 251 879 0.43
1 180 000 JPMBB Commercial Mortgage Securities Trust 2014-C21 144AFRN 15/08/2047
USD 814 027 850 788 0.29
2 010 000 JPMBB Commercial Mortgage Securities Trust 2015-C29 FRN15/05/2048
USD 1 609 421 1 655 805 0.57
2 375 000 JPMBB Commercial Mortgage Securities Trust 2015-C29 144AFRN 15/05/2048
USD 1 672 272 1 672 483 0.58
2 037 000 JPMBB Commercial Mortgage Securities Trust 2015-C31 144AFRN 15/08/2048
USD 1 422 961 1 475 018 0.51
1 750 000 Madison Park Funding XXVIII Ltd. 144A FRN 15/07/2030 USD 1 750 000 1 677 205 0.581 425 000 Morgan Stanley Bank of America Merrill Lynch Trust
2013-C12 144A 3.709% 15/10/2046USD 1 160 563 1 156 925 0.40
1 290 000 Morgan Stanley Bank of America Merrill Lynch Trust2014 C19 144A 3.250% 15/12/2047
USD 877 560 949 833 0.33
392 000 Morgan Stanley Bank of America Merrill Lynch Trust2015-C25 144A FRN 15/10/2048
USD 304 449 322 952 0.11
500 000 Octagon Investment Partners XVI Ltd. 144A FRN 17/07/2030 USD 500 000 466 833 0.162 369 000 SG Commercial Mortgage Securities Trust 2016-C5 144A
2.537% 10/10/2048USD 1 330 736 1 411 090 0.49
2 000 000 Sound Point CLO X Ltd. 144A FRN 20/01/2028 USD 2 000 000 1 953 106 0.671 330 000 STACR Trust 2018-DNA3 144A FRN 25/09/2048 USD 1 302 302 1 313 509 0.455 460 000 STACR Trust 2018-HRP2 M3 FRN 25/02/2047 USD 5 460 000 5 614 699 1.942 120 000 Toorak Mortgage Corp. 2018-1 Ltd. 144A 4.336% 25/08/2021 USD 2 119 998 2 121 106 0.732 252 000 Wells Fargo Commercial Mortgage Trust 2015-C26 144A
3.250% 15/02/2048USD 1 562 404 1 605 069 0.55
2 333 000 Wells Fargo Commercial Mortgage Trust 2015-C28 144A3.000% 15/05/2048
USD 1 488 895 1 549 857 0.53
1 175 000 Wells Fargo Commercial Mortgage Trust 2015-C31 3.852%15/11/2048
USD 974 222 1 016 096 0.35
1 908 500 Wells Fargo Commercial Mortgage Trust 2015-C31 144A FRN15/11/2048
USD 1 358 307 1 430 922 0.49
284 000 Wells Fargo Commercial Mortgage Trust 2015-LC22 144A3.356% 15/09/2058
USD 195 685 204 290 0.07
140 Merrill Lynch Investment Solutions
Merrill Lynch Investment Solutions – KLS Fixed IncomeUCITS FundSchedule of Investments as at March 31, 2019 (cont.)(expressed in USD)
The accompanying notes form an integral part of these financial statements.
Audited annual report
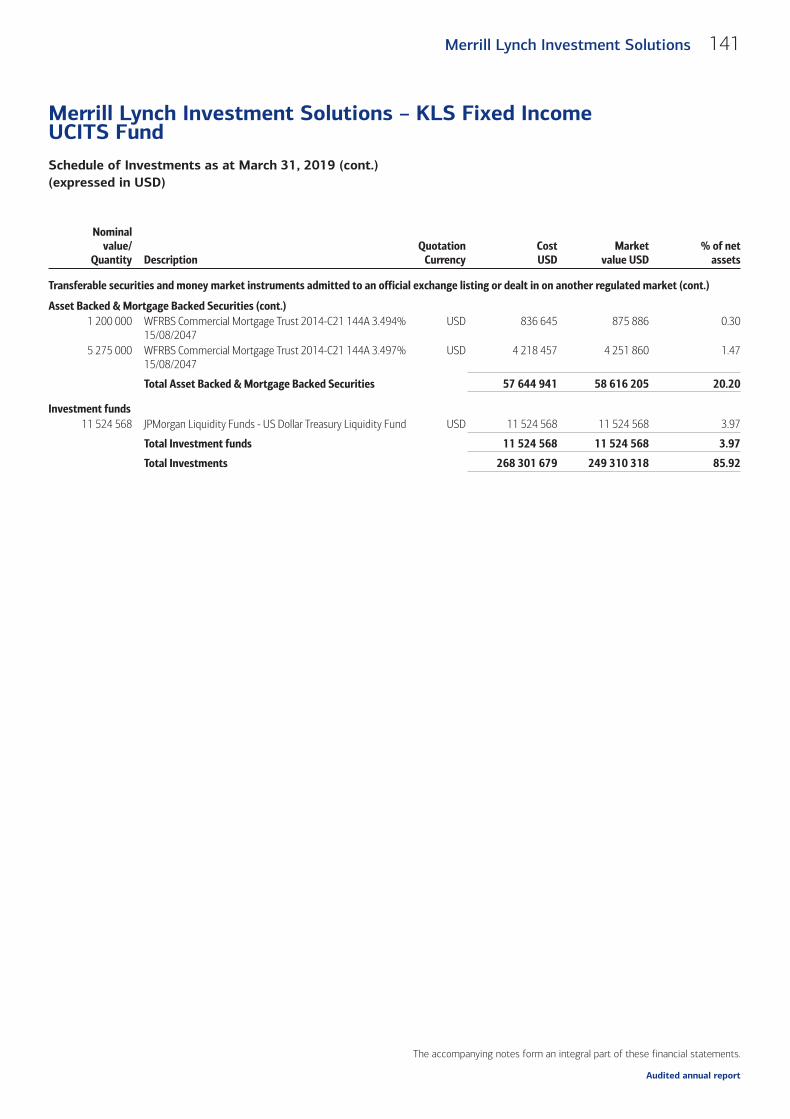
Nominalvalue/
Quantity DescriptionQuotation
CurrencyCostUSD
Marketvalue USD
% of netassets
Transferable securities and money market instruments admitted to an official exchange listing or dealt in on another regulated market (cont.)
Asset Backed & Mortgage Backed Securities (cont.)1 200 000 WFRBS Commercial Mortgage Trust 2014-C21 144A 3.494%
15/08/2047USD 836 645 875 886 0.30
5 275 000 WFRBS Commercial Mortgage Trust 2014-C21 144A 3.497%15/08/2047
USD 4 218 457 4 251 860 1.47
Total Asset Backed & Mortgage Backed Securities 57 644 941 58 616 205 20.20
Investment funds11 524 568 JPMorgan Liquidity Funds - US Dollar Treasury Liquidity Fund USD 11 524 568 11 524 568 3.97
Total Investment funds 11 524 568 11 524 568 3.97
Total Investments 268 301 679 249 310 318 85.92
141Merrill Lynch Investment Solutions
Merrill Lynch Investment Solutions – KLS Fixed IncomeUCITS FundSchedule of Investments as at March 31, 2019 (cont.)(expressed in USD)
The accompanying notes form an integral part of these financial statements.
Audited annual report
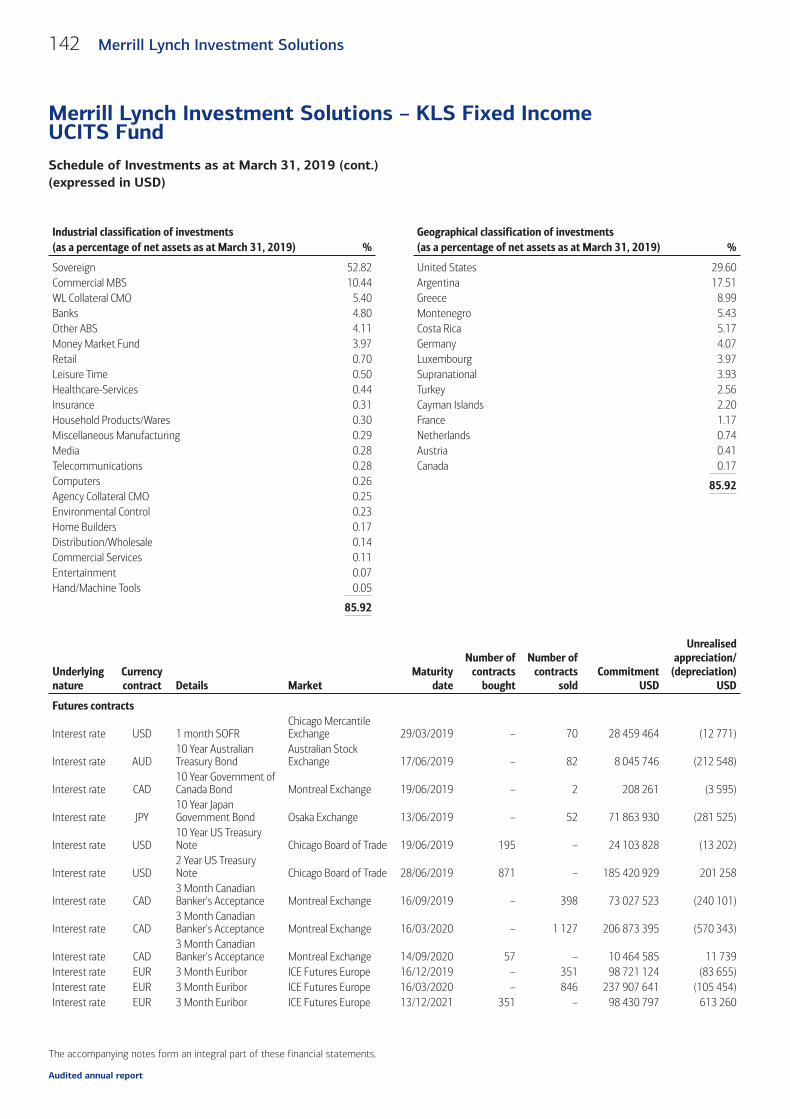
Industrial classification of investments(as a percentage of net assets as at March 31, 2019) %
Sovereign 52.82Commercial MBS 10.44WL Collateral CMO 5.40Banks 4.80Other ABS 4.11Money Market Fund 3.97Retail 0.70Leisure Time 0.50Healthcare-Services 0.44Insurance 0.31Household Products/Wares 0.30Miscellaneous Manufacturing 0.29Media 0.28Telecommunications 0.28Computers 0.26Agency Collateral CMO 0.25Environmental Control 0.23Home Builders 0.17Distribution/Wholesale 0.14Commercial Services 0.11Entertainment 0.07Hand/Machine Tools 0.05
85.92
Geographical classification of investments(as a percentage of net assets as at March 31, 2019) %
United States 29.60Argentina 17.51Greece 8.99Montenegro 5.43Costa Rica 5.17Germany 4.07Luxembourg 3.97Supranational 3.93Turkey 2.56Cayman Islands 2.20France 1.17Netherlands 0.74Austria 0.41Canada 0.17
85.92
Underlyingnature
Currencycontract Details Market
Maturitydate
Number ofcontracts
bought
Number ofcontracts
soldCommitment
USD
Unrealisedappreciation/
(depreciation)USD
Futures contracts
Interest rate USD 1 month SOFRChicago MercantileExchange 29/03/2019 – 70 28 459 464 (12 771)
Interest rate AUD10 Year AustralianTreasury Bond
Australian StockExchange 17/06/2019 – 82 8 045 746 (212 548)
Interest rate CAD10 Year Government ofCanada Bond Montreal Exchange 19/06/2019 – 2 208 261 (3 595)
Interest rate JPY10 Year JapanGovernment Bond Osaka Exchange 13/06/2019 – 52 71 863 930 (281 525)
Interest rate USD10 Year US TreasuryNote Chicago Board of Trade 19/06/2019 195 – 24 103 828 (13 202)
Interest rate USD2 Year US TreasuryNote Chicago Board of Trade 28/06/2019 871 – 185 420 929 201 258
Interest rate CAD3 Month CanadianBanker's Acceptance Montreal Exchange 16/09/2019 – 398 73 027 523 (240 101)
Interest rate CAD3 Month CanadianBanker's Acceptance Montreal Exchange 16/03/2020 – 1 127 206 873 395 (570 343)
Interest rate CAD3 Month CanadianBanker's Acceptance Montreal Exchange 14/09/2020 57 – 10 464 585 11 739
Interest rate EUR 3 Month Euribor ICE Futures Europe 16/12/2019 – 351 98 721 124 (83 655)Interest rate EUR 3 Month Euribor ICE Futures Europe 16/03/2020 – 846 237 907 641 (105 454)Interest rate EUR 3 Month Euribor ICE Futures Europe 13/12/2021 351 – 98 430 797 613 260
142 Merrill Lynch Investment Solutions
Merrill Lynch Investment Solutions – KLS Fixed IncomeUCITS FundSchedule of Investments as at March 31, 2019 (cont.)(expressed in USD)
The accompanying notes form an integral part of these financial statements.
Audited annual report
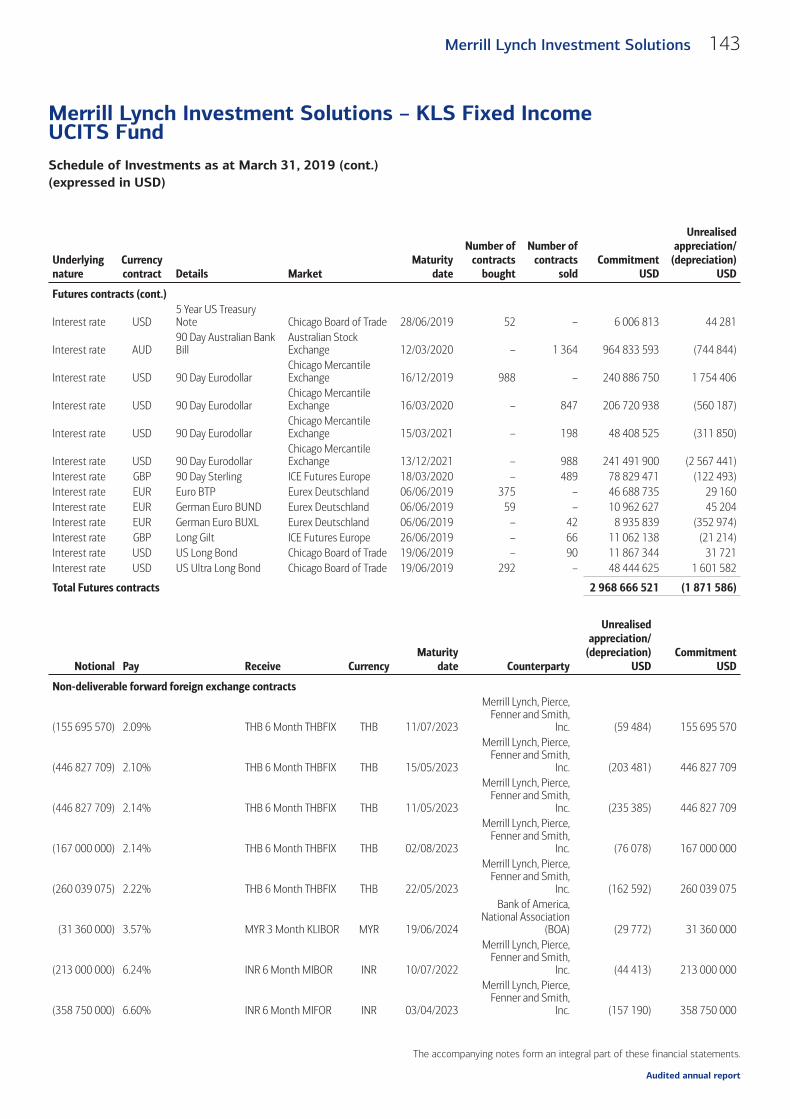
Underlyingnature
Currencycontract Details Market
Maturitydate
Number ofcontracts
bought
Number ofcontracts
soldCommitment
USD
Unrealisedappreciation/
(depreciation)USD
Futures contracts (cont.)
Interest rate USD5 Year US TreasuryNote Chicago Board of Trade 28/06/2019 52 – 6 006 813 44 281
Interest rate AUD90 Day Australian BankBill
Australian StockExchange 12/03/2020 – 1 364 964 833 593 (744 844)
Interest rate USD 90 Day EurodollarChicago MercantileExchange 16/12/2019 988 – 240 886 750 1 754 406
Interest rate USD 90 Day EurodollarChicago MercantileExchange 16/03/2020 – 847 206 720 938 (560 187)
Interest rate USD 90 Day EurodollarChicago MercantileExchange 15/03/2021 – 198 48 408 525 (311 850)
Interest rate USD 90 Day EurodollarChicago MercantileExchange 13/12/2021 – 988 241 491 900 (2 567 441)
Interest rate GBP 90 Day Sterling ICE Futures Europe 18/03/2020 – 489 78 829 471 (122 493)Interest rate EUR Euro BTP Eurex Deutschland 06/06/2019 375 – 46 688 735 29 160Interest rate EUR German Euro BUND Eurex Deutschland 06/06/2019 59 – 10 962 627 45 204Interest rate EUR German Euro BUXL Eurex Deutschland 06/06/2019 – 42 8 935 839 (352 974)Interest rate GBP Long Gilt ICE Futures Europe 26/06/2019 – 66 11 062 138 (21 214)Interest rate USD US Long Bond Chicago Board of Trade 19/06/2019 – 90 11 867 344 31 721Interest rate USD US Ultra Long Bond Chicago Board of Trade 19/06/2019 292 – 48 444 625 1 601 582
Total Futures contracts 2 968 666 521 (1 871 586)
Notional Pay Receive CurrencyMaturity
date Counterparty
Unrealisedappreciation/
(depreciation)USD
CommitmentUSD
Non-deliverable forward foreign exchange contracts
(155 695 570) 2.09% THB 6 Month THBFIX THB 11/07/2023
Merrill Lynch, Pierce,Fenner and Smith,
Inc. (59 484) 155 695 570
(446 827 709) 2.10% THB 6 Month THBFIX THB 15/05/2023
Merrill Lynch, Pierce,Fenner and Smith,
Inc. (203 481) 446 827 709
(446 827 709) 2.14% THB 6 Month THBFIX THB 11/05/2023
Merrill Lynch, Pierce,Fenner and Smith,
Inc. (235 385) 446 827 709
(167 000 000) 2.14% THB 6 Month THBFIX THB 02/08/2023
Merrill Lynch, Pierce,Fenner and Smith,
Inc. (76 078) 167 000 000
(260 039 075) 2.22% THB 6 Month THBFIX THB 22/05/2023
Merrill Lynch, Pierce,Fenner and Smith,
Inc. (162 592) 260 039 075
(31 360 000) 3.57% MYR 3 Month KLIBOR MYR 19/06/2024
Bank of America,National Association
(BOA) (29 772) 31 360 000
(213 000 000) 6.24% INR 6 Month MIBOR INR 10/07/2022
Merrill Lynch, Pierce,Fenner and Smith,
Inc. (44 413) 213 000 000
(358 750 000) 6.60% INR 6 Month MIFOR INR 03/04/2023
Merrill Lynch, Pierce,Fenner and Smith,
Inc. (157 190) 358 750 000
143Merrill Lynch Investment Solutions
Merrill Lynch Investment Solutions – KLS Fixed IncomeUCITS FundSchedule of Investments as at March 31, 2019 (cont.)(expressed in USD)
The accompanying notes form an integral part of these financial statements.
Audited annual report

Notional Pay Receive CurrencyMaturity
date Counterparty
Unrealisedappreciation/
(depreciation)USD
CommitmentUSD
Non-deliverable forward foreign exchange contracts (cont.)
(13 381 395) 7.08%
Brazil Cetip DIInterbank DepositRate Index BRL 04/01/2021
Bank of America,National Association
(BOA) 1 346 13 381 395
(367 416 000) 7.49% INR 6 Month MIFOR INR 03/10/2023
Merrill Lynch, Pierce,Fenner and Smith,
Inc. (383 618) 367 416 000(494 070 000) 7.54% INR 6 Month MIFOR INR 10/10/2023 Barclays Bank Plc. (532 790) 494 070 000
(3 914 085) 8.54%
Brazil Cetip DIInterbank DepositRate Index BRL 02/01/2025
Bank of America,National Association
(BOA) 336 3 914 085
17 082 660Brazil Cetip DI InterbankDeposit Rate Index 7.60% BRL 03/01/2022
Bank of America,National Association
(BOA) (18 984) 17 082 660
17 012 114Brazil Cetip DI InterbankDeposit Rate Index 7.75% BRL 03/01/2022
Bank of America,National Association
(BOA) 5 980 17 012 114
51 775 787Brazil Cetip DI InterbankDeposit Rate Index 7.89% BRL 03/01/2022 Barclays Bank Plc. 69 222 51 775 787
13 008 348Brazil Cetip DI InterbankDeposit Rate Index 8.09% BRL 02/01/2023
Bank of America,National Association
(BOA) (2 340) 13 008 348
3 709 581China 7-Days ReverseRepo Rate 3.77% CNY 28/12/2021
Merrill Lynch, Pierce,Fenner and Smith,
Inc. 14 827 3 709 581
81 305 000China 7-Days ReverseRepo Rate 2.65% CNY 14/03/2022
Bank of America,National Association
(BOA) (35 171) 81 305 000
54 591 000China 7-Days ReverseRepo Rate 2.67% CNY 14/03/2022 Morgan Stanley (18 961) 54 591 000
81 305 000China 7-Days ReverseRepo Rate 2.74% CNY 15/03/2022 Barclays Bank Plc. (5 228) 81 305 000
54 591 000China 7-Days ReverseRepo Rate 2.77% CNY 18/03/2022
Bank of America,National Association
(BOA) 1 101 54 591 000
3 800 000China 7-Days ReverseRepo Rate 3.98% CNY 24/03/2022
Merrill Lynch, Pierce,Fenner and Smith,
Inc. 19 679 3 800 000
81 305 000China 7-Days ReverseRepo Rate 2.71% CNY 25/03/2022 Morgan Stanley (17 620) 81 305 000
81 305 000China 7-Days ReverseRepo Rate 2.70% CNY 28/03/2022
Bank of America,National Association
(BOA) (24 019) 81 305 000
7 114 350China 7-Days ReverseRepo Rate 3.72% CNY 22/06/2022
Merrill Lynch, Pierce,Fenner and Smith,
Inc. 30 595 7 114 350
26 000 000China 7-Days ReverseRepo Rate 3.75% CNY 11/07/2022
Merrill Lynch, Pierce,Fenner and Smith,
Inc. 127 399 26 000 000
12 380 000China 7-Days ReverseRepo Rate 3.85% CNY 08/09/2022
Merrill Lynch, Pierce,Fenner and Smith,
Inc. 64 696 12 380 000
8 666 000China 7-Days ReverseRepo Rate 3.77% CNY 19/09/2022
Merrill Lynch, Pierce,Fenner and Smith,
Inc. 41 018 8 666 000
144 Merrill Lynch Investment Solutions
Merrill Lynch Investment Solutions – KLS Fixed IncomeUCITS FundSchedule of Investments as at March 31, 2019 (cont.)(expressed in USD)
The accompanying notes form an integral part of these financial statements.
Audited annual report
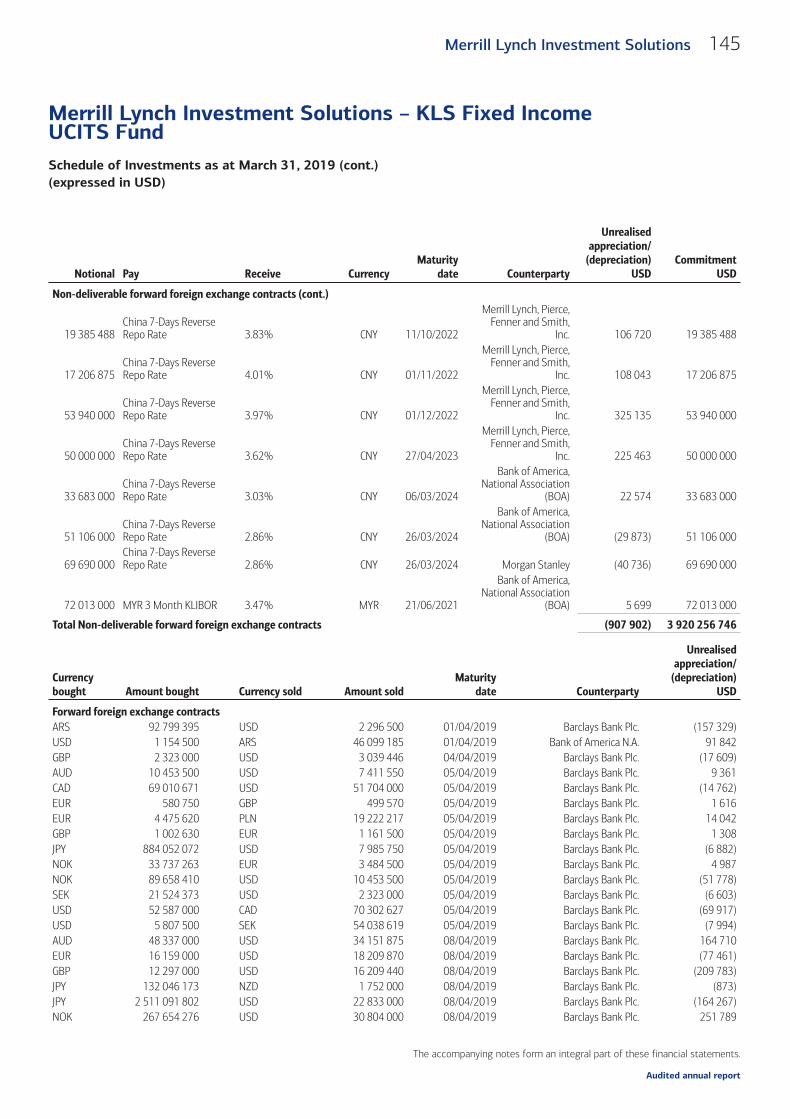
Notional Pay Receive CurrencyMaturity
date Counterparty
Unrealisedappreciation/
(depreciation)USD
CommitmentUSD
Non-deliverable forward foreign exchange contracts (cont.)
19 385 488China 7-Days ReverseRepo Rate 3.83% CNY 11/10/2022
Merrill Lynch, Pierce,Fenner and Smith,
Inc. 106 720 19 385 488
17 206 875China 7-Days ReverseRepo Rate 4.01% CNY 01/11/2022
Merrill Lynch, Pierce,Fenner and Smith,
Inc. 108 043 17 206 875
53 940 000China 7-Days ReverseRepo Rate 3.97% CNY 01/12/2022
Merrill Lynch, Pierce,Fenner and Smith,
Inc. 325 135 53 940 000
50 000 000China 7-Days ReverseRepo Rate 3.62% CNY 27/04/2023
Merrill Lynch, Pierce,Fenner and Smith,
Inc. 225 463 50 000 000
33 683 000China 7-Days ReverseRepo Rate 3.03% CNY 06/03/2024
Bank of America,National Association
(BOA) 22 574 33 683 000
51 106 000China 7-Days ReverseRepo Rate 2.86% CNY 26/03/2024
Bank of America,National Association
(BOA) (29 873) 51 106 000
69 690 000China 7-Days ReverseRepo Rate 2.86% CNY 26/03/2024 Morgan Stanley (40 736) 69 690 000
72 013 000 MYR 3 Month KLIBOR 3.47% MYR 21/06/2021
Bank of America,National Association
(BOA) 5 699 72 013 000
Total Non-deliverable forward foreign exchange contracts (907 902) 3 920 256 746
Currencybought Amount bought Currency sold Amount sold
Maturitydate Counterparty
Unrealisedappreciation/
(depreciation)USD
Forward foreign exchange contractsARS 92 799 395 USD 2 296 500 01/04/2019 Barclays Bank Plc. (157 329)USD 1 154 500 ARS 46 099 185 01/04/2019 Bank of America N.A. 91 842GBP 2 323 000 USD 3 039 446 04/04/2019 Barclays Bank Plc. (17 609)AUD 10 453 500 USD 7 411 550 05/04/2019 Barclays Bank Plc. 9 361CAD 69 010 671 USD 51 704 000 05/04/2019 Barclays Bank Plc. (14 762)EUR 580 750 GBP 499 570 05/04/2019 Barclays Bank Plc. 1 616EUR 4 475 620 PLN 19 222 217 05/04/2019 Barclays Bank Plc. 14 042GBP 1 002 630 EUR 1 161 500 05/04/2019 Barclays Bank Plc. 1 308JPY 884 052 072 USD 7 985 750 05/04/2019 Barclays Bank Plc. (6 882)NOK 33 737 263 EUR 3 484 500 05/04/2019 Barclays Bank Plc. 4 987NOK 89 658 410 USD 10 453 500 05/04/2019 Barclays Bank Plc. (51 778)SEK 21 524 373 USD 2 323 000 05/04/2019 Barclays Bank Plc. (6 603)USD 52 587 000 CAD 70 302 627 05/04/2019 Barclays Bank Plc. (69 917)USD 5 807 500 SEK 54 038 619 05/04/2019 Barclays Bank Plc. (7 994)AUD 48 337 000 USD 34 151 875 08/04/2019 Barclays Bank Plc. 164 710EUR 16 159 000 USD 18 209 870 08/04/2019 Barclays Bank Plc. (77 461)GBP 12 297 000 USD 16 209 440 08/04/2019 Barclays Bank Plc. (209 783)JPY 132 046 173 NZD 1 752 000 08/04/2019 Barclays Bank Plc. (873)JPY 2 511 091 802 USD 22 833 000 08/04/2019 Barclays Bank Plc. (164 267)NOK 267 654 276 USD 30 804 000 08/04/2019 Barclays Bank Plc. 251 789
145Merrill Lynch Investment Solutions
Merrill Lynch Investment Solutions – KLS Fixed IncomeUCITS FundSchedule of Investments as at March 31, 2019 (cont.)(expressed in USD)
The accompanying notes form an integral part of these financial statements.
Audited annual report

Currencybought Amount bought Currency sold Amount sold
Maturitydate Counterparty
Unrealisedappreciation/
(depreciation)USD
Forward foreign exchange contracts (cont.)NZD 31 912 000 USD 21 707 928 08/04/2019 Barclays Bank Plc. 20 499SEK 180 709 189 USD 19 522 000 08/04/2019 Barclays Bank Plc. (70 218)USD 27 496 658 AUD 38 815 000 08/04/2019 Barclays Bank Plc. (59 839)USD 22 073 317 EUR 19 615 000 08/04/2019 Barclays Bank Plc. 62 846USD 12 595 072 GBP 9 525 000 08/04/2019 Barclays Bank Plc. 202 074USD 38 501 000 JPY 4 246 518 363 08/04/2019 Barclays Bank Plc. 165 805USD 15 084 000 NOK 129 439 064 08/04/2019 Barclays Bank Plc. 65 251USD 15 342 273 NZD 22 422 000 08/04/2019 Barclays Bank Plc. 75 449USD 19 541 000 SEK 181 671 440 08/04/2019 Barclays Bank Plc. (14 358)KRW 3 896 526 840 USD 3 426 000 12/04/2019 Barclays Bank Plc. 1 184USD 9 120 500 KRW 10 339 422 015 12/04/2019 Barclays Bank Plc. 26 478EUR 11 091 150 USD 12 814 294 17/04/2019 Barclays Bank Plc. (359 181)JPY 2 875 086 334 USD 26 404 325 17/04/2019 Barclays Bank Plc. (428 093)THB 657 052 311 USD 20 778 500 17/04/2019 Barclays Bank Plc. (66 304)USD 2 493 962 EUR 2 183 550 17/04/2019 Barclays Bank Plc. 41 883USD 8 087 825 JPY 887 679 892 17/04/2019 Barclays Bank Plc. 67 691USD 55 038 500 THB 1 741 480 612 17/04/2019 Barclays Bank Plc. 141 979EUR 3 172 480 USD 3 744 453 18/04/2019 Barclays Bank Plc. (181 528)USD 3 744 453 EUR 3 172 480 18/04/2019 Barclays Bank Plc. 181 528
USD 17 365 297 EUR 13 750 365 18/04/2019State Street Bank and
Trust Co. 1 922 643KRW 2 640 786 400 USD 2 323 000 22/04/2019 Barclays Bank Plc. (7)USD 10 356 000 KRW 11 672 804 990 22/04/2019 Barclays Bank Plc. 87 907JPY 1 042 698 628 EUR 8 349 725 26/04/2019 Barclays Bank Plc. 45 027USD 2 894 189 EUR 2 551 695 26/04/2019 Barclays Bank Plc. 26 516
USD 5 746 929 EUR 5 000 000 26/04/2019State Street Bank and
Trust Co. 127 775
EUR 43 681 083 USD 49 426 615 30/04/2019State Street Bank and
Trust Co. (319 889)
USD 22 513 901 EUR 19 716 174 30/04/2019State Street Bank and
Trust Co. 348 774USD 8 072 000 KRW 9 176 179 325 02/05/2019 Barclays Bank Plc. (932)BRL 78 707 397 USD 21 239 037 06/05/2019 Barclays Bank Plc. (1 146 781)PHP 852 335 632 USD 16 076 506 06/05/2019 Barclays Bank Plc. 48 654TRY 50 924 791 USD 9 262 000 06/05/2019 Barclays Bank Plc. (503 336)USD 2 770 800 BRL 10 483 668 06/05/2019 Barclays Bank Plc. 94 551USD 19 433 303 PHP 1 022 475 464 06/05/2019 Barclays Bank Plc. 89 303USD 9 301 896 TRY 50 924 791 06/05/2019 Barclays Bank Plc. 543 232MYR 19 653 864 USD 4 823 037 07/05/2019 Barclays Bank Plc. (9 490)USD 4 823 037 MYR 19 549 798 07/05/2019 Barclays Bank Plc. 34 977USD 2 250 000 ZAR 31 942 125 07/05/2019 Barclays Bank Plc. 47 374ZAR 32 155 875 USD 2 250 000 07/05/2019 Barclays Bank Plc. (32 634)USD 5 012 646 ZAR 72 210 629 09/05/2019 Barclays Bank Plc. 34 417ZAR 71 978 035 USD 5 012 646 09/05/2019 Barclays Bank Plc. (50 453)ARS 155 837 675 USD 3 465 000 15/05/2019 Bank of America N.A. (65 357)EUR 41 034 700 RON 196 902 384 20/05/2019 Barclays Bank Plc. 20 701RON 34 116 572 EUR 7 103 000 20/05/2019 Barclays Bank Plc. 4 223ARS 247 190 085 USD 5 698 250 21/05/2019 Bank of America N.A. (347 075)
146 Merrill Lynch Investment Solutions
Merrill Lynch Investment Solutions – KLS Fixed IncomeUCITS FundSchedule of Investments as at March 31, 2019 (cont.)(expressed in USD)
The accompanying notes form an integral part of these financial statements.
Audited annual report

Currencybought Amount bought Currency sold Amount sold
Maturitydate Counterparty
Unrealisedappreciation/
(depreciation)USD
Forward foreign exchange contracts (cont.)MYR 127 855 171 USD 31 413 780 28/05/2019 Barclays Bank Plc. (84 887)PHP 189 442 041 USD 3 603 615 28/05/2019 Barclays Bank Plc. (26 115)USD 3 570 664 PHP 186 760 010 28/05/2019 Barclays Bank Plc. 43 813IDR 81 044 501 832 USD 5 725 908 31/05/2019 Barclays Bank Plc. (93 980)USD 5 725 908 IDR 81 937 743 480 31/05/2019 Barclays Bank Plc. 31 907CLP 23 334 133 823 USD 35 292 182 06/06/2019 Barclays Bank Plc. (1 009 735)USD 5 110 600 CLP 3 458 180 410 06/06/2019 Barclays Bank Plc. 29 851CNH 39 007 235 USD 5 807 500 10/06/2019 Barclays Bank Plc. (5 587)USD 23 230 000 CNH 156 058 676 10/06/2019 Barclays Bank Plc. 17 923MXN 67 720 096 USD 3 484 500 11/06/2019 Barclays Bank Plc. (35 658)USD 10 453 500 MXN 207 740 779 11/06/2019 Barclays Bank Plc. (126 301)USD 30 455 071 CNH 205 106 041 13/06/2019 Barclays Bank Plc. (51 860)
USD 9 464 970 EUR 7 887 085 14/06/2019State Street Bank and
Trust Co. 564 754BRL 3 089 144 USD 789 820 17/06/2019 Barclays Bank Plc. (3 785)IDR 16 321 464 000 USD 1 142 000 26/06/2019 Barclays Bank Plc. (11 420)USD 1 142 000 IDR 16 403 688 000 26/06/2019 Barclays Bank Plc. 5 724THB 110 179 890 USD 3 484 500 27/06/2019 Barclays Bank Plc. (4 876)USD 3 484 500 THB 109 883 707 27/06/2019 Barclays Bank Plc. 14 230IDR 21 586 524 000 USD 1 449 600 28/06/2019 Barclays Bank Plc. 45 338USD 1 449 600 IDR 20 835 100 800 28/06/2019 Barclays Bank Plc. 6 701PHP 316 410 433 USD 5 920 730 08/07/2019 Barclays Bank Plc. 35 768USD 17 286 000 PHP 916 807 995 08/07/2019 Barclays Bank Plc. 26 882BRL 6 128 000 USD 1 600 000 16/07/2019 Barclays Bank Plc. (44 728)USD 1 600 000 BRL 6 212 800 16/07/2019 Barclays Bank Plc. 23 206CNH 43 819 847 USD 6 526 216 01/08/2019 Barclays Bank Plc. (10 533)EUR 5 613 252 USD 6 526 214 01/08/2019 Barclays Bank Plc. (166 635)USD 6 526 216 CNH 43 819 847 01/08/2019 Barclays Bank Plc. 10 533USD 6 526 214 EUR 5 613 252 01/08/2019 Barclays Bank Plc. 166 635
USD 1 391 993 EUR 1 195 465 02/08/2019State Street Bank and
Trust Co. 37 471CNH 31 224 837 USD 4 646 000 12/08/2019 Barclays Bank Plc. (3 465)USD 4 646 000 CNH 31 064 550 12/08/2019 Barclays Bank Plc. 27 296
USD 8 056 430 EUR 6 974 660 30/08/2019State Street Bank and
Trust Co. 135 750KRW 5 489 091 435 USD 4 906 625 05/09/2019 Barclays Bank Plc. (58 489)
USD 7 815 066 CHF 7 660 850 20/09/2019State Street Bank and
Trust Co. (512)
USD 44 546 755 EUR 39 096 335 20/09/2019State Street Bank and
Trust Co. 71 378
USD 2 310 104 EUR 1 981 000 13/03/2020State Street Bank and
Trust Co. 24 698
Total forward foreign exchange contracts 208 955
Short/Long Currency Description
Put/Call
StrikePrice
Maturitydate Quantity
Marketvalue USD
CommitmentUSD
OptionsShort USD 10 Year US Treasury Note Call 122.5000 26/04/2019 (232 000) (409 625) 28 420 000*
147Merrill Lynch Investment Solutions
Merrill Lynch Investment Solutions – KLS Fixed IncomeUCITS FundSchedule of Investments as at March 31, 2019 (cont.)(expressed in USD)
The accompanying notes form an integral part of these financial statements.
Audited annual report

Short/Long Currency Description
Put/Call
StrikePrice
Maturitydate Quantity
Marketvalue USD
CommitmentUSD
Options (cont.)Long USD 10 Year US Treasury Note Call 124.7000 26/04/2019 232 000 76 125 -Long USD 10 Year US Treasury Note Put 123.5000 26/04/2019 232 000 50 750 -Long USD 10 Year US Treasury Note Put 124.0000 26/04/2019 232 000 97 875 -Short USD 10 Year US Treasury Note Put 123.0000 24/05/2019 (464 000) (123 250) 57 072 000Short USD 10 Year US Treasury Note Put 122.5000 24/05/2019 (464 000) (79 750) 56 840 000Short USD 2 Year US Treasury Note Call 107.0000 24/05/2019 (764 000) (53 719) 81 748 000*Long USD 2 Year US Treasury Note Put 106.3000 24/05/2019 764 000 77 594 -Long CAD 3 Month Canadian Banker's Call 98.0000 17/06/2019 545 000 10 204 -Long CAD 3 Month Canadian Banker's
AcceptanceCall 97.8700 16/09/2019 575 000 79 667 -
Long EUR 3 Month Euribor Put 99.6250 10/05/2019 115 500 000 (42 100) -Short EUR 3 Month Euribor Put 99.5000 10/05/2019 (115 500 000) 19 431 12 889 135 879Long EUR 3 Month Euribor Put 99.3750 14/06/2019 117 000 000 (52 489) -Short EUR 3 Month Euribor Put 99.2500 14/06/2019 (117 000 000) 29 525 13 023 721 909Short USD 5 Year US Treasury Note Put 115.0000 24/05/2019 (465 000) (69 024) 53 475 000Long USD 5 Year US Treasury Note Put 116.5000 24/05/2019 1 394 000 348 500 -Short USD 90 Day Eurodollar Futures Call 97.5000 12/04/2019 (1 145 000) (320 600) 111 637 500*Long USD 90 Day Eurodollar Futures Call 97.6250 12/04/2019 572 500 95 894 -Long USD 90 Day Eurodollar Futures Call 97.3750 12/04/2019 572 500 230 431 -Short USD 90 Day Eurodollar Futures Call 98.0000 14/06/2019 (1 290 000) (90 300) 126 420 000*Long USD 90 Day Eurodollar Futures Call 98.1250 14/06/2019 1 162 500 58 125 -Long USD 90 Day Eurodollar Futures Call 97.8750 13/09/2019 5 807 500 1 219 575 -Short USD 90 Day Eurodollar Futures Call 98.5000 13/12/2019 (2 902 500) (210 431) 285 896 250*Short USD 90 Day Eurodollar Futures Call 97.2500 13/12/2019 (285 000) (121 838) 27 716 250*Short USD 90 Day Eurodollar Futures Put 97.0000 14/06/2019 (1 667 500) (4 169) 161 747 500Long USD 90 Day Eurodollar Futures Put 97.1250 14/06/2019 255 000 638 -Long USD 90 Day Eurodollar Futures Put 97.2500 14/06/2019 2 245 000 5 613 -Short USD 90 Day Eurodollar Futures Put 97.3750 12/07/2019 (1 162 500) (11 625) 113 198 438Long USD 90 Day Eurodollar Futures Put 97.6250 12/07/2019 1 162 500 66 844 -Short USD 90 Day Eurodollar Futures Put 97.0000 13/09/2019 (2 297 500) (11 488) 222 857 500Long USD 90 Day Eurodollar Futures Put 97.2500 13/09/2019 2 297 500 28 719 -Short USD 90 Day Eurodollar Futures Put 97.5000 13/12/2019 (11 615 000) (929 200) 1 132 462 500Short USD 90 Day Eurodollar Futures Put 97.2500 13/12/2019 (285 000) (16 388) 27 716 250Short AUD AUD/CAD Call 0.9830 11/12/2019 (4 428 000) (28 304) 3 089 782*Short AUD AUD/CAD Put 0.9435 11/12/2019 (4 428 000) (62 322) 2 965 625Long AUD AUD/USD Call 0.7400 02/04/2019 11 640 000 167 -Long AUD AUD/USD Call 0.7460 11/12/2019 6 642 000 55 675 -Long AUD AUD/USD Put 0.7300 03/05/2019 12 699 500 13 234 -Long EUR EUR/CNH Call 8.0000 30/07/2019 4 618 000 8 812 -Long EUR EUR/CNH Call 8.0000 30/07/2019 5 807 500 11 082 -Long EUR EUR/CNH Call 8.0000 30/07/2019 5 807 500 11 082 -Long EUR EUR/CNH Call 8.0000 30/07/2019 6 927 000 13 218 -Long EUR EUR/CNH Call 8.0000 30/07/2019 9 292 000 17 731 -Long EUR EUR/CNH Call 8.0000 30/07/2019 22 840 000 43 583 -Short EUR EUR/GBP Call 0.9300 13/06/2019 (6 561 000) (20 995) 6 843 397*Short EUR EUR/JPY Call 131.5000 11/12/2019 (7 749 000) (64 303) 1 142 852 416*Short EUR EUR/JPY Call 131.5000 17/12/2019 (7 749 000) (64 440) 1 142 852 416*Short EUR EUR/JPY Put 124.3000 11/12/2019 (7 749 000) (237 050) 1 080 277 988Short EUR EUR/JPY Put 124.0000 17/12/2019 (7 749 000) (228 043) 1 077 670 720Short EUR EUR/NOK Call 10.0000 08/04/2019 (6 852 000) (1 336) 76 848 623*
148 Merrill Lynch Investment Solutions
Merrill Lynch Investment Solutions – KLS Fixed IncomeUCITS FundSchedule of Investments as at March 31, 2019 (cont.)(expressed in USD)
The accompanying notes form an integral part of these financial statements.
Audited annual report

Short/Long Currency Description
Put/Call
StrikePrice
Maturitydate Quantity
Marketvalue USD
CommitmentUSD
Options (cont.)Short EUR EUR/NOK Call 9.9000 15/05/2019 (6 927 000) (19 319) 76 912 888*Short EUR EUR/SEK Call 10.6000 30/07/2019 (9 136 000) (91 839) 108 612 721*Long EUR EUR/USD Call 1.1250 04/04/2019 18 982 500 81 061 -Long EUR EUR/USD Call 1.1680 11/06/2019 11 070 000 15 087 -Long EUR EUR/USD Call 1.1800 09/07/2019 17 130 000 27 156 -Long EUR EUR/USD Call 1.1750 02/08/2019 12 695 000 44 158 -Long EUR EUR/USD Call 1.1800 03/10/2019 11 420 000 70 606 -Long EUR EUR/USD Call 1.2250 30/03/2020 17 422 500 141 530 -Long EUR EUR/USD Put 1.1700 21/06/2019 11 070 000 18 750 -Long EUR Euro-Bund Futures OGBL Put 162.0000 26/04/2019 11 600 000 (100 177) -Short EUR Euro-Bund Futures OGBL Put 159.0000 26/04/2019 (11 600 000) 16 913 2 068 587 284Short EUR Euro-Bund Futures OGBL Put 160.5000 26/04/2019 (11 600 000) 44 234 2 088 102 259Short KRW Fund purchases an option to
enter into an Interest RateSwap. Pay: 1.70% Receive KRWSouth Korea Three MonthInterbank Rate
Call 1.7000 16/03/2020 (34 845 000 000) (538 263) 245 581 887*
Short KRW Fund purchases an option toenter into an Interest RateSwap. Pay: 2.00% Receive KRWSouth Korea Three MonthInterbank Rate
Put 2.0000 16/03/2020 (34 845 000 000) (113 029) 76 744 340
Long KRW Fund purchases an option toenter into an Interest RateSwap. Pay: 7.20% Receive KRWSouth Korea Three MonthInterbank Rate
Call 7.2000 16/03/2020 232 300 000 000 897 622 -
Long ZAR Fund purchases an option toenter into an Interest RateSwap. Pay: 7.20% Receive ZARJohannesburg InterbankAverage Rate
Call 7.2000 09/05/2019 520 000 000 662 583 -
Long ZAR Fund purchases an option toenter into an Interest RateSwap. Pay: 7.20% Receive ZARJohannesburg InterbankAverage Rate
Call 7.2000 11/11/2019 245 000 000 96 158 -
Short GBP GBP/USD Put 1.3000 25/04/2019 (5 807 500) (101 994) 9 819 957Long USD IMM Eurodollar Put 97.2500 16/12/2019 342 500 7 706 -Long USD IMM Eurodollar Put 97.2500 16/12/2019 342 500 116 450 -Short NZD NZD/CAD Call 0.9400 12/12/2019 (3 321 000) (27 713) 2 125 281*Short NZD NZD/CAD Put 0.8900 12/12/2019 (3 321 000) (36 912) 2 012 234Short NZD NZD/JPY Put 68.0000 18/12/2019 (6 852 000) (57 497) 317 209 264Long NZD NZD/USD Call 0.7135 11/12/2019 6 642 000 54 509 -Short SEK SEK/JPY Put 11.5000 08/08/2019 (46 180 000) (61 786) 57 139 629Short SEK SEK/JPY Put 11.5000 08/08/2019 (46 180 000) (61 786) 57 139 629Long USD US Bond Call 141.0000 24/05/2019 25 000 1 563 -Short USD US Bond Put 143.0000 24/05/2019 (25 000) (2 734) 3 575 000Long USD USD/CAD Call 1.3400 05/04/2019 11 615 000 19 771 -Long USD USD/CHF Put 0.9500 20/12/2019 11 070 000 141 404 -Short USD USD/CLP Call 670.0000 11/06/2019 (4 618 000) (115 610) 3 094 060 000*Long USD USD/CNH Call 6.8500 08/08/2019 2 309 000 13 146 -Long USD USD/CNH Call 6.8500 08/08/2019 5 772 500 32 866 -
149Merrill Lynch Investment Solutions
Merrill Lynch Investment Solutions – KLS Fixed IncomeUCITS FundSchedule of Investments as at March 31, 2019 (cont.)(expressed in USD)
The accompanying notes form an integral part of these financial statements.
Audited annual report
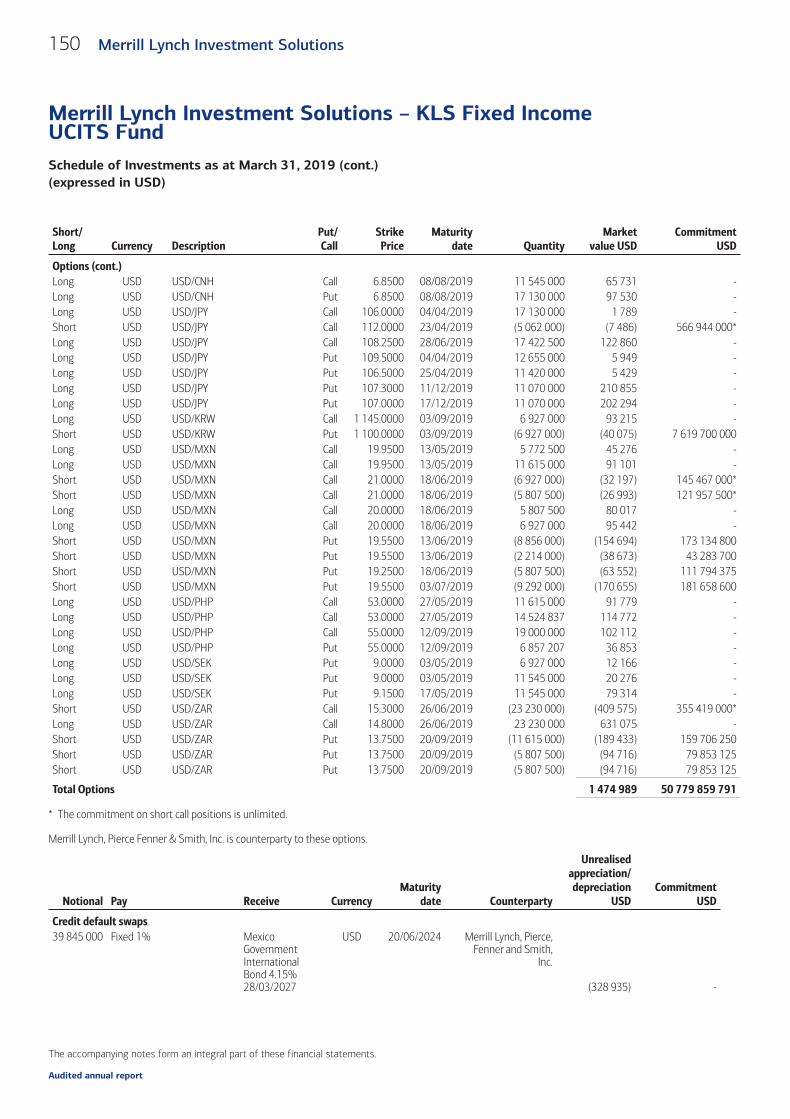
Short/Long Currency Description
Put/Call
StrikePrice
Maturitydate Quantity
Marketvalue USD
CommitmentUSD
Options (cont.)Long USD USD/CNH Call 6.8500 08/08/2019 11 545 000 65 731 -Long USD USD/CNH Put 6.8500 08/08/2019 17 130 000 97 530 -Long USD USD/JPY Call 106.0000 04/04/2019 17 130 000 1 789 -Short USD USD/JPY Call 112.0000 23/04/2019 (5 062 000) (7 486) 566 944 000*Long USD USD/JPY Call 108.2500 28/06/2019 17 422 500 122 860 -Long USD USD/JPY Put 109.5000 04/04/2019 12 655 000 5 949 -Long USD USD/JPY Put 106.5000 25/04/2019 11 420 000 5 429 -Long USD USD/JPY Put 107.3000 11/12/2019 11 070 000 210 855 -Long USD USD/JPY Put 107.0000 17/12/2019 11 070 000 202 294 -Long USD USD/KRW Call 1 145.0000 03/09/2019 6 927 000 93 215 -Short USD USD/KRW Put 1 100.0000 03/09/2019 (6 927 000) (40 075) 7 619 700 000Long USD USD/MXN Call 19.9500 13/05/2019 5 772 500 45 276 -Long USD USD/MXN Call 19.9500 13/05/2019 11 615 000 91 101 -Short USD USD/MXN Call 21.0000 18/06/2019 (6 927 000) (32 197) 145 467 000*Short USD USD/MXN Call 21.0000 18/06/2019 (5 807 500) (26 993) 121 957 500*Long USD USD/MXN Call 20.0000 18/06/2019 5 807 500 80 017 -Long USD USD/MXN Call 20.0000 18/06/2019 6 927 000 95 442 -Short USD USD/MXN Put 19.5500 13/06/2019 (8 856 000) (154 694) 173 134 800Short USD USD/MXN Put 19.5500 13/06/2019 (2 214 000) (38 673) 43 283 700Short USD USD/MXN Put 19.2500 18/06/2019 (5 807 500) (63 552) 111 794 375Short USD USD/MXN Put 19.5500 03/07/2019 (9 292 000) (170 655) 181 658 600Long USD USD/PHP Call 53.0000 27/05/2019 11 615 000 91 779 -Long USD USD/PHP Call 53.0000 27/05/2019 14 524 837 114 772 -Long USD USD/PHP Call 55.0000 12/09/2019 19 000 000 102 112 -Long USD USD/PHP Put 55.0000 12/09/2019 6 857 207 36 853 -Long USD USD/SEK Put 9.0000 03/05/2019 6 927 000 12 166 -Long USD USD/SEK Put 9.0000 03/05/2019 11 545 000 20 276 -Long USD USD/SEK Put 9.1500 17/05/2019 11 545 000 79 314 -Short USD USD/ZAR Call 15.3000 26/06/2019 (23 230 000) (409 575) 355 419 000*Long USD USD/ZAR Call 14.8000 26/06/2019 23 230 000 631 075 -Short USD USD/ZAR Put 13.7500 20/09/2019 (11 615 000) (189 433) 159 706 250Short USD USD/ZAR Put 13.7500 20/09/2019 (5 807 500) (94 716) 79 853 125Short USD USD/ZAR Put 13.7500 20/09/2019 (5 807 500) (94 716) 79 853 125
Total Options 1 474 989 50 779 859 791
* The commitment on short call positions is unlimited.
Merrill Lynch, Pierce Fenner & Smith, Inc. is counterparty to these options.
Notional Pay Receive CurrencyMaturity
date Counterparty
Unrealisedappreciation/depreciation
USDCommitment
USD
Credit default swaps39 845 000 Fixed 1% Mexico
GovernmentInternationalBond 4.15%28/03/2027
USD 20/06/2024 Merrill Lynch, Pierce,Fenner and Smith,
Inc.
(328 935) -
150 Merrill Lynch Investment Solutions
Merrill Lynch Investment Solutions – KLS Fixed IncomeUCITS FundSchedule of Investments as at March 31, 2019 (cont.)(expressed in USD)
The accompanying notes form an integral part of these financial statements.
Audited annual report

Notional Pay Receive CurrencyMaturity
date Counterparty
Unrealisedappreciation/depreciation
USDCommitment
USD
Credit default swaps (cont.)90 553 000 Fixed 1% South Africa
GovernmentInternationalBond 5.50%09/03/2020
USD 20/06/2024 Merrill Lynch, Pierce,Fenner and Smith,
Inc.
80 864 -6 649 000 Fixed 1% Turkey
GovernmentInternationalBond 11.88%15/01/2030
USD 20/06/2024 Merrill Lynch, Pierce,Fenner and Smith,
Inc.
232 768 -10 000 000 Fixed 1% Turkey
GovernmentInternationalBond 11.88%15/01/2030
USD 20/12/2027 Merrill Lynch, Pierce,Fenner and Smith,
Inc.
901 128 -7 687 000 Fixed 5% Argentina
GovernmentInternationalBond 7.50%22/04/2026
USD 20/06/2023 Merrill Lynch, Pierce,Fenner and Smith,
Inc.
(178 745) -3 188 000 Fixed 5% Argentina
GovernmentInternationalBond 7.50%22/04/2026
USD 20/06/2023 Merrill Lynch, Pierce,Fenner and Smith,
Inc.
337 840 -3 188 000 Fixed 5% Argentina
GovernmentInternationalBond 7.50%22/04/2026
USD 20/06/2023 Merrill Lynch, Pierce,Fenner and Smith,
Inc.
293 699 -3 188 000 Fixed 5% Argentina
GovernmentInternationalBond 7.50%22/04/2026
USD 20/06/2023 Merrill Lynch, Pierce,Fenner and Smith,
Inc.
293 699 -974 000 Fixed 5% Argentina
GovernmentInternationalBond 7.50%22/04/2026
USD 20/06/2023 Merrill Lynch, Pierce,Fenner and Smith,
Inc.
89 731 -904 000 Fixed 5% Argentina
GovernmentInternationalBond 7.50%22/04/2026
USD 20/06/2023 Merrill Lynch, Pierce,Fenner and Smith,
Inc.
94 355 -
151Merrill Lynch Investment Solutions
Merrill Lynch Investment Solutions – KLS Fixed IncomeUCITS FundSchedule of Investments as at March 31, 2019 (cont.)(expressed in USD)
The accompanying notes form an integral part of these financial statements.
Audited annual report
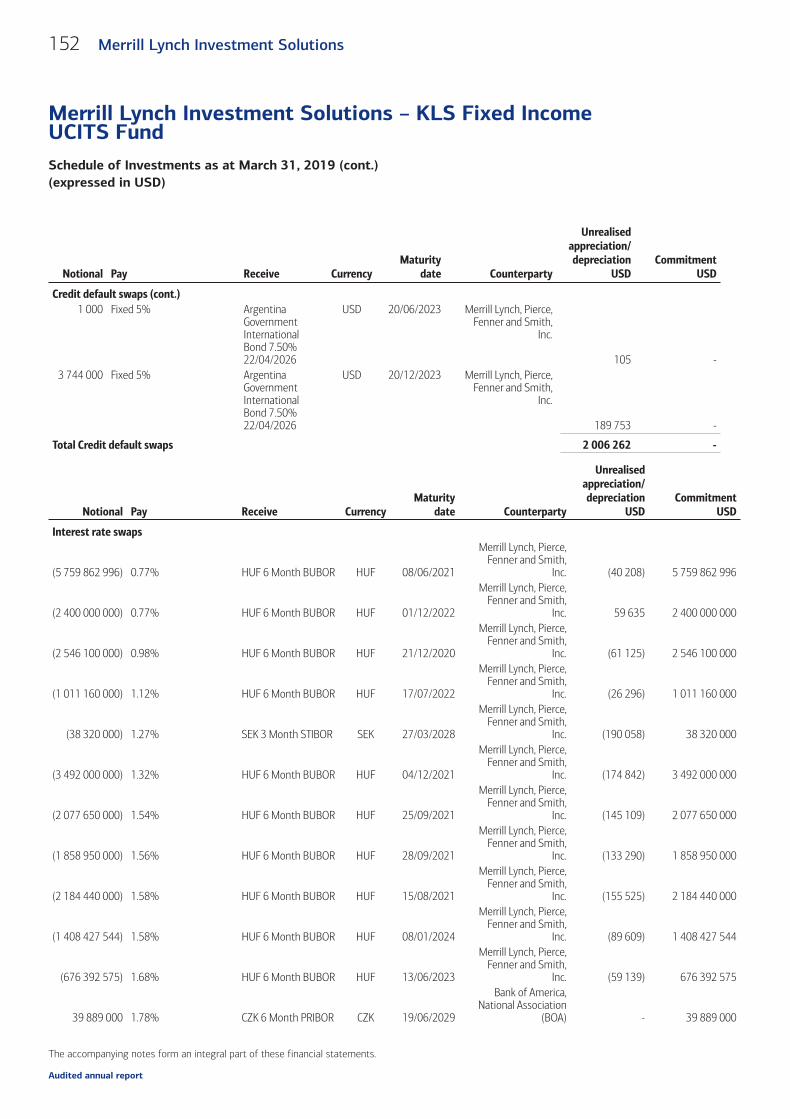
Notional Pay Receive CurrencyMaturity
date Counterparty
Unrealisedappreciation/depreciation
USDCommitment
USD
Credit default swaps (cont.)1 000 Fixed 5% Argentina
GovernmentInternationalBond 7.50%22/04/2026
USD 20/06/2023 Merrill Lynch, Pierce,Fenner and Smith,
Inc.
105 -3 744 000 Fixed 5% Argentina
GovernmentInternationalBond 7.50%22/04/2026
USD 20/12/2023 Merrill Lynch, Pierce,Fenner and Smith,
Inc.
189 753 -
Total Credit default swaps 2 006 262 -
Notional Pay Receive CurrencyMaturity
date Counterparty
Unrealisedappreciation/depreciation
USDCommitment
USD
Interest rate swaps
(5 759 862 996) 0.77% HUF 6 Month BUBOR HUF 08/06/2021
Merrill Lynch, Pierce,Fenner and Smith,
Inc. (40 208) 5 759 862 996
(2 400 000 000) 0.77% HUF 6 Month BUBOR HUF 01/12/2022
Merrill Lynch, Pierce,Fenner and Smith,
Inc. 59 635 2 400 000 000
(2 546 100 000) 0.98% HUF 6 Month BUBOR HUF 21/12/2020
Merrill Lynch, Pierce,Fenner and Smith,
Inc. (61 125) 2 546 100 000
(1 011 160 000) 1.12% HUF 6 Month BUBOR HUF 17/07/2022
Merrill Lynch, Pierce,Fenner and Smith,
Inc. (26 296) 1 011 160 000
(38 320 000) 1.27% SEK 3 Month STIBOR SEK 27/03/2028
Merrill Lynch, Pierce,Fenner and Smith,
Inc. (190 058) 38 320 000
(3 492 000 000) 1.32% HUF 6 Month BUBOR HUF 04/12/2021
Merrill Lynch, Pierce,Fenner and Smith,
Inc. (174 842) 3 492 000 000
(2 077 650 000) 1.54% HUF 6 Month BUBOR HUF 25/09/2021
Merrill Lynch, Pierce,Fenner and Smith,
Inc. (145 109) 2 077 650 000
(1 858 950 000) 1.56% HUF 6 Month BUBOR HUF 28/09/2021
Merrill Lynch, Pierce,Fenner and Smith,
Inc. (133 290) 1 858 950 000
(2 184 440 000) 1.58% HUF 6 Month BUBOR HUF 15/08/2021
Merrill Lynch, Pierce,Fenner and Smith,
Inc. (155 525) 2 184 440 000
(1 408 427 544) 1.58% HUF 6 Month BUBOR HUF 08/01/2024
Merrill Lynch, Pierce,Fenner and Smith,
Inc. (89 609) 1 408 427 544
(676 392 575) 1.68% HUF 6 Month BUBOR HUF 13/06/2023
Merrill Lynch, Pierce,Fenner and Smith,
Inc. (59 139) 676 392 575
39 889 000 1.78% CZK 6 Month PRIBOR CZK 19/06/2029
Bank of America,National Association
(BOA) - 39 889 000
152 Merrill Lynch Investment Solutions
Merrill Lynch Investment Solutions – KLS Fixed IncomeUCITS FundSchedule of Investments as at March 31, 2019 (cont.)(expressed in USD)
The accompanying notes form an integral part of these financial statements.
Audited annual report

Notional Pay Receive CurrencyMaturity
date Counterparty
Unrealisedappreciation/depreciation
USDCommitment
USD
Interest rate swaps (cont.)
(190 000 000) 1.84% HKD 3 Month HIBOR HKD 12/02/2021
Merrill Lynch, Pierce,Fenner and Smith,
Inc. (331) 190 000 000
(640 000) 1.89% USD 3 Month LIBOR USD 19/01/2022
Merrill Lynch, Pierce,Fenner and Smith,
Inc. 7 683 640 000
(41 100 000) 1.89% USD 3 Month LIBOR USD 21/07/2022
Merrill Lynch, Pierce,Fenner and Smith,
Inc. 546 468 41 100 000
(1 668 190 000) 1.89% HUF 6 Month BUBOR HUF 29/06/2023
Merrill Lynch, Pierce,Fenner and Smith,
Inc. (195 992) 1 668 190 000
(640 000) 1.92% USD 3 Month LIBOR USD 11/01/2022
Merrill Lynch, Pierce,Fenner and Smith,
Inc. 7 206 640 000
(1 281 000) 1.93% USD 3 Month LIBOR USD 13/01/2022
Merrill Lynch, Pierce,Fenner and Smith,
Inc. 14 265 1 281 000
(640 000) 1.94% USD 3 Month LIBOR USD 10/01/2022
Merrill Lynch, Pierce,Fenner and Smith,
Inc. 6 898 640 000
(2 527 000) 2.00% USD 3 Month LIBOR USD 11/04/2022
Merrill Lynch, Pierce,Fenner and Smith,
Inc. 23 165 2 527 000
(20 500 000) 2.01% USD 3 Month LIBOR USD 10/07/2022
Merrill Lynch, Pierce,Fenner and Smith,
Inc. 191 100 20 500 000
(1 602 000) 2.02% USD 3 Month LIBOR USD 23/01/2022
Merrill Lynch, Pierce,Fenner and Smith,
Inc. 13 770 1 602 000
(1 534 000) 2.02% USD 3 Month LIBOR USD 07/02/2022
Merrill Lynch, Pierce,Fenner and Smith,
Inc. 13 545 1 534 000
(6 532 000) 2.08% USD 3 Month LIBOR USD 02/11/2022
Merrill Lynch, Pierce,Fenner and Smith,
Inc. 49 572 6 532 000
(3 054 000) 2.09% USD 3 Month LIBOR USD 03/03/2022
Merrill Lynch, Pierce,Fenner and Smith,
Inc. 19 856 3 054 000
(1 278 800 000) 2.09% HUF 6 Month BUBOR HUF 11/07/2023
Merrill Lynch, Pierce,Fenner and Smith,
Inc. (187 719) 1 278 800 000
(2 561 000) 2.12% USD 3 Month LIBOR USD 08/03/2022
Merrill Lynch, Pierce,Fenner and Smith,
Inc. 14 362 2 561 000
(151 050 000) 2.21% HKD 3 Month HIBOR HKD 12/02/2021
Merrill Lynch, Pierce,Fenner and Smith,
Inc. (69 679) 151 050 000
(2 188 000) 2.21% USD 3 Month LIBOR USD 15/03/2022
Merrill Lynch, Pierce,Fenner and Smith,
Inc. 6 665 2 188 000
(1 672 000) 2.23% USD 3 Month LIBOR USD 03/04/2024
Merrill Lynch, Pierce,Fenner and Smith,
Inc. 4 931 1 672 000
153Merrill Lynch Investment Solutions
Merrill Lynch Investment Solutions – KLS Fixed IncomeUCITS FundSchedule of Investments as at March 31, 2019 (cont.)(expressed in USD)
The accompanying notes form an integral part of these financial statements.
Audited annual report

Notional Pay Receive CurrencyMaturity
date Counterparty
Unrealisedappreciation/depreciation
USDCommitment
USD
Interest rate swaps (cont.)
(3 150 000) 2.37% PLN 6 Month WIBOR PLN 26/04/2022
Merrill Lynch, Pierce,Fenner and Smith,
Inc. (13 261) 3 150 000
(4 000 000) 2.41% PLN 6 Month WIBOR PLN 10/07/2022
Merrill Lynch, Pierce,Fenner and Smith,
Inc. (19 046) 4 000 000
(13 800 000) 2.41% PLN 6 Month WIBOR PLN 10/07/2022
Merrill Lynch, Pierce,Fenner and Smith,
Inc. (65 653) 13 800 000
(24 472 000) 2.46% PLN 6 Month WIBOR PLN 14/05/2023
Merrill Lynch, Pierce,Fenner and Smith,
Inc. (144 311) 24 472 000
(947 925 000) 2.46% HUF 6 Month BUBOR HUF 18/10/2023
Merrill Lynch, Pierce,Fenner and Smith,
Inc. (194 560) 947 925 000
(10 538 000) 2.48% PLN 6 Month WIBOR PLN 23/03/2023
Merrill Lynch, Pierce,Fenner and Smith,
Inc. (63 011) 10 538 000
(29 400 000) 2.48% USD 3 Month LIBOR USD 31/08/2023
Merrill Lynch, Pierce,Fenner and Smith,
Inc. (247 123) 29 400 000
(29 400 000) 2.49% USD 3 Month LIBOR USD 31/08/2023
Merrill Lynch, Pierce,Fenner and Smith,
Inc. (258 135) 29 400 000
(34 000 000) 2.51% PLN 6 Month WIBOR PLN 01/12/2022
Merrill Lynch, Pierce,Fenner and Smith,
Inc. (202 310) 34 000 000
(2 968 000) 2.52% PLN 6 Month WIBOR PLN 09/03/2022
Merrill Lynch, Pierce,Fenner and Smith,
Inc. (15 467) 2 968 000
(3 340 268) 2.54% PLN 6 Month WIBOR PLN 03/11/2022
Merrill Lynch, Pierce,Fenner and Smith,
Inc. (20 530) 3 340 268
(16 084 000) 2.54% PLN 6 Month WIBOR PLN 17/05/2023
Merrill Lynch, Pierce,Fenner and Smith,
Inc. (108 145) 16 084 000
(29 745 000) 2.54% PLN 6 Month WIBOR PLN 11/06/2023
Merrill Lynch, Pierce,Fenner and Smith,
Inc. (199 919) 29 745 000
(2 650 000) 2.55% PLN 6 Month WIBOR PLN 10/03/2022
Merrill Lynch, Pierce,Fenner and Smith,
Inc. (14 508) 2 650 000
(3 117 000) 2.56% USD 3 Month LIBOR USD 22/02/2022
Merrill Lynch, Pierce,Fenner and Smith,
Inc. (20 039) 3 117 000
(2 375 000) 2.57% USD 3 Month LIBOR USD 08/01/2022
Merrill Lynch, Pierce,Fenner and Smith,
Inc. (14 804) 2 375 000
(39 500 000) 2.58% USD 3 Month LIBOR USD 15/03/2021
Merrill Lynch, Pierce,Fenner and Smith,
Inc. (140 352) 39 500 000
(1 736 000) 2.62% USD 3 Month LIBOR USD 17/01/2024
Merrill Lynch, Pierce,Fenner and Smith,
Inc. (25 494) 1 736 000
154 Merrill Lynch Investment Solutions
Merrill Lynch Investment Solutions – KLS Fixed IncomeUCITS FundSchedule of Investments as at March 31, 2019 (cont.)(expressed in USD)
The accompanying notes form an integral part of these financial statements.
Audited annual report

Notional Pay Receive CurrencyMaturity
date Counterparty
Unrealisedappreciation/depreciation
USDCommitment
USD
Interest rate swaps (cont.)
(35 000 000) 2.64% USD 3 Month LIBOR USD 15/03/2021
Merrill Lynch, Pierce,Fenner and Smith,
Inc. (159 458) 35 000 000
(6 695 000) 2.75% USD 3 Month LIBOR USD 08/03/2023
Merrill Lynch, Pierce,Fenner and Smith,
Inc. (115 968) 6 695 000
(9 944 000) 2.79% USD 3 Month LIBOR USD 26/03/2023
Merrill Lynch, Pierce,Fenner and Smith,
Inc. (190 397) 9 944 000
(4 512 000) 2.81% USD 3 Month LIBOR USD 12/12/2021
Merrill Lynch, Pierce,Fenner and Smith,
Inc. (54 879) 4 512 000
(1 149 000) 2.84% USD 3 Month LIBOR USD 13/12/2023
Merrill Lynch, Pierce,Fenner and Smith,
Inc. (27 911) 1 149 000
(2 298 000) 2.84% USD 3 Month LIBOR USD 13/12/2023
Merrill Lynch, Pierce,Fenner and Smith,
Inc. (55 878) 2 298 000
(3 543 000) 2.88% USD 3 Month LIBOR USD 07/09/2021
Merrill Lynch, Pierce,Fenner and Smith,
Inc. (43 182) 3 543 000
(3 169 000) 2.88% USD 3 Month LIBOR USD 21/08/2025
Merrill Lynch, Pierce,Fenner and Smith,
Inc. (106 335) 3 169 000
(52 200 000) 2.89% USD 3 Month LIBOR USD 23/03/2025
Merrill Lynch, Pierce,Fenner and Smith,
Inc. (1 715 478) 52 200 000
(5 560 000) 2.90% USD 3 Month LIBOR USD 19/07/2023
Merrill Lynch, Pierce,Fenner and Smith,
Inc. (138 830) 5 560 000
(2 378 000) 2.93% USD 3 Month LIBOR USD 11/06/2025
Merrill Lynch, Pierce,Fenner and Smith,
Inc. (85 475) 2 378 000
(4 887 000) 2.94% USD 3 Month LIBOR USD 10/05/2023
Merrill Lynch, Pierce,Fenner and Smith,
Inc. (124 716) 4 887 000
(2 584 000) 2.97% USD 3 Month LIBOR USD 03/08/2021
Merrill Lynch, Pierce,Fenner and Smith,
Inc. (34 736) 2 584 000
(1 032 000) 2.97% USD 3 Month LIBOR USD 04/05/2025
Merrill Lynch, Pierce,Fenner and Smith,
Inc. (38 571) 1 032 000
(3 974 000) 3.04% USD 3 Month LIBOR USD 22/05/2025
Merrill Lynch, Pierce,Fenner and Smith,
Inc. (165 882) 3 974 000
(6 486 000) 3.04% USD 3 Month LIBOR USD 07/08/2028
Merrill Lynch, Pierce,Fenner and Smith,
Inc. (350 619) 6 486 000
(2 165 000) 3.08% USD 3 Month LIBOR USD 24/09/2023
Merrill Lynch, Pierce,Fenner and Smith,
Inc. (73 020) 2 165 000
(7 884 000) 3.09% USD 3 Month LIBOR USD 01/10/2024
Merrill Lynch, Pierce,Fenner and Smith,
Inc. (320 646) 7 884 000
155Merrill Lynch Investment Solutions
Merrill Lynch Investment Solutions – KLS Fixed IncomeUCITS FundSchedule of Investments as at March 31, 2019 (cont.)(expressed in USD)
The accompanying notes form an integral part of these financial statements.
Audited annual report

Notional Pay Receive CurrencyMaturity
date Counterparty
Unrealisedappreciation/depreciation
USDCommitment
USD
Interest rate swaps (cont.)
(11 640 000) 3.16% USD 3 Month LIBOR USD 06/11/2023
Merrill Lynch, Pierce,Fenner and Smith,
Inc. (440 191) 11 640 000
(5 600 000) 3.16% USD 3 Month LIBOR USD 25/10/2025
Merrill Lynch, Pierce,Fenner and Smith,
Inc. (288 385) 5 600 000
(367 134 287) 7.01% ZAR 3 Month JIBAR ZAR 04/06/2020
Merrill Lynch, Pierce,Fenner and Smith,
Inc. 37 807 367 134 287
(212 554 000) 7.79%
Banco de MéxicoInterbank EquilibriumInterest Rate MXN 22/03/2024
Merrill Lynch, Pierce,Fenner and Smith,
Inc. 11 911 212 554 000
(40 293 000) 7.82% ZAR 3 Month JIBAR ZAR 08/05/2028
Merrill Lynch, Pierce,Fenner and Smith,
Inc. 12 662 40 293 000
(32 000 000) 7.84% ZAR 3 Month JIBAR ZAR 18/01/2028
Merrill Lynch, Pierce,Fenner and Smith,
Inc. 6 470 32 000 000
(348 450 000) 7.89%
Banco de MéxicoInterbank EquilibriumInterest Rate MXN 11/09/2024
Merrill Lynch, Pierce,Fenner and Smith,
Inc. (151 439) 348 450 000
(265 000 000) 8.15%
Banco de MéxicoInterbank EquilibriumInterest Rate MXN 04/03/2020
Merrill Lynch, Pierce,Fenner and Smith,
Inc. 4 422 265 000 000
(1 015 000 000) 8.15%
Banco de MéxicoInterbank EquilibriumInterest Rate MXN 04/03/2020
Merrill Lynch, Pierce,Fenner and Smith,
Inc. 16 935 1 015 000 000
(790 000 000) 8.16%
Banco de MéxicoInterbank EquilibriumInterest Rate MXN 04/03/2020
Merrill Lynch, Pierce,Fenner and Smith,
Inc. - 790 000 000
133 000 000
Banco de MéxicoInterbank EquilibriumInterest Rate 7.65% MXN 14/09/2022
Merrill Lynch, Pierce,Fenner and Smith,
Inc. - 133 000 000
50 000 000
Banco de MéxicoInterbank EquilibriumInterest Rate 7.73% MXN 14/09/2022
Merrill Lynch, Pierce,Fenner and Smith,
Inc. 704 50 000 000
541 259 000
Banco de MéxicoInterbank EquilibriumInterest Rate 7.83% MXN 14/09/2022
Merrill Lynch, Pierce,Fenner and Smith,
Inc. 79 704 541 259 000
170 000 000
Banco de MéxicoInterbank EquilibriumInterest Rate 7.85% MXN 14/09/2022
Merrill Lynch, Pierce,Fenner and Smith,
Inc. 30 693 170 000 000
13 412 000 CAD 6 Month CDOR 2.44% CAD 22/03/2023
Merrill Lynch, Pierce,Fenner and Smith,
Inc. 211 285 13 412 000
6 706 000 CAD 6 Month CDOR 2.58% CAD 22/03/2028
Merrill Lynch, Pierce,Fenner and Smith,
Inc. 221 927 6 706 000
6 706 000 CAD 6 Month CDOR 2.62% CAD 23/03/2028
Merrill Lynch, Pierce,Fenner and Smith,
Inc. 238 072 6 706 000
6 801 000 CAD 6 Month CDOR 2.53% CAD 03/04/2028
Merrill Lynch, Pierce,Fenner and Smith,
Inc. 202 989 6 801 000
156 Merrill Lynch Investment Solutions
Merrill Lynch Investment Solutions – KLS Fixed IncomeUCITS FundSchedule of Investments as at March 31, 2019 (cont.)(expressed in USD)
The accompanying notes form an integral part of these financial statements.
Audited annual report

Notional Pay Receive CurrencyMaturity
date Counterparty
Unrealisedappreciation/depreciation
USDCommitment
USD
Interest rate swaps (cont.)
2 000 000 CAD 6 Month CDOR 2.72% CAD 23/04/2028
Merrill Lynch, Pierce,Fenner and Smith,
Inc. 83 200 2 000 000
60 000 000 CZK 6 Month PRIBOR 1.75% CZK 19/06/2029
Merrill Lynch, Pierce,Fenner and Smith,
Inc. (7 249) 60 000 000
21 000 000 HKD 3 Month HIBOR 2.10% HKD 14/05/2029
Merrill Lynch, Pierce,Fenner and Smith,
Inc. (14 407) 21 000 000
16 500 000 HKD 3 Month HIBOR 2.39% HKD 15/05/2029
Merrill Lynch, Pierce,Fenner and Smith,
Inc. 43 555 16 500 0001 811 940 000 HUF 6 Month BUBOR 1.23% HUF 02/04/2024 Barclays Bank Plc. - 1 811 940 000
114 200 000 USD 3 Month LIBOR 2.43% USD 18/12/2019
Merrill Lynch, Pierce,Fenner and Smith,
Inc. 54 074 114 200 000
114 200 000 USD 3 Month LIBOR 2.69% USD 18/12/2019
Merrill Lynch, Pierce,Fenner and Smith,
Inc. (65 003) 114 200 000
112 000 000 USD 3 Month LIBOR 2.67% USD 23/03/2020
Merrill Lynch, Pierce,Fenner and Smith,
Inc. 106 178 112 000 000
12 161 000 USD 3 Month LIBOR 2.98% USD 07/08/2023
Merrill Lynch, Pierce,Fenner and Smith,
Inc. 344 381 12 161 000
190 451 155 ZAR 3 Month JIBAR 6.88% ZAR 11/05/2020
Merrill Lynch, Pierce,Fenner and Smith,
Inc. (37 495) 190 451 155
367 134 287 ZAR 3 Month JIBAR 7.20% ZAR 04/06/2020
Merrill Lynch, Pierce,Fenner and Smith,
Inc. 16 162 367 134 287
32 000 000 ZAR 3 Month JIBAR 7.84% ZAR 18/01/2028
Merrill Lynch, Pierce,Fenner and Smith,
Inc. (6 776) 32 000 000
20 000 000 ZAR 3 Month JIBAR 7.70% ZAR 20/02/2028
Merrill Lynch, Pierce,Fenner and Smith,
Inc. (17 471) 20 000 000
16 000 000 ZAR 3 Month JIBAR 7.60% ZAR 23/02/2028
Merrill Lynch, Pierce,Fenner and Smith,
Inc. (21 152) 16 000 000
16 000 000 ZAR 3 Month JIBAR 7.70% ZAR 28/02/2028
Merrill Lynch, Pierce,Fenner and Smith,
Inc. (14 099) 16 000 000
23 000 000 ZAR 3 Month JIBAR 7.72% ZAR 05/03/2028
Merrill Lynch, Pierce,Fenner and Smith,
Inc. (18 923) 23 000 000
29 417 500 ZAR 3 Month JIBAR 7.64% ZAR 29/03/2028
Merrill Lynch, Pierce,Fenner and Smith,
Inc. (34 914) 29 417 500
53 000 000 ZAR 3 Month JIBAR 7.73% ZAR 26/04/2028
Merrill Lynch, Pierce,Fenner and Smith,
Inc. (43 142) 53 000 000
157Merrill Lynch Investment Solutions
Merrill Lynch Investment Solutions – KLS Fixed IncomeUCITS FundSchedule of Investments as at March 31, 2019 (cont.)(expressed in USD)
The accompanying notes form an integral part of these financial statements.
Audited annual report
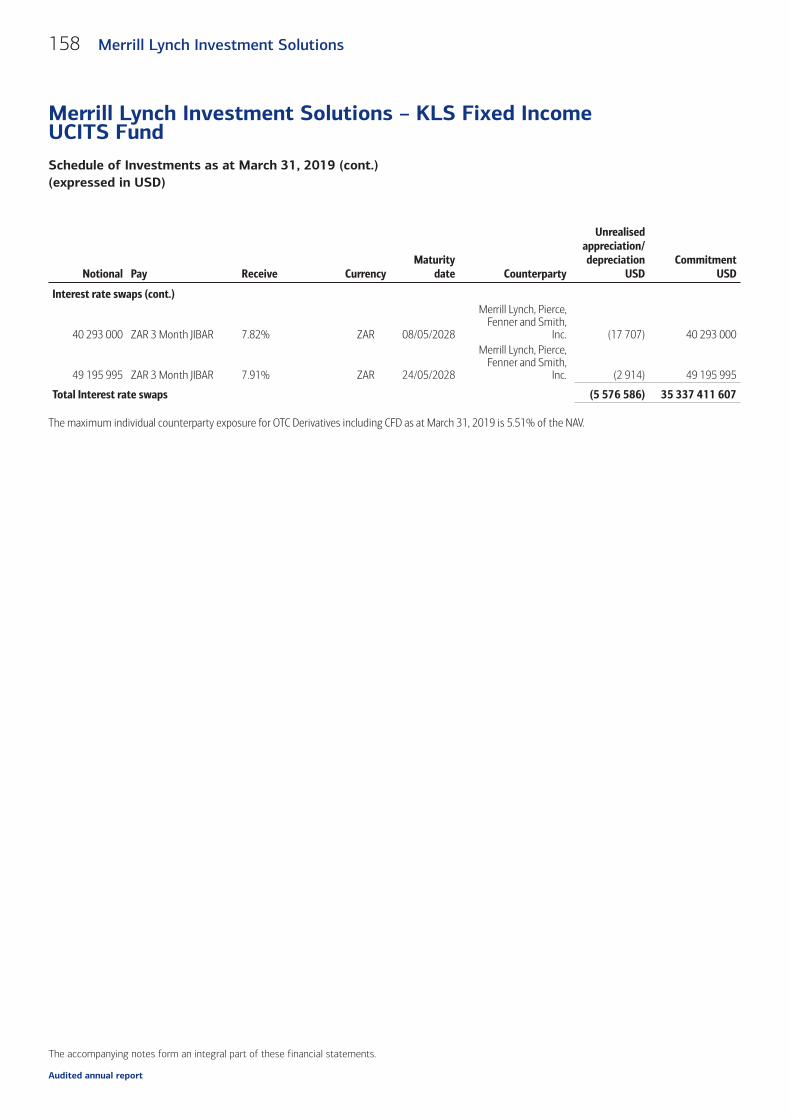
Notional Pay Receive CurrencyMaturity
date Counterparty
Unrealisedappreciation/depreciation
USDCommitment
USD
Interest rate swaps (cont.)
40 293 000 ZAR 3 Month JIBAR 7.82% ZAR 08/05/2028
Merrill Lynch, Pierce,Fenner and Smith,
Inc. (17 707) 40 293 000
49 195 995 ZAR 3 Month JIBAR 7.91% ZAR 24/05/2028
Merrill Lynch, Pierce,Fenner and Smith,
Inc. (2 914) 49 195 995
Total Interest rate swaps (5 576 586) 35 337 411 607
The maximum individual counterparty exposure for OTC Derivatives including CFD as at March 31, 2019 is 5.51% of the NAV.
158 Merrill Lynch Investment Solutions
Merrill Lynch Investment Solutions – KLS Fixed IncomeUCITS FundSchedule of Investments as at March 31, 2019 (cont.)(expressed in USD)
The accompanying notes form an integral part of these financial statements.
Audited annual report

Nominalvalue Description
QuotationCurrency
CostUSD
Marketvalue USD
% of netassets
Transferable securities and money market instruments admitted to an official exchange listing or dealt in on another regulated market
Supranationals, Governments and Local Public Authorities, Debt Instruments18 000 000 European Investment Bank 1.125% 15/08/2019 USD 17 909 449 17 905 608 6.4845 000 000 European Investment Bank 1.625% 14/08/2020 USD 44 511 608 44 516 350 16.1140 000 000 European Investment Bank 1.625% 15/12/2020 USD 39 371 434 39 475 423 14.2921 000 000 European Investment Bank 1.750% 17/06/2019 USD 21 008 222 20 967 030 7.5937 000 000 International Bank for Reconstruction & Development 1.200%
30/09/2019USD 36 752 472 36 754 632 13.30
20 000 000 International Bank for Reconstruction & Development 1.375%24/05/2021
USD 19 403 106 19 591 827 7.09
20 000 000 International Bank for Reconstruction & Development 1.875%07/10/2019
USD 20 030 097 19 935 070 7.22
1 000 United States Treasury Note/Bond 3.500% 15/02/2039 USD 1 065 1 133 0.001 000 United States Treasury Note/Bond 4.250% 15/05/2039 USD 1 173 1 250 0.001 000 United States Treasury Note/Bond 4.375% 15/02/2038 USD 1 198 1 265 0.001 000 United States Treasury Note/Bond 4.500% 15/05/2038 USD 1 216 1 286 0.001 000 United States Treasury Note/Bond 4.750% 15/02/2037 USD 1 247 1 312 0.001 000 United States Treasury Note/Bond 5.000% 15/05/2037 USD 1 283 1 352 0.00
Total Supranationals, Governments and Local PublicAuthorities, Debt Instruments 198 993 570 199 153 538 72.08
Other transferable securities
Bonds19 057 499 Star Compass Plc. 0.000% 01/02/2022 USD 14 506 874 19 135 635 6.93
Total Bonds 14 506 874 19 135 635 6.93
Total Investments 213 500 444 218 289 173 79.01
159Merrill Lynch Investment Solutions
Merrill Lynch Investment Solutions – MillburnDiversified UCITS FundSchedule of Investments as at March 31, 2019(expressed in USD)
The accompanying notes form an integral part of these financial statements.
Audited annual report

Industrial classification of investments(as a percentage of net assets as at March 31, 2019) %
Sovereign 72.08Diversified Financial Services 6.93
79.01
Geographical classification of investments(as a percentage of net assets as at March 31, 2019) %
Supranational 44.47United States 27.61Ireland 6.93
79.01
Underlyingnature
Currencycontract Details Market
Maturitydate
Number ofcontracts
bought
Number ofcontracts
soldCommitment
USD
Unrealisedappreciation/
(depreciation)USD
Futures contractsIndex EUR Amsterdam Index Euronext EQF 18/04/2019 34 – 4 178 887 37 417Index EUR CAC 40 10 Euro Index Euronext Paris 18/04/2019 234 – 14 022 317 (83 886)Index EUR DAX Index Eurex Deutschland 21/06/2019 2 – 646 826 3 785Index USD DJIA Mini Index Chicago Board of Trade 21/06/2019 51 – 6 612 915 83 120Index EUR Euro Stoxx 50 Index Eurex Deutschland 21/06/2019 – 12 440 366 (808)Index GBP FTSE 100 Index ICE Futures Europe 21/06/2019 – 91 8 535 796 (51 313)
Index USD FTSE 100 IndexCBOE FuturesExchange 17/07/2019 – 13 220 025 515
Index USD FTSE China A50 IndexSingapore Exchange(was SIMEX) 29/04/2019 511 – 6 706 875 180 100
Index ZAR FTSE JSE TOP 40 IndexSouth African FuturesExchange 20/06/2019 – 13 457 148 (163)
Index MYR FTSE KLCI Index Bursa Malaysia 30/04/2019 3 – 60 478 (37)Index EUR FTSE MIB Index Borsa Italiana S.P.A 21/06/2019 – 43 5 001 346 (31 000)
Index HKD Hang Seng IndexHong Kong FuturesExchange 29/04/2019 100 – 18 520 500 244 148
Index HKD HSCEI IndexHong Kong FuturesExchange 29/04/2019 193 – 13 982 140 81 236
Index EUR IBEX 35 IndexBolsas Y MercadosEspanoles 18/04/2019 – 8 824 420 289
Index KRW KOSPI 200 Index Korea Exchange 13/06/2019 – 54 3 296 802 (4 625)Index USD Mini MSCI EAFE Index ICE Futures U.S. 21/06/2019 – 111 10 358 520 (23 030)
Index USDMSCI EmergingMarkets Mini Index ICE Futures U.S. 21/06/2019 190 – 10 045 300 (95 575)
Index SGD MSCI Singapore IndexSingapore Exchange(was SIMEX) 29/04/2019 173 – 4 591 802 12 227
Index USD MSCI Taiwan IndexSingapore Exchange(was SIMEX) 29/04/2019 95 – 3 711 650 32 830
Index USDNasdaq 100 E-MiniIndex
Chicago MercantileExchange 21/06/2019 63 – 9 324 630 76 260
Index JPY Nikkei 225 Index Singapore Exchange 13/06/2019 – 88 8 420 844 (30 972)Index SEK OMXS30 Index NASDAQ OMX Nordic 17/04/2019 163 – 2 711 771 (7 166)
Index USDRussell 2000 MiniIndex
Chicago MercantileExchange 21/06/2019 71 – 5 480 490 71 155
Index USD S&P 500 E-Mini IndexChicago MercantileExchange 21/06/2019 95 – 13 479 550 125 813
Index USDS&P MidCap400 E-Mini Index
Chicago MercantileExchange 21/06/2019 21 – 3 992 100 82 010
Index CAD S&P TSX 60 Index Montreal Exchange 20/06/2019 97 – 13 905 815 6 283
Index THB SET 50 IndexThailand FuturesExchange 27/06/2019 166 – 1 133 414 4 231
160 Merrill Lynch Investment Solutions
Merrill Lynch Investment Solutions – MillburnDiversified UCITS FundSchedule of Investments as at March 31, 2019 (cont.)(expressed in USD)
The accompanying notes form an integral part of these financial statements.
Audited annual report
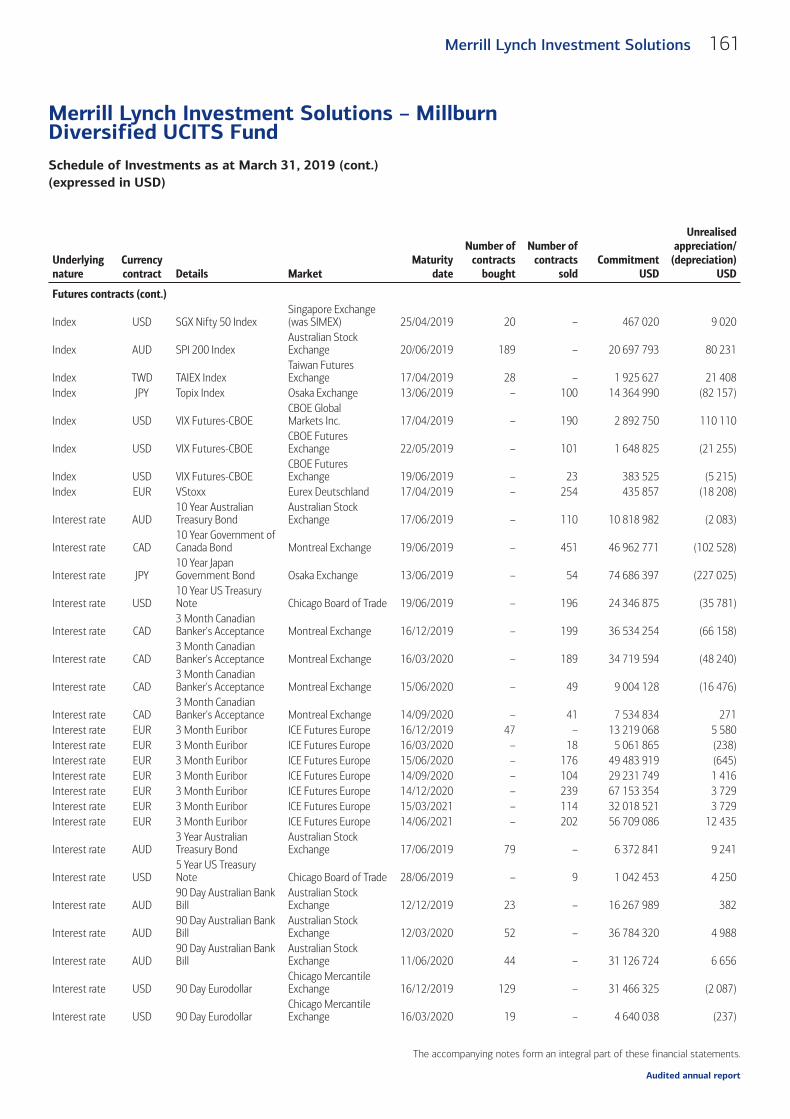
Underlyingnature
Currencycontract Details Market
Maturitydate
Number ofcontracts
bought
Number ofcontracts
soldCommitment
USD
Unrealisedappreciation/
(depreciation)USD
Futures contracts (cont.)
Index USD SGX Nifty 50 IndexSingapore Exchange(was SIMEX) 25/04/2019 20 – 467 020 9 020
Index AUD SPI 200 IndexAustralian StockExchange 20/06/2019 189 – 20 697 793 80 231
Index TWD TAIEX IndexTaiwan FuturesExchange 17/04/2019 28 – 1 925 627 21 408
Index JPY Topix Index Osaka Exchange 13/06/2019 – 100 14 364 990 (82 157)
Index USD VIX Futures-CBOECBOE GlobalMarkets Inc. 17/04/2019 – 190 2 892 750 110 110
Index USD VIX Futures-CBOECBOE FuturesExchange 22/05/2019 – 101 1 648 825 (21 255)
Index USD VIX Futures-CBOECBOE FuturesExchange 19/06/2019 – 23 383 525 (5 215)
Index EUR VStoxx Eurex Deutschland 17/04/2019 – 254 435 857 (18 208)
Interest rate AUD10 Year AustralianTreasury Bond
Australian StockExchange 17/06/2019 – 110 10 818 982 (2 083)
Interest rate CAD10 Year Government ofCanada Bond Montreal Exchange 19/06/2019 – 451 46 962 771 (102 528)
Interest rate JPY10 Year JapanGovernment Bond Osaka Exchange 13/06/2019 – 54 74 686 397 (227 025)
Interest rate USD10 Year US TreasuryNote Chicago Board of Trade 19/06/2019 – 196 24 346 875 (35 781)
Interest rate CAD3 Month CanadianBanker's Acceptance Montreal Exchange 16/12/2019 – 199 36 534 254 (66 158)
Interest rate CAD3 Month CanadianBanker's Acceptance Montreal Exchange 16/03/2020 – 189 34 719 594 (48 240)
Interest rate CAD3 Month CanadianBanker's Acceptance Montreal Exchange 15/06/2020 – 49 9 004 128 (16 476)
Interest rate CAD3 Month CanadianBanker's Acceptance Montreal Exchange 14/09/2020 – 41 7 534 834 271
Interest rate EUR 3 Month Euribor ICE Futures Europe 16/12/2019 47 – 13 219 068 5 580Interest rate EUR 3 Month Euribor ICE Futures Europe 16/03/2020 – 18 5 061 865 (238)Interest rate EUR 3 Month Euribor ICE Futures Europe 15/06/2020 – 176 49 483 919 (645)Interest rate EUR 3 Month Euribor ICE Futures Europe 14/09/2020 – 104 29 231 749 1 416Interest rate EUR 3 Month Euribor ICE Futures Europe 14/12/2020 – 239 67 153 354 3 729Interest rate EUR 3 Month Euribor ICE Futures Europe 15/03/2021 – 114 32 018 521 3 729Interest rate EUR 3 Month Euribor ICE Futures Europe 14/06/2021 – 202 56 709 086 12 435
Interest rate AUD3 Year AustralianTreasury Bond
Australian StockExchange 17/06/2019 79 – 6 372 841 9 241
Interest rate USD5 Year US TreasuryNote Chicago Board of Trade 28/06/2019 – 9 1 042 453 4 250
Interest rate AUD90 Day Australian BankBill
Australian StockExchange 12/12/2019 23 – 16 267 989 382
Interest rate AUD90 Day Australian BankBill
Australian StockExchange 12/03/2020 52 – 36 784 320 4 988
Interest rate AUD90 Day Australian BankBill
Australian StockExchange 11/06/2020 44 – 31 126 724 6 656
Interest rate USD 90 Day EurodollarChicago MercantileExchange 16/12/2019 129 – 31 466 325 (2 087)
Interest rate USD 90 Day EurodollarChicago MercantileExchange 16/03/2020 19 – 4 640 038 (237)
161Merrill Lynch Investment Solutions
Merrill Lynch Investment Solutions – MillburnDiversified UCITS FundSchedule of Investments as at March 31, 2019 (cont.)(expressed in USD)
The accompanying notes form an integral part of these financial statements.
Audited annual report

Underlyingnature
Currencycontract Details Market
Maturitydate
Number ofcontracts
bought
Number ofcontracts
soldCommitment
USD
Unrealisedappreciation/
(depreciation)USD
Futures contracts (cont.)
Interest rate USD 90 Day EurodollarChicago MercantileExchange 15/06/2020 – 100 24 443 750 (71 450)
Interest rate USD 90 Day EurodollarChicago MercantileExchange 14/09/2020 195 – 47 697 000 22 250
Interest rate USD 90 Day EurodollarChicago MercantileExchange 14/12/2020 137 – 33 515 338 (24 462)
Interest rate USD 90 Day EurodollarChicago MercantileExchange 15/03/2021 268 – 65 579 600 (27 912)
Interest rate USD 90 Day EurodollarChicago MercantileExchange 14/06/2021 300 – 73 406 250 (20 300)
Interest rate GBP 90 Day Sterling ICE Futures Europe 18/12/2019 144 – 23 215 928 34 810Interest rate GBP 90 Day Sterling ICE Futures Europe 18/03/2020 430 – 69 335 827 120 258Interest rate GBP 90 Day Sterling ICE Futures Europe 17/06/2020 490 – 78 994 660 145 687Interest rate GBP 90 Day Sterling ICE Futures Europe 16/09/2020 368 – 59 302 669 101 430Interest rate GBP 90 Day Sterling ICE Futures Europe 16/12/2020 214 – 34 473 613 62 726Interest rate GBP 90 Day Sterling ICE Futures Europe 17/03/2021 346 – 55 723 648 105 755Interest rate GBP 90 Day Sterling ICE Futures Europe 16/06/2021 288 – 46 366 300 76 302Interest rate EUR Euro BTP Eurex Deutschland 06/06/2019 255 – 37 027 813 170 980Interest rate EUR Euro BTP Eurex Deutschland 06/06/2019 6 – 746 952 (191)Interest rate EUR Euro OAT Eurex Deutschland 06/06/2019 4 – 729 770 135Interest rate EUR German Euro BOBL Eurex Deutschland 06/06/2019 216 – 32 253 811 108 409Interest rate EUR German Euro BUND Eurex Deutschland 06/06/2019 – 1 186 559 348Interest rate EUR German Euro BUXL Eurex Deutschland 06/06/2019 – 20 4 299 126 31 942Interest rate GBP Long Gilt ICE Futures Europe 26/06/2019 84 – 14 134 807 20 746Interest rate USD US Long Bond Chicago Board of Trade 19/06/2019 9 – 1 346 906 1 313Interest rate USD US Ultra Long Bond Chicago Board of Trade 19/06/2019 – 17 2 856 000 531
Total Futures contracts 1 544 301 528 1 217 264
Currencybought Amount bought Currency sold Amount sold
Maturitydate Counterparty
Unrealisedappreciation/
(depreciation)USD
Forward foreign exchange contractsAUD 52 310 000 USD 37 082 916 17/04/2019 Deutsche Bank AG 60 738BRL 52 170 000 USD 13 688 552 17/04/2019 Deutsche Bank AG (355 918)CAD 31 560 000 USD 23 586 190 17/04/2019 Deutsche Bank AG 59 596CHF 37 650 000 USD 37 733 863 17/04/2019 Deutsche Bank AG 123 399CLP 3 322 000 000 USD 5 007 977 17/04/2019 Deutsche Bank AG (127 334)COP 11 636 000 000 USD 3 713 463 17/04/2019 Deutsche Bank AG (66 898)EUR 16 700 000 NOK 162 234 802 17/04/2019 Deutsche Bank AG (76 859)EUR 18 180 000 PLN 78 246 005 17/04/2019 Deutsche Bank AG 26 964EUR 10 680 000 SEK 111 696 633 17/04/2019 Deutsche Bank AG (37 874)EUR 57 200 000 USD 64 867 351 17/04/2019 Deutsche Bank AG (633 036)GBP 36 390 000 USD 47 923 979 17/04/2019 Deutsche Bank AG (555 443)ILS 36 900 000 USD 10 217 957 17/04/2019 Deutsche Bank AG (48 701)JPY 10 015 000 000 USD 90 290 810 17/04/2019 Deutsche Bank AG 194 110KRW 26 318 000 000 USD 23 316 629 17/04/2019 Deutsche Bank AG (167 208)
162 Merrill Lynch Investment Solutions
Merrill Lynch Investment Solutions – MillburnDiversified UCITS FundSchedule of Investments as at March 31, 2019 (cont.)(expressed in USD)
The accompanying notes form an integral part of these financial statements.
Audited annual report

Currencybought Amount bought Currency sold Amount sold
Maturitydate Counterparty
Unrealisedappreciation/
(depreciation)USD
Forward foreign exchange contracts (cont.)MXN 266 390 000 USD 13 749 589 17/04/2019 Deutsche Bank AG (64 290)NOK 182 366 248 EUR 18 680 000 17/04/2019 Deutsche Bank AG 190 031NOK 102 020 000 USD 11 853 327 17/04/2019 Deutsche Bank AG (11 870)NZD 38 310 000 USD 26 182 284 17/04/2019 Deutsche Bank AG (93 139)PLN 85 165 051 EUR 19 770 000 17/04/2019 Deutsche Bank AG (9 584)PLN 24 560 000 USD 6 469 764 17/04/2019 Deutsche Bank AG (70 097)RUB 1 023 030 000 USD 15 497 557 17/04/2019 Deutsche Bank AG 34 018SEK 107 022 840 EUR 10 190 000 17/04/2019 Deutsche Bank AG 84 697SEK 147 820 000 USD 15 967 459 17/04/2019 Deutsche Bank AG (45 200)SGD 47 440 000 USD 35 029 847 17/04/2019 Deutsche Bank AG (13 731)TRY 64 520 000 USD 11 702 497 17/04/2019 Deutsche Bank AG (429 364)USD 43 853 135 AUD 61 910 000 17/04/2019 Deutsche Bank AG (107 174)USD 19 198 450 BRL 74 660 000 17/04/2019 Deutsche Bank AG 118 236USD 30 341 731 CAD 40 470 000 17/04/2019 Deutsche Bank AG 20 280USD 45 987 805 CHF 46 010 000 17/04/2019 Deutsche Bank AG (275 477)USD 4 545 318 CLP 3 061 000 000 17/04/2019 Deutsche Bank AG 48 132USD 2 653 601 COP 8 435 000 000 17/04/2019 Deutsche Bank AG 10 187USD 120 968 283 EUR 107 310 000 17/04/2019 Deutsche Bank AG 461 562USD 54 628 130 GBP 41 360 000 17/04/2019 Deutsche Bank AG 790 190USD 13 349 908 ILS 48 250 000 17/04/2019 Deutsche Bank AG 52 714USD 92 837 031 JPY 10 309 000 000 17/04/2019 Deutsche Bank AG (304 160)USD 22 998 722 KRW 26 059 000 000 17/04/2019 Deutsche Bank AG 77 119USD 3 629 797 MXN 69 980 000 17/04/2019 Deutsche Bank AG 34 702USD 14 694 467 NOK 126 670 000 17/04/2019 Deutsche Bank AG (8 115)USD 30 390 044 NZD 44 540 000 17/04/2019 Deutsche Bank AG 58 263USD 13 797 781 PLN 52 640 000 17/04/2019 Deutsche Bank AG 81 234USD 2 941 633 RUB 191 210 000 17/04/2019 Deutsche Bank AG 38 695USD 21 157 693 SEK 196 880 000 17/04/2019 Deutsche Bank AG (49 008)USD 36 561 737 SGD 49 490 000 17/04/2019 Deutsche Bank AG 32 489USD 11 431 510 TRY 64 520 000 17/04/2019 Deutsche Bank AG 158 376USD 10 028 448 ZAR 145 780 000 17/04/2019 Deutsche Bank AG (47 974)ZAR 169 150 000 USD 11 756 569 17/04/2019 Deutsche Bank AG (64 799)INR 1 351 560 000 USD 19 296 274 18/04/2019 Deutsche Bank AG 132 403USD 5 016 237 INR 346 990 000 18/04/2019 Deutsche Bank AG 28 255
CHF 80 639 USD 81 407 30/04/2019State Street Bank and
Trust Co. (225)
EUR 129 601 355 USD 146 677 944 30/04/2019State Street Bank and
Trust Co. (978 758)
GBP 33 616 435 USD 44 520 736 30/04/2019State Street Bank and
Trust Co. (734 016)
USD 1 087 605 EUR 959 695 30/04/2019State Street Bank and
Trust Co. 8 706
JPY 6 663 327 762 USD 60 908 771 07/05/2019State Street Bank and
Trust Co. (601 541)TRY 37 180 000 USD 6 306 724 19/06/2019 Deutsche Bank AG (105 388)
Total forward foreign exchange contracts (3 158 085)
163Merrill Lynch Investment Solutions
Merrill Lynch Investment Solutions – MillburnDiversified UCITS FundSchedule of Investments as at March 31, 2019 (cont.)(expressed in USD)
The accompanying notes form an integral part of these financial statements.
Audited annual report

Short/Long Currency Description
Put/Call
StrikePrice
Maturitydate Quantity
Marketvalue USD
CommitmentUSD
OptionsShort USD UBS ETC Linked to a Millburn Strategy
Delta-1 Basket on Commodity FuturesPut 88.0209 29/03/2019 (957 718) - 84 299 274
Total Options - 84 299 274
UBS AG is the counterparty to this option.
The maximum individual counterparty exposure for OTC Derivatives including CFD as at March 31, 2019 is 4.15% of the NAV.
164 Merrill Lynch Investment Solutions
Merrill Lynch Investment Solutions – MillburnDiversified UCITS FundSchedule of Investments as at March 31, 2019 (cont.)(expressed in USD)
The accompanying notes form an integral part of these financial statements.
Audited annual report
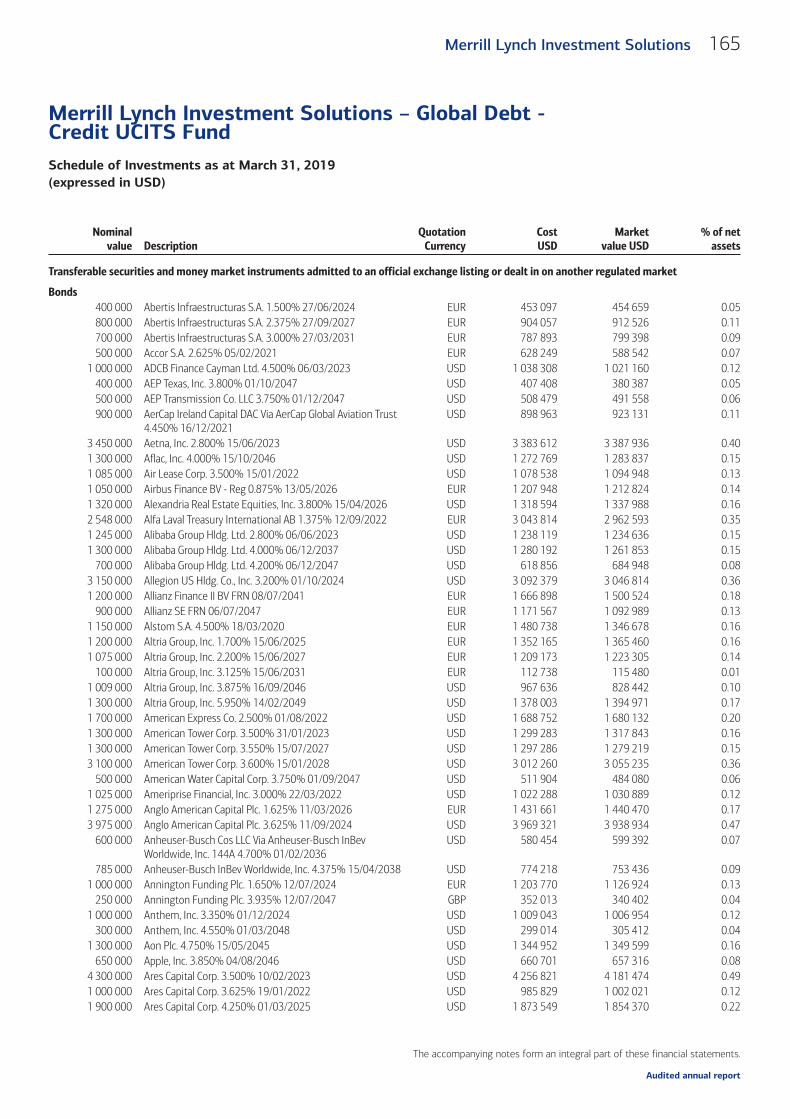
Nominalvalue Description
QuotationCurrency
CostUSD
Marketvalue USD
% of netassets
Transferable securities and money market instruments admitted to an official exchange listing or dealt in on another regulated market
Bonds400 000 Abertis Infraestructuras S.A. 1.500% 27/06/2024 EUR 453 097 454 659 0.05800 000 Abertis Infraestructuras S.A. 2.375% 27/09/2027 EUR 904 057 912 526 0.11700 000 Abertis Infraestructuras S.A. 3.000% 27/03/2031 EUR 787 893 799 398 0.09500 000 Accor S.A. 2.625% 05/02/2021 EUR 628 249 588 542 0.07
1 000 000 ADCB Finance Cayman Ltd. 4.500% 06/03/2023 USD 1 038 308 1 021 160 0.12400 000 AEP Texas, Inc. 3.800% 01/10/2047 USD 407 408 380 387 0.05500 000 AEP Transmission Co. LLC 3.750% 01/12/2047 USD 508 479 491 558 0.06900 000 AerCap Ireland Capital DAC Via AerCap Global Aviation Trust
4.450% 16/12/2021USD 898 963 923 131 0.11
3 450 000 Aetna, Inc. 2.800% 15/06/2023 USD 3 383 612 3 387 936 0.401 300 000 Aflac, Inc. 4.000% 15/10/2046 USD 1 272 769 1 283 837 0.151 085 000 Air Lease Corp. 3.500% 15/01/2022 USD 1 078 538 1 094 948 0.131 050 000 Airbus Finance BV - Reg 0.875% 13/05/2026 EUR 1 207 948 1 212 824 0.141 320 000 Alexandria Real Estate Equities, Inc. 3.800% 15/04/2026 USD 1 318 594 1 337 988 0.162 548 000 Alfa Laval Treasury International AB 1.375% 12/09/2022 EUR 3 043 814 2 962 593 0.351 245 000 Alibaba Group Hldg. Ltd. 2.800% 06/06/2023 USD 1 238 119 1 234 636 0.151 300 000 Alibaba Group Hldg. Ltd. 4.000% 06/12/2037 USD 1 280 192 1 261 853 0.15
700 000 Alibaba Group Hldg. Ltd. 4.200% 06/12/2047 USD 618 856 684 948 0.083 150 000 Allegion US Hldg. Co., Inc. 3.200% 01/10/2024 USD 3 092 379 3 046 814 0.361 200 000 Allianz Finance II BV FRN 08/07/2041 EUR 1 666 898 1 500 524 0.18
900 000 Allianz SE FRN 06/07/2047 EUR 1 171 567 1 092 989 0.131 150 000 Alstom S.A. 4.500% 18/03/2020 EUR 1 480 738 1 346 678 0.161 200 000 Altria Group, Inc. 1.700% 15/06/2025 EUR 1 352 165 1 365 460 0.161 075 000 Altria Group, Inc. 2.200% 15/06/2027 EUR 1 209 173 1 223 305 0.14
100 000 Altria Group, Inc. 3.125% 15/06/2031 EUR 112 738 115 480 0.011 009 000 Altria Group, Inc. 3.875% 16/09/2046 USD 967 636 828 442 0.101 300 000 Altria Group, Inc. 5.950% 14/02/2049 USD 1 378 003 1 394 971 0.171 700 000 American Express Co. 2.500% 01/08/2022 USD 1 688 752 1 680 132 0.201 300 000 American Tower Corp. 3.500% 31/01/2023 USD 1 299 283 1 317 843 0.161 300 000 American Tower Corp. 3.550% 15/07/2027 USD 1 297 286 1 279 219 0.153 100 000 American Tower Corp. 3.600% 15/01/2028 USD 3 012 260 3 055 235 0.36
500 000 American Water Capital Corp. 3.750% 01/09/2047 USD 511 904 484 080 0.061 025 000 Ameriprise Financial, Inc. 3.000% 22/03/2022 USD 1 022 288 1 030 889 0.121 275 000 Anglo American Capital Plc. 1.625% 11/03/2026 EUR 1 431 661 1 440 470 0.173 975 000 Anglo American Capital Plc. 3.625% 11/09/2024 USD 3 969 321 3 938 934 0.47
600 000 Anheuser-Busch Cos LLC Via Anheuser-Busch InBevWorldwide, Inc. 144A 4.700% 01/02/2036
USD 580 454 599 392 0.07
785 000 Anheuser-Busch InBev Worldwide, Inc. 4.375% 15/04/2038 USD 774 218 753 436 0.091 000 000 Annington Funding Plc. 1.650% 12/07/2024 EUR 1 203 770 1 126 924 0.13
250 000 Annington Funding Plc. 3.935% 12/07/2047 GBP 352 013 340 402 0.041 000 000 Anthem, Inc. 3.350% 01/12/2024 USD 1 009 043 1 006 954 0.12
300 000 Anthem, Inc. 4.550% 01/03/2048 USD 299 014 305 412 0.041 300 000 Aon Plc. 4.750% 15/05/2045 USD 1 344 952 1 349 599 0.16
650 000 Apple, Inc. 3.850% 04/08/2046 USD 660 701 657 316 0.084 300 000 Ares Capital Corp. 3.500% 10/02/2023 USD 4 256 821 4 181 474 0.491 000 000 Ares Capital Corp. 3.625% 19/01/2022 USD 985 829 1 002 021 0.121 900 000 Ares Capital Corp. 4.250% 01/03/2025 USD 1 873 549 1 854 370 0.22
165Merrill Lynch Investment Solutions
Merrill Lynch Investment Solutions – Global Debt -Credit UCITS FundSchedule of Investments as at March 31, 2019(expressed in USD)
The accompanying notes form an integral part of these financial statements.
Audited annual report
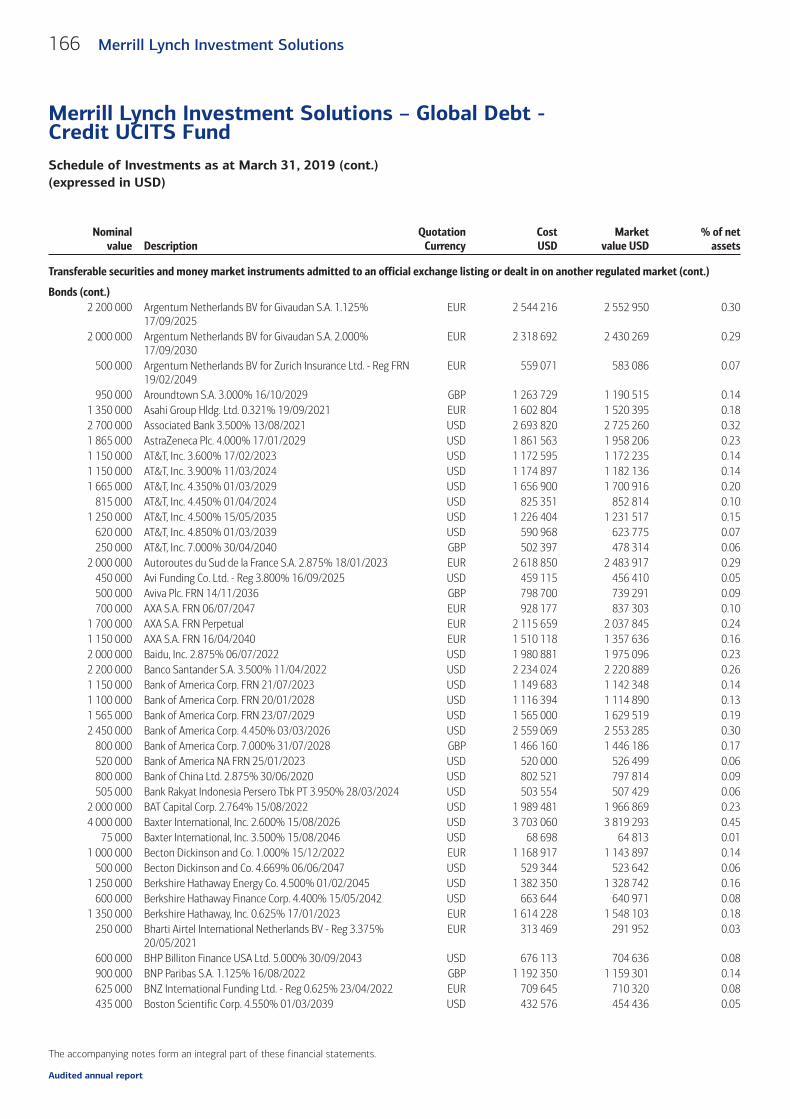
Nominalvalue Description
QuotationCurrency
CostUSD
Marketvalue USD
% of netassets
Transferable securities and money market instruments admitted to an official exchange listing or dealt in on another regulated market (cont.)
Bonds (cont.)2 200 000 Argentum Netherlands BV for Givaudan S.A. 1.125%
17/09/2025EUR 2 544 216 2 552 950 0.30
2 000 000 Argentum Netherlands BV for Givaudan S.A. 2.000%17/09/2030
EUR 2 318 692 2 430 269 0.29
500 000 Argentum Netherlands BV for Zurich Insurance Ltd. - Reg FRN19/02/2049
EUR 559 071 583 086 0.07
950 000 Aroundtown S.A. 3.000% 16/10/2029 GBP 1 263 729 1 190 515 0.141 350 000 Asahi Group Hldg. Ltd. 0.321% 19/09/2021 EUR 1 602 804 1 520 395 0.182 700 000 Associated Bank 3.500% 13/08/2021 USD 2 693 820 2 725 260 0.321 865 000 AstraZeneca Plc. 4.000% 17/01/2029 USD 1 861 563 1 958 206 0.231 150 000 AT&T, Inc. 3.600% 17/02/2023 USD 1 172 595 1 172 235 0.141 150 000 AT&T, Inc. 3.900% 11/03/2024 USD 1 174 897 1 182 136 0.141 665 000 AT&T, Inc. 4.350% 01/03/2029 USD 1 656 900 1 700 916 0.20
815 000 AT&T, Inc. 4.450% 01/04/2024 USD 825 351 852 814 0.101 250 000 AT&T, Inc. 4.500% 15/05/2035 USD 1 226 404 1 231 517 0.15
620 000 AT&T, Inc. 4.850% 01/03/2039 USD 590 968 623 775 0.07250 000 AT&T, Inc. 7.000% 30/04/2040 GBP 502 397 478 314 0.06
2 000 000 Autoroutes du Sud de la France S.A. 2.875% 18/01/2023 EUR 2 618 850 2 483 917 0.29450 000 Avi Funding Co. Ltd. - Reg 3.800% 16/09/2025 USD 459 115 456 410 0.05500 000 Aviva Plc. FRN 14/11/2036 GBP 798 700 739 291 0.09700 000 AXA S.A. FRN 06/07/2047 EUR 928 177 837 303 0.10
1 700 000 AXA S.A. FRN Perpetual EUR 2 115 659 2 037 845 0.241 150 000 AXA S.A. FRN 16/04/2040 EUR 1 510 118 1 357 636 0.162 000 000 Baidu, Inc. 2.875% 06/07/2022 USD 1 980 881 1 975 096 0.232 200 000 Banco Santander S.A. 3.500% 11/04/2022 USD 2 234 024 2 220 889 0.261 150 000 Bank of America Corp. FRN 21/07/2023 USD 1 149 683 1 142 348 0.141 100 000 Bank of America Corp. FRN 20/01/2028 USD 1 116 394 1 114 890 0.131 565 000 Bank of America Corp. FRN 23/07/2029 USD 1 565 000 1 629 519 0.192 450 000 Bank of America Corp. 4.450% 03/03/2026 USD 2 559 069 2 553 285 0.30
800 000 Bank of America Corp. 7.000% 31/07/2028 GBP 1 466 160 1 446 186 0.17520 000 Bank of America NA FRN 25/01/2023 USD 520 000 526 499 0.06800 000 Bank of China Ltd. 2.875% 30/06/2020 USD 802 521 797 814 0.09505 000 Bank Rakyat Indonesia Persero Tbk PT 3.950% 28/03/2024 USD 503 554 507 429 0.06
2 000 000 BAT Capital Corp. 2.764% 15/08/2022 USD 1 989 481 1 966 869 0.234 000 000 Baxter International, Inc. 2.600% 15/08/2026 USD 3 703 060 3 819 293 0.45
75 000 Baxter International, Inc. 3.500% 15/08/2046 USD 68 698 64 813 0.011 000 000 Becton Dickinson and Co. 1.000% 15/12/2022 EUR 1 168 917 1 143 897 0.14
500 000 Becton Dickinson and Co. 4.669% 06/06/2047 USD 529 344 523 642 0.061 250 000 Berkshire Hathaway Energy Co. 4.500% 01/02/2045 USD 1 382 350 1 328 742 0.16
600 000 Berkshire Hathaway Finance Corp. 4.400% 15/05/2042 USD 663 644 640 971 0.081 350 000 Berkshire Hathaway, Inc. 0.625% 17/01/2023 EUR 1 614 228 1 548 103 0.18
250 000 Bharti Airtel International Netherlands BV - Reg 3.375%20/05/2021
EUR 313 469 291 952 0.03
600 000 BHP Billiton Finance USA Ltd. 5.000% 30/09/2043 USD 676 113 704 636 0.08900 000 BNP Paribas S.A. 1.125% 16/08/2022 GBP 1 192 350 1 159 301 0.14625 000 BNZ International Funding Ltd. - Reg 0.625% 23/04/2022 EUR 709 645 710 320 0.08435 000 Boston Scientific Corp. 4.550% 01/03/2039 USD 432 576 454 436 0.05
166 Merrill Lynch Investment Solutions
Merrill Lynch Investment Solutions – Global Debt -Credit UCITS FundSchedule of Investments as at March 31, 2019 (cont.)(expressed in USD)
The accompanying notes form an integral part of these financial statements.
Audited annual report
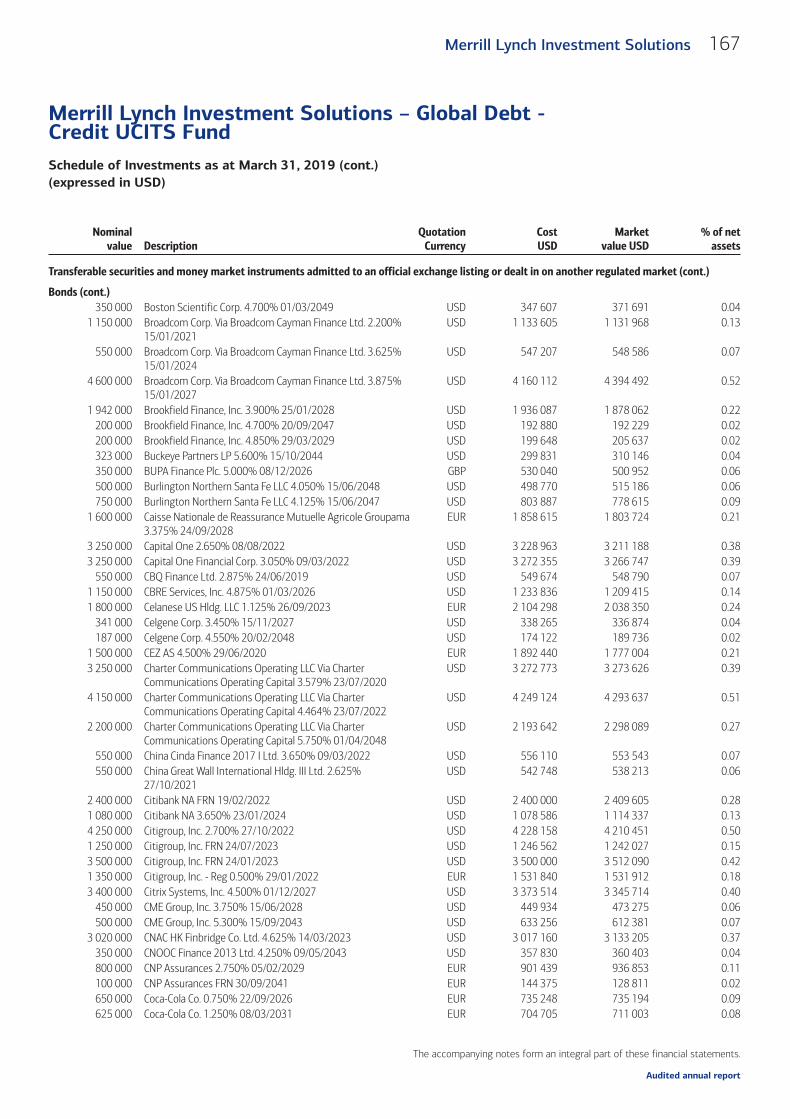
Nominalvalue Description
QuotationCurrency
CostUSD
Marketvalue USD
% of netassets
Transferable securities and money market instruments admitted to an official exchange listing or dealt in on another regulated market (cont.)
Bonds (cont.)350 000 Boston Scientific Corp. 4.700% 01/03/2049 USD 347 607 371 691 0.04
1 150 000 Broadcom Corp. Via Broadcom Cayman Finance Ltd. 2.200%15/01/2021
USD 1 133 605 1 131 968 0.13
550 000 Broadcom Corp. Via Broadcom Cayman Finance Ltd. 3.625%15/01/2024
USD 547 207 548 586 0.07
4 600 000 Broadcom Corp. Via Broadcom Cayman Finance Ltd. 3.875%15/01/2027
USD 4 160 112 4 394 492 0.52
1 942 000 Brookfield Finance, Inc. 3.900% 25/01/2028 USD 1 936 087 1 878 062 0.22200 000 Brookfield Finance, Inc. 4.700% 20/09/2047 USD 192 880 192 229 0.02200 000 Brookfield Finance, Inc. 4.850% 29/03/2029 USD 199 648 205 637 0.02323 000 Buckeye Partners LP 5.600% 15/10/2044 USD 299 831 310 146 0.04350 000 BUPA Finance Plc. 5.000% 08/12/2026 GBP 530 040 500 952 0.06500 000 Burlington Northern Santa Fe LLC 4.050% 15/06/2048 USD 498 770 515 186 0.06750 000 Burlington Northern Santa Fe LLC 4.125% 15/06/2047 USD 803 887 778 615 0.09
1 600 000 Caisse Nationale de Reassurance Mutuelle Agricole Groupama3.375% 24/09/2028
EUR 1 858 615 1 803 724 0.21
3 250 000 Capital One 2.650% 08/08/2022 USD 3 228 963 3 211 188 0.383 250 000 Capital One Financial Corp. 3.050% 09/03/2022 USD 3 272 355 3 266 747 0.39
550 000 CBQ Finance Ltd. 2.875% 24/06/2019 USD 549 674 548 790 0.071 150 000 CBRE Services, Inc. 4.875% 01/03/2026 USD 1 233 836 1 209 415 0.141 800 000 Celanese US Hldg. LLC 1.125% 26/09/2023 EUR 2 104 298 2 038 350 0.24
341 000 Celgene Corp. 3.450% 15/11/2027 USD 338 265 336 874 0.04187 000 Celgene Corp. 4.550% 20/02/2048 USD 174 122 189 736 0.02
1 500 000 CEZ AS 4.500% 29/06/2020 EUR 1 892 440 1 777 004 0.213 250 000 Charter Communications Operating LLC Via Charter
Communications Operating Capital 3.579% 23/07/2020USD 3 272 773 3 273 626 0.39
4 150 000 Charter Communications Operating LLC Via CharterCommunications Operating Capital 4.464% 23/07/2022
USD 4 249 124 4 293 637 0.51
2 200 000 Charter Communications Operating LLC Via CharterCommunications Operating Capital 5.750% 01/04/2048
USD 2 193 642 2 298 089 0.27
550 000 China Cinda Finance 2017 I Ltd. 3.650% 09/03/2022 USD 556 110 553 543 0.07550 000 China Great Wall International Hldg. III Ltd. 2.625%
27/10/2021USD 542 748 538 213 0.06
2 400 000 Citibank NA FRN 19/02/2022 USD 2 400 000 2 409 605 0.281 080 000 Citibank NA 3.650% 23/01/2024 USD 1 078 586 1 114 337 0.134 250 000 Citigroup, Inc. 2.700% 27/10/2022 USD 4 228 158 4 210 451 0.501 250 000 Citigroup, Inc. FRN 24/07/2023 USD 1 246 562 1 242 027 0.153 500 000 Citigroup, Inc. FRN 24/01/2023 USD 3 500 000 3 512 090 0.421 350 000 Citigroup, Inc. - Reg 0.500% 29/01/2022 EUR 1 531 840 1 531 912 0.183 400 000 Citrix Systems, Inc. 4.500% 01/12/2027 USD 3 373 514 3 345 714 0.40
450 000 CME Group, Inc. 3.750% 15/06/2028 USD 449 934 473 275 0.06500 000 CME Group, Inc. 5.300% 15/09/2043 USD 633 256 612 381 0.07
3 020 000 CNAC HK Finbridge Co. Ltd. 4.625% 14/03/2023 USD 3 017 160 3 133 205 0.37350 000 CNOOC Finance 2013 Ltd. 4.250% 09/05/2043 USD 357 830 360 403 0.04800 000 CNP Assurances 2.750% 05/02/2029 EUR 901 439 936 853 0.11100 000 CNP Assurances FRN 30/09/2041 EUR 144 375 128 811 0.02650 000 Coca-Cola Co. 0.750% 22/09/2026 EUR 735 248 735 194 0.09625 000 Coca-Cola Co. 1.250% 08/03/2031 EUR 704 705 711 003 0.08
167Merrill Lynch Investment Solutions
Merrill Lynch Investment Solutions – Global Debt -Credit UCITS FundSchedule of Investments as at March 31, 2019 (cont.)(expressed in USD)
The accompanying notes form an integral part of these financial statements.
Audited annual report
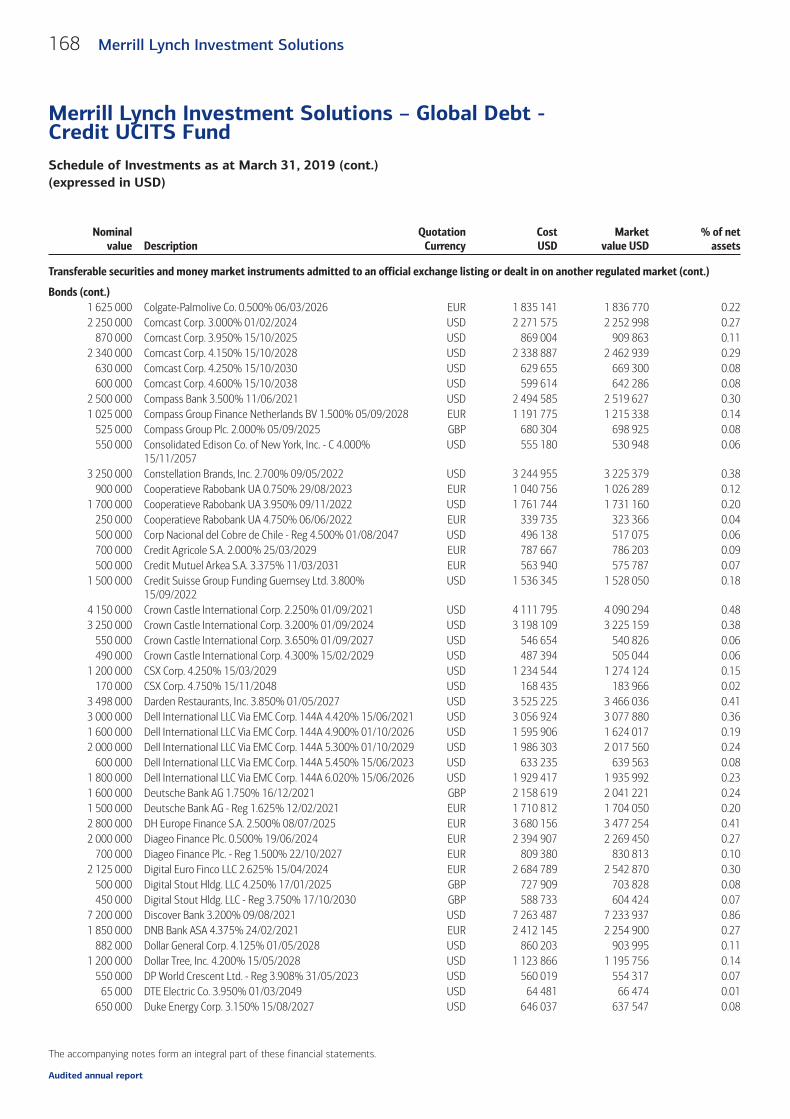
Nominalvalue Description
QuotationCurrency
CostUSD
Marketvalue USD
% of netassets
Transferable securities and money market instruments admitted to an official exchange listing or dealt in on another regulated market (cont.)
Bonds (cont.)1 625 000 Colgate-Palmolive Co. 0.500% 06/03/2026 EUR 1 835 141 1 836 770 0.222 250 000 Comcast Corp. 3.000% 01/02/2024 USD 2 271 575 2 252 998 0.27
870 000 Comcast Corp. 3.950% 15/10/2025 USD 869 004 909 863 0.112 340 000 Comcast Corp. 4.150% 15/10/2028 USD 2 338 887 2 462 939 0.29
630 000 Comcast Corp. 4.250% 15/10/2030 USD 629 655 669 300 0.08600 000 Comcast Corp. 4.600% 15/10/2038 USD 599 614 642 286 0.08
2 500 000 Compass Bank 3.500% 11/06/2021 USD 2 494 585 2 519 627 0.301 025 000 Compass Group Finance Netherlands BV 1.500% 05/09/2028 EUR 1 191 775 1 215 338 0.14
525 000 Compass Group Plc. 2.000% 05/09/2025 GBP 680 304 698 925 0.08550 000 Consolidated Edison Co. of New York, Inc. - C 4.000%
15/11/2057USD 555 180 530 948 0.06
3 250 000 Constellation Brands, Inc. 2.700% 09/05/2022 USD 3 244 955 3 225 379 0.38900 000 Cooperatieve Rabobank UA 0.750% 29/08/2023 EUR 1 040 756 1 026 289 0.12
1 700 000 Cooperatieve Rabobank UA 3.950% 09/11/2022 USD 1 761 744 1 731 160 0.20250 000 Cooperatieve Rabobank UA 4.750% 06/06/2022 EUR 339 735 323 366 0.04500 000 Corp Nacional del Cobre de Chile - Reg 4.500% 01/08/2047 USD 496 138 517 075 0.06700 000 Credit Agricole S.A. 2.000% 25/03/2029 EUR 787 667 786 203 0.09500 000 Credit Mutuel Arkea S.A. 3.375% 11/03/2031 EUR 563 940 575 787 0.07
1 500 000 Credit Suisse Group Funding Guernsey Ltd. 3.800%15/09/2022
USD 1 536 345 1 528 050 0.18
4 150 000 Crown Castle International Corp. 2.250% 01/09/2021 USD 4 111 795 4 090 294 0.483 250 000 Crown Castle International Corp. 3.200% 01/09/2024 USD 3 198 109 3 225 159 0.38
550 000 Crown Castle International Corp. 3.650% 01/09/2027 USD 546 654 540 826 0.06490 000 Crown Castle International Corp. 4.300% 15/02/2029 USD 487 394 505 044 0.06
1 200 000 CSX Corp. 4.250% 15/03/2029 USD 1 234 544 1 274 124 0.15170 000 CSX Corp. 4.750% 15/11/2048 USD 168 435 183 966 0.02
3 498 000 Darden Restaurants, Inc. 3.850% 01/05/2027 USD 3 525 225 3 466 036 0.413 000 000 Dell International LLC Via EMC Corp. 144A 4.420% 15/06/2021 USD 3 056 924 3 077 880 0.361 600 000 Dell International LLC Via EMC Corp. 144A 4.900% 01/10/2026 USD 1 595 906 1 624 017 0.192 000 000 Dell International LLC Via EMC Corp. 144A 5.300% 01/10/2029 USD 1 986 303 2 017 560 0.24
600 000 Dell International LLC Via EMC Corp. 144A 5.450% 15/06/2023 USD 633 235 639 563 0.081 800 000 Dell International LLC Via EMC Corp. 144A 6.020% 15/06/2026 USD 1 929 417 1 935 992 0.231 600 000 Deutsche Bank AG 1.750% 16/12/2021 GBP 2 158 619 2 041 221 0.241 500 000 Deutsche Bank AG - Reg 1.625% 12/02/2021 EUR 1 710 812 1 704 050 0.202 800 000 DH Europe Finance S.A. 2.500% 08/07/2025 EUR 3 680 156 3 477 254 0.412 000 000 Diageo Finance Plc. 0.500% 19/06/2024 EUR 2 394 907 2 269 450 0.27
700 000 Diageo Finance Plc. - Reg 1.500% 22/10/2027 EUR 809 380 830 813 0.102 125 000 Digital Euro Finco LLC 2.625% 15/04/2024 EUR 2 684 789 2 542 870 0.30
500 000 Digital Stout Hldg. LLC 4.250% 17/01/2025 GBP 727 909 703 828 0.08450 000 Digital Stout Hldg. LLC - Reg 3.750% 17/10/2030 GBP 588 733 604 424 0.07
7 200 000 Discover Bank 3.200% 09/08/2021 USD 7 263 487 7 233 937 0.861 850 000 DNB Bank ASA 4.375% 24/02/2021 EUR 2 412 145 2 254 900 0.27
882 000 Dollar General Corp. 4.125% 01/05/2028 USD 860 203 903 995 0.111 200 000 Dollar Tree, Inc. 4.200% 15/05/2028 USD 1 123 866 1 195 756 0.14
550 000 DP World Crescent Ltd. - Reg 3.908% 31/05/2023 USD 560 019 554 317 0.0765 000 DTE Electric Co. 3.950% 01/03/2049 USD 64 481 66 474 0.01
650 000 Duke Energy Corp. 3.150% 15/08/2027 USD 646 037 637 547 0.08
168 Merrill Lynch Investment Solutions
Merrill Lynch Investment Solutions – Global Debt -Credit UCITS FundSchedule of Investments as at March 31, 2019 (cont.)(expressed in USD)
The accompanying notes form an integral part of these financial statements.
Audited annual report
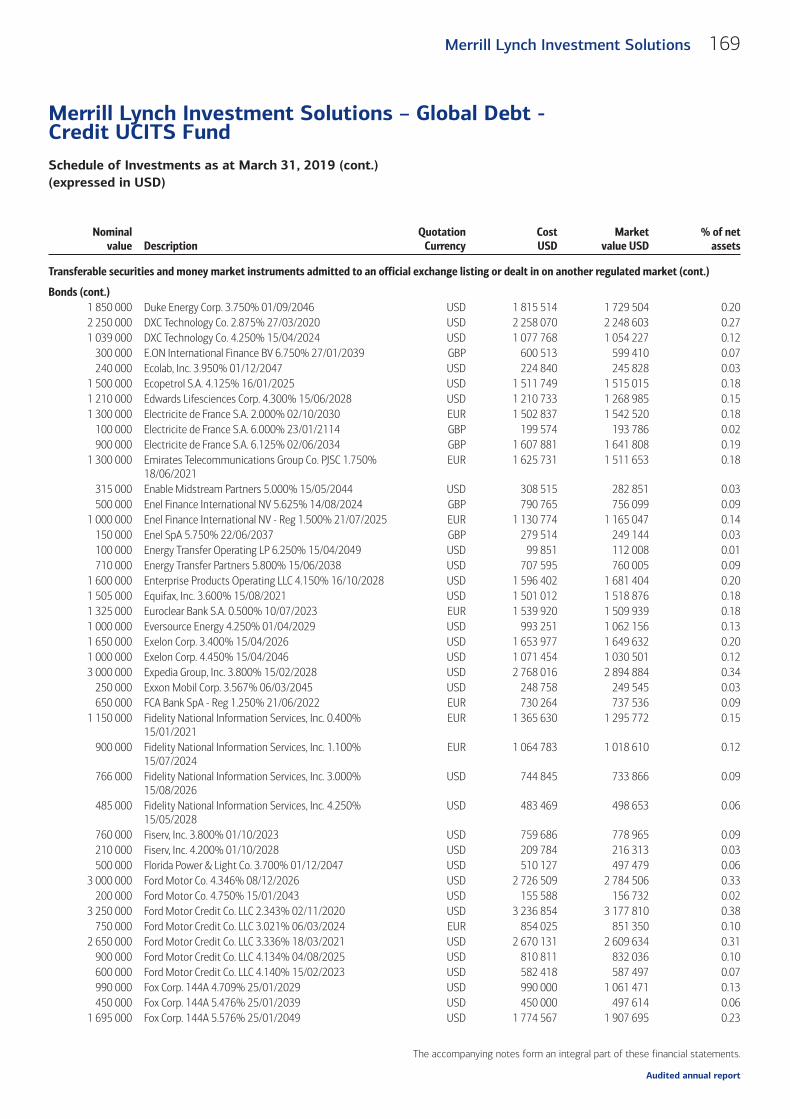
Nominalvalue Description
QuotationCurrency
CostUSD
Marketvalue USD
% of netassets
Transferable securities and money market instruments admitted to an official exchange listing or dealt in on another regulated market (cont.)
Bonds (cont.)1 850 000 Duke Energy Corp. 3.750% 01/09/2046 USD 1 815 514 1 729 504 0.202 250 000 DXC Technology Co. 2.875% 27/03/2020 USD 2 258 070 2 248 603 0.271 039 000 DXC Technology Co. 4.250% 15/04/2024 USD 1 077 768 1 054 227 0.12
300 000 E.ON International Finance BV 6.750% 27/01/2039 GBP 600 513 599 410 0.07240 000 Ecolab, Inc. 3.950% 01/12/2047 USD 224 840 245 828 0.03
1 500 000 Ecopetrol S.A. 4.125% 16/01/2025 USD 1 511 749 1 515 015 0.181 210 000 Edwards Lifesciences Corp. 4.300% 15/06/2028 USD 1 210 733 1 268 985 0.151 300 000 Electricite de France S.A. 2.000% 02/10/2030 EUR 1 502 837 1 542 520 0.18
100 000 Electricite de France S.A. 6.000% 23/01/2114 GBP 199 574 193 786 0.02900 000 Electricite de France S.A. 6.125% 02/06/2034 GBP 1 607 881 1 641 808 0.19
1 300 000 Emirates Telecommunications Group Co. PJSC 1.750%18/06/2021
EUR 1 625 731 1 511 653 0.18
315 000 Enable Midstream Partners 5.000% 15/05/2044 USD 308 515 282 851 0.03500 000 Enel Finance International NV 5.625% 14/08/2024 GBP 790 765 756 099 0.09
1 000 000 Enel Finance International NV - Reg 1.500% 21/07/2025 EUR 1 130 774 1 165 047 0.14150 000 Enel SpA 5.750% 22/06/2037 GBP 279 514 249 144 0.03100 000 Energy Transfer Operating LP 6.250% 15/04/2049 USD 99 851 112 008 0.01710 000 Energy Transfer Partners 5.800% 15/06/2038 USD 707 595 760 005 0.09
1 600 000 Enterprise Products Operating LLC 4.150% 16/10/2028 USD 1 596 402 1 681 404 0.201 505 000 Equifax, Inc. 3.600% 15/08/2021 USD 1 501 012 1 518 876 0.181 325 000 Euroclear Bank S.A. 0.500% 10/07/2023 EUR 1 539 920 1 509 939 0.181 000 000 Eversource Energy 4.250% 01/04/2029 USD 993 251 1 062 156 0.131 650 000 Exelon Corp. 3.400% 15/04/2026 USD 1 653 977 1 649 632 0.201 000 000 Exelon Corp. 4.450% 15/04/2046 USD 1 071 454 1 030 501 0.123 000 000 Expedia Group, Inc. 3.800% 15/02/2028 USD 2 768 016 2 894 884 0.34
250 000 Exxon Mobil Corp. 3.567% 06/03/2045 USD 248 758 249 545 0.03650 000 FCA Bank SpA - Reg 1.250% 21/06/2022 EUR 730 264 737 536 0.09
1 150 000 Fidelity National Information Services, Inc. 0.400%15/01/2021
EUR 1 365 630 1 295 772 0.15
900 000 Fidelity National Information Services, Inc. 1.100%15/07/2024
EUR 1 064 783 1 018 610 0.12
766 000 Fidelity National Information Services, Inc. 3.000%15/08/2026
USD 744 845 733 866 0.09
485 000 Fidelity National Information Services, Inc. 4.250%15/05/2028
USD 483 469 498 653 0.06
760 000 Fiserv, Inc. 3.800% 01/10/2023 USD 759 686 778 965 0.09210 000 Fiserv, Inc. 4.200% 01/10/2028 USD 209 784 216 313 0.03500 000 Florida Power & Light Co. 3.700% 01/12/2047 USD 510 127 497 479 0.06
3 000 000 Ford Motor Co. 4.346% 08/12/2026 USD 2 726 509 2 784 506 0.33200 000 Ford Motor Co. 4.750% 15/01/2043 USD 155 588 156 732 0.02
3 250 000 Ford Motor Credit Co. LLC 2.343% 02/11/2020 USD 3 236 854 3 177 810 0.38750 000 Ford Motor Credit Co. LLC 3.021% 06/03/2024 EUR 854 025 851 350 0.10
2 650 000 Ford Motor Credit Co. LLC 3.336% 18/03/2021 USD 2 670 131 2 609 634 0.31900 000 Ford Motor Credit Co. LLC 4.134% 04/08/2025 USD 810 811 832 036 0.10600 000 Ford Motor Credit Co. LLC 4.140% 15/02/2023 USD 582 418 587 497 0.07990 000 Fox Corp. 144A 4.709% 25/01/2029 USD 990 000 1 061 471 0.13450 000 Fox Corp. 144A 5.476% 25/01/2039 USD 450 000 497 614 0.06
1 695 000 Fox Corp. 144A 5.576% 25/01/2049 USD 1 774 567 1 907 695 0.23
169Merrill Lynch Investment Solutions
Merrill Lynch Investment Solutions – Global Debt -Credit UCITS FundSchedule of Investments as at March 31, 2019 (cont.)(expressed in USD)
The accompanying notes form an integral part of these financial statements.
Audited annual report

Nominalvalue Description
QuotationCurrency
CostUSD
Marketvalue USD
% of netassets
Transferable securities and money market instruments admitted to an official exchange listing or dealt in on another regulated market (cont.)
Bonds (cont.)2 000 000 Gazprom OAO Via Gaz Capital S.A. - Reg 4.950% 19/07/2022 USD 2 063 846 2 055 628 0.24
182 000 Geberit International BV 0.688% 30/03/2021 EUR 215 096 206 737 0.02300 000 General Motors Co 5.200% 01/04/2045 USD 266 487 266 486 0.03
2 750 000 General Motors Financial Co., Inc. 3.200% 06/07/2021 USD 2 773 086 2 737 652 0.321 295 000 General Motors Financial Co., Inc. 4.150% 19/06/2023 USD 1 293 384 1 307 145 0.152 530 000 General Motors Financial Co., Inc. 4.200% 06/11/2021 USD 2 529 861 2 574 013 0.303 396 000 General Motors Financial Co., Inc. 4.350% 17/01/2027 USD 3 158 459 3 300 574 0.391 435 000 General Motors Financial Co., Inc. 5.650% 17/01/2029 USD 1 434 367 1 483 721 0.181 700 000 GKN Hldg. Ltd. 5.375% 19/09/2022 GBP 2 519 690 2 369 190 0.281 800 000 GlaxoSmithKline Capital Plc. 3.375% 01/06/2029 USD 1 781 082 1 816 799 0.21
800 000 GlaxoSmithKline Capital, Inc. 6.375% 15/05/2038 USD 1 058 552 1 054 668 0.12550 000 Glencore Canada Financial Corp. 7.375% 27/05/2020 GBP 786 695 762 577 0.09
1 750 000 Glencore Finance Europe Ltd. 2.750% 01/04/2021 EUR 2 185 459 2 056 210 0.242 000 000 Glencore Finance Europe Ltd. 3.375% 30/09/2020 EUR 2 569 210 2 355 559 0.281 167 000 GLP Capital LP Via GLP Financing II, Inc. 5.250% 01/06/2025 USD 1 188 592 1 222 432 0.141 985 000 GLP Capital LP Via GLP Financing II, Inc. 5.300% 15/01/2029 USD 1 987 013 2 071 546 0.251 000 000 GLP Capital LP Via GLP Financing II, Inc. 5.375% 01/11/2023 USD 1 025 189 1 052 690 0.12
841 000 GLP Capital LP Via GLP Financing II, Inc. 5.375% 15/04/2026 USD 845 964 878 761 0.10436 000 GLP Capital LP Via GLP Financing II, Inc. 5.750% 01/06/2028 USD 451 280 468 133 0.06400 000 Goldman Sachs Group, Inc. FRN 31/10/2022 USD 389 574 396 441 0.05
1 025 000 Goldman Sachs Group, Inc. 3.125% 25/07/2029 GBP 1 327 258 1 365 941 0.164 500 000 Goldman Sachs Group, Inc. 3.200% 23/02/2023 USD 4 466 878 4 507 377 0.532 250 000 Goldman Sachs Group, Inc. FRN 29/09/2025 USD 2 244 616 2 221 093 0.262 150 000 Goldman Sachs Group, Inc. 3.625% 22/01/2023 USD 2 198 507 2 187 016 0.262 250 000 Goldman Sachs Group, Inc. FRN 31/10/2038 USD 2 288 251 2 148 425 0.25
500 000 Goldman Sachs Group, Inc. 4.750% 21/10/2045 USD 524 405 531 775 0.061 500 000 Goldman Sachs Group, Inc. 5.125% 23/10/2019 EUR 1 821 659 1 732 782 0.211 550 000 Goodman Australia Finance Pty Ltd. - Reg 1.375% 27/09/2025 EUR 1 743 943 1 749 053 0.211 000 000 Grand City Properties S.A. 1.500% 22/02/2027 EUR 1 166 900 1 109 888 0.13
355 000 Harris Corp. 4.400% 15/06/2028 USD 354 967 373 347 0.04400 000 HCA, Inc. 4.750% 01/05/2023 USD 414 385 419 151 0.05
1 740 000 HCA, Inc. 5.000% 15/03/2024 USD 1 805 297 1 844 735 0.221 760 000 HCA, Inc. 5.250% 15/06/2026 USD 1 841 767 1 885 784 0.221 200 000 HCA, Inc. 5.500% 15/06/2047 USD 1 253 005 1 275 779 0.15
250 000 Heathrow Funding Ltd. 2.750% 09/08/2049 GBP 310 493 312 048 0.04500 000 Heathrow Funding Ltd. 6.000% 20/03/2020 GBP 703 200 679 432 0.08550 000 Heathrow Funding Ltd. 6.750% 03/12/2026 GBP 963 238 947 124 0.11
1 000 000 Hewlett Packard Enterprise Co. 4.400% 15/10/2022 USD 1 035 847 1 046 120 0.123 780 000 HollyFrontier Corp. 5.875% 01/04/2026 USD 4 141 598 4 044 729 0.48
650 000 Home Depot, Inc. 5.875% 16/12/2036 USD 852 658 817 893 0.102 000 000 Honeywell International, Inc. 1.300% 22/02/2023 EUR 2 386 385 2 355 283 0.28
266 000 Hospitality Properties Trust 3.950% 15/01/2028 USD 258 452 243 745 0.034 000 000 Hospitality Properties Trust 4.500% 15/06/2023 USD 4 143 552 4 049 586 0.481 675 000 HSBC Hldg. Plc. FRN 27/06/2023 GBP 2 225 573 2 193 780 0.26
350 000 HSBC Hldg. Plc. 2.625% 16/08/2028 GBP 470 539 455 374 0.05445 000 HSBC Hldg. Plc. FRN 11/03/2025 USD 445 000 451 089 0.05
1 359 000 HSBC Hldg. Plc. FRN 12/09/2026 USD 1 359 000 1 401 448 0.17
170 Merrill Lynch Investment Solutions
Merrill Lynch Investment Solutions – Global Debt -Credit UCITS FundSchedule of Investments as at March 31, 2019 (cont.)(expressed in USD)
The accompanying notes form an integral part of these financial statements.
Audited annual report

Nominalvalue Description
QuotationCurrency
CostUSD
Marketvalue USD
% of netassets
Transferable securities and money market instruments admitted to an official exchange listing or dealt in on another regulated market (cont.)
Bonds (cont.)2 550 000 HSBC Hldg. Plc. 5.250% 14/03/2044 USD 2 960 687 2 789 152 0.33
425 000 HSBC Hldg. Plc. 6.000% 29/03/2040 GBP 784 388 723 064 0.092 250 000 HSBC USA, Inc. 5.000% 27/09/2020 USD 2 326 788 2 314 791 0.27
550 000 Huarong Finance II Co. Ltd. 3.250% 03/06/2021 USD 549 795 546 406 0.06800 000 Hudson Pacific Properties LP 4.650% 01/04/2029 USD 789 400 814 973 0.10610 000 Humana, Inc. 2.900% 15/12/2022 USD 609 229 605 570 0.07505 000 Huntington National Bank 3.125% 01/04/2022 USD 504 554 508 782 0.06300 000 Iberdrola International BV - Reg FRN Perpetual EUR 342 300 351 153 0.04550 000 ICBCIL Finance Co. Ltd. 3.000% 05/04/2020 USD 550 122 546 762 0.06
1 055 000 IHS Markit Ltd. 4.750% 01/08/2028 USD 1 051 111 1 103 857 0.131 600 000 Imperial Brands Finance Plc. 2.250% 26/02/2021 EUR 1 968 639 1 861 466 0.221 500 000 Imperial Brands Finance Plc. 9.000% 17/02/2022 GBP 2 431 928 2 325 511 0.282 550 000 Imperial Brands Finance Plc. - Reg 2.125% 12/02/2027 EUR 2 873 277 2 870 225 0.34
800 000 Industrial & Commercial Bank of China Ltd. 2.635%26/05/2021
USD 796 606 790 127 0.09
2 100 000 Infineon Technologies AG 1.500% 10/03/2022 EUR 2 580 198 2 444 520 0.291 950 000 Informa Plc. 1.500% 05/07/2023 EUR 2 256 252 2 240 151 0.261 155 000 ING Groep NV 4.100% 02/10/2023 USD 1 154 771 1 187 143 0.14
350 000 innogy Finance BV 6.125% 06/07/2039 GBP 668 517 657 957 0.08550 000 Intercontinental Exchange, Inc. 3.100% 15/09/2027 USD 549 938 544 512 0.06
1 115 000 Intercontinental Exchange, Inc. 4.250% 21/09/2048 USD 1 106 134 1 168 388 0.141 700 000 InterContinental Hotels Group Plc. 3.875% 28/11/2022 GBP 2 446 904 2 366 186 0.28
350 000 Interstate Power & Light Co. 3.600% 01/04/2029 USD 349 534 350 902 0.04800 000 Israel Electric Corp. Ltd. 144A 5.000% 12/11/2024 USD 848 244 844 000 0.10
1 700 000 JAB Hldg. BV 1.500% 24/11/2021 EUR 2 085 243 1 967 899 0.231 400 000 Jabil, Inc. 3.950% 12/01/2028 USD 1 220 352 1 306 200 0.151 700 000 Johnson & Johnson 3.625% 03/03/2037 USD 1 759 844 1 717 844 0.202 000 000 Johnson & Johnson 3.700% 01/03/2046 USD 1 908 889 2 019 984 0.24
900 000 JPMorgan Chase & Co. 2.295% 15/08/2021 USD 879 776 889 558 0.112 250 000 JPMorgan Chase & Co. 3.625% 13/05/2024 USD 2 322 662 2 312 461 0.272 500 000 JPMorgan Chase & Co. FRN 23/07/2024 USD 2 500 000 2 566 975 0.301 750 000 JPMorgan Chase & Co. FRN 24/07/2038 USD 1 769 819 1 715 306 0.202 310 000 JPMorgan Chase & Co. FRN 29/01/2027 USD 2 310 000 2 385 504 0.28
790 000 JPMorgan Chase & Co. FRN 23/04/2029 USD 790 000 811 426 0.101 700 000 JPMorgan Chase & Co. FRN 05/12/2024 USD 1 700 000 1 764 231 0.21
350 000 KazMunayGas National Co. JSC - Reg 4.750% 19/04/2027 USD 363 137 358 995 0.042 000 000 Keurig Dr Pepper, Inc. 144A 3.551% 25/05/2021 USD 2 000 257 2 021 527 0.242 260 000 Keurig Dr Pepper, Inc. 144A 4.057% 25/05/2023 USD 2 262 490 2 324 923 0.27
800 000 Keurig Dr Pepper, Inc. 144A 5.085% 25/05/2048 USD 771 862 821 303 0.10550 000 KeyBank NA 3.300% 01/02/2022 USD 549 766 559 067 0.07529 000 Keysight Technologies, Inc. 4.600% 06/04/2027 USD 542 187 546 824 0.06560 000 KLA-Tencor Corp. 4.100% 15/03/2029 USD 557 332 569 938 0.07750 000 Korea Gas Corp. - Reg 1.875% 18/07/2021 USD 722 610 732 319 0.09
2 250 000 Kreditanstalt fuer Wiederaufbau 3.200% 11/09/2026 AUD 1 732 786 1 709 581 0.20700 000 Kreditanstalt fuer Wiederaufbau 5.000% 09/06/2036 GBP 1 363 828 1 375 730 0.16
2 250 000 Lear Corp. 5.375% 15/03/2024 USD 2 362 007 2 312 261 0.27175 000 Legal & General Group Plc. - Reg FRN 14/11/2048 GBP 228 924 241 673 0.03
171Merrill Lynch Investment Solutions
Merrill Lynch Investment Solutions – Global Debt -Credit UCITS FundSchedule of Investments as at March 31, 2019 (cont.)(expressed in USD)
The accompanying notes form an integral part of these financial statements.
Audited annual report

Nominalvalue Description
QuotationCurrency
CostUSD
Marketvalue USD
% of netassets
Transferable securities and money market instruments admitted to an official exchange listing or dealt in on another regulated market (cont.)
Bonds (cont.)350 000 Liberty Living Finance Plc. 2.625% 28/11/2024 GBP 469 466 455 492 0.05950 000 Lloyds Banking Group Plc. 3.000% 11/01/2022 USD 947 417 945 308 0.11
2 800 000 Lloyds Banking Group Plc. 3.100% 06/07/2021 USD 2 788 469 2 800 823 0.332 200 000 Lloyds Banking Group Plc. 4.050% 16/08/2023 USD 2 199 480 2 243 306 0.271 500 000 Lloyds Banking Group Plc. 4.500% 04/11/2024 USD 1 548 316 1 524 244 0.182 000 000 LVMH Moet Hennessy Louis Vuitton SE 0.000% 26/05/2020 EUR 2 373 385 2 248 323 0.272 000 000 LVMH Moet Hennessy Louis Vuitton SE 0.750% 26/05/2024 EUR 2 404 500 2 314 133 0.27
700 000 LVMH Moet Hennessy Louis Vuitton SE - Reg 0.125%28/02/2023
EUR 791 710 789 242 0.09
3 000 000 LYB International Finance II BV 1.875% 02/03/2022 EUR 3 836 258 3 479 678 0.411 000 000 Malaysia Sukuk Global Bhd - Reg 3.179% 27/04/2026 USD 979 120 1 004 800 0.12
600 000 Marsh & McLennan Cos, Inc. 1.979% 21/03/2030 EUR 678 270 689 938 0.082 290 000 Marsh & McLennan Cos, Inc. 4.200% 01/03/2048 USD 2 287 750 2 271 562 0.271 150 000 Marsh & McLennan Cos, Inc. 4.750% 15/03/2039 USD 1 148 987 1 244 479 0.15
670 000 Marsh & McLennan Cos., Inc. 4.900% 15/03/2049 USD 669 288 733 629 0.09350 000 Masco Corp. 4.450% 01/04/2025 USD 369 259 359 408 0.04
3 150 000 Mastercard, Inc. 1.100% 01/12/2022 EUR 3 914 864 3 656 120 0.432 250 000 Mastercard, Inc. 2.100% 01/12/2027 EUR 2 908 765 2 822 720 0.331 200 000 Mastercard, Inc. 3.800% 21/11/2046 USD 1 252 780 1 240 135 0.15
550 000 Maxim Integrated Products, Inc. 3.450% 15/06/2027 USD 554 741 530 061 0.06600 000 McDonald's Corp. 0.900% 15/06/2026 EUR 671 158 677 095 0.08500 000 McDonald's Corp. 1.600% 15/03/2031 EUR 559 568 569 658 0.07450 000 McDonald's Corp. 4.700% 09/12/2035 USD 500 486 482 311 0.06
1 100 000 McDonald's Corp. - Reg 1.750% 03/05/2028 EUR 1 276 724 1 302 828 0.15500 000 Mediobanca Banca di Credito Finanziario SpA 0.625%
27/09/2022EUR 598 337 554 401 0.07
1 800 000 Mediobanca Banca di Credito Finanziario SpA 0.750%17/02/2020
EUR 2 146 064 2 031 454 0.24
800 000 Mediobanca Banca di Credito Finanziario SpA 1.625%07/01/2025
EUR 901 474 903 064 0.11
750 000 Medtronic Global Hldg. SCA 1.125% 07/03/2027 EUR 845 341 866 938 0.10475 000 Medtronic Global Hldg. SCA 1.625% 07/03/2031 EUR 533 162 557 295 0.07123 000 Medtronic, Inc. 4.625% 15/03/2045 USD 131 669 140 606 0.02
1 105 000 Merck & Co., Inc. 0.500% 02/11/2024 EUR 1 253 491 1 262 822 0.15207 000 Mexico City Airport Trust 5.500% 31/10/2046 USD 207 575 190 978 0.02700 000 mFinance France S.A. 1.398% 26/09/2020 EUR 843 487 798 436 0.09600 000 Microsoft Corp. 4.100% 06/02/2037 USD 656 231 652 585 0.08
1 800 000 Mitsubishi UFJ Financial Group, Inc. 3.455% 02/03/2023 USD 1 800 000 1 824 642 0.22700 000 Molnlycke Hldg. AB 1.875% 28/02/2025 EUR 855 085 803 405 0.10
1 290 000 Mondelez International, Inc. 3.625% 13/02/2026 USD 1 283 187 1 307 510 0.15650 000 Moody's Corp. 2.625% 15/01/2023 USD 647 383 640 515 0.08
2 250 000 Morgan Stanley 2.750% 19/05/2022 USD 2 251 171 2 236 400 0.263 000 000 Morgan Stanley 3.125% 23/01/2023 USD 2 994 851 3 009 150 0.36
950 000 Morgan Stanley FRN 22/07/2038 USD 959 832 933 220 0.11670 000 Morgan Stanley FRN 23/01/2030 USD 670 000 705 662 0.08
1 550 000 Motorola Solutions, Inc. 4.000% 01/09/2024 USD 1 579 783 1 579 002 0.191 985 000 Motorola Solutions, Inc. 4.600% 23/02/2028 USD 1 942 657 2 001 210 0.24
172 Merrill Lynch Investment Solutions
Merrill Lynch Investment Solutions – Global Debt -Credit UCITS FundSchedule of Investments as at March 31, 2019 (cont.)(expressed in USD)
The accompanying notes form an integral part of these financial statements.
Audited annual report
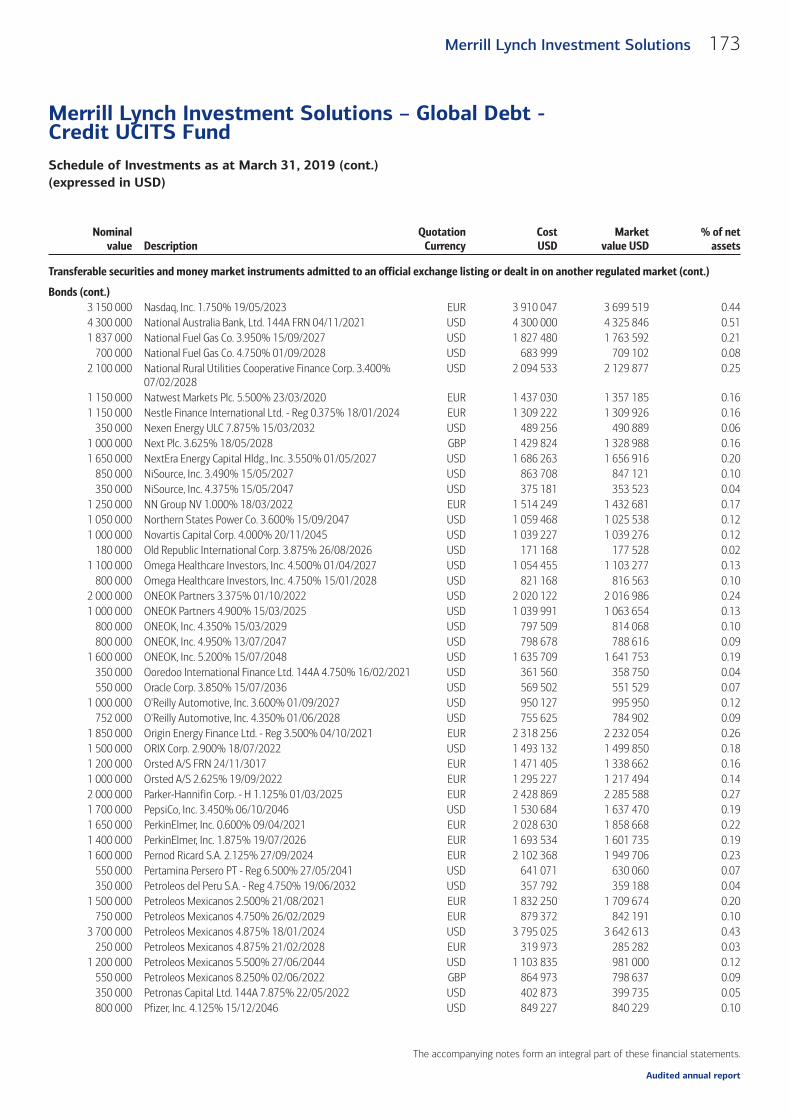
Nominalvalue Description
QuotationCurrency
CostUSD
Marketvalue USD
% of netassets
Transferable securities and money market instruments admitted to an official exchange listing or dealt in on another regulated market (cont.)
Bonds (cont.)3 150 000 Nasdaq, Inc. 1.750% 19/05/2023 EUR 3 910 047 3 699 519 0.444 300 000 National Australia Bank, Ltd. 144A FRN 04/11/2021 USD 4 300 000 4 325 846 0.511 837 000 National Fuel Gas Co. 3.950% 15/09/2027 USD 1 827 480 1 763 592 0.21
700 000 National Fuel Gas Co. 4.750% 01/09/2028 USD 683 999 709 102 0.082 100 000 National Rural Utilities Cooperative Finance Corp. 3.400%
07/02/2028USD 2 094 533 2 129 877 0.25
1 150 000 Natwest Markets Plc. 5.500% 23/03/2020 EUR 1 437 030 1 357 185 0.161 150 000 Nestle Finance International Ltd. - Reg 0.375% 18/01/2024 EUR 1 309 222 1 309 926 0.16
350 000 Nexen Energy ULC 7.875% 15/03/2032 USD 489 256 490 889 0.061 000 000 Next Plc. 3.625% 18/05/2028 GBP 1 429 824 1 328 988 0.161 650 000 NextEra Energy Capital Hldg., Inc. 3.550% 01/05/2027 USD 1 686 263 1 656 916 0.20
850 000 NiSource, Inc. 3.490% 15/05/2027 USD 863 708 847 121 0.10350 000 NiSource, Inc. 4.375% 15/05/2047 USD 375 181 353 523 0.04
1 250 000 NN Group NV 1.000% 18/03/2022 EUR 1 514 249 1 432 681 0.171 050 000 Northern States Power Co. 3.600% 15/09/2047 USD 1 059 468 1 025 538 0.121 000 000 Novartis Capital Corp. 4.000% 20/11/2045 USD 1 039 227 1 039 276 0.12
180 000 Old Republic International Corp. 3.875% 26/08/2026 USD 171 168 177 528 0.021 100 000 Omega Healthcare Investors, Inc. 4.500% 01/04/2027 USD 1 054 455 1 103 277 0.13
800 000 Omega Healthcare Investors, Inc. 4.750% 15/01/2028 USD 821 168 816 563 0.102 000 000 ONEOK Partners 3.375% 01/10/2022 USD 2 020 122 2 016 986 0.241 000 000 ONEOK Partners 4.900% 15/03/2025 USD 1 039 991 1 063 654 0.13
800 000 ONEOK, Inc. 4.350% 15/03/2029 USD 797 509 814 068 0.10800 000 ONEOK, Inc. 4.950% 13/07/2047 USD 798 678 788 616 0.09
1 600 000 ONEOK, Inc. 5.200% 15/07/2048 USD 1 635 709 1 641 753 0.19350 000 Ooredoo International Finance Ltd. 144A 4.750% 16/02/2021 USD 361 560 358 750 0.04550 000 Oracle Corp. 3.850% 15/07/2036 USD 569 502 551 529 0.07
1 000 000 O'Reilly Automotive, Inc. 3.600% 01/09/2027 USD 950 127 995 950 0.12752 000 O'Reilly Automotive, Inc. 4.350% 01/06/2028 USD 755 625 784 902 0.09
1 850 000 Origin Energy Finance Ltd. - Reg 3.500% 04/10/2021 EUR 2 318 256 2 232 054 0.261 500 000 ORIX Corp. 2.900% 18/07/2022 USD 1 493 132 1 499 850 0.181 200 000 Orsted A/S FRN 24/11/3017 EUR 1 471 405 1 338 662 0.161 000 000 Orsted A/S 2.625% 19/09/2022 EUR 1 295 227 1 217 494 0.142 000 000 Parker-Hannifin Corp. - H 1.125% 01/03/2025 EUR 2 428 869 2 285 588 0.271 700 000 PepsiCo, Inc. 3.450% 06/10/2046 USD 1 530 684 1 637 470 0.191 650 000 PerkinElmer, Inc. 0.600% 09/04/2021 EUR 2 028 630 1 858 668 0.221 400 000 PerkinElmer, Inc. 1.875% 19/07/2026 EUR 1 693 534 1 601 735 0.191 600 000 Pernod Ricard S.A. 2.125% 27/09/2024 EUR 2 102 368 1 949 706 0.23
550 000 Pertamina Persero PT - Reg 6.500% 27/05/2041 USD 641 071 630 060 0.07350 000 Petroleos del Peru S.A. - Reg 4.750% 19/06/2032 USD 357 792 359 188 0.04
1 500 000 Petroleos Mexicanos 2.500% 21/08/2021 EUR 1 832 250 1 709 674 0.20750 000 Petroleos Mexicanos 4.750% 26/02/2029 EUR 879 372 842 191 0.10
3 700 000 Petroleos Mexicanos 4.875% 18/01/2024 USD 3 795 025 3 642 613 0.43250 000 Petroleos Mexicanos 4.875% 21/02/2028 EUR 319 973 285 282 0.03
1 200 000 Petroleos Mexicanos 5.500% 27/06/2044 USD 1 103 835 981 000 0.12550 000 Petroleos Mexicanos 8.250% 02/06/2022 GBP 864 973 798 637 0.09350 000 Petronas Capital Ltd. 144A 7.875% 22/05/2022 USD 402 873 399 735 0.05800 000 Pfizer, Inc. 4.125% 15/12/2046 USD 849 227 840 229 0.10
173Merrill Lynch Investment Solutions
Merrill Lynch Investment Solutions – Global Debt -Credit UCITS FundSchedule of Investments as at March 31, 2019 (cont.)(expressed in USD)
The accompanying notes form an integral part of these financial statements.
Audited annual report
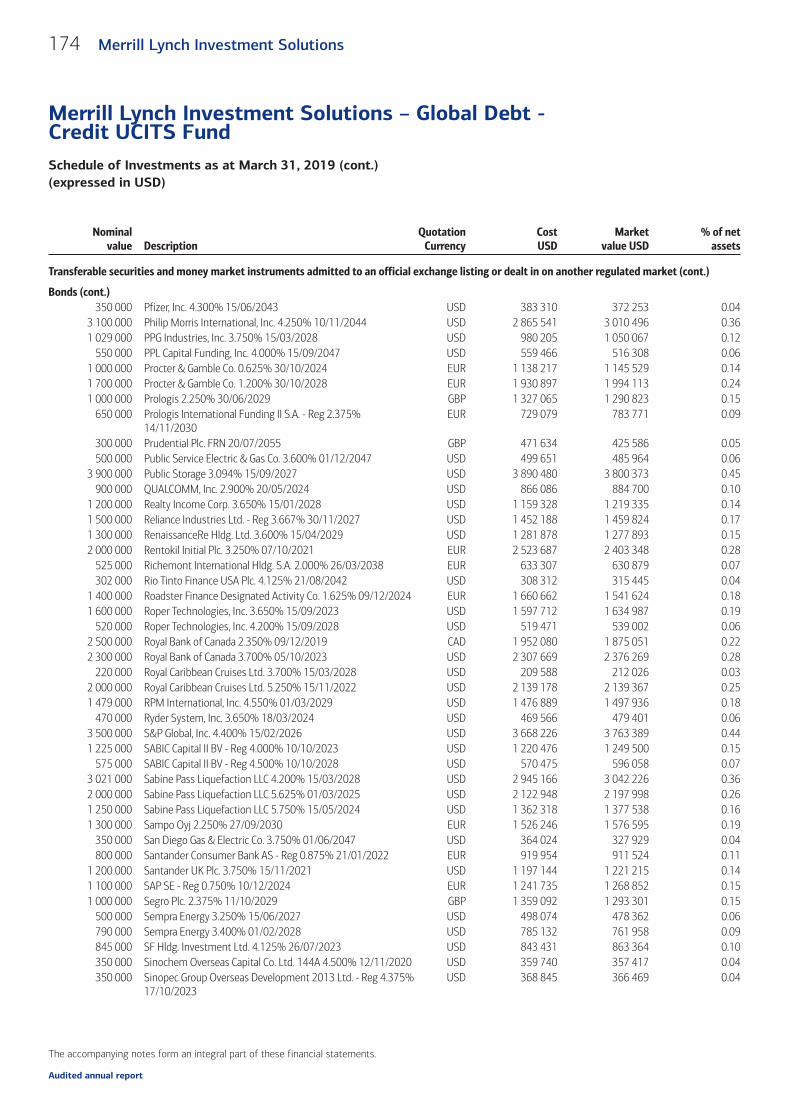
Nominalvalue Description
QuotationCurrency
CostUSD
Marketvalue USD
% of netassets
Transferable securities and money market instruments admitted to an official exchange listing or dealt in on another regulated market (cont.)
Bonds (cont.)350 000 Pfizer, Inc. 4.300% 15/06/2043 USD 383 310 372 253 0.04
3 100 000 Philip Morris International, Inc. 4.250% 10/11/2044 USD 2 865 541 3 010 496 0.361 029 000 PPG Industries, Inc. 3.750% 15/03/2028 USD 980 205 1 050 067 0.12
550 000 PPL Capital Funding, Inc. 4.000% 15/09/2047 USD 559 466 516 308 0.061 000 000 Procter & Gamble Co. 0.625% 30/10/2024 EUR 1 138 217 1 145 529 0.141 700 000 Procter & Gamble Co. 1.200% 30/10/2028 EUR 1 930 897 1 994 113 0.241 000 000 Prologis 2.250% 30/06/2029 GBP 1 327 065 1 290 823 0.15
650 000 Prologis International Funding II S.A. - Reg 2.375%14/11/2030
EUR 729 079 783 771 0.09
300 000 Prudential Plc. FRN 20/07/2055 GBP 471 634 425 586 0.05500 000 Public Service Electric & Gas Co. 3.600% 01/12/2047 USD 499 651 485 964 0.06
3 900 000 Public Storage 3.094% 15/09/2027 USD 3 890 480 3 800 373 0.45900 000 QUALCOMM, Inc. 2.900% 20/05/2024 USD 866 086 884 700 0.10
1 200 000 Realty Income Corp. 3.650% 15/01/2028 USD 1 159 328 1 219 335 0.141 500 000 Reliance Industries Ltd. - Reg 3.667% 30/11/2027 USD 1 452 188 1 459 824 0.171 300 000 RenaissanceRe Hldg. Ltd. 3.600% 15/04/2029 USD 1 281 878 1 277 893 0.152 000 000 Rentokil Initial Plc. 3.250% 07/10/2021 EUR 2 523 687 2 403 348 0.28
525 000 Richemont International Hldg. S.A. 2.000% 26/03/2038 EUR 633 307 630 879 0.07302 000 Rio Tinto Finance USA Plc. 4.125% 21/08/2042 USD 308 312 315 445 0.04
1 400 000 Roadster Finance Designated Activity Co. 1.625% 09/12/2024 EUR 1 660 662 1 541 624 0.181 600 000 Roper Technologies, Inc. 3.650% 15/09/2023 USD 1 597 712 1 634 987 0.19
520 000 Roper Technologies, Inc. 4.200% 15/09/2028 USD 519 471 539 002 0.062 500 000 Royal Bank of Canada 2.350% 09/12/2019 CAD 1 952 080 1 875 051 0.222 300 000 Royal Bank of Canada 3.700% 05/10/2023 USD 2 307 669 2 376 269 0.28
220 000 Royal Caribbean Cruises Ltd. 3.700% 15/03/2028 USD 209 588 212 026 0.032 000 000 Royal Caribbean Cruises Ltd. 5.250% 15/11/2022 USD 2 139 178 2 139 367 0.251 479 000 RPM International, Inc. 4.550% 01/03/2029 USD 1 476 889 1 497 936 0.18
470 000 Ryder System, Inc. 3.650% 18/03/2024 USD 469 566 479 401 0.063 500 000 S&P Global, Inc. 4.400% 15/02/2026 USD 3 668 226 3 763 389 0.441 225 000 SABIC Capital II BV - Reg 4.000% 10/10/2023 USD 1 220 476 1 249 500 0.15
575 000 SABIC Capital II BV - Reg 4.500% 10/10/2028 USD 570 475 596 058 0.073 021 000 Sabine Pass Liquefaction LLC 4.200% 15/03/2028 USD 2 945 166 3 042 226 0.362 000 000 Sabine Pass Liquefaction LLC 5.625% 01/03/2025 USD 2 122 948 2 197 998 0.261 250 000 Sabine Pass Liquefaction LLC 5.750% 15/05/2024 USD 1 362 318 1 377 538 0.161 300 000 Sampo Oyj 2.250% 27/09/2030 EUR 1 526 246 1 576 595 0.19
350 000 San Diego Gas & Electric Co. 3.750% 01/06/2047 USD 364 024 327 929 0.04800 000 Santander Consumer Bank AS - Reg 0.875% 21/01/2022 EUR 919 954 911 524 0.11
1 200 000 Santander UK Plc. 3.750% 15/11/2021 USD 1 197 144 1 221 215 0.141 100 000 SAP SE - Reg 0.750% 10/12/2024 EUR 1 241 735 1 268 852 0.151 000 000 Segro Plc. 2.375% 11/10/2029 GBP 1 359 092 1 293 301 0.15
500 000 Sempra Energy 3.250% 15/06/2027 USD 498 074 478 362 0.06790 000 Sempra Energy 3.400% 01/02/2028 USD 785 132 761 958 0.09845 000 SF Hldg. Investment Ltd. 4.125% 26/07/2023 USD 843 431 863 364 0.10350 000 Sinochem Overseas Capital Co. Ltd. 144A 4.500% 12/11/2020 USD 359 740 357 417 0.04350 000 Sinopec Group Overseas Development 2013 Ltd. - Reg 4.375%
17/10/2023USD 368 845 366 469 0.04
174 Merrill Lynch Investment Solutions
Merrill Lynch Investment Solutions – Global Debt -Credit UCITS FundSchedule of Investments as at March 31, 2019 (cont.)(expressed in USD)
The accompanying notes form an integral part of these financial statements.
Audited annual report

Nominalvalue Description
QuotationCurrency
CostUSD
Marketvalue USD
% of netassets
Transferable securities and money market instruments admitted to an official exchange listing or dealt in on another regulated market (cont.)
Bonds (cont.)350 000 Sinopec Group Overseas Development 2014 Ltd. - Reg 4.375%
10/04/2024USD 368 369 367 152 0.04
1 250 000 Sky Plc. 2.875% 24/11/2020 GBP 1 726 757 1 671 162 0.20625 000 Snam SpA - Reg 1.250% 28/08/2025 EUR 705 644 716 102 0.08
1 000 000 SoQ Sukuk A QSC 3.241% 18/01/2023 USD 990 104 1 004 916 0.12400 000 Southern California Edison Co. - C 4.125% 01/03/2048 USD 399 275 381 299 0.05650 000 Southern Co. 3.250% 01/07/2026 USD 643 161 636 652 0.08
1 050 000 Southern Co. 4.400% 01/07/2046 USD 1 109 005 1 055 647 0.12350 000 Southern Co. Gas Capital Corp. 4.400% 30/05/2047 USD 371 870 351 768 0.04300 000 Southwestern Electric Power Co. 3.850% 01/02/2048 USD 299 386 282 317 0.03
1 100 000 Spirit AeroSystems, Inc. 4.600% 15/06/2028 USD 1 098 447 1 106 356 0.133 843 750 Sprint Spectrum Co. LLC Via Sprint Spectrum Co II LLC Via
Sprint Spectrum Co III LLC 144A 3.360% 20/09/2021USD 3 861 062 3 842 597 0.45
1 250 000 State Grid Overseas Investment 2013 Ltd. - Reg 3.125%22/05/2023
USD 1 256 347 1 251 517 0.15
2 400 000 STORE Capital Corp. 4.625% 15/03/2029 USD 2 381 058 2 435 562 0.291 650 000 Stryker Corp. 3.375% 01/11/2025 USD 1 683 713 1 676 623 0.202 000 000 Stryker Corp. 3.650% 07/03/2028 USD 1 997 704 2 051 298 0.242 950 000 Suzano Austria GmbH 6.000% 15/01/2029 USD 3 065 835 3 142 369 0.37
900 000 Swedish Match AB 0.875% 23/09/2024 EUR 1 093 641 995 008 0.121 000 000 Synchrony Financial 5.150% 19/03/2029 USD 997 848 1 016 896 0.12
307 000 Sysco Corp. 1.250% 23/06/2023 EUR 368 348 354 503 0.042 150 000 Tapestry, Inc. 3.000% 15/07/2022 USD 2 146 620 2 115 628 0.25
544 000 Tapestry, Inc. 4.125% 15/07/2027 USD 520 752 519 700 0.061 100 000 Tele2 AB - Reg 1.125% 15/05/2024 EUR 1 248 362 1 257 958 0.15
600 000 Telefonica Emisiones S.A. - Reg 1.069% 05/02/2024 EUR 686 130 688 944 0.083 200 000 Teleperformance 1.500% 03/04/2024 EUR 3 995 103 3 664 263 0.431 000 000 Teleperformance 1.875% 02/07/2025 EUR 1 159 195 1 161 645 0.14
425 000 Telstra Corp. Ltd. 1.375% 26/03/2029 EUR 481 531 488 437 0.061 275 000 Temasek Financial I Ltd. 144A 3.625% 01/08/2028 USD 1 269 954 1 333 441 0.161 500 000 Tencent Hldg. Ltd. - Reg 2.985% 19/01/2023 USD 1 466 143 1 493 457 0.182 000 000 Tencent Hldg. Ltd. - Reg 3.595% 19/01/2028 USD 1 986 669 1 973 252 0.231 400 000 Thales S.A. 0.750% 07/06/2023 EUR 1 748 229 1 611 384 0.19
550 000 Thames Water Utilities Cayman Finance Ltd. 2.375%03/05/2023
GBP 730 694 702 512 0.08
250 000 Thames Water Utilities Cayman Finance Ltd. 4.375%03/07/2034
GBP 409 905 378 945 0.05
550 000 Time Warner Cable LLC 6.550% 01/05/2037 USD 630 666 607 602 0.072 250 000 Toronto-Dominion Bank 3.226% 24/07/2024 CAD 1 817 564 1 757 508 0.211 000 000 TOTAL S.A. FRN Perpetual EUR 1 236 909 1 159 342 0.142 550 000 TOTAL S.A. FRN Perpetual EUR 3 282 959 3 008 781 0.361 390 000 Total System Services, Inc. 4.450% 01/06/2028 USD 1 386 908 1 420 000 0.17
800 000 Total System Services, Inc. 4.800% 01/04/2026 USD 820 480 840 496 0.101 300 000 TransCanada PipeLines Ltd. 4.875% 15/05/2048 USD 1 355 705 1 359 483 0.16
550 000 Tyco Electronics Group S.A. 3.125% 15/08/2027 USD 549 630 530 680 0.06406 000 United Technologies Corp. 4.125% 16/11/2028 USD 405 863 421 800 0.05800 000 UnitedHealth Group, Inc. 4.625% 15/07/2035 USD 878 517 896 813 0.11150 000 University of Oxford 2.544% 08/12/2117 GBP 217 279 196 535 0.02
175Merrill Lynch Investment Solutions
Merrill Lynch Investment Solutions – Global Debt -Credit UCITS FundSchedule of Investments as at March 31, 2019 (cont.)(expressed in USD)
The accompanying notes form an integral part of these financial statements.
Audited annual report
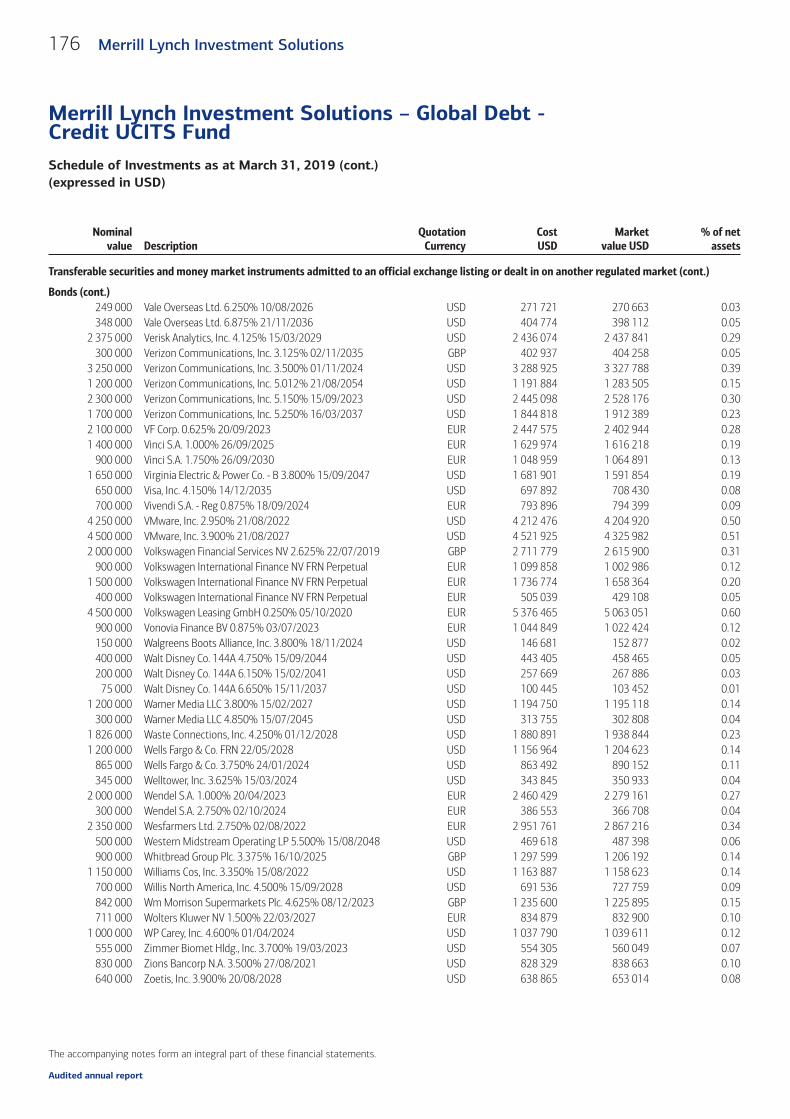
Nominalvalue Description
QuotationCurrency
CostUSD
Marketvalue USD
% of netassets
Transferable securities and money market instruments admitted to an official exchange listing or dealt in on another regulated market (cont.)
Bonds (cont.)249 000 Vale Overseas Ltd. 6.250% 10/08/2026 USD 271 721 270 663 0.03348 000 Vale Overseas Ltd. 6.875% 21/11/2036 USD 404 774 398 112 0.05
2 375 000 Verisk Analytics, Inc. 4.125% 15/03/2029 USD 2 436 074 2 437 841 0.29300 000 Verizon Communications, Inc. 3.125% 02/11/2035 GBP 402 937 404 258 0.05
3 250 000 Verizon Communications, Inc. 3.500% 01/11/2024 USD 3 288 925 3 327 788 0.391 200 000 Verizon Communications, Inc. 5.012% 21/08/2054 USD 1 191 884 1 283 505 0.152 300 000 Verizon Communications, Inc. 5.150% 15/09/2023 USD 2 445 098 2 528 176 0.301 700 000 Verizon Communications, Inc. 5.250% 16/03/2037 USD 1 844 818 1 912 389 0.232 100 000 VF Corp. 0.625% 20/09/2023 EUR 2 447 575 2 402 944 0.281 400 000 Vinci S.A. 1.000% 26/09/2025 EUR 1 629 974 1 616 218 0.19
900 000 Vinci S.A. 1.750% 26/09/2030 EUR 1 048 959 1 064 891 0.131 650 000 Virginia Electric & Power Co. - B 3.800% 15/09/2047 USD 1 681 901 1 591 854 0.19
650 000 Visa, Inc. 4.150% 14/12/2035 USD 697 892 708 430 0.08700 000 Vivendi S.A. - Reg 0.875% 18/09/2024 EUR 793 896 794 399 0.09
4 250 000 VMware, Inc. 2.950% 21/08/2022 USD 4 212 476 4 204 920 0.504 500 000 VMware, Inc. 3.900% 21/08/2027 USD 4 521 925 4 325 982 0.512 000 000 Volkswagen Financial Services NV 2.625% 22/07/2019 GBP 2 711 779 2 615 900 0.31
900 000 Volkswagen International Finance NV FRN Perpetual EUR 1 099 858 1 002 986 0.121 500 000 Volkswagen International Finance NV FRN Perpetual EUR 1 736 774 1 658 364 0.20
400 000 Volkswagen International Finance NV FRN Perpetual EUR 505 039 429 108 0.054 500 000 Volkswagen Leasing GmbH 0.250% 05/10/2020 EUR 5 376 465 5 063 051 0.60
900 000 Vonovia Finance BV 0.875% 03/07/2023 EUR 1 044 849 1 022 424 0.12150 000 Walgreens Boots Alliance, Inc. 3.800% 18/11/2024 USD 146 681 152 877 0.02400 000 Walt Disney Co. 144A 4.750% 15/09/2044 USD 443 405 458 465 0.05200 000 Walt Disney Co. 144A 6.150% 15/02/2041 USD 257 669 267 886 0.03
75 000 Walt Disney Co. 144A 6.650% 15/11/2037 USD 100 445 103 452 0.011 200 000 Warner Media LLC 3.800% 15/02/2027 USD 1 194 750 1 195 118 0.14
300 000 Warner Media LLC 4.850% 15/07/2045 USD 313 755 302 808 0.041 826 000 Waste Connections, Inc. 4.250% 01/12/2028 USD 1 880 891 1 938 844 0.231 200 000 Wells Fargo & Co. FRN 22/05/2028 USD 1 156 964 1 204 623 0.14
865 000 Wells Fargo & Co. 3.750% 24/01/2024 USD 863 492 890 152 0.11345 000 Welltower, Inc. 3.625% 15/03/2024 USD 343 845 350 933 0.04
2 000 000 Wendel S.A. 1.000% 20/04/2023 EUR 2 460 429 2 279 161 0.27300 000 Wendel S.A. 2.750% 02/10/2024 EUR 386 553 366 708 0.04
2 350 000 Wesfarmers Ltd. 2.750% 02/08/2022 EUR 2 951 761 2 867 216 0.34500 000 Western Midstream Operating LP 5.500% 15/08/2048 USD 469 618 487 398 0.06900 000 Whitbread Group Plc. 3.375% 16/10/2025 GBP 1 297 599 1 206 192 0.14
1 150 000 Williams Cos, Inc. 3.350% 15/08/2022 USD 1 163 887 1 158 623 0.14700 000 Willis North America, Inc. 4.500% 15/09/2028 USD 691 536 727 759 0.09842 000 Wm Morrison Supermarkets Plc. 4.625% 08/12/2023 GBP 1 235 600 1 225 895 0.15711 000 Wolters Kluwer NV 1.500% 22/03/2027 EUR 834 879 832 900 0.10
1 000 000 WP Carey, Inc. 4.600% 01/04/2024 USD 1 037 790 1 039 611 0.12555 000 Zimmer Biomet Hldg., Inc. 3.700% 19/03/2023 USD 554 305 560 049 0.07830 000 Zions Bancorp N.A. 3.500% 27/08/2021 USD 828 329 838 663 0.10640 000 Zoetis, Inc. 3.900% 20/08/2028 USD 638 865 653 014 0.08
176 Merrill Lynch Investment Solutions
Merrill Lynch Investment Solutions – Global Debt -Credit UCITS FundSchedule of Investments as at March 31, 2019 (cont.)(expressed in USD)
The accompanying notes form an integral part of these financial statements.
Audited annual report

Nominalvalue Description
QuotationCurrency
CostUSD
Marketvalue USD
% of netassets
Transferable securities and money market instruments admitted to an official exchange listing or dealt in on another regulated market (cont.)
Bonds (cont.)350 000 Zoetis, Inc. 3.950% 12/09/2047 USD 352 847 331 610 0.04200 000 Zoetis, Inc. 4.700% 01/02/2043 USD 215 096 212 401 0.03
Total Bonds 731 359 315 725 644 580 85.75
Supranationals, Governments and Local Public Authorities, Debt Instruments1 000 000 Abu Dhabi Government International Bond - Reg 3.125%
03/05/2026USD 993 595 1 001 290 0.12
550 000 Abu Dhabi Government International Bond - Reg 4.125%11/10/2047
USD 548 251 554 840 0.07
250 000 Bay Area Toll Authority 6.263% 01/04/2049 USD 361 675 356 528 0.04400 000 Bay Area Toll Authority 6.907% 01/10/2050 USD 620 705 611 672 0.07
2 500 000 Canadian Government Bond 2.750% 01/12/2048 CAD 2 159 499 2 225 008 0.26500 000 Chile Government International Bond 3.860% 21/06/2047 USD 512 183 508 255 0.06450 000 Colombia Government International Bond 5.000%
15/06/2045USD 470 305 472 140 0.06
600 000 Colombia Government International Bond 5.625%26/02/2044
USD 683 603 676 320 0.08
2 250 000 CPPIB Capital, Inc. - Reg 0.375% 20/06/2024 EUR 2 664 699 2 565 155 0.302 600 000 European Financial Stability Facility 0.750% 03/05/2027 EUR 3 129 701 3 046 567 0.36
700 000 European Financial Stability Facility 1.375% 31/05/2047 EUR 819 642 814 464 0.101 900 000 European Financial Stability Facility 3.000% 04/09/2034 EUR 2 864 922 2 796 907 0.335 400 000 European Investment Bank 0.500% 15/01/2027 EUR 6 425 610 6 232 558 0.74
550 000 European Investment Bank 0.500% 13/11/2037 EUR 588 696 576 326 0.071 700 000 European Investment Bank 1.125% 13/04/2033 EUR 2 040 939 2 017 588 0.241 500 000 European Investment Bank 1.500% 16/10/2048 EUR 1 854 676 1 822 385 0.22
350 000 European Investment Bank 4.500% 07/06/2029 GBP 586 125 587 529 0.07550 000 European Investment Bank 4.500% 07/03/2044 GBP 1 067 763 1 100 115 0.13700 000 European Stability Mechanism 0.750% 15/03/2027 EUR 843 907 823 330 0.10
1 250 000 European Stability Mechanism 0.875% 18/07/2042 EUR 1 373 104 1 350 812 0.16550 000 European Union 1.125% 04/04/2036 EUR 661 704 642 999 0.08900 000 European Union 3.375% 04/04/2032 EUR 1 395 482 1 354 547 0.16550 000 Export-Import Bank of China 2.875% 26/04/2026 USD 539 348 529 152 0.06
1 500 000 Export-Import Bank of Korea 2.625% 26/05/2026 USD 1 372 022 1 447 737 0.17900 000 Hungary Government International Bond 5.375% 25/03/2024 USD 996 907 986 107 0.12775 000 Indonesia Government International Bond 4.750%
11/02/2029USD 773 105 829 899 0.10
625 000 Indonesia Government International Bond 5.350%11/02/2049
USD 622 148 693 071 0.08
1 000 000 Indonesia Government International Bond 6.750%15/01/2044
USD 1 313 374 1 281 987 0.15
800 000 Indonesia Government International Bond - Reg 2.625%14/06/2023
EUR 1 012 227 957 791 0.11
3 000 000 Indonesia Government International Bond - Reg 4.125%15/01/2025
USD 3 101 893 3 074 553 0.36
500 000 Indonesia Government International Bond - Reg 4.750%08/01/2026
USD 519 872 528 112 0.06
1 150 000 International Bank for Reconstruction & Development 2.600%20/09/2022
AUD 875 887 837 375 0.10
177Merrill Lynch Investment Solutions
Merrill Lynch Investment Solutions – Global Debt -Credit UCITS FundSchedule of Investments as at March 31, 2019 (cont.)(expressed in USD)
The accompanying notes form an integral part of these financial statements.
Audited annual report

Nominalvalue Description
QuotationCurrency
CostUSD
Marketvalue USD
% of netassets
Transferable securities and money market instruments admitted to an official exchange listing or dealt in on another regulated market (cont.)
Supranationals, Governments and Local Public Authorities, Debt Instruments (cont.)550 000 Israel Government International Bond 4.500% 30/01/2043 USD 597 207 594 687 0.07900 000 Kazakhstan Government International Bond - Reg 5.125%
21/07/2025USD 988 324 980 957 0.12
300 000 Kazakhstan Government International Bond - Reg 6.500%21/07/2045
USD 388 072 384 606 0.05
1 200 000 Korea International Bond 2.750% 19/01/2027 USD 1 135 310 1 187 448 0.141 150 000 Kuwait International Government Bond 3.500% 20/03/2027 USD 1 170 712 1 174 437 0.14
250 000 Kuwait International Government Bond - Reg 3.500%20/03/2027
USD 253 939 255 313 0.03
550 000 Los Angeles Department of Water & Power Power SystemRevenue 6.574% 01/07/2045
USD 812 466 802 252 0.10
2 000 000 Mexico Government International Bond 3.750% 11/01/2028 USD 1 967 820 1 975 400 0.232 300 000 Mexico Government International Bond 4.150% 28/03/2027 USD 2 397 744 2 338 410 0.28
800 000 Mexico Government International Bond 4.350% 15/01/2047 USD 779 146 748 800 0.091 050 000 New Jersey Turnpike Authority 7.414% 01/01/2040 USD 1 562 019 1 577 121 0.19
250 000 New York City Water & Sewer System 5.724% 15/06/2042 USD 330 068 332 588 0.04550 000 New York City Water & Sewer System 5.882% 15/06/2044 USD 753 306 751 866 0.09300 000 Panama Government International Bond 3.750% 16/03/2025 USD 311 396 309 453 0.04400 000 Panama Government International Bond 4.500% 15/05/2047 USD 435 805 421 880 0.05450 000 Panama Government International Bond 9.375% 01/04/2029 USD 657 270 656 550 0.08500 000 Peruvian Government International Bond 4.125% 25/08/2027 USD 541 431 545 505 0.06350 000 Peruvian Government International Bond 5.625% 18/11/2050 USD 445 042 449 050 0.05
1 300 000 Peruvian Government International Bond 7.350% 21/07/2025 USD 1 595 847 1 636 050 0.191 000 000 Philippine Government International Bond 4.200%
21/01/2024USD 1 054 502 1 054 398 0.12
350 000 Philippine Government International Bond 5.000%13/01/2037
USD 410 195 411 788 0.05
550 000 Port Authority of New York & New Jersey - H 4.458%01/10/2062
USD 611 617 616 181 0.07
1 000 000 Province of Quebec Canada 5.000% 29/04/2019 EUR 1 188 900 1 127 301 0.13725 000 Qatar Government International Bond 4.000% 14/03/2029 USD 722 468 747 194 0.09500 000 Qatar Government International Bond 144A 4.500%
20/01/2022USD 512 702 519 250 0.06
750 000 Qatar Government International Bond 4.817% 14/03/2049 USD 750 000 788 578 0.09500 000 Qatar Government International Bond - Reg 3.250%
02/06/2026USD 489 588 496 000 0.06
325 000 Qatar Government International Bond - Reg 3.875%23/04/2023
USD 323 210 334 253 0.04
450 000 Qatar Government International Bond - Reg 4.500%23/04/2028
USD 448 667 480 865 0.06
350 000 Qatar Government International Bond - Reg 4.625%02/06/2046
USD 363 073 369 548 0.04
400 000 Qatar Government International Bond - Reg 5.103%23/04/2048
USD 409 189 438 000 0.05
550 000 Regents of the University of California Medical Center PooledRevenue - H 6.548% 15/05/2048
USD 767 031 764 186 0.09
600 000 Republic of Poland Government International Bond 0.875%10/05/2027
EUR 708 470 686 082 0.08
178 Merrill Lynch Investment Solutions
Merrill Lynch Investment Solutions – Global Debt -Credit UCITS FundSchedule of Investments as at March 31, 2019 (cont.)(expressed in USD)
The accompanying notes form an integral part of these financial statements.
Audited annual report
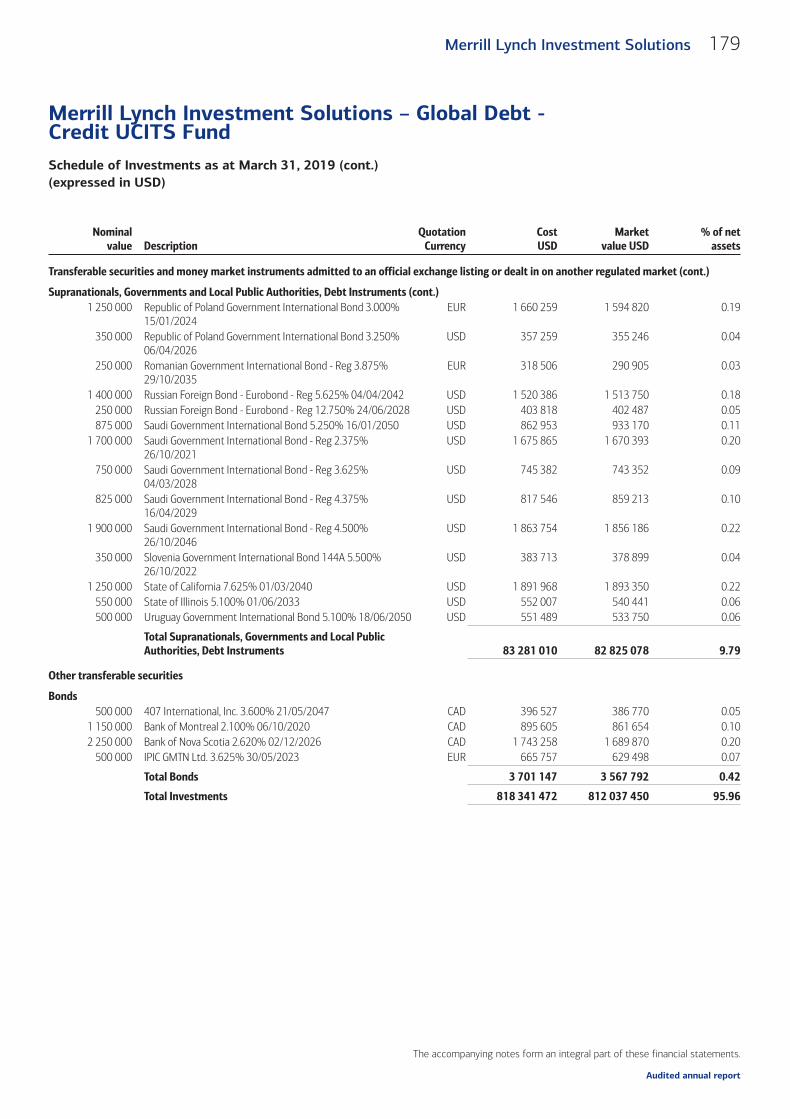
Nominalvalue Description
QuotationCurrency
CostUSD
Marketvalue USD
% of netassets
Transferable securities and money market instruments admitted to an official exchange listing or dealt in on another regulated market (cont.)
Supranationals, Governments and Local Public Authorities, Debt Instruments (cont.)1 250 000 Republic of Poland Government International Bond 3.000%
15/01/2024EUR 1 660 259 1 594 820 0.19
350 000 Republic of Poland Government International Bond 3.250%06/04/2026
USD 357 259 355 246 0.04
250 000 Romanian Government International Bond - Reg 3.875%29/10/2035
EUR 318 506 290 905 0.03
1 400 000 Russian Foreign Bond - Eurobond - Reg 5.625% 04/04/2042 USD 1 520 386 1 513 750 0.18250 000 Russian Foreign Bond - Eurobond - Reg 12.750% 24/06/2028 USD 403 818 402 487 0.05875 000 Saudi Government International Bond 5.250% 16/01/2050 USD 862 953 933 170 0.11
1 700 000 Saudi Government International Bond - Reg 2.375%26/10/2021
USD 1 675 865 1 670 393 0.20
750 000 Saudi Government International Bond - Reg 3.625%04/03/2028
USD 745 382 743 352 0.09
825 000 Saudi Government International Bond - Reg 4.375%16/04/2029
USD 817 546 859 213 0.10
1 900 000 Saudi Government International Bond - Reg 4.500%26/10/2046
USD 1 863 754 1 856 186 0.22
350 000 Slovenia Government International Bond 144A 5.500%26/10/2022
USD 383 713 378 899 0.04
1 250 000 State of California 7.625% 01/03/2040 USD 1 891 968 1 893 350 0.22550 000 State of Illinois 5.100% 01/06/2033 USD 552 007 540 441 0.06500 000 Uruguay Government International Bond 5.100% 18/06/2050 USD 551 489 533 750 0.06
Total Supranationals, Governments and Local PublicAuthorities, Debt Instruments 83 281 010 82 825 078 9.79
Other transferable securities
Bonds500 000 407 International, Inc. 3.600% 21/05/2047 CAD 396 527 386 770 0.05
1 150 000 Bank of Montreal 2.100% 06/10/2020 CAD 895 605 861 654 0.102 250 000 Bank of Nova Scotia 2.620% 02/12/2026 CAD 1 743 258 1 689 870 0.20
500 000 IPIC GMTN Ltd. 3.625% 30/05/2023 EUR 665 757 629 498 0.07
Total Bonds 3 701 147 3 567 792 0.42
Total Investments 818 341 472 812 037 450 95.96
179Merrill Lynch Investment Solutions
Merrill Lynch Investment Solutions – Global Debt -Credit UCITS FundSchedule of Investments as at March 31, 2019 (cont.)(expressed in USD)
The accompanying notes form an integral part of these financial statements.
Audited annual report

Industrial classification of investments(as a percentage of net assets as at March 31, 2019) %
Banks 16.82Sovereign 8.68REITS 5.32Electric 4.13Diversified Financial Services 4.10Auto Manufacturers 3.96Media 3.41Telecommunications 3.40Insurance 3.17Oil & Gas 2.95Commercial Services 2.38Beverages 2.29Computers 2.26Pipelines 2.26Software 2.25Agriculture 2.13Chemicals 2.13Healthcare-Products 2.11Retail 2.07Investment Companies 1.66Pharmaceuticals 1.56Healthcare-Services 1.44Mining 1.43Internet 1.36Electronics 1.32
Industrial classification of investments(as a percentage of net assets as at March 31, 2019) %
Semiconductors 1.24Municipal 0.97Apparel 0.91Real Estate 0.88Food 0.84Miscellaneous Manufacturing 0.78Gas 0.64Cosmetics/Personal Care 0.60Engineering & Construction 0.57Aerospace/Defense 0.55Auto Parts & Equipment 0.55Lodging 0.49Transportation 0.48Forest Products & Paper 0.37Leisure Time 0.28Machinery-Diversified 0.25Environmental Control 0.23Food Service 0.22Water 0.19Regional (State/Province) 0.13Iron/Steel 0.08Biotechnology 0.06Building Materials 0.06
95.96
180 Merrill Lynch Investment Solutions
Merrill Lynch Investment Solutions – Global Debt -Credit UCITS FundSchedule of Investments as at March 31, 2019 (cont.)(expressed in USD)
The accompanying notes form an integral part of these financial statements.
Audited annual report
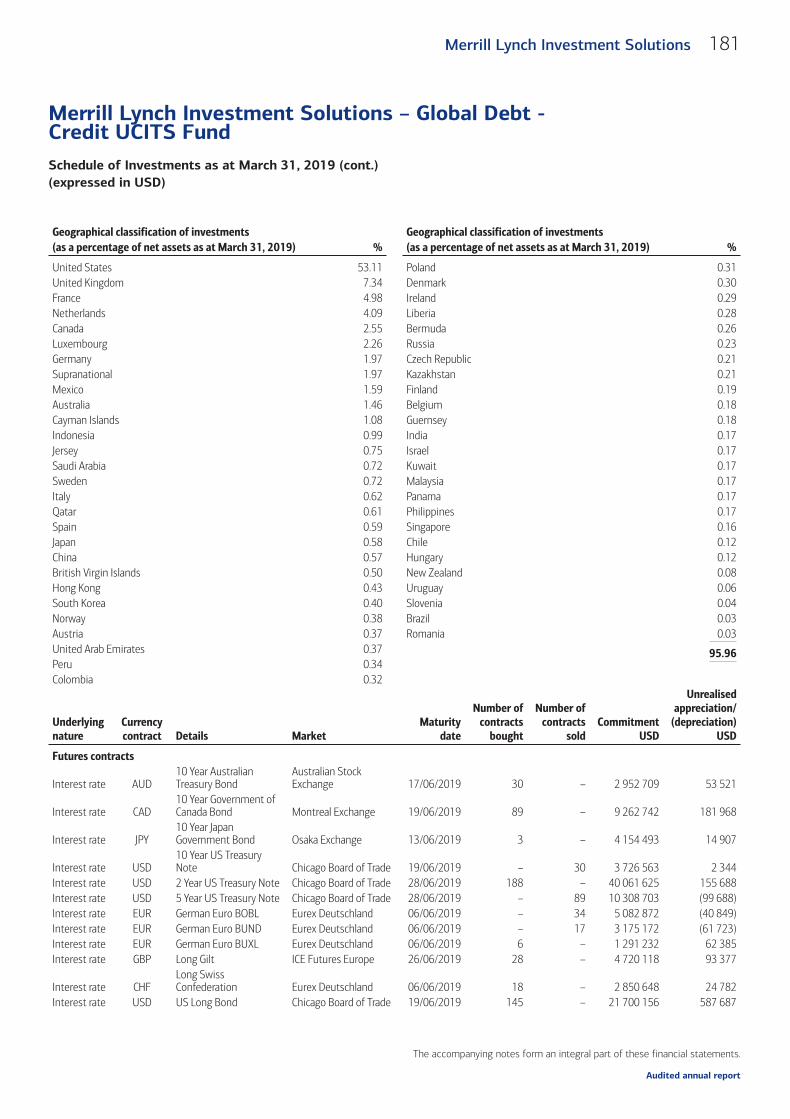
Geographical classification of investments(as a percentage of net assets as at March 31, 2019) %
United States 53.11United Kingdom 7.34France 4.98Netherlands 4.09Canada 2.55Luxembourg 2.26Germany 1.97Supranational 1.97Mexico 1.59Australia 1.46Cayman Islands 1.08Indonesia 0.99Jersey 0.75Saudi Arabia 0.72Sweden 0.72Italy 0.62Qatar 0.61Spain 0.59Japan 0.58China 0.57British Virgin Islands 0.50Hong Kong 0.43South Korea 0.40Norway 0.38Austria 0.37United Arab Emirates 0.37Peru 0.34Colombia 0.32
Geographical classification of investments(as a percentage of net assets as at March 31, 2019) %
Poland 0.31Denmark 0.30Ireland 0.29Liberia 0.28Bermuda 0.26Russia 0.23Czech Republic 0.21Kazakhstan 0.21Finland 0.19Belgium 0.18Guernsey 0.18India 0.17Israel 0.17Kuwait 0.17Malaysia 0.17Panama 0.17Philippines 0.17Singapore 0.16Chile 0.12Hungary 0.12New Zealand 0.08Uruguay 0.06Slovenia 0.04Brazil 0.03Romania 0.03
95.96
Underlyingnature
Currencycontract Details Market
Maturitydate
Number ofcontracts
bought
Number ofcontracts
soldCommitment
USD
Unrealisedappreciation/
(depreciation)USD
Futures contracts
Interest rate AUD10 Year AustralianTreasury Bond
Australian StockExchange 17/06/2019 30 – 2 952 709 53 521
Interest rate CAD10 Year Government ofCanada Bond Montreal Exchange 19/06/2019 89 – 9 262 742 181 968
Interest rate JPY10 Year JapanGovernment Bond Osaka Exchange 13/06/2019 3 – 4 154 493 14 907
Interest rate USD10 Year US TreasuryNote Chicago Board of Trade 19/06/2019 – 30 3 726 563 2 344
Interest rate USD 2 Year US Treasury Note Chicago Board of Trade 28/06/2019 188 – 40 061 625 155 688Interest rate USD 5 Year US Treasury Note Chicago Board of Trade 28/06/2019 – 89 10 308 703 (99 688)Interest rate EUR German Euro BOBL Eurex Deutschland 06/06/2019 – 34 5 082 872 (40 849)Interest rate EUR German Euro BUND Eurex Deutschland 06/06/2019 – 17 3 175 172 (61 723)Interest rate EUR German Euro BUXL Eurex Deutschland 06/06/2019 6 – 1 291 232 62 385Interest rate GBP Long Gilt ICE Futures Europe 26/06/2019 28 – 4 720 118 93 377
Interest rate CHFLong SwissConfederation Eurex Deutschland 06/06/2019 18 – 2 850 648 24 782
Interest rate USD US Long Bond Chicago Board of Trade 19/06/2019 145 – 21 700 156 587 687
181Merrill Lynch Investment Solutions
Merrill Lynch Investment Solutions – Global Debt -Credit UCITS FundSchedule of Investments as at March 31, 2019 (cont.)(expressed in USD)
The accompanying notes form an integral part of these financial statements.
Audited annual report

Underlyingnature
Currencycontract Details Market
Maturitydate
Number ofcontracts
bought
Number ofcontracts
soldCommitment
USD
Unrealisedappreciation/
(depreciation)USD
Futures contracts (cont.)Interest rate USD US Long Bond Chicago Board of Trade 19/06/2019 – 309 41 029 406 (877 118)Interest rate USD US Ultra Long Bond Chicago Board of Trade 19/06/2019 26 – 4 368 000 182 502
Total Futures contracts 154 684 439 279 783
Currencybought Amount bought Currency sold Amount sold
Maturitydate Counterparty
Unrealisedappreciation/
(depreciation)USD
Forward foreign exchange contractsAUD 5 590 000 USD 3 970 857 02/04/2019 BNP Paribas S.A. (1)CAD 12 480 000 USD 9 341 940 02/04/2019 BNP Paribas S.A. (23)
EUR 39 575 000 USD 44 436 789 02/04/2019Barclays Bank Plc.
Wholesale (5)EUR 39 575 000 USD 44 436 789 02/04/2019 Deutsche Bank AG (5)
EUR 39 575 000 USD 44 436 789 02/04/2019Goldman Sachs
International (5)EUR 39 575 000 USD 44 436 789 02/04/2019 HSBC Bank Plc. (5)
EUR 39 575 000 USD 44 436 789 02/04/2019Morgan Stanley & Co.
International Plc. (5)
GBP 36 390 000 USD 47 417 990 02/04/2019Goldman Sachs
International 16JPY 10 000 000 USD 90 346 02/04/2019 BNP Paribas S.A. 0
USD 242 021 AUD 340 000 02/04/2019Barclays Bank Plc.
Wholesale 502USD 3 750 390 AUD 5 250 000 02/04/2019 State Street Bank London 21 053
USD 9 483 827 CAD 12 480 000 02/04/2019Morgan Stanley & Co.
International Plc. 141 910
USD 46 965 107 EUR 41 055 000 02/04/2019Barclays Bank Plc.
Wholesale 866 505
USD 44 845 463 EUR 39 205 000 02/04/2019Goldman Sachs
International 824 133USD 44 870 122 EUR 39 205 000 02/04/2019 HSBC Bank Plc. 848 793USD 44 865 457 EUR 39 205 000 02/04/2019 Natwest Markets Plc. 844 127USD 44 858 283 EUR 39 205 000 02/04/2019 State Street Bank London 836 953USD 48 452 885 GBP 36 390 000 02/04/2019 BNP Paribas S.A. 1 034 879USD 90 516 JPY 10 000 000 02/04/2019 State Street Bank London 170
EUR 307 627 666 USD 350 899 410 03/04/2019State Street Bank and Trust
Co. (5 450 291)EUR 6 517 944 USD 7 320 160 03/04/2019 State Street Bank London (863)
GBP 18 754 484 USD 24 958 651 03/04/2019State Street Bank and Trust
Co. (519 353)
USD 352 809 285 EUR 314 145 609 03/04/2019State Street Bank and Trust
Co. 40 871
USD 24 441 413 GBP 18 754 483 03/04/2019State Street Bank and Trust
Co. 2 115
EUR 310 039 011 USD 349 057 421 03/05/2019State Street Bank and Trust
Co. (20 554)
GBP 18 467 132 USD 24 101 990 03/05/2019State Street Bank and Trust
Co. (835)
182 Merrill Lynch Investment Solutions
Merrill Lynch Investment Solutions – Global Debt -Credit UCITS FundSchedule of Investments as at March 31, 2019 (cont.)(expressed in USD)
The accompanying notes form an integral part of these financial statements.
Audited annual report
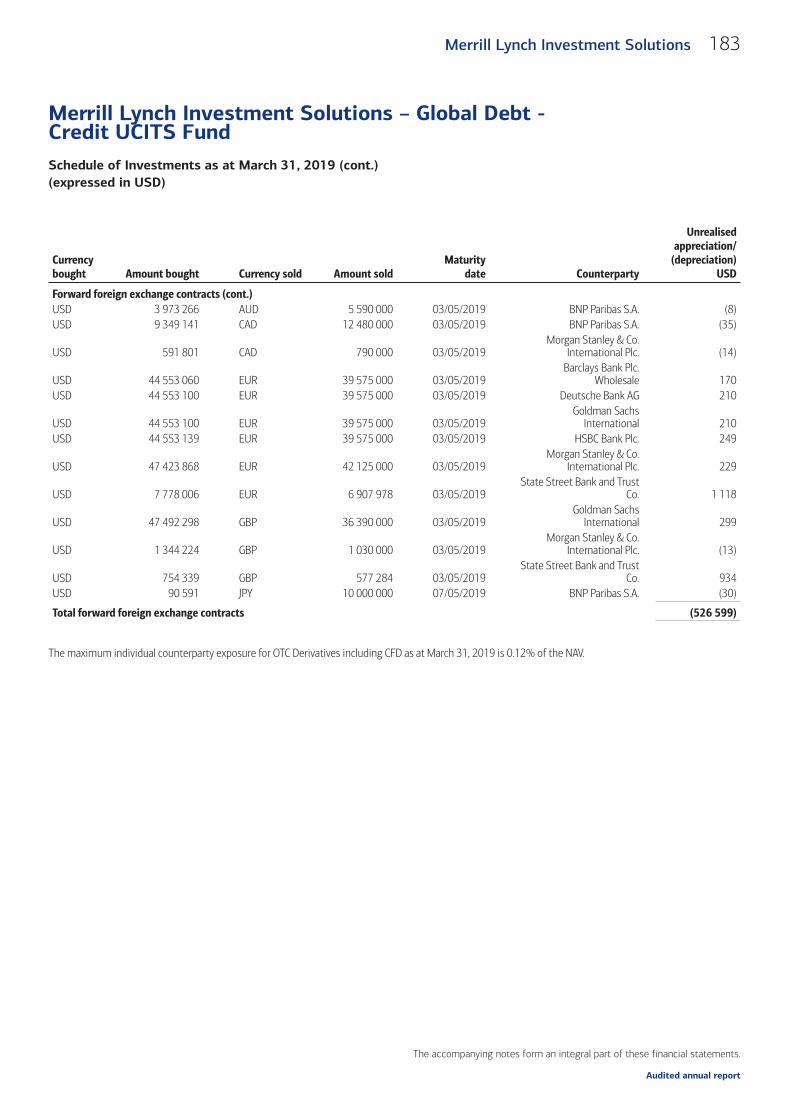
Currencybought Amount bought Currency sold Amount sold
Maturitydate Counterparty
Unrealisedappreciation/
(depreciation)USD
Forward foreign exchange contracts (cont.)USD 3 973 266 AUD 5 590 000 03/05/2019 BNP Paribas S.A. (8)USD 9 349 141 CAD 12 480 000 03/05/2019 BNP Paribas S.A. (35)
USD 591 801 CAD 790 000 03/05/2019Morgan Stanley & Co.
International Plc. (14)
USD 44 553 060 EUR 39 575 000 03/05/2019Barclays Bank Plc.
Wholesale 170USD 44 553 100 EUR 39 575 000 03/05/2019 Deutsche Bank AG 210
USD 44 553 100 EUR 39 575 000 03/05/2019Goldman Sachs
International 210USD 44 553 139 EUR 39 575 000 03/05/2019 HSBC Bank Plc. 249
USD 47 423 868 EUR 42 125 000 03/05/2019Morgan Stanley & Co.
International Plc. 229
USD 7 778 006 EUR 6 907 978 03/05/2019State Street Bank and Trust
Co. 1 118
USD 47 492 298 GBP 36 390 000 03/05/2019Goldman Sachs
International 299
USD 1 344 224 GBP 1 030 000 03/05/2019Morgan Stanley & Co.
International Plc. (13)
USD 754 339 GBP 577 284 03/05/2019State Street Bank and Trust
Co. 934USD 90 591 JPY 10 000 000 07/05/2019 BNP Paribas S.A. (30)
Total forward foreign exchange contracts (526 599)
The maximum individual counterparty exposure for OTC Derivatives including CFD as at March 31, 2019 is 0.12% of the NAV.
183Merrill Lynch Investment Solutions
Merrill Lynch Investment Solutions – Global Debt -Credit UCITS FundSchedule of Investments as at March 31, 2019 (cont.)(expressed in USD)
The accompanying notes form an integral part of these financial statements.
Audited annual report

Nominalvalue Description
QuotationCurrency
CostUSD
Marketvalue USD
% of netassets
Transferable securities and money market instruments admitted to an official exchange listing or dealt in on another regulated market
Bonds100 000 A2A SpA 1.625% 19/10/2027 EUR 119 668 114 218 0.00100 000 ACEA SpA 2.625% 15/07/2024 EUR 129 549 119 426 0.00200 000 ACEA SpA - Reg 1.500% 08/06/2027 EUR 211 211 217 962 0.00200 000 Aeroports de Paris 1.000% 13/12/2027 EUR 242 232 230 560 0.00100 000 Aeroports de Paris 3.125% 11/06/2024 EUR 135 222 128 156 0.00200 000 Aeroports de Paris - Reg 2.125% 11/10/2038 EUR 231 484 247 772 0.01400 000 Affordable Housing Finance Plc. 2.893% 11/08/2043 GBP 601 970 614 167 0.01300 000 Alliander NV 2.875% 14/06/2024 EUR 383 736 381 818 0.01150 000 Bayerische Landesbodenkreditanstalt 1.875% 25/01/2023 EUR 192 041 181 516 0.00
1 500 000 BNG Bank NV 0.050% 11/07/2023 EUR 1 732 643 1 698 315 0.03400 000 BNG Bank NV 0.250% 10/01/2024 EUR 477 200 456 827 0.01500 000 BNG Bank NV 0.500% 16/04/2025 EUR 603 571 575 390 0.01
1 100 000 BNG Bank NV 0.750% 11/01/2028 EUR 1 297 796 1 278 488 0.03200 000 BNG Bank NV 1.375% 21/10/2030 EUR 248 760 243 517 0.01300 000 BNG Bank NV 1.875% 14/01/2021 EUR 369 660 350 332 0.01
1 000 000 BNG Bank NV - Reg 0.750% 24/01/2029 EUR 1 134 011 1 156 226 0.02200 000 BNG Bank NV - Reg 1.500% 15/07/2039 EUR 226 595 241 023 0.01200 000 Caisse Centrale du Credit Immobilier de France S.A. 0.125%
05/02/2020EUR 238 493 225 246 0.00
1 000 000 Caisse Centrale du Credit Immobilier de France S.A. - Reg0.000% 22/01/2023
EUR 1 142 661 1 126 909 0.02
100 000 Coentreprise de Transport d'Electricite S.A. 0.875%29/09/2024
EUR 119 390 114 834 0.00
400 000 Coentreprise de Transport d'Electricite S.A. 2.125%29/07/2032
EUR 473 011 474 921 0.01
900 000 Deutsche Bahn Finance GmbH 0.750% 02/03/2026 EUR 1 057 310 1 043 234 0.02500 000 Deutsche Bahn Finance GmbH 1.000% 17/12/2027 EUR 589 450 586 882 0.01100 000 Deutsche Bahn Finance GmbH 1.500% 08/12/2032 EUR 122 537 118 336 0.00500 000 Deutsche Bahn Finance GmbH - Reg 1.125% 18/12/2028 EUR 570 670 584 292 0.01650 000 Dexia Credit Local S.A. 0.200% 16/03/2021 EUR 795 588 735 448 0.01
1 000 000 Dexia Credit Local S.A. 0.250% 01/06/2023 EUR 1 147 940 1 132 539 0.02400 000 Dexia Credit Local S.A. 0.500% 17/01/2025 EUR 486 421 456 926 0.01500 000 Dexia Credit Local S.A. 0.500% 17/01/2025 EUR 611 853 571 158 0.01200 000 Dexia Credit Local S.A. 1.000% 18/10/2027 EUR 239 588 234 048 0.01500 000 Dexia Credit Local S.A. - Reg 0.625% 17/01/2026 EUR 568 029 573 088 0.01
1 300 000 Electricite de France S.A. 1.000% 13/10/2026 EUR 1 477 023 1 483 335 0.03100 000 Electricite de France S.A. 1.875% 13/10/2036 EUR 113 355 111 164 0.00500 000 Electricite de France S.A. 2.000% 02/10/2030 EUR 572 172 593 277 0.01200 000 Electricite de France S.A. 3.875% 18/01/2022 EUR 263 878 249 032 0.01250 000 Electricite de France S.A. 4.000% 12/11/2025 EUR 353 212 341 194 0.01200 000 Electricite de France S.A. FRN Perpetual EUR 223 210 232 427 0.00100 000 Electricite de France S.A. FRN Perpetual EUR 126 168 118 239 0.00150 000 Electricite de France S.A. 4.500% 12/11/2040 EUR 232 440 231 790 0.00600 000 Electricite de France S.A. 4.625% 11/09/2024 EUR 883 452 826 133 0.02300 000 Electricite de France S.A. FRN Perpetual EUR 378 552 355 458 0.01
50 000 Electricite de France S.A. 5.625% 21/02/2033 EUR 85 016 83 163 0.0070 000 EnBW Energie Baden-Wuerttemberg AG FRN 05/04/2077 EUR 88 850 83 021 0.00
184 Merrill Lynch Investment Solutions
Merrill Lynch Investment Solutions – Global Debt -Government UCITS FundSchedule of Investments as at March 31, 2019(expressed in USD)
The accompanying notes form an integral part of these financial statements.
Audited annual report

Nominalvalue Description
QuotationCurrency
CostUSD
Marketvalue USD
% of netassets
Transferable securities and money market instruments admitted to an official exchange listing or dealt in on another regulated market (cont.)
Bonds (cont.)1 000 000 EnBW Energie Baden-Wuerttemberg AG FRN 02/04/2076 EUR 1 258 388 1 174 782 0.02
200 000 EnBW International Finance BV 6.125% 07/07/2039 EUR 369 335 382 375 0.01100 000 Enexis Hldg. NV 3.375% 26/01/2022 EUR 129 191 122 888 0.00300 000 Erste Abwicklungsanstalt 0.000% 25/02/2021 EUR 371 191 339 055 0.01100 000 ESB Finance DAC 1.750% 07/02/2029 EUR 125 029 118 538 0.00200 000 ESB Finance DAC - Reg 1.875% 14/06/2031 EUR 229 890 235 335 0.01200 000 ESB Finance DAC - Reg 2.125% 05/11/2033 EUR 237 775 240 219 0.01300 000 Ferrovie dello Stato Italiane SpA 1.500% 27/06/2025 EUR 338 595 332 009 0.01200 000 FLUVIUS System Operator CVBA 1.750% 04/12/2026 EUR 255 150 240 811 0.01
1 500 000 FMS Wertmanagement 0.000% 18/09/2020 EUR 1 753 638 1 694 162 0.031 000 000 FMS Wertmanagement 0.000% 13/11/2020 EUR 1 238 991 1 130 395 0.02
100 000 Fortum OYJ 4.000% 24/05/2021 EUR 128 036 121 303 0.00400 000 Fortum OYJ - Reg 2.125% 27/02/2029 EUR 458 586 456 643 0.01100 000 Hera SpA 2.375% 04/07/2024 EUR 128 793 120 365 0.00200 000 Hera SpA - Reg 0.875% 14/10/2026 EUR 212 220 215 589 0.00200 000 HSH Finanzfonds AoeR 0.250% 07/02/2023 EUR 240 381 227 125 0.00300 000 Investitionsbank Berlin 0.500% 17/04/2026 EUR 341 654 343 777 0.01
50 000 KAF Kaerntner Ausgleichszahlungs-Fonds - Reg 0.000%14/01/2032
EUR 51 442 50 730 0.00
500 000 Kreditanstalt fuer Wiederaufbau 0.000% 15/12/2022 EUR 601 056 567 593 0.012 400 000 Kreditanstalt fuer Wiederaufbau 0.125% 01/06/2020 EUR 2 865 578 2 713 450 0.051 500 000 Kreditanstalt fuer Wiederaufbau 0.125% 24/02/2023 EUR 1 790 741 1 710 381 0.036 600 000 Kreditanstalt fuer Wiederaufbau 0.125% 07/06/2023 EUR 7 585 695 7 526 788 0.153 000 000 Kreditanstalt fuer Wiederaufbau 0.125% 07/11/2023 EUR 3 449 663 3 420 425 0.071 000 000 Kreditanstalt fuer Wiederaufbau 0.125% 15/01/2024 EUR 1 214 328 1 140 382 0.02
600 000 Kreditanstalt fuer Wiederaufbau 0.125% 04/10/2024 EUR 733 711 683 134 0.014 000 000 Kreditanstalt fuer Wiederaufbau 0.250% 15/09/2025 EUR 4 585 961 4 573 808 0.091 250 000 Kreditanstalt fuer Wiederaufbau 0.625% 22/02/2027 EUR 1 527 874 1 460 452 0.03
500 000 Kreditanstalt fuer Wiederaufbau 0.625% 07/01/2028 EUR 597 534 582 597 0.011 000 000 Kreditanstalt fuer Wiederaufbau 0.750% 28/06/2028 EUR 1 131 703 1 175 457 0.021 420 000 Kreditanstalt fuer Wiederaufbau 1.125% 15/09/2032 EUR 1 700 229 1 700 908 0.03
500 000 Kreditanstalt fuer Wiederaufbau 1.125% 09/05/2033 EUR 581 977 597 704 0.01400 000 Kreditanstalt fuer Wiederaufbau 1.125% 15/06/2037 EUR 461 141 472 006 0.01500 000 Kreditanstalt fuer Wiederaufbau 1.250% 04/07/2036 EUR 604 015 602 364 0.01
1 000 000 Kreditanstalt fuer Wiederaufbau - Reg 0.750% 15/01/2029 EUR 1 152 800 1 173 005 0.02600 000 La Banque Postale S.A. 1.000% 16/10/2024 EUR 684 137 675 865 0.01100 000 La Banque Postale S.A. FRN 19/11/2027 EUR 127 677 117 725 0.00200 000 La Poste S.A. 1.125% 04/06/2025 EUR 244 541 234 241 0.01400 000 La Poste S.A. - Reg 1.450% 30/11/2028 EUR 456 230 470 586 0.01
1 200 000 Landesbank Baden-Wuerttemberg 0.500% 07/06/2022 EUR 1 397 855 1 357 864 0.03500 000 Landeskreditbank Baden-Wuerttemberg Foerderbank 0.375%
13/04/2026EUR 573 490 573 018 0.01
300 000 Landwirtschaftliche Rentenbank 0.250% 15/07/2024 EUR 357 454 343 019 0.011 200 000 Landwirtschaftliche Rentenbank 0.500% 06/03/2025 EUR 1 433 026 1 389 773 0.031 250 000 Landwirtschaftliche Rentenbank 0.625% 20/02/2030 EUR 1 418 547 1 430 584 0.03
400 000 Landwirtschaftliche Rentenbank 0.625% 31/10/2036 EUR 419 621 434 759 0.01300 000 LCR Finance Plc. 5.100% 07/03/2051 GBP 696 925 702 104 0.01
185Merrill Lynch Investment Solutions
Merrill Lynch Investment Solutions – Global Debt -Government UCITS FundSchedule of Investments as at March 31, 2019 (cont.)(expressed in USD)
The accompanying notes form an integral part of these financial statements.
Audited annual report

Nominalvalue Description
QuotationCurrency
CostUSD
Marketvalue USD
% of netassets
Transferable securities and money market instruments admitted to an official exchange listing or dealt in on another regulated market (cont.)
Bonds (cont.)100 000 LCR Finance Plc. - Reg 4.500% 07/12/2028 GBP 167 083 167 408 0.00100 000 Nederlandse Gasunie NV 1.000% 11/05/2026 EUR 121 302 115 610 0.00200 000 Nederlandse Gasunie NV - Reg 1.375% 16/10/2028 EUR 229 928 235 182 0.01500 000 Nederlandse Waterschapsbank NV 0.250% 07/06/2024 EUR 595 474 570 139 0.01500 000 Nederlandse Waterschapsbank NV 1.000% 01/03/2028 EUR 617 989 593 126 0.01800 000 Nederlandse Waterschapsbank NV 1.500% 27/04/2038 EUR 938 594 972 147 0.02200 000 Nederlandse Waterschapsbank NV 1.625% 29/01/2048 EUR 245 367 248 498 0.01
1 500 000 Nederlandse Waterschapsbank NV - Reg 0.125% 17/01/2024 EUR 1 718 311 1 702 586 0.031 000 000 Nederlandse Waterschapsbank NV - Reg 0.625% 06/02/2029 EUR 1 135 945 1 145 785 0.02
150 000 Network Rail Infrastructure Finance Plc. 3.000% 07/09/2023 GBP 216 957 212 434 0.00300 000 Network Rail Infrastructure Finance Plc. 4.750% 29/11/2035 GBP 533 106 564 562 0.01
1 600 000 NRW Bank 0.000% 02/08/2021 EUR 1 864 987 1 808 185 0.041 400 000 NRW Bank 0.125% 07/07/2023 EUR 1 628 179 1 589 128 0.03
200 000 NRW Bank 0.500% 11/05/2026 EUR 237 031 230 334 0.00400 000 NRW Bank 0.625% 04/01/2028 EUR 485 438 460 849 0.01150 000 NRW Bank 0.750% 30/06/2028 EUR 175 258 174 424 0.00500 000 NRW Bank - Reg 0.625% 02/02/2029 EUR 566 086 572 879 0.01750 000 OeBB-Infrastruktur AG 1.000% 18/11/2024 EUR 913 384 890 645 0.02
1 000 000 OeBB-Infrastruktur AG 2.250% 04/07/2023 EUR 1 282 682 1 239 525 0.02600 000 OeBB-Infrastruktur AG 3.000% 24/10/2033 EUR 856 427 869 582 0.02200 000 Proximus SADP 0.500% 22/03/2022 EUR 241 455 227 076 0.00200 000 Prs Finance Plc. - Reg 1.750% 24/11/2026 GBP 265 307 266 803 0.01200 000 Royal Schiphol Group NV - Reg 1.500% 05/11/2030 EUR 225 756 238 081 0.01100 000 RTE Reseau de Transport d'Electricite SADIR 1.000%
19/10/2026EUR 119 030 115 604 0.00
500 000 RTE Reseau de Transport d'Electricite SADIR 1.500%27/09/2030
EUR 572 520 593 071 0.01
400 000 RTE Reseau de Transport d'Electricite SADIR 1.625%27/11/2025
EUR 508 015 482 967 0.01
100 000 RTE Reseau de Transport d'Electricite SADIR 1.875%23/10/2037
EUR 120 974 120 318 0.00
100 000 Stedin Hldg. NV 0.875% 24/10/2025 EUR 120 145 113 474 0.00100 000 TenneT Hldg. BV 0.750% 26/06/2025 EUR 118 455 114 558 0.00400 000 TenneT Hldg. BV 1.250% 24/10/2033 EUR 454 238 449 210 0.01250 000 TenneT Hldg. BV 1.375% 05/06/2028 EUR 293 754 294 080 0.01200 000 Transport for London 2.125% 24/04/2025 GBP 278 094 269 806 0.01120 000 Transport for London 4.000% 07/04/2064 GBP 238 997 225 930 0.00200 000 Transport for London - Reg 4.000% 12/09/2033 GBP 298 120 320 978 0.01400 000 Wirtschafts- und Infrastrukturbank Hessen 1.250%
06/09/2033EUR 454 493 472 540 0.01
Total Bonds 86 398 293 84 965 424 1.63
Supranationals, Governments and Local Public Authorities, Debt Instruments300 000 Adif - Alta Velocidad 1.250% 04/05/2026 EUR 358 971 344 695 0.01100 000 Adif - Alta Velocidad 3.500% 27/05/2024 EUR 133 943 129 203 0.00500 000 Adif - Alta Velocidad - Reg 1.875% 28/01/2025 EUR 601 272 599 980 0.01
1 000 000 Agence Francaise de Developpement 0.125% 15/11/2023 EUR 1 158 564 1 130 474 0.02200 000 Agence Francaise de Developpement 0.250% 21/07/2026 EUR 231 293 224 098 0.00
186 Merrill Lynch Investment Solutions
Merrill Lynch Investment Solutions – Global Debt -Government UCITS FundSchedule of Investments as at March 31, 2019 (cont.)(expressed in USD)
The accompanying notes form an integral part of these financial statements.
Audited annual report

Nominalvalue Description
QuotationCurrency
CostUSD
Marketvalue USD
% of netassets
Transferable securities and money market instruments admitted to an official exchange listing or dealt in on another regulated market (cont.)
Supranationals, Governments and Local Public Authorities, Debt Instruments (cont.)700 000 Agence Francaise de Developpement 1.000% 31/01/2028 EUR 861 273 821 711 0.02400 000 Agence Francaise de Developpement 1.375% 05/07/2032 EUR 472 025 476 239 0.01200 000 Agence Francaise de Developpement - Reg 1.500%
31/10/2034EUR 228 479 237 930 0.00
1 000 000 Agence Francaise de Developpement - Reg 3.750%15/02/2027
EUR 1 404 033 1 423 144 0.03
400 000 Agence France Locale 1.125% 20/06/2028 EUR 469 773 470 912 0.0110 730 000 Australia Government Bond 1.750% 21/11/2020 AUD 8 005 808 7 651 224 0.15
7 350 000 Australia Government Bond 2.000% 21/12/2021 AUD 5 379 100 5 302 771 0.102 500 000 Australia Government Bond 2.250% 21/11/2022 AUD 1 933 959 1 829 163 0.044 500 000 Australia Government Bond 2.500% 21/05/2030 AUD 3 137 336 3 418 771 0.075 900 000 Australia Government Bond 2.750% 21/04/2024 AUD 4 456 288 4 456 007 0.092 740 000 Australia Government Bond 2.750% 21/11/2027 AUD 2 086 107 2 105 581 0.041 950 000 Australia Government Bond 2.750% 21/11/2028 AUD 1 508 083 1 503 716 0.032 250 000 Australia Government Bond 2.750% 21/06/2035 AUD 1 716 064 1 751 376 0.031 410 000 Australia Government Bond 3.000% 21/03/2047 AUD 1 021 796 1 121 470 0.025 300 000 Australia Government Bond 3.250% 21/04/2025 AUD 4 069 683 4 136 780 0.084 900 000 Australia Government Bond 3.250% 21/04/2029 AUD 3 884 206 3 948 432 0.081 730 000 Australia Government Bond 3.250% 21/06/2039 AUD 1 339 715 1 433 657 0.031 350 000 Australia Government Bond 3.750% 21/04/2037 AUD 1 121 835 1 191 103 0.026 800 000 Australia Government Bond 4.250% 21/04/2026 AUD 5 693 236 5 674 058 0.111 800 000 Australia Government Bond 4.500% 21/04/2033 AUD 1 635 107 1 682 869 0.035 730 000 Australia Government Bond 4.750% 21/04/2027 AUD 4 985 609 5 007 317 0.102 450 000 Australia Government Bond 5.750% 15/07/2022 AUD 2 111 898 1 983 087 0.048 710 000 Australia Government Bond - Reg 2.250% 21/05/2028 AUD 6 236 551 6 440 833 0.121 000 000 Australia Government Bond - Reg 2.750% 21/05/2041 AUD 675 582 763 764 0.014 400 000 Australia Government Bond - Reg 5.500% 21/04/2023 AUD 3 585 900 3 628 839 0.074 000 000 Australia Government Bond - Reg 5.750% 15/05/2021 AUD 3 055 159 3 094 278 0.062 400 000 Autobahnen- und Schnell- strassen-Finanzierungs AG 0.250%
18/10/2024EUR 2 773 933 2 740 846 0.05
300 000 Autobahnen- und Schnell- strassen-Finanzierungs AG 1.375%09/04/2021
EUR 367 774 348 883 0.01
200 000 Autonomous Community of Andalusia Spain - Reg 1.875%31/10/2028
EUR 228 630 237 592 0.00
200 000 Autonomous Community of Madrid Spain 1.773%30/04/2028
EUR 252 999 237 422 0.00
500 000 Autonomous Community of Madrid Spain 1.826%30/04/2025
EUR 608 507 603 278 0.01
200 000 Autonomous Community of Madrid Spain 2.146%30/04/2027
EUR 259 761 244 917 0.00
300 000 Autonomous Community of Madrid Spain 2.875%17/07/2023
EUR 392 648 374 783 0.01
1 000 000 Autonomous Community of Madrid Spain - Reg 0.997%30/09/2024
EUR 1 150 923 1 156 140 0.02
200 000 Autonomous Community of Madrid Spain - Reg 1.571%30/04/2029
EUR 231 162 230 967 0.00
200 000 Basque Government 1.450% 30/04/2028 EUR 233 888 232 613 0.00400 000 Bpifrance Financement S.A. 0.125% 25/11/2023 EUR 473 280 451 610 0.01
187Merrill Lynch Investment Solutions
Merrill Lynch Investment Solutions – Global Debt -Government UCITS FundSchedule of Investments as at March 31, 2019 (cont.)(expressed in USD)
The accompanying notes form an integral part of these financial statements.
Audited annual report

Nominalvalue Description
QuotationCurrency
CostUSD
Marketvalue USD
% of netassets
Transferable securities and money market instruments admitted to an official exchange listing or dealt in on another regulated market (cont.)
Supranationals, Governments and Local Public Authorities, Debt Instruments (cont.)700 000 Bpifrance Financement S.A. 0.250% 14/02/2023 EUR 839 350 796 431 0.02600 000 Bpifrance Financement S.A. 0.750% 25/11/2024 EUR 709 788 699 033 0.01200 000 Bpifrance Financement S.A. 1.000% 25/05/2027 EUR 247 328 235 810 0.00
1 000 000 Bpifrance Financement S.A. - Reg 0.625% 25/05/2026 EUR 1 137 391 1 152 240 0.02500 000 Bpifrance Financement S.A. - Reg 0.875% 26/09/2028 EUR 566 278 579 589 0.01
10 000 000 Bundesobligation 0.000% 08/04/2022 EUR 12 367 992 11 434 048 0.227 600 000 Bundesobligation 0.250% 16/10/2020 EUR 9 000 435 8 646 935 0.175 720 000 Bundesrepublik Deutschland Bundesanleihe 0.000%
15/08/2026EUR 6 563 946 6 566 647 0.13
9 570 000 Bundesrepublik Deutschland Bundesanleihe 0.250%15/02/2027
EUR 11 195 721 11 181 948 0.21
2 000 000 Bundesrepublik Deutschland Bundesanleihe 0.250%15/08/2028
EUR 2 310 279 2 323 522 0.04
10 010 000 Bundesrepublik Deutschland Bundesanleihe 0.500%15/02/2025
EUR 12 048 329 11 850 045 0.23
7 400 000 Bundesrepublik Deutschland Bundesanleihe 0.500%15/02/2026
EUR 8 788 230 8 794 606 0.17
1 870 000 Bundesrepublik Deutschland Bundesanleihe 0.500%15/08/2027
EUR 2 312 498 2 227 393 0.04
730 000 Bundesrepublik Deutschland Bundesanleihe 0.500%15/02/2028
EUR 872 967 868 861 0.02
650 000 Bundesrepublik Deutschland Bundesanleihe 1.000%15/08/2024
EUR 819 307 787 166 0.02
4 710 000 Bundesrepublik Deutschland Bundesanleihe 1.000%15/08/2025
EUR 5 818 788 5 759 644 0.11
3 920 000 Bundesrepublik Deutschland Bundesanleihe 1.250%15/08/2048
EUR 4 836 838 5 204 436 0.10
4 500 000 Bundesrepublik Deutschland Bundesanleihe 1.500%04/09/2022
EUR 5 649 315 5 418 265 0.10
6 450 000 Bundesrepublik Deutschland Bundesanleihe 1.500%15/05/2024
EUR 8 158 433 7 979 859 0.15
1 000 000 Bundesrepublik Deutschland Bundesanleihe 1.750%04/07/2022
EUR 1 292 514 1 209 644 0.02
7 890 000 Bundesrepublik Deutschland Bundesanleihe 1.750%15/02/2024
EUR 10 001 462 9 837 705 0.19
10 650 000 Bundesrepublik Deutschland Bundesanleihe 2.000%04/01/2022
EUR 12 937 470 12 830 809 0.25
12 000 000 Bundesrepublik Deutschland Bundesanleihe 2.250%04/09/2021
EUR 14 806 875 14 416 975 0.28
4 210 000 Bundesrepublik Deutschland Bundesanleihe 2.500%04/01/2021
EUR 5 448 944 4 993 651 0.10
3 240 000 Bundesrepublik Deutschland Bundesanleihe 2.500%04/07/2044
EUR 5 193 181 5 358 794 0.10
4 840 000 Bundesrepublik Deutschland Bundesanleihe 2.500%15/08/2046
EUR 7 707 942 8 142 760 0.16
770 000 Bundesrepublik Deutschland Bundesanleihe 3.000%04/07/2020
EUR 961 544 903 913 0.02
1 500 000 Bundesrepublik Deutschland Bundesanleihe 3.250%04/07/2021
EUR 1 945 426 1 832 077 0.04
188 Merrill Lynch Investment Solutions
Merrill Lynch Investment Solutions – Global Debt -Government UCITS FundSchedule of Investments as at March 31, 2019 (cont.)(expressed in USD)
The accompanying notes form an integral part of these financial statements.
Audited annual report

Nominalvalue Description
QuotationCurrency
CostUSD
Marketvalue USD
% of netassets
Transferable securities and money market instruments admitted to an official exchange listing or dealt in on another regulated market (cont.)
Supranationals, Governments and Local Public Authorities, Debt Instruments (cont.)5 450 000 Bundesrepublik Deutschland Bundesanleihe 3.250%
04/07/2042EUR 9 347 215 9 927 661 0.19
4 400 000 Bundesrepublik Deutschland Bundesanleihe 4.000%04/01/2037
EUR 7 876 191 8 125 182 0.16
1 810 000 Bundesrepublik Deutschland Bundesanleihe 4.250%04/07/2039
EUR 3 441 955 3 576 556 0.07
3 940 000 Bundesrepublik Deutschland Bundesanleihe 4.750%04/07/2034
EUR 7 321 301 7 478 289 0.14
2 250 000 Bundesrepublik Deutschland Bundesanleihe 4.750%04/07/2040
EUR 4 627 921 4 785 606 0.09
1 940 000 Bundesrepublik Deutschland Bundesanleihe 5.500%04/01/2031
EUR 3 555 067 3 597 070 0.07
3 100 000 Bundesrepublik Deutschland Bundesanleihe - Reg 0.250%15/02/2029
EUR 3 552 601 3 590 864 0.07
6 500 000 Bundesrepublik Deutschland Bundesanleihe - Reg 1.500%15/05/2023
EUR 8 179 342 7 919 629 0.15
4 400 000 Bundesrepublik Deutschland Bundesanleihe - Reg 2.000%15/08/2023
EUR 5 604 929 5 492 669 0.11
10 000 000 Bundesrepublik Deutschland Bundesanleihe - Reg 2.250%04/09/2020
EUR 11 892 186 11 689 227 0.22
1 400 000 Caisse d'Amortissement de la Dette Sociale 0.050%25/11/2020
EUR 1 725 341 1 582 610 0.03
2 900 000 Caisse d'Amortissement de la Dette Sociale 0.125%25/11/2022
EUR 3 456 720 3 301 559 0.06
500 000 Caisse d'Amortissement de la Dette Sociale 1.375%25/11/2024
EUR 608 461 607 709 0.01
1 600 000 Caisse d'Amortissement de la Dette Sociale 2.375%25/01/2024
EUR 2 058 097 2 015 546 0.04
600 000 Caisse d'Amortissement de la Dette Sociale 4.000%15/12/2025
EUR 895 696 853 476 0.02
2 000 000 Caisse d'Amortissement de la Dette Sociale - Reg 0.125%25/10/2023
EUR 2 287 683 2 275 123 0.04
200 000 Caisse des Depots et Consignations 0.750% 18/09/2028 EUR 228 959 231 511 0.00800 000 Canada Housing Trust No 1 144A 1.250% 15/12/2020 CAD 617 749 594 232 0.01
4 000 000 Canada Housing Trust No 1 144A 1.750% 15/06/2022 CAD 3 035 282 2 992 178 0.064 000 000 Canada Housing Trust No 1 144A 1.900% 15/09/2026 CAD 2 931 808 2 968 135 0.061 000 000 Canada Housing Trust No 1 144A 2.350% 15/06/2023 CAD 764 792 763 621 0.01
400 000 Canada Housing Trust No 1 144A 2.350% 15/06/2027 CAD 313 021 306 023 0.01500 000 Canada Housing Trust No 1 144A 2.350% 15/03/2028 CAD 396 676 382 264 0.01
1 300 000 Canada Housing Trust No 1 144A 2.400% 15/12/2022 CAD 1 060 935 993 408 0.024 000 000 Canada Housing Trust No 1 144A 2.550% 15/12/2023 CAD 3 079 441 3 083 409 0.06
300 000 Canada Housing Trust No 1 144A 2.550% 15/03/2025 CAD 238 584 232 017 0.001 000 000 Canada Housing Trust No 1 144A 2.650% 15/03/2028 CAD 763 940 782 776 0.021 200 000 Canada Housing Trust No 1 144A 2.650% 15/12/2028 CAD 917 325 940 418 0.022 310 000 Canada Housing Trust No 1 144A 2.900% 15/06/2024 CAD 1 816 109 1 813 124 0.04
11 510 000 Canadian Government Bond 0.500% 01/03/2022 CAD 8 381 505 8 359 709 0.161 620 000 Canadian Government Bond 0.750% 01/05/2019 CAD 1 275 422 1 211 699 0.022 500 000 Canadian Government Bond 0.750% 01/09/2020 CAD 1 953 081 1 849 863 0.04
189Merrill Lynch Investment Solutions
Merrill Lynch Investment Solutions – Global Debt -Government UCITS FundSchedule of Investments as at March 31, 2019 (cont.)(expressed in USD)
The accompanying notes form an integral part of these financial statements.
Audited annual report

Nominalvalue Description
QuotationCurrency
CostUSD
Marketvalue USD
% of netassets
Transferable securities and money market instruments admitted to an official exchange listing or dealt in on another regulated market (cont.)
Supranationals, Governments and Local Public Authorities, Debt Instruments (cont.)12 000 000 Canadian Government Bond 0.750% 01/03/2021 CAD 9 041 239 8 847 008 0.17
6 000 000 Canadian Government Bond 0.750% 01/09/2021 CAD 4 515 501 4 406 662 0.083 300 000 Canadian Government Bond 1.000% 01/09/2022 CAD 2 452 414 2 425 270 0.057 900 000 Canadian Government Bond 1.500% 01/03/2020 CAD 6 172 522 5 904 347 0.115 300 000 Canadian Government Bond 1.500% 01/06/2026 CAD 3 894 772 3 943 014 0.082 500 000 Canadian Government Bond 2.000% 01/06/2028 CAD 1 883 441 1 929 713 0.04
920 000 Canadian Government Bond 2.000% 01/12/2051 CAD 661 136 703 454 0.013 300 000 Canadian Government Bond 2.250% 01/06/2025 CAD 2 531 573 2 569 774 0.052 820 000 Canadian Government Bond 2.250% 01/06/2029 CAD 2 186 983 2 228 306 0.044 800 000 Canadian Government Bond 2.500% 01/06/2024 CAD 3 772 808 3 763 686 0.071 280 000 Canadian Government Bond 2.750% 01/12/2048 CAD 1 049 890 1 139 204 0.02
950 000 Canadian Government Bond 2.750% 01/12/2064 CAD 829 388 902 143 0.027 730 000 Canadian Government Bond 3.250% 01/06/2021 CAD 6 100 365 5 994 330 0.123 400 000 Canadian Government Bond 3.500% 01/12/2045 CAD 3 206 297 3 377 808 0.071 500 000 Canadian Government Bond 4.000% 01/06/2041 CAD 1 534 147 1 544 182 0.03
380 000 Canadian Government Bond 5.000% 01/06/2037 CAD 424 475 421 287 0.014 100 000 Canadian Government Bond 5.000% 01/06/2037 CAD 4 391 785 4 545 462 0.091 000 000 Canadian Government Bond 5.750% 01/06/2033 CAD 1 063 303 1 121 150 0.02
600 000 Cassa Depositi e Prestiti SpA 1.500% 21/06/2024 EUR 688 035 653 767 0.01600 000 City of Montreal Canada 3.000% 01/09/2027 CAD 459 875 463 432 0.01200 000 City of Montreal Canada 3.150% 01/12/2036 CAD 151 339 152 307 0.00400 000 City of Paris France - Reg 1.375% 20/11/2034 EUR 460 236 477 921 0.01
1 000 000 City of Toronto Canada 3.400% 21/05/2024 CAD 788 530 790 007 0.02100 000 City of Toronto Canada 3.500% 02/06/2036 CAD 82 676 80 175 0.00150 000 City of Toronto Canada 4.150% 10/03/2044 CAD 132 385 133 258 0.00250 000 CPPIB Capital, Inc. 3.000% 15/06/2028 CAD 192 098 196 581 0.00200 000 Cyprus Government International Bond 2.750% 26/02/2034 EUR 238 594 239 010 0.00600 000 Cyprus Government International Bond - Reg 2.375%
25/09/2028EUR 699 048 722 651 0.01
38 000 000 Czech Republic Government Bond 0.250% 10/02/2027 CZK 1 537 318 1 457 599 0.0326 130 000 Czech Republic Government Bond 0.950% 15/05/2030 CZK 1 053 914 1 022 149 0.0245 000 000 Czech Republic Government Bond 2.750% 23/07/2029 CZK 2 141 571 2 105 360 0.0438 000 000 Czech Republic Government Bond 3.850% 29/09/2021 CZK 1 843 207 1 733 095 0.03
3 000 000 Czech Republic Government Bond 4.200% 04/12/2036 CZK 183 449 161 692 0.0017 000 000 Czech Republic Government Bond 5.700% 25/05/2024 CZK 988 378 885 661 0.02
3 500 000 Denmark Government Bond 0.250% 15/11/2020 DKK 578 237 534 129 0.0116 090 000 Denmark Government Bond 0.500% 15/11/2027 DKK 2 564 028 2 563 597 0.0524 200 000 Denmark Government Bond 1.500% 15/11/2023 DKK 4 042 047 3 978 531 0.0812 000 000 Denmark Government Bond 1.750% 15/11/2025 DKK 2 098 313 2 057 849 0.0420 500 000 Denmark Government Bond 4.500% 15/11/2039 DKK 5 448 067 5 638 503 0.11
200 000 FADE - Fondo de Amortizacion del Deficit Electrico 0.500%17/03/2023
EUR 247 307 227 955 0.00
100 000 FADE - Fondo de Amortizacion del Deficit Electrico 0.625%17/03/2022
EUR 119 778 114 540 0.00
1 500 000 Federal Home Loan Banks 1.125% 14/07/2021 USD 1 454 523 1 460 493 0.031 500 000 Federal Home Loan Banks 1.375% 28/09/2020 USD 1 479 627 1 477 572 0.032 800 000 Federal Home Loan Banks 2.510% 29/12/2022 USD 2 761 049 2 794 251 0.05
190 Merrill Lynch Investment Solutions
Merrill Lynch Investment Solutions – Global Debt -Government UCITS FundSchedule of Investments as at March 31, 2019 (cont.)(expressed in USD)
The accompanying notes form an integral part of these financial statements.
Audited annual report

Nominalvalue Description
QuotationCurrency
CostUSD
Marketvalue USD
% of netassets
Transferable securities and money market instruments admitted to an official exchange listing or dealt in on another regulated market (cont.)
Supranationals, Governments and Local Public Authorities, Debt Instruments (cont.)1 000 000 Federal Home Loan Banks 3.000% 12/10/2021 USD 1 000 774 1 017 222 0.021 500 000 Federal Home Loan Banks 3.250% 09/06/2028 USD 1 512 747 1 568 346 0.032 000 000 Federal Home Loan Banks 3.375% 08/12/2023 USD 2 057 716 2 090 967 0.04
700 000 Federal Home Loan Banks 5.500% 15/07/2036 USD 899 889 933 529 0.02500 000 Federal Home Loan Mortgage Corp. 1.875% 17/11/2020 USD 499 129 496 191 0.01500 000 Federal Home Loan Mortgage Corp. 2.375% 16/02/2021 USD 498 981 500 484 0.01
2 500 000 Federal Home Loan Mortgage Corp. 2.375% 13/01/2022 USD 2 497 481 2 506 952 0.052 000 000 Federal Home Loan Mortgage Corp. 2.750% 19/06/2023 USD 1 978 383 2 034 886 0.04
700 000 Federal Home Loan Mortgage Corp. 6.250% 15/07/2032 USD 920 472 965 530 0.026 700 000 Federal National Mortgage Association 1.500% 30/07/2020 USD 6 607 649 6 622 642 0.132 400 000 Federal National Mortgage Association 1.875% 24/09/2026 USD 2 240 009 2 295 604 0.04
500 000 Federal National Mortgage Association 2.000% 05/10/2022 USD 496 391 495 285 0.011 200 000 Federal National Mortgage Association 2.375% 19/01/2023 USD 1 192 231 1 203 232 0.021 500 000 Federal National Mortgage Association 2.625% 06/09/2024 USD 1 481 651 1 521 878 0.034 500 000 Federal National Mortgage Association 2.750% 22/06/2021 USD 4 479 692 4 542 755 0.091 500 000 Federal National Mortgage Association 6.625% 15/11/2030 USD 1 995 711 2 065 597 0.04
150 000 Financement-Quebec 5.250% 01/06/2034 CAD 152 972 147 212 0.002 100 000 Finland Government Bond 144A 0.000% 15/09/2023 EUR 2 431 247 2 395 288 0.05
240 000 Finland Government Bond 144A 0.375% 15/09/2020 EUR 288 277 273 139 0.01850 000 Finland Government Bond 144A 0.500% 15/04/2026 EUR 1 043 176 993 676 0.02
1 240 000 Finland Government Bond 144A 0.500% 15/09/2027 EUR 1 454 014 1 443 459 0.031 700 000 Finland Government Bond 144A 0.750% 15/04/2031 EUR 1 948 471 1 990 505 0.04
240 000 Finland Government Bond 144A 0.875% 15/09/2025 EUR 297 761 287 633 0.01510 000 Finland Government Bond 144A 1.375% 15/04/2047 EUR 597 858 645 007 0.01
2 400 000 Finland Government Bond 144A 1.625% 15/09/2022 EUR 2 998 967 2 891 024 0.06920 000 Finland Government Bond 144A 2.000% 15/04/2024 EUR 1 213 002 1 153 658 0.02610 000 Finland Government Bond 144A 2.625% 04/07/2042 EUR 936 132 961 355 0.02
3 350 000 Finland Government Bond 144A 3.500% 15/04/2021 EUR 4 136 952 4 072 981 0.08230 000 Finland Government Bond 144A 4.000% 04/07/2025 EUR 336 639 326 749 0.01
1 870 000 Finland Government Bond - Reg 144A 0.500% 15/09/2028 EUR 2 141 305 2 164 821 0.04100 000 Finnvera OYJ 0.500% 13/04/2026 EUR 119 037 115 127 0.00300 000 Finnvera OYJ 1.250% 14/07/2033 EUR 369 097 359 455 0.01500 000 Finnvera OYJ - Reg 0.750% 07/08/2028 EUR 573 345 579 949 0.01100 000 Flemish Community 1.000% 13/10/2036 EUR 112 157 109 797 0.00600 000 Flemish Community 1.500% 12/07/2038 EUR 683 245 702 140 0.01600 000 Fondo De Titulizacion Del Deficit Del Sistema Electrico FTA -
Reg 0.850% 17/12/2023EUR 684 080 691 967 0.01
900 000 Free and Hanseatic City of Hamburg 0.500% 27/04/2026 EUR 1 036 961 1 036 655 0.02500 000 Free and Hanseatic City of Hamburg - Reg 1.200%
03/06/2033EUR 570 920 590 269 0.01
10 100 000 French Republic Government Bond 0.000% 25/02/2020 EUR 11 961 659 11 395 741 0.2213 970 000 French Republic Government Bond 0.000% 25/02/2021 EUR 16 170 799 15 846 369 0.30
3 200 000 French Republic Government Bond 0.000% 25/05/2021 EUR 3 766 856 3 633 927 0.0715 930 000 French Republic Government Bond 0.000% 25/05/2022 EUR 18 687 606 18 144 339 0.3513 740 000 French Republic Government Bond 0.000% 25/03/2023 EUR 15 966 945 15 658 081 0.3011 100 000 French Republic Government Bond 0.250% 25/11/2020 EUR 13 196 195 12 628 154 0.24
5 590 000 French Republic Government Bond 0.250% 25/11/2026 EUR 6 420 186 6 391 143 0.12
191Merrill Lynch Investment Solutions
Merrill Lynch Investment Solutions – Global Debt -Government UCITS FundSchedule of Investments as at March 31, 2019 (cont.)(expressed in USD)
The accompanying notes form an integral part of these financial statements.
Audited annual report

Nominalvalue Description
QuotationCurrency
CostUSD
Marketvalue USD
% of netassets
Transferable securities and money market instruments admitted to an official exchange listing or dealt in on another regulated market (cont.)
Supranationals, Governments and Local Public Authorities, Debt Instruments (cont.)6 800 000 French Republic Government Bond 0.500% 25/05/2026 EUR 8 302 797 7 932 487 0.153 860 000 French Republic Government Bond 0.750% 25/05/2028 EUR 4 658 986 4 552 202 0.098 020 000 French Republic Government Bond 0.750% 25/11/2028 EUR 9 210 399 9 427 756 0.188 510 000 French Republic Government Bond 1.000% 25/11/2025 EUR 10 262 072 10 259 670 0.203 300 000 French Republic Government Bond 1.000% 25/05/2027 EUR 4 087 664 3 984 940 0.085 450 000 French Republic Government Bond 1.250% 25/05/2034 EUR 6 453 904 6 587 811 0.133 910 000 French Republic Government Bond 144A 1.250% 25/05/2036 EUR 4 593 415 4 666 935 0.09
10 920 000 French Republic Government Bond 1.500% 25/05/2031 EUR 13 470 422 13 719 783 0.264 850 000 French Republic Government Bond 1.750% 25/05/2023 EUR 6 045 197 5 930 369 0.11
15 200 000 French Republic Government Bond 1.750% 25/11/2024 EUR 19 295 617 18 980 974 0.363 560 000 French Republic Government Bond 144A 1.750% 25/06/2039 EUR 4 427 159 4 555 031 0.092 560 000 French Republic Government Bond 144A 1.750% 25/05/2066 EUR 2 944 645 3 060 913 0.062 700 000 French Republic Government Bond 144A 2.000% 25/05/2048 EUR 3 447 230 3 549 490 0.07
13 830 000 French Republic Government Bond 2.250% 25/10/2022 EUR 17 694 497 17 023 060 0.33800 000 French Republic Government Bond 2.250% 25/05/2024 EUR 1 058 889 1 016 163 0.02
7 050 000 French Republic Government Bond 2.500% 25/10/2020 EUR 9 028 057 8 296 507 0.169 850 000 French Republic Government Bond 2.500% 25/05/2030 EUR 13 402 820 13 602 782 0.265 320 000 French Republic Government Bond 2.750% 25/10/2027 EUR 7 408 503 7 337 684 0.141 300 000 French Republic Government Bond 3.000% 25/04/2022 EUR 1 704 549 1 616 016 0.034 820 000 French Republic Government Bond 3.250% 25/05/2045 EUR 7 702 917 7 918 757 0.159 200 000 French Republic Government Bond 3.500% 25/04/2026 EUR 13 099 891 12 970 829 0.252 840 000 French Republic Government Bond 4.000% 25/10/2038 EUR 4 928 327 4 959 654 0.102 500 000 French Republic Government Bond 4.000% 25/04/2055 EUR 4 701 512 4 857 263 0.092 590 000 French Republic Government Bond 4.000% 25/04/2060 EUR 5 006 111 5 174 806 0.102 650 000 French Republic Government Bond 4.250% 25/10/2023 EUR 3 695 974 3 607 411 0.078 670 000 French Republic Government Bond 4.500% 25/04/2041 EUR 16 028 475 16 444 506 0.321 560 000 French Republic Government Bond 4.750% 25/04/2035 EUR 2 885 170 2 826 200 0.054 090 000 French Republic Government Bond 5.750% 25/10/2032 EUR 7 709 911 7 720 754 0.153 800 000 French Republic Government Bond - Reg 0.000% 25/03/2024 EUR 4 299 036 4 322 102 0.083 000 000 French Republic Government Bond - Reg 0.500% 25/05/2025 EUR 3 480 218 3 505 579 0.071 100 000 French Republic Government Bond - Reg 144A 1.500%
25/05/2050EUR 1 217 246 1 278 615 0.02
5 500 000 French Republic Government Bond - Reg 3.250% 25/10/2021 EUR 6 840 298 6 778 358 0.13300 000 Gemeinsame Deutsche Bundeslaender 0.250% 18/03/2024 EUR 357 075 342 580 0.01
1 200 000 Gemeinsame Deutsche Bundeslaender 0.375% 17/04/2025 EUR 1 387 072 1 375 501 0.03350 000 Gemeinsame Deutsche Bundeslaender 0.625% 25/10/2027 EUR 424 247 404 373 0.01
1 000 000 Gemeinsame Deutsche Bundeslaender - Reg 0.750%25/09/2028
EUR 1 159 518 1 162 800 0.02
700 000 000 Hungary Government Bond 1.000% 23/09/2020 HUF 2 505 075 2 471 535 0.05150 000 000 Hungary Government Bond 1.750% 26/10/2022 HUF 564 285 530 828 0.01
85 000 000 Hungary Government Bond 2.500% 27/10/2021 HUF 336 216 310 074 0.01140 000 000 Hungary Government Bond 2.750% 22/12/2026 HUF 506 038 498 445 0.01510 000 000 Hungary Government Bond 3.000% 26/06/2024 HUF 1 989 721 1 893 271 0.04
50 000 000 Hungary Government Bond 6.750% 22/10/2028 HUF 274 467 234 272 0.00700 000 Hydro-Quebec 4.000% 15/02/2055 CAD 634 909 676 102 0.01
1 000 000 Hydro-Quebec 5.000% 15/02/2045 CAD 1 010 082 1 056 552 0.021 850 000 Hydro-Quebec 5.000% 15/02/2050 CAD 1 989 522 2 032 736 0.04
192 Merrill Lynch Investment Solutions
Merrill Lynch Investment Solutions – Global Debt -Government UCITS FundSchedule of Investments as at March 31, 2019 (cont.)(expressed in USD)
The accompanying notes form an integral part of these financial statements.
Audited annual report

Nominalvalue Description
QuotationCurrency
CostUSD
Marketvalue USD
% of netassets
Transferable securities and money market instruments admitted to an official exchange listing or dealt in on another regulated market (cont.)
Supranationals, Governments and Local Public Authorities, Debt Instruments (cont.)1 000 000 Hydro-Quebec 6.500% 15/02/2035 CAD 1 115 751 1 118 425 0.02
37 000 000 000 Indonesia Treasury Bond 6.125% 15/05/2028 IDR 2 254 676 2 351 994 0.0560 000 000 000 Indonesia Treasury Bond 8.250% 15/07/2021 IDR 4 236 332 4 342 879 0.0870 000 000 000 Indonesia Treasury Bond 8.250% 15/05/2029 IDR 5 023 091 5 134 972 0.1070 000 000 000 Indonesia Treasury Bond 8.250% 15/05/2036 IDR 4 785 398 4 998 806 0.1060 000 000 000 Indonesia Treasury Bond 8.375% 15/09/2026 IDR 4 277 586 4 410 463 0.0820 000 000 000 Indonesia Treasury Bond 8.750% 15/05/2031 IDR 1 357 892 1 498 622 0.03
100 000 Instituto de Credito Oficial 0.250% 30/04/2022 EUR 118 617 113 460 0.00400 000 Ireland Government Bond 0.000% 18/10/2022 EUR 475 053 453 429 0.01320 000 Ireland Government Bond 0.900% 15/05/2028 EUR 387 318 375 122 0.01
3 230 000 Ireland Government Bond 1.000% 15/05/2026 EUR 3 813 918 3 840 939 0.071 060 000 Ireland Government Bond 1.700% 15/05/2037 EUR 1 272 204 1 297 512 0.031 300 000 Ireland Government Bond 2.000% 18/02/2045 EUR 1 613 806 1 664 142 0.032 300 000 Ireland Government Bond 2.400% 15/05/2030 EUR 3 063 467 3 069 464 0.061 900 000 Ireland Government Bond 3.400% 18/03/2024 EUR 2 690 300 2 505 777 0.051 000 000 Ireland Government Bond 3.900% 20/03/2023 EUR 1 321 273 1 309 288 0.033 800 000 Ireland Government Bond 4.500% 18/04/2020 EUR 4 660 171 4 493 061 0.09
500 000 Ireland Government Bond 5.000% 18/10/2020 EUR 673 594 609 673 0.011 900 000 Ireland Government Bond 5.400% 13/03/2025 EUR 2 836 659 2 813 313 0.051 210 000 Ireland Government Bond - Reg 1.100% 15/05/2029 EUR 1 396 814 1 431 146 0.03
600 000 Ireland Government Bond - Reg 1.300% 15/05/2033 EUR 677 909 705 432 0.0111 000 000 Israel Government Bond - Fixed 1.000% 30/04/2021 ILS 2 998 751 3 089 947 0.06
1 500 000 Israel Government Bond - Fixed 1.250% 30/11/2022 ILS 442 445 421 274 0.011 000 000 Israel Government Bond - Fixed 1.750% 31/08/2025 ILS 289 053 284 817 0.01
450 000 Israel Government Bond - Fixed 2.000% 31/03/2027 ILS 130 938 127 721 0.003 700 000 Israel Government Bond - Fixed 3.750% 31/03/2024 ILS 1 235 010 1 151 487 0.024 180 000 Israel Government Bond - Fixed 5.500% 31/01/2042 ILS 1 674 278 1 692 455 0.035 800 000 Israel Government Bond - Fixed 6.250% 30/10/2026 ILS 2 078 280 2 182 980 0.041 400 000 Israel Government International Bond 3.750% 31/03/2047 ILS 421 976 434 386 0.017 000 000 Italy Buoni Poliennali Del Tesoro 0.050% 15/04/2021 EUR 7 894 915 7 781 963 0.156 900 000 Italy Buoni Poliennali Del Tesoro 0.200% 15/10/2020 EUR 7 867 108 7 741 853 0.151 700 000 Italy Buoni Poliennali Del Tesoro 0.650% 01/11/2020 EUR 2 055 559 1 919 267 0.044 640 000 Italy Buoni Poliennali Del Tesoro 0.650% 15/10/2023 EUR 5 070 524 5 034 446 0.10
13 000 000 Italy Buoni Poliennali Del Tesoro 0.900% 01/08/2022 EUR 14 582 585 14 499 774 0.281 200 000 Italy Buoni Poliennali Del Tesoro 0.950% 15/03/2023 EUR 1 495 833 1 329 095 0.03
12 500 000 Italy Buoni Poliennali Del Tesoro 1.200% 01/04/2022 EUR 15 628 720 14 121 325 0.2711 420 000 Italy Buoni Poliennali Del Tesoro 1.250% 01/12/2026 EUR 13 019 476 12 095 013 0.2311 100 000 Italy Buoni Poliennali Del Tesoro 1.450% 15/09/2022 EUR 12 970 277 12 599 512 0.2414 700 000 Italy Buoni Poliennali Del Tesoro 1.450% 15/11/2024 EUR 16 203 630 16 207 995 0.31
1 000 000 Italy Buoni Poliennali Del Tesoro 1.500% 01/06/2025 EUR 1 238 540 1 096 454 0.024 090 000 Italy Buoni Poliennali Del Tesoro 1.600% 01/06/2026 EUR 4 944 894 4 457 980 0.094 430 000 Italy Buoni Poliennali Del Tesoro 144A 1.650% 01/03/2032 EUR 4 556 950 4 395 175 0.086 350 000 Italy Buoni Poliennali Del Tesoro 1.850% 15/05/2024 EUR 7 323 172 7 192 043 0.14
360 000 Italy Buoni Poliennali Del Tesoro 2.000% 01/12/2025 EUR 443 059 404 630 0.014 870 000 Italy Buoni Poliennali Del Tesoro 2.000% 01/02/2028 EUR 5 552 725 5 339 873 0.10
11 270 000 Italy Buoni Poliennali Del Tesoro 2.050% 01/08/2027 EUR 12 516 516 12 450 780 0.248 400 000 Italy Buoni Poliennali Del Tesoro 2.200% 01/06/2027 EUR 9 355 283 9 406 643 0.18
193Merrill Lynch Investment Solutions
Merrill Lynch Investment Solutions – Global Debt -Government UCITS FundSchedule of Investments as at March 31, 2019 (cont.)(expressed in USD)
The accompanying notes form an integral part of these financial statements.
Audited annual report

Nominalvalue Description
QuotationCurrency
CostUSD
Marketvalue USD
% of netassets
Transferable securities and money market instruments admitted to an official exchange listing or dealt in on another regulated market (cont.)
Supranationals, Governments and Local Public Authorities, Debt Instruments (cont.)6 600 000 Italy Buoni Poliennali Del Tesoro 144A 2.250% 01/09/2036 EUR 6 884 857 6 664 407 0.134 040 000 Italy Buoni Poliennali Del Tesoro 144A 2.450% 01/09/2033 EUR 4 447 613 4 308 318 0.083 240 000 Italy Buoni Poliennali Del Tesoro 144A 2.700% 01/03/2047 EUR 3 292 240 3 223 298 0.063 000 000 Italy Buoni Poliennali Del Tesoro 2.800% 01/12/2028 EUR 3 394 082 3 463 000 0.07
900 000 Italy Buoni Poliennali Del Tesoro 144A 2.800% 01/03/2067 EUR 934 518 855 042 0.023 570 000 Italy Buoni Poliennali Del Tesoro 144A 2.950% 01/09/2038 EUR 3 909 934 3 851 374 0.071 470 000 Italy Buoni Poliennali Del Tesoro 3.000% 01/08/2029 EUR 1 724 095 1 697 111 0.034 280 000 Italy Buoni Poliennali Del Tesoro 144A 3.250% 01/09/2046 EUR 4 807 276 4 701 925 0.093 320 000 Italy Buoni Poliennali Del Tesoro 144A 3.450% 01/03/2048 EUR 3 848 484 3 730 616 0.078 320 000 Italy Buoni Poliennali Del Tesoro 144A 3.500% 01/03/2030 EUR 9 778 594 10 061 136 0.197 360 000 Italy Buoni Poliennali Del Tesoro 3.750% 01/03/2021 EUR 8 910 545 8 779 760 0.177 500 000 Italy Buoni Poliennali Del Tesoro 4.000% 01/09/2020 EUR 9 158 015 8 868 044 0.174 220 000 Italy Buoni Poliennali Del Tesoro 144A 4.000% 01/02/2037 EUR 5 577 350 5 287 089 0.10
12 200 000 Italy Buoni Poliennali Del Tesoro 144A 4.500% 01/02/2020 EUR 14 966 240 14 206 828 0.277 490 000 Italy Buoni Poliennali Del Tesoro 4.500% 01/05/2023 EUR 9 935 116 9 445 746 0.185 900 000 Italy Buoni Poliennali Del Tesoro 4.500% 01/03/2024 EUR 7 640 334 7 507 346 0.141 500 000 Italy Buoni Poliennali Del Tesoro 4.750% 01/09/2021 EUR 1 927 716 1 844 166 0.044 280 000 Italy Buoni Poliennali Del Tesoro 144A 4.750% 01/09/2028 EUR 5 931 019 5 757 403 0.112 690 000 Italy Buoni Poliennali Del Tesoro 144A 4.750% 01/09/2044 EUR 4 122 433 3 671 582 0.075 120 000 Italy Buoni Poliennali Del Tesoro 144A 5.000% 01/08/2034 EUR 7 861 879 7 129 876 0.14
750 000 Italy Buoni Poliennali Del Tesoro 144A 5.000% 01/08/2039 EUR 1 221 107 1 049 111 0.022 950 000 Italy Buoni Poliennali Del Tesoro 144A 5.000% 01/09/2040 EUR 4 190 782 4 112 433 0.083 240 000 Italy Buoni Poliennali Del Tesoro - Reg 0.450% 01/06/2021 EUR 3 673 864 3 629 812 0.074 000 000 Italy Buoni Poliennali Del Tesoro - Reg 2.450% 01/10/2023 EUR 4 638 514 4 674 271 0.092 900 000 Italy Buoni Poliennali Del Tesoro - Reg 144A 3.350%
01/03/2035EUR 3 319 549 3 364 519 0.06
2 675 500 000 Japan Government Five Year Bond 0.100% 20/03/2020 JPY 23 930 487 24 236 257 0.47400 000 000 Japan Government Five Year Bond 0.100% 20/06/2020 JPY 3 605 584 3 625 893 0.07450 000 000 Japan Government Five Year Bond 0.100% 20/09/2020 JPY 4 040 378 4 081 976 0.08
2 490 000 000 Japan Government Five Year Bond 0.100% 20/12/2020 JPY 22 357 085 22 602 456 0.432 696 550 000 Japan Government Five Year Bond 0.100% 20/03/2021 JPY 24 467 861 24 493 937 0.471 800 000 000 Japan Government Five Year Bond 0.100% 20/06/2021 JPY 16 448 582 16 362 542 0.311 520 000 000 Japan Government Five Year Bond 0.100% 20/09/2021 JPY 13 631 326 13 827 969 0.271 770 000 000 Japan Government Five Year Bond 0.100% 20/12/2021 JPY 16 095 457 16 115 260 0.311 160 000 000 Japan Government Five Year Bond 0.100% 20/03/2022 JPY 10 601 504 10 569 483 0.201 870 000 000 Japan Government Five Year Bond 0.100% 20/06/2022 JPY 16 902 558 17 052 758 0.334 075 000 000 Japan Government Five Year Bond 0.100% 20/09/2022 JPY 36 443 104 37 193 924 0.713 100 000 000 Japan Government Five Year Bond 0.100% 20/12/2022 JPY 27 638 426 28 325 012 0.542 150 000 000 Japan Government Five Year Bond 0.100% 20/03/2023 JPY 19 544 076 19 657 198 0.38
340 000 000 Japan Government Five Year Bond 0.100% 20/06/2023 JPY 3 093 391 3 111 468 0.061 800 000 000 Japan Government Five Year Bond 0.100% 20/09/2023 JPY 16 177 127 16 479 306 0.32
800 000 000 Japan Government Five Year Bond 0.100% 20/12/2023 JPY 7 272 902 7 330 569 0.14540 000 000 Japan Government Forty Year Bond 0.400% 20/03/2056 JPY 4 089 722 4 618 284 0.09230 000 000 Japan Government Forty Year Bond 0.800% 20/03/2058 JPY 2 026 370 2 238 139 0.04592 750 000 Japan Government Forty Year Bond 0.900% 20/03/2057 JPY 5 481 598 5 951 277 0.11402 000 000 Japan Government Forty Year Bond 1.400% 20/03/2055 JPY 4 419 472 4 635 249 0.09447 000 000 Japan Government Forty Year Bond 1.700% 20/03/2054 JPY 5 161 806 5 525 014 0.11
194 Merrill Lynch Investment Solutions
Merrill Lynch Investment Solutions – Global Debt -Government UCITS FundSchedule of Investments as at March 31, 2019 (cont.)(expressed in USD)
The accompanying notes form an integral part of these financial statements.
Audited annual report

Nominalvalue Description
QuotationCurrency
CostUSD
Marketvalue USD
% of netassets
Transferable securities and money market instruments admitted to an official exchange listing or dealt in on another regulated market (cont.)
Supranationals, Governments and Local Public Authorities, Debt Instruments (cont.)317 000 000 Japan Government Forty Year Bond 1.900% 20/03/2053 JPY 3 694 262 4 070 551 0.08802 850 000 Japan Government Forty Year Bond 2.000% 20/03/2052 JPY 9 327 351 10 474 587 0.20165 000 000 Japan Government Forty Year Bond 2.200% 20/03/2049 JPY 2 092 127 2 188 730 0.04160 000 000 Japan Government Forty Year Bond 2.200% 20/03/2050 JPY 1 978 532 2 139 390 0.04634 000 000 Japan Government Forty Year Bond 2.200% 20/03/2051 JPY 7 618 271 8 543 262 0.16
1 258 000 000 Japan Government Ten Year Bond 0.100% 20/03/2026 JPY 11 789 662 11 614 493 0.22870 000 000 Japan Government Ten Year Bond 0.100% 20/06/2026 JPY 7 961 262 8 036 682 0.15
1 700 000 000 Japan Government Ten Year Bond 0.100% 20/09/2026 JPY 15 275 874 15 710 159 0.301 500 000 000 Japan Government Ten Year Bond 0.100% 20/12/2026 JPY 13 503 941 13 867 191 0.271 940 000 000 Japan Government Ten Year Bond 0.100% 20/03/2027 JPY 17 565 361 17 940 859 0.341 995 000 000 Japan Government Ten Year Bond 0.100% 20/06/2027 JPY 18 146 305 18 444 625 0.353 865 000 000 Japan Government Ten Year Bond 0.100% 20/09/2027 JPY 35 261 274 35 731 477 0.692 275 000 000 Japan Government Ten Year Bond 0.100% 20/12/2027 JPY 20 742 368 21 018 340 0.402 370 000 000 Japan Government Ten Year Bond 0.100% 20/03/2028 JPY 21 635 140 21 884 038 0.421 250 000 000 Japan Government Ten Year Bond 0.100% 20/06/2028 JPY 11 244 448 11 528 888 0.22
650 000 000 Japan Government Ten Year Bond 0.100% 20/09/2028 JPY 5 803 618 5 991 498 0.12500 000 000 Japan Government Ten Year Bond 0.100% 20/12/2028 JPY 4 556 926 4 603 740 0.09
1 615 000 000 Japan Government Ten Year Bond 0.300% 20/12/2024 JPY 14 735 331 15 011 905 0.29750 000 000 Japan Government Ten Year Bond 0.300% 20/12/2025 JPY 6 996 515 7 010 909 0.13
1 300 000 000 Japan Government Ten Year Bond 0.400% 20/03/2025 JPY 12 249 545 12 171 387 0.23420 000 000 Japan Government Ten Year Bond 0.400% 20/06/2025 JPY 3 947 697 3 939 694 0.08
1 820 000 000 Japan Government Ten Year Bond 0.400% 20/09/2025 JPY 16 828 662 17 100 617 0.331 720 000 000 Japan Government Ten Year Bond 0.500% 20/09/2024 JPY 15 871 958 16 143 618 0.31
650 000 000 Japan Government Ten Year Bond 0.500% 20/12/2024 JPY 5 926 362 6 109 888 0.121 510 000 000 Japan Government Ten Year Bond 0.600% 20/03/2023 JPY 14 628 770 14 075 598 0.27
940 000 000 Japan Government Ten Year Bond 0.600% 20/09/2023 JPY 8 656 173 8 797 282 0.171 275 000 000 Japan Government Ten Year Bond 0.600% 20/12/2023 JPY 11 777 792 11 955 177 0.232 660 000 000 Japan Government Ten Year Bond 0.600% 20/03/2024 JPY 24 871 245 24 996 093 0.481 900 000 000 Japan Government Ten Year Bond 0.600% 20/06/2024 JPY 17 995 420 17 885 938 0.341 200 000 000 Japan Government Ten Year Bond 0.800% 20/09/2020 JPY 11 156 496 10 996 720 0.21
255 000 000 Japan Government Ten Year Bond 0.800% 20/06/2022 JPY 2 339 682 2 377 489 0.051 720 000 000 Japan Government Ten Year Bond 0.800% 20/09/2022 JPY 15 884 723 16 076 643 0.31
690 450 000 Japan Government Ten Year Bond 0.800% 20/12/2022 JPY 6 431 235 6 470 649 0.124 130 000 000 Japan Government Ten Year Bond 0.800% 20/06/2023 JPY 38 965 730 38 892 932 0.75
605 000 000 Japan Government Ten Year Bond 0.800% 20/09/2023 JPY 5 696 992 5 711 329 0.11805 000 000 Japan Government Ten Year Bond 0.900% 20/03/2022 JPY 7 725 854 7 508 315 0.14350 000 000 Japan Government Ten Year Bond 0.900% 20/06/2022 JPY 3 256 350 3 273 560 0.06790 000 000 Japan Government Ten Year Bond 1.000% 20/09/2020 JPY 7 310 785 7 260 491 0.14700 000 000 Japan Government Ten Year Bond 1.000% 20/03/2022 JPY 6 522 301 6 547 626 0.13
2 700 000 000 Japan Government Ten Year Bond 1.200% 20/12/2020 JPY 24 837 792 24 970 945 0.482 010 000 000 Japan Government Ten Year Bond 1.300% 20/03/2021 JPY 19 365 924 18 687 180 0.36
440 000 000 Japan Government Thirty Year Bond 0.300% 20/06/2046 JPY 3 583 524 3 796 518 0.07530 000 000 Japan Government Thirty Year Bond 0.500% 20/09/2046 JPY 4 474 499 4 817 333 0.09493 300 000 Japan Government Thirty Year Bond 0.600% 20/12/2046 JPY 4 291 652 4 593 125 0.09
50 000 000 Japan Government Thirty Year Bond 0.700% 20/06/2048 JPY 437 753 475 846 0.01100 000 000 Japan Government Thirty Year Bond 0.700% 20/12/2048 JPY 925 811 949 948 0.02530 000 000 Japan Government Thirty Year Bond 0.800% 20/03/2046 JPY 4 780 522 5 186 276 0.10
195Merrill Lynch Investment Solutions
Merrill Lynch Investment Solutions – Global Debt -Government UCITS FundSchedule of Investments as at March 31, 2019 (cont.)(expressed in USD)
The accompanying notes form an integral part of these financial statements.
Audited annual report

Nominalvalue Description
QuotationCurrency
CostUSD
Marketvalue USD
% of netassets
Transferable securities and money market instruments admitted to an official exchange listing or dealt in on another regulated market (cont.)
Supranationals, Governments and Local Public Authorities, Debt Instruments (cont.)610 000 000 Japan Government Thirty Year Bond 0.800% 20/03/2047 JPY 5 623 342 5 963 434 0.11430 000 000 Japan Government Thirty Year Bond 0.800% 20/06/2047 JPY 4 123 057 4 201 052 0.08491 000 000 Japan Government Thirty Year Bond 0.800% 20/09/2047 JPY 4 553 649 4 795 019 0.09610 000 000 Japan Government Thirty Year Bond 0.800% 20/12/2047 JPY 5 769 687 5 954 616 0.11550 000 000 Japan Government Thirty Year Bond 0.800% 20/03/2048 JPY 4 931 251 5 362 755 0.10165 000 000 Japan Government Thirty Year Bond 1.400% 20/12/2032 JPY 1 692 746 1 758 166 0.03300 000 000 Japan Government Thirty Year Bond 1.400% 20/09/2045 JPY 3 072 606 3 343 841 0.06
1 320 000 000 Japan Government Thirty Year Bond 1.400% 20/12/2045 JPY 14 167 619 14 725 898 0.28185 000 000 Japan Government Thirty Year Bond 1.500% 20/12/2044 JPY 1 967 754 2 093 742 0.04440 000 000 Japan Government Thirty Year Bond 1.500% 20/03/2045 JPY 4 641 240 4 991 914 0.10585 000 000 Japan Government Thirty Year Bond 1.600% 20/06/2045 JPY 6 521 506 6 770 747 0.13235 000 000 Japan Government Thirty Year Bond 1.700% 20/12/2043 JPY 2 638 202 2 750 127 0.05180 000 000 Japan Government Thirty Year Bond 1.700% 20/03/2044 JPY 1 994 549 2 108 920 0.04165 000 000 Japan Government Thirty Year Bond 1.700% 20/06/2044 JPY 1 845 799 1 936 799 0.04
61 000 000 Japan Government Thirty Year Bond 1.700% 20/09/2044 JPY 667 433 716 530 0.01520 000 000 Japan Government Thirty Year Bond 1.800% 20/03/2043 JPY 6 141 897 6 160 463 0.12240 000 000 Japan Government Thirty Year Bond 1.800% 20/09/2043 JPY 2 680 025 2 854 999 0.06568 000 000 Japan Government Thirty Year Bond 1.900% 20/09/2042 JPY 6 481 391 6 828 419 0.13235 000 000 Japan Government Thirty Year Bond 1.900% 20/06/2043 JPY 2 680 061 2 839 363 0.05883 000 000 Japan Government Thirty Year Bond 2.000% 20/09/2040 JPY 9 857 118 10 639 797 0.20
1 166 000 000 Japan Government Thirty Year Bond 2.000% 20/09/2041 JPY 13 090 701 14 134 214 0.27935 000 000 Japan Government Thirty Year Bond 2.000% 20/03/2042 JPY 10 612 892 11 385 653 0.22380 000 000 Japan Government Thirty Year Bond 2.200% 20/09/2039 JPY 4 372 264 4 677 483 0.09490 000 000 Japan Government Thirty Year Bond 2.200% 20/03/2041 JPY 5 854 432 6 108 521 0.12100 000 000 Japan Government Thirty Year Bond 2.300% 20/05/2030 JPY 1 138 573 1 138 185 0.02260 000 000 Japan Government Thirty Year Bond 2.300% 20/03/2039 JPY 3 044 072 3 234 491 0.06425 000 000 Japan Government Thirty Year Bond 2.300% 20/03/2040 JPY 5 062 930 5 330 115 0.10500 000 000 Japan Government Thirty Year Bond 2.400% 20/09/2038 JPY 5 964 098 6 277 183 0.12
93 800 000 Japan Government Thirty Year Bond 2.500% 20/03/2038 JPY 1 125 259 1 188 794 0.021 365 000 000 Japan Government Twenty Year Bond 0.200% 20/06/2036 JPY 11 973 428 12 248 558 0.241 155 000 000 Japan Government Twenty Year Bond 0.400% 20/03/2036 JPY 10 092 339 10 735 025 0.21
915 000 000 Japan Government Twenty Year Bond 0.500% 20/09/2036 JPY 8 414 033 8 622 584 0.17800 000 000 Japan Government Twenty Year Bond 0.500% 20/03/2038 JPY 7 064 757 7 477 581 0.14180 000 000 Japan Government Twenty Year Bond 0.500% 20/06/2038 JPY 1 588 014 1 680 114 0.03560 000 000 Japan Government Twenty Year Bond 0.500% 20/12/2038 JPY 5 133 671 5 212 753 0.10985 000 000 Japan Government Twenty Year Bond 0.600% 20/12/2036 JPY 9 287 098 9 424 266 0.18625 000 000 Japan Government Twenty Year Bond 0.600% 20/06/2037 JPY 5 637 147 5 966 990 0.11195 000 000 Japan Government Twenty Year Bond 0.600% 20/09/2037 JPY 1 759 398 1 859 410 0.04505 000 000 Japan Government Twenty Year Bond 0.600% 20/12/2037 JPY 4 823 181 4 806 682 0.09540 000 000 Japan Government Twenty Year Bond 0.700% 20/03/2037 JPY 5 135 631 5 245 247 0.10420 000 000 Japan Government Twenty Year Bond 0.700% 20/09/2038 JPY 3 983 208 4 059 488 0.08
1 475 000 000 Japan Government Twenty Year Bond 1.000% 20/12/2035 JPY 14 436 541 15 040 776 0.29515 000 000 Japan Government Twenty Year Bond 1.200% 20/12/2034 JPY 5 343 025 5 391 390 0.10500 000 000 Japan Government Twenty Year Bond 1.200% 20/03/2035 JPY 5 160 836 5 236 346 0.10
2 560 000 000 Japan Government Twenty Year Bond 1.200% 20/09/2035 JPY 26 270 289 26 832 991 0.52460 000 000 Japan Government Twenty Year Bond 1.300% 20/06/2035 JPY 4 717 416 4 885 430 0.09380 000 000 Japan Government Twenty Year Bond 1.400% 20/09/2034 JPY 3 993 174 4 078 807 0.08
196 Merrill Lynch Investment Solutions
Merrill Lynch Investment Solutions – Global Debt -Government UCITS FundSchedule of Investments as at March 31, 2019 (cont.)(expressed in USD)
The accompanying notes form an integral part of these financial statements.
Audited annual report

Nominalvalue Description
QuotationCurrency
CostUSD
Marketvalue USD
% of netassets
Transferable securities and money market instruments admitted to an official exchange listing or dealt in on another regulated market (cont.)
Supranationals, Governments and Local Public Authorities, Debt Instruments (cont.)565 000 000 Japan Government Twenty Year Bond 1.500% 20/03/2034 JPY 5 753 665 6 125 644 0.12
1 015 000 000 Japan Government Twenty Year Bond 1.500% 20/06/2034 JPY 10 575 301 11 019 882 0.211 080 000 000 Japan Government Twenty Year Bond 1.600% 20/06/2030 JPY 11 442 338 11 536 880 0.22
300 000 000 Japan Government Twenty Year Bond 1.600% 20/03/2032 JPY 3 090 660 3 253 585 0.06491 150 000 Japan Government Twenty Year Bond 1.600% 20/03/2033 JPY 5 479 746 5 362 115 0.10900 000 000 Japan Government Twenty Year Bond 1.600% 20/12/2033 JPY 9 499 216 9 875 728 0.19550 000 000 Japan Government Twenty Year Bond 1.700% 20/09/2031 JPY 5 907 417 6 001 278 0.12
1 110 000 000 Japan Government Twenty Year Bond 1.700% 20/12/2031 JPY 11 542 183 12 136 341 0.23525 000 000 Japan Government Twenty Year Bond 1.700% 20/06/2032 JPY 5 899 109 5 766 154 0.11385 000 000 Japan Government Twenty Year Bond 1.700% 20/09/2032 JPY 4 089 635 4 236 478 0.08300 000 000 Japan Government Twenty Year Bond 1.700% 20/12/2032 JPY 3 277 778 3 307 033 0.06525 000 000 Japan Government Twenty Year Bond 1.700% 20/06/2033 JPY 5 686 732 5 806 898 0.11900 000 000 Japan Government Twenty Year Bond 1.700% 20/09/2033 JPY 9 609 738 9 970 863 0.19550 000 000 Japan Government Twenty Year Bond 1.800% 20/06/2031 JPY 5 907 530 6 049 081 0.12685 000 000 Japan Government Twenty Year Bond 1.800% 20/09/2031 JPY 7 329 843 7 551 245 0.15445 000 000 Japan Government Twenty Year Bond 1.800% 20/12/2031 JPY 4 705 824 4 916 328 0.09635 000 000 Japan Government Twenty Year Bond 1.800% 20/03/2032 JPY 6 791 577 7 034 654 0.14209 000 000 Japan Government Twenty Year Bond 1.800% 20/12/2032 JPY 2 243 062 2 329 523 0.04310 000 000 Japan Government Twenty Year Bond 1.900% 20/12/2023 JPY 3 048 806 3 079 835 0.06300 000 000 Japan Government Twenty Year Bond 1.900% 20/12/2028 JPY 3 331 416 3 238 515 0.06185 000 000 Japan Government Twenty Year Bond 1.900% 20/03/2029 JPY 1 947 747 2 003 603 0.04727 400 000 Japan Government Twenty Year Bond 1.900% 20/09/2030 JPY 7 857 598 8 013 854 0.15390 000 000 Japan Government Twenty Year Bond 1.900% 20/03/2031 JPY 4 359 548 4 321 342 0.08635 000 000 Japan Government Twenty Year Bond 1.900% 20/06/2031 JPY 6 882 392 7 053 873 0.14175 000 000 Japan Government Twenty Year Bond 2.000% 20/12/2030 JPY 1 873 851 1 952 724 0.04175 000 000 Japan Government Twenty Year Bond 2.000% 20/03/2031 JPY 1 886 979 1 957 957 0.04
1 950 000 000 Japan Government Twenty Year Bond 2.100% 20/12/2026 JPY 20 034 101 20 772 517 0.401 600 000 000 Japan Government Twenty Year Bond 2.100% 20/09/2027 JPY 16 401 936 17 259 936 0.33
165 000 000 Japan Government Twenty Year Bond 2.100% 20/06/2028 JPY 1 751 585 1 798 282 0.03120 000 000 Japan Government Twenty Year Bond 2.100% 20/09/2029 JPY 1 312 694 1 330 142 0.03230 000 000 Japan Government Twenty Year Bond 2.100% 20/12/2029 JPY 2 539 836 2 557 710 0.05515 000 000 Japan Government Twenty Year Bond 2.100% 20/03/2030 JPY 5 733 737 5 744 913 0.11885 000 000 Japan Government Twenty Year Bond 2.100% 20/12/2030 JPY 9 868 123 9 970 112 0.19220 000 000 Japan Government Twenty Year Bond 2.200% 20/03/2026 JPY 2 277 017 2 324 187 0.04400 000 000 Japan Government Twenty Year Bond 2.200% 20/12/2029 JPY 4 246 737 4 487 076 0.09555 000 000 Japan Government Twenty Year Bond 2.200% 20/03/2031 JPY 6 035 976 6 329 462 0.12380 000 000 Japan Government Twenty Year Bond 2.300% 20/06/2026 JPY 4 013 231 4 060 406 0.08800 000 000 Japan Government Twenty Year Bond 2.300% 20/06/2027 JPY 8 971 382 8 714 532 0.17900 000 000 Japan Government Two Year Bond 0.100% 15/02/2020 JPY 8 501 937 8 150 454 0.16
2 000 000 000 Japan Government Two Year Bond 0.100% 01/06/2020 JPY 17 575 014 18 126 756 0.352 450 000 000 Japan Government Two Year Bond 0.100% 01/09/2020 JPY 22 248 752 22 220 328 0.43
880 000 000 Japan Government Two Year Bond 0.100% 01/10/2020 JPY 7 840 201 7 982 928 0.15800 000 000 Japan Government Two Year Bond 0.100% 01/01/2021 JPY 7 354 960 7 262 195 0.14900 000 000 Japan Government Two Year Bond 0.100% 01/03/2021 JPY 8 107 316 8 173 790 0.16
1 200 000 Kingdom of Belgium Government Bond 144A 0.200%22/10/2023
EUR 1 476 369 1 378 249 0.03
197Merrill Lynch Investment Solutions
Merrill Lynch Investment Solutions – Global Debt -Government UCITS FundSchedule of Investments as at March 31, 2019 (cont.)(expressed in USD)
The accompanying notes form an integral part of these financial statements.
Audited annual report
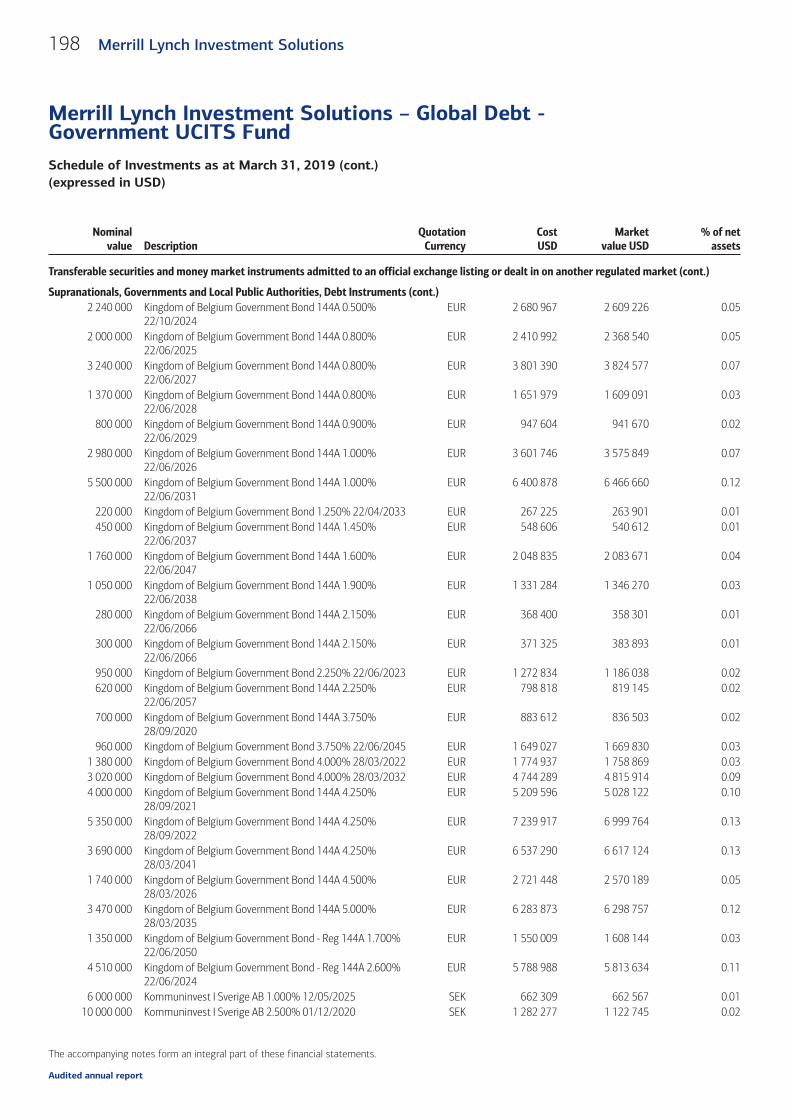
Nominalvalue Description
QuotationCurrency
CostUSD
Marketvalue USD
% of netassets
Transferable securities and money market instruments admitted to an official exchange listing or dealt in on another regulated market (cont.)
Supranationals, Governments and Local Public Authorities, Debt Instruments (cont.)2 240 000 Kingdom of Belgium Government Bond 144A 0.500%
22/10/2024EUR 2 680 967 2 609 226 0.05
2 000 000 Kingdom of Belgium Government Bond 144A 0.800%22/06/2025
EUR 2 410 992 2 368 540 0.05
3 240 000 Kingdom of Belgium Government Bond 144A 0.800%22/06/2027
EUR 3 801 390 3 824 577 0.07
1 370 000 Kingdom of Belgium Government Bond 144A 0.800%22/06/2028
EUR 1 651 979 1 609 091 0.03
800 000 Kingdom of Belgium Government Bond 144A 0.900%22/06/2029
EUR 947 604 941 670 0.02
2 980 000 Kingdom of Belgium Government Bond 144A 1.000%22/06/2026
EUR 3 601 746 3 575 849 0.07
5 500 000 Kingdom of Belgium Government Bond 144A 1.000%22/06/2031
EUR 6 400 878 6 466 660 0.12
220 000 Kingdom of Belgium Government Bond 1.250% 22/04/2033 EUR 267 225 263 901 0.01450 000 Kingdom of Belgium Government Bond 144A 1.450%
22/06/2037EUR 548 606 540 612 0.01
1 760 000 Kingdom of Belgium Government Bond 144A 1.600%22/06/2047
EUR 2 048 835 2 083 671 0.04
1 050 000 Kingdom of Belgium Government Bond 144A 1.900%22/06/2038
EUR 1 331 284 1 346 270 0.03
280 000 Kingdom of Belgium Government Bond 144A 2.150%22/06/2066
EUR 368 400 358 301 0.01
300 000 Kingdom of Belgium Government Bond 144A 2.150%22/06/2066
EUR 371 325 383 893 0.01
950 000 Kingdom of Belgium Government Bond 2.250% 22/06/2023 EUR 1 272 834 1 186 038 0.02620 000 Kingdom of Belgium Government Bond 144A 2.250%
22/06/2057EUR 798 818 819 145 0.02
700 000 Kingdom of Belgium Government Bond 144A 3.750%28/09/2020
EUR 883 612 836 503 0.02
960 000 Kingdom of Belgium Government Bond 3.750% 22/06/2045 EUR 1 649 027 1 669 830 0.031 380 000 Kingdom of Belgium Government Bond 4.000% 28/03/2022 EUR 1 774 937 1 758 869 0.033 020 000 Kingdom of Belgium Government Bond 4.000% 28/03/2032 EUR 4 744 289 4 815 914 0.094 000 000 Kingdom of Belgium Government Bond 144A 4.250%
28/09/2021EUR 5 209 596 5 028 122 0.10
5 350 000 Kingdom of Belgium Government Bond 144A 4.250%28/09/2022
EUR 7 239 917 6 999 764 0.13
3 690 000 Kingdom of Belgium Government Bond 144A 4.250%28/03/2041
EUR 6 537 290 6 617 124 0.13
1 740 000 Kingdom of Belgium Government Bond 144A 4.500%28/03/2026
EUR 2 721 448 2 570 189 0.05
3 470 000 Kingdom of Belgium Government Bond 144A 5.000%28/03/2035
EUR 6 283 873 6 298 757 0.12
1 350 000 Kingdom of Belgium Government Bond - Reg 144A 1.700%22/06/2050
EUR 1 550 009 1 608 144 0.03
4 510 000 Kingdom of Belgium Government Bond - Reg 144A 2.600%22/06/2024
EUR 5 788 988 5 813 634 0.11
6 000 000 Kommuninvest I Sverige AB 1.000% 12/05/2025 SEK 662 309 662 567 0.0110 000 000 Kommuninvest I Sverige AB 2.500% 01/12/2020 SEK 1 282 277 1 122 745 0.02
198 Merrill Lynch Investment Solutions
Merrill Lynch Investment Solutions – Global Debt -Government UCITS FundSchedule of Investments as at March 31, 2019 (cont.)(expressed in USD)
The accompanying notes form an integral part of these financial statements.
Audited annual report

Nominalvalue Description
QuotationCurrency
CostUSD
Marketvalue USD
% of netassets
Transferable securities and money market instruments admitted to an official exchange listing or dealt in on another regulated market (cont.)
Supranationals, Governments and Local Public Authorities, Debt Instruments (cont.)10 000 000 Kommuninvest I Sverige AB - Reg 1.000% 13/11/2023 SEK 1 100 141 1 110 216 0.02
3 300 000 000 Korea Treasury Bond 1.250% 10/12/2019 KRW 3 055 749 2 896 607 0.0614 500 000 000 Korea Treasury Bond 1.375% 10/09/2021 KRW 12 788 419 12 660 502 0.24
2 570 000 000 Korea Treasury Bond 1.500% 10/12/2026 KRW 2 196 196 2 207 076 0.043 255 000 000 Korea Treasury Bond 1.500% 10/09/2036 KRW 2 657 186 2 682 515 0.051 770 000 000 Korea Treasury Bond 1.750% 10/12/2020 KRW 1 630 168 1 559 336 0.038 200 000 000 Korea Treasury Bond 1.875% 10/03/2022 KRW 7 337 188 7 247 937 0.142 800 000 000 Korea Treasury Bond 1.875% 10/06/2026 KRW 2 489 688 2 472 643 0.052 100 000 000 Korea Treasury Bond 2.000% 10/03/2020 KRW 1 970 721 1 853 515 0.042 500 000 000 Korea Treasury Bond 2.000% 10/09/2022 KRW 2 307 426 2 218 906 0.042 750 000 000 Korea Treasury Bond 2.000% 10/03/2046 KRW 2 332 828 2 473 907 0.051 200 000 000 Korea Treasury Bond 2.000% 10/03/2049 KRW 1 076 532 1 080 902 0.022 000 000 000 Korea Treasury Bond 2.125% 10/06/2027 KRW 1 810 819 1 795 810 0.035 850 000 000 Korea Treasury Bond 2.125% 10/03/2047 KRW 5 044 732 5 404 166 0.107 720 000 000 Korea Treasury Bond 2.250% 10/06/2025 KRW 7 007 022 6 974 688 0.132 500 000 000 Korea Treasury Bond 2.250% 10/12/2025 KRW 2 193 939 2 260 988 0.043 630 000 000 Korea Treasury Bond 2.250% 10/09/2037 KRW 3 163 742 3 342 843 0.063 000 000 000 Korea Treasury Bond 2.375% 10/12/2027 KRW 2 620 624 2 747 073 0.052 300 000 000 Korea Treasury Bond 2.375% 10/12/2028 KRW 2 096 146 2 118 466 0.045 000 000 000 Korea Treasury Bond 2.625% 10/06/2028 KRW 4 491 640 4 683 090 0.092 800 000 000 Korea Treasury Bond 2.625% 10/09/2035 KRW 2 511 136 2 711 030 0.053 300 000 000 Korea Treasury Bond 2.625% 10/03/2048 KRW 3 214 117 3 374 277 0.071 100 000 000 Korea Treasury Bond 2.750% 10/12/2044 KRW 1 061 391 1 136 328 0.028 000 000 000 Korea Treasury Bond 3.000% 10/03/2023 KRW 7 308 309 7 374 885 0.142 190 000 000 Korea Treasury Bond 3.000% 10/12/2042 KRW 2 126 845 2 334 045 0.054 500 000 000 Korea Treasury Bond 3.375% 10/09/2023 KRW 4 169 936 4 235 503 0.082 500 000 000 Korea Treasury Bond 3.750% 10/06/2022 KRW 2 419 111 2 337 153 0.052 400 000 000 Korea Treasury Bond 3.750% 10/12/2033 KRW 2 548 881 2 617 734 0.051 640 000 000 Korea Treasury Bond 4.000% 10/12/2031 KRW 1 763 138 1 786 551 0.031 850 000 000 Korea Treasury Bond 4.750% 10/12/2030 KRW 2 002 878 2 118 140 0.049 000 000 000 Korea Treasury Bond 5.000% 10/06/2020 KRW 8 410 608 8 228 534 0.16
500 000 Labrador-Island Link Funding Trust 144A 3.850% 01/12/2053 CAD 447 107 475 078 0.01300 000 Labrador-Island Link Funding Trust - A 144A 3.760%
01/06/2033CAD 252 353 257 689 0.01
600 000 Land Baden-Wuerttemberg 0.625% 27/01/2026 EUR 704 063 698 385 0.01300 000 Land Baden-Wuerttemberg 2.000% 13/11/2023 EUR 391 220 370 139 0.01350 000 Land Berlin 0.625% 20/03/2026 EUR 419 937 406 896 0.01
1 500 000 Land Berlin 0.750% 08/09/2023 EUR 1 792 494 1 750 790 0.03400 000 Land Berlin 1.375% 05/06/2037 EUR 485 595 479 155 0.01440 000 Land Berlin - Reg 1.300% 13/06/2033 EUR 510 306 526 570 0.01500 000 Land Berlin - Reg 1.375% 27/08/2038 EUR 584 932 595 368 0.01100 000 Land Thueringen 0.500% 12/05/2025 EUR 119 674 115 539 0.00
1 000 000 Latvia Government International Bond 0.375% 07/10/2026 EUR 1 108 220 1 114 990 0.02200 000 Latvia Government International Bond 2.250% 15/02/2047 EUR 252 093 249 812 0.01100 000 Lithuania Government International Bond 0.950%
26/05/2027EUR 119 807 116 253 0.00
199Merrill Lynch Investment Solutions
Merrill Lynch Investment Solutions – Global Debt -Government UCITS FundSchedule of Investments as at March 31, 2019 (cont.)(expressed in USD)
The accompanying notes form an integral part of these financial statements.
Audited annual report

Nominalvalue Description
QuotationCurrency
CostUSD
Marketvalue USD
% of netassets
Transferable securities and money market instruments admitted to an official exchange listing or dealt in on another regulated market (cont.)
Supranationals, Governments and Local Public Authorities, Debt Instruments (cont.)100 000 Lithuania Government International Bond 2.100%
26/05/2047EUR 130 364 120 405 0.00
1 000 000 Lithuania Government International Bond - Reg 1.250%22/10/2025
EUR 1 199 648 1 180 358 0.02
1 000 000 Luxembourg Government Bond 0.625% 01/02/2027 EUR 1 157 539 1 168 324 0.027 000 000 Malaysia Government Bond 3.441% 15/02/2021 MYR 1 767 943 1 715 829 0.036 000 000 Malaysia Government Bond 3.844% 15/04/2033 MYR 1 350 934 1 428 414 0.034 000 000 Malaysia Government Bond 3.899% 16/11/2027 MYR 977 263 983 519 0.02
10 000 000 Malaysia Government Bond 3.900% 30/11/2026 MYR 2 389 762 2 487 625 0.0512 000 000 Malaysia Government Bond 4.059% 30/09/2024 MYR 2 954 411 2 984 410 0.06
6 000 000 Malaysia Government Bond 4.392% 15/04/2026 MYR 1 549 970 1 526 622 0.035 500 000 Malaysia Government Bond 4.498% 15/04/2030 MYR 1 372 407 1 413 555 0.031 000 000 Malaysia Government Bond 4.736% 15/03/2046 MYR 247 506 247 861 0.001 000 000 Malaysia Government Bond 4.762% 07/04/2037 MYR 249 249 257 945 0.014 000 000 Malaysia Government Bond 4.893% 08/06/2038 MYR 1 006 713 1 053 119 0.02
22 900 000 Malaysia Government Investment Issue 3.948% 14/04/2022 MYR 5 640 437 5 680 928 0.111 500 000 Malaysia Government Investment Issue 4.258% 26/07/2027 MYR 366 471 379 150 0.01
12 500 000 Malaysia Government Investment Issue 4.369% 31/10/2028 MYR 3 125 751 3 181 776 0.063 600 000 Malaysia Government Investment Issue 4.582% 30/08/2033 MYR 918 198 917 296 0.028 000 000 Mexican Bonos 5.000% 11/12/2019 MXN 425 969 403 722 0.01
106 000 000 Mexican Bonos 5.750% 05/03/2026 MXN 4 878 880 4 827 010 0.0983 000 000 Mexican Bonos 6.500% 10/06/2021 MXN 4 371 149 4 166 367 0.0810 000 000 Mexican Bonos 6.500% 09/06/2022 MXN 530 989 496 466 0.0140 000 000 Mexican Bonos 7.500% 03/06/2027 MXN 1 943 997 1 996 690 0.0435 000 000 Mexican Bonos 7.750% 29/05/2031 MXN 1 883 887 1 743 513 0.0317 000 000 Mexican Bonos 7.750% 23/11/2034 MXN 904 779 833 616 0.0244 000 000 Mexican Bonos 7.750% 13/11/2042 MXN 2 282 460 2 106 601 0.0440 000 000 Mexican Bonos 8.000% 07/12/2023 MXN 2 182 184 2 075 876 0.04
5 000 000 Mexican Bonos 8.000% 07/11/2047 MXN 271 957 244 629 0.0017 000 000 Mexican Bonos 8.500% 18/11/2038 MXN 976 388 882 703 0.0230 000 000 Mexican Bonos 10.000% 05/12/2024 MXN 1 726 439 1 697 801 0.03
300 000 Municipal Finance Authority of British Columbia 2.150%01/12/2022
CAD 237 812 225 824 0.00
500 000 Municipal Finance Authority of British Columbia 3.050%23/10/2028
CAD 378 262 391 927 0.01
200 000 Municipality Finance Plc. 1.250% 23/02/2033 EUR 247 201 239 167 0.00500 000 Municipality Finance Plc. - Reg 0.125% 07/03/2024 EUR 571 609 566 209 0.01500 000 Muskrat Falls Via Labrador Transmission Assets Funding Trust -
B 144A 3.830% 01/06/2037CAD 424 206 439 193 0.01
200 000 Nederlandse Financierings-Maatschappij voorOntwikkelingslanden NV 0.125% 01/06/2023
EUR 246 109 227 575 0.00
370 000 Netherlands Government Bond 144A 0.000% 15/01/2022 EUR 442 888 421 815 0.014 400 000 Netherlands Government Bond 144A 0.000% 15/01/2024 EUR 5 162 793 5 029 025 0.10
900 000 Netherlands Government Bond 144A 0.250% 15/01/2020 EUR 1 128 650 1 017 336 0.023 430 000 Netherlands Government Bond 144A 0.250% 15/07/2025 EUR 4 042 330 3 976 090 0.084 120 000 Netherlands Government Bond 144A 0.500% 15/07/2026 EUR 4 833 501 4 852 545 0.093 100 000 Netherlands Government Bond 144A 0.750% 15/07/2027 EUR 3 727 710 3 713 180 0.072 470 000 Netherlands Government Bond 144A 0.750% 15/07/2028 EUR 2 927 173 2 958 261 0.06
200 Merrill Lynch Investment Solutions
Merrill Lynch Investment Solutions – Global Debt -Government UCITS FundSchedule of Investments as at March 31, 2019 (cont.)(expressed in USD)
The accompanying notes form an integral part of these financial statements.
Audited annual report

Nominalvalue Description
QuotationCurrency
CostUSD
Marketvalue USD
% of netassets
Transferable securities and money market instruments admitted to an official exchange listing or dealt in on another regulated market (cont.)
Supranationals, Governments and Local Public Authorities, Debt Instruments (cont.)900 000 Netherlands Government Bond 144A 1.750% 15/07/2023 EUR 1 152 721 1 106 464 0.02
1 550 000 Netherlands Government Bond 144A 2.000% 15/07/2024 EUR 2 019 521 1 958 805 0.042 290 000 Netherlands Government Bond 144A 2.250% 15/07/2022 EUR 3 026 438 2 809 205 0.051 950 000 Netherlands Government Bond 144A 2.500% 15/01/2033 EUR 2 786 749 2 840 924 0.052 840 000 Netherlands Government Bond 144A 2.750% 15/01/2047 EUR 4 662 525 4 917 484 0.097 760 000 Netherlands Government Bond 144A 3.250% 15/07/2021 EUR 9 769 244 9 488 277 0.182 000 000 Netherlands Government Bond 144A 3.500% 15/07/2020 EUR 2 552 135 2 364 722 0.052 840 000 Netherlands Government Bond 3.750% 15/01/2023 EUR 3 803 773 3 710 954 0.072 110 000 Netherlands Government Bond 144A 3.750% 15/01/2042 EUR 3 871 720 4 001 170 0.081 620 000 Netherlands Government Bond 144A 4.000% 15/01/2037 EUR 2 925 690 2 937 639 0.061 740 000 Netherlands Government Bond - Reg 144A 0.250%
15/07/2029EUR 1 954 691 1 977 016 0.04
1 000 000 Netherlands Government Bond - Reg 144A 4.000%15/01/2037
EUR 1 765 197 1 813 358 0.04
1 600 000 New South Wales Treasury Corp. 3.000% 20/05/2027 AUD 1 170 462 1 211 719 0.022 000 000 New South Wales Treasury Corp. 3.000% 20/04/2029 AUD 1 478 606 1 510 715 0.03
750 000 New South Wales Treasury Corp. 5.000% 20/08/2024 AUD 639 608 620 394 0.01400 000 New Zealand Government Bond 2.750% 15/04/2025 NZD 291 434 291 836 0.01200 000 New Zealand Government Bond 2.750% 15/04/2037 NZD 133 424 148 155 0.00
2 350 000 New Zealand Government Bond 3.000% 20/04/2029 NZD 1 713 713 1 776 437 0.031 250 000 New Zealand Government Bond 3.500% 14/04/2033 NZD 897 661 1 008 859 0.021 900 000 New Zealand Government Bond 4.500% 15/04/2027 NZD 1 500 001 1 571 026 0.033 000 000 New Zealand Government Bond 5.500% 15/04/2023 NZD 2 264 594 2 368 791 0.05
600 000 New Zealand Government Bond 6.000% 15/05/2021 NZD 446 643 448 083 0.01100 000 Newfoundland & Labrador Hydro 3.600% 01/12/2045 CAD 84 111 80 994 0.00500 000 Northern Territory Treasury Corp. 3.500% 21/05/2030 AUD 374 558 382 329 0.01
8 000 000 Norway Government Bond 144A 1.500% 19/02/2026 NOK 932 045 931 952 0.026 000 000 Norway Government Bond 144A 1.750% 13/03/2025 NOK 759 567 710 878 0.019 600 000 Norway Government Bond 144A 1.750% 17/02/2027 NOK 1 170 335 1 135 755 0.029 000 000 Norway Government Bond 144A 2.000% 24/05/2023 NOK 1 185 063 1 073 136 0.02
18 730 000 Norway Government Bond 144A 3.750% 25/05/2021 NOK 2 410 749 2 287 994 0.048 600 000 Norway Government Bond - Reg 144A 2.000% 26/04/2028 NOK 1 033 263 1 036 342 0.02
200 000 Ontario Electricity Financial Corp. 8.250% 22/06/2026 CAD 208 242 207 744 0.001 000 000 Portugal Obrigacoes do Tesouro OT 144A 1.950% 15/06/2029 EUR 1 202 123 1 196 974 0.021 470 000 Portugal Obrigacoes do Tesouro OT 144A 2.125% 17/10/2028 EUR 1 766 049 1 798 013 0.031 790 000 Portugal Obrigacoes do Tesouro OT 144A 2.200% 17/10/2022 EUR 2 315 972 2 177 628 0.042 900 000 Portugal Obrigacoes do Tesouro OT 144A 2.875% 15/10/2025 EUR 3 763 171 3 742 425 0.071 000 000 Portugal Obrigacoes do Tesouro OT 144A 2.875% 21/07/2026 EUR 1 294 284 1 291 725 0.033 480 000 Portugal Obrigacoes do Tesouro OT 144A 3.850% 15/04/2021 EUR 4 363 475 4 239 508 0.081 690 000 Portugal Obrigacoes do Tesouro OT 144A 3.875% 15/02/2030 EUR 2 319 043 2 379 174 0.051 450 000 Portugal Obrigacoes do Tesouro OT 144A 4.100% 15/04/2037 EUR 2 096 575 2 144 244 0.04
400 000 Portugal Obrigacoes do Tesouro OT 144A 4.100% 15/02/2045 EUR 575 879 603 879 0.011 300 000 Portugal Obrigacoes do Tesouro OT 144A 4.125% 14/04/2027 EUR 1 791 431 1 819 119 0.04
550 000 Portugal Obrigacoes do Tesouro OT 144A 4.800% 15/06/2020 EUR 699 882 655 828 0.012 600 000 Portugal Obrigacoes do Tesouro OT 144A 5.650% 15/02/2024 EUR 3 741 662 3 694 892 0.07
830 000 Portugal Obrigacoes do Tesouro OT - Reg 144A 2.250%18/04/2034
EUR 960 679 995 069 0.02
201Merrill Lynch Investment Solutions
Merrill Lynch Investment Solutions – Global Debt -Government UCITS FundSchedule of Investments as at March 31, 2019 (cont.)(expressed in USD)
The accompanying notes form an integral part of these financial statements.
Audited annual report

Nominalvalue Description
QuotationCurrency
CostUSD
Marketvalue USD
% of netassets
Transferable securities and money market instruments admitted to an official exchange listing or dealt in on another regulated market (cont.)
Supranationals, Governments and Local Public Authorities, Debt Instruments (cont.)800 000 Province of Alberta Canada 1.350% 01/09/2021 CAD 614 896 592 555 0.01650 000 Province of Alberta Canada 2.350% 01/06/2025 CAD 514 872 491 114 0.01230 000 Province of Alberta Canada 2.550% 01/06/2027 CAD 178 590 174 461 0.00
3 200 000 Province of Alberta Canada 2.900% 01/12/2028 CAD 2 445 449 2 489 099 0.051 500 000 Province of Alberta Canada 3.050% 01/12/2048 CAD 1 117 076 1 171 638 0.021 300 000 Province of Alberta Canada 3.300% 01/12/2046 CAD 1 033 315 1 057 817 0.02
80 000 Province of Alberta Canada 3.900% 01/12/2033 CAD 70 199 68 605 0.00200 000 Province of Alberta Canada - Reg 0.625% 16/01/2026 EUR 227 601 228 806 0.00450 000 Province of British Columbia Canada 2.550% 18/06/2027 CAD 352 889 344 270 0.01
1 530 000 Province of British Columbia Canada 2.800% 18/06/2048 CAD 1 118 194 1 173 609 0.021 200 000 Province of British Columbia Canada 2.950% 18/12/2028 CAD 925 840 946 787 0.02
900 000 Province of British Columbia Canada 3.200% 18/06/2044 CAD 716 528 735 205 0.01250 000 Province of British Columbia Canada 3.300% 18/12/2023 CAD 207 110 198 140 0.00
1 000 000 Province of British Columbia Canada 4.700% 18/06/2037 CAD 945 906 970 545 0.02250 000 Province of British Columbia Canada 4.950% 18/06/2040 CAD 264 051 255 565 0.01650 000 Province of Manitoba Canada 2.550% 02/06/2026 CAD 507 872 494 661 0.01400 000 Province of Manitoba Canada 3.000% 02/06/2028 CAD 308 552 312 554 0.01300 000 Province of Manitoba Canada 3.200% 05/03/2050 CAD 232 134 237 957 0.00
1 850 000 Province of Manitoba Canada 3.400% 05/09/2048 CAD 1 472 612 1 516 212 0.03700 000 Province of Manitoba Canada 4.100% 05/03/2041 CAD 608 346 623 731 0.01340 000 Province of Manitoba Canada 4.400% 05/03/2042 CAD 312 167 315 993 0.01350 000 Province of New Brunswick Canada 2.350% 14/08/2027 CAD 266 820 260 118 0.01200 000 Province of New Brunswick Canada 3.100% 14/08/2048 CAD 149 965 152 760 0.00250 000 Province of New Brunswick Canada 3.550% 03/06/2043 CAD 212 504 204 691 0.00
1 000 000 Province of New Brunswick Canada 4.800% 26/09/2039 CAD 926 476 956 735 0.021 600 000 Province of Newfoundland and Labrador Canada 2.850%
02/06/2028CAD 1 198 917 1 225 160 0.02
300 000 Province of Newfoundland and Labrador Canada 3.000%02/06/2026
CAD 239 020 233 364 0.00
300 000 Province of Newfoundland and Labrador Canada 3.700%17/10/2048
CAD 254 165 251 527 0.01
500 000 Province of Nova Scotia Canada 2.100% 01/06/2027 CAD 385 090 367 510 0.01500 000 Province of Nova Scotia Canada 3.500% 02/06/2062 CAD 415 412 437 438 0.01700 000 Province of Nova Scotia Canada 4.400% 01/06/2042 CAD 648 917 662 295 0.01
4 500 000 Province of Ontario Canada 2.600% 02/06/2025 CAD 3 465 017 3 452 296 0.075 620 000 Province of Ontario Canada 2.600% 02/06/2027 CAD 4 257 928 4 289 449 0.082 000 000 Province of Ontario Canada 2.800% 02/06/2048 CAD 1 489 888 1 502 347 0.031 150 000 Province of Ontario Canada 2.850% 02/06/2023 CAD 930 516 890 293 0.021 500 000 Province of Ontario Canada 2.900% 02/06/2028 CAD 1 159 201 1 169 954 0.022 100 000 Province of Ontario Canada 2.900% 02/12/2046 CAD 1 520 894 1 604 092 0.032 450 000 Province of Ontario Canada 2.900% 02/06/2049 CAD 1 851 489 1 881 949 0.042 100 000 Province of Ontario Canada 3.450% 02/06/2045 CAD 1 663 469 1 762 636 0.035 000 000 Province of Ontario Canada 3.500% 02/06/2024 CAD 3 987 802 4 000 936 0.081 000 000 Province of Ontario Canada 3.500% 02/06/2043 CAD 823 112 841 319 0.023 620 000 Province of Ontario Canada 4.200% 02/06/2020 CAD 2 935 216 2 785 580 0.055 310 000 Province of Ontario Canada 4.650% 02/06/2041 CAD 5 071 840 5 195 926 0.10
800 000 Province of Ontario Canada 4.700% 02/06/2037 CAD 753 369 766 574 0.01
202 Merrill Lynch Investment Solutions
Merrill Lynch Investment Solutions – Global Debt -Government UCITS FundSchedule of Investments as at March 31, 2019 (cont.)(expressed in USD)
The accompanying notes form an integral part of these financial statements.
Audited annual report

Nominalvalue Description
QuotationCurrency
CostUSD
Marketvalue USD
% of netassets
Transferable securities and money market instruments admitted to an official exchange listing or dealt in on another regulated market (cont.)
Supranationals, Governments and Local Public Authorities, Debt Instruments (cont.)1 370 000 Province of Ontario Canada 5.600% 02/06/2035 CAD 1 427 418 1 414 250 0.032 000 000 Province of Ontario Canada 5.850% 08/03/2033 CAD 2 002 272 2 058 835 0.043 000 000 Province of Quebec Canada 2.250% 22/02/2024 CAD 2 271 864 2 270 946 0.042 900 000 Province of Quebec Canada 2.450% 01/03/2023 CAD 2 224 164 2 216 716 0.043 000 000 Province of Quebec Canada 2.500% 01/09/2026 CAD 2 272 121 2 287 406 0.04
300 000 Province of Quebec Canada 2.750% 01/09/2027 CAD 242 692 232 316 0.002 500 000 Province of Quebec Canada 2.750% 01/09/2028 CAD 1 880 305 1 936 281 0.04
450 000 Province of Quebec Canada 3.500% 01/12/2022 CAD 371 912 355 955 0.011 700 000 Province of Quebec Canada 3.500% 01/12/2045 CAD 1 439 020 1 453 771 0.032 400 000 Province of Quebec Canada 3.500% 01/12/2048 CAD 1 988 557 2 075 575 0.04
300 000 Province of Quebec Canada 3.750% 01/09/2024 CAD 250 308 243 851 0.00650 000 Province of Quebec Canada 4.250% 01/12/2021 CAD 535 768 517 776 0.01
1 500 000 Province of Quebec Canada 4.250% 01/12/2043 CAD 1 390 040 1 424 548 0.031 100 000 Province of Quebec Canada 5.000% 01/12/2038 CAD 1 085 476 1 109 296 0.021 150 000 Province of Quebec Canada 5.000% 01/12/2041 CAD 1 149 613 1 189 554 0.02
500 000 Province of Quebec Canada 6.250% 01/06/2032 CAD 548 104 528 905 0.01350 000 Province of Saskatchewan Canada 2.550% 02/06/2026 CAD 276 392 266 704 0.01500 000 Province of Saskatchewan Canada 2.650% 02/06/2027 CAD 400 964 382 308 0.01
1 100 000 Province of Saskatchewan Canada 2.750% 02/12/2046 CAD 788 906 809 518 0.021 000 000 Province of Saskatchewan Canada 3.050% 02/12/2028 CAD 765 892 787 791 0.02
200 000 Province of Saskatchewan Canada 4.750% 01/06/2040 CAD 191 493 195 426 0.00200 000 PSP Capital, Inc. 1.730% 21/06/2022 CAD 155 333 149 052 0.00
2 200 000 Queensland Treasury Corp. 144A 3.000% 22/03/2024 AUD 1 653 002 1 649 458 0.03900 000 Queensland Treasury Corp. 144A 3.250% 21/07/2026 AUD 705 987 689 192 0.01500 000 Queensland Treasury Corp. 144A 3.250% 21/07/2028 AUD 384 466 383 769 0.01
1 500 000 Queensland Treasury Corp. 144A 3.500% 21/08/2030 AUD 1 115 987 1 172 637 0.02200 000 Queensland Treasury Corp. 144A 4.750% 21/07/2025 AUD 168 937 165 641 0.00
2 400 000 Queensland Treasury Corp. 5.500% 21/06/2021 AUD 2 005 258 1 846 121 0.04330 000 Queensland Treasury Corp. 5.750% 22/07/2024 AUD 300 338 280 349 0.01
2 300 000 Queensland Treasury Corp. - Reg 144A 3.250% 21/08/2029 AUD 1 678 831 1 764 645 0.03800 000 Regie Autonome des Transports Parisiens 0.875%
25/05/2027EUR 934 890 934 398 0.02
400 000 Region of Ile de France 0.500% 14/06/2025 EUR 488 947 460 439 0.01500 000 Region of Ile de France - Reg 1.375% 20/06/2033 EUR 587 870 597 648 0.01100 000 Regional Municipality of York 2.350% 09/06/2027 CAD 77 383 73 943 0.00
1 980 000 Republic of Austria Government Bond 144A 0.000%20/09/2022
EUR 2 307 493 2 257 659 0.04
2 800 000 Republic of Austria Government Bond 144A 0.000%15/07/2023
EUR 3 283 149 3 194 661 0.06
6 150 000 Republic of Austria Government Bond 144A 0.500%20/04/2027
EUR 7 135 252 7 164 746 0.14
400 000 Republic of Austria Government Bond 144A 0.750%20/02/2028
EUR 492 194 473 753 0.01
1 240 000 Republic of Austria Government Bond 144A 1.500%20/02/2047
EUR 1 482 208 1 546 866 0.03
520 000 Republic of Austria Government Bond 144A 1.500%02/11/2086
EUR 555 127 614 772 0.01
203Merrill Lynch Investment Solutions
Merrill Lynch Investment Solutions – Global Debt -Government UCITS FundSchedule of Investments as at March 31, 2019 (cont.)(expressed in USD)
The accompanying notes form an integral part of these financial statements.
Audited annual report
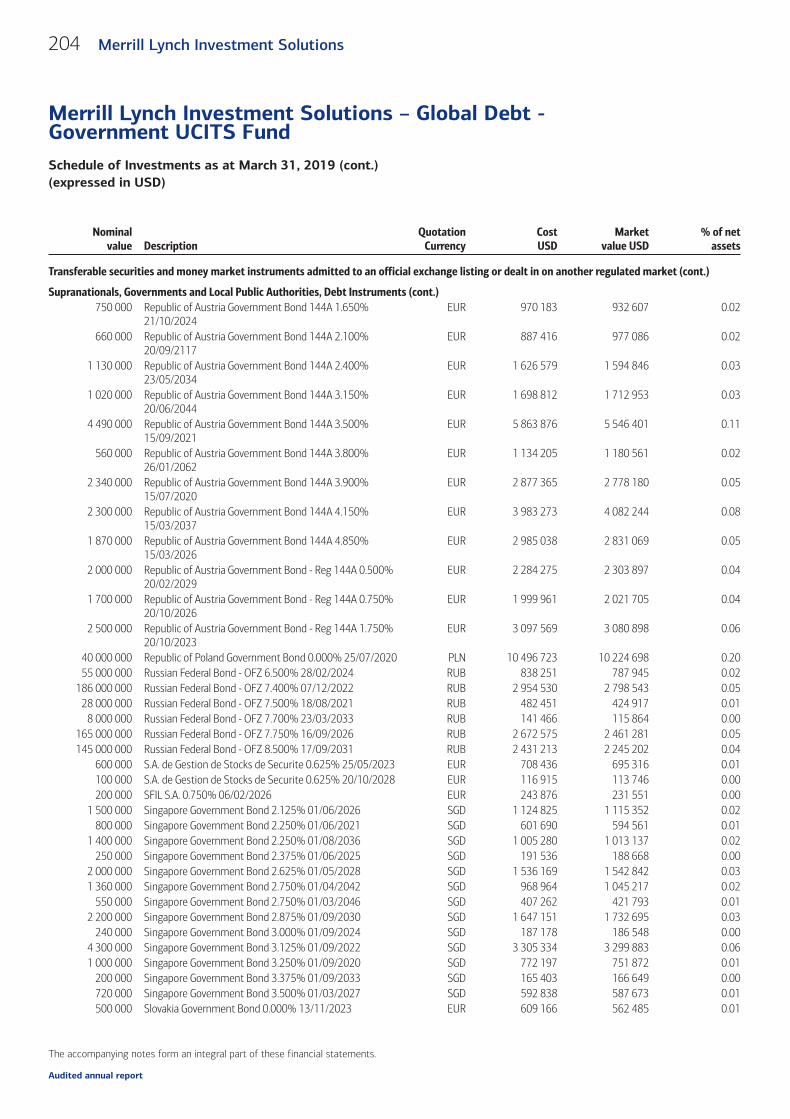
Nominalvalue Description
QuotationCurrency
CostUSD
Marketvalue USD
% of netassets
Transferable securities and money market instruments admitted to an official exchange listing or dealt in on another regulated market (cont.)
Supranationals, Governments and Local Public Authorities, Debt Instruments (cont.)750 000 Republic of Austria Government Bond 144A 1.650%
21/10/2024EUR 970 183 932 607 0.02
660 000 Republic of Austria Government Bond 144A 2.100%20/09/2117
EUR 887 416 977 086 0.02
1 130 000 Republic of Austria Government Bond 144A 2.400%23/05/2034
EUR 1 626 579 1 594 846 0.03
1 020 000 Republic of Austria Government Bond 144A 3.150%20/06/2044
EUR 1 698 812 1 712 953 0.03
4 490 000 Republic of Austria Government Bond 144A 3.500%15/09/2021
EUR 5 863 876 5 546 401 0.11
560 000 Republic of Austria Government Bond 144A 3.800%26/01/2062
EUR 1 134 205 1 180 561 0.02
2 340 000 Republic of Austria Government Bond 144A 3.900%15/07/2020
EUR 2 877 365 2 778 180 0.05
2 300 000 Republic of Austria Government Bond 144A 4.150%15/03/2037
EUR 3 983 273 4 082 244 0.08
1 870 000 Republic of Austria Government Bond 144A 4.850%15/03/2026
EUR 2 985 038 2 831 069 0.05
2 000 000 Republic of Austria Government Bond - Reg 144A 0.500%20/02/2029
EUR 2 284 275 2 303 897 0.04
1 700 000 Republic of Austria Government Bond - Reg 144A 0.750%20/10/2026
EUR 1 999 961 2 021 705 0.04
2 500 000 Republic of Austria Government Bond - Reg 144A 1.750%20/10/2023
EUR 3 097 569 3 080 898 0.06
40 000 000 Republic of Poland Government Bond 0.000% 25/07/2020 PLN 10 496 723 10 224 698 0.2055 000 000 Russian Federal Bond - OFZ 6.500% 28/02/2024 RUB 838 251 787 945 0.02
186 000 000 Russian Federal Bond - OFZ 7.400% 07/12/2022 RUB 2 954 530 2 798 543 0.0528 000 000 Russian Federal Bond - OFZ 7.500% 18/08/2021 RUB 482 451 424 917 0.01
8 000 000 Russian Federal Bond - OFZ 7.700% 23/03/2033 RUB 141 466 115 864 0.00165 000 000 Russian Federal Bond - OFZ 7.750% 16/09/2026 RUB 2 672 575 2 461 281 0.05145 000 000 Russian Federal Bond - OFZ 8.500% 17/09/2031 RUB 2 431 213 2 245 202 0.04
600 000 S.A. de Gestion de Stocks de Securite 0.625% 25/05/2023 EUR 708 436 695 316 0.01100 000 S.A. de Gestion de Stocks de Securite 0.625% 20/10/2028 EUR 116 915 113 746 0.00200 000 SFIL S.A. 0.750% 06/02/2026 EUR 243 876 231 551 0.00
1 500 000 Singapore Government Bond 2.125% 01/06/2026 SGD 1 124 825 1 115 352 0.02800 000 Singapore Government Bond 2.250% 01/06/2021 SGD 601 690 594 561 0.01
1 400 000 Singapore Government Bond 2.250% 01/08/2036 SGD 1 005 280 1 013 137 0.02250 000 Singapore Government Bond 2.375% 01/06/2025 SGD 191 536 188 668 0.00
2 000 000 Singapore Government Bond 2.625% 01/05/2028 SGD 1 536 169 1 542 842 0.031 360 000 Singapore Government Bond 2.750% 01/04/2042 SGD 968 964 1 045 217 0.02
550 000 Singapore Government Bond 2.750% 01/03/2046 SGD 407 262 421 793 0.012 200 000 Singapore Government Bond 2.875% 01/09/2030 SGD 1 647 151 1 732 695 0.03
240 000 Singapore Government Bond 3.000% 01/09/2024 SGD 187 178 186 548 0.004 300 000 Singapore Government Bond 3.125% 01/09/2022 SGD 3 305 334 3 299 883 0.061 000 000 Singapore Government Bond 3.250% 01/09/2020 SGD 772 197 751 872 0.01
200 000 Singapore Government Bond 3.375% 01/09/2033 SGD 165 403 166 649 0.00720 000 Singapore Government Bond 3.500% 01/03/2027 SGD 592 838 587 673 0.01500 000 Slovakia Government Bond 0.000% 13/11/2023 EUR 609 166 562 485 0.01
204 Merrill Lynch Investment Solutions
Merrill Lynch Investment Solutions – Global Debt -Government UCITS FundSchedule of Investments as at March 31, 2019 (cont.)(expressed in USD)
The accompanying notes form an integral part of these financial statements.
Audited annual report

Nominalvalue Description
QuotationCurrency
CostUSD
Marketvalue USD
% of netassets
Transferable securities and money market instruments admitted to an official exchange listing or dealt in on another regulated market (cont.)
Supranationals, Governments and Local Public Authorities, Debt Instruments (cont.)1 530 000 Slovakia Government Bond 0.625% 22/05/2026 EUR 1 793 059 1 763 005 0.031 000 000 Slovakia Government Bond 1.000% 12/06/2028 EUR 1 169 200 1 170 010 0.02
150 000 Slovakia Government Bond 1.625% 21/01/2031 EUR 191 339 182 656 0.00310 000 Slovakia Government Bond 1.875% 09/03/2037 EUR 387 922 386 853 0.01350 000 Slovakia Government Bond 2.000% 17/10/2047 EUR 432 632 437 524 0.01200 000 Slovakia Government Bond 3.625% 16/01/2029 EUR 305 490 289 230 0.01200 000 Slovakia Government Bond 4.000% 27/04/2020 EUR 248 771 234 746 0.00300 000 Slovakia Government Bond 4.350% 14/10/2025 EUR 467 439 440 460 0.01
1 300 000 Slovakia Government Bond - Reg 3.375% 15/11/2024 EUR 1 745 198 1 734 245 0.031 240 000 Slovenia Government Bond 1.250% 22/03/2027 EUR 1 490 600 1 487 820 0.031 400 000 Slovenia Government Bond 1.750% 03/11/2040 EUR 1 613 511 1 634 184 0.03
200 000 Slovenia Government Bond 2.125% 28/07/2025 EUR 263 472 251 693 0.01500 000 Slovenia Government Bond 2.250% 25/03/2022 EUR 657 220 603 639 0.01400 000 Slovenia Government Bond 2.250% 03/03/2032 EUR 539 010 520 469 0.01100 000 SNCF Mobilites 1.500% 02/02/2029 EUR 124 520 121 897 0.00
1 000 000 SNCF Mobilites 4.875% 12/06/2023 EUR 1 392 479 1 358 109 0.031 600 000 SNCF Reseau EPIC 1.125% 25/05/2030 EUR 1 853 154 1 881 595 0.04
100 000 SNCF Reseau EPIC 1.875% 30/03/2034 EUR 127 540 125 527 0.00400 000 SNCF Reseau EPIC 2.000% 05/02/2048 EUR 477 741 482 489 0.01200 000 SNCF Reseau EPIC 2.625% 29/12/2025 EUR 270 245 260 862 0.01700 000 SNCF Reseau EPIC 4.250% 07/10/2026 EUR 1 080 459 1 018 398 0.02800 000 SNCF Reseau EPIC 4.375% 02/06/2022 EUR 1 121 153 1 028 728 0.02
1 500 000 SNCF Reseau EPIC - Reg 0.875% 22/01/2029 EUR 1 698 993 1 721 706 0.03200 000 Societe Du Grand Paris EPIC - Reg 1.125% 22/10/2028 EUR 230 961 237 446 0.00
1 000 000 South Australian Government Financing Authority 2.750%24/05/2030
AUD 708 249 726 834 0.01
150 000 South Australian Government Financing Authority 3.000%20/09/2027
AUD 116 520 112 930 0.00
700 000 South Australian Government Financing Authority 3.000%24/05/2028
AUD 510 142 525 206 0.01
300 000 South Australian Government Financing Authority 5.000%20/05/2021
AUD 240 904 228 019 0.00
300 000 South Coast British Columbia Transportation Authority4.450% 09/06/2044
CAD 276 654 279 893 0.01
8 470 000 Spain Government Bond 0.050% 31/01/2021 EUR 9 916 991 9 570 930 0.182 500 000 Spain Government Bond 0.350% 30/07/2023 EUR 2 859 199 2 842 523 0.051 500 000 Spain Government Bond 0.400% 30/04/2022 EUR 1 787 207 1 714 353 0.038 900 000 Spain Government Bond 0.450% 31/10/2022 EUR 10 508 869 10 193 291 0.203 760 000 Spain Government Bond 0.750% 30/07/2021 EUR 4 355 083 4 322 608 0.089 650 000 Spain Government Bond 1.150% 30/07/2020 EUR 11 647 438 11 054 378 0.215 500 000 Spain Government Bond 144A 1.300% 31/10/2026 EUR 6 473 978 6 451 653 0.124 700 000 Spain Government Bond 144A 1.400% 30/04/2028 EUR 5 601 438 5 494 855 0.115 090 000 Spain Government Bond 144A 1.400% 30/07/2028 EUR 5 829 882 5 922 200 0.114 780 000 Spain Government Bond 144A 1.450% 31/10/2027 EUR 5 603 913 5 627 404 0.112 270 000 Spain Government Bond 144A 1.500% 30/04/2027 EUR 2 752 000 2 687 706 0.056 900 000 Spain Government Bond 144A 1.600% 30/04/2025 EUR 8 340 673 8 304 721 0.161 000 000 Spain Government Bond 144A 1.850% 30/07/2035 EUR 1 134 308 1 142 654 0.021 500 000 Spain Government Bond 144A 1.950% 30/04/2026 EUR 1 859 187 1 839 339 0.04
205Merrill Lynch Investment Solutions
Merrill Lynch Investment Solutions – Global Debt -Government UCITS FundSchedule of Investments as at March 31, 2019 (cont.)(expressed in USD)
The accompanying notes form an integral part of these financial statements.
Audited annual report

Nominalvalue Description
QuotationCurrency
CostUSD
Marketvalue USD
% of netassets
Transferable securities and money market instruments admitted to an official exchange listing or dealt in on another regulated market (cont.)
Supranationals, Governments and Local Public Authorities, Debt Instruments (cont.)8 480 000 Spain Government Bond 144A 1.950% 30/07/2030 EUR 10 263 158 10 237 423 0.204 000 000 Spain Government Bond 144A 2.150% 31/10/2025 EUR 5 114 081 4 965 251 0.103 260 000 Spain Government Bond 144A 2.350% 30/07/2033 EUR 3 989 657 4 034 732 0.081 330 000 Spain Government Bond 144A 2.700% 31/10/2048 EUR 1 582 556 1 639 943 0.034 960 000 Spain Government Bond 144A 2.750% 31/10/2024 EUR 6 640 696 6 318 456 0.122 910 000 Spain Government Bond 144A 2.900% 31/10/2046 EUR 3 661 899 3 757 617 0.071 900 000 Spain Government Bond 144A 3.450% 30/07/2066 EUR 2 548 648 2 651 408 0.051 550 000 Spain Government Bond 144A 4.000% 30/04/2020 EUR 1 954 402 1 822 085 0.043 440 000 Spain Government Bond 144A 4.200% 31/01/2037 EUR 5 330 043 5 329 396 0.107 290 000 Spain Government Bond 144A 4.400% 31/10/2023 EUR 9 969 486 9 790 284 0.195 680 000 Spain Government Bond 144A 4.650% 30/07/2025 EUR 8 152 073 8 046 299 0.153 690 000 Spain Government Bond 144A 4.700% 30/07/2041 EUR 6 058 228 6 184 131 0.122 720 000 Spain Government Bond 144A 4.900% 30/07/2040 EUR 4 594 863 4 645 530 0.092 190 000 Spain Government Bond 144A 5.150% 31/10/2028 EUR 3 399 267 3 389 100 0.072 280 000 Spain Government Bond 144A 5.150% 31/10/2044 EUR 4 097 706 4 107 155 0.086 340 000 Spain Government Bond 144A 5.400% 31/01/2023 EUR 8 824 701 8 609 132 0.171 200 000 Spain Government Bond 5.750% 30/07/2032 EUR 2 032 257 2 063 547 0.042 800 000 Spain Government Bond 144A 5.850% 31/01/2022 EUR 4 005 005 3 684 600 0.07
350 000 Spain Government Bond 6.000% 31/01/2029 EUR 591 783 576 629 0.013 190 000 Spain Government Bond - Reg 144A 1.450% 30/04/2029 EUR 3 690 788 3 700 731 0.07
200 000 State of Brandenburg 0.250% 19/10/2026 EUR 238 746 225 946 0.00400 000 State of Brandenburg 1.125% 04/07/2033 EUR 459 359 467 581 0.01300 000 State of Bremen 1.000% 25/02/2028 EUR 372 191 356 324 0.01100 000 State of Bremen 1.125% 30/10/2024 EUR 124 298 119 413 0.00500 000 State of Bremen - Reg 1.200% 30/01/2034 EUR 573 387 584 432 0.01350 000 State of Hesse 0.375% 04/07/2022 EUR 426 723 401 169 0.01750 000 State of Hesse 0.375% 06/07/2026 EUR 896 050 856 652 0.02
1 000 000 State of Hesse 0.625% 02/08/2028 EUR 1 141 740 1 151 415 0.02500 000 State of Hesse 1.125% 10/12/2021 EUR 589 508 582 821 0.01
1 000 000 State of Lower Saxony 0.125% 07/03/2023 EUR 1 189 504 1 136 083 0.02500 000 State of Lower Saxony 0.250% 06/02/2024 EUR 576 239 570 879 0.01100 000 State of Lower Saxony 0.375% 09/01/2026 EUR 119 647 114 432 0.00
1 100 000 State of Lower Saxony 0.500% 13/06/2025 EUR 1 279 451 1 270 554 0.02180 000 State of Lower Saxony 0.625% 06/07/2027 EUR 213 769 208 367 0.00350 000 State of Lower Saxony 0.750% 15/02/2028 EUR 430 703 408 149 0.01500 000 State of Lower Saxony - Reg 0.875% 25/10/2028 EUR 581 644 587 582 0.01
1 600 000 State of North Rhine-Westphalia Germany 0.000%05/12/2022
EUR 1 855 886 1 810 627 0.03
400 000 State of North Rhine-Westphalia Germany 0.500%16/04/2026
EUR 491 435 460 911 0.01
400 000 State of North Rhine-Westphalia Germany 1.100%13/03/2034
EUR 465 745 464 314 0.01
250 000 State of North Rhine-Westphalia Germany 1.250%12/05/2036
EUR 293 583 292 478 0.01
300 000 State of North Rhine-Westphalia Germany 1.450%16/02/2043
EUR 341 980 355 230 0.01
1 000 000 State of North Rhine-Westphalia Germany 1.500%12/06/2040
EUR 1 157 999 1 203 446 0.02
206 Merrill Lynch Investment Solutions
Merrill Lynch Investment Solutions – Global Debt -Government UCITS FundSchedule of Investments as at March 31, 2019 (cont.)(expressed in USD)
The accompanying notes form an integral part of these financial statements.
Audited annual report
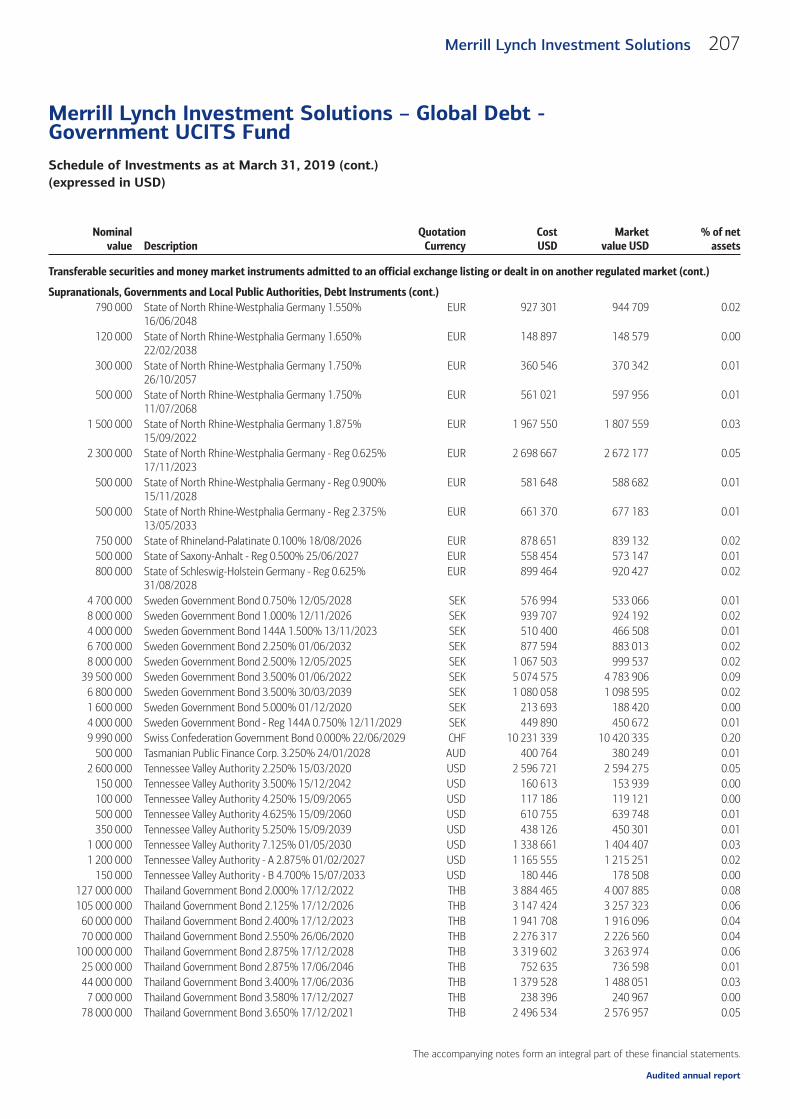
Nominalvalue Description
QuotationCurrency
CostUSD
Marketvalue USD
% of netassets
Transferable securities and money market instruments admitted to an official exchange listing or dealt in on another regulated market (cont.)
Supranationals, Governments and Local Public Authorities, Debt Instruments (cont.)790 000 State of North Rhine-Westphalia Germany 1.550%
16/06/2048EUR 927 301 944 709 0.02
120 000 State of North Rhine-Westphalia Germany 1.650%22/02/2038
EUR 148 897 148 579 0.00
300 000 State of North Rhine-Westphalia Germany 1.750%26/10/2057
EUR 360 546 370 342 0.01
500 000 State of North Rhine-Westphalia Germany 1.750%11/07/2068
EUR 561 021 597 956 0.01
1 500 000 State of North Rhine-Westphalia Germany 1.875%15/09/2022
EUR 1 967 550 1 807 559 0.03
2 300 000 State of North Rhine-Westphalia Germany - Reg 0.625%17/11/2023
EUR 2 698 667 2 672 177 0.05
500 000 State of North Rhine-Westphalia Germany - Reg 0.900%15/11/2028
EUR 581 648 588 682 0.01
500 000 State of North Rhine-Westphalia Germany - Reg 2.375%13/05/2033
EUR 661 370 677 183 0.01
750 000 State of Rhineland-Palatinate 0.100% 18/08/2026 EUR 878 651 839 132 0.02500 000 State of Saxony-Anhalt - Reg 0.500% 25/06/2027 EUR 558 454 573 147 0.01800 000 State of Schleswig-Holstein Germany - Reg 0.625%
31/08/2028EUR 899 464 920 427 0.02
4 700 000 Sweden Government Bond 0.750% 12/05/2028 SEK 576 994 533 066 0.018 000 000 Sweden Government Bond 1.000% 12/11/2026 SEK 939 707 924 192 0.024 000 000 Sweden Government Bond 144A 1.500% 13/11/2023 SEK 510 400 466 508 0.016 700 000 Sweden Government Bond 2.250% 01/06/2032 SEK 877 594 883 013 0.028 000 000 Sweden Government Bond 2.500% 12/05/2025 SEK 1 067 503 999 537 0.02
39 500 000 Sweden Government Bond 3.500% 01/06/2022 SEK 5 074 575 4 783 906 0.096 800 000 Sweden Government Bond 3.500% 30/03/2039 SEK 1 080 058 1 098 595 0.021 600 000 Sweden Government Bond 5.000% 01/12/2020 SEK 213 693 188 420 0.004 000 000 Sweden Government Bond - Reg 144A 0.750% 12/11/2029 SEK 449 890 450 672 0.019 990 000 Swiss Confederation Government Bond 0.000% 22/06/2029 CHF 10 231 339 10 420 335 0.20
500 000 Tasmanian Public Finance Corp. 3.250% 24/01/2028 AUD 400 764 380 249 0.012 600 000 Tennessee Valley Authority 2.250% 15/03/2020 USD 2 596 721 2 594 275 0.05
150 000 Tennessee Valley Authority 3.500% 15/12/2042 USD 160 613 153 939 0.00100 000 Tennessee Valley Authority 4.250% 15/09/2065 USD 117 186 119 121 0.00500 000 Tennessee Valley Authority 4.625% 15/09/2060 USD 610 755 639 748 0.01350 000 Tennessee Valley Authority 5.250% 15/09/2039 USD 438 126 450 301 0.01
1 000 000 Tennessee Valley Authority 7.125% 01/05/2030 USD 1 338 661 1 404 407 0.031 200 000 Tennessee Valley Authority - A 2.875% 01/02/2027 USD 1 165 555 1 215 251 0.02
150 000 Tennessee Valley Authority - B 4.700% 15/07/2033 USD 180 446 178 508 0.00127 000 000 Thailand Government Bond 2.000% 17/12/2022 THB 3 884 465 4 007 885 0.08105 000 000 Thailand Government Bond 2.125% 17/12/2026 THB 3 147 424 3 257 323 0.06
60 000 000 Thailand Government Bond 2.400% 17/12/2023 THB 1 941 708 1 916 096 0.0470 000 000 Thailand Government Bond 2.550% 26/06/2020 THB 2 276 317 2 226 560 0.04
100 000 000 Thailand Government Bond 2.875% 17/12/2028 THB 3 319 602 3 263 974 0.0625 000 000 Thailand Government Bond 2.875% 17/06/2046 THB 752 635 736 598 0.0144 000 000 Thailand Government Bond 3.400% 17/06/2036 THB 1 379 528 1 488 051 0.03
7 000 000 Thailand Government Bond 3.580% 17/12/2027 THB 238 396 240 967 0.0078 000 000 Thailand Government Bond 3.650% 17/12/2021 THB 2 496 534 2 576 957 0.05
207Merrill Lynch Investment Solutions
Merrill Lynch Investment Solutions – Global Debt -Government UCITS FundSchedule of Investments as at March 31, 2019 (cont.)(expressed in USD)
The accompanying notes form an integral part of these financial statements.
Audited annual report

Nominalvalue Description
QuotationCurrency
CostUSD
Marketvalue USD
% of netassets
Transferable securities and money market instruments admitted to an official exchange listing or dealt in on another regulated market (cont.)
Supranationals, Governments and Local Public Authorities, Debt Instruments (cont.)27 000 000 Thailand Government Bond 3.650% 20/06/2031 THB 915 471 939 553 0.0210 000 000 Thailand Government Bond 3.850% 12/12/2025 THB 337 222 345 511 0.0130 000 000 Thailand Government Bond 4.000% 17/06/2066 THB 1 014 619 1 038 597 0.0244 000 000 Thailand Government Bond 4.260% 12/12/2037 THB 1 556 417 1 565 402 0.0327 800 000 Thailand Government Bond 4.675% 29/06/2044 THB 1 072 644 1 089 135 0.02
7 500 000 Thailand Government Bond 4.850% 17/06/2061 THB 305 397 305 098 0.0155 000 000 Thailand Government Bond 4.875% 22/06/2029 THB 1 944 616 2 086 974 0.04
1 800 000 Treasury Corp. of Victoria 3.000% 20/10/2028 AUD 1 308 884 1 364 517 0.03750 000 Treasury Corp. of Victoria 5.500% 17/12/2024 AUD 679 974 638 347 0.01
2 000 000 Treasury Corp. of Victoria 5.500% 17/11/2026 AUD 1 742 174 1 769 977 0.03500 000 Treasury Corp. of Victoria 6.000% 17/10/2022 AUD 426 487 407 924 0.01400 000 UNEDIC ASSEO 0.125% 25/05/2022 EUR 483 102 453 642 0.01
1 600 000 UNEDIC ASSEO 0.125% 25/11/2024 EUR 1 854 590 1 800 651 0.031 000 000 UNEDIC ASSEO 0.875% 25/05/2028 EUR 1 155 897 1 174 127 0.02
300 000 UNEDIC ASSEO 1.250% 28/03/2027 EUR 384 287 364 063 0.011 000 000 UNEDIC ASSEO 1.500% 20/04/2032 EUR 1 227 577 1 235 791 0.02
10 900 000 United Kingdom Gilt 0.500% 22/07/2022 GBP 14 110 519 14 135 387 0.275 800 000 United Kingdom Gilt 0.750% 22/07/2023 GBP 7 540 033 7 568 364 0.158 380 000 United Kingdom Gilt 1.250% 22/07/2027 GBP 10 979 395 11 217 033 0.225 600 000 United Kingdom Gilt 1.500% 22/01/2021 GBP 7 539 963 7 409 363 0.145 800 000 United Kingdom Gilt 1.500% 22/07/2026 GBP 8 135 430 7 918 323 0.154 430 000 United Kingdom Gilt 1.500% 22/07/2047 GBP 5 461 277 5 694 007 0.115 860 000 United Kingdom Gilt 1.625% 22/10/2028 GBP 7 848 944 8 067 089 0.161 880 000 United Kingdom Gilt 1.625% 22/10/2071 GBP 2 371 733 2 624 756 0.052 290 000 United Kingdom Gilt 1.750% 07/09/2022 GBP 3 264 931 3 093 316 0.065 900 000 United Kingdom Gilt 1.750% 07/09/2037 GBP 7 745 224 8 021 195 0.152 960 000 United Kingdom Gilt 1.750% 22/07/2057 GBP 3 899 734 4 184 067 0.088 340 000 United Kingdom Gilt 2.000% 22/07/2020 GBP 11 184 700 11 057 164 0.213 280 000 United Kingdom Gilt 2.000% 07/09/2025 GBP 4 490 019 4 602 420 0.094 620 000 United Kingdom Gilt 2.250% 07/09/2023 GBP 6 513 382 6 426 588 0.123 050 000 United Kingdom Gilt 2.500% 22/07/2065 GBP 5 139 485 5 382 320 0.109 660 000 United Kingdom Gilt 2.750% 07/09/2024 GBP 13 678 301 13 928 788 0.274 180 000 United Kingdom Gilt 3.250% 22/01/2044 GBP 7 082 925 7 319 453 0.144 730 000 United Kingdom Gilt 3.500% 22/01/2045 GBP 8 608 739 8 677 491 0.173 860 000 United Kingdom Gilt 3.500% 22/07/2068 GBP 8 251 575 8 658 697 0.174 400 000 United Kingdom Gilt 3.750% 07/09/2020 GBP 5 924 563 5 985 693 0.126 370 000 United Kingdom Gilt 3.750% 07/09/2021 GBP 8 938 639 8 923 636 0.173 820 000 United Kingdom Gilt 3.750% 22/07/2052 GBP 7 609 443 7 909 092 0.155 200 000 United Kingdom Gilt 4.000% 07/03/2022 GBP 7 868 319 7 437 180 0.143 760 000 United Kingdom Gilt 4.000% 22/01/2060 GBP 8 407 620 8 739 375 0.173 900 000 United Kingdom Gilt 4.250% 07/12/2027 GBP 6 379 755 6 506 759 0.135 500 000 United Kingdom Gilt 4.250% 07/06/2032 GBP 9 464 623 9 793 115 0.194 830 000 United Kingdom Gilt 4.250% 07/03/2036 GBP 8 952 321 8 978 565 0.174 200 000 United Kingdom Gilt 4.250% 07/09/2039 GBP 7 840 165 8 118 916 0.163 710 000 United Kingdom Gilt 4.250% 07/12/2040 GBP 6 987 130 7 266 704 0.143 850 000 United Kingdom Gilt 4.250% 07/12/2046 GBP 7 732 842 8 034 818 0.153 110 000 United Kingdom Gilt 4.250% 07/12/2049 GBP 6 388 462 6 734 585 0.13
208 Merrill Lynch Investment Solutions
Merrill Lynch Investment Solutions – Global Debt -Government UCITS FundSchedule of Investments as at March 31, 2019 (cont.)(expressed in USD)
The accompanying notes form an integral part of these financial statements.
Audited annual report

Nominalvalue Description
QuotationCurrency
CostUSD
Marketvalue USD
% of netassets
Transferable securities and money market instruments admitted to an official exchange listing or dealt in on another regulated market (cont.)
Supranationals, Governments and Local Public Authorities, Debt Instruments (cont.)4 760 000 United Kingdom Gilt 4.250% 07/12/2055 GBP 10 639 314 11 078 309 0.214 880 000 United Kingdom Gilt 4.500% 07/09/2034 GBP 8 968 964 9 146 622 0.185 300 000 United Kingdom Gilt 4.500% 07/12/2042 GBP 10 455 117 10 960 640 0.216 670 000 United Kingdom Gilt 4.750% 07/12/2030 GBP 11 766 137 12 155 230 0.23
600 000 United Kingdom Gilt 8.000% 07/06/2021 GBP 941 760 906 958 0.021 800 000 United Kingdom Gilt - Reg 1.000% 22/04/2024 GBP 2 316 760 2 373 093 0.05
890 000 United Kingdom Gilt - Reg 1.750% 22/01/2049 GBP 1 146 235 1 212 477 0.022 040 000 United Kingdom Gilt - Reg 4.750% 07/12/2038 GBP 4 035 890 4 148 954 0.089 500 000 United States Treasury Note/Bond 1.125% 31/07/2021 USD 9 240 333 9 254 707 0.185 800 000 United States Treasury Note/Bond 1.125% 31/08/2021 USD 5 684 016 5 645 484 0.11
30 000 000 United States Treasury Note/Bond 1.125% 30/09/2021 USD 28 793 749 29 196 094 0.567 200 000 United States Treasury Note/Bond 1.250% 31/03/2021 USD 7 099 493 7 057 688 0.148 800 000 United States Treasury Note/Bond 1.375% 31/08/2020 USD 8 698 130 8 676 250 0.174 740 000 United States Treasury Note/Bond 1.375% 15/09/2020 USD 4 706 168 4 674 825 0.091 440 000 United States Treasury Note/Bond 1.375% 30/09/2020 USD 1 428 607 1 419 075 0.033 000 000 United States Treasury Note/Bond 1.375% 31/10/2020 USD 2 968 108 2 954 648 0.062 000 000 United States Treasury Note/Bond 1.375% 31/05/2021 USD 1 958 341 1 962 109 0.045 500 000 United States Treasury Note/Bond 1.375% 30/06/2023 USD 5 248 250 5 307 715 0.10
12 000 000 United States Treasury Note/Bond 1.375% 31/08/2023 USD 11 295 101 11 564 531 0.221 900 000 United States Treasury Note/Bond 1.500% 15/04/2020 USD 1 882 723 1 882 484 0.042 000 000 United States Treasury Note/Bond 1.500% 15/06/2020 USD 1 991 706 1 978 589 0.041 900 000 United States Treasury Note/Bond 1.500% 15/07/2020 USD 1 891 940 1 878 848 0.04
17 860 000 United States Treasury Note/Bond 1.500% 15/08/2026 USD 16 295 587 16 846 306 0.3227 000 000 United States Treasury Note/Bond 1.625% 15/10/2020 USD 26 688 272 26 703 633 0.5113 000 000 United States Treasury Note/Bond 1.625% 30/11/2020 USD 12 729 565 12 848 672 0.25
9 160 000 United States Treasury Note/Bond 1.625% 31/08/2022 USD 8 918 039 8 976 084 0.175 000 000 United States Treasury Note/Bond 1.625% 15/11/2022 USD 4 761 172 4 894 922 0.096 000 000 United States Treasury Note/Bond 1.625% 31/10/2023 USD 5 779 388 5 839 453 0.114 000 000 United States Treasury Note/Bond 1.625% 15/02/2026 USD 3 767 404 3 822 031 0.07
11 100 000 United States Treasury Note/Bond 1.625% 15/05/2026 USD 10 251 628 10 587 926 0.2010 000 000 United States Treasury Note/Bond 1.750% 15/11/2020 USD 9 853 646 9 905 859 0.19
5 500 000 United States Treasury Note/Bond 1.750% 31/12/2020 USD 5 486 537 5 445 859 0.1011 000 000 United States Treasury Note/Bond 1.750% 30/11/2021 USD 10 832 143 10 857 773 0.2110 600 000 United States Treasury Note/Bond 1.750% 15/05/2022 USD 10 397 433 10 444 727 0.2011 500 000 United States Treasury Note/Bond 1.750% 30/06/2022 USD 11 204 755 11 326 602 0.2212 200 000 United States Treasury Note/Bond 1.750% 30/09/2022 USD 11 722 941 12 000 797 0.2311 400 000 United States Treasury Note/Bond 1.750% 31/01/2023 USD 10 903 624 11 196 492 0.2215 000 000 United States Treasury Note/Bond 1.750% 15/05/2023 USD 14 440 297 14 709 961 0.2814 000 000 United States Treasury Note/Bond 1.875% 28/02/2022 USD 13 742 779 13 855 078 0.27
8 830 000 United States Treasury Note/Bond 1.875% 31/07/2022 USD 8 642 341 8 727 558 0.172 000 000 United States Treasury Note/Bond 1.875% 30/09/2022 USD 1 981 999 1 976 250 0.04
24 000 000 United States Treasury Note/Bond 1.875% 31/10/2022 USD 23 310 941 23 702 813 0.4616 000 000 United States Treasury Note/Bond 2.000% 15/01/2021 USD 15 755 852 15 911 250 0.3116 000 000 United States Treasury Note/Bond 2.000% 31/12/2021 USD 15 735 972 15 901 250 0.31
8 600 000 United States Treasury Note/Bond 2.000% 31/07/2022 USD 8 528 992 8 535 500 0.1623 400 000 United States Treasury Note/Bond 2.000% 31/10/2022 USD 22 776 883 23 212 617 0.4517 700 000 United States Treasury Note/Bond 2.000% 30/11/2022 USD 17 354 688 17 554 805 0.34
209Merrill Lynch Investment Solutions
Merrill Lynch Investment Solutions – Global Debt -Government UCITS FundSchedule of Investments as at March 31, 2019 (cont.)(expressed in USD)
The accompanying notes form an integral part of these financial statements.
Audited annual report
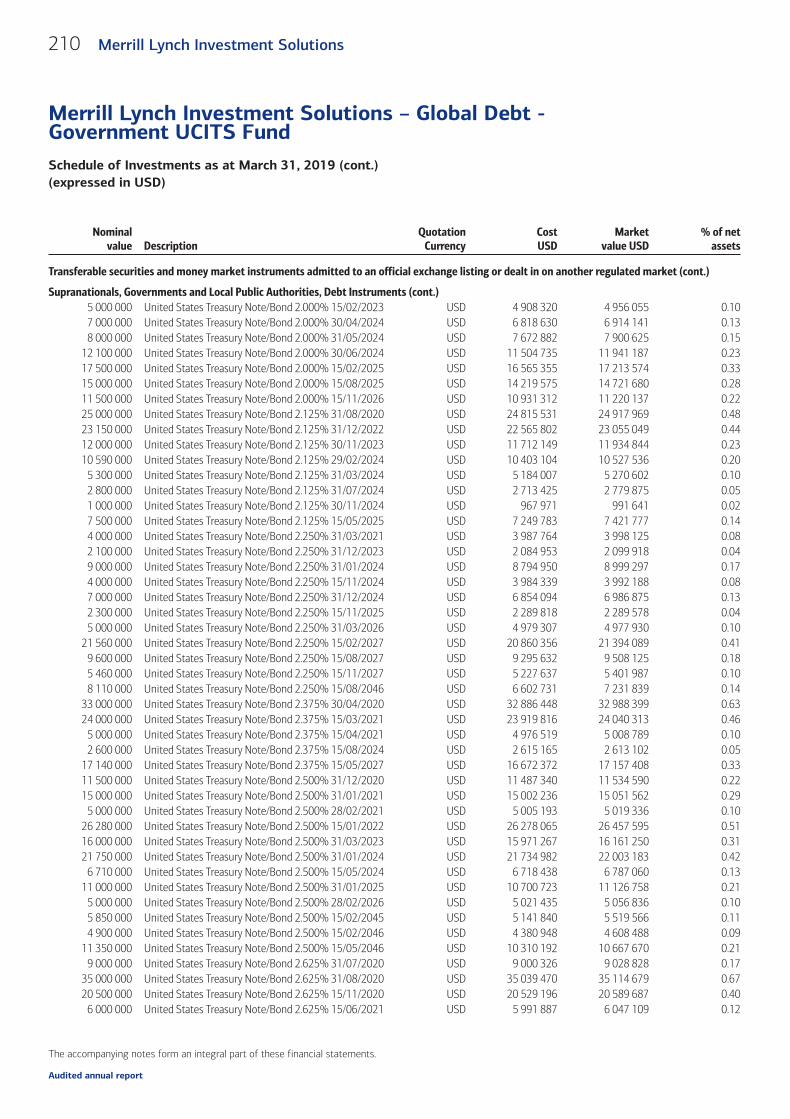
Nominalvalue Description
QuotationCurrency
CostUSD
Marketvalue USD
% of netassets
Transferable securities and money market instruments admitted to an official exchange listing or dealt in on another regulated market (cont.)
Supranationals, Governments and Local Public Authorities, Debt Instruments (cont.)5 000 000 United States Treasury Note/Bond 2.000% 15/02/2023 USD 4 908 320 4 956 055 0.107 000 000 United States Treasury Note/Bond 2.000% 30/04/2024 USD 6 818 630 6 914 141 0.138 000 000 United States Treasury Note/Bond 2.000% 31/05/2024 USD 7 672 882 7 900 625 0.15
12 100 000 United States Treasury Note/Bond 2.000% 30/06/2024 USD 11 504 735 11 941 187 0.2317 500 000 United States Treasury Note/Bond 2.000% 15/02/2025 USD 16 565 355 17 213 574 0.3315 000 000 United States Treasury Note/Bond 2.000% 15/08/2025 USD 14 219 575 14 721 680 0.2811 500 000 United States Treasury Note/Bond 2.000% 15/11/2026 USD 10 931 312 11 220 137 0.2225 000 000 United States Treasury Note/Bond 2.125% 31/08/2020 USD 24 815 531 24 917 969 0.4823 150 000 United States Treasury Note/Bond 2.125% 31/12/2022 USD 22 565 802 23 055 049 0.4412 000 000 United States Treasury Note/Bond 2.125% 30/11/2023 USD 11 712 149 11 934 844 0.2310 590 000 United States Treasury Note/Bond 2.125% 29/02/2024 USD 10 403 104 10 527 536 0.20
5 300 000 United States Treasury Note/Bond 2.125% 31/03/2024 USD 5 184 007 5 270 602 0.102 800 000 United States Treasury Note/Bond 2.125% 31/07/2024 USD 2 713 425 2 779 875 0.051 000 000 United States Treasury Note/Bond 2.125% 30/11/2024 USD 967 971 991 641 0.027 500 000 United States Treasury Note/Bond 2.125% 15/05/2025 USD 7 249 783 7 421 777 0.144 000 000 United States Treasury Note/Bond 2.250% 31/03/2021 USD 3 987 764 3 998 125 0.082 100 000 United States Treasury Note/Bond 2.250% 31/12/2023 USD 2 084 953 2 099 918 0.049 000 000 United States Treasury Note/Bond 2.250% 31/01/2024 USD 8 794 950 8 999 297 0.174 000 000 United States Treasury Note/Bond 2.250% 15/11/2024 USD 3 984 339 3 992 188 0.087 000 000 United States Treasury Note/Bond 2.250% 31/12/2024 USD 6 854 094 6 986 875 0.132 300 000 United States Treasury Note/Bond 2.250% 15/11/2025 USD 2 289 818 2 289 578 0.045 000 000 United States Treasury Note/Bond 2.250% 31/03/2026 USD 4 979 307 4 977 930 0.10
21 560 000 United States Treasury Note/Bond 2.250% 15/02/2027 USD 20 860 356 21 394 089 0.419 600 000 United States Treasury Note/Bond 2.250% 15/08/2027 USD 9 295 632 9 508 125 0.185 460 000 United States Treasury Note/Bond 2.250% 15/11/2027 USD 5 227 637 5 401 987 0.108 110 000 United States Treasury Note/Bond 2.250% 15/08/2046 USD 6 602 731 7 231 839 0.14
33 000 000 United States Treasury Note/Bond 2.375% 30/04/2020 USD 32 886 448 32 988 399 0.6324 000 000 United States Treasury Note/Bond 2.375% 15/03/2021 USD 23 919 816 24 040 313 0.46
5 000 000 United States Treasury Note/Bond 2.375% 15/04/2021 USD 4 976 519 5 008 789 0.102 600 000 United States Treasury Note/Bond 2.375% 15/08/2024 USD 2 615 165 2 613 102 0.05
17 140 000 United States Treasury Note/Bond 2.375% 15/05/2027 USD 16 672 372 17 157 408 0.3311 500 000 United States Treasury Note/Bond 2.500% 31/12/2020 USD 11 487 340 11 534 590 0.2215 000 000 United States Treasury Note/Bond 2.500% 31/01/2021 USD 15 002 236 15 051 562 0.29
5 000 000 United States Treasury Note/Bond 2.500% 28/02/2021 USD 5 005 193 5 019 336 0.1026 280 000 United States Treasury Note/Bond 2.500% 15/01/2022 USD 26 278 065 26 457 595 0.5116 000 000 United States Treasury Note/Bond 2.500% 31/03/2023 USD 15 971 267 16 161 250 0.3121 750 000 United States Treasury Note/Bond 2.500% 31/01/2024 USD 21 734 982 22 003 183 0.42
6 710 000 United States Treasury Note/Bond 2.500% 15/05/2024 USD 6 718 438 6 787 060 0.1311 000 000 United States Treasury Note/Bond 2.500% 31/01/2025 USD 10 700 723 11 126 758 0.21
5 000 000 United States Treasury Note/Bond 2.500% 28/02/2026 USD 5 021 435 5 056 836 0.105 850 000 United States Treasury Note/Bond 2.500% 15/02/2045 USD 5 141 840 5 519 566 0.114 900 000 United States Treasury Note/Bond 2.500% 15/02/2046 USD 4 380 948 4 608 488 0.09
11 350 000 United States Treasury Note/Bond 2.500% 15/05/2046 USD 10 310 192 10 667 670 0.219 000 000 United States Treasury Note/Bond 2.625% 31/07/2020 USD 9 000 326 9 028 828 0.17
35 000 000 United States Treasury Note/Bond 2.625% 31/08/2020 USD 35 039 470 35 114 679 0.6720 500 000 United States Treasury Note/Bond 2.625% 15/11/2020 USD 20 529 196 20 589 687 0.40
6 000 000 United States Treasury Note/Bond 2.625% 15/06/2021 USD 5 991 887 6 047 109 0.12
210 Merrill Lynch Investment Solutions
Merrill Lynch Investment Solutions – Global Debt -Government UCITS FundSchedule of Investments as at March 31, 2019 (cont.)(expressed in USD)
The accompanying notes form an integral part of these financial statements.
Audited annual report

Nominalvalue Description
QuotationCurrency
CostUSD
Marketvalue USD
% of netassets
Transferable securities and money market instruments admitted to an official exchange listing or dealt in on another regulated market (cont.)
Supranationals, Governments and Local Public Authorities, Debt Instruments (cont.)19 000 000 United States Treasury Note/Bond 2.625% 15/07/2021 USD 18 954 879 19 149 180 0.3714 000 000 United States Treasury Note/Bond 2.625% 28/02/2023 USD 13 919 432 14 202 891 0.27
6 000 000 United States Treasury Note/Bond 2.625% 31/03/2025 USD 6 067 954 6 110 391 0.123 000 000 United States Treasury Note/Bond 2.625% 31/01/2026 USD 3 036 130 3 057 773 0.067 000 000 United States Treasury Note/Bond 2.625% 15/02/2029 USD 7 086 751 7 128 516 0.14
20 000 000 United States Treasury Note/Bond 2.750% 30/09/2020 USD 19 980 030 20 113 281 0.3912 000 000 United States Treasury Note/Bond 2.750% 15/08/2021 USD 12 058 653 12 133 125 0.23
7 000 000 United States Treasury Note/Bond 2.750% 31/05/2023 USD 7 006 505 7 141 367 0.1431 000 000 United States Treasury Note/Bond 2.750% 31/07/2023 USD 31 139 596 31 647 852 0.61
2 500 000 United States Treasury Note/Bond 2.750% 15/11/2023 USD 2 560 984 2 554 590 0.056 700 000 United States Treasury Note/Bond 2.750% 15/02/2024 USD 6 779 593 6 853 629 0.13
17 000 000 United States Treasury Note/Bond 2.750% 31/08/2025 USD 16 655 709 17 440 937 0.3413 140 000 United States Treasury Note/Bond 2.750% 15/02/2028 USD 12 936 718 13 514 695 0.26
3 600 000 United States Treasury Note/Bond 2.750% 15/08/2042 USD 3 513 627 3 584 812 0.075 330 000 United States Treasury Note/Bond 2.750% 15/11/2042 USD 5 077 396 5 303 558 0.104 320 000 United States Treasury Note/Bond 2.750% 15/08/2047 USD 4 147 633 4 258 406 0.082 950 000 United States Treasury Note/Bond 2.750% 15/11/2047 USD 2 822 768 2 907 479 0.064 000 000 United States Treasury Note/Bond 2.875% 30/11/2023 USD 3 999 714 4 112 812 0.08
35 000 000 United States Treasury Note/Bond 2.875% 31/05/2025 USD 35 629 020 36 141 602 0.6910 000 000 United States Treasury Note/Bond 2.875% 31/07/2025 USD 9 984 067 10 332 812 0.2012 400 000 United States Treasury Note/Bond 2.875% 15/05/2028 USD 12 180 812 12 880 016 0.25
6 230 000 United States Treasury Note/Bond 2.875% 15/08/2028 USD 6 327 638 6 472 873 0.129 100 000 United States Treasury Note/Bond 2.875% 15/05/2043 USD 8 595 945 9 239 699 0.185 210 000 United States Treasury Note/Bond 2.875% 15/08/2045 USD 4 999 994 5 279 399 0.107 500 000 United States Treasury Note/Bond 2.875% 15/11/2046 USD 7 270 478 7 593 164 0.154 700 000 United States Treasury Note/Bond 3.000% 15/05/2042 USD 4 637 995 4 890 203 0.095 400 000 United States Treasury Note/Bond 3.000% 15/11/2044 USD 5 308 806 5 599 547 0.118 900 000 United States Treasury Note/Bond 3.000% 15/05/2045 USD 8 961 363 9 234 098 0.18
15 900 000 United States Treasury Note/Bond 3.000% 15/11/2045 USD 16 005 031 16 501 219 0.325 750 000 United States Treasury Note/Bond 3.000% 15/02/2047 USD 5 783 708 5 966 748 0.116 190 000 United States Treasury Note/Bond 3.000% 15/05/2047 USD 6 028 840 6 414 871 0.123 540 000 United States Treasury Note/Bond 3.000% 15/02/2048 USD 3 481 425 3 662 655 0.077 320 000 United States Treasury Note/Bond 3.000% 15/08/2048 USD 6 961 828 7 577 344 0.155 700 000 United States Treasury Note/Bond 3.000% 15/02/2049 USD 5 686 040 5 905 734 0.11
12 150 000 United States Treasury Note/Bond 3.125% 15/11/2028 USD 12 387 215 12 888 018 0.251 400 000 United States Treasury Note/Bond 3.125% 15/11/2041 USD 1 480 905 1 489 195 0.033 520 000 United States Treasury Note/Bond 3.125% 15/02/2042 USD 3 615 014 3 740 687 0.076 050 000 United States Treasury Note/Bond 3.125% 15/02/2043 USD 6 117 296 6 410 400 0.128 200 000 United States Treasury Note/Bond 3.125% 15/08/2044 USD 8 311 738 8 691 680 0.17
10 300 000 United States Treasury Note/Bond 3.125% 15/05/2048 USD 10 400 626 10 921 621 0.216 830 000 United States Treasury Note/Bond 3.375% 15/05/2044 USD 7 223 612 7 549 551 0.157 630 000 United States Treasury Note/Bond 3.375% 15/11/2048 USD 8 140 987 8 491 654 0.165 600 000 United States Treasury Note/Bond 3.500% 15/02/2039 USD 6 050 956 6 345 281 0.12
14 000 000 United States Treasury Note/Bond 3.625% 15/02/2020 USD 14 180 629 14 140 000 0.276 830 000 United States Treasury Note/Bond 3.625% 15/02/2021 USD 7 007 622 6 993 546 0.135 540 000 United States Treasury Note/Bond 3.625% 15/08/2043 USD 6 061 641 6 364 941 0.124 080 000 United States Treasury Note/Bond 3.625% 15/02/2044 USD 4 572 462 4 693 434 0.09
211Merrill Lynch Investment Solutions
Merrill Lynch Investment Solutions – Global Debt -Government UCITS FundSchedule of Investments as at March 31, 2019 (cont.)(expressed in USD)
The accompanying notes form an integral part of these financial statements.
Audited annual report

Nominalvalue Description
QuotationCurrency
CostUSD
Marketvalue USD
% of netassets
Transferable securities and money market instruments admitted to an official exchange listing or dealt in on another regulated market (cont.)
Supranationals, Governments and Local Public Authorities, Debt Instruments (cont.)6 600 000 United States Treasury Note/Bond 3.750% 15/08/2041 USD 7 165 391 7 723 289 0.151 450 000 United States Treasury Note/Bond 3.750% 15/11/2043 USD 1 654 369 1 699 842 0.035 250 000 United States Treasury Note/Bond 4.250% 15/05/2039 USD 6 368 908 6 563 730 0.135 000 000 United States Treasury Note/Bond 4.250% 15/11/2040 USD 5 925 674 6 262 305 0.122 700 000 United States Treasury Note/Bond 4.375% 15/02/2038 USD 3 293 467 3 416 027 0.07
770 000 United States Treasury Note/Bond 4.375% 15/05/2040 USD 939 966 979 494 0.022 500 000 United States Treasury Note/Bond 4.375% 15/05/2041 USD 3 067 234 3 188 379 0.062 000 000 United States Treasury Note/Bond 4.500% 15/02/2036 USD 2 456 583 2 532 969 0.053 670 000 United States Treasury Note/Bond 4.625% 15/02/2040 USD 4 637 934 4 817 879 0.093 000 000 United States Treasury Note/Bond 4.750% 15/02/2037 USD 3 787 999 3 936 680 0.083 150 000 United States Treasury Note/Bond 4.750% 15/02/2041 USD 4 097 978 4 213 494 0.088 000 000 United States Treasury Note/Bond 5.375% 15/02/2031 USD 10 025 103 10 397 500 0.20
500 000 United States Treasury Note/Bond 6.125% 15/08/2029 USD 668 122 668 984 0.013 100 000 Western Australian Treasury Corp. 2.500% 23/07/2024 AUD 2 232 767 2 268 528 0.04
500 000 Western Australian Treasury Corp. 2.750% 20/10/2022 AUD 400 277 367 254 0.011 200 000 Western Australian Treasury Corp. 3.000% 21/10/2026 AUD 890 843 903 132 0.02
Total Supranationals, Governments and Local PublicAuthorities, Debt Instruments 5 020 678 980 5 066 424 492 97.25
Other transferable securities
Bonds700 000 Lower Mattagami Energy LP 2.307% 21/10/2026 CAD 507 874 513 823 0.01100 000 Ontario Power Generation, Inc. 3.838% 22/06/2048 CAD 76 997 76 053 0.00600 000 OPB Finance Trust 2.980% 25/01/2027 CAD 460 279 463 863 0.01
1 000 000 Toronto Hydro Corp. 2.520% 25/08/2026 CAD 737 532 748 471 0.02
Total Bonds 1 782 682 1 802 210 0.04
Total Investments 5 108 859 955 5 153 192 126 98.92
212 Merrill Lynch Investment Solutions
Merrill Lynch Investment Solutions – Global Debt -Government UCITS FundSchedule of Investments as at March 31, 2019 (cont.)(expressed in USD)
The accompanying notes form an integral part of these financial statements.
Audited annual report
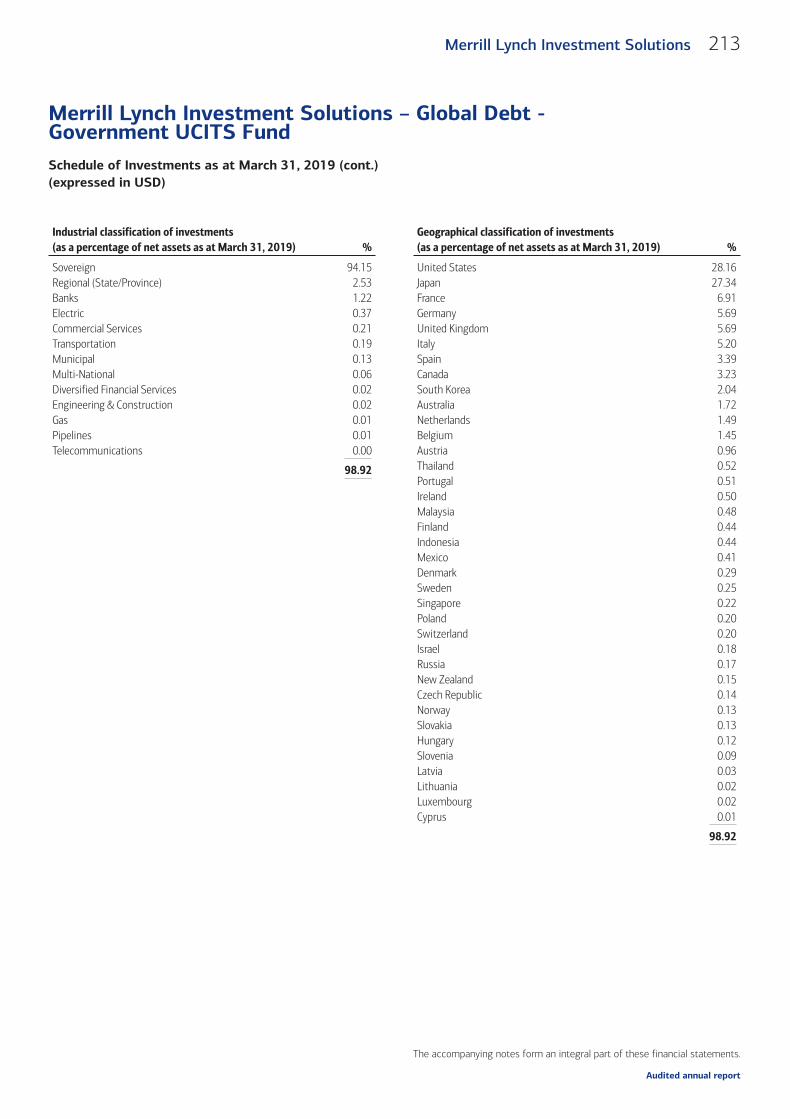
Industrial classification of investments(as a percentage of net assets as at March 31, 2019) %
Sovereign 94.15Regional (State/Province) 2.53Banks 1.22Electric 0.37Commercial Services 0.21Transportation 0.19Municipal 0.13Multi-National 0.06Diversified Financial Services 0.02Engineering & Construction 0.02Gas 0.01Pipelines 0.01Telecommunications 0.00
98.92
Geographical classification of investments(as a percentage of net assets as at March 31, 2019) %
United States 28.16Japan 27.34France 6.91Germany 5.69United Kingdom 5.69Italy 5.20Spain 3.39Canada 3.23South Korea 2.04Australia 1.72Netherlands 1.49Belgium 1.45Austria 0.96Thailand 0.52Portugal 0.51Ireland 0.50Malaysia 0.48Finland 0.44Indonesia 0.44Mexico 0.41Denmark 0.29Sweden 0.25Singapore 0.22Poland 0.20Switzerland 0.20Israel 0.18Russia 0.17New Zealand 0.15Czech Republic 0.14Norway 0.13Slovakia 0.13Hungary 0.12Slovenia 0.09Latvia 0.03Lithuania 0.02Luxembourg 0.02Cyprus 0.01
98.92
213Merrill Lynch Investment Solutions
Merrill Lynch Investment Solutions – Global Debt -Government UCITS FundSchedule of Investments as at March 31, 2019 (cont.)(expressed in USD)
The accompanying notes form an integral part of these financial statements.
Audited annual report

Currencybought Amount bought Currency sold Amount sold
Maturitydate Counterparty
Unrealisedappreciation/
(depreciation)USD
Forward foreign exchange contractsAUD 124 960 000 USD 88 590 392 02/04/2019 Natwest Markets Plc. 174 928
CAD 219 940 000 USD 164 642 447 02/04/2019Barclays Bank Plc.
Wholesale (6 136)CZK 209 570 000 USD 9 124 831 02/04/2019 HSBC Bank Plc. (15 013)DKK 100 930 000 USD 15 187 492 02/04/2019 Natwest Markets Plc. (6 967)
EUR 248 960 000 USD 279 532 288 02/04/2019Barclays Bank Plc.
Wholesale 12 419EUR 248 960 000 USD 279 557 184 02/04/2019 Deutsche Bank AG (12 477)
EUR 248 960 000 USD 279 557 184 02/04/2019Goldman Sachs
International (12 477)EUR 248 960 000 USD 279 592 038 02/04/2019 HSBC Bank Plc. (47 332)EUR 248 950 000 USD 279 441 396 02/04/2019 Société Générale 92 082
GBP 45 195 000 USD 58 834 851 02/04/2019Barclays Bank Plc.
Wholesale 56 514GBP 45 195 000 USD 58 861 968 02/04/2019 Deutsche Bank AG 29 397
GBP 45 195 000 USD 58 861 968 02/04/2019Goldman Sachs
International 29 397GBP 45 195 000 USD 58 879 594 02/04/2019 HSBC Bank Plc. 11 771GBP 45 190 000 USD 58 895 223 02/04/2019 Société Générale (10 374)HUF 1 688 310 000 USD 5 907 561 02/04/2019 HSBC Bank Plc. (13 463)ILS 35 770 000 USD 9 864 865 02/04/2019 Société Générale (9 106)
JPY 31 581 030 000 USD 284 821 699 02/04/2019Barclays Bank Plc.
Wholesale 501 786JPY 31 581 030 000 USD 284 924 486 02/04/2019 Deutsche Bank AG 399 000
JPY 31 581 030 000 USD 284 873 083 02/04/2019Goldman Sachs
International 450 402JPY 31 581 030 000 USD 284 867 944 02/04/2019 HSBC Bank Plc. 455 542JPY 31 581 020 000 USD 284 929 537 02/04/2019 Société Générale 393 858MXN 433 870 000 USD 22 458 179 02/04/2019 Natwest Markets Plc. (90 863)NOK 57 030 000 USD 6 631 241 02/04/2019 Deutsche Bank AG (8 778)NZD 11 280 000 USD 7 676 378 02/04/2019 Natwest Markets Plc. 16 580
PLN 38 800 000 USD 10 135 047 02/04/2019Morgan Stanley & Co.
International Plc. (14 672)
SEK 129 550 000 USD 13 990 855 02/04/2019Goldman Sachs
International (23 652)SGD 20 490 000 USD 15 130 704 02/04/2019 Société Générale (3 351)THB 881 460 000 USD 27 815 084 02/04/2019 Société Générale (39 442)
USD 1 005 147 AUD 1 430 000 02/04/2019Barclays Bank Plc.
Wholesale (10 653)USD 3 015 840 AUD 4 290 000 02/04/2019 BNP Paribas S.A. (31 561)
USD 85 180 286 AUD 119 240 000 02/04/2019State Street Bank
London 478 168USD 6 008 285 CAD 7 950 000 02/04/2019 BNP Paribas S.A. 57 304
USD 161 095 868 CAD 211 990 000 02/04/2019Morgan Stanley & Co.
International Plc. 2 410 538USD 11 840 902 CHF 11 730 000 02/04/2019 Natwest Markets Plc. 62 611USD 1 548 849 CZK 35 110 000 02/04/2019 BNP Paribas S.A. 22 649
USD 6 739 535 CZK 151 220 000 02/04/2019Morgan Stanley & Co.
International Plc. 166 138
214 Merrill Lynch Investment Solutions
Merrill Lynch Investment Solutions – Global Debt -Government UCITS FundSchedule of Investments as at March 31, 2019 (cont.)(expressed in USD)
The accompanying notes form an integral part of these financial statements.
Audited annual report

Currencybought Amount bought Currency sold Amount sold
Maturitydate Counterparty
Unrealisedappreciation/
(depreciation)USD
Forward foreign exchange contracts (cont.)
USD 1 024 032 CZK 23 240 000 02/04/2019State Street Bank
London 13 810
USD 15 480 775 DKK 100 930 000 02/04/2019State Street Bank
London 300 250
USD 274 737 690 EUR 240 140 000 02/04/2019Barclays Bank Plc.
Wholesale 5 096 519USD 20 931 035 EUR 18 430 000 02/04/2019 BNP Paribas S.A. 236 911
USD 274 689 182 EUR 240 140 000 02/04/2019Goldman Sachs
International 5 048 011USD 294 786 900 EUR 257 660 000 02/04/2019 HSBC Bank Plc. 5 473 401
USD 1 495 552 EUR 1 320 000 02/04/2019Morgan Stanley & Co.
International Plc. 13 390USD 277 408 447 EUR 242 440 000 02/04/2019 Natwest Markets Plc. 5 184 722
USD 279 883 964 EUR 244 660 000 02/04/2019State Street Bank
London 5 167 511
USD 58 940 068 GBP 44 260 000 02/04/2019Barclays Bank Plc.
Wholesale 1 267 056USD 5 155 119 GBP 3 880 000 02/04/2019 BNP Paribas S.A. 99 284
USD 58 931 482 GBP 44 260 000 02/04/2019Goldman Sachs
International 1 258 469USD 58 974 149 GBP 44 260 000 02/04/2019 HSBC Bank Plc. 1 301 136USD 60 004 494 GBP 45 050 000 02/04/2019 Natwest Markets Plc. 1 302 071
USD 58 945 247 GBP 44 260 000 02/04/2019State Street Bank
London 1 272 234USD 6 115 053 HUF 1 688 310 000 02/04/2019 HSBC Bank Plc. 220 956
USD 9 944 352 ILS 35 770 000 02/04/2019Goldman Sachs
International 88 593
USD 277 457 011 JPY 30 671 615 000 02/04/2019Barclays Bank Plc.
Wholesale 349 768USD 30 340 939 JPY 3 383 030 000 02/04/2019 BNP Paribas S.A. (223 546)
USD 271 919 782 JPY 30 058 475 000 02/04/2019Goldman Sachs
International 352 045USD 298 862 040 JPY 33 037 220 000 02/04/2019 HSBC Bank Plc. 382 389USD 277 778 830 JPY 30 696 325 000 02/04/2019 Natwest Markets Plc. 448 343
USD 272 021 167 JPY 30 058 475 000 02/04/2019State Street Bank
London 453 430
USD 22 542 726 MXN 433 870 000 02/04/2019Goldman Sachs
International 175 411USD 6 707 099 NOK 57 030 000 02/04/2019 BNP Paribas S.A. 84 636USD 2 013 487 NZD 2 960 000 02/04/2019 BNP Paribas S.A. (5 233)USD 5 696 771 NZD 8 320 000 02/04/2019 Natwest Markets Plc. 22 532
USD 10 293 828 PLN 38 800 000 02/04/2019Morgan Stanley & Co.
International Plc. 173 453
USD 14 158 869 SEK 129 550 000 02/04/2019Goldman Sachs
International 191 666
USD 15 207 282 SGD 20 490 000 02/04/2019State Street Bank
London 79 929
USD 27 988 188 THB 881 460 000 02/04/2019Goldman Sachs
International 212 546
215Merrill Lynch Investment Solutions
Merrill Lynch Investment Solutions – Global Debt -Government UCITS FundSchedule of Investments as at March 31, 2019 (cont.)(expressed in USD)
The accompanying notes form an integral part of these financial statements.
Audited annual report

Currencybought Amount bought Currency sold Amount sold
Maturitydate Counterparty
Unrealisedappreciation/
(depreciation)USD
Forward foreign exchange contracts (cont.)
EUR 1 903 327 195 USD 2 171 466 009 03/04/2019State Street Bank and
Trust Co. (34 133 210)
GBP 106 503 865 USD 141 798 387 03/04/2019State Street Bank and
Trust Co. (3 011 328)
USD 2 137 530 611 EUR 1 903 327 194 03/04/2019State Street Bank and
Trust Co. 197 811
USD 138 794 468 GBP 106 503 865 03/04/2019State Street Bank and
Trust Co. 7 409
EUR 1 911 049 221 USD 2 151 529 198 03/05/2019State Street Bank and
Trust Co. (101 128)
GBP 107 051 660 USD 139 710 881 03/05/2019State Street Bank and
Trust Co. 506
USD 1 570 769 AUD 2 210 000 03/05/2019Barclays Bank Plc.
Wholesale (60)USD 88 643 375 AUD 124 960 000 03/05/2019 Natwest Markets Plc. (175 989)
USD 2 096 854 AUD 2 950 000 03/05/2019State Street Bank
London 46
USD 170 020 820 CAD 226 950 000 03/05/2019Barclays Bank Plc.
Wholesale 5 151
USD 11 825 132 CHF 11 730 000 03/05/2019State Street Bank
London 12 179USD 9 132 943 CZK 209 570 000 03/05/2019 HSBC Bank Plc. 15 250USD 15 230 195 DKK 100 930 000 03/05/2019 Natwest Markets Plc. 6 958
USD 305 844 214 EUR 271 680 000 03/05/2019Barclays Bank Plc.
Wholesale (8 702)USD 280 285 890 EUR 248 960 000 03/05/2019 Deutsche Bank AG 10 779
USD 280 286 886 EUR 248 960 000 03/05/2019Goldman Sachs
International 11 775USD 280 320 744 EUR 248 960 000 03/05/2019 HSBC Bank Plc. 45 634USD 280 175 799 EUR 248 950 000 03/05/2019 Société Générale (88 054)
USD 43 656 377 EUR 38 774 150 03/05/2019State Street Bank and
Trust Co. 5 072
USD 62 567 217 GBP 47 985 000 03/05/2019Barclays Bank Plc.
Wholesale (57 228)USD 58 953 488 GBP 45 195 000 03/05/2019 Deutsche Bank AG (29 774)
USD 58 953 307 GBP 45 195 000 03/05/2019Goldman Sachs
International (29 955)USD 58 971 340 GBP 45 195 000 03/05/2019 HSBC Bank Plc. (11 922)USD 58 986 371 GBP 45 190 000 03/05/2019 Société Générale 9 635
USD 5 179 723 GBP 3 961 894 03/05/2019State Street Bank and
Trust Co. 9 119USD 5 921 426 HUF 1 688 310 000 03/05/2019 HSBC Bank Plc. 13 584USD 9 884 943 ILS 35 770 000 03/05/2019 Société Générale 9 000USD 22 346 787 MXN 433 870 000 03/05/2019 Natwest Markets Plc. 89 972USD 6 639 341 NOK 57 030 000 03/05/2019 Deutsche Bank AG 8 843
USD 1 048 699 NOK 9 020 000 03/05/2019State Street Bank
London 4USD 7 680 902 NZD 11 280 000 03/05/2019 Natwest Markets Plc. (16 603)
USD 14 023 203 SEK 129 550 000 03/05/2019Goldman Sachs
International 23 619
216 Merrill Lynch Investment Solutions
Merrill Lynch Investment Solutions – Global Debt -Government UCITS FundSchedule of Investments as at March 31, 2019 (cont.)(expressed in USD)
The accompanying notes form an integral part of these financial statements.
Audited annual report

Currencybought Amount bought Currency sold Amount sold
Maturitydate Counterparty
Unrealisedappreciation/
(depreciation)USD
Forward foreign exchange contracts (cont.)USD 15 139 401 SGD 20 490 000 03/05/2019 Société Générale 3 492USD 27 809 669 THB 881 460 000 03/05/2019 Société Générale 12 293
USD 10 145 754 PLN 38 800 000 06/05/2019Morgan Stanley & Co.
International Plc. 14 627
JPY 2 188 140 000 USD 19 822 982 07/05/2019State Street Bank
London 6 206
USD 285 594 411 JPY 31 581 030 000 07/05/2019Barclays Bank Plc.
Wholesale (596 676)USD 285 699 049 JPY 31 581 030 000 07/05/2019 Deutsche Bank AG (492 039)
USD 285 646 075 JPY 31 581 030 000 07/05/2019Goldman Sachs
International (545 013)USD 285 640 907 JPY 31 581 030 000 07/05/2019 HSBC Bank Plc. (550 180)USD 285 701 543 JPY 31 581 020 000 07/05/2019 Société Générale (489 454)USD 22 713 227 IDR 328 705 820 000 19/06/2019 BNP Paribas S.A. (62 109)USD 103 892 714 KRW 117 686 550 000 19/06/2019 BNP Paribas S.A. 178 601
USD 2 089 665 KRW 2 371 770 000 19/06/2019Goldman Sachs
International (514)USD 3 637 719 KRW 4 100 000 000 19/06/2019 HSBC Bank Plc. 24 495
USD 24 439 829 MYR 100 020 000 19/06/2019State Street Bank
London (76 535)
USD 9 260 237 RUB 613 750 000 19/06/2019Morgan Stanley & Co.
International Plc. 21 676
Total forward foreign exchange contracts 1 773 723
The maximum individual counterparty exposure for OTC Derivatives including CFD as at March 31, 2019 is 0.14% of the NAV.
217Merrill Lynch Investment Solutions
Merrill Lynch Investment Solutions – Global Debt -Government UCITS FundSchedule of Investments as at March 31, 2019 (cont.)(expressed in USD)
The accompanying notes form an integral part of these financial statements.
Audited annual report

Nominalvalue Description
QuotationCurrency
CostUSD
Marketvalue USD
% of netassets
Transferable securities and money market instruments admitted to an official exchange listing or dealt in on another regulated market
Bonds200 000 ABN AMRO Bank NV 1.250% 10/01/2033 EUR 242 265 236 078 0.03
1 000 000 ABN AMRO Bank NV 3.375% 15/08/2031 CHF 1 401 494 1 395 722 0.19700 000 Achmea Bank NV 0.375% 22/11/2024 EUR 828 753 795 086 0.11500 000 Aegon Bank NV 0.250% 25/05/2023 EUR 611 262 566 317 0.08500 000 Aktia Bank OYJ - Reg 0.375% 05/03/2026 EUR 566 531 566 009 0.08300 000 Arkea Home Loans SFH S.A. 1.500% 01/06/2033 EUR 352 938 363 336 0.05200 000 Arqiva Financing Plc. 4.040% 30/06/2020 GBP 291 377 267 113 0.04183 342 Aspire Defence Finance Plc. - B 4.674% 31/03/2040 GBP 304 285 300 277 0.04300 000 AXA Bank Europe SCF 1.375% 18/04/2033 EUR 370 405 358 205 0.05300 000 Ayt Cedulas Cajas Global 4.750% 25/05/2027 EUR 458 545 444 558 0.06500 000 AyT Cedulas Cajas X Fondo de Titulizacion de Activos 3.750%
30/06/2025EUR 705 813 680 306 0.09
150 000 Banca Monte dei Paschi di Siena SpA 2.875% 16/04/2021 EUR 193 566 175 756 0.02150 000 Banca Monte dei Paschi di Siena SpA 2.875% 16/07/2024 EUR 200 694 178 913 0.02700 000 Banco Bilbao Vizcaya Argentaria S.A. 0.625% 18/03/2023 EUR 843 603 805 323 0.11500 000 Banco Bilbao Vizcaya Argentaria S.A. 0.750% 20/01/2022 EUR 626 474 575 766 0.08100 000 Banco BPI S.A. 0.250% 22/03/2024 EUR 112 742 112 391 0.01200 000 Banco BPM SpA 0.750% 31/03/2022 EUR 239 594 225 475 0.03300 000 Banco Comercial Portugues S.A. 0.750% 31/05/2022 EUR 359 954 342 621 0.05500 000 Banco de Sabadell S.A. 0.875% 12/11/2021 EUR 605 444 576 222 0.08300 000 Banco de Sabadell S.A. 1.000% 26/04/2027 EUR 357 443 347 085 0.05200 000 Banco Popular Espanol S.A. 0.750% 29/09/2020 EUR 240 138 227 883 0.03300 000 Banco Popular Espanol S.A. 1.000% 07/04/2025 EUR 363 005 351 622 0.05500 000 Banco Santander S.A. 0.750% 09/09/2022 EUR 607 218 577 858 0.08400 000 Banco Santander S.A. 4.625% 04/05/2027 EUR 616 504 600 071 0.08375 000 Bank of Ireland Mortgage Bank 0.625% 14/03/2025 EUR 463 214 433 083 0.06700 000 Bank of Montreal 0.200% 26/01/2023 EUR 829 956 792 597 0.11500 000 Bank of Montreal 144A 2.500% 11/01/2022 USD 494 612 497 317 0.07800 000 Bank of Nova Scotia 0.500% 23/07/2020 EUR 957 128 907 101 0.12500 000 Bank of Nova Scotia 0.500% 22/01/2025 EUR 603 576 572 314 0.08
1 000 000 Bankia S.A. 0.875% 21/01/2021 EUR 1 230 336 1 143 629 0.15300 000 Bankinter S.A. 0.875% 03/08/2022 EUR 363 394 346 682 0.05600 000 Barclays Bank UK Plc. 4.250% 02/03/2022 EUR 801 024 759 530 0.10
1 000 000 Bayerische Landesbank 0.750% 19/01/2028 EUR 1 208 794 1 157 974 0.16500 000 Belfius Bank S.A. 1.375% 05/06/2020 EUR 604 517 572 216 0.08500 000 Berlin Hyp AG 0.000% 29/11/2021 EUR 612 709 564 554 0.08
1 000 000 Berlin Hyp AG 0.375% 21/02/2025 EUR 1 188 970 1 141 945 0.15200 000 BNP Paribas Fortis S.A. 0.875% 22/03/2028 EUR 244 153 231 453 0.03
1 000 000 BNP Paribas Home Loan SFH S.A. 3.875% 12/07/2021 EUR 1 298 762 1 227 899 0.17700 000 BPCE SFH S.A. 0.750% 02/09/2025 EUR 860 749 813 904 0.11300 000 BPCE SFH S.A. 1.000% 08/06/2029 EUR 361 012 349 318 0.05300 000 BPER Banca 0.875% 22/01/2022 EUR 362 612 342 559 0.05
1 000 000 BRFkredit A/S 0.375% 01/07/2024 EUR 1 185 117 1 137 235 0.152 000 000 BRFkredit A/S 1.000% 01/04/2021 DKK 338 433 309 357 0.04
125 000 Broadgate Financing Plc. 4.821% 05/07/2033 GBP 217 797 211 406 0.03125 000 Broadgate Financing Plc. - B 4.999% 05/10/2031 GBP 209 246 197 184 0.03500 000 Caisse de Refinancement de l'Habitat S.A. 2.400% 17/01/2025 EUR 666 290 636 195 0.09
218 Merrill Lynch Investment Solutions
Merrill Lynch Investment Solutions – Global Debt -Securitised UCITS FundSchedule of Investments as at March 31, 2019(expressed in USD)
The accompanying notes form an integral part of these financial statements.
Audited annual report

Nominalvalue Description
QuotationCurrency
CostUSD
Marketvalue USD
% of netassets
Transferable securities and money market instruments admitted to an official exchange listing or dealt in on another regulated market (cont.)
Bonds (cont.)1 000 000 Caisse de Refinancement de l'Habitat S.A. 4.000% 10/01/2022 EUR 1 324 790 1 253 675 0.171 000 000 Caisse de Refinancement de l'Habitat S.A. 4.000% 17/06/2022 EUR 1 393 518 1 272 568 0.17
200 000 Caixa Economica Montepio Geral Caixa Economica BancariaS.A. 0.875% 17/10/2022
EUR 238 477 227 999 0.03
500 000 CaixaBank S.A. 0.625% 12/11/2020 EUR 599 602 568 985 0.08900 000 CaixaBank S.A. 0.625% 27/03/2025 EUR 1 104 645 1 026 481 0.14200 000 CaixaBank S.A. 1.250% 11/01/2027 EUR 243 348 237 024 0.03200 000 Caja Rural de Navarra SCC 0.875% 08/05/2025 EUR 242 038 230 695 0.03600 000 Canadian Imperial Bank of Commerce 0.000% 25/07/2022 EUR 710 147 675 324 0.09350 000 Canadian Imperial Bank of Commerce 0.250% 24/01/2023 EUR 427 290 396 987 0.05800 000 Cedulas TDA 6 Fondo de Titulizacion de Activos 3.875%
23/05/2025EUR 1 130 813 1 098 731 0.15
300 000 Channel Link Enterprises Finance Plc. FRN 30/06/2050 GBP 406 031 393 456 0.05600 000 Cie de Financement Foncier S.A. 0.250% 11/04/2023 EUR 735 339 681 572 0.09700 000 Cie de Financement Foncier S.A. 0.375% 11/12/2024 EUR 833 288 798 058 0.11400 000 Cie de Financement Foncier S.A. 1.250% 15/11/2032 EUR 477 411 470 378 0.06
1 500 000 Cie de Financement Foncier S.A. 4.375% 15/04/2021 EUR 1 946 786 1 843 152 0.25800 000 CIF Euromortgage S.A. 4.125% 19/01/2022 EUR 1 059 497 1 005 281 0.14
1 000 000 Commerzbank AG 0.250% 26/01/2022 EUR 1 196 363 1 136 643 0.15300 000 Commerzbank AG 0.875% 18/04/2028 EUR 368 946 350 222 0.05900 000 Commonwealth Bank of Australia 0.750% 04/11/2021 EUR 1 087 940 1 034 040 0.14500 000 Commonwealth Bank of Australia 1.125% 22/12/2021 GBP 669 514 649 535 0.09150 000 Commonwealth Bank of Australia - Reg 0.875% 19/02/2029 EUR 168 075 171 110 0.02300 000 Cooperatieve Rabobank UA 1.500% 26/04/2038 EUR 371 005 362 230 0.05500 000 Cooperatieve Rabobank UA - Reg 0.875% 01/02/2029 EUR 577 426 579 916 0.08400 000 Credit Agricole Cariparma SpA 0.875% 31/01/2022 EUR 483 779 458 689 0.06500 000 Credit Agricole Cariparma SpA 1.750% 15/01/2038 EUR 597 437 584 270 0.08
1 000 000 Credit Agricole Home Loan SFH S.A. 0.500% 03/04/2025 EUR 1 195 574 1 148 040 0.15400 000 Credit Agricole Home Loan SFH S.A. 1.500% 28/09/2038 EUR 461 999 479 286 0.06
1 000 000 Credit Agricole Home Loan SFH S.A. 4.000% 17/01/2022 EUR 1 317 595 1 254 841 0.17200 000 Credit Agricole Public Sector SCF S.A. 0.625% 29/03/2029 EUR 226 093 225 177 0.03700 000 Credit Mutuel - CIC Home Loan SFH S.A. 0.625% 02/02/2026 EUR 862 796 806 153 0.11
1 000 000 Credit Suisse AG 1.750% 15/01/2021 EUR 1 227 024 1 161 633 0.16400 000 Credito Emiliano SpA 3.250% 09/07/2020 EUR 495 011 467 666 0.06
10 000 000 Danske Hypotek AB 1.000% 15/12/2021 SEK 1 262 811 1 099 389 0.154 000 000 Danske Hypotek AB 1.000% 21/12/2022 SEK 481 026 439 787 0.06
300 000 de Volksbank NV - Reg 0.500% 30/01/2026 EUR 339 364 342 356 0.05200 000 Deutsche Apotheker-und Aerztebank eG 0.500% 14/02/2025 EUR 245 830 230 046 0.03500 000 Deutsche Bank S.A. Espanola 0.500% 11/03/2024 EUR 575 561 566 568 0.08500 000 Deutsche Bank S.A. Espanola 0.625% 25/11/2020 EUR 620 738 568 887 0.08500 000 Deutsche Hypothekenbank AG 0.125% 20/04/2022 EUR 596 821 566 373 0.08200 000 Deutsche Hypothekenbank AG - Reg 0.750% 05/03/2029 EUR 226 560 228 758 0.03300 000 Deutsche Kreditbank AG 0.875% 02/10/2028 EUR 349 692 349 152 0.05300 000 Deutsche Pfandbriefbank AG 0.625% 30/08/2027 EUR 342 701 343 392 0.05
1 000 000 Deutsche Pfandbriefbank AG 1.000% 04/12/2020 GBP 1 392 739 1 297 825 0.18125 656 Dignity Finance Plc. - A 3.546% 31/12/2034 GBP 187 756 174 223 0.02100 000 Dignity Finance Plc. - B 4.696% 31/12/2049 GBP 171 998 115 434 0.02
219Merrill Lynch Investment Solutions
Merrill Lynch Investment Solutions – Global Debt -Securitised UCITS FundSchedule of Investments as at March 31, 2019 (cont.)(expressed in USD)
The accompanying notes form an integral part of these financial statements.
Audited annual report

Nominalvalue Description
QuotationCurrency
CostUSD
Marketvalue USD
% of netassets
Transferable securities and money market instruments admitted to an official exchange listing or dealt in on another regulated market (cont.)
Bonds (cont.)3 000 000 DLR Kredit A/S - B 1.000% 01/10/2020 DKK 489 705 461 000 0.061 000 000 DNB Boligkreditt A/S 0.375% 20/11/2024 EUR 1 183 126 1 138 143 0.151 000 000 DNB Boligkreditt A/S 144A 2.500% 28/03/2022 USD 1 001 567 995 920 0.13
10 000 000 DNB Boligkreditt AS 0.750% 31/01/2024 SEK 1 063 423 1 085 356 0.15200 000 DZ HYP AG 0.250% 30/06/2023 EUR 247 159 227 607 0.03600 000 DZ HYP AG 0.875% 18/01/2030 EUR 708 905 693 076 0.09300 000 Erste Group Bank AG 0.625% 17/04/2026 EUR 367 646 345 171 0.05500 000 Eurocaja Rural SCC 0.875% 01/10/2021 EUR 605 205 576 042 0.08700 000 Fannie Mae Pool 2.250% 26/03/2021 EUR 870 012 824 865 0.11400 000 Ginnie Mae II Pool - Reg 0.375% 07/03/2024 EUR 455 232 452 223 0.06132 124 Greene King Finance Plc. 4.064% 15/03/2035 GBP 195 357 184 331 0.02100 000 Greene King Finance Plc. - Reg 3.593% 15/03/2035 GBP 128 475 132 872 0.02100 000 High Speed Rail Finance 1 Plc. 4.375% 01/11/2038 GBP 166 131 161 076 0.02700 000 HSBC SFH France S.A. 0.375% 11/03/2022 EUR 843 232 799 090 0.11700 000 Hypoe NOE Landesbank fuer Niederoesterreich und Wien AG
0.375% 04/04/2023EUR 834 499 797 392 0.11
300 000 IM Cedulas 10 Fondo de Titulazion de Activos 4.500%21/02/2022
EUR 400 390 380 776 0.05
400 000 ING Bank NV 0.875% 11/04/2028 EUR 486 608 466 504 0.06700 000 ING Bank NV 2.000% 28/08/2020 EUR 857 166 811 334 0.11800 000 ING Belgium S.A. 0.750% 28/09/2026 EUR 936 917 925 201 0.12800 000 Intesa Sanpaolo SpA 3.250% 10/02/2026 EUR 1 121 048 1 062 423 0.14300 000 Intesa Sanpaolo SpA - Reg 0.500% 05/03/2024 EUR 339 305 340 988 0.05175 000 Intu SGS Finance Plc. 4.625% 17/03/2028 GBP 270 913 230 975 0.03
1 000 000 KBC Bank NV 0.125% 28/04/2021 EUR 1 244 956 1 131 053 0.151 000 000 La Banque Postale Home Loan SFH S.A. 0.175% 22/04/2022 EUR 1 194 184 1 134 020 0.151 200 000 Landesbank Baden-Wuerttemberg - Reg 0.000% 25/10/2022 EUR 1 378 617 1 354 057 0.181 200 000 Landesbank Hessen-Thueringen Girozentrale 0.000%
23/11/2020EUR 1 431 563 1 353 437 0.18
300 000 Landesbank Hessen-Thueringen Girozentrale 0.875%20/03/2028
EUR 351 425 350 529 0.05
3 000 000 Landshypotek Bank AB 0.750% 25/05/2023 SEK 342 556 325 519 0.04300 000 Lansforsakringar Hypotek AB 0.625% 27/03/2025 EUR 366 502 345 145 0.05
5 000 000 Lansforsakringar Hypotek AB 3.250% 16/09/2020 SEK 627 262 564 561 0.081 000 000 Lloyds Bank Plc. 0.375% 18/01/2021 EUR 1 195 752 1 134 143 0.15
500 000 Lloyds Bank Plc. 0.500% 22/07/2020 EUR 619 313 566 717 0.08600 000 Lloyds Bank Plc. 5.125% 07/03/2025 GBP 960 214 941 838 0.13150 000 Mediobanca Banca di Credito Finanziario SpA 1.250%
24/11/2029EUR 177 400 170 183 0.02
500 000 Mediobanca Banca di Credito Finanziario SpA 3.625%17/10/2023
EUR 703 327 643 768 0.09
108 799 Mitchells & Butlers Finance Plc. 6.013% 15/12/2028 GBP 172 310 160 849 0.02300 000 MMB SCF SACA - Reg 0.750% 31/10/2025 EUR 339 638 345 371 0.05
1 000 000 Muenchener Hypothekenbank eG 1.375% 16/04/2021 EUR 1 277 993 1 160 084 0.161 300 000 National Australia Bank Ltd. 144A 2.250% 16/03/2021 USD 1 298 619 1 290 275 0.17
200 000 National Australia Bank Ltd. - Reg 0.750% 30/01/2026 EUR 226 649 230 626 0.03400 000 National Bank of Canada 1.500% 25/03/2021 EUR 486 993 464 334 0.06
1 000 000 National Westminster Bank Plc. 3.875% 19/10/2020 EUR 1 317 345 1 193 668 0.16
220 Merrill Lynch Investment Solutions
Merrill Lynch Investment Solutions – Global Debt -Securitised UCITS FundSchedule of Investments as at March 31, 2019 (cont.)(expressed in USD)
The accompanying notes form an integral part of these financial statements.
Audited annual report
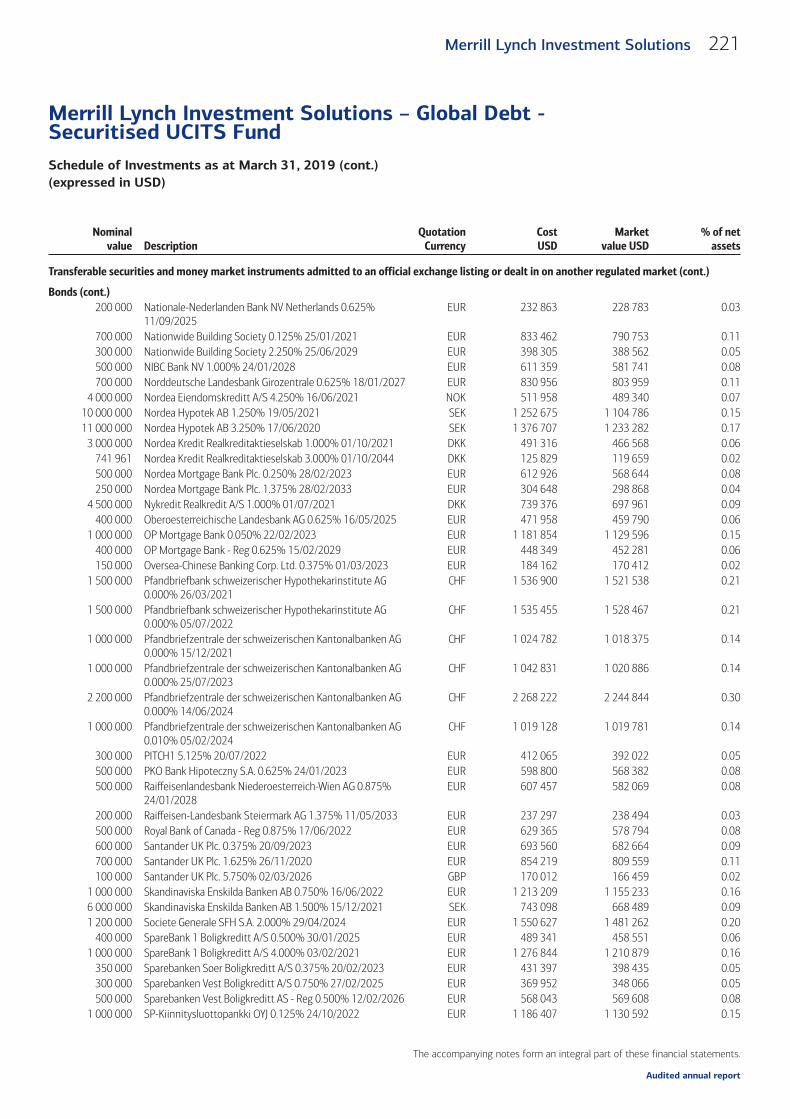
Nominalvalue Description
QuotationCurrency
CostUSD
Marketvalue USD
% of netassets
Transferable securities and money market instruments admitted to an official exchange listing or dealt in on another regulated market (cont.)
Bonds (cont.)200 000 Nationale-Nederlanden Bank NV Netherlands 0.625%
11/09/2025EUR 232 863 228 783 0.03
700 000 Nationwide Building Society 0.125% 25/01/2021 EUR 833 462 790 753 0.11300 000 Nationwide Building Society 2.250% 25/06/2029 EUR 398 305 388 562 0.05500 000 NIBC Bank NV 1.000% 24/01/2028 EUR 611 359 581 741 0.08700 000 Norddeutsche Landesbank Girozentrale 0.625% 18/01/2027 EUR 830 956 803 959 0.11
4 000 000 Nordea Eiendomskreditt A/S 4.250% 16/06/2021 NOK 511 958 489 340 0.0710 000 000 Nordea Hypotek AB 1.250% 19/05/2021 SEK 1 252 675 1 104 786 0.1511 000 000 Nordea Hypotek AB 3.250% 17/06/2020 SEK 1 376 707 1 233 282 0.17
3 000 000 Nordea Kredit Realkreditaktieselskab 1.000% 01/10/2021 DKK 491 316 466 568 0.06741 961 Nordea Kredit Realkreditaktieselskab 3.000% 01/10/2044 DKK 125 829 119 659 0.02500 000 Nordea Mortgage Bank Plc. 0.250% 28/02/2023 EUR 612 926 568 644 0.08250 000 Nordea Mortgage Bank Plc. 1.375% 28/02/2033 EUR 304 648 298 868 0.04
4 500 000 Nykredit Realkredit A/S 1.000% 01/07/2021 DKK 739 376 697 961 0.09400 000 Oberoesterreichische Landesbank AG 0.625% 16/05/2025 EUR 471 958 459 790 0.06
1 000 000 OP Mortgage Bank 0.050% 22/02/2023 EUR 1 181 854 1 129 596 0.15400 000 OP Mortgage Bank - Reg 0.625% 15/02/2029 EUR 448 349 452 281 0.06150 000 Oversea-Chinese Banking Corp. Ltd. 0.375% 01/03/2023 EUR 184 162 170 412 0.02
1 500 000 Pfandbriefbank schweizerischer Hypothekarinstitute AG0.000% 26/03/2021
CHF 1 536 900 1 521 538 0.21
1 500 000 Pfandbriefbank schweizerischer Hypothekarinstitute AG0.000% 05/07/2022
CHF 1 535 455 1 528 467 0.21
1 000 000 Pfandbriefzentrale der schweizerischen Kantonalbanken AG0.000% 15/12/2021
CHF 1 024 782 1 018 375 0.14
1 000 000 Pfandbriefzentrale der schweizerischen Kantonalbanken AG0.000% 25/07/2023
CHF 1 042 831 1 020 886 0.14
2 200 000 Pfandbriefzentrale der schweizerischen Kantonalbanken AG0.000% 14/06/2024
CHF 2 268 222 2 244 844 0.30
1 000 000 Pfandbriefzentrale der schweizerischen Kantonalbanken AG0.010% 05/02/2024
CHF 1 019 128 1 019 781 0.14
300 000 PITCH1 5.125% 20/07/2022 EUR 412 065 392 022 0.05500 000 PKO Bank Hipoteczny S.A. 0.625% 24/01/2023 EUR 598 800 568 382 0.08500 000 Raiffeisenlandesbank Niederoesterreich-Wien AG 0.875%
24/01/2028EUR 607 457 582 069 0.08
200 000 Raiffeisen-Landesbank Steiermark AG 1.375% 11/05/2033 EUR 237 297 238 494 0.03500 000 Royal Bank of Canada - Reg 0.875% 17/06/2022 EUR 629 365 578 794 0.08600 000 Santander UK Plc. 0.375% 20/09/2023 EUR 693 560 682 664 0.09700 000 Santander UK Plc. 1.625% 26/11/2020 EUR 854 219 809 559 0.11100 000 Santander UK Plc. 5.750% 02/03/2026 GBP 170 012 166 459 0.02
1 000 000 Skandinaviska Enskilda Banken AB 0.750% 16/06/2022 EUR 1 213 209 1 155 233 0.166 000 000 Skandinaviska Enskilda Banken AB 1.500% 15/12/2021 SEK 743 098 668 489 0.091 200 000 Societe Generale SFH S.A. 2.000% 29/04/2024 EUR 1 550 627 1 481 262 0.20
400 000 SpareBank 1 Boligkreditt A/S 0.500% 30/01/2025 EUR 489 341 458 551 0.061 000 000 SpareBank 1 Boligkreditt A/S 4.000% 03/02/2021 EUR 1 276 844 1 210 879 0.16
350 000 Sparebanken Soer Boligkreditt A/S 0.375% 20/02/2023 EUR 431 397 398 435 0.05300 000 Sparebanken Vest Boligkreditt A/S 0.750% 27/02/2025 EUR 369 952 348 066 0.05500 000 Sparebanken Vest Boligkreditt AS - Reg 0.500% 12/02/2026 EUR 568 043 569 608 0.08
1 000 000 SP-Kiinnitysluottopankki OYJ 0.125% 24/10/2022 EUR 1 186 407 1 130 592 0.15
221Merrill Lynch Investment Solutions
Merrill Lynch Investment Solutions – Global Debt -Securitised UCITS FundSchedule of Investments as at March 31, 2019 (cont.)(expressed in USD)
The accompanying notes form an integral part of these financial statements.
Audited annual report
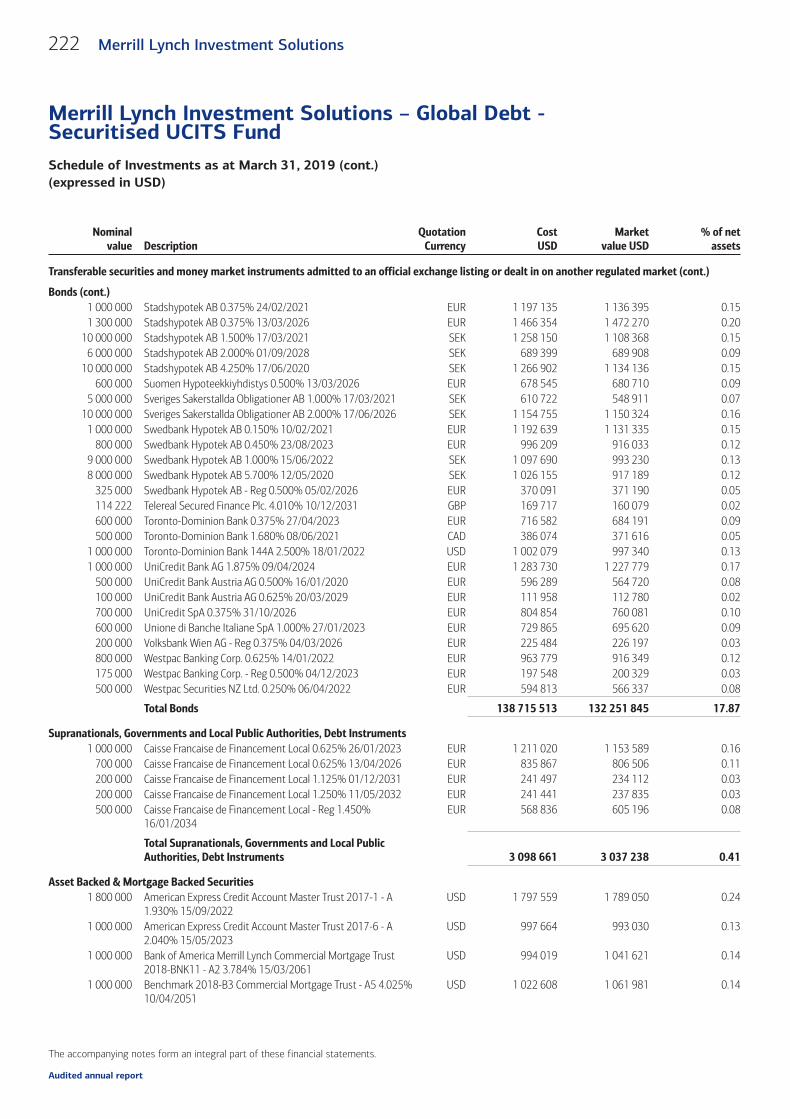
Nominalvalue Description
QuotationCurrency
CostUSD
Marketvalue USD
% of netassets
Transferable securities and money market instruments admitted to an official exchange listing or dealt in on another regulated market (cont.)
Bonds (cont.)1 000 000 Stadshypotek AB 0.375% 24/02/2021 EUR 1 197 135 1 136 395 0.151 300 000 Stadshypotek AB 0.375% 13/03/2026 EUR 1 466 354 1 472 270 0.20
10 000 000 Stadshypotek AB 1.500% 17/03/2021 SEK 1 258 150 1 108 368 0.156 000 000 Stadshypotek AB 2.000% 01/09/2028 SEK 689 399 689 908 0.09
10 000 000 Stadshypotek AB 4.250% 17/06/2020 SEK 1 266 902 1 134 136 0.15600 000 Suomen Hypoteekkiyhdistys 0.500% 13/03/2026 EUR 678 545 680 710 0.09
5 000 000 Sveriges Sakerstallda Obligationer AB 1.000% 17/03/2021 SEK 610 722 548 911 0.0710 000 000 Sveriges Sakerstallda Obligationer AB 2.000% 17/06/2026 SEK 1 154 755 1 150 324 0.16
1 000 000 Swedbank Hypotek AB 0.150% 10/02/2021 EUR 1 192 639 1 131 335 0.15800 000 Swedbank Hypotek AB 0.450% 23/08/2023 EUR 996 209 916 033 0.12
9 000 000 Swedbank Hypotek AB 1.000% 15/06/2022 SEK 1 097 690 993 230 0.138 000 000 Swedbank Hypotek AB 5.700% 12/05/2020 SEK 1 026 155 917 189 0.12
325 000 Swedbank Hypotek AB - Reg 0.500% 05/02/2026 EUR 370 091 371 190 0.05114 222 Telereal Secured Finance Plc. 4.010% 10/12/2031 GBP 169 717 160 079 0.02600 000 Toronto-Dominion Bank 0.375% 27/04/2023 EUR 716 582 684 191 0.09500 000 Toronto-Dominion Bank 1.680% 08/06/2021 CAD 386 074 371 616 0.05
1 000 000 Toronto-Dominion Bank 144A 2.500% 18/01/2022 USD 1 002 079 997 340 0.131 000 000 UniCredit Bank AG 1.875% 09/04/2024 EUR 1 283 730 1 227 779 0.17
500 000 UniCredit Bank Austria AG 0.500% 16/01/2020 EUR 596 289 564 720 0.08100 000 UniCredit Bank Austria AG 0.625% 20/03/2029 EUR 111 958 112 780 0.02700 000 UniCredit SpA 0.375% 31/10/2026 EUR 804 854 760 081 0.10600 000 Unione di Banche Italiane SpA 1.000% 27/01/2023 EUR 729 865 695 620 0.09200 000 Volksbank Wien AG - Reg 0.375% 04/03/2026 EUR 225 484 226 197 0.03800 000 Westpac Banking Corp. 0.625% 14/01/2022 EUR 963 779 916 349 0.12175 000 Westpac Banking Corp. - Reg 0.500% 04/12/2023 EUR 197 548 200 329 0.03500 000 Westpac Securities NZ Ltd. 0.250% 06/04/2022 EUR 594 813 566 337 0.08
Total Bonds 138 715 513 132 251 845 17.87
Supranationals, Governments and Local Public Authorities, Debt Instruments1 000 000 Caisse Francaise de Financement Local 0.625% 26/01/2023 EUR 1 211 020 1 153 589 0.16
700 000 Caisse Francaise de Financement Local 0.625% 13/04/2026 EUR 835 867 806 506 0.11200 000 Caisse Francaise de Financement Local 1.125% 01/12/2031 EUR 241 497 234 112 0.03200 000 Caisse Francaise de Financement Local 1.250% 11/05/2032 EUR 241 441 237 835 0.03500 000 Caisse Francaise de Financement Local - Reg 1.450%
16/01/2034EUR 568 836 605 196 0.08
Total Supranationals, Governments and Local PublicAuthorities, Debt Instruments 3 098 661 3 037 238 0.41
Asset Backed & Mortgage Backed Securities1 800 000 American Express Credit Account Master Trust 2017-1 - A
1.930% 15/09/2022USD 1 797 559 1 789 050 0.24
1 000 000 American Express Credit Account Master Trust 2017-6 - A2.040% 15/05/2023
USD 997 664 993 030 0.13
1 000 000 Bank of America Merrill Lynch Commercial Mortgage Trust2018-BNK11 - A2 3.784% 15/03/2061
USD 994 019 1 041 621 0.14
1 000 000 Benchmark 2018-B3 Commercial Mortgage Trust - A5 4.025%10/04/2051
USD 1 022 608 1 061 981 0.14
222 Merrill Lynch Investment Solutions
Merrill Lynch Investment Solutions – Global Debt -Securitised UCITS FundSchedule of Investments as at March 31, 2019 (cont.)(expressed in USD)
The accompanying notes form an integral part of these financial statements.
Audited annual report

Nominalvalue Description
QuotationCurrency
CostUSD
Marketvalue USD
% of netassets
Transferable securities and money market instruments admitted to an official exchange listing or dealt in on another regulated market (cont.)
Asset Backed & Mortgage Backed Securities (cont.)1 800 000 Capital One Multi-Asset Execution Trust 2017-A3 - A3 1.920%
07/04/2022USD 1 796 089 1 787 655 0.24
1 000 000 Capital One Multi-Asset Execution Trust 2017-A6 - A6 2.290%15/07/2025
USD 966 434 990 943 0.13
2 000 000 CD 2017-CD3 Mortgage Trust - A4 3.631% 10/02/2050 USD 2 083 905 2 066 152 0.281 000 000 CD 2017-CD6 Mortgage Trust - AM FRN 13/11/2050 USD 1 023 996 1 011 096 0.141 000 000 Citibank Credit Card Issuance Trust 2016-A1 - A1 1.750%
19/11/2021USD 990 417 994 455 0.13
1 000 000 Citigroup Commercial Mortgage Trust 2013-GC17 - A3 3.854%10/11/2046
USD 1 029 298 1 040 675 0.14
1 000 000 CSAIL 2016-C7 Commercial Mortgage Trust - A5 3.502%15/11/2049
USD 1 022 236 1 020 211 0.14
3 330 511 Fannie Mae Pool 3.000% 01/01/2043 USD 3 330 511 3 332 793 0.4512 952 836 Fannie Mae Pool 3.000% 01/03/2046 USD 12 968 282 12 913 374 1.75
115 144 Fannie Mae Pool 3.000% 01/08/2046 USD 111 648 114 936 0.02576 178 Fannie Mae Pool 3.000% 01/11/2046 USD 552 102 573 722 0.08535 380 Fannie Mae Pool 3.000% 01/03/2047 USD 516 798 533 749 0.07
2 622 755 Fannie Mae Pool 3.500% 01/05/2042 USD 2 689 176 2 678 569 0.3627 552 362 Fannie Mae Pool 3.500% 01/01/2044 USD 28 593 456 28 308 693 3.83
1 176 385 Fannie Mae Pool 3.500% 01/02/2046 USD 1 175 412 1 196 689 0.161 025 382 Fannie Mae Pool 3.500% 01/03/2046 USD 1 009 900 1 048 144 0.141 312 551 Fannie Mae Pool 3.500% 01/09/2046 USD 1 344 265 1 341 540 0.18
496 483 Fannie Mae Pool 3.500% 01/10/2046 USD 486 077 504 659 0.078 555 635 Fannie Mae Pool 3.500% 01/01/2047 USD 8 665 459 8 765 265 1.192 412 289 Fannie Mae Pool 3.500% 01/04/2047 USD 2 367 163 2 450 580 0.331 186 228 Fannie Mae Pool 3.500% 01/09/2047 USD 1 203 253 1 204 569 0.16
826 492 Fannie Mae Pool 3.500% 01/10/2047 USD 847 670 839 314 0.114 149 376 Fannie Mae Pool 3.500% 01/11/2047 USD 4 257 908 4 213 316 0.574 412 588 Fannie Mae Pool 3.500% 01/11/2047 USD 4 547 539 4 493 796 0.61
923 710 Fannie Mae Pool 3.500% 01/11/2047 USD 947 381 937 944 0.138 837 462 Fannie Mae Pool 3.500% 01/12/2047 USD 8 834 767 9 020 140 1.22
280 396 Fannie Mae Pool 3.500% 01/01/2048 USD 280 571 284 718 0.045 458 979 Fannie Mae Pool 3.500% 01/02/2048 USD 5 478 785 5 576 862 0.75
306 240 Fannie Mae Pool 3.500% 01/03/2048 USD 306 431 311 158 0.04149 632 Fannie Mae Pool 3.500% 01/04/2048 USD 150 338 153 326 0.02712 089 Fannie Mae Pool 3.500% 01/11/2051 USD 698 488 724 843 0.10
42 924 Fannie Mae Pool 4.000% 01/06/2025 USD 44 240 44 225 0.013 384 940 Fannie Mae Pool 4.000% 01/08/2038 USD 3 471 861 3 501 030 0.471 371 801 Fannie Mae Pool 4.000% 01/08/2043 USD 1 395 982 1 437 485 0.191 872 868 Fannie Mae Pool 4.000% 01/05/2044 USD 1 899 007 1 956 432 0.261 802 245 Fannie Mae Pool 4.000% 01/06/2044 USD 1 905 118 1 882 614 0.25
221 102 Fannie Mae Pool 4.000% 01/01/2045 USD 222 702 228 893 0.035 447 394 Fannie Mae Pool 4.000% 01/01/2045 USD 5 529 310 5 649 460 0.76
365 684 Fannie Mae Pool 4.000% 01/03/2045 USD 375 009 378 401 0.05345 623 Fannie Mae Pool 4.000% 01/02/2047 USD 353 310 357 090 0.05
8 528 866 Fannie Mae Pool 4.000% 01/03/2047 USD 8 682 198 8 937 374 1.211 763 966 Fannie Mae Pool 4.000% 01/08/2047 USD 1 832 287 1 823 054 0.25
893 089 Fannie Mae Pool 4.000% 01/09/2047 USD 913 579 921 948 0.13
223Merrill Lynch Investment Solutions
Merrill Lynch Investment Solutions – Global Debt -Securitised UCITS FundSchedule of Investments as at March 31, 2019 (cont.)(expressed in USD)
The accompanying notes form an integral part of these financial statements.
Audited annual report
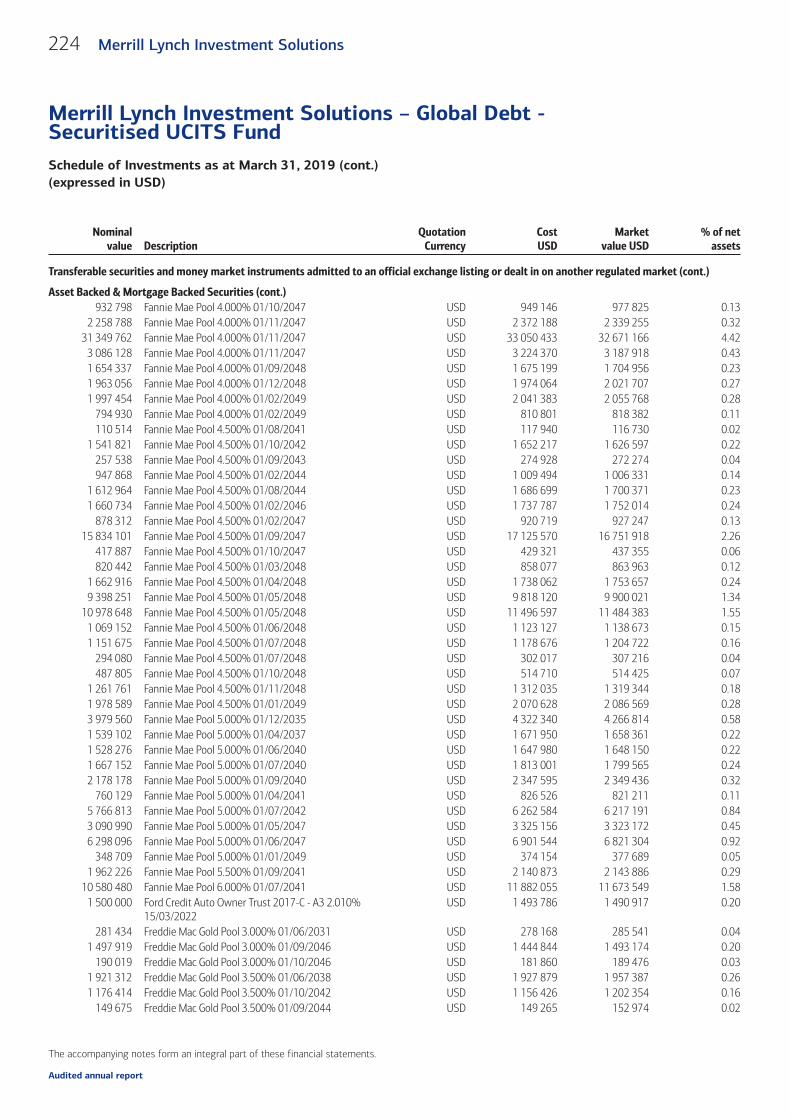
Nominalvalue Description
QuotationCurrency
CostUSD
Marketvalue USD
% of netassets
Transferable securities and money market instruments admitted to an official exchange listing or dealt in on another regulated market (cont.)
Asset Backed & Mortgage Backed Securities (cont.)932 798 Fannie Mae Pool 4.000% 01/10/2047 USD 949 146 977 825 0.13
2 258 788 Fannie Mae Pool 4.000% 01/11/2047 USD 2 372 188 2 339 255 0.3231 349 762 Fannie Mae Pool 4.000% 01/11/2047 USD 33 050 433 32 671 166 4.42
3 086 128 Fannie Mae Pool 4.000% 01/11/2047 USD 3 224 370 3 187 918 0.431 654 337 Fannie Mae Pool 4.000% 01/09/2048 USD 1 675 199 1 704 956 0.231 963 056 Fannie Mae Pool 4.000% 01/12/2048 USD 1 974 064 2 021 707 0.271 997 454 Fannie Mae Pool 4.000% 01/02/2049 USD 2 041 383 2 055 768 0.28
794 930 Fannie Mae Pool 4.000% 01/02/2049 USD 810 801 818 382 0.11110 514 Fannie Mae Pool 4.500% 01/08/2041 USD 117 940 116 730 0.02
1 541 821 Fannie Mae Pool 4.500% 01/10/2042 USD 1 652 217 1 626 597 0.22257 538 Fannie Mae Pool 4.500% 01/09/2043 USD 274 928 272 274 0.04947 868 Fannie Mae Pool 4.500% 01/02/2044 USD 1 009 494 1 006 331 0.14
1 612 964 Fannie Mae Pool 4.500% 01/08/2044 USD 1 686 699 1 700 371 0.231 660 734 Fannie Mae Pool 4.500% 01/02/2046 USD 1 737 787 1 752 014 0.24
878 312 Fannie Mae Pool 4.500% 01/02/2047 USD 920 719 927 247 0.1315 834 101 Fannie Mae Pool 4.500% 01/09/2047 USD 17 125 570 16 751 918 2.26
417 887 Fannie Mae Pool 4.500% 01/10/2047 USD 429 321 437 355 0.06820 442 Fannie Mae Pool 4.500% 01/03/2048 USD 858 077 863 963 0.12
1 662 916 Fannie Mae Pool 4.500% 01/04/2048 USD 1 738 062 1 753 657 0.249 398 251 Fannie Mae Pool 4.500% 01/05/2048 USD 9 818 120 9 900 021 1.34
10 978 648 Fannie Mae Pool 4.500% 01/05/2048 USD 11 496 597 11 484 383 1.551 069 152 Fannie Mae Pool 4.500% 01/06/2048 USD 1 123 127 1 138 673 0.151 151 675 Fannie Mae Pool 4.500% 01/07/2048 USD 1 178 676 1 204 722 0.16
294 080 Fannie Mae Pool 4.500% 01/07/2048 USD 302 017 307 216 0.04487 805 Fannie Mae Pool 4.500% 01/10/2048 USD 514 710 514 425 0.07
1 261 761 Fannie Mae Pool 4.500% 01/11/2048 USD 1 312 035 1 319 344 0.181 978 589 Fannie Mae Pool 4.500% 01/01/2049 USD 2 070 628 2 086 569 0.283 979 560 Fannie Mae Pool 5.000% 01/12/2035 USD 4 322 340 4 266 814 0.581 539 102 Fannie Mae Pool 5.000% 01/04/2037 USD 1 671 950 1 658 361 0.221 528 276 Fannie Mae Pool 5.000% 01/06/2040 USD 1 647 980 1 648 150 0.221 667 152 Fannie Mae Pool 5.000% 01/07/2040 USD 1 813 001 1 799 565 0.242 178 178 Fannie Mae Pool 5.000% 01/09/2040 USD 2 347 595 2 349 436 0.32
760 129 Fannie Mae Pool 5.000% 01/04/2041 USD 826 526 821 211 0.115 766 813 Fannie Mae Pool 5.000% 01/07/2042 USD 6 262 584 6 217 191 0.843 090 990 Fannie Mae Pool 5.000% 01/05/2047 USD 3 325 156 3 323 172 0.456 298 096 Fannie Mae Pool 5.000% 01/06/2047 USD 6 901 544 6 821 304 0.92
348 709 Fannie Mae Pool 5.000% 01/01/2049 USD 374 154 377 689 0.051 962 226 Fannie Mae Pool 5.500% 01/09/2041 USD 2 140 873 2 143 886 0.29
10 580 480 Fannie Mae Pool 6.000% 01/07/2041 USD 11 882 055 11 673 549 1.581 500 000 Ford Credit Auto Owner Trust 2017-C - A3 2.010%
15/03/2022USD 1 493 786 1 490 917 0.20
281 434 Freddie Mac Gold Pool 3.000% 01/06/2031 USD 278 168 285 541 0.041 497 919 Freddie Mac Gold Pool 3.000% 01/09/2046 USD 1 444 844 1 493 174 0.20
190 019 Freddie Mac Gold Pool 3.000% 01/10/2046 USD 181 860 189 476 0.031 921 312 Freddie Mac Gold Pool 3.500% 01/06/2038 USD 1 927 879 1 957 387 0.261 176 414 Freddie Mac Gold Pool 3.500% 01/10/2042 USD 1 156 426 1 202 354 0.16
149 675 Freddie Mac Gold Pool 3.500% 01/09/2044 USD 149 265 152 974 0.02
224 Merrill Lynch Investment Solutions
Merrill Lynch Investment Solutions – Global Debt -Securitised UCITS FundSchedule of Investments as at March 31, 2019 (cont.)(expressed in USD)
The accompanying notes form an integral part of these financial statements.
Audited annual report

Nominalvalue Description
QuotationCurrency
CostUSD
Marketvalue USD
% of netassets
Transferable securities and money market instruments admitted to an official exchange listing or dealt in on another regulated market (cont.)
Asset Backed & Mortgage Backed Securities (cont.)1 117 000 Freddie Mac Gold Pool 3.500% 01/10/2044 USD 1 130 701 1 138 164 0.152 168 978 Freddie Mac Gold Pool 3.500% 01/08/2045 USD 2 124 696 2 208 079 0.30
50 351 Freddie Mac Gold Pool 3.500% 01/08/2046 USD 49 841 51 461 0.011 043 115 Freddie Mac Gold Pool 3.500% 01/08/2047 USD 1 046 886 1 064 900 0.14
301 325 Freddie Mac Gold Pool 3.500% 01/09/2047 USD 302 735 306 246 0.042 494 699 Freddie Mac Gold Pool 3.500% 01/09/2047 USD 2 499 976 2 546 608 0.342 790 746 Freddie Mac Gold Pool 3.500% 01/11/2047 USD 2 845 176 2 835 889 0.383 231 983 Freddie Mac Gold Pool 3.500% 01/12/2047 USD 3 318 754 3 285 865 0.442 341 721 Freddie Mac Gold Pool 3.500% 01/12/2047 USD 2 404 250 2 379 601 0.32
904 892 Freddie Mac Gold Pool 3.500% 01/12/2047 USD 939 115 926 530 0.13889 519 Freddie Mac Gold Pool 3.500% 01/12/2047 USD 893 956 909 414 0.12
2 092 013 Freddie Mac Gold Pool 3.500% 01/01/2048 USD 2 098 951 2 142 340 0.291 864 941 Freddie Mac Gold Pool 3.500% 01/02/2048 USD 1 870 177 1 895 102 0.267 544 322 Freddie Mac Gold Pool 3.500% 01/03/2048 USD 7 501 640 7 706 014 1.041 174 239 Freddie Mac Gold Pool 3.500% 01/07/2048 USD 1 174 899 1 193 232 0.16
543 491 Freddie Mac Gold Pool 3.500% 01/01/2049 USD 543 027 552 114 0.08864 991 Freddie Mac Gold Pool 4.000% 01/10/2037 USD 911 089 899 379 0.12
2 090 954 Freddie Mac Gold Pool 4.000% 01/02/2041 USD 2 145 355 2 170 215 0.291 876 502 Freddie Mac Gold Pool 4.000% 01/01/2044 USD 1 925 507 1 947 700 0.26
929 917 Freddie Mac Gold Pool 4.000% 01/09/2045 USD 951 395 960 625 0.131 054 168 Freddie Mac Gold Pool 4.000% 01/10/2047 USD 1 082 126 1 092 517 0.156 151 072 Freddie Mac Gold Pool 4.000% 01/01/2048 USD 6 337 025 6 388 504 0.861 301 125 Freddie Mac Gold Pool 4.000% 01/02/2048 USD 1 331 514 1 342 851 0.18
509 422 Freddie Mac Gold Pool 4.000% 01/02/2048 USD 525 286 529 086 0.074 874 418 Freddie Mac Gold Pool 4.000% 01/07/2048 USD 4 959 490 5 029 788 0.681 661 460 Freddie Mac Gold Pool 4.000% 01/08/2048 USD 1 681 114 1 714 318 0.231 112 493 Freddie Mac Gold Pool 4.000% 01/09/2048 USD 1 128 574 1 147 654 0.16
995 863 Freddie Mac Gold Pool 4.000% 01/03/2049 USD 1 016 716 1 026 299 0.141 675 000 Freddie Mac Gold Pool 4.000% 01/03/2049 USD 1 724 203 1 725 891 0.235 317 766 Freddie Mac Gold Pool 4.500% 01/08/2039 USD 5 689 171 5 630 361 0.76
705 294 Freddie Mac Gold Pool 4.500% 01/02/2041 USD 738 980 746 879 0.10391 189 Freddie Mac Gold Pool 4.500% 01/05/2041 USD 417 288 414 207 0.06948 747 Freddie Mac Gold Pool 4.500% 01/05/2042 USD 1 012 199 1 004 626 0.14797 521 Freddie Mac Gold Pool 4.500% 01/07/2045 USD 841 265 842 934 0.11
3 959 950 Freddie Mac Gold Pool 4.500% 01/08/2045 USD 4 219 828 4 192 018 0.572 010 412 Freddie Mac Gold Pool 4.500% 01/04/2046 USD 2 166 461 2 142 572 0.298 756 897 Freddie Mac Gold Pool 4.500% 01/09/2046 USD 9 096 601 9 180 946 1.24
755 819 Freddie Mac Gold Pool 4.500% 01/09/2047 USD 804 853 791 965 0.113 615 488 Freddie Mac Gold Pool 4.500% 01/03/2048 USD 3 821 556 3 833 352 0.525 506 263 Freddie Mac Gold Pool 4.500% 01/05/2048 USD 5 718 240 5 770 052 0.78
364 571 Freddie Mac Gold Pool 4.500% 01/07/2048 USD 380 239 383 910 0.051 646 830 Freddie Mac Gold Pool 5.000% 01/12/2038 USD 1 789 825 1 774 654 0.244 144 012 Freddie Mac Gold Pool 5.000% 01/09/2039 USD 4 515 414 4 484 321 0.611 471 927 Freddie Mac Gold Pool 5.000% 01/03/2044 USD 1 588 101 1 589 376 0.22
956 812 Freddie Mac Gold Pool 5.000% 01/10/2048 USD 1 002 681 1 013 420 0.14883 842 Freddie Mac Gold Pool 5.500% 01/04/2038 USD 972 264 966 613 0.13362 207 Freddie Mac Gold Pool 5.500% 01/05/2038 USD 398 876 395 824 0.05
225Merrill Lynch Investment Solutions
Merrill Lynch Investment Solutions – Global Debt -Securitised UCITS FundSchedule of Investments as at March 31, 2019 (cont.)(expressed in USD)
The accompanying notes form an integral part of these financial statements.
Audited annual report

Nominalvalue Description
QuotationCurrency
CostUSD
Marketvalue USD
% of netassets
Transferable securities and money market instruments admitted to an official exchange listing or dealt in on another regulated market (cont.)
Asset Backed & Mortgage Backed Securities (cont.)2 000 000 Freddie Mac Multifamily Structured Pass Through Certificates
- A2 2.396% 25/06/2022USD 2 001 778 1 990 990 0.27
1 000 000 Freddie Mac Multifamily Structured Pass Through Certificates- A2 2.570% 25/07/2026
USD 952 668 985 145 0.13
2 060 000 Freddie Mac Multifamily Structured Pass Through Certificates- A2 2.789% 25/01/2022
USD 2 085 941 2 069 560 0.28
2 525 000 Freddie Mac Multifamily Structured Pass Through Certificates- A2 2.991% 25/09/2021
USD 2 567 236 2 544 294 0.34
2 000 000 Freddie Mac Multifamily Structured Pass Through Certificates- A2 3.136% 25/10/2024
USD 2 034 640 2 043 081 0.28
1 250 000 Freddie Mac Multifamily Structured Pass Through Certificates- A2 FRN 25/09/2027
USD 1 277 036 1 275 377 0.17
1 500 000 Freddie Mac Multifamily Structured Pass Through Certificates- A2 3.241% 25/09/2024
USD 1 509 325 1 542 803 0.21
500 000 Freddie Mac Multifamily Structured Pass Through Certificates- A2 3.244% 25/08/2027
USD 505 309 512 599 0.07
1 000 000 Freddie Mac Multifamily Structured Pass Through Certificates- A2 FRN 25/05/2025
USD 1 008 217 1 033 593 0.14
2 000 000 Freddie Mac Multifamily Structured Pass Through Certificates- A2 FRN 25/07/2023
USD 2 084 615 2 071 400 0.28
2 400 000 Freddie Mac Multifamily Structured Pass Through Certificates- A2 FRN 25/10/2020
USD 2 471 218 2 449 972 0.33
10 573 582 Ginnie Mae I Pool 5.000% 15/07/2046 USD 11 490 675 11 352 214 1.531 202 969 Ginnie Mae II Pool 3.000% 20/05/2045 USD 1 182 673 1 210 349 0.16
495 595 Ginnie Mae II Pool 3.000% 20/07/2045 USD 489 616 498 638 0.071 855 833 Ginnie Mae II Pool 3.000% 20/01/2046 USD 1 827 009 1 869 523 0.25
32 222 Ginnie Mae II Pool 3.000% 20/04/2046 USD 31 515 32 420 0.001 524 351 Ginnie Mae II Pool 3.000% 20/06/2046 USD 1 494 333 1 533 243 0.211 755 301 Ginnie Mae II Pool 3.000% 20/08/2046 USD 1 722 742 1 766 082 0.24
655 889 Ginnie Mae II Pool 3.000% 20/09/2046 USD 641 352 660 321 0.094 914 562 Ginnie Mae II Pool 3.000% 20/01/2047 USD 4 813 619 4 943 999 0.677 292 450 Ginnie Mae II Pool 3.000% 20/11/2047 USD 7 008 647 7 260 600 0.98
310 927 Ginnie Mae II Pool 3.000% 20/12/2047 USD 300 859 312 353 0.04532 473 Ginnie Mae II Pool 3.500% 20/04/2045 USD 530 346 544 956 0.07
19 807 Ginnie Mae II Pool 3.500% 20/12/2045 USD 19 584 20 272 0.004 448 890 Ginnie Mae II Pool 3.500% 20/04/2046 USD 4 428 554 4 553 285 0.621 540 028 Ginnie Mae II Pool 3.500% 20/06/2046 USD 1 548 049 1 576 171 0.21
86 989 Ginnie Mae II Pool 3.500% 20/10/2046 USD 85 594 89 030 0.01586 849 Ginnie Mae II Pool 3.500% 20/03/2047 USD 588 990 600 518 0.08
2 373 588 Ginnie Mae II Pool 3.500% 20/07/2047 USD 2 395 076 2 427 385 0.3337 457 587 Ginnie Mae II Pool 3.500% 20/12/2047 USD 38 784 529 38 288 307 5.18
4 620 607 Ginnie Mae II Pool 3.500% 20/01/2048 USD 4 758 241 4 722 759 0.642 462 466 Ginnie Mae II Pool 3.500% 20/02/2048 USD 2 484 508 2 516 780 0.344 207 007 Ginnie Mae II Pool 3.500% 20/05/2048 USD 4 233 416 4 299 632 0.58
18 410 561 Ginnie Mae II Pool 4.000% 20/03/2046 USD 19 145 041 19 099 331 2.581 300 191 Ginnie Mae II Pool 4.000% 20/07/2046 USD 1 352 908 1 347 218 0.183 306 285 Ginnie Mae II Pool 4.000% 20/12/2047 USD 3 335 276 3 414 533 0.463 358 132 Ginnie Mae II Pool 4.000% 20/01/2048 USD 3 509 775 3 468 585 0.47
226 Merrill Lynch Investment Solutions
Merrill Lynch Investment Solutions – Global Debt -Securitised UCITS FundSchedule of Investments as at March 31, 2019 (cont.)(expressed in USD)
The accompanying notes form an integral part of these financial statements.
Audited annual report

Nominalvalue Description
QuotationCurrency
CostUSD
Marketvalue USD
% of netassets
Transferable securities and money market instruments admitted to an official exchange listing or dealt in on another regulated market (cont.)
Asset Backed & Mortgage Backed Securities (cont.)1 832 991 Ginnie Mae II Pool 4.000% 20/03/2048 USD 1 884 568 1 893 280 0.265 922 364 Ginnie Mae II Pool 4.000% 20/04/2048 USD 6 081 267 6 117 157 0.83
728 964 Ginnie Mae II Pool 4.000% 20/08/2048 USD 746 594 752 941 0.10547 521 Ginnie Mae II Pool 4.000% 20/01/2049 USD 565 487 565 530 0.08249 473 Ginnie Mae II Pool 4.000% 20/02/2049 USD 256 200 257 678 0.04560 996 Ginnie Mae II Pool 4.500% 20/08/2047 USD 584 024 582 845 0.08
4 789 980 Ginnie Mae II Pool 4.500% 20/02/2048 USD 4 996 748 4 988 221 0.6720 361 313 Ginnie Mae II Pool 4.500% 20/06/2048 USD 21 151 484 21 156 174 2.86
2 295 068 Ginnie Mae II Pool 4.500% 20/07/2048 USD 2 384 376 2 384 454 0.32550 000 Ginnie Mae II Pool 4.500% 20/08/2048 USD 569 724 571 421 0.08
2 369 664 Ginnie Mae II Pool 4.500% 20/09/2048 USD 2 456 216 2 462 381 0.333 145 524 Ginnie Mae II Pool 4.500% 20/10/2048 USD 3 253 103 3 269 271 0.441 978 456 Ginnie Mae II Pool 4.500% 20/11/2048 USD 2 047 270 2 057 159 0.281 191 983 Ginnie Mae II Pool 4.500% 20/12/2048 USD 1 229 805 1 243 428 0.172 940 472 Ginnie Mae II Pool 4.500% 20/02/2049 USD 3 053 437 3 057 778 0.41
164 719 Ginnie Mae II Pool 5.000% 20/01/2048 USD 175 792 172 139 0.025 546 154 Ginnie Mae II Pool 5.000% 20/05/2048 USD 5 821 179 5 812 440 0.79
976 239 Ginnie Mae II Pool 5.000% 20/09/2048 USD 1 020 056 1 024 788 0.14543 363 Ginnie Mae II Pool 5.000% 20/11/2048 USD 566 659 569 314 0.08
1 000 000 GM Financial Automobile Leasing Trust 2017-3 - A3 2.010%20/11/2020
USD 993 496 996 843 0.14
2 000 000 JPMBB Commercial Mortgage Securities Trust 2014-C19 -A4 3.997% 15/04/2047
USD 2 116 386 2 096 169 0.28
2 000 000 Morgan Stanley Bank of America Merrill Lynch Trust2015-C27 - A4 3.753% 15/12/2047
USD 2 100 824 2 077 022 0.28
2 000 000 Morgan Stanley Bank of America Merrill Lynch Trust2016-C28 - A4 3.544% 15/01/2049
USD 2 066 801 2 048 744 0.28
1 275 000 Toyota Auto Receivables 2017-B Owner Trust - A4 2.050%15/09/2022
USD 1 272 982 1 262 736 0.17
500 000 Wells Fargo Commercial Mortgage Trust 2017-C39 -A5 3.418% 15/09/2050
USD 510 048 506 589 0.07
1 000 000 Wells Fargo Commercial Mortgage Trust 2018-C45 -A4 4.184% 15/06/2051
USD 1 023 682 1 067 192 0.14
2 000 000 WFRBS Commercial Mortgage Trust 2012-C10 - A3 2.875%15/12/2045
USD 2 014 292 1 993 599 0.27
1 300 000 WFRBS Commercial Mortgage Trust 2013-C18 - A5 FRN15/12/2046
USD 1 390 724 1 369 559 0.19
Total Asset Backed & Mortgage Backed Securities 593 996 652 594 809 098 80.39
Total Investments 735 810 826 730 098 181 98.67
227Merrill Lynch Investment Solutions
Merrill Lynch Investment Solutions – Global Debt -Securitised UCITS FundSchedule of Investments as at March 31, 2019 (cont.)(expressed in USD)
The accompanying notes form an integral part of these financial statements.
Audited annual report

Industrial classification of investments(as a percentage of net assets as at March 31, 2019) %
FNMA Collateral 35.30GNMA2 Collateral 22.44FGLMC Collateral 14.75Banks 14.11Commercial MBS 4.99Diversified Financial Services 3.20GNMA Collateral 1.53Credit Card ABS 0.87Automobile ABS 0.51Sovereign 0.41Savings & Loans 0.16Commercial Services 0.09Insurance 0.08Real Estate 0.08Beverages 0.04Telecommunications 0.04REITS 0.03Retail 0.02Transportation 0.02
98.67
Geographical classification of investments(as a percentage of net assets as at March 31, 2019) %
United States 80.39France 2.95Sweden 2.49Germany 1.98Spain 1.68United Kingdom 1.36Switzerland 1.30Canada 0.93Norway 0.90Netherlands 0.87Italy 0.81Finland 0.65Australia 0.60Austria 0.46Denmark 0.42Belgium 0.38Ireland 0.17Portugal 0.09New Zealand 0.08Poland 0.08Luxembourg 0.06Singapore 0.02
98.67
Nominalvalue Description
QuotationCurrency
CostUSD
Marketvalue USD
% of netassets
To Be Announced271 000 Fannie Mae Pool 3.500% 10/04/2049 USD 271 291 274 673 0.04985 400 Fannie Mae Pool 4.000% 10/04/2049 USD 1 005 262 1 013 584 0.14
(215 000) Fannie Mae Pool 4.500% 10/04/2049 USD (222 458) (224 007) (0.03)1 000 000 Fannie Mae Pool 5.000% 10/04/2049 USD 1 049 297 1 057 203 0.14
11 496 000 Freddie Mac Gold Pool 3.500% 10/04/2049 USD 11 522 376 11 660 613 1.5812 175 000 Freddie Mac Gold Pool 4.000% 10/04/2049 USD 12 431 735 12 532 403 1.69
1 443 000 Freddie Mac Gold Pool 4.500% 10/04/2049 USD 1 494 971 1 505 918 0.202 000 000 Freddie Mac Gold Pool 5.000% 10/04/2049 USD 2 098 750 2 117 812 0.29
719 000 Ginnie Mae II Pool 3.500% 17/04/2049 USD 728 886 734 546 0.103 325 000 Ginnie Mae II Pool 4.000% 17/04/2049 USD 3 419 035 3 432 998 0.46
29 000 Ginnie Mae II Pool 4.500% 17/04/2049 USD 30 029 30 120 0.00
Total To Be Announced 34 135 863 4.61
228 Merrill Lynch Investment Solutions
Merrill Lynch Investment Solutions – Global Debt -Securitised UCITS FundSchedule of Investments as at March 31, 2019 (cont.)(expressed in USD)
The accompanying notes form an integral part of these financial statements.
Audited annual report

Underlyingnature
Currencycontract Details Market
Maturitydate
Number ofcontracts
bought
Number ofcontracts
soldCommitment
USD
Unrealisedappreciation/
(depreciation)USD
Futures contracts
Interest rate USD10 Year US TreasuryNote Chicago Board of Trade 19/06/2019 187 – 23 228 906 393 610
Interest rate USD 5 Year US Treasury Note Chicago Board of Trade 28/06/2019 226 – 26 177 156 283 862
Total Futures contracts 49 406 062 677 472
Currencybought Amount bought Currency sold Amount sold
Maturitydate Counterparty
Unrealisedappreciation/
(depreciation)USD
Forward foreign exchange contracts
CAD 500 000 USD 374 289 02/04/2019Barclays Bank Plc.
Wholesale (14)
DKK 14 160 000 USD 2 130 749 02/04/2019Goldman Sachs
International (994)
EUR 17 760 000 USD 19 940 928 02/04/2019Barclays Bank Plc.
Wholesale 886EUR 17 760 000 USD 19 942 704 02/04/2019 Deutsche Bank AG (890)
EUR 17 760 000 USD 19 942 704 02/04/2019Goldman Sachs
International (890)EUR 17 760 000 USD 19 945 190 02/04/2019 HSBC Bank Plc. (3 377)EUR 17 770 000 USD 19 946 470 02/04/2019 Société Générale 6 573NOK 5 470 000 USD 636 032 02/04/2019 Deutsche Bank AG (842)
SEK 107 340 000 USD 11 592 268 02/04/2019Goldman Sachs
International (19 597)
USD 379 961 CAD 500 000 02/04/2019Morgan Stanley & Co.
International Plc. 5 685USD 9 983 505 CHF 9 890 000 02/04/2019 Natwest Markets Plc. 52 790USD 2 171 879 DKK 14 160 000 02/04/2019 State Street Bank London 42 124
USD 19 734 918 EUR 17 250 000 02/04/2019Barclays Bank Plc.
Wholesale 365 758USD 292 591 EUR 260 000 02/04/2019 Deutsche Bank AG 650
USD 19 583 072 EUR 17 120 000 02/04/2019Goldman Sachs
International 359 882USD 20 312 960 EUR 17 750 000 02/04/2019 HSBC Bank Plc. 382 374
USD 2 185 155 EUR 1 940 000 02/04/2019Morgan Stanley & Co.
International Plc. 6 827USD 19 877 057 EUR 17 370 000 02/04/2019 Natwest Markets Plc. 373 155USD 19 588 670 EUR 17 120 000 02/04/2019 State Street Bank London 365 480USD 5 898 496 GBP 4 430 000 02/04/2019 BNP Paribas S.A. 125 983USD 643 309 NOK 5 470 000 02/04/2019 BNP Paribas S.A. 8 119
USD 11 731 478 SEK 107 340 000 02/04/2019Goldman Sachs
International 158 807
EUR 240 980 822 USD 274 950 791 03/04/2019State Street Bank and Trust
Co. (4 342 449)
GBP 17 532 448 USD 23 343 180 03/04/2019State Street Bank and Trust
Co. (496 342)
USD 270 654 435 EUR 240 980 821 03/04/2019State Street Bank and Trust
Co. 46 094
229Merrill Lynch Investment Solutions
Merrill Lynch Investment Solutions – Global Debt -Securitised UCITS FundSchedule of Investments as at March 31, 2019 (cont.)(expressed in USD)
The accompanying notes form an integral part of these financial statements.
Audited annual report

Currencybought Amount bought Currency sold Amount sold
Maturitydate Counterparty
Unrealisedappreciation/
(depreciation)USD
Forward foreign exchange contracts (cont.)
USD 22 849 010 GBP 17 532 447 03/04/2019State Street Bank and Trust
Co. 2 172
EUR 240 140 878 USD 270 359 909 03/05/2019State Street Bank and Trust
Co. (13 220)
GBP 17 489 783 USD 22 825 695 03/05/2019State Street Bank and Trust
Co. (64)
USD 374 578 CAD 500 000 03/05/2019Barclays Bank Plc.
Wholesale 12USD 9 970 226 CHF 9 890 000 03/05/2019 State Street Bank London 10 286
USD 2 136 742 DKK 14 160 000 03/05/2019Goldman Sachs
International 994
USD 21 096 575 EUR 18 740 000 03/05/2019Barclays Bank Plc.
Wholesale (612)USD 19 994 688 EUR 17 760 000 03/05/2019 Deutsche Bank AG 769
USD 19 994 759 EUR 17 760 000 03/05/2019Goldman Sachs
International 840USD 19 997 174 EUR 17 760 000 03/05/2019 HSBC Bank Plc. 3 255USD 19 998 891 EUR 17 770 000 03/05/2019 Société Générale (6 285)
USD 5 324 201 EUR 4 728 860 03/05/2019State Street Bank and Trust
Co. 527
USD 726 618 GBP 556 016 03/05/2019State Street Bank and Trust
Co. 972USD 5 796 164 GBP 4 430 000 03/05/2019 State Street Bank London 14 643USD 636 809 NOK 5 470 000 03/05/2019 Deutsche Bank AG 848
USD 2 220 652 SEK 20 550 000 03/05/2019Barclays Bank Plc.
Wholesale (47)
USD 11 619 072 SEK 107 340 000 03/05/2019Goldman Sachs
International 19 571
Total forward foreign exchange contracts (2 529 547)
The maximum individual counterparty exposure for OTC Derivatives including CFD as at March 31, 2019 is 0.07% of the NAV.
230 Merrill Lynch Investment Solutions
Merrill Lynch Investment Solutions – Global Debt -Securitised UCITS FundSchedule of Investments as at March 31, 2019 (cont.)(expressed in USD)
The accompanying notes form an integral part of these financial statements.
Audited annual report

Note 1 – Activity
Merrill Lynch Investment Solutions (the “SICAV”) has been incorporated on November 5, 2007 under Luxembourg laws as a “Sociétéd’Investissement à Capital Variable” (SICAV) for an unlimited period of time. The SICAV is governed by the provisions of Part I and itfulfils the provisions of Article 27 of the Luxembourg Law of December 17, 2010 “as amended” relating to Undertakings forCollective Investment, as may be amended from time to time.
The Articles of Incorporation created on November 5, 2007 and amended on December 22, 2011 are deposited with the Register ofCommerce and Companies of Luxembourg and have been published in the Mémorial C, “Recueil des Sociétés et Associations” (the“Mémorial”) on November 30, 2007 and February 21, 2012 respectively. The SICAV is registered with the Register of Commerce andCompanies of Luxembourg under the number B 133.445.
As at March 31, 2019, sixteen Sub-Funds are available to investors:
Sub-Funds Launch Date
Merrill Lynch Investment Solutions – Marshall Wace TOPS UCITS Fund (Market Neutral) November 23, 2007
Merrill Lynch Investment Solutions – York Event-Driven UCITS Fund July 29, 2009
Merrill Lynch Investment Solutions – York Asian Event-Driven UCITS Fund November 3, 2010
Merrill Lynch Investment Solutions – AQR Global Relative Value UCITS Fund December 1, 2010
Merrill Lynch Investment Solutions – Merrill Lynch WNT Diversified Futures UCITS Fund (in liquidation) October 23, 2013
Merrill Lynch Investment Solutions – Merrill Lynch Enhanced Equity Volatility Premium Fund November 27, 2013
Merrill Lynch Investment Solutions – Merrill Lynch MLCX Commodity Enhanced Beta Fund May 7, 2014
Merrill Lynch Investment Solutions – Merrill Lynch MLCX Commodity Alpha Fund February 19, 2016
Merrill Lynch Investment Solutions – Zeal Greater China Long Short UCITS Fund August 29, 2014
Merrill Lynch Investment Solutions – Ramius Merger Arbitrage UCITS Fund July 8, 2016
Merrill Lynch Investment Solutions – Merrill Lynch Enhanced Cross-Asset Volatility Premium Fund September 16, 2016
Merrill Lynch Investment Solutions – KLS Fixed Income UCITS Fund December 12, 2016
Merrill Lynch Investment Solutions – Millburn Diversified UCITS Fund March 8, 2017
Merrill Lynch Investment Solutions – Global Debt - Credit UCITS Fund November 24, 2017
Merrill Lynch Investment Solutions – Global Debt - Government UCITS Fund November 24, 2017
Merrill Lynch Investment Solutions – Global Debt - Securitised UCITS Fund November 24, 2017
During the year ended, the following Sub-Fund was liquidated:
Sub-Funds Liquidation Date
Merrill Lynch Investment Solutions – Merrill Lynch MLCX Commodity Enhanced Beta ex Agriculture Fund June 14, 2018
Note 2 – Principal accounting policies
2.1 Presentation of financial statements
The financial statements are prepared in accordance with Luxembourg regulations relating to Undertakings for CollectiveInvestment. Portfolios were valued as at March 29, 2019.
2.2 Valuation of investment in securities
2.2.1 Securities or money market instruments quoted or traded on an official stock exchange or any other regulated market, arevalued on the basis of the last known price, and if the securities or money market instruments are listed on several stock exchangesor regulated markets, the last known price of the stock exchange which is the principal market for security or money market inquestion, unless these prices are not representative.
2.2.2 For securities or money market instruments not quoted or traded on an official stock exchange or any other regulated market,and for quoted securities or money market instruments, but for which the last known price is not representative, valuation is basedon the probable sales price estimated prudently and in good faith by the Board of Directors of the SICAV.
231Merrill Lynch Investment Solutions
Notes to the financial statementsas at March 31, 2019
Audited annual report
Note 2 – Principal accounting policies (cont.)
2.2 Valuation of investment in securities (cont.)
2.2.3 Liquid assets and money market instruments with a maturity of less than 12 months may be valued at nominal value plus anyaccrued interest or using an amortised cost method.
2.2.4 Investments in other open-ended UCIs are valued on the basis of the respective last available net asset value of such UCIs ateach Valuation Day.
2.2.5 Units or shares of a closed-ended UCI are valued in accordance with the valuation rules set out in items 2.2.1 and 2.2.2.
2.2.6 Any of the above mentioned assets for which the valuation in accordance with the above paragraphs is not possible,practicable or representative of their fair value are valued at fair market value, as determined in good faith by the Board of Directorsof the SICAV.
2.3 Valuation of swaps
2.3.1 Credit default swap
A credit default swap is a credit derivative transaction in which two parties enter into an agreement, whereby one party (theprotection buyer) pays the other (the protection seller) a fixed periodic coupon for the specified life of the agreement in return fora payment contingent on a credit event related to the underlying reference obligation.
If a credit event occurs, the protection seller would be obligated to make a payment, which may be either: (i) a net cash settlementequal to the notional amount of the swap less the auction value of the reference obligation or (ii) the notional amount of the swapin exchange for the delivery of the reference obligation. Selling protection effectively adds leverage to a sub-fund’s portfolio up tothe notional amount of swap agreements.
The notional amount represents the maximum potential liability under a contract and is not reflected in the statement of net assets.Potential liabilities under these contracts may be reduced by: the auction rates of the underlying reference obligations; upfrontpayments received at the inception of a swap; and net amounts received from credit default swaps purchased with the identicalreference obligation.
Credit default swaps are marked to market at each NAV calculation date. The market value is based on the valuation elements laiddown in the contracts, and is obtained from third party pricing agents, market makers or internal models.
The unrealised appreciation/(depreciation) is disclosed in the statement of net assets under “Unrealised appreciation/(depreciation)on swap contracts”. Realised gains/(losses) and change in unrealised appreciation/depreciation resulting there from are included inthe statement of operations and changes in net assets respectively under the heading “Net realised gains/(losses) on swapcontracts” and “Change in net unrealized appreciation/depreciation on swap contracts”.
The related interest income or expense is disclosed net of withholding tax in the statement of operations and changes in net assets.
2.3.2 Total return swap
A total return swap is a bilateral agreement in which each party agrees to exchange payments based on the performance of anunderlying instrument represented by a security, basket or index thereof for a fixed or variable rate. One party pays out the totalreturn of a specific reference asset, and in return, receives a regular stream of payments. The total performance will include gainsand losses on the underlying, as well as any interest or dividends during the contract period according to the type of underlying. Thecash flows to be exchanged are calculated by reference to an agreed upon notional amount or quantity. To the extent the total returnof the reference asset underlying the transaction exceeds or falls short of the offsetting payment, the Fund will receive a paymentfrom or make a payment to the counterparty.
Total return swaps are marked to market at each NAV calculation date. The estimated market value is based on the valuationelements laid down in the contracts, and is obtained from third party pricing agents, market makers or internal models.
232 Merrill Lynch Investment Solutions
Notes to the financial statementsas at March 31, 2019 (cont.)
Audited annual report

Note 2 – Principal accounting policies (cont.)
2.3 Valuation of swaps (cont.)
2.3.2 Total return swap (cont.)
The unrealised appreciation/(depreciation) is disclosed in the statement of net assets under “Unrealised appreciation/(depreciation)on swap contracts”. Realised gains/(losses) and changes in unrealised appreciation/depreciation as a result thereof are included inthe statement of operations and changes in net assets respectively under “Net realised gain/(loss) on swap contracts” and “Netchange in unrealised appreciation/depreciation on swaps contracts.”
The related interest income or expense is disclosed net of withholding tax in the statement of operations and changes in net assets.
2.3.3 Interest rate swap
An interest rate swap is a forward contract in which one stream of future interest payments is exchanged for another based on aspecified principal amount. Interest rate swaps usually involve the exchange of a fixed interest rate for a floating rate, or vice versa,to reduce or increase exposure to fluctuations in interest rates or to obtain a marginally lower interest rate than would have beenpossible without the swap.
Interest rate swaps are marked to market at each NAV calculation date. The estimated market value is based on the valuationelements laid down in the contracts, and is obtained from third party pricing agents, market makers or internal models.
The unrealised appreciation/(depreciation) is disclosed in the statement of net assets under “Unrealised appreciation/(depreciation)on swap contracts”. Realised gains/(losses) and changes in unrealised appreciation/depreciation as a result thereof are included inthe statement of operations and changes in net assets respectively under “Net realised gain/(loss) on swap contracts” and “Netchange in unrealised appreciation/depreciation on swaps contracts.”
The related interest income or expense is disclosed net of withholding tax in the statement of operations and changes in net assets.
2.4 Valuation of contracts for difference
Contracts for differences are contracts entered into between a broker and the sub-fund under which the parties agree to makepayments to each other so as to replicate the economic consequences of holding a long or short position in the underlying security.Contracts for differences also mirror any corporate actions that take place.
Contracts for differences are valued based on the closing market price of the underlying security, less any financing chargesattributable to each contract. Upon entering into contracts for differences, the sub- fund may be required to pledge to the broker anamount of cash and/or other assets equal to a certain percentage of the contract amount (“initial margin”). Subsequently, paymentsknown as “variation margin” are made or received by the sub-fund periodically, depending on fluctuations in the value of theunderlying security.
The unrealised appreciation/(depreciation) is disclosed in the statement of net assets under “Contracts for difference at marketvalue”. Realised gains/(losses) and changes in unrealised appreciation/depreciation as a result thereof are included in the statementof operations and changes in net assets respectively under “Net realised gain/(loss) on contracts for differences” and “Change in netunrealised appreciation/(depreciation) on contracts for difference”.
2.5 Valuation of futures contracts
Futures contracts provide for the delayed delivery of the underlying instrument at a fixed price or for a cash amount based on thechange in the value of the underlying instrument at a specific date in the future. Upon entering into a futures contract, the sub-fundis required to deposit with the broker, cash or securities in an amount equal to a certain percentage of the contract amount which isreferred to as the initial margin account. Subsequent payments, referred to as variation margin, are made or received by thesub-fund periodically and are based on changes in the market Value of open futures contracts.
The unrealised appreciation/(depreciation) on futures contracts is disclosed in the statement of net assets under “Unrealisedappreciation/(depreciation) on futures contracts”. Changes in the market value of open futures contracts are recorded as unrealisedappreciation/depreciation in the statement of operations and changes in net assets under “Change in net unrealised appreciation/depreciation on futures contracts”.
233Merrill Lynch Investment Solutions
Notes to the financial statementsas at March 31, 2019 (cont.)
Audited annual report

Note 2 – Principal accounting policies (cont.)
2.5 Valuation of futures contracts (cont.)
Realised gains or losses, representing the difference between the value of the contract at the time it was opened and the value atthe time it was closed, are reported at the closing or expiration of futures contracts in the statement of operations and changes innet assets under “Net realized gain/(loss) on futures contracts”. Securities deposited as initial margin are designated in thestatement of investments and cash deposited is recorded in the statement of net assets. A receivable and/or a payable to brokersfor the daily variation margin is also recorded in the statement of net assets.
2.6 Valuation of options contracts
A purchaser of a put option has the right, but not the obligation, to sell the underlying instrument at an agreed upon price (“strikeprice”) to the option seller. A purchaser of a call option has the right, but not the obligation, to purchase the underlying instrument atthe strike price from the option seller. Purchased Options — Premiums paid by the sub—fund for purchased options are included inthe statement of net assets as an investment. The option is adjusted daily to reflect the current market value of the option and thechange is recorded as unrealised appreciation or depreciation. If the option is allowed to expire, the Fund will lose the entire premiumit paid and record a realised loss for the premium amount. Premiums paid for purchased options which are exercised or closed areadded to the amounts paid or offset against the proceeds on the underlying investment transaction to determine the realisedgain/loss or cost basis of the security.
Written Options — Premiums received by the sub-fund for written options are included in the statement of net assets. The amountof the liability is adjusted daily to reflect the current market value of the written option and the change in market value is recordedas unrealised appreciation or depreciation. Premiums received from written options that expire are treated as realised gains. Thesub-fund records a realised gain or loss on written options based on whether the cost of the closing transaction exceeds thepremium received. If a call option is exercised by the option buyer, the premium received by the sub-fund is added to the proceedsfrom the sale of the underlying security to the option buyer and compared to the cost of the closing transaction to determinewhether there has been a realised gain or loss. If a put option is exercised by an option buyer, the premium received by the optionseller reduces the cost basis of the purchased security.
Written uncovered call options expose the sub-fund to unlimited risk of loss. Written covered call options limit the upside potentialof a security above the strike price. Written put options expose the Fund to risk of loss if the value of the security declines below theexercise price minus the put premium. The sub-fund is not subject to credit risk on written options as the counterparty has alreadyperformed its obligation by paying the premium at the inception of the contract.
Outstanding options traded on a regulated market are valued based on the closing price or the last available market price of theinstruments. OTC options are marked to market based upon prices obtained from third party pricing agents and verified against thevalue from the counterparty. The market value of options is included in the statement of net assets under the heading “Optionsbought/(written) at market value”.
The realised gains/(losses) and change in unrealised appreciation/depreciation on options are disclosed in the statement ofoperations and changes in net assets respectively under the headings “Net realised gains/(losses) on options” and “Change in netunrealised appreciation/depreciation on options.”
2.7 Valuation of forward foreign exchange contracts
Forward foreign exchange contracts represent obligations to purchase or sell foreign currency on a specified future date at a pricefixed at the time the contracts are entered into. Non-deliverable forward foreign exchange contracts are settled with thecounterparty in cash without the delivery of foreign currency. The values of the forward foreign exchange contracts are adjusteddaily based on the applicable exchange rate of the underlying currency. Changes in the value of these contracts are recorded asunrealised appreciation or depreciation until the contract settlement date. When the forward contract is closed, the sub-fund recordsa realised gain or loss equal to the difference between the value at the time the contract was opened and the value at the time it wasclosed.
234 Merrill Lynch Investment Solutions
Notes to the financial statementsas at March 31, 2019 (cont.)
Audited annual report
Note 2 – Principal accounting policies (cont.)
2.7 Valuation of forward foreign exchange contracts (cont.)
The unrealised appreciation/(depreciation) on forward foreign exchange contracts is disclosed in the statement of net assets under“Unrealised appreciation/(depreciation) on forward foreign exchange contracts”. Realised gains/(losses) and change in unrealisedappreciation/depreciation resulting there from are included in the statement of operations and changes in net assets respectivelyunder “Net realised gains/(losses) on forward foreign exchange contracts” and “Change in net unrealised appreciation/depreciationon forward foreign exchange contracts”.
2.8 Valuation of repurchase agreements and reverse repurchase agreements
Each Sub-Fund may enter into Repurchase Transactions which consist in the purchase or sale of securities with a clause reservingthe seller the right or the obligation to repurchase from the acquirer the securities sold at a price and term specified by the twoparties in their contractual arrangement and reverse repurchase transactions, which consist of a forward transaction at the maturityof which the seller (counterparty) has the obligation to repurchase the securities sold and the Sub-Fund the obligation to return thesecurities received under the transaction (collectively, the “repo transactions”).
The Company shall disclose the total amount of the open repo transactions on the date of reference of its annual and semi-annualreports.
Market value of repurchase agreements is disclosed in the statement of net assets under “Repurchase agreements at market value”.Market value of reverse repurchase agreements is disclosed under “Reverse repurchase agreements at market value”. Cost of bothrepurchase agreements and reverse repurchase agreements is disclosed in the statement of net assets under “Investments insecurities at cost”.
2.9 Valuation of To Be Announced
To Be Announced securities (TBAs) are related to mortgage backed securities issued by US government sponsored agencies. Theseagencies usually pool mortgage loans and sell interests in the pools created. TBAs relate to future pools of these agencies that arebought and sold for future settlement for which either the interest rate or the maturity date is not yet fixed. TBAs are separatelydisclosed in the Portfolio of Investments.
Although the Funds will generally enter into TBA purchase commitments with the intention of acquiring securities, the Funds mayalso dispose of a commitment prior to settlement if it is deemed appropriate to do so. Proceeds of TBA sales are not received untilthe contractual settlement date. During the time a TBA sale commitment is outstanding, equivalent deliverable securities, or anoffsetting TBA purchase commitment (deliverable on or before the sale commitment date), are held as cover for the transaction.
If the TBA sale commitment is closed through the acquisition of an offsetting purchase commitment, the Fund realises a gain or losson the commitment without regard to any unrealised gain or loss on the underlying security. If the Fund delivers securities under thecommitment, the Fund realises a gain or loss from the sale of the securities upon the unit price established at the date thecommitment was entered into.
The Funds had unsettled TBAs as of March 31, 2019 which are included within receivable for investments sold and payable forinvestments purchased in the Statement of Net Assets.
The market values of the TBAs are presented in the Statement of Net Assets. The net change in unrealized appreciation ordepreciation and the realised appreciation or depreciation on sales of the TBAs are presented in the Statement of Operations andChanges in Net Assets.
2.10 Net realised gains or losses resulting from investments
The realised gains or losses resulting from the sales of investments are calculated on an average cost basis.
2.11 Foreign exchange translation
The accounts of each Sub-Fund are maintained in the reference currency of the Sub-Fund and the financial statements areexpressed in EUR currency.
235Merrill Lynch Investment Solutions
Notes to the financial statementsas at March 31, 2019 (cont.)
Audited annual report

Note 2 – Principal accounting policies (cont.)
2.11 Foreign exchange translation (cont.)
The acquisition cost of securities expressed in a currency other than the reference currency is translated into the reference currencyat the exchange rates prevailing on the date of purchase.
Income and expenses expressed in other currencies than the reference currency are converted at exchange rates ruling at thetransaction date.
Assets and liabilities expressed in other currencies than the reference currency are converted at exchange rates ruling at theyear-end. The realised gains and losses or unrealised appreciation and depreciations on foreign exchange translation are recognizedin the Statement of Operations and Changes in Net Assets in determining the increase or decrease in net assets.
The following exchange rates (against EUR) as at 5 p.m. Central European Time have been used to convert the investments andother assets and liabilities denominated in currencies other than EUR for all Sub-Funds denominated in EUR:
Currency March 29, 2019
AUD 1.580699
CAD 1.500071
CHF 1.118246
CNH 7.546281
GBP 0.861708
HKD 8.814315
JPY 124.282639
KRW 1274.546902
MXN 21.780481
MYR 4.584035
NOK 9.669534
NZD 1.646408
SEK 10.414770
SGD 1.520900
THB 35.633641
TWD 34.606795
USD 1.122850
The following exchange rates (against USD) as at 5 p.m. Central European Time have been used to convert the investments andother assets and liabilities denominated in currencies other than USD for all Sub-Funds denominated in USD except for Merrill LynchInvestment Solutions – KLS Fixed Income UCITS Fund and Merrill Lynch Investment Solutions – Millburn Diversified UCITS Fund:
Currency March 29, 2019
AUD 1.407757
BRL 3.891700
CAD 1.335950
CHF 0.995900
CLP 680.475000
COP 3185.480000
CNH 6.720650
CNY 6.720200
CZK 23.004850
DKK 6.648650
EUR 0.890591
236 Merrill Lynch Investment Solutions
Notes to the financial statementsas at March 31, 2019 (cont.)
Audited annual report

Note 2 – Principal accounting policies (cont.)
2.11 Foreign exchange translation (cont.)
Currency March 29, 2019
GBP 0.767430
HKD 7.849950
HUF 286.440800
IDR 14240.000000
ILS 3.629350
INR 69.275000
JPY 110.685000
KRW 1135.100000
MXN 19.397500
MYR 4.082500
NOK 8.611600
NZD 1.466276
PHP 52.510000
PLN 3.833850
RUB 65.697500
SEK 9.275300
SGD 1.354500
THB 31.735000
TRY 5.649600
TWD 30.820500
ZAR 14.421250
The following exchange rates (against USD) as at 9 p.m. Central European Time have been used to convert the investments andother assets and liabilities denominated in currencies other than USD for Merrill Lynch Investment Solutions – KLS Fixed IncomeUCITS Fund and Merrill Lynch Investment Solutions – Millburn Diversified UCITS Fund:
Currency March 29, 2019
AUD 1.408748
ARS 43.381000
BRL 3.909350
CAD 1.335250
CHF 0.995950
CLP 680.665000
CNH 6.722250
CNY 6.720200
COP 3188.030000
CZK 23.017250
EUR 0.891623
GBP 0.768817
HKD 7.849950
HUF 286.558800
IDR 14240.000000
ILS 3.632250
INR 69.275000
237Merrill Lynch Investment Solutions
Notes to the financial statementsas at March 31, 2019 (cont.)
Audited annual report

Note 2 – Principal accounting policies (cont.)
2.11 Foreign exchange translation (cont.)
Currency March 29, 2019
JPY 110.825000
KRW 1135.100000
MXN 19.418500
MYR 4.082500
NOK 8.620650
NZD 1.468860
PEN 3.317350
PHP 52.510000
PLN 3.839550
RON 4.255900
RUB 65.697500
SEK 9.294250
SGD 1.355200
THB 31.735000
TRY 5.595300
TWD 30.820500
ZAR 14.441250
The following exchange rate (against EUR) as at 5 p.m. has been used to calculate the combined total in the Statement of Net Assetsand in the Statement of Operations and Changes in Net Assets for all Sub-Funds denominated in USD except for the Merrill LynchInvestment Solutions – KLS Fixed Income UCITS Fund and Merrill Lynch Investment Solutions – Millburn Diversified UCITS Fund.
Currency March 29, 2019
USD 1.122849883
The following exchange rate (against EUR) as at 9 p.m. has been used to calculate the combined total in the Statement of Net Assetsand in the Statement of Operations and Changes in Net Assets for the Merrill Lynch Investment Solutions – KLS Fixed IncomeUCITS Fund and Merrill Lynch Investment Solutions – Millburn Diversified UCITS Fund:
Currency March 29, 2019
USD 1.121550252
2.12 Income
Dividend income and dividend expense are recorded on the ex-dividend date and interest income and interest expense are accruedover the life of the investment. Interest income includes accretion of market discount, original issue discounts and amortisation ofpremiums and is recorded into income over the life of the underlying investment. Interest income and dividend income arerecognised on a gross basis before withholding tax, if any. Interest income is accrued on a daily basis.
2.13 Formation expenses
Formation expenses and those of the launch of new Sub-Funds are born by CM Investment Solutions Limited.
Note 3 – Investment management, distributor and performance fees
The investment management fees which are payable to the Investment Manager in connection with the services to be provided bythem, and distribution fees which are payable to the Investment Manager or CM Investment Solutions Limited pursuant to therelevant agreements between each of them, are payable monthly in arrears and calculated on each banking day (as defined in theProspectus) on the net assets of each Share Class and at the combined annual rates mentioned below.
238 Merrill Lynch Investment Solutions
Notes to the financial statementsas at March 31, 2019 (cont.)
Audited annual report
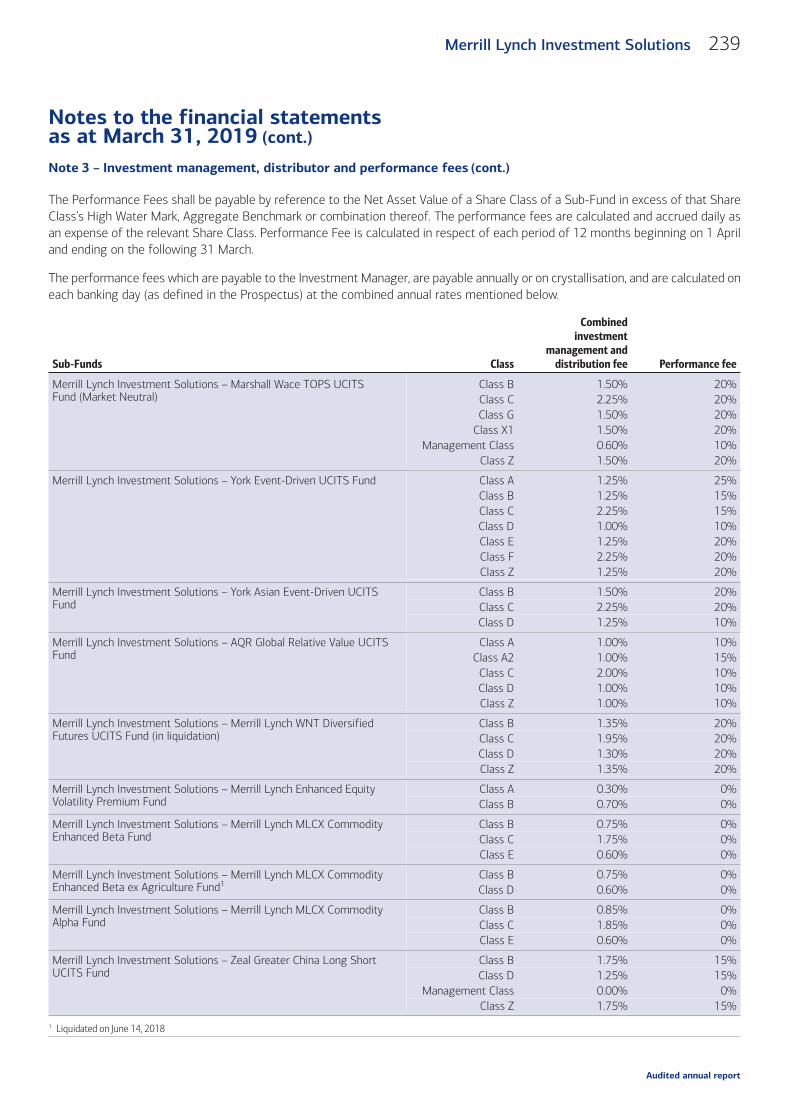
Note 3 – Investment management, distributor and performance fees (cont.)
The Performance Fees shall be payable by reference to the Net Asset Value of a Share Class of a Sub-Fund in excess of that ShareClass’s High Water Mark, Aggregate Benchmark or combination thereof. The performance fees are calculated and accrued daily asan expense of the relevant Share Class. Performance Fee is calculated in respect of each period of 12 months beginning on 1 Apriland ending on the following 31 March.
The performance fees which are payable to the Investment Manager, are payable annually or on crystallisation, and are calculated oneach banking day (as defined in the Prospectus) at the combined annual rates mentioned below.
Sub-Funds Class
Combinedinvestment
management anddistribution fee Performance fee
Merrill Lynch Investment Solutions – Marshall Wace TOPS UCITSFund (Market Neutral)
Class B 1.50% 20%Class C 2.25% 20%Class G 1.50% 20%
Class X1 1.50% 20%Management Class 0.60% 10%
Class Z 1.50% 20%
Merrill Lynch Investment Solutions – York Event-Driven UCITS Fund Class A 1.25% 25%Class B 1.25% 15%Class C 2.25% 15%Class D 1.00% 10%Class E 1.25% 20%Class F 2.25% 20%Class Z 1.25% 20%
Merrill Lynch Investment Solutions – York Asian Event-Driven UCITSFund
Class B 1.50% 20%Class C 2.25% 20%Class D 1.25% 10%
Merrill Lynch Investment Solutions – AQR Global Relative Value UCITSFund
Class A 1.00% 10%Class A2 1.00% 15%Class C 2.00% 10%Class D 1.00% 10%Class Z 1.00% 10%
Merrill Lynch Investment Solutions – Merrill Lynch WNT DiversifiedFutures UCITS Fund (in liquidation)
Class B 1.35% 20%Class C 1.95% 20%Class D 1.30% 20%Class Z 1.35% 20%
Merrill Lynch Investment Solutions – Merrill Lynch Enhanced EquityVolatility Premium Fund
Class A 0.30% 0%Class B 0.70% 0%
Merrill Lynch Investment Solutions – Merrill Lynch MLCX CommodityEnhanced Beta Fund
Class B 0.75% 0%Class C 1.75% 0%Class E 0.60% 0%
Merrill Lynch Investment Solutions – Merrill Lynch MLCX CommodityEnhanced Beta ex Agriculture Fund1
Class B 0.75% 0%Class D 0.60% 0%
Merrill Lynch Investment Solutions – Merrill Lynch MLCX CommodityAlpha Fund
Class B 0.85% 0%Class C 1.85% 0%Class E 0.60% 0%
Merrill Lynch Investment Solutions – Zeal Greater China Long ShortUCITS Fund
Class B 1.75% 15%Class D 1.25% 15%
Management Class 0.00% 0%Class Z 1.75% 15%
1 Liquidated on June 14, 2018
239Merrill Lynch Investment Solutions
Notes to the financial statementsas at March 31, 2019 (cont.)
Audited annual report

Note 3 – Investment management, distributor and performance fees (cont.)
Sub-Funds Class
Combinedinvestment
management anddistribution fee Performance fee
Merrill Lynch Investment Solutions – Ramius Merger Arbitrage UCITSFund
Class B 1.25% 20%Class C 2.00% 20%Class D 1.00% 10%
Management Class 0.00% 0%Class X 1.25% 20%
Merrill Lynch Investment Solutions – Merrill Lynch EnhancedCross-Asset Volatility Premium Fund
Class A 0.50% 0%Class B 1.00% 0%
Merrill Lynch Investment Solutions – KLS Fixed Income UCITS Fund Class B 1.25% 15%Class C 2.00% 15%Class D 0.95% 10%
Management Class 0.00% 0%Class X2 1.25% 15%
Merrill Lynch Investment Solutions – Millburn Diversified UCITS Fund Class B 1.50% 20%Class C 2.25% 20%Class D 1.00% 15%
Management Class 0.00% 0%Class X2 1.50% 20%Class X3 1.50% 20%Class X4 1.50% 20%Class Y1 2.25% 20%
Class Z 1.50% 20%Class X5 1.50% 20%
Merrill Lynch Investment Solutions – Global Debt - Credit UCITS Fund Class B 0.42% 0%
Merrill Lynch Investment Solutions – Global Debt - Government UCITSFund
Class B 0.32% 0%
Merrill Lynch Investment Solutions – Global Debt - Securitised UCITSFund
Class B 0.38% 0%
Note 4 – Operating and administrative fees
In respect of each Sub-Fund, the SICAV shall pay to CM Investment Solutions Limited an operating and administrative fee equal toa certain percentage of the Net Asset Value of the relevant Share Class calculated in the same manner as for the calculation of theinvestment management fee. The operating and administrative fee shall be calculated and accrued as an expense of the relevantShare Class and shall be payable monthly in arrears.
Sub-Funds ClassAdministrative and
Operating Fees
Merrill Lynch Investment Solutions – Marshall Wace TOPS UCITS Fund (Market Neutral) Class B 0.30% p.a.Class C Up to 0.40% p.a.Class G 0.30% p.a.
Class X1 0.30% p.a.Management Class 0.30% p.a.
Class Z Up to 0.40% p.a.
Merrill Lynch Investment Solutions – York Event-Driven UCITS Fund Class A Up to 0.40% p.a.Class B Up to 0.40% p.a.Class C Up to 0.40% p.a.Class D Up to 0.40% p.a.Class E Up to 0.40% p.a.Class F Up to 0.40% p.a.Class Z Up to 0.40% p.a.
240 Merrill Lynch Investment Solutions
Notes to the financial statementsas at March 31, 2019 (cont.)
Audited annual report

Note 4 – Operating and administrative fees (cont.)
Sub-Funds ClassAdministrative and
Operating Fees
Merrill Lynch Investment Solutions – York Asian Event-Driven UCITS Fund Class B Up to 0.40% p.a.Class C Up to 0.40% p.a.Class D Up to 0.40% p.a.
Merrill Lynch Investment Solutions – AQR Global Relative Value UCITS Fund Class A 0.15% p.a.Class A2 0.15% p.a.Class C1 0.15% p.a.Class D 0.15% p.a.Class Z 0.15% p.a.
Merrill Lynch Investment Solutions – Merrill Lynch WNT Diversified Futures UCITS Fund (inliquidation)
Class B Up to 0.40% p.a.Class C Up to 0.40% p.a.Class D Up to 0.40% p.a.Class Z Up to 0.40% p.a.
Merrill Lynch Investment Solutions – Merrill Lynch Enhanced Equity Volatility PremiumFund
Class A 0.30% p.a.Class B 0.30% p.a.
Merrill Lynch Investment Solutions – Merrill Lynch MLCX Commodity Enhanced Beta Fund Class B 0.15% p.a.Class C 0.15% p.a.Class E 0.15% p.a.
Merrill Lynch Investment Solutions – Merrill Lynch MLCX Commodity Enhanced Beta exAgriculture Fund
Class B 0.15% p.a.Class D 0.15% p.a.
Merrill Lynch Investment Solutions – Merrill Lynch MLCX Commodity Alpha Fund Class B 0.15% p.a.Class C 0.15% p.a.Class E 0.15% p.a.
Merrill Lynch Investment Solutions – Zeal Greater China Long Short UCITS Fund Class B Up to 0.40% p.aClass D Up to 0.40% p.a
Management Class Up to 0.40% p.aClass Z Up to 0.40% p.a
Merrill Lynch Investment Solutions – Ramius Merger Arbitrage UCITS Fund Class B Up to 0.40% p.a.Class C Up to 0.40% p.a.Class D Up to 0.40% p.a.
Management Class Up to 0.40% p.a.Class X Up to 0.40% p.a.
Merrill Lynch Investment Solutions – Merrill Lynch Enhanced Cross-Asset VolatilityPremium Fund
Class A 0.10% p.a.Class B 0.10% p.a.
Merrill Lynch Investment Solutions – KLS Fixed Income UCITS Fund Class B Up to 0.40% p.a.Class C Up to 0.40% p.a.Class D Up to 0.40% p.a.
Management Class Up to 0.40% p.a.Class X2 Up to 0.40% p.a.
Merrill Lynch Investment Solutions – Millburn Diversified UCITS Fund Class B Up to 0.40% p.a.Class C Up to 0.40% p.a.Class D Up to 0.40% p.a.
Management Class Up to 0.40% p.a.Class X2 Up to 0.40% p.a.Class X3 Up to 0.40% p.a.Class X4 Up to 0.40% p.a.Class Y1 Up to 0.40% p.a.
Class Z Up to 0.40% p.a.Class X5 Up to 0.40% p.a.
Merrill Lynch Investment Solutions – Global Debt - Credit UCITS Fund Class B Up to 0.42% p.a.
Merrill Lynch Investment Solutions – Global Debt - Government UCITS Fund Class B Up to 0.32% p.a.
241Merrill Lynch Investment Solutions
Notes to the financial statementsas at March 31, 2019 (cont.)
Audited annual report

Note 4 – Operating and administrative fees (cont.)
Sub-Funds ClassAdministrative and
Operating Fees
Merrill Lynch Investment Solutions – Global Debt - Securitised UCITS Fund Class B Up to 0.38% p.a.
Note 5 – Custodian, Administrator, Registrar Agent fees
Each of the Custodian, the Administrator and the Registrar Agent are entitled to receive from CM Investment Solutions Limited feespursuant to the relevant agreements between each of them and the SICAV in accordance with usual market practice. In addition,reasonable disbursements and out-of-pocket expenses incurred by such parties are charged to CM Investment Solutions Limited asappropriate.
Note 6 – Transaction Costs
For the year from April 01, 2018 to March 31, 2019 the SICAV incurred transaction costs related to purchase or sale of securities,fixed income and trading of financial instruments such as Options and Futures as follows:
Merrill Lynch Investment Solutions – Marshall Wace TOPS UCITS Fund (Market Neutral) USD (4 106 168)
Merrill Lynch Investment Solutions – York Event-Driven UCITS Fund EUR (132 490)
Merrill Lynch Investment Solutions – York Asian Event-Driven UCITS Fund EUR (1 320 058)
Merrill Lynch Investment Solutions – AQR Global Relative Value UCITS Fund USD (615 543)
Merrill Lynch Investment Solutions – Merrill Lynch WNT Diversified Futures UCITS Fund (in liquidation) USD (24 161)
Merrill Lynch Investment Solutions – Merrill Lynch Enhanced Equity Volatility Premium Fund EUR (17 756)
Merrill Lynch Investment Solutions – Merrill Lynch MLCX Commodity Enhanced Beta Fund USD (3 213)
Merrill Lynch Investment Solutions – Merrill Lynch MLCX Commodity Enhanced Beta ex Agriculture Fund USD (432)
Merrill Lynch Investment Solutions – Merrill Lynch MLCX Commodity Alpha Fund USD (6 205)
Merrill Lynch Investment Solutions – Zeal Greater China Long Short UCITS Fund USD (477 080)
Merrill Lynch Investment Solutions – Ramius Merger Arbitrage UCITS Fund USD (486 117)
Merrill Lynch Investment Solutions – Merrill Lynch Enhanced Cross-Asset Volatility Premium Fund EUR (19 721)
Merrill Lynch Investment Solutions – Millburn Diversified UCITS Fund USD (464 196)
Merrill Lynch Investment Solutions – Global Debt - Credit UCITS Fund USD (28 848)
Merrill Lynch Investment Solutions – Global Debt - Government UCITS Fund USD (6 481)
Merrill Lynch Investment Solutions – Global Debt - Securitised UCITS Fund USD (5 332)
The fees charged by external brokers for OTC derivatives transactions are not included in the above table and are recorded under thecaption “interest and bank charges and transaction costs” in the Statement of Operations and Changes in Net Assets.
Note 7 – Taxation
The SICAV’s assets are subject to subscription tax (“Taxe d’abonnement”) in the Grand Duchy of Luxembourg of 0.05% of the netassets p.a. (except Sub-Funds or Classes of Shares reserved to Institutional Investors that can benefit from the reduced tax rate of0.01% of the net assets p.a. as stipulated in the Prospectus) payable quarterly. The SICAV’s income is not taxable in Luxembourg. Notax will be deducted at source from any dividends paid by the SICAV. Income received from the SICAV may be subject to withholdingtaxes in the country of origin of the issuer of the security, in respect of which such income is paid.
No duty or tax is payable in Luxembourg in connection with the issue of Shares of the SICAV, except for one lump sum capital levyof EUR 75 which is payable at incorporation.
Investment income from dividends and interest received by the SICAV may be subject to withholding taxes at varying rates. Suchwithholding taxes are usually not recoverable.
242 Merrill Lynch Investment Solutions
Notes to the financial statementsas at March 31, 2019 (cont.)
Audited annual report

Note 8 – Cash collateral information
The table below provides the cash collateral balances due from / due to the brokers in relations to the Futures contracts, Swaps,Forward foreign exchange contracts, OTC Options contracts and Contracts for difference held as at March 31, 2019. The cashcollateral balances are included in the Statement of Net Assets respectively under “Due from Broker” and “Due to Broker”.
Sub-Funds
Due from /(due to)brokers Counterparty Currency
Cash collateralbalances
Merrill Lynch Investment Solutions –Marshall Wace TOPS UCITS Fund (MarketNeutral)
Due to Barclays Bank Plc. USD (17 200 002)
Due from BNP Paribas USD 325 983 245
Due to Credit Suisse International USD (10 420 235)
Due from Credit Suisse Securities (Europe) Limited USD 20 236
Due to Credit Suisse Securities (Europe) Limited USD (100 001)
Due to Deutsche Bank AG USD (3 462 244)
Due from Deutsche Bank AG London USD 7 462 250
Due from Goldman Sachs International USD 16 100 000
Due to JPMorgan Chase Bank NA USD (1 200 088)
Due from Merrill Lynch International Bank Ltd. USD 25 500 001
Due from Morgan Stanley Capital Services, Inc. USD 1 800 001
Due from Morgan Stanley & Co. International Plc. USD 16 800 009
Due to Morgan Stanley & Co. International Plc. USD (2)
Due to Société Générale USD (3 000 000)
Due from State Street Bank and Trust Co. USD 33 000 000
Due from Sumitomo Bank Ltd. USD 305 333 071
Due from UBS AG USD 13 771 464
Due to UBS AG USD (59 347)
Merrill Lynch Investment Solutions – YorkEvent-Driven UCITS Fund
Due from Bank of America EUR 188 281
Due from Barclays Bank Plc. EUR 586 891
Due from Citibank NA EUR 702 449
Due from Credit Suisse Securities (Europe) Limited EUR 223 612
Due from Goldman Sachs International EUR 464 359
Due from JPMorgan Chase Bank NA EUR 303 802
Due from Merrill Lynch International Bank Ltd. EUR 566 978
Due to Merrill Lynch International Bank Ltd. EUR (2)
Due from Morgan Stanley & Co. LLC EUR 2 610 809
Due to Morgan Stanley & Co. LLC EUR (79 731)
Due from Morgan Stanley Capital Services, Inc. EUR 2 947 717
Due to Morgan Stanley Capital Services, Inc. EUR (641 188)
Due from State Street Bank and Trust Co. EUR 267 177
Due from UBS AG EUR 276 083
243Merrill Lynch Investment Solutions
Notes to the financial statementsas at March 31, 2019 (cont.)
Audited annual report

Note 8 – Cash collateral information (cont.)
Sub-Funds
Due from /(due to)brokers Counterparty Currency
Cash collateralbalances
Merrill Lynch Investment Solutions – YorkAsian Event-Driven UCITS Fund
Due from Bank of America EUR 5 451 258
Due from Citibank NA EUR 6 526 562
Due from Credit Suisse Securities (Europe) Limited EUR 653 507
Due from Goldman Sachs International EUR 2 502 545
Due from JPMorgan Chase Bank NA EUR 3 990 468
Due from Merrill Lynch International Bank Ltd. EUR 335 631
Due from Morgan Stanley & Co. LLC EUR 2 531 949
Due from Morgan Stanley & Co. International Plc. EUR 7 517 305
Due from State Street Bank and Trust Co. EUR 872 779
Due from UBS AG EUR 3 071 754
Merrill Lynch Investment Solutions – AQRGlobal Relative Value UCITS Fund
Due from Bank of America USD 361 430
Due from Citibank NA USD 15 973 044
Due to Deutsche Bank AG USD (18 141 776)
Due from Goldman Sachs International USD 86 439 999
Due from JPMorgan Chase Bank NA USD 1 565 797
Due from Merrill Lynch International Bank Ltd. USD 75 027 046
Due to Merrill Lynch International Bank Ltd. USD (6 105 126)
Due from Morgan Stanley & Co. International Plc. USD 2 741 870
Merrill Lynch Investment Solutions – MerrillLynch WNT Diversified Futures UCITS Fund(in liquidation)
Due from Merrill Lynch International Bank Ltd. USD 408 709
Due to Merrill Lynch International Bank Ltd. USD (147 642)
Due from Morgan Stanley Capital Services, Inc. USD 270 000
Due to Morgan Stanley Capital Services, Inc. USD (70 000)
Merrill Lynch Investment Solutions – MerrillLynch Enhanced Equity Volatility PremiumFund
Due from Merrill Lynch International Bank Ltd. EUR 725 000
Merrill Lynch Investment Solutions – MerrillLynch MLCX Commodity Enhanced BetaFund
Due to Merrill Lynch International Bank Ltd. USD (430 000)
Due from State Street Bank and Trust Co. USD 280 000
Merrill Lynch Investment Solutions – MerrillLynch MLCX Commodity Alpha Fund
Due from Merrill Lynch International Bank Ltd. USD 720 000
Due from State Street Bank and Trust Co. USD 600 000
Merrill Lynch Investment Solutions – ZealGreater China Long Short UCITS Fund
Due from Merrill Lynch International Bank Ltd. USD 467 483
Due to Merrill Lynch International Bank Ltd. USD (607 253)
Due from Morgan Stanley Capital Services, Inc. USD 5 533 067
Due to Morgan Stanley & Co. International Plc. USD (1 182 798)
Due from Royal Bank of Scotland Plc. USD 1 070 642
Merrill Lynch Investment Solutions –Ramius Merger Arbitrage UCITS Fund
Due to Merrill Lynch International Bank Ltd. USD (39)
Due from Morgan Stanley & Co. LLC USD 3 984 074
Due to Morgan Stanley & Co. LLC USD (35 674)
Due to Morgan Stanley Capital Services, Inc. USD (651 632)
Due from State Street Bank and Trust Co. USD 3 082 429
Merrill Lynch Investment Solutions – MerrillLynch Enhanced Cross-Asset VolatilityPremium Fund
Due from Merrill Lynch International Bank Ltd. EUR 1 780 000
244 Merrill Lynch Investment Solutions
Notes to the financial statementsas at March 31, 2019 (cont.)
Audited annual report

Note 8 – Cash collateral information (cont.)
Sub-Funds
Due from /(due to)brokers Counterparty Currency
Cash collateralbalances
Merrill Lynch Investment Solutions – KLSFixed Income UCITS Fund
Due from Barclays Bank Plc. USD 18 400 000
Due from Merrill Lynch International Bank Ltd. USD 18 928 225
Due to Merrill Lynch International Bank Ltd. USD (2 087 432)
Due to State Street Bank and Trust Co. USD (3 930 000)
Merrill Lynch Investment Solutions –Millburn Diversified UCITS Fund
Due from Deutsche Bank AG USD 34 201 793
Due to Deutsche Bank AG USD (308 879)
Due from Merrill Lynch International Bank Ltd. USD 13 670 844
Due to Merrill Lynch International Bank Ltd. USD (146 710)
Due from State Street Bank and Trust Co. USD 2 060 000
Merrill Lynch Investment Solutions – GlobalDebt - Credit UCITS Fund
Due from Merrill Lynch International Bank Ltd. USD 755 836
Due to Merrill Lynch International Bank Ltd. USD (423 515)
Merrill Lynch Investment Solutions – GlobalDebt - Government UCITS Fund
Due to HSBC Bank Plc. USD (30 000)
Due from Morgan Stanley & Co. International Plc. USD 80 000
Due from State Street Bank and Trust Co. USD 70 000
Merrill Lynch Investment Solutions – GlobalDebt - Securitised UCITS Fund
Due from Merrill Lynch International Bank Ltd. USD 375 000
Due to Merrill Lynch International Bank Ltd. USD (781 269)
245Merrill Lynch Investment Solutions
Notes to the financial statementsas at March 31, 2019 (cont.)
Audited annual report
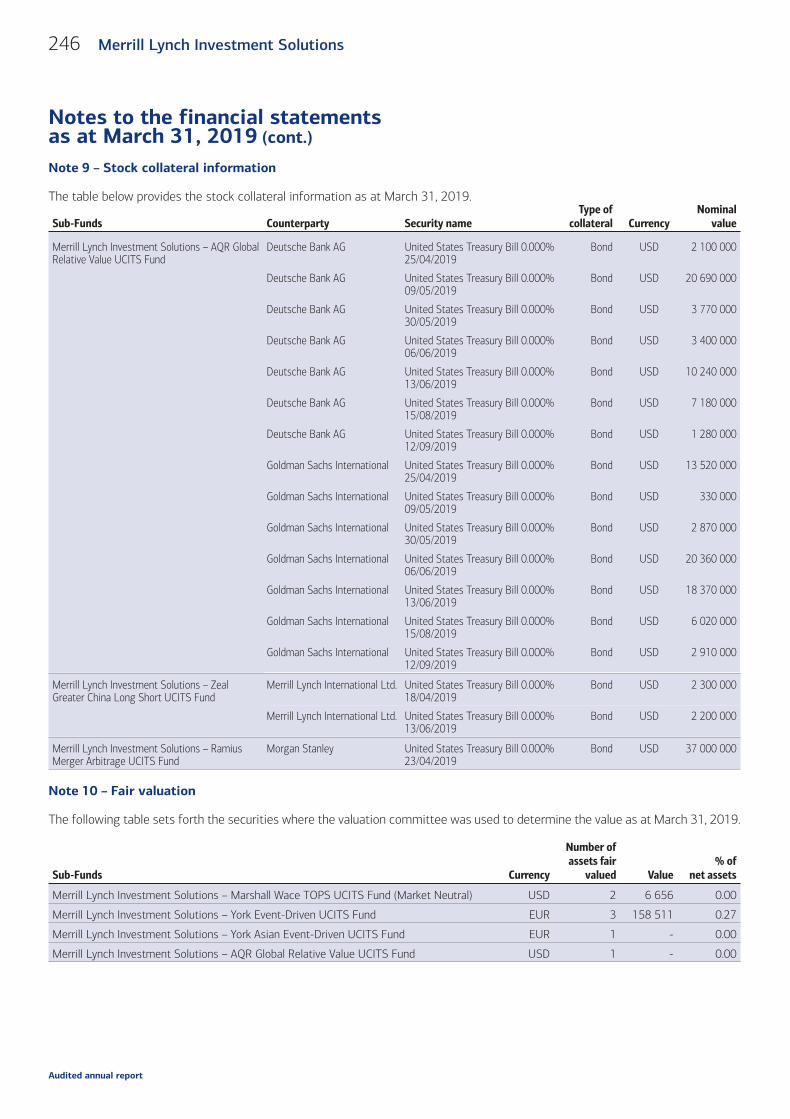
Note 9 – Stock collateral information
The table below provides the stock collateral information as at March 31, 2019.
Sub-Funds Counterparty Security nameType of
collateral CurrencyNominal
value
Merrill Lynch Investment Solutions – AQR GlobalRelative Value UCITS Fund
Deutsche Bank AG United States Treasury Bill 0.000%25/04/2019
Bond USD 2 100 000
Deutsche Bank AG United States Treasury Bill 0.000%09/05/2019
Bond USD 20 690 000
Deutsche Bank AG United States Treasury Bill 0.000%30/05/2019
Bond USD 3 770 000
Deutsche Bank AG United States Treasury Bill 0.000%06/06/2019
Bond USD 3 400 000
Deutsche Bank AG United States Treasury Bill 0.000%13/06/2019
Bond USD 10 240 000
Deutsche Bank AG United States Treasury Bill 0.000%15/08/2019
Bond USD 7 180 000
Deutsche Bank AG United States Treasury Bill 0.000%12/09/2019
Bond USD 1 280 000
Goldman Sachs International United States Treasury Bill 0.000%25/04/2019
Bond USD 13 520 000
Goldman Sachs International United States Treasury Bill 0.000%09/05/2019
Bond USD 330 000
Goldman Sachs International United States Treasury Bill 0.000%30/05/2019
Bond USD 2 870 000
Goldman Sachs International United States Treasury Bill 0.000%06/06/2019
Bond USD 20 360 000
Goldman Sachs International United States Treasury Bill 0.000%13/06/2019
Bond USD 18 370 000
Goldman Sachs International United States Treasury Bill 0.000%15/08/2019
Bond USD 6 020 000
Goldman Sachs International United States Treasury Bill 0.000%12/09/2019
Bond USD 2 910 000
Merrill Lynch Investment Solutions – ZealGreater China Long Short UCITS Fund
Merrill Lynch International Ltd. United States Treasury Bill 0.000%18/04/2019
Bond USD 2 300 000
Merrill Lynch International Ltd. United States Treasury Bill 0.000%13/06/2019
Bond USD 2 200 000
Merrill Lynch Investment Solutions – RamiusMerger Arbitrage UCITS Fund
Morgan Stanley United States Treasury Bill 0.000%23/04/2019
Bond USD 37 000 000
Note 10 – Fair valuation
The following table sets forth the securities where the valuation committee was used to determine the value as at March 31, 2019.
Sub-Funds Currency
Number ofassets fair
valued Value% of
net assets
Merrill Lynch Investment Solutions – Marshall Wace TOPS UCITS Fund (Market Neutral) USD 2 6 656 0.00
Merrill Lynch Investment Solutions – York Event-Driven UCITS Fund EUR 3 158 511 0.27
Merrill Lynch Investment Solutions – York Asian Event-Driven UCITS Fund EUR 1 - 0.00
Merrill Lynch Investment Solutions – AQR Global Relative Value UCITS Fund USD 1 - 0.00
246 Merrill Lynch Investment Solutions
Notes to the financial statementsas at March 31, 2019 (cont.)
Audited annual report
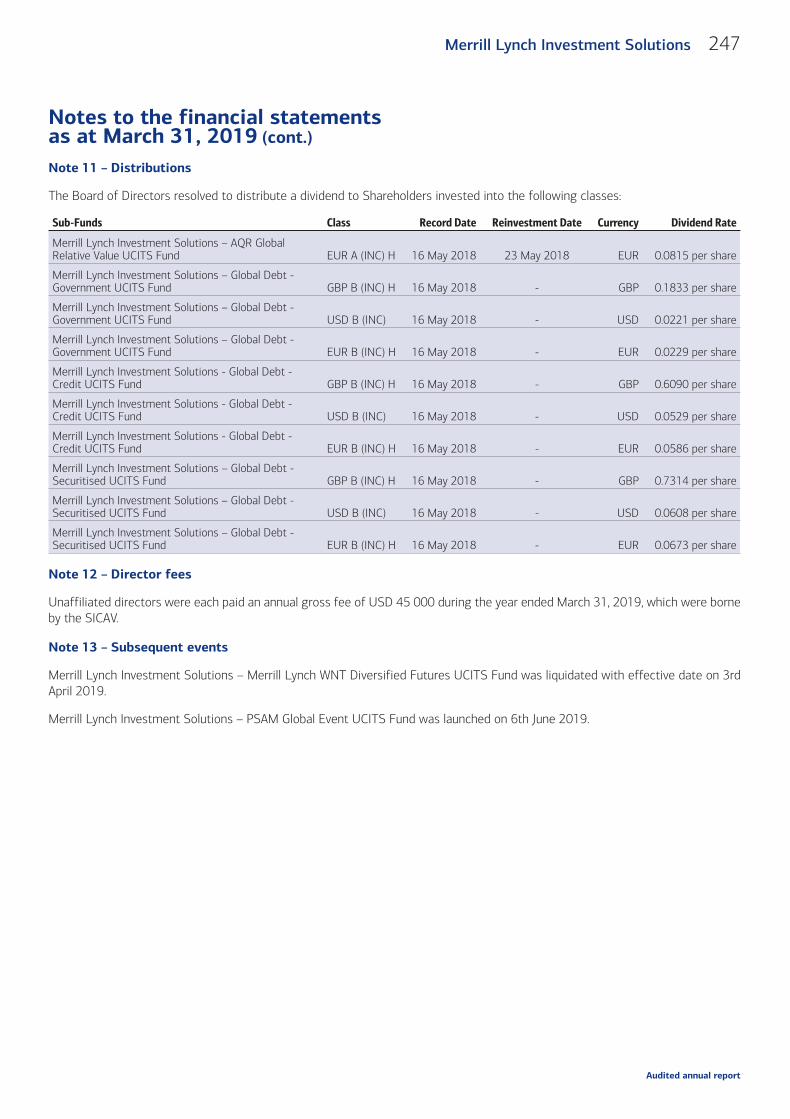
Note 11 – Distributions
The Board of Directors resolved to distribute a dividend to Shareholders invested into the following classes:
Sub-Funds Class Record Date Reinvestment Date Currency Dividend Rate
Merrill Lynch Investment Solutions – AQR GlobalRelative Value UCITS Fund EUR A (INC) H 16 May 2018 23 May 2018 EUR 0.0815 per share
Merrill Lynch Investment Solutions – Global Debt -Government UCITS Fund GBP B (INC) H 16 May 2018 - GBP 0.1833 per share
Merrill Lynch Investment Solutions – Global Debt -Government UCITS Fund USD B (INC) 16 May 2018 - USD 0.0221 per share
Merrill Lynch Investment Solutions – Global Debt -Government UCITS Fund EUR B (INC) H 16 May 2018 - EUR 0.0229 per share
Merrill Lynch Investment Solutions - Global Debt -Credit UCITS Fund GBP B (INC) H 16 May 2018 - GBP 0.6090 per share
Merrill Lynch Investment Solutions - Global Debt -Credit UCITS Fund USD B (INC) 16 May 2018 - USD 0.0529 per share
Merrill Lynch Investment Solutions - Global Debt -Credit UCITS Fund EUR B (INC) H 16 May 2018 - EUR 0.0586 per share
Merrill Lynch Investment Solutions – Global Debt -Securitised UCITS Fund GBP B (INC) H 16 May 2018 - GBP 0.7314 per share
Merrill Lynch Investment Solutions – Global Debt -Securitised UCITS Fund USD B (INC) 16 May 2018 - USD 0.0608 per share
Merrill Lynch Investment Solutions – Global Debt -Securitised UCITS Fund EUR B (INC) H 16 May 2018 - EUR 0.0673 per share
Note 12 – Director fees
Unaffiliated directors were each paid an annual gross fee of USD 45 000 during the year ended March 31, 2019, which were borneby the SICAV.
Note 13 – Subsequent events
Merrill Lynch Investment Solutions – Merrill Lynch WNT Diversified Futures UCITS Fund was liquidated with effective date on 3rdApril 2019.
Merrill Lynch Investment Solutions – PSAM Global Event UCITS Fund was launched on 6th June 2019.
247Merrill Lynch Investment Solutions
Notes to the financial statementsas at March 31, 2019 (cont.)
Audited annual report

The reference portfolio used by each Sub-Fund is set out in the table below.
In terms of risk management, the Board of Directors choose the commitment approach for the Sub-Fund Merrill Lynch InvestmentSolutions – Merrill Lynch MLCX Commodity Enhanced Beta Fund, Merrill Lynch Investment Solutions – Global Debt - Credit UCITSFund, Merrill Lynch Investment Solutions – Global Debt - Government UCITS Fund, Merrill Lynch Investment Solutions – Global Debt- Securitised UCITS Fund and the absolute VaR approach in order to determine the global risk for:
Sub-FundsHighest
VaRLowest
VaRAverage
VaRVaR
MethodologyConfidence
LevelDays
HorizonHistorical
Observations Period
Merrill Lynch Investment Solutions – MarshallWace TOPS UCITS Fund (Market Neutral) 4.13% 2.08% 2.64%
Monte CarloSimulation 99% 20 days 1 year
April 1, 2018 toMarch 31, 2019
Merrill Lynch Investment Solutions – YorkEvent-Driven UCITS Fund 5.90% 1.80% 3.34%
Monte CarloSimulation 99% 20 days 1 year
April 1, 2018 toMarch 31, 2019
Merrill Lynch Investment Solutions – YorkAsian Event-Driven UCITS Fund 7.43% 3.50% 4.66%
Monte CarloSimulation 99% 20 days 1 year
April 1, 2018 toMarch 31, 2019
Merrill Lynch Investment Solutions – AQRGlobal Relative Value UCITS Fund 5.77% 2.91% 4.08%
Monte CarloSimulation 99% 20 days 1 year
April 1, 2018 toMarch 31, 2019
Merrill Lynch Investment Solutions – MerrillLynch WNT Diversified Futures UCITS Fund(in liquidation) 4.82% 0.13% 2.84%
Monte CarloSimulation 99% 20 days 1 year
April 1, 2018 toMarch 31, 2019
Merrill Lynch Investment Solutions – MerrillLynch Enhanced Equity Volatility PremiumFund 11.19% 0.70% 4.03%
Monte CarloSimulation 99% 20 days 1 year
April 1, 2018 toMarch 31, 2019
Merrill Lynch Investment Solutions – MerrillLynch MLCX Commodity Alpha Fund 14.88% 3.15% 5.85%
EWMA VaRwith 11-day
half-life 99% 20 days 2 yearsApril 1, 2018 toMarch 31, 2019
Merrill Lynch Investment Solutions – ZealGreater China Long Short UCITS Fund 12.88% 2.76% 6.60%
Monte CarloSimulation 99% 20 days 1 year
April 1, 2018 toMarch 31, 2019
Merrill Lynch Investment Solutions – RamiusMerger Arbitrage UCITS Fund 9.50% 1.74% 4.80%
Monte CarloSimulation 99% 20 days 1 year
April 1, 2018 toMarch 31, 2019
Merrill Lynch Investment Solutions – MerrillLynch Enhanced Cross-Asset VolatilityPremium Fund 18.18% 8.89% 12.37%
EWMA VaRwith 11-day
half-life 99% 20 days 2 yearsApril 1, 2018 toMarch 31, 2019
Merrill Lynch Investment Solutions – KLSFixed Income UCITS Fund 7.67% 1.62% 3.31%
Monte CarloSimulation 99% 20 days 1 year
April 1, 2018 toMarch 31, 2019
Merrill Lynch Investment Solutions – MillburnDiversified UCITS Fund 14.20% 2.03% 6.08%
Monte CarloSimulation 99% 20 days 1 year
April 1, 2018 toMarch 31, 2019
The lowest, highest and average utilisation of the VaR limit during the year from April 1, 2018 to March 31, 2019 is calculated on adaily basis.
The level of leverage for the year ended March 31, 2019 is calculated by the sum of notionals approach.
The lowest, highest and average sum of the notionals of each Sub-Fund during the year from April 1, 2018 to March 31, 2019 iscalculated on a daily basis.
Sub-FundsMinimum
leverageMaximum
leverageAverageleverage
Merrill Lynch Investment Solutions – Marshall Wace TOPS UCITS Fund (Market Neutral) 218.88% 268.13% 254.20%
Merrill Lynch Investment Solutions – York Event-Driven UCITS Fund 158.39% 338.97% 204.50%
Merrill Lynch Investment Solutions – York Asian Event-Driven UCITS Fund 218.70% 326.28% 252.85%
Merrill Lynch Investment Solutions – AQR Global Relative Value UCITS Fund 1 172.68% 2 001.20% 1 557.94%
Merrill Lynch Investment Solutions – Merrill Lynch WNT Diversified Futures UCITS Fund (inliquidation) 0.37% 2 414.84% 1 748.08%
Merrill Lynch Investment Solutions – Merrill Lynch Enhanced Equity Volatility Premium Fund 386.71% 641.93% 549.59%
Merrill Lynch Investment Solutions – Merrill Lynch MLCX Commodity Alpha Fund 948.42% 1 281.55% 1 001.85%
Merrill Lynch Investment Solutions – Zeal Greater China Long Short UCITS Fund 13.86% 76.67% 40.17%
248 Merrill Lynch Investment Solutions
Global Risk Management (Unaudited Information)
Audited annual report
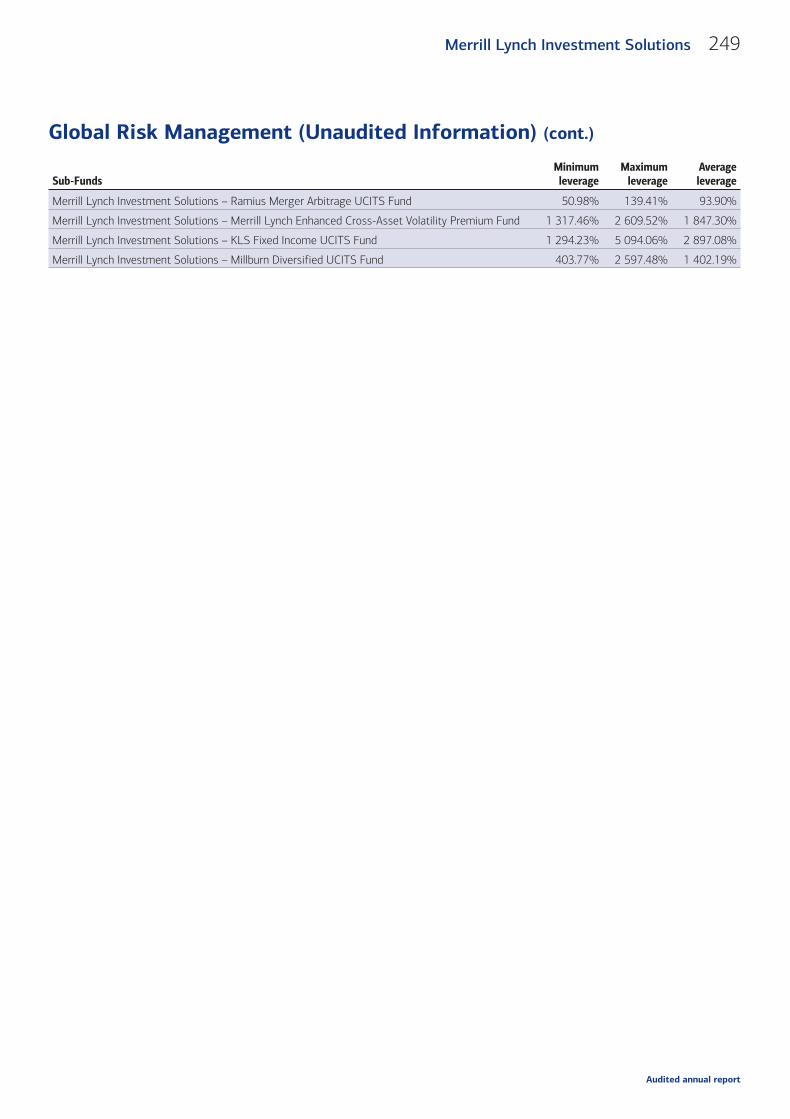
Sub-FundsMinimum
leverageMaximum
leverageAverageleverage
Merrill Lynch Investment Solutions – Ramius Merger Arbitrage UCITS Fund 50.98% 139.41% 93.90%
Merrill Lynch Investment Solutions – Merrill Lynch Enhanced Cross-Asset Volatility Premium Fund 1 317.46% 2 609.52% 1 847.30%
Merrill Lynch Investment Solutions – KLS Fixed Income UCITS Fund 1 294.23% 5 094.06% 2 897.08%
Merrill Lynch Investment Solutions – Millburn Diversified UCITS Fund 403.77% 2 597.48% 1 402.19%
249Merrill Lynch Investment Solutions
Global Risk Management (Unaudited Information) (cont.)
Audited annual report

Marcard, Stein & Co AG, Ballindamm 36, D-20095 Hamburg, has undertaken the function of Paying and Information Agent for theFederal Republic of Germany (the “German Paying and Information Agent”).
Applications for the redemption and conversion of shares may be sent to the German Paying and Information Agent.
All payments to investors, including redemption proceeds and potential distributions, may, upon request, be paid through the GermanPaying and Information Agent.
The prospectus, the key investor information documents, the articles of incorporation and the annual and semi-annual reports maybe obtained, free of charge, in hardcopy form at the office of the German Paying and Information Agent during normal openinghours.
The statement of changes in the composition of the investment portfolio is also available free of charge upon request at the officeof the German Paying and Information Agent.
Issue, redemption and conversion prices of shares and any other information to the shareholders are also available, free of charge,from the German Paying and Information Agent.
Fiscal information on taxable income to the shareholders are also available, free of charge, from the German Paying and InformationAgent.
The issue, redemption and conversion prices of shares and the notices to the shareholders will be published on the following websitewww.funds-invest.baml.com/.
250 Merrill Lynch Investment Solutions
Additional Information for Investors in the Federal Republic ofGermany
Audited annual report

SUPPLEMENTARY INFORMATION TO THE YEARLY REPORT
All OTC derivative transactions are entered into by the Funds under an International Swaps and Derivatives Associations, Inc. MasterAgreement (“ISDA Master Agreement”) or similar agreement. An ISDA Master Agreement is an agreement between the Funds anda counterparty that governs OTC derivative transactions including Total Return Swaps (“TRS”) entered into by the parties. Theparties’ exposures under the ISDA Master agreement are netted and collateralised together, therefore any collateral disclosuresprovided in this report are in respect of TRS transactions including CFDs and, if applicable, OTC derivative transactions conductedwith the same counterparties entered into by the Funds under the ISDA Master Agreement, not just TRS and CFDs.
Collateral received by the Sub-Fund under the ISDA Master Agreement is transferred tri-partitely or bilaterally. Collateral received bythe Sub-Fund in relation to OTC Derivatives transactions (including TRS and CFDs) are held by the Depositary and itssub-depositories. Cash collateral received by the relevant Sub-Fund is not reused or reinvested. Non-cash collateral received by therelevant Sub-Fund cannot be sold, re-invested or pledged.
All the revenues arising from Securities Financing Transactions, net of direct and indirect operational costs are returned to therelevant Sub-Fund. The fees and costs related to these transactions are negotiated at an arm’s length with the relevant counterparty,all in accordance with the Investment Restrictions set out in the Prospectus and the current market practice.
All reverse repurchase agreements are entered into by the Fund with a counterparty under a Global Master Repurchase Agreement(“GMRA”). All collateral received/posted by the Fund under the GMRA is held in a tri-party account. Collateral received by the Fund isheld in an account in the name of the Depositary on behalf of the Fund. Collateral received is segregated from the assets belongingto the Fund’s Depositary.
The following table details the value of TRS, CFDs and Repurchase agreements as a proportion of the Funds’ NAV, as at March 31,2019. The value of TRS, CFDs and Repurchase agreements is based on the underlying exposure value (notional).
Sub-Funds CurrencyUnderlying
exposure value% of
net assets
Merrill Lynch Investment Solutions – Marshall Wace TOPS UCITS Fund (Market Neutral)
TRS/CFD USD 6 554 133 685 241.88
Merrill Lynch Investment Solutions – York Event-Driven UCITS Fund
TRS/CFD EUR 39 737 399 68.40
Merrill Lynch Investment Solutions – York Asian Event-Driven UCITS Fund
TRS/CFD EUR 143 684 224 122.73
Merrill Lynch Investment Solutions – AQR Global Relative Value UCITS Fund
TRS/CFD USD 3 167 078 520 500.12
Merrill Lynch Investment Solutions – Merrill Lynch WNT Diversified Futures UCITS Fund (inliquidation)
Reverse repurchase USD 2 760 000 74.96
Merrill Lynch Investment Solutions – Merrill Lynch Enhanced Equity Volatility Premium Fund
Reverse repurchase EUR 124 900 000 95.37
Merrill Lynch Investment Solutions – Merrill Lynch MLCX Commodity Enhanced Beta Fund
TRS/CFD USD 29 108 694 99.81
Reverse repurchase USD 28 280 000 96.97
Merrill Lynch Investment Solutions – Merrill Lynch MLCX Commodity Alpha Fund
TRS/CFD USD 70 429 268 100.05
Reverse repurchase USD 67 330 000 95.65
Merrill Lynch Investment Solutions – Zeal Greater China Long Short UCITS Fund
TRS/CFD USD 21 916 494 34.37
Merrill Lynch Investment Solutions – Ramius Merger Arbitrage UCITS Fund
TRS/CFD USD 153 142 926 51.47
Merrill Lynch Investment Solutions – Merrill Lynch Enhanced Cross-Asset Volatility Premium Fund
TRS/CFD EUR 99 529 301 99.57
Reverse repurchase EUR 94 550 000 94.59
251Merrill Lynch Investment Solutions
Appendix I (Section A) – Securities Financing Transactions Regulation (SFTR)Disclosures (Unaudited) as at March 31, 2019
Audited annual report

The following table details the underlying exposure value (notional) in base currency for TRS, CFDs and Repurchase agreements,analyzed for top 10 counterparties, as at March 31, 2019.
Counterparty
Counterparty'scountry of
establishment
Underlyingexposure value
for TRS and CFDs
Underlyingexposure value
for Reverse Repurchase
Merrill Lynch Investment Solutions – Marshall Wace TOPS UCITS Fund (Market Neutral)Barclays Bank PLCCredit Suisse AGCredit Suisse Securities Europe Ltd.Deutsche Bank AGGoldman Sachs InternationalJP Morgan Securities PLCMerrill Lynch InternationalMorgan Stanley Capital Services LLCMorgan Stanley & Co International PLCSociete Generale International Ltd
United KingdomSwitzerland
United KingdomGermany
United KingdomUnited KingdomUnited Kingdom
United StatesUnited KingdomUnited Kingdom
554 987 286815 880 264
11 982 527518 131 567
1 559 010 0791 224 653 603
438 077 88120 350 082
244 842 46371 235 889
----------
Merrill Lynch Investment Solutions – York Event-Driven UCITS FundBank of America NABarclays Bank PLCCitibank NACredit Suisse Securities Europe LtdDeutsche Bank AGGoldman Sachs InternationalJPMorgan Chase Bank NAMorgan Stanley Capital Services LLCUBS AG
United StatesUnited Kingdom
United StatesUnited Kingdom
GermanyUnited Kingdom
United StatesUnited States
Switzerland
573 2291 015 0794 484 4581 069 727
622 0642 698 1711 260 669
23 333 8404 680 163
---------
Merrill Lynch Investment Solutions – York Asian Event-Driven UCITS FundBank of America NACitibank NACredit Suisse Securities Europe LtdGoldman Sachs InternationalJPMorgan Chase Bank NAMorgan Stanley & Co International PLCUBS AG
United StatesUnited States
United KingdomUnited Kingdom
United StatesUnited States
Switzerland
20 335 17026 650 51419 634 13010 188 57519 437 65233 341 55314 096 630
-------
Merrill Lynch Investment Solutions – AQR Global Relative Value UCITS FundBank of America N.A.Deutsche Bank AGGoldman Sachs InternationalJP Morgan Chase Bank N.A.Merrill Lynch InternationalMorgan Stanley & Co. International Plc.
United StatesGermany
United KingdomUnited States
United KingdomUnited Kingdom
4 995 636641 366 741
1 923 782 3816 263 832
572 923 64617 746 284
------
Merrill Lynch Investment Solutions – Merrill Lynch WNT Diversified Futures UCITS Fund (in liquidation)Merrill Lynch International United Kingdom 2 760 000
Merrill Lynch Investment Solutions – Merrill Lynch Enhanced Equity Volatility Premium FundMerrill Lynch International United Kingdom - 124 900 000
Merrill Lynch Investment Solutions – Merrill Lynch MLCX Commodity Enhanced Beta FundMerrill Lynch International United Kingdom 29 108 694 28 280 000
Merrill Lynch Investment Solutions – Merrill Lynch MLCX Commodity Alpha FundMerrill Lynch International United Kingdom 70 429 268 67 330 000
Merrill Lynch Investment Solutions – Zeal Greater China Long Short UCITS FundMerrill Lynch InternationalMorgan Stanley & Co International PLC
United KingdomUnited Kingdom
11 059 21810 857 276
--
Merrill Lynch Investment Solutions – Ramius Merger Arbitrage UCITS FundMorgan Stanley Capital Services LLC United States 153 142 926 -
Merrill Lynch Investment Solutions – Merrill Lynch Enhanced Cross-Asset Volatility Premium FundMerrill Lynch International United Kingdom 99 529 301 94 550 000
252 Merrill Lynch Investment Solutions
Appendix I (Section A) – Securities Financing Transactions Regulation (SFTR)Disclosures (Unaudited) as at March 31, 2019 (cont.)
Audited annual report

The following table provides an analysis of the maturity tenor of TRS, CFDs and Repurchase agreements outstanding as at March 31,2019.
Maturity TenorLess than
1 dayOne day to
one weekOne week to
one monthOne to three
monthsThree months
to one yearAbove one
yearOpen
Transaction
Merrill Lynch Investment Solutions – Marshall Wace TOPS UCITS Fund (Market Neutral)CFD - - - - - - 6 554 133 685
Merrill Lynch Investment Solutions – York Event-Driven UCITS FundCFD - - - - - - 39 737 399
Merrill Lynch Investment Solutions – York Asian Event-Driven UCITS FundCFD - - - - - - 143 684 224
Merrill Lynch Investment Solutions – AQR Global Relative Value UCITS FundCFD - - - - - - 3 167 078 520
Merrill Lynch Investment Solutions – Merrill Lynch WNT Diversified Futures UCITS Fund (in liquidation)- - - - - - 2 760 000
Merrill Lynch Investment Solutions – Merrill Lynch Enhanced Equity Volatility Premium FundReverse repurchase - 124 900 000 - - - - -
Merrill Lynch Investment Solutions – Merrill Lynch MLCX Commodity Enhanced Beta FundTRS - - - - 29 108 694 - -Reverse repurchase - 28 280 000 - - - - -
Merrill Lynch Investment Solutions – Merrill Lynch MLCX Commodity Alpha FundTRS - - - - 70 429 268 - -Reverse repurchase - 67 330 000 - - - - -
Merrill Lynch Investment Solutions – Zeal Greater China Long Short UCITS FundCFD - - - - - - 21 916 494
Merrill Lynch Investment Solutions – Ramius Merger Arbitrage UCITS FundCFD - - - - - - 153 142 926
Merrill Lynch Investment Solutions – Merrill Lynch Enhanced Cross-Asset Volatility Premium FundTRS - - - - 99 529 301 - -Reverse repurchase - 94 550 000 - - - - -
The following table provides an analysis of the maturity tenor of cash collateral posted/(received) as at March 31, 2019.
Maturity TenorLess
than 1 dayOne day
to one weekOne week
to one monthOne to
three monthsThree months
to one yearAbove one
yearOpen
Maturity
Merrill Lynch Investment Solutions – Marshall Wace TOPS UCITS Fund (Market Neutral)USD - - - - - - 100 065 065
Merrill Lynch Investment Solutions – York Event-Driven UCITS FundEUR - - - - - - 6 334 382
Merrill Lynch Investment Solutions – York Asian Event-Driven UCITS FundEUR - - - - - - 29 713 398
Merrill Lynch Investment Solutions – AQR Global Relative Value UCITS FundUSD - - - - - - 151 170 609
Merrill Lynch Investment Solutions – Merrill Lynch MLCX Commodity Enhanced Beta FundUSD - - - - - - 430 000
Merrill Lynch Investment Solutions – Merrill Lynch MLCX Commodity Alpha FundUSD - - - - - - 720 000
Merrill Lynch Investment Solutions – Zeal Greater China Long Short UCITS FundUSD - - - - - - 7 790 600
Merrill Lynch Investment Solutions – Merrill Lynch Enhanced Cross-Asset Volatility Premium FundEUR - - - - - - 1 780 000
253Merrill Lynch Investment Solutions
Appendix I (Section A) – Securities Financing Transactions Regulation (SFTR)Disclosures (Unaudited) as at March 31, 2019 (cont.)
Audited annual report
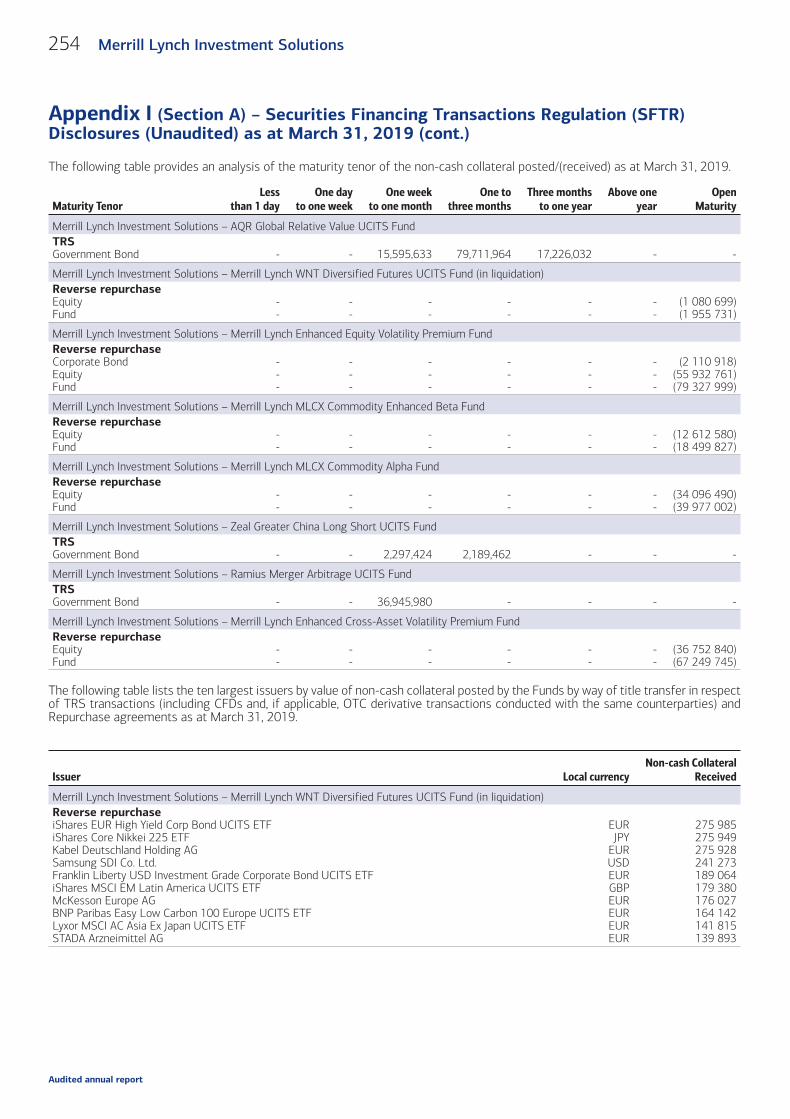
The following table provides an analysis of the maturity tenor of the non-cash collateral posted/(received) as at March 31, 2019.
Maturity TenorLess
than 1 dayOne day
to one weekOne week
to one monthOne to
three monthsThree months
to one yearAbove one
yearOpen
Maturity
Merrill Lynch Investment Solutions – AQR Global Relative Value UCITS FundTRSGovernment Bond - - 15,595,633 79,711,964 17,226,032 - -
Merrill Lynch Investment Solutions – Merrill Lynch WNT Diversified Futures UCITS Fund (in liquidation)Reverse repurchaseEquityFund
--
--
--
--
--
--
(1 080 699)(1 955 731)
Merrill Lynch Investment Solutions – Merrill Lynch Enhanced Equity Volatility Premium FundReverse repurchaseCorporate BondEquityFund
---
---
---
---
---
---
(2 110 918)(55 932 761)(79 327 999)
Merrill Lynch Investment Solutions – Merrill Lynch MLCX Commodity Enhanced Beta FundReverse repurchaseEquityFund
--
--
--
--
--
--
(12 612 580)(18 499 827)
Merrill Lynch Investment Solutions – Merrill Lynch MLCX Commodity Alpha FundReverse repurchaseEquityFund
--
--
--
--
--
--
(34 096 490)(39 977 002)
Merrill Lynch Investment Solutions – Zeal Greater China Long Short UCITS FundTRSGovernment Bond - - 2,297,424 2,189,462 - - -
Merrill Lynch Investment Solutions – Ramius Merger Arbitrage UCITS FundTRSGovernment Bond - - 36,945,980 - - - -
Merrill Lynch Investment Solutions – Merrill Lynch Enhanced Cross-Asset Volatility Premium FundReverse repurchaseEquityFund
--
--
--
--
--
--
(36 752 840)(67 249 745)
The following table lists the ten largest issuers by value of non-cash collateral posted by the Funds by way of title transfer in respectof TRS transactions (including CFDs and, if applicable, OTC derivative transactions conducted with the same counterparties) andRepurchase agreements as at March 31, 2019.
Issuer Local currencyNon-cash Collateral
Received
Merrill Lynch Investment Solutions – Merrill Lynch WNT Diversified Futures UCITS Fund (in liquidation)Reverse repurchaseiShares EUR High Yield Corp Bond UCITS ETFiShares Core Nikkei 225 ETFKabel Deutschland Holding AGSamsung SDI Co. Ltd.Franklin Liberty USD Investment Grade Corporate Bond UCITS ETFiShares MSCI EM Latin America UCITS ETFMcKesson Europe AGBNP Paribas Easy Low Carbon 100 Europe UCITS ETFLyxor MSCI AC Asia Ex Japan UCITS ETFSTADA Arzneimittel AG
EURJPY
EURUSDEURGBPEUREUREUREUR
275 985275 949275 928241 273189 064179 380176 027164 142141 815139 893
254 Merrill Lynch Investment Solutions
Appendix I (Section A) – Securities Financing Transactions Regulation (SFTR)Disclosures (Unaudited) as at March 31, 2019 (cont.)
Audited annual report

Issuer Local currencyNon-cash Collateral
Received
Merrill Lynch Investment Solutions – Merrill Lynch Enhanced Equity Volatility Premium FundReverse repurchaseTOPIX Exchange Traded FundRaksul, Inc.McDonald's Holdings Co. Japan Ltd.Schwab Emerging Markets Equity ETFiShares USD Floating Rate Bond UCITS ETFSuper Micro Computer, Inc.Yume No Machi Souzou Iinkai Co. Ltd.iShares MSCI Taiwan ETFiShares EUR High Yield Corp Bond UCITS ETFSosei Group Corp.iShares USD Floating Rate Bond UCITS ETF
JPYJPYJPY
USDUSDUSDJPY
USDEURJPY
GBP
12 489 67111 297 997
9 287 9414 884 1393 838 8853 354 8203 264 0123 210 5642 479 1022 476 202
106 918
Merrill Lynch Investment Solutions – Merrill Lynch MLCX Commodity Enhanced Beta FundReverse repurchaseMcDonald's Holdings Co. Japan Ltd.Raksul, Inc.iShares EUR High Yield Corp Bond UCITS ETFEnigmo, Inc.iShares Core Nikkei 225 ETFLyxor MSCI India UCITS ETFKabel Deutschland Holding AGXtrackers MSCI Taiwan UCITS ETFTKP Corp.Amundi Index MSCI Emerging Markets UCITS ETF DRLyxor MSCI India UCITS ETF
JPYJPY
EURJPYJPY
EUREUREURJPY
EURCHF
2 828 3762 828 3622 785 2892 509 2742 416 6191 463 2411 116 687
866 286774 524757 046
44 258
Merrill Lynch Investment Solutions – Merrill Lynch MLCX Commodity Alpha FundReverse repurchaseMcDonald's Holdings Co. Japan Ltd.Linde AGiShares MSCI Emerging Markets ETFUUUM, Inc.SPDR MSCI ACWI UCITS ETFiShares EUR High Yield Corp. Bond UCITS ETFiShares Core Nikkei 225 ETFiShares Core MSCI EM IMI UCITS ETFiShares MSCI China A UCITS ETFRaksul, Inc.
JPYEURUSDJPY
EUREURJPY
GBPUSDJPY
6 733 9406 417 7304 983 8224 951 5822 983 2392 785 2892 416 6192 387 4761 954 3121 819 466
Merrill Lynch Investment Solutions – Merrill Lynch Enhanced Cross-Asset Volatility Premium FundReverse repurchaseiShares MSCI Taiwan ETFiShares J.P. Morgan USD EM Bond UCITS ETFYume No Machi Souzou Iinkai Co. Ltd.iShares Core MSCI Emerging Markets ETFRaksul, Inc.Super Micro Computer, Inc.Lyxor MSCI India UCITS ETFAmundi Msci Emerging Markets UCITS ETFiShares EUR High Yield Corp Bond UCITS ETFXtrackers MSCI China UCITS ETFAmundi Msci Emerging Markets UCITS ETFLyxor MSCI India UCITS ETF
USDUSDJPY
USDJPY
USDEUREUREURUSDUSDCHF
9 454 7659 152 1536 093 5575 110 5844 691 6683 354 8203 248 6242 623 6642 479 1022 336 432
534 30639 393
The following table presents information on the safekeeping of collateral posted/(received) by the Funds in respect of TRStransactions (including CFDs and, if applicable, OTC derivative transactions conducted with the same counterparties) andRepurchase agreements as at March 31, 2019.
Received Pooled Received Segregated Posted Pooled Posted Segregated
Merrill Lynch Investment Solutions – Marshall Wace TOPS UCITS Fund (Market Neutral)TRS 100.00% 0.00% 100.00% 0.00%Merrill Lynch Investment Solutions – York Event-Driven UCITS FundTRS 100.00% 0.00% 48.22% 51.78%
255Merrill Lynch Investment Solutions
Appendix I (Section A) – Securities Financing Transactions Regulation (SFTR)Disclosures (Unaudited) as at March 31, 2019 (cont.)
Audited annual report

Received Pooled Received Segregated Posted Pooled Posted Segregated
Merrill Lynch Investment Solutions – York Asian Event-Driven UCITS FundTRS 0.00% 0.00% 100.00% 0.00%Merrill Lynch Investment Solutions – AQR Global Relative Value UCITS FundTRS 100.00% 0.00% 19.56% 80.44%Merrill Lynch Investment Solutions – Merrill Lynch WNT Diversified Futures UCITS Fund (in liquidation)Reverse repurchase 0.00% 100.00% 0.00% 0.00%Merrill Lynch Investment Solutions – Merrill Lynch Enhanced Equity Volatility Premium FundReverse repurchase 0.00% 100.00% 0.00% 0.00%Merrill Lynch Investment Solutions – Merrill Lynch MLCX Commodity Enhanced Beta FundTRS 100.00% 0.00% 0.00% 0.00%Reverse repurchase 0.00% 100% 0.00% 0.00%Merrill Lynch Investment Solutions – Merrill Lynch MLCX Commodity Alpha FundTRS 0.00% 0.00% 100.00% 0.00%Reverse repurchase 0.00% 100% 0.00% 0.00%Merrill Lynch Investment Solutions – Zeal Greater China Long Short UCITS FundTRS 100.00% 0.00% 4.44% 95.56%Merrill Lynch Investment Solutions – Ramius Merger Arbitrage UCITS FundTRS 0.00% 0.00% 0.00% 100.00%Merrill Lynch Investment Solutions – Merrill Lynch Enhanced Cross-Asset Volatility Premium FundTRS 0.00% 0.00% 100.00% 0.00%Reverse repurchase 0.00% 100% 0.00% 0.00%
The following table presents name of custodians and amount held in safekeeping by each custodian as at March 31, 2019.
Account name Currency Custodian Cash collateral
Merrill Lynch Investment Solutions – Marshall Wace TOPS UCITS Fund (MarketNeutral) USD Bank of New York Mellon 100 065 065
Merrill Lynch Investment Solutions – York Event-Driven UCITS Fund EUR Bank of New York Mellon 6 334 382
Merrill Lynch Investment Solutions – York Asian Event-Driven UCITS Fund EUR Bank of New York Mellon 29 713 398
Merrill Lynch Investment Solutions – AQR Global Relative Value UCITS Fund USD Bank of New York Mellon 151 170 609
Merrill Lynch Investment Solutions – Merrill Lynch MLCX Commodity Enhanced BetaFund USD Bank of New York Mellon 430 000
Merrill Lynch Investment Solutions – Merrill Lynch MLCX Commodity Alpha Fund USD Bank of New York Mellon 720 000
Merrill Lynch Investment Solutions – Zeal Greater China Long Short UCITS Fund USD Bank of New York Mellon 7 790 600
Merrill Lynch Investment Solutions – Merrill Lynch Enhanced Cross-Asset VolatilityPremium Fund EUR Bank of New York Mellon 1 780 000
For the following funds and counterparties, collateral was posted to a segregated account as part of a tri-party agreement.
Account name Counterparty nameSettlement
and Clearing
Merrill Lynch Investment Solutions - York Event-Driven UCITS Fund Morgan Stanley Capital Services, Inc. Tri-Party
Merrill Lynch Investment Solutions - AQR Global Relative Value UCITS Fund Deutsche Bank AG Tri-Party
Merrill Lynch Investment Solutions - AQR Global Relative Value UCITS Fund Goldman Sachs International Tri-Party
Merrill Lynch Investment Solutions - Merrill Lynch WNT Diversified Futures UCITSFund (in liquidation)
Merrill Lynch InternationalBank of New York Mellon
Tri-PartyTri-Party
Merrill Lynch Investment Solutions - Merrill Lynch Enhanced Equity VolatilityPremium Fund
Merrill Lynch InternationalBank of New York Mellon
Tri-PartyTri-Party
Merrill Lynch Investment Solutions - Merrill Lynch MLCX Commodity Enhanced BetaFund
Merrill Lynch InternationalBank of New York Mellon
Tri-PartyTri-Party
Merrill Lynch Investment Solutions - Merrill Lynch MLCX Commodity Alpha FundMerrill Lynch InternationalBank of New York Mellon
Tri-PartyTri-Party
Merrill Lynch Investment Solutions - Zeal Greater China Long Short UCITS Fund Merrill Lynch International Tri-Party
Merrill Lynch Investment Solutions - Zeal Greater China Long Short UCITS Fund Morgan Stanley & Co. International Plc. Tri-Party
256 Merrill Lynch Investment Solutions
Appendix I (Section A) – Securities Financing Transactions Regulation (SFTR)Disclosures (Unaudited) as at March 31, 2019 (cont.)
Audited annual report
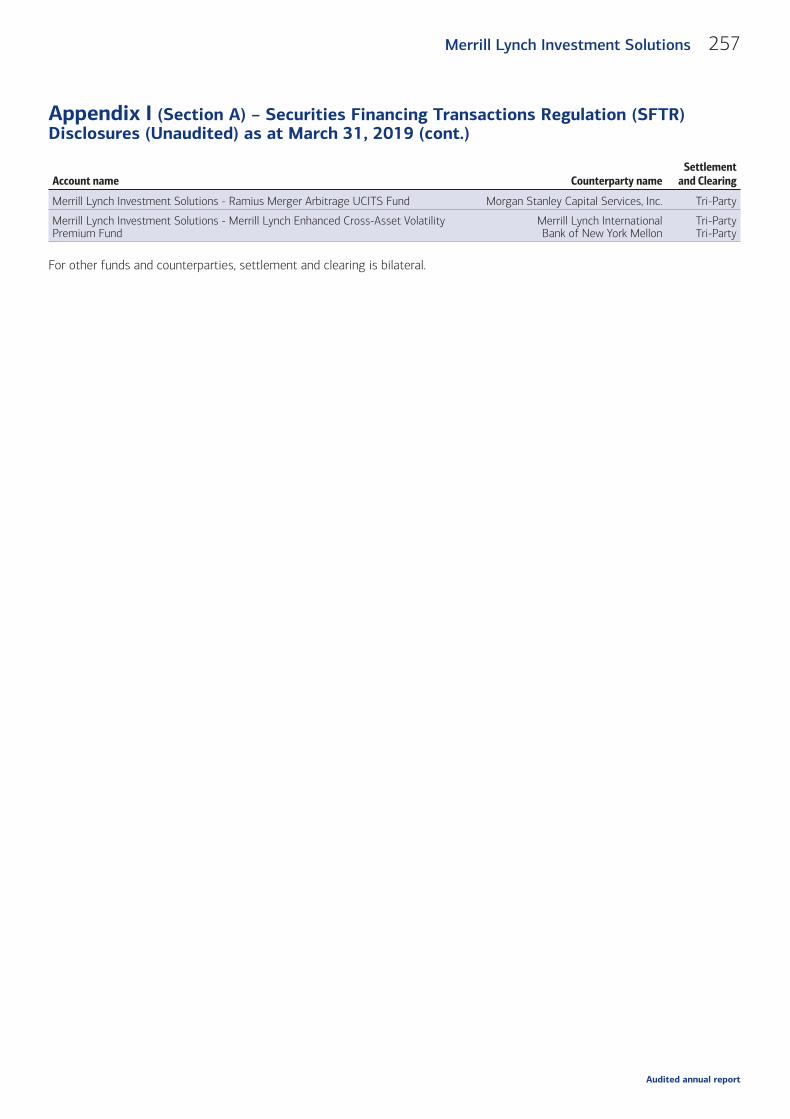
Account name Counterparty nameSettlement
and Clearing
Merrill Lynch Investment Solutions - Ramius Merger Arbitrage UCITS Fund Morgan Stanley Capital Services, Inc. Tri-Party
Merrill Lynch Investment Solutions - Merrill Lynch Enhanced Cross-Asset VolatilityPremium Fund
Merrill Lynch InternationalBank of New York Mellon
Tri-PartyTri-Party
For other funds and counterparties, settlement and clearing is bilateral.
257Merrill Lynch Investment Solutions
Appendix I (Section A) – Securities Financing Transactions Regulation (SFTR)Disclosures (Unaudited) as at March 31, 2019 (cont.)
Audited annual report

The following disclosures are required for Index-Tracking Portfolio’s based on European Securities and Market Authority (“ESMA”)guidelines and other UCITS issues (ESMA/2012/832), issued on 18 December 2012 :
FundNAV @
31/03/2018NAV @
31/03/2019NAV
PerformanceIndex
TrackedIndex @
31/03/2018Index @
31/03/2019Index
PerformanceTracking
DifferenceAnticipated
Tracking ErrorTracking
error Comments
Merrill LynchInvestmentSolutions – MerrillLynch MLCXCommodityEnhanced BetaFund
71.68 69.03 -3.70% MLCX03TRIndex
492.01 478.69 -2.71% 0.99% Within 1 to 2%annually
0.41% Within tolerance.Difference fromIndex not inclusiveof fund fees andexecution costsfrom trading bonds
Merrill LynchInvestmentSolutions – MerrillLynch MLCXCommodity AlphaFund
138.43 153.66 11.00% MLCXAF5TIndex
2,056.10 2,307.65 12.23% 1.23% Within 1 to 2%annually
0.70% Within tolerance.Difference fromIndex not inclusiveof fund fees andexecution costsfrom trading bonds
The anticipated tracking error for each portfolios under normal market circumstances is set out in the above table. Investors shouldnote that the actual performance of the portfolios will not necessarily be aligned with the anticipated tracking error as detailedabove. Tracking error has been calculated using current financial year historical data available and therefore may not capture allfactors that will impact a portfolio’s actual performance against its benchmark index.
258 Merrill Lynch Investment Solutions
Appendix II – Index Tracking Portfolios (Unaudited)
Audited annual report

UCITS remuneration figures disclosure.
From 1 January 2018 until 31 December 2018 the total amount of remuneration paid – in cash and/or restricted securities – bythe Management Company to its entire staff and relevant staff (composed during the reference period) in average of 28 employeeswas USD 4,595,527.
The Remuneration is based on an individual’s base salary and incentive compensation for 2018 – which is then proportionallysplit between time spent by the individual for the 2 funds which the Management Company has responsibilities for.
Quantitative information relevant to UCITS is outlined below:
Total remuneration for the financial year ending 31 December 2018 paid to 28 staff of the Management Companyand contracted staff from affiliate companies in respect of the management of the UCITS funds
USD 4, 595,527 made up of:- USD 3,107,159 of fixed remuneration- USD 1,488,368 of variable remuneration
Which includes:(a) Remuneration paid by the Management Company to senior management
USD 2,354,929
(b) Remuneration paid by the Management Company to other staff members whose actions have a material impacton the risk profile of the funds
USD 2,563,166
Information on the remuneration policy
In accordance with the guidelines set out in the Remuneration Policy approved by the CM Investment Solutions Limited boardof directors, staff are remunerated in a way which is consistent with and promotes sound and effective risk management and doesnot encourage risk-taking which is inconsistent with the risk profiles, rules or instruments of incorporation of the funds managedby the Company. The Remuneration Policy has been designed to ensure that it is aligned with the business strategy, objectives,values and interests of the Company and the funds it manages or the investors of such funds, and includes measures to avoidconflicts of interest.
Risk Management and Risk Tolerance.It is the Firm’s policy to promote sound and effective risk management and discourage risk-taking that exceeds the level of risktolerated by the Firm and the UCITS it manages. As such the Firm maintains:
• Strong disclosure practices, which provide investors with the information they need to determine whether to invest in theFund, monitor their investment and make a decision whether to redeem their investment based on the risk profile of theinvestment strategy.
• Robust valuation policies and procedures to provide for clear and consistent valuations of the investments in the Fund’sportfolio, with independent oversight provided by the Fund’s board or other governing body, third party administrators,independent auditors and expert valuation advisers, the latter particularly in the case of hard-to-value assets.
• Comprehensive and independent risk management processes to measure, monitor, report and manage risk, including stresstesting of the portfolio and liquidity risk management.
• Sound operational and regulatory systems and controls.
• A strong culture of compliance, sponsored by the Management Body with specific practices to address conflicts of interest.
Due to the nature of the market, and sensitivity of investors to both risk and performance, the Firm has determined that itsoffering is based on its ability to provide an agreed balance between risk and reward. This balance is respected in the Firm’s riskmanagement and remuneration policies.
The Management Company’s remuneration policy was updated to ensure the policy reflected the company remuneration post sale(from BAML). The policy was presented to and reviewed by the New Company’s Board of Directors and approved.
259Merrill Lynch Investment Solutions
Appendix III – Remuneration Note (Unaudited)
Audited annual report

Merrill Lynch Investment Solutions
Audited annual reportas at March 31, 2019
Related Documents