Meridian Fund, Inc. Meridian Growth F und Meridian Contrarian Fund Meridian Enhanced Equity Fund Meridian Small Cap Growth Fund Annual Repor t June 30, 2020

Welcome message from author
This document is posted to help you gain knowledge. Please leave a comment to let me know what you think about it! Share it to your friends and learn new things together.
Transcript
Meridian Fund, Inc.
Meridian Growth Fund
Meridian Contrarian Fund
Meridian Enhanced Equity Fund
Meridian Small Cap Growth Fund
Annual ReportJune 30, 2020

Beginning on January 1, 2021, as permitted by regulations adopted by the U.S. Securities and Exchange Commission, paper copiesof the Funds’ annual and semi-annual shareholder reports will no longer be sent by mail, unless you specifically request papercopies of the reports. Instead, the reports will be made available on the Funds’ website (www.meridianfund.com), and you will benotified by mail each time a report is posted and provided with a website link to access the report.
If you already elected to receive shareholder reports electronically, you will not be affected by this change and you need not takeany action. You may elect to receive shareholder reports and other communications from a Fund electronically anytime bycontacting your financial intermediary (such as a broker-dealer or bank) or, if you are a direct investor, by enrolling atwww.meridianfund.com.
You may elect to receive all future reports in paper free of charge. If you invest through a financial intermediary, you can contactyour financial intermediary to request that you continue to receive paper copies of your shareholder reports. If you invest directlywith a Fund, you can call 1-800-446-6662 to let the Fund know you wish to continue receiving paper copies of your shareholderreports. Your election to receive reports in paper will apply to all funds held in your account if you invest through your financialintermediary or all funds held with the fund complex if you invest directly with a Fund.
MERIDIAN FUND, INC.
Table of Contents
Portfolio Performance and Composition . . . . . . . . . . . . . . . . . . . . . . . . . . . . . . . . . . . . . . . . . . . . . . . . . . . . . . . . . . . . . . . . . . . . . . . . . . . . . . . . . . 4
Fund Expenses . . . . . . . . . . . . . . . . . . . . . . . . . . . . . . . . . . . . . . . . . . . . . . . . . . . . . . . . . . . . . . . . . . . . . . . . . . . . . . . . . . . . . . . . . . . . . . . . . . . . . . . . . . . . 23
Performance Disclosure . . . . . . . . . . . . . . . . . . . . . . . . . . . . . . . . . . . . . . . . . . . . . . . . . . . . . . . . . . . . . . . . . . . . . . . . . . . . . . . . . . . . . . . . . . . . . . . . . . . 28
Schedules of Investments . . . . . . . . . . . . . . . . . . . . . . . . . . . . . . . . . . . . . . . . . . . . . . . . . . . . . . . . . . . . . . . . . . . . . . . . . . . . . . . . . . . . . . . . . . . . . . . . . 29
Statements of Assets and Liabilities . . . . . . . . . . . . . . . . . . . . . . . . . . . . . . . . . . . . . . . . . . . . . . . . . . . . . . . . . . . . . . . . . . . . . . . . . . . . . . . . . . . . . . . 45
Statements of Operations . . . . . . . . . . . . . . . . . . . . . . . . . . . . . . . . . . . . . . . . . . . . . . . . . . . . . . . . . . . . . . . . . . . . . . . . . . . . . . . . . . . . . . . . . . . . . . . . . 47
Statements of Changes in Net Assets . . . . . . . . . . . . . . . . . . . . . . . . . . . . . . . . . . . . . . . . . . . . . . . . . . . . . . . . . . . . . . . . . . . . . . . . . . . . . . . . . . . . . 48
Financial Highlights . . . . . . . . . . . . . . . . . . . . . . . . . . . . . . . . . . . . . . . . . . . . . . . . . . . . . . . . . . . . . . . . . . . . . . . . . . . . . . . . . . . . . . . . . . . . . . . . . . . . . . . 50
Notes to Financial Statements. . . . . . . . . . . . . . . . . . . . . . . . . . . . . . . . . . . . . . . . . . . . . . . . . . . . . . . . . . . . . . . . . . . . . . . . . . . . . . . . . . . . . . . . . . . . . 68
Report of Independent Registered Public Accounting Firm . . . . . . . . . . . . . . . . . . . . . . . . . . . . . . . . . . . . . . . . . . . . . . . . . . . . . . . . . . . . . . . 86
Board Consideration of Liquidity Risk Management Program . . . . . . . . . . . . . . . . . . . . . . . . . . . . . . . . . . . . . . . . . . . . . . . . . . . . . . . . . . . . . 87
Information About the Directors and Officers . . . . . . . . . . . . . . . . . . . . . . . . . . . . . . . . . . . . . . . . . . . . . . . . . . . . . . . . . . . . . . . . . . . . . . . . . . . . . 88
2020 Tax Notice to Shareholders . . . . . . . . . . . . . . . . . . . . . . . . . . . . . . . . . . . . . . . . . . . . . . . . . . . . . . . . . . . . . . . . . . . . . . . . . . . . . . . . . . . . . . . . . . 89
Glossary of Terms used in this Report . . . . . . . . . . . . . . . . . . . . . . . . . . . . . . . . . . . . . . . . . . . . . . . . . . . . . . . . . . . . . . . . . . . . . . . . . . . . . . . . . . . . . 91
Meridian Funds 3 www.meridianfund.com
Market Overview
Through the latter half of 2019, equities extended their long bull run as the outlook for the global economy continued tobrighten. In the U.S., a more accommodative monetary policy helped keep the economy strong in the face of headwindsthat included a trade war between the U.S. and China. The year ended on a high note, with trade tension easing, corporateearnings surprising on the upside, and one of the strongest U.S. jobs markets on record.
That all ended abruptly in late February and early March of 2020, as the novel coronavirus that originated in China began tospread globally, requiring quarantines that shut down economies. Stocks fell swiftly and severely, with U.S. equity marketsplummeting from their February peaks into bear market territory. Fueled by uncertainty and fear, the CBOE Volatility Index(VIX), a benchmark for stock market volatility, closed at the highest level on record in mid-March.
In response to stay-at-home orders, businesses shuttered their doors, ultimately resulting in more than 40 million Americansfiling for unemployment. While the U.S. government passed a relief package for struggling Americans valued at nearly $3trillion, central bankers responded to the crisis with unprecedented fiscal and monetary stimulus. These and otherdevelopments, including declining COVID-19 infection rates and the reopening of economies, lifted investor confidence andspurred a strong rally in U.S. equity markets in the second quarter of 2020.
Against this backdrop, large-cap stocks outperformed both mid-caps and small-caps, as measured by the Russell family ofU.S. indices. In addition, growth stocks continued to outperform value stocks by a wide margin across the capitalizationspectrum.
Fund Performance
The Meridian Growth Fund (the "Fund") Legacy Class Shares returned -1.40% (net) for the 12 months ended June 30, 2020,underperforming its benchmark, the Russell 2500® Growth Index, which returned 9.21%.
Our investment process prioritizes the management of risk over the opportunity for return. We look to build an “enduring”fund that can mitigate capital losses during turbulent bear market environments and, secondarily, participate on the upsideduring strong market environments. During the period, volatility increased significantly. In fact, there were 25 days in whichthe index dropped 2% or more, well above the historical average. Fund performance was mixed during these down days, asgrowth outperformed value three times more often than is historically normal, a surprising development which provided aheadwind to performance due to the Fund’s more valuation-sensitive approach.
Negative stock selection within the information technology and communication services sectors detracted from the Fund’srelative results. Alternately, our holdings in the healthcare sector were the largest contributors to gains during the 12 monthperiod.
Many of the same factors we have discussed in recent communications continued to work against us during the 12 monthperiod, including investors’ preference for large-cap stocks. For example, in the Russell 2500® Growth Index, the top quintilemarket cap of the index appreciated approximately 88.4%, versus an approximate -23.1% decline for the lowest quintile.Another unfavorable trend that created headwinds for the Fund was investors’ bias toward more growth-orientedcompanies. In fact, the Russell 2500® Growth Index appreciated 9.21% during the period, versus the Russell 2500® ValueIndex which declined -15.50%, resulting in growth outperforming value by 2,471 basis points. The Russell 2500® GrowthIndex has now outperformed the Russell 2500® Value Index over the trailing quarter, 1-year, 3-year, 5-year, and 10-yearperiods. Given our focus on valuation, this trend has worked against us.
The three largest individual detractors from the Fund’s performance during the period were Cinemark Holdings, Inc.,Hanesbrands, Inc., and Belden, Inc.
• Cinemark Holdings, Inc. is a leader in the U.S. motion picture exhibition industry. Prior to the COVID-19 outbreak,the company had outperformed the North American theater industry for 39 of the past 44 quarters,demonstrating the value of Cinemark’s high-quality circuit. The company’s strong balance sheet compared to itscompetitors has enabled it to make theater upgrades that enhance the moviegoing experience and should act asa competitive advantage during today’s challenging times. Quarantine directives forced Cinemark to close all its
Meridian Growth FundPortfolio Performance and Composition (Unaudited)
Meridian Funds 4 www.meridianfund.com
theaters in the first quarter of 2020. We believe Cinemark is one of the best positioned theater companies toweather COVID-19 and expect the company to resume its track record of gaining share when theaters are allowedto reopen. We maintained our position in the company, however it is much smaller than it was at the beginning ofthe period.
• Hanesbrands, Inc. designs, makes, and sells intimate apparel and activewear under brand names such as Hanes,Champion, Bali and Playtex. The company has a low-cost global supply chain, which allows it to generate healthymargins and returns, and a unique business model that enables it to produce more than 90% of its goods throughits own manufacturing facilities. Store closures and weak global apparel trends resulting from the pandemiccaused Hanesbrands’ share price to slide lower during the period. Sales results were further impacted from therecent termination of the company’s exclusive contract with Target to sell its C9 Champion-branded clothing.Despite this challenge, the company has since entered into a multiyear agreement with Amazon.com to sell its C9Champion clothing. Hanes has a strong liquidity position of $1.8 billion that we believe will help the company toweather the pandemic and return to growth. More recently, we are encouraged by the company’s ability tomanufacture PPE gear for the government and businesses to help offset the impact from the Covid-19 relatedshutdowns. As such, we added to our position.
• Belden, Inc. is a diversified supplier of specialty network solutions to the enterprise and industrial markets.Belden's products are mission critical and are expected to perform in highly complex environments. The companyhas repositioned the product portfolio to focus on higher growth end markets like industrial automation, smartbuildings, cybersecurity, and broadband and 5G. While still a small percentage of sales today, the company ismaking strides to increase the percentage of recurring and repeating revenues. Management has divested slowergrowing, lower margin divisions and taken aggressive restructuring actions with the goal of accelerating revenuegrowth to 5-7%, improving EBITDA margins to 20-22%, and delivering a return on invested capital of 13-15%.Belden’s focus on these initiatives gives us confidence in the company’s ability to increase revenues despite near-term headwinds. We consequently are comfortable with our current position size in the stock.
The three largest contributors to the Fund’s performance during the period were Forte Biosciences, Inc., Quidel Corp., andImmunomedics, Inc.
• Forte Biosciences, Inc. is a clinical-stage biopharmaceutical firm focused on the treatment of inflammatory skindiseases, particularly atopic dermatitis. We purchased the restricted stock of the company when it was still aprivately held corporation. We were optimistic about Phase 1/2a clinical trial results for its lead drug candidateFB-401, a live biotherapeutic being developed as a topical therapy for inflammatory skin diseases in adults andchildren. While the trial showed statistically significant improvement in patients, regulatory approval and apotential commercial launch of the drug will require Forte to run a placebo-controlled trial. The company securedfunding for additional trials for FB-401 and to advance its product pipeline through a reverse merger with publiclyheld biotech firm Tocagen. The all-stock transaction was completed in June, resulting in Forte becoming a publiclyheld corporation and sending shares of Forte higher.
• Quidel Corp. is a developer of rapid diagnostic testing solutions which generates most of its revenue from point-of-care tests. Its QuickVue flu tests allow for the fast, qualitative detection of influenza type A and type B, andstreptococcus. Since receiving FDA Emergency Use Authorization for its COVID-19 detection test in the firstquarter, Quidel has seen strong demand for the test, leading to better-than-expected quarterly revenue andprofits. News that the company is ramping up to one million tests per week fueled share strength during theperiod. At this pace, Quidel could see an incremental $700 million to $1 billion in revenue on a trailing 12-monthbasis, essentially doubling its revenue. We continue to see strong potential growth for revenue and profits goingforward and, subsequently, maintained our position in the stock.
• Immunomedics, Inc. is a biopharmaceutical company focused on developing targeted treatments for cancer,autoimmune disorders, and other serious diseases. Our initial investment in Immunomedics was motivated bypositive clinical trial data for the company’s experimental treatment for an aggressive type of metastatic triple-negative breast cancer. In April, the Food and Drug Administration approved the drug, known as Trodelvy. Giventhe unmet clinical need in this patient population, we believe the market opportunity for Trodelvy is significantwhich should lead to a strong commercial launch. During the period, we trimmed our position based on ourvaluation discipline as the stock appreciated.
Meridian Growth FundPortfolio Performance and Composition (Unaudited) (continued)
Meridian Funds 5 www.meridianfund.com
Outlook
In the final days of the period, COVID-19 infection rates began to spike in certain parts of the country, suggesting thev-shaped economic recovery that investors had hoped for may be elusive and raising the question about whether additionalfiscal and monetary stimulus may be needed. Given expectations that the current stimulus package will have fully worked itsway into the economy by September, the course of economic growth should be clearer at that point. Our approach in thisuncertain environment remains unchanged: as we continue to focus on businesses with predictable and recurring revenuestreams, improving margins, strong competitive advantages, and growing market opportunities.
Now more than ever, we maintain strong conviction in the companies we own. Our focus remains on companies that cannot only weather the recent market volatility but also emerge even stronger once the recessionary clouds clear. The market’scorrection and subsequent rebound has presented us with opportunities to continue to upgrade the quality of the Fundwhile maintaining our strict valuation discipline. Although recent economic events are unprecedented, we remain confidentthat staying disciplined to our investment process is the best approach to achieve the strategy’s long-term investmentobjectives.
Thank you for your continued trust and confidence.
Brian Schaub & Chad Meade
Co-Portfolio Managers
Meridian Growth FundPortfolio Performance and Composition (Unaudited) (continued)
Meridian Funds 6 www.meridianfund.com
Total Return Based on a $10,000 investment for the Period Ended June 30, 2020
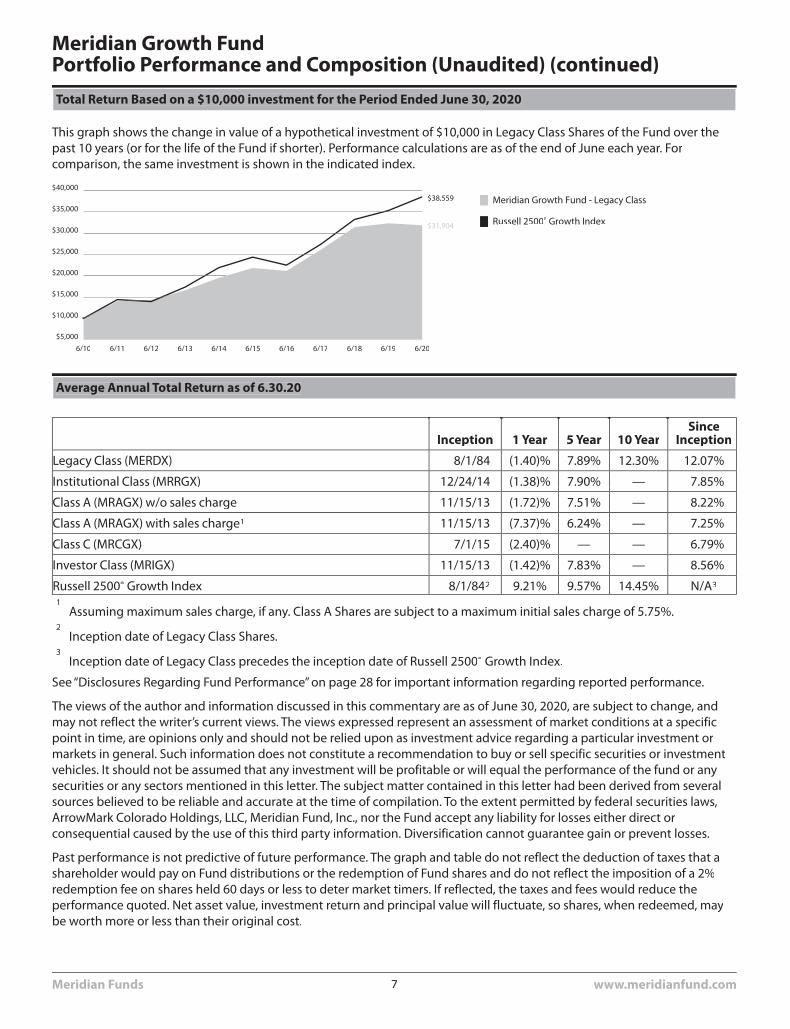
This graph shows the change in value of a hypothetical investment of $10,000 in Legacy Class Shares of the Fund over thepast 10 years (or for the life of the Fund if shorter). Performance calculations are as of the end of June each year. Forcomparison, the same investment is shown in the indicated index.
$5,000
$10,000
$15,000
$20,000
$25,000
$30,000
$35,000
$40,000$38,559 Meridian Growth Fund - Legacy Class
Russell 2500® Growth Index
6/116/10 6/206/18 6/196/176/166/156/146/136/12
$31,904
Average Annual Total Return as of 6.30.20
Inception 1 Year 5 Year 10 YearSince
Inception
Legacy Class (MERDX) 8/1/84 (1.40)% 7.89% 12.30% 12.07%
Institutional Class (MRRGX) 12/24/14 (1.38)% 7.90% — 7.85%
Class A (MRAGX) w/o sales charge 11/15/13 (1.72)% 7.51% — 8.22%
Class A (MRAGX) with sales charge1 11/15/13 (7.37)% 6.24% — 7.25%
Class C (MRCGX) 7/1/15 (2.40)% — — 6.79%
Investor Class (MRIGX) 11/15/13 (1.42)% 7.83% — 8.56%
Russell 2500® Growth Index 8/1/842 9.21% 9.57% 14.45% N/A3
1Assuming maximum sales charge, if any. Class A Shares are subject to a maximum initial sales charge of 5.75%.
2Inception date of Legacy Class Shares.
3Inception date of Legacy Class precedes the inception date of Russell 2500® Growth Index.
See “Disclosures Regarding Fund Performance” on page 28 for important information regarding reported performance.
The views of the author and information discussed in this commentary are as of June 30, 2020, are subject to change, andmay not reflect the writer’s current views. The views expressed represent an assessment of market conditions at a specificpoint in time, are opinions only and should not be relied upon as investment advice regarding a particular investment ormarkets in general. Such information does not constitute a recommendation to buy or sell specific securities or investmentvehicles. It should not be assumed that any investment will be profitable or will equal the performance of the fund or anysecurities or any sectors mentioned in this letter. The subject matter contained in this letter had been derived from severalsources believed to be reliable and accurate at the time of compilation. To the extent permitted by federal securities laws,ArrowMark Colorado Holdings, LLC, Meridian Fund, Inc., nor the Fund accept any liability for losses either direct orconsequential caused by the use of this third party information. Diversification cannot guarantee gain or prevent losses.
Past performance is not predictive of future performance. The graph and table do not reflect the deduction of taxes that ashareholder would pay on Fund distributions or the redemption of Fund shares and do not reflect the imposition of a 2%redemption fee on shares held 60 days or less to deter market timers. If reflected, the taxes and fees would reduce theperformance quoted. Net asset value, investment return and principal value will fluctuate, so shares, when redeemed, maybe worth more or less than their original cost.
Meridian Growth FundPortfolio Performance and Composition (Unaudited) (continued)
Meridian Funds 7 www.meridianfund.com
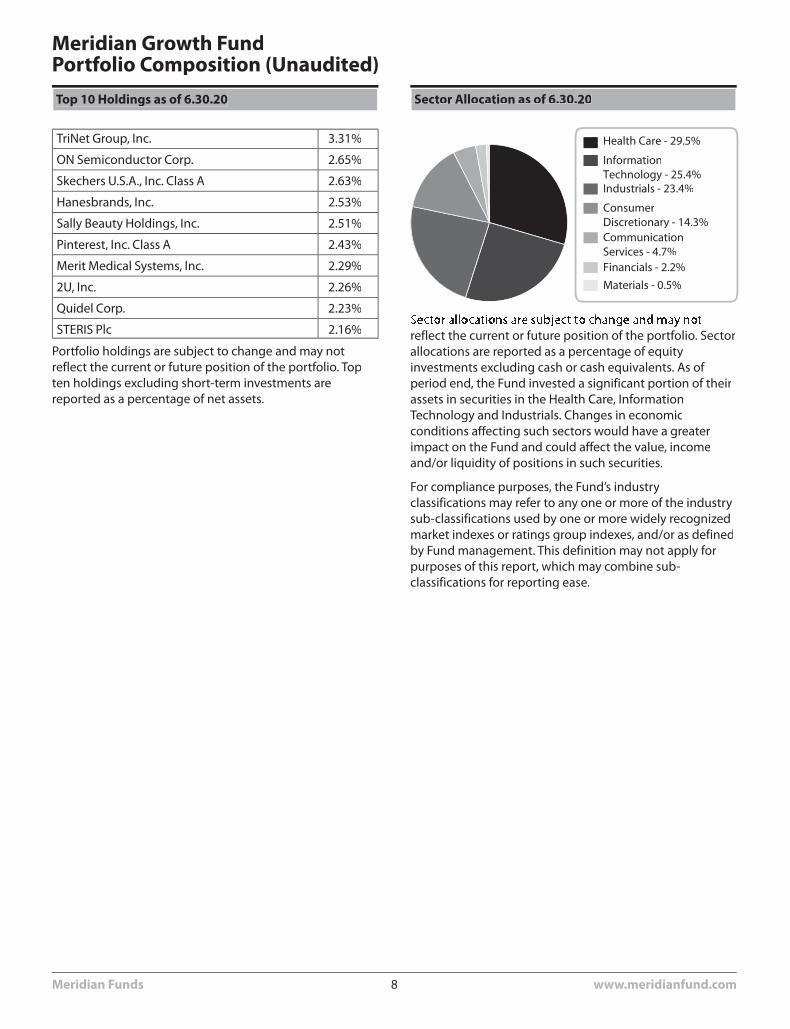
Top 10 Holdings as of 6.30.20
TriNet Group, Inc. 3.31%
ON Semiconductor Corp. 2.65%
Skechers U.S.A., Inc. Class A 2.63%
Hanesbrands, Inc. 2.53%
Sally Beauty Holdings, Inc. 2.51%
Pinterest, Inc. Class A 2.43%
Merit Medical Systems, Inc. 2.29%
2U, Inc. 2.26%
Quidel Corp. 2.23%
STERIS Plc 2.16%
Portfolio holdings are subject to change and may notreflect the current or future position of the portfolio. Topten holdings excluding short-term investments arereported as a percentage of net assets.
Sector Allocation as of 6.30.20
Health Care - 29.5%
Industrials - 23.4%
InformationTechnology - 25.4%
Financials - 2.2%
CommunicationServices - 4.7%
Materials - 0.5%
ConsumerDiscretionary - 14.3%
reflect the current or future position of the portfolio. Sectorallocations are reported as a percentage of equityinvestments excluding cash or cash equivalents. As ofperiod end, the Fund invested a significant portion of theirassets in securities in the Health Care, InformationTechnology and Industrials. Changes in economicconditions affecting such sectors would have a greaterimpact on the Fund and could affect the value, incomeand/or liquidity of positions in such securities.
For compliance purposes, the Fund’s industryclassifications may refer to any one or more of the industrysub-classifications used by one or more widely recognizedmarket indexes or ratings group indexes, and/or as definedby Fund management. This definition may not apply forpurposes of this report, which may combine sub-classifications for reporting ease.
Meridian Growth FundPortfolio Composition (Unaudited)
Meridian Funds 8 www.meridianfund.com
Market Overview
Through the latter half of 2019, equities extended their long bull run as the outlook for the global economy continued tobrighten. In the U.S., a more accommodative monetary policy helped keep the economy strong in the face of headwindsthat included a trade war between the U.S. and China. The year ended on a high note, with trade tension easing, corporateearnings surprising on the upside and one of the strongest U.S. jobs markets on record.
That all ended abruptly in late February and early March of 2020, as the novel coronavirus that originated in China began tospread globally, requiring quarantines that shut down economies. Stocks fell swiftly and severely, with U.S. equity marketsplummeting from their February peaks into bear market territory. Fueled by uncertainty and fear, stock market volatilityclimbed to the highest level on record, as measured by the CBOE Volatility Index (VIX).
In response to stay-at-home orders, businesses shuttered the doors, ultimately resulting in more than 40 million Americansfiling for unemployment. While the U.S. government passed a relief package for struggling Americans valued at nearly $3trillion, central bankers responded to the crisis with unprecedented fiscal and monetary stimulus. These and otherdevelopments, including declining COVID-19 infection rates and the reopening of economies, lifted investor confidence andspurred a strong rally in U.S. equity markets in the second quarter of 2020.
Against this backdrop, large-cap stocks outperformed both mid-caps and small-caps, as measured by the Russell family ofU.S. indices. In addition, growth stocks outperformed value stocks by a wide margin across the capitalization spectrum.
Fund Performance
The Meridian Contrarian Fund (the “Fund”) Legacy Class Shares returned -4.90% (net) for the 12 months ending June 30,2020, performing approximately in line with its benchmark, the Russell 2500® Index, which returned -4.70%, andoutperforming its secondary benchmark, the Russell 2500® Value Index, which returned -15.50%.
Our investment process seeks to identify out-of-favor companies that we believe have depressed valuations and visiblecatalysts for sustainable improvement. Experience has taught us that businesses with unappreciated potential for earningsgrowth and multiple expansion can be a powerful source of outperformance. As such, we employ a fundamental research-driven process that includes screening for companies that have multiple quarters of year-over-year earnings declines,understanding the reason for the declines, then singling out the companies we believe are poised for an earnings reboundvia a cohesive turnaround plan, a new management team, or through improvements or changes to the business. Theoutcome of this process is a concentrated portfolio of 50-65 of our best ideas.
With a process that prioritizes the management of risk over the opportunity for return, we scrutinize the quality of eachprospective investment’s business model and its valuation. Our high standards for quality require that a company have adurable competitive advantage, improving return on invested capital and free cash flow, as well as sustainable futureearnings growth.
While we manage the Fund from the bottom up based on individual company fundamentals, we augment this bymonitoring overall portfolio characteristics as part of our risk-management process. Two of our primary risk measures arebeta-adjusted weight and downside capture, both of which we measure on portfolio, sector, and individual company levels.We analyze the beta-adjusted weights of portfolio holdings against the Russell 2500® Index to determine how sensitive eachholding is to movement in the broader market and identify where our risk exposure lies within the portfolio. Depending onthe degree to which a stock correlates closely with market movement (high beta), or inversely to the market (low beta), wemay increase or decrease our weighting to align with the Fund’s risk parameters as we prioritize risk before reward.Downside capture measures how much a stock goes down relative to an overall market decline, with lower capturerepresenting lower risk. For both these measures we focus on absolute levels and changes over time. This is part of ourongoing process of recycling capital and we are comfortable with the current lower-risk profile.
From a sector standpoint, strong stock selection within the information technology, materials, and utilities sectorscontributed to the Fund’s relative performance. Conversely, negative stock selection within the consumer discretionarysector weighed on relative results. Another area of relative weakness was healthcare, where an underweight positionweighed on relative returns.
Meridian Contrarian FundPortfolio Performance and Composition (Unaudited)
Meridian Funds 9 www.meridianfund.com
The three largest contributors to the Fund’s performance were Immunomedics, Inc., Cerence, Inc., and Newmont Corp.
• Immunomedics, Inc. is a biopharmaceutical company focused on developing targeted treatments for cancer,autoimmune disorders, and other serious diseases. We invested in the company in 2017 following a 40% decline inthe stock resulting from a failed acquisition attempt by biopharmaceutical firm Seattle Genetics. Our optimism forImmunomedics is related to our favorable outlook for its prospects in triple-negative breast cancer. Since ourinitial investment, clinical data for its lead breast-cancer drug has supported this view. In April, the Food and DrugAdministration approved the drug, known as Trodelvy. We believe the market opportunity in this space is muchlarger than the market estimates and that Immunomedics’ stock has further upside. We trimmed our position asthe stock appreciated during the period.
• Cerence, Inc. develops human-automotive interface software that provides drivers and passengers withapplications ranging from infotainment to safety and, eventually, autonomous driving. In the fourth quarter of2019, Cerence was spun off of Nuance, a company we’ve owned in the Fund since the second quarter of 2018. Atthe time of the spinoff, Cerence was not well understood by the market and out of favor with investors due toconcerns it would lose market share to Big Tech competitors such as Google, Amazon.com and Apple. Ourresearch showed Cerence was well positioned competitively as a partner to the major automotive originalequipment manufacturers because it allows them to retain control over the data and other value-generationpotential from its products rather than ceding these functions to large tech companies. In addition to the shareswe received from the Nuance spinoff, we bought more shares in late 2019 and early 2020 at what we believedwere deeply discounted valuations relative to the company’s growth potential. Cerence’s stock benefited from anumber of developments during the year, including a rebound from pandemic-related concerns about theautomotive industry; strong fundamental results that demonstrated the resilience of the business; andannouncements of significant contract wins that allayed fears of competitive intrusions. We believe Cerenceremains well positioned with significant growth opportunities.
• Newmont Corp. is the world’s second-largest producer of gold. The company operates in five countries on fourcontinents, including Africa, Australia, North America and South America. At the time of our initial investment in2015, Newmont was struggling from declining gold prices, production shortfalls, cost overruns and pooracquisitions. Our investment thesis was that the company’s new management team would effectively changeNewmont’s strategic direction by maximizing its production volume and value via portfolio rationalization, capitaldiscipline, targeted investments, and process improvements designed to lower costs and improve the reliability ofproduction volumes. As we had anticipated, these initiatives have led to improved production, lower costs andincreased profitability. By the end of June 2020, gold prices had reached nearly an eight-year high, supported bystimulus measures and interest rate cuts by central banks globally. The rally in gold drove strong share priceappreciation for Newmont. We continued to believe in the long-term growth opportunity represented in thiscompany and trimmed our position during the period.
The three largest detractors from the Fund’s performance were Brinker International, Inc., Designer Brands, Inc., andKennedy-Wilson Holdings, Inc.
• Brinker International, Inc. owns and operates Chili’s and Maggiano’s restaurant chains. We invested in thecompany in late 2017, when its stock was out of favor due to lackluster sales and declining operating margins.Contributing to our positive outlook for Brinker, was our belief that its strategy to improve results by shrinking itsovercrowded menu offered an attractive risk/reward opportunity given Brinker’s compelling valuation at the timeof our investment. We liquidated our position early in the second quarter of 2020 and reinvested proceeds fromthe sale in rebound opportunities we felt offered a better risk/reward.
• Designer Brands, Inc. operates the discount shoe chain DSW as well as some smaller brands. We invested in thecompany in the second quarter of 2019 when the stock was out of favor due to the impact of tariffs on the shoebusiness. We believed the valuation of less than eight times price-to-earnings offered attractive risk/rewardpotential given our thesis that shoes were a better segment of the retail industry to support brick-and-mortar
Meridian Contrarian FundPortfolio Performance and Composition (Unaudited) (continued)
Meridian Funds 10 www.meridianfund.com
stores than other areas of retail. We also felt DSW had a strong online strategy and that its vertical integrationefforts could significantly improve margins. Unfortunately, Designer Brand’s business and stock suffered severelydue to the economic impacts of the pandemic. We sold our shares to invest in areas where we believed we couldfind better risk/reward opportunities.
• Kennedy-Wilson Holdings, Inc. is a diversified real estate investment business that owns apartment and officeproperties in the Western U.S. and Ireland. It also provides real estate investment services to large investorsgenerating investment management fees. We invested in this company following substantial portfolio changes in2017 and 2018 that led to several quarters of disappointing earnings. Among these changes was the purchase ofapartments and development options in Ireland. However, we felt that the development pipeline of Kennedy-Wilson’s assets provides visibility to growth not reflected in the company’s valuation, which traded below a sum-of-the-parts market value of Kennedy-Wilson’s recurring cashflow. Investors have focused on simple recoverystories, and Kennedy-Wilson’s diversified real estate model has not garnered attention, despite resilient operationupdates. We believe Kennedy-Wilson has significant growth opportunities within its own control and that themarket does not appreciate this. The company raised roughly $700 million in capital prior to the COVID-19outbreak – equal to more than 15% of current asset-providing options. Management also announced aninvestment management partnership of $2 billion to assist investors in purchasing discounted real estate debt,driving investment fees for Kennedy-Wilson. The company’s properties remain very resilient, with second-quarter2020 rent collections in the mid-90%, in-line with pre-pandemic levels. We continue to believe Kennedy-Wilson’sstock trades at a discount to the current sum-of-parts on asset value of its owned properties. We maintained ourposition in the stock.
Outlook
With the course and duration of this coronavirus outbreak unknown, we expect that, through the remainder of the year, themarket will oscillate between concern about the pandemic and indifference. We also believe near-term corporate earningslikely will remain weak, but the effect of this weakness on the market could be blunted significantly by optimism regardingFederal Reserve activity. Our outlook is further clouded by uncertainty surrounding the upcoming presidential election.Macroeconomic influence on the market is always difficult to predict, and with these other exogenous factors we believethat is especially true currently.
Given this unpredictable outlook, we continue to focus on where our edge lies in investing in high quality companies whenthey are out of favor. Market volatility spurred by this uncertainty, however, has created investment opportunities that wemay not otherwise have seen. We have found and will continue to look for companies we call traditional turnaround stories,whose stocks are out of favor and inexpensive—especially now. In addition, we will also continue to selectively invest instocks that typically would be outside of our investment universe, but due to the recent volatility, are now deeplydiscounted and meet our strict investment criteria. In doing so, we remain focused on navigating through these volatilemarket conditions in seeking to deliver on the long-term investment goals of our investors.
Thank you for your continued trust and confidence.
Jamie England
Portfolio Manager
Meridian Contrarian FundPortfolio Performance and Composition (Unaudited) (continued)
Meridian Funds 11 www.meridianfund.com
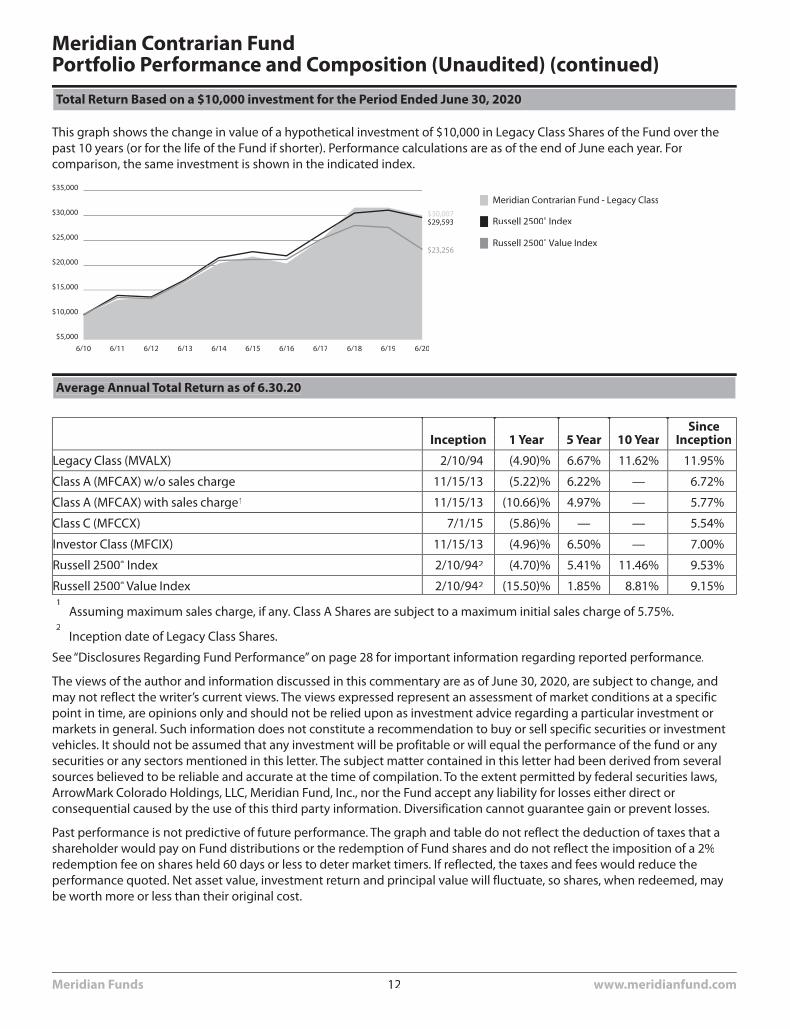
Total Return Based on a $10,000 investment for the Period Ended June 30, 2020
This graph shows the change in value of a hypothetical investment of $10,000 in Legacy Class Shares of the Fund over thepast 10 years (or for the life of the Fund if shorter). Performance calculations are as of the end of June each year. Forcomparison, the same investment is shown in the indicated index.
$5,000
$10,000
$15,000
$20,000
$25,000
$30,000
$35,000
$29,593
$23,256
Meridian Contrarian Fund - Legacy Class
Russell 2500® Index
Russell 2500® Value Index
6/116/10 6/206/18 6/196/176/166/156/146/136/12
$30,007
Average Annual Total Return as of 6.30.20
Inception 1 Year 5 Year 10 YearSince
Inception
Legacy Class (MVALX) 2/10/94 (4.90)% 6.67% 11.62% 11.95%
Class A (MFCAX) w/o sales charge 11/15/13 (5.22)% 6.22% — 6.72%
Class A (MFCAX) with sales charge1 11/15/13 (10.66)% 4.97% — 5.77%
Class C (MFCCX) 7/1/15 (5.86)% — — 5.54%
Investor Class (MFCIX) 11/15/13 (4.96)% 6.50% — 7.00%
Russell 2500® Index 2/10/942 (4.70)% 5.41% 11.46% 9.53%
Russell 2500® Value Index 2/10/942 (15.50)% 1.85% 8.81% 9.15%1
Assuming maximum sales charge, if any. Class A Shares are subject to a maximum initial sales charge of 5.75%.2
Inception date of Legacy Class Shares.
See “Disclosures Regarding Fund Performance” on page 28 for important information regarding reported performance.
The views of the author and information discussed in this commentary are as of June 30, 2020, are subject to change, andmay not reflect the writer’s current views. The views expressed represent an assessment of market conditions at a specificpoint in time, are opinions only and should not be relied upon as investment advice regarding a particular investment ormarkets in general. Such information does not constitute a recommendation to buy or sell specific securities or investmentvehicles. It should not be assumed that any investment will be profitable or will equal the performance of the fund or anysecurities or any sectors mentioned in this letter. The subject matter contained in this letter had been derived from severalsources believed to be reliable and accurate at the time of compilation. To the extent permitted by federal securities laws,ArrowMark Colorado Holdings, LLC, Meridian Fund, Inc., nor the Fund accept any liability for losses either direct orconsequential caused by the use of this third party information. Diversification cannot guarantee gain or prevent losses.
Past performance is not predictive of future performance. The graph and table do not reflect the deduction of taxes that ashareholder would pay on Fund distributions or the redemption of Fund shares and do not reflect the imposition of a 2%redemption fee on shares held 60 days or less to deter market timers. If reflected, the taxes and fees would reduce theperformance quoted. Net asset value, investment return and principal value will fluctuate, so shares, when redeemed, maybe worth more or less than their original cost.
Meridian Contrarian FundPortfolio Performance and Composition (Unaudited) (continued)
Meridian Funds 12 www.meridianfund.com
Top 10 Holdings as of 6.30.20
TreeHouse Foods, Inc. 3.64%
VICI Properties, Inc. 3.60%
Signature Bank 2.92%
Citizens Financial Group, Inc. 2.50%
TerraForm Power, Inc. Class A 2.44%
CACI International, Inc. Class A 2.36%
Perrigo Co. Plc 2.29%
Nuance Communications, Inc. 2.21%
Acadia Healthcare Co., Inc. 2.13%
Kennedy-Wilson Holdings, Inc. 2.11%
Portfolio holdings are subject to change and may notreflect the current or future position of the portfolio. Topten holdings excluding short-term investments arereported as a percentage of net assets.
Sector Allocation as of 6.30.20
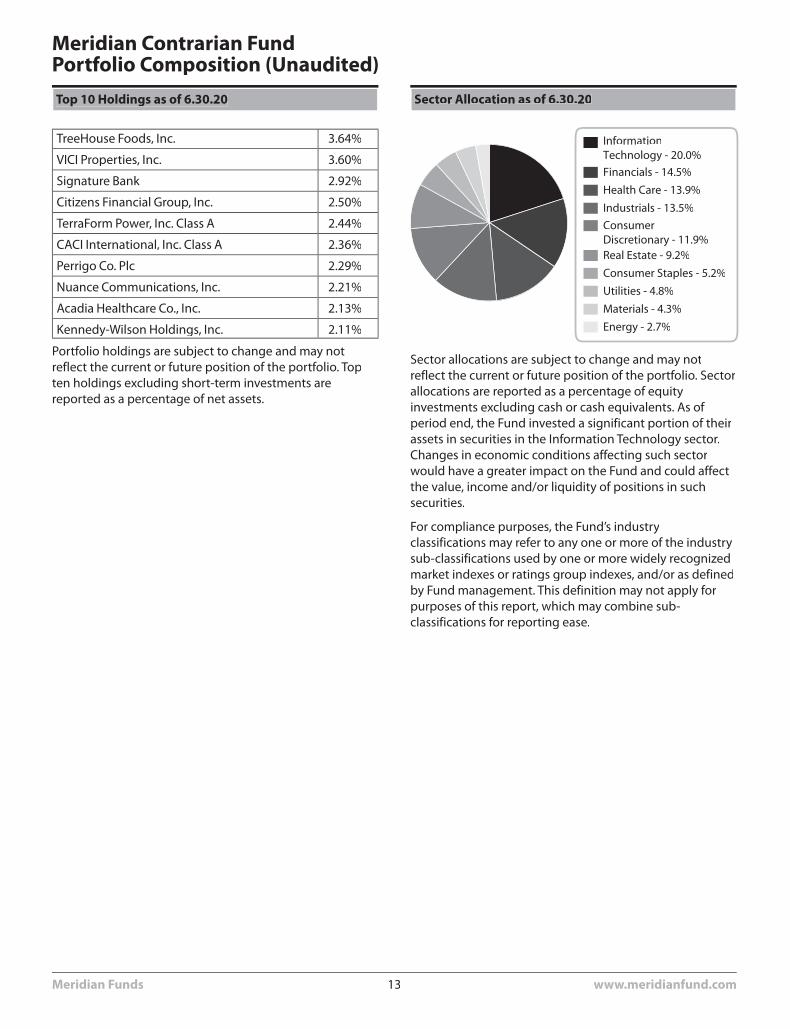
InformationTechnology - 20.0%
Health Care - 13.9%
Industrials - 13.5%
Financials - 14.5%
Real Estate - 9.2%
ConsumerDiscretionary - 11.9%
Consumer Staples - 5.2%
Utilities - 4.8%
Materials - 4.3%
Energy - 2.7%
Sector allocations are subject to change and may notreflect the current or future position of the portfolio. Sectorallocations are reported as a percentage of equityinvestments excluding cash or cash equivalents. As ofperiod end, the Fund invested a significant portion of theirassets in securities in the Information Technology sector.Changes in economic conditions affecting such sectorwould have a greater impact on the Fund and could affectthe value, income and/or liquidity of positions in suchsecurities.
For compliance purposes, the Fund’s industryclassifications may refer to any one or more of the industrysub-classifications used by one or more widely recognizedmarket indexes or ratings group indexes, and/or as definedby Fund management. This definition may not apply forpurposes of this report, which may combine sub-classifications for reporting ease.
Meridian Contrarian FundPortfolio Composition (Unaudited)
Meridian Funds 13 www.meridianfund.com
Market Overview
Through the latter half of 2019, equities extended their long bull run as the outlook for the global economy continued tobrighten. In the U.S., a more accommodative monetary policy helped keep the economy strong in the face of headwindsthat included a trade war between the U.S. and China. The year ended on a high note, with trade tension easing, corporateearnings surprising on the upside and one of the strongest U.S. jobs markets on record.
That all ended abruptly in late February and early March of 2020, as the novel coronavirus that originated in China began tospread globally, requiring quarantines that shut down economies. Stocks fell swiftly and severely, with U.S. equity marketsplummeting from their February peaks into bear market territory. Fueled by uncertainty and fear, stock market volatilityclimbed to the highest level on record, as measured by the CBOE Volatility Index (VIX).
In response to stay-at-home orders, businesses shuttered the doors, ultimately resulting in more than 40 million Americansfiling for unemployment. While the U.S. government passed a relief package for struggling Americans valued at nearly $3trillion, central bankers responded to the crisis with unprecedented fiscal and monetary stimulus. These and otherdevelopments, including declining COVID-19 infection rates and the reopening of economies, lifted investor confidence andspurred a strong rally in U.S. equity markets in the second quarter of 2020.
Against this backdrop, large-cap stocks outperformed both mid-caps and small-caps, as measured by the Russell family ofU.S. indices.
Fund Performance
The Meridian Enhanced Equity Fund (the "Fund") Legacy Class Shares advanced 15.86% (net) for the 12-month period endedJune 30, 2020, outperforming its benchmark, the S&P 500@ Index, which gained 7.51%.
Our investment process prioritizes the management of risk over the opportunity for return. We look to build an “enduring”portfolio that can mitigate capital losses during turbulent bear market environments and, secondarily, offer upsideparticipation during strong bull market environments. To achieve that, we seek out quality businesses maintainingconsiderable competitive advantages and healthy balance sheets that offer robust cash flow characteristics and mutedvolatility traits.
At any given time, roughly half of the Fund is invested in high quality, larger capitalization companies with promisinggrowth prospects. The balance of the portfolio is invested in equities hedged in a risk-managed approach where morepredictable stocks are married with options in an effort to reduce downside risks. Although an early-period portfoliomanagement change resulted in a recalibration of the Fund’s holdings with the aforementioned approach, every investmentdecision we made throughout the 12 months reflected our commitment to deep, fundamental research.
Top individual contributors during the period included Roku, Inc., NVIDIA Corp., and Apple, Inc.
• Roku, Inc. pioneered streaming television and benefited from consumers’ broad-based adoption of the medium.It’s success, however, drew others into the space and competitive pressures have built significantly. In weighingmarket conditions and the stock’s valuation, we realized profits and exited the position.
• Alternatively, we continue to hold NVIDIA Corp. and Apple, Inc., two industry leaders that have thrived throughthe pandemic. NVIDIA designs and sells graphics and video processing chips for desktop and notebook gamingpersonal computers, workstations, consoles, servers, and supercomputers. Additionally, a new partnership withMercedes validated NVIDIA’s full end-to-end solution for automakers and the company closed on its purchase ofnetworking technology firm Mellanox. As shelter-in-place and similar stay-at-home orders confined millions totheir homes, many sought computer upgrades to fulfill work-from-home responsibilities, improved gamingsystems for entertainment purposes, or both. As a key supplier of higher-end chip technology to both markets,the stock rallied and we selectively took profits as its valuation surged, but it remains a core position.
• So, too, does Apple, Inc., which produces premium personal electronics, software, and services. Possessingsignificant brand equity worldwide, the company’s broad portfolio of offerings is deeply embedded in customers’daily professional and leisure experiences, from watches to smartphones and from content subscription servicesto laptop computers. Throughout the period, Apple’s growth prospects were bolstered by strong product sales,
Meridian Enhanced Equity FundPortfolio Performance and Composition (Unaudited)
Meridian Funds 14 www.meridianfund.com
including the latest release in its iPhone franchise; double-digit growth in services revenue from platforms such asiCloud and Apple Music; and rising online sales in the wake of the pandemic-forced closure of its Apple stores.Additionally, anticipation of a 5G-based iPhone refresh later this year fueled interest in the stock.
The three largest detractors from the Fund’s performance during the period were California Resources Corp., Wells Fargo& Co., and Seritage Growth Properties.
• We see limited upside within the oil and gas industry going forward as most names in the space fail to fit our focuson well-capitalized cash-flow generators with a competitive advantage. Our related aversion to commodity-basedbusinesses and highly leveraged balance sheets prompted an exit from lead detractor California ResourcesCorp., an oil and gas exploration and drilling company operating exclusively in California.
• A laggard that we’re standing by is Wells Fargo & Co., a diversified financial services company that struggled withexternal and internal pressures. In addition to contending with near 0% interest rates and the evolving falloutfrom the abrupt economic contraction, company management embarked on the arduous process of emergingfrom increased regulatory scrutiny and, late in the period, cut its dividend. Nonetheless, we believe in the currentleadership’s ability to turn the company around, the firm’s relatively strong capital levels, and its discount totangible book value, in addition to the mission critical nature of the banking industry.
• Amid the COVID-19 pandemic, challenges to traditional brick-and-mortar retailers compounded, whichcontributed to our decision to liquidate our stake in another detractor, Seritage Growth Properties. The REIT,which owns commercial real estate that targets retail tenants, operates a compelling portfolio repositioningstrategy that we continue to like for longer-term prospects. Uncertainties in the near-term, however, areabundant, so we exited the position and reallocated the proceeds into opportunities with more attractiverisk/reward profiles.
Given our company-specific focus, we maintain a sector-agnostic philosophy in the management of the Fund. Therefore,changes in sector weightings at any point during a period largely reflect the performance of underlying holdings andinvestment decisions made to strike the optimal balance between the two portions of the portfolio.
Outlook
In the final days of the period, COVID-19 infection rates began to spike in certain parts of the country, suggesting thev-shaped economic recovery that investors had hoped for may be elusive and raising the question about whether additionalfiscal and monetary stimulus may be needed. Given expectations that the current stimulus package will have fully worked itsway into the economy by September, the course of economic growth should be clearer at that point. Our approach in thisuncertain environment remains unchanged: as we continue to focus on businesses with predictable and recurring revenuestreams, improving margins, strong competitive advantages, and growing market opportunities.
Now more than ever, we maintain strong conviction in the companies we own. Our focus remains on companies that cannot only weather the recent market volatility, but also emerge even stronger once the recessionary clouds clear. Themarket’s correction and subsequent rebound has presented us with opportunities to continue to upgrade the quality of theFund, while maintaining our strict valuation discipline. Although recent economic events are unprecedented, we remainconfident that staying disciplined to our investment process is the best approach to achieve the strategy’s long-terminvestment objectives.
Thank you for your continued trust and confidence.
Clay Freeman
Portfolio Manager
Meridian Enhanced Equity FundPortfolio Performance and Composition (Unaudited) (continued)
Meridian Funds 15 www.meridianfund.com

Total Return Based on a $10,000 investment for the Period Ended June 30, 2020
This graph shows the change in value of a hypothetical investment of $10,000 in Legacy Class Shares of the Fund over thepast 10 years (or for the life of the Fund if shorter). Performance calculations are as of the end of June each year. Forcomparison, the same investment is shown in the indicated index.
$5,000
$10,000
$15,000
$20,000
$25,000
$30,000
$40,000
$35,000Meridian Enhanced Equity Fund - Legacy Class
S&P 500® Index
6/116/10 6/206/18 6/196/176/166/156/146/136/12
$39,708
$37,031
Average Annual Total Return as of 6.30.20
Inception 1 Year 5 Year 10 YearSince
Inception
Legacy Class (MEIFX) 1/31/05 15.86% 15.33% 14.79% 9.78%
Class A (MRAEX) w/o sales charge 11/15/13 15.39% 14.91% — 12.86%
Class A (MRAEX) with sales charge1 11/15/13 8.74% 13.56% — 11.85%
Class C (MRCEX) 7/1/15 15.08% — — 14.35%
Investor Class (MRIEX) 11/15/13 15.65% 15.16% — 13.11%
S&P 500® Index 1/31/052 7.51% 10.73% 13.99% 8.70%1
Assuming maximum sales charge, if any. Class A Shares are subject to a maximum initial sales charge of 5.75%.2
Inception date of Legacy Class Shares.
See “Disclosures Regarding Fund Performance” on page 28 for important information regarding reported performance.
The views of the author and information discussed in this commentary are as of June 30, 2020, are subject to change, andmay not reflect the writer’s current views. The views expressed represent an assessment of market conditions at a specificpoint in time, are opinions only and should not be relied upon as investment advice regarding a particular investment ormarkets in general. Such information does not constitute a recommendation to buy or sell specific securities or investmentvehicles. It should not be assumed that any investment will be profitable or will equal the performance of the fund or anysecurities or any sectors mentioned in this letter. The subject matter contained in this letter had been derived from severalsources believed to be reliable and accurate at the time of compilation. To the extent permitted by federal securities laws,ArrowMark Colorado Holdings, LLC, Meridian Fund, Inc., nor the Fund accept any liability for losses either direct orconsequential caused by the use of this third party information. Diversification cannot guarantee gain or prevent losses.
Past performance is not predictive of future performance. The graph and table do not reflect the deduction of taxes that ashareholder would pay on Fund distributions or the redemption of Fund shares and do not reflect the imposition of a 2%redemption fee on shares held 60 days or less to deter market timers. If reflected, the taxes and fees would reduce theperformance quoted. Net asset value, investment return and principal value will fluctuate, so shares, when redeemed, maybe worth more or less than their original cost.
Meridian Enhanced Equity FundPortfolio Performance and Composition (Unaudited) (continued)
Meridian Funds 16 www.meridianfund.com
Top 10 Holdings as of 6.30.20
Snap, Inc. Class A 9.07%
Chewy, Inc. Class A 5.23%
LogMeIn, Inc. 4.12%
Huntsman Corp. 3.82%
Apple, Inc. 3.52%
Amazon.com, Inc. 3.52%
Pinterest, Inc. Class A 3.42%
GCI Liberty, Inc. Class A 3.34%
Hanesbrands, Inc. 3.27%
Microsoft Corp. 3.22%
Portfolio holdings are subject to change and may notreflect the current or future position of the portfolio. Topten holdings excluding short-term and options writteninvestments are reported as a percentage of net assets.
Sector Allocation as of 6.30.20
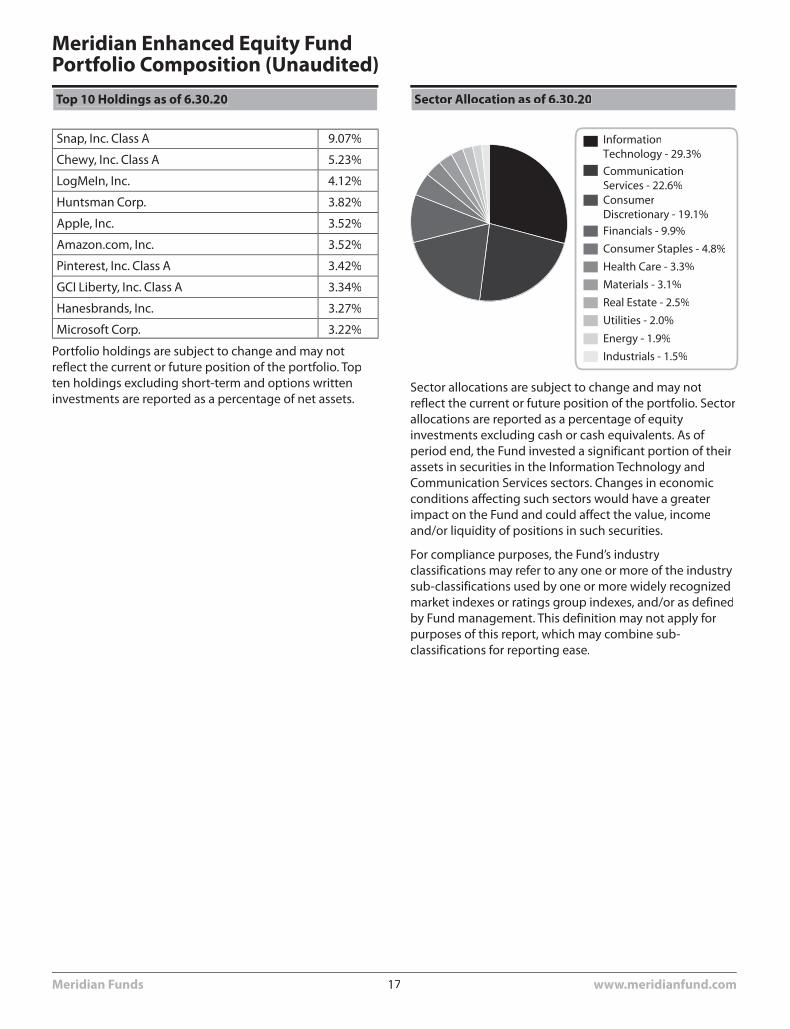
InformationTechnology - 29.3%
CommunicationServices - 22.6%ConsumerDiscretionary - 19.1%
Financials - 9.9%
Consumer Staples - 4.8%
Health Care - 3.3%
Materials - 3.1%
Real Estate - 2.5%
Utilities - 2.0%
Energy - 1.9%
Industrials - 1.5%
Sector allocations are subject to change and may notreflect the current or future position of the portfolio. Sectorallocations are reported as a percentage of equityinvestments excluding cash or cash equivalents. As ofperiod end, the Fund invested a significant portion of theirassets in securities in the Information Technology andCommunication Services sectors. Changes in economicconditions affecting such sectors would have a greaterimpact on the Fund and could affect the value, incomeand/or liquidity of positions in such securities.
For compliance purposes, the Fund’s industryclassifications may refer to any one or more of the industrysub-classifications used by one or more widely recognizedmarket indexes or ratings group indexes, and/or as definedby Fund management. This definition may not apply forpurposes of this report, which may combine sub-classifications for reporting ease.
Meridian Enhanced Equity FundPortfolio Composition (Unaudited)
Meridian Funds 17 www.meridianfund.com
Market Overview
Through the latter half of 2019, equities extended their long bull run as the outlook for the global economy continued tobrighten. In the U.S., a more accommodative monetary policy helped keep the economy strong in the face of headwindsthat included a trade war between the U.S. and China. The year ended on a high note, with trade tension easing, corporateearnings surprising on the upside, and one of the strongest U.S. jobs markets on record.
That all ended abruptly in late February and early March of 2020, as the novel coronavirus that originated in China began tospread globally, requiring quarantines that shut down economies. Stocks fell swiftly and severely, with U.S. equity marketsplummeting from their February peaks into bear market territory. Fueled by uncertainty and fear, the CBOE Volatility Index(VIX), a benchmark for stock market volatility, closed at the highest level on record in mid-March.
In response to stay-at-home orders, businesses shuttered their doors, ultimately resulting in more than 40 million Americansfiling for unemployment. While the U.S. government passed a relief package for struggling Americans valued at nearly $3trillion, central bankers responded to the crisis with unprecedented fiscal and monetary stimulus. These and otherdevelopments, including declining COVID-19 infection rates and the reopening of economies, lifted investor confidence andspurred a strong rally in U.S. equity markets in the second quarter of 2020.
Against this backdrop, large-cap stocks outperformed both mid-caps and small-caps, as measured by the Russell family ofU.S. indices. In addition, growth stocks continued to outperform value stocks by a wide margin across the capitalizationspectrum.
Fund Performance
The Meridian Small Cap Growth Fund (the “Fund”) Legacy Class Shares returned -1.17% (net) during the 12-months endedJune 30, 2020, underperforming its benchmark, the Russell 2000® Growth Index, which returned 3.48%.
Our investment process prioritizes the management of risk over the opportunity for return. We look to build an “enduring”fund that can mitigate capital losses during turbulent bear market environments and, secondarily, participate on the upsideduring strong market environments. During the period, volatility increased significantly. In fact, there were 30 days in whichthe index dropped 2% or more, well above the historical average. Performance was mixed during these down days, asgrowth outperformed value twice as often as is historically normal, a surprising development which provided a headwind toperformance due to the Fund’s more valuation-sensitive approach.
Weak stock selection within the industrials, communication services, and consumer discretionary sectors detracted from theFund’s relative results. Alternately, our holdings in the healthcare and information technology sectors were the largestcontributors to gains.
Many of the same factors we have discussed in recent communications continued to work against us during the period,including investors’ preference for large-cap stocks. For example, in the Russell 2000® Growth Index, the top quintile marketcap of the index appreciated approximately 85.7%, versus an approximate -33.5% decline for the lowest quintile. Anotherunfavorable trend that created headwinds for the Fund was investors’ bias toward more growth-oriented companies. In fact,the Russell 2000® Growth Index appreciated 3.48% during the period, versus the Russell 2000® Value Index which declined-17.48%, resulting in growth outperforming value by 2,096 basis points. The Russell 2000® Growth Index has nowoutperformed the Russell 2000® Value Index over the trailing quarter, 1-year, 3-year, 5-year, and 10-year periods. Given ourfocus on valuation, this trend has worked against us.
The three largest detractors from the Fund’s performance were PlayAGS, Inc., Cinemark Holdings, Inc., and Heritage-Crystal Clean, Inc.
• PlayAGS, Inc. is a designer and supplier of slot machines and other gaming hardware for the gaming industry.Among the many things we like about this company are its seasoned management team, extensive gaminghardware design experience and the recurring revenue generated through the gaming devices it sells tocustomers. After going public in 2018, PlayAGS exceeded earnings estimates and raised guidance for severalconsecutive quarters and consistently improved its market share position. However, the closure of casinos andother businesses in an attempt to slow COVID-19 infections led to a steep decline in revenues for the company.More recently, regional casinos have started to reopen and pent-up demand is resulting in high traffic at many
Meridian Small Cap Growth FundPortfolio Performance and Composition (Unaudited)
Meridian Funds 18 www.meridianfund.com
casinos. We are optimistic that, as people become more comfortable returning to their routines, this trend willcontinue. We are also encouraged by steps PlayAGS has taken to improve liquidity, including financing its debtand reducing its cash burn. During the period, we maintained our position in the company, however it is muchsmaller than it was at the beginning of the fiscal year.
• Cinemark Holdings, Inc. is a leader in the U.S. motion picture exhibition industry. Prior to the COVID-19 outbreak,the company had outperformed the North American theater industry for 39 of the past 44 quarters,demonstrating the value of Cinemark’s high-quality circuit. The company’s strong balance sheet compared to itscompetitors has enabled it to make theater upgrades that enhance the moviegoing experience and should act asa competitive advantage during today’s challenging times. Quarantine directives forced Cinemark to close all itstheaters in the first quarter of 2020. We believe Cinemark is one of the best positioned theater companies toweather COVID-19 and expect the company to resume its track record of gaining share when theaters are allowedto reopen. Similar to PlayAGS, we maintained our position in the company, however it is much smaller than it wasat the beginning of the period.
• Heritage-Crystal Clean, Inc. is an environmental services company focused on parts cleaning, used oil collection,oil re-refining, and hazardous and non-hazardous waste services. Our rationale for investing in this companyincludes the strong recurring revenue stream it generates and substantial growth opportunities in the re-refineryand used oil collection segments. During the period, the stock was hurt by declining oil prices, which plummetedbelow zero in April, and COVID-19-related quarantines. As stay-at-home directives reduced miles driven across thenation, fewer people utilized maintenance shops which negatively impacted Heritage-Crystal Clean’s partscleaning and used oil collection businesses. Although oil prices have recovered from April’s low and quarantineshave begun to ease, we expect there will be a lag between these improving trends and demand for the company’sparts cleaning and used oil collection services. Nonetheless, we think Heritage-Crystal Clean’s healthy balancesheet and large recurring revenue stream will allow it to return to prior growth rates and profitability levels. Weadded to our position in the stock on this temporary setback.
The three largest contributors to the Fund’s performance during the period were Forte Biosciences, Inc., Kodiak Sciences,Inc., and Quidel Corp.
• Forte Biosciences, Inc. is a clinical-stage biopharmaceutical firm focused on the treatment of inflammatory skindiseases, particularly atopic dermatitis. We purchased the restricted stock of the company when it was still aprivately held corporation. We were optimistic about Phase 1/2a clinical trial results for its lead drug candidateFB-401, a live biotherapeutic being developed as a topical therapy for inflammatory skin diseases in adults andchildren. While the trial showed statistically significant improvement in patients, regulatory approval and apotential commercial launch of the drug will require Forte to run a placebo-controlled trial. The company securedfunding for additional trials for FB-401 and to advance its product pipeline through a reverse merger with publiclyheld biotech firm Tocagen. The all-stock transaction was completed in June, resulting in Forte becoming a publiclyheld corporation and sending shares of Forte higher.
• Kodiak Sciences, Inc. is a biopharmaceutical company focused on the development of therapeutics to treatophthalmic diseases. We established a position in the stock based on our optimism for KSI-301, an investigationaldrug developed for the treatment of wet AMD, diabetic macular edema, and retinal vein occlusion. Althoughsimilar therapies are available, studies indicate that KSI-301 is equally effective yet requires only three intravitrealinjections (into the eye) versus six, which is the current standard of care. Continued optimism for the experimentaldrug prompted investors to bid Kodiak’s shares higher during the period. The stock received an additional boostfrom Kodiak’s announcement that it is selling royalty rights on potential global net sales for KSI-301, which putsKodiak in a solid financial position to continue advancing its clinical programs. With an addressable market inexcess of $10B, we see a significant revenue opportunity for KSI-301 and therefore remain confident in ourinvestment in Kodiak. During the period, we trimmed our position in Kodiak as the company appreciatedsignificantly.
• Quidel Corp., is a developer of rapid diagnostic testing solutions which generates most of its revenue from point-of-care tests. Its QuickVue flu tests allow for the fast, qualitative detection of influenza type A and type B, andstreptococcus. Since receiving FDA Emergency Use Authorization for its COVID-19 detection test in the firstquarter, Quidel has seen strong demand for the test, leading to better-than-expected quarterly revenue andprofits. News that the company is ramping up to one million tests per week fueled share strength during the
Meridian Small Cap Growth FundPortfolio Performance and Composition (Unaudited) (continued)
Meridian Funds 19 www.meridianfund.com
period. At this pace, Quidel could see an incremental $700 million to $1 billion in revenue on a trailing 12-monthbasis, essentially doubling its revenue. We continue to see strong potential growth for revenue and profits goingforward, and subsequently maintained our position in the stock.
Outlook
In the final days of the period, COVID-19 infection rates began to spike in certain parts of the country, suggesting thev-shaped economic recovery that investors had hoped for may be elusive and raising the question about whether additionalfiscal and monetary stimulus may be needed. Given expectations that the current stimulus package will have fully worked itsway into the economy by September, the course of economic growth should be clearer at that point. Our approach in thisuncertain environment remains unchanged: as we continue to focus on businesses with predictable and recurring revenuestreams, improving margins, strong competitive advantages, and growing market opportunities.
Now more than ever, we maintain strong conviction in the companies we own. Our focus remains on companies that cannot only weather the recent market volatility but also emerge even stronger once the recessionary clouds clear. The market’scorrection and subsequent rebound has presented us with opportunities to continue to upgrade the quality of the Fundwhile maintaining our strict valuation discipline. Although recent economic events are unprecedented, we remain confidentthat staying disciplined to our investment process is the best approach to achieve the strategy’s long-term investmentobjectives.
Thank you for your continued trust and confidence.
Brian Schaub & Chad Meade
Co-Portfolio Managers
Meridian Small Cap Growth FundPortfolio Performance and Composition (Unaudited) (continued)
Meridian Funds 20 www.meridianfund.com
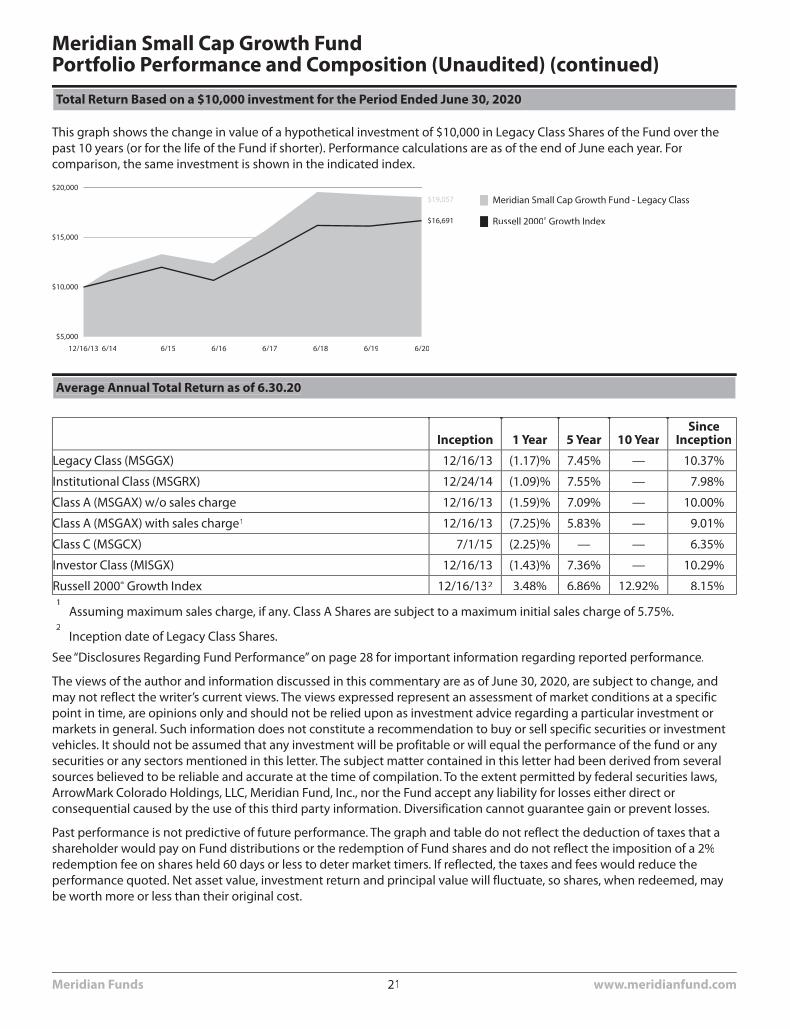
Total Return Based on a $10,000 investment for the Period Ended June 30, 2020
This graph shows the change in value of a hypothetical investment of $10,000 in Legacy Class Shares of the Fund over thepast 10 years (or for the life of the Fund if shorter). Performance calculations are as of the end of June each year. Forcomparison, the same investment is shown in the indicated index.
$5,000
$10,000
$15,000
$20,000
$16,691
Meridian Small Cap Growth Fund - Legacy Class
Russell 2000® Growth Index
6/1412/16/13 6/206/18 6/196/176/166/15
$19,057
Average Annual Total Return as of 6.30.20
Inception 1 Year 5 Year 10 YearSince
Inception
Legacy Class (MSGGX) 12/16/13 (1.17)% 7.45% — 10.37%
Institutional Class (MSGRX) 12/24/14 (1.09)% 7.55% — 7.98%
Class A (MSGAX) w/o sales charge 12/16/13 (1.59)% 7.09% — 10.00%
Class A (MSGAX) with sales charge1 12/16/13 (7.25)% 5.83% — 9.01%
Class C (MSGCX) 7/1/15 (2.25)% — — 6.35%
Investor Class (MISGX) 12/16/13 (1.43)% 7.36% — 10.29%
Russell 2000® Growth Index 12/16/132 3.48% 6.86% 12.92% 8.15%1
Assuming maximum sales charge, if any. Class A Shares are subject to a maximum initial sales charge of 5.75%.2
Inception date of Legacy Class Shares.
See “Disclosures Regarding Fund Performance” on page 28 for important information regarding reported performance.
The views of the author and information discussed in this commentary are as of June 30, 2020, are subject to change, andmay not reflect the writer’s current views. The views expressed represent an assessment of market conditions at a specificpoint in time, are opinions only and should not be relied upon as investment advice regarding a particular investment ormarkets in general. Such information does not constitute a recommendation to buy or sell specific securities or investmentvehicles. It should not be assumed that any investment will be profitable or will equal the performance of the fund or anysecurities or any sectors mentioned in this letter. The subject matter contained in this letter had been derived from severalsources believed to be reliable and accurate at the time of compilation. To the extent permitted by federal securities laws,ArrowMark Colorado Holdings, LLC, Meridian Fund, Inc., nor the Fund accept any liability for losses either direct orconsequential caused by the use of this third party information. Diversification cannot guarantee gain or prevent losses.
Past performance is not predictive of future performance. The graph and table do not reflect the deduction of taxes that ashareholder would pay on Fund distributions or the redemption of Fund shares and do not reflect the imposition of a 2%redemption fee on shares held 60 days or less to deter market timers. If reflected, the taxes and fees would reduce theperformance quoted. Net asset value, investment return and principal value will fluctuate, so shares, when redeemed, maybe worth more or less than their original cost.
Meridian Small Cap Growth FundPortfolio Performance and Composition (Unaudited) (continued)
Meridian Funds 21 www.meridianfund.com
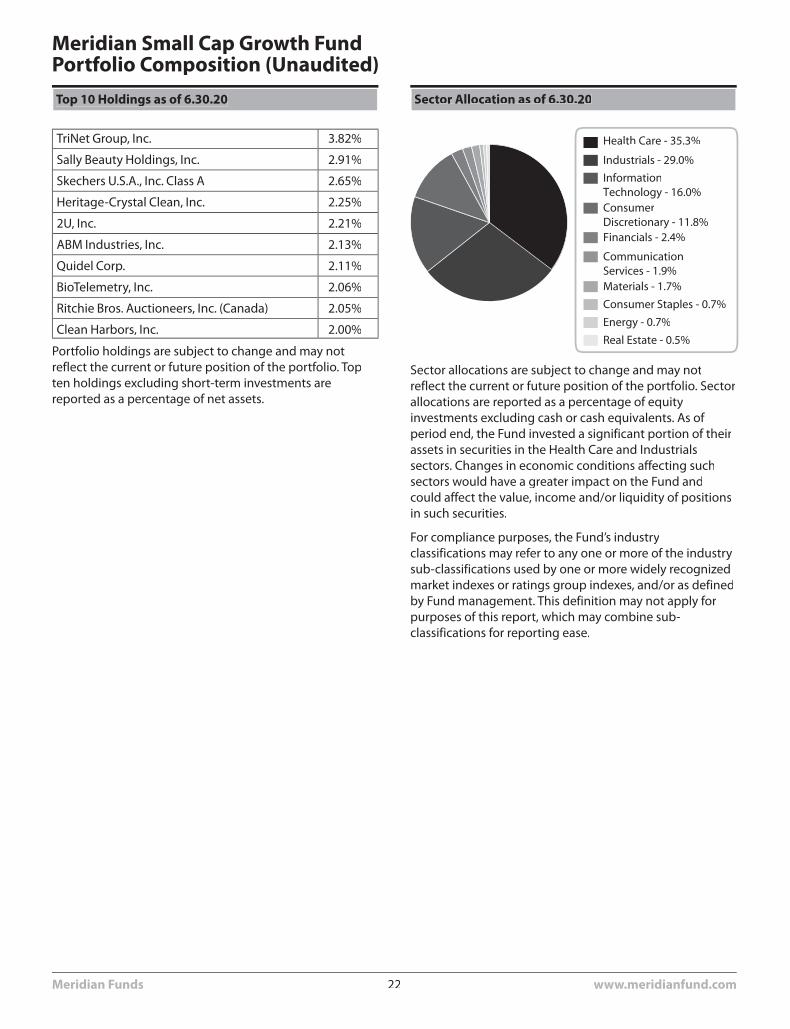
Top 10 Holdings as of 6.30.20
TriNet Group, Inc. 3.82%
Sally Beauty Holdings, Inc. 2.91%
Skechers U.S.A., Inc. Class A 2.65%
Heritage-Crystal Clean, Inc. 2.25%
2U, Inc. 2.21%
ABM Industries, Inc. 2.13%
Quidel Corp. 2.11%
BioTelemetry, Inc. 2.06%
Ritchie Bros. Auctioneers, Inc. (Canada) 2.05%
Clean Harbors, Inc. 2.00%
Portfolio holdings are subject to change and may notreflect the current or future position of the portfolio. Topten holdings excluding short-term investments arereported as a percentage of net assets.
Sector Allocation as of 6.30.20
Health Care - 35.3%
InformationTechnology - 16.0%ConsumerDiscretionary - 11.8%
Industrials - 29.0%
CommunicationServices - 1.9%
Financials - 2.4%
Materials - 1.7%
Consumer Staples - 0.7%
Energy - 0.7%
Real Estate - 0.5%
Sector allocations are subject to change and may notreflect the current or future position of the portfolio. Sectorallocations are reported as a percentage of equityinvestments excluding cash or cash equivalents. As ofperiod end, the Fund invested a significant portion of theirassets in securities in the Health Care and Industrialssectors. Changes in economic conditions affecting suchsectors would have a greater impact on the Fund andcould affect the value, income and/or liquidity of positionsin such securities.
For compliance purposes, the Fund’s industryclassifications may refer to any one or more of the industrysub-classifications used by one or more widely recognizedmarket indexes or ratings group indexes, and/or as definedby Fund management. This definition may not apply forpurposes of this report, which may combine sub-classifications for reporting ease.
Meridian Small Cap Growth FundPortfolio Composition (Unaudited)
Meridian Funds 22 www.meridianfund.com
Meridian Fund, Inc.Expense DisclosureJune 30, 2020 (Unaudited)
Disclosures Regarding Fund Expenses
Example
As a shareholder of the Fund, you incur two types of costs: (1) transaction costs, including sales charges (loads) on purchasepayments, reinvested dividends, or other distributions; redemption fees; and (2) ongoing costs, including management fees;service and distribution (12b-1) fees; and other Fund expenses. This Example is intended to help you understand yourongoing costs (in dollars) of investing in the Fund and to compare these costs with the ongoing costs of investing in othermutual funds.
The Example is based on an investment of $1,000 invested at the beginning of the period and held for the entire period ofJanuary 1, 2020 through June 30, 2020.
Actual Expenses
The first table below provides information about actual account values and actual expenses. You may use the information inthis table, together with the amount you invested, to estimate the expenses that you paid over the period. Simply divideyour account value by $1,000 (e.g., an $8,600 account value divided by $1,000 = 8.6), then multiply the result by the numberreported under “Expenses Paid During the Period” to estimate the expenses you paid on your account during this period.
Hypothetical Example for Comparison Purposes
The second table below provides information about hypothetical account values and hypothetical expenses based on theFund’s actual expense ratio and an assumed rate of return of 5% per year before expenses, which is not the Fund’s actualreturn. The hypothetical account values and expenses may not be used to estimate the actual ending account balance orexpenses you paid for the period. You may use this information to compare the ongoing costs of investing in the Fund andother funds. To do so, compare this 5% hypothetical example with the 5% hypothetical examples that appear in theshareholder reports of the other funds.
Please note that the expenses shown in the tables are meant to highlight your ongoing costs only and do not reflect anytransactional costs, such as sales charges (loads) or redemption fees. Therefore, the second table is useful in comparingongoing costs only, and will not help you determine the relative total costs of owning different funds. In addition, if thesetransactional costs were included, your costs would have been higher.
Meridian Funds 23 www.meridianfund.com
Meridian Growth FundFund ExpensesJune 30, 2020 (Unaudited)
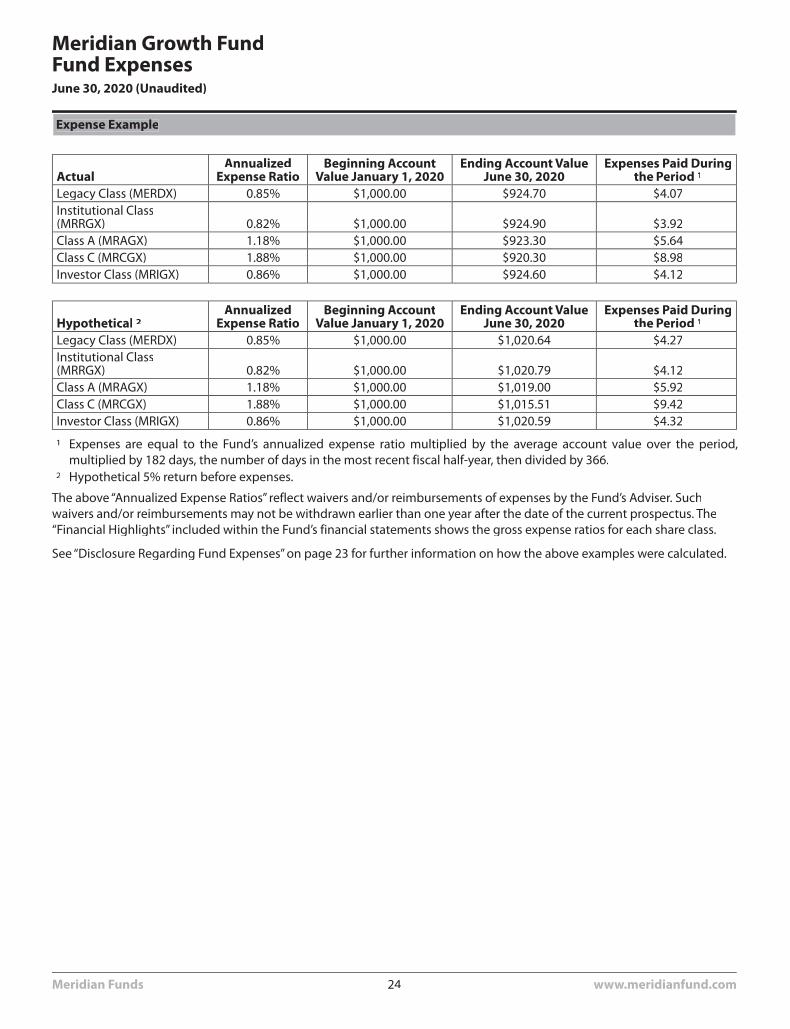
Expense Example
ActualAnnualized
Expense RatioBeginning Account
Value January 1, 2020Ending Account Value
June 30, 2020Expenses Paid During
the Period 1
Legacy Class (MERDX) 0.85% $1,000.00 $924.70 $4.07Institutional Class(MRRGX) 0.82% $1,000.00 $924.90 $3.92Class A (MRAGX) 1.18% $1,000.00 $923.30 $5.64Class C (MRCGX) 1.88% $1,000.00 $920.30 $8.98Investor Class (MRIGX) 0.86% $1,000.00 $924.60 $4.12
Hypothetical 2Annualized
Expense RatioBeginning Account
Value January 1, 2020Ending Account Value
June 30, 2020Expenses Paid During
the Period 1
Legacy Class (MERDX) 0.85% $1,000.00 $1,020.64 $4.27Institutional Class(MRRGX) 0.82% $1,000.00 $1,020.79 $4.12Class A (MRAGX) 1.18% $1,000.00 $1,019.00 $5.92Class C (MRCGX) 1.88% $1,000.00 $1,015.51 $9.42Investor Class (MRIGX) 0.86% $1,000.00 $1,020.59 $4.32
1 Expenses are equal to the Fund’s annualized expense ratio multiplied by the average account value over the period,multiplied by 182 days, the number of days in the most recent fiscal half-year, then divided by 366.
2 Hypothetical 5% return before expenses.
The above “Annualized Expense Ratios” reflect waivers and/or reimbursements of expenses by the Fund’s Adviser. Suchwaivers and/or reimbursements may not be withdrawn earlier than one year after the date of the current prospectus. The“Financial Highlights” included within the Fund’s financial statements shows the gross expense ratios for each share class.
See “Disclosure Regarding Fund Expenses” on page 23 for further information on how the above examples were calculated.
Meridian Funds 24 www.meridianfund.com
Meridian Contrarian FundFund ExpensesJune 30, 2020 (Unaudited)
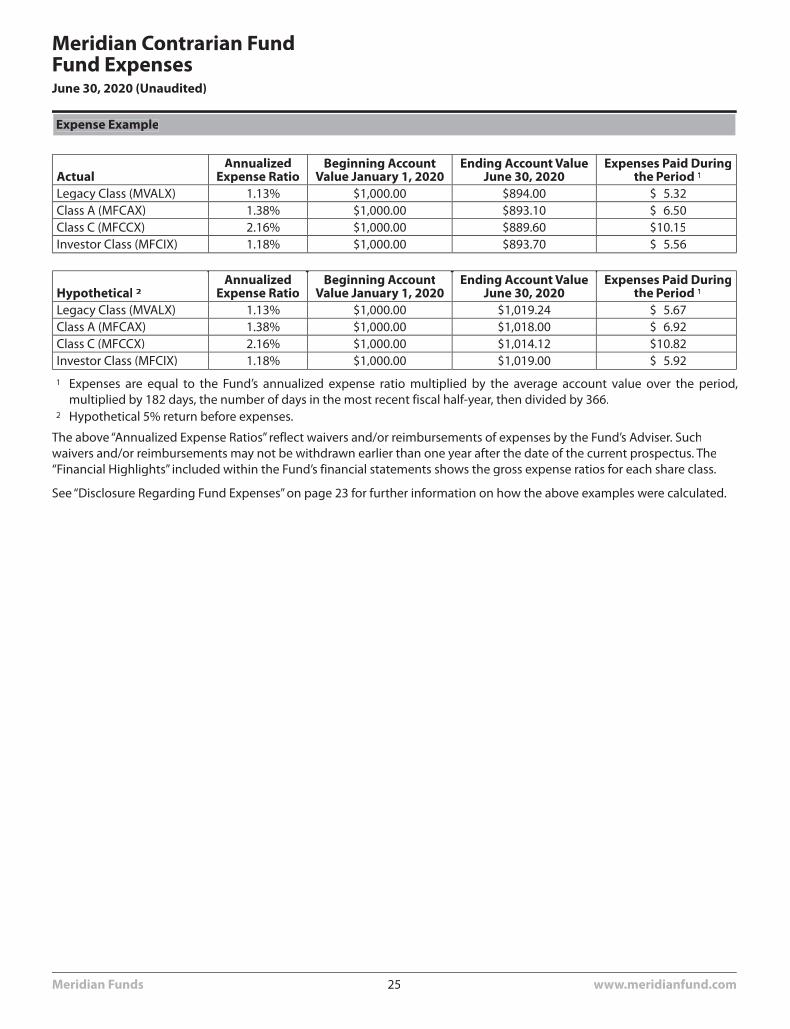
Expense Example
ActualAnnualized
Expense RatioBeginning Account
Value January 1, 2020Ending Account Value
June 30, 2020Expenses Paid During
the Period 1
Legacy Class (MVALX) 1.13% $1,000.00 $894.00 $ 5.32Class A (MFCAX) 1.38% $1,000.00 $893.10 $ 6.50Class C (MFCCX) 2.16% $1,000.00 $889.60 $10.15Investor Class (MFCIX) 1.18% $1,000.00 $893.70 $ 5.56
Hypothetical 2Annualized
Expense RatioBeginning Account
Value January 1, 2020Ending Account Value
June 30, 2020Expenses Paid During
the Period 1
Legacy Class (MVALX) 1.13% $1,000.00 $1,019.24 $ 5.67Class A (MFCAX) 1.38% $1,000.00 $1,018.00 $ 6.92Class C (MFCCX) 2.16% $1,000.00 $1,014.12 $10.82Investor Class (MFCIX) 1.18% $1,000.00 $1,019.00 $ 5.92
1 Expenses are equal to the Fund’s annualized expense ratio multiplied by the average account value over the period,multiplied by 182 days, the number of days in the most recent fiscal half-year, then divided by 366.
2 Hypothetical 5% return before expenses.
The above “Annualized Expense Ratios” reflect waivers and/or reimbursements of expenses by the Fund’s Adviser. Suchwaivers and/or reimbursements may not be withdrawn earlier than one year after the date of the current prospectus. The“Financial Highlights” included within the Fund’s financial statements shows the gross expense ratios for each share class.
See “Disclosure Regarding Fund Expenses” on page 23 for further information on how the above examples were calculated.
Meridian Funds 25 www.meridianfund.com
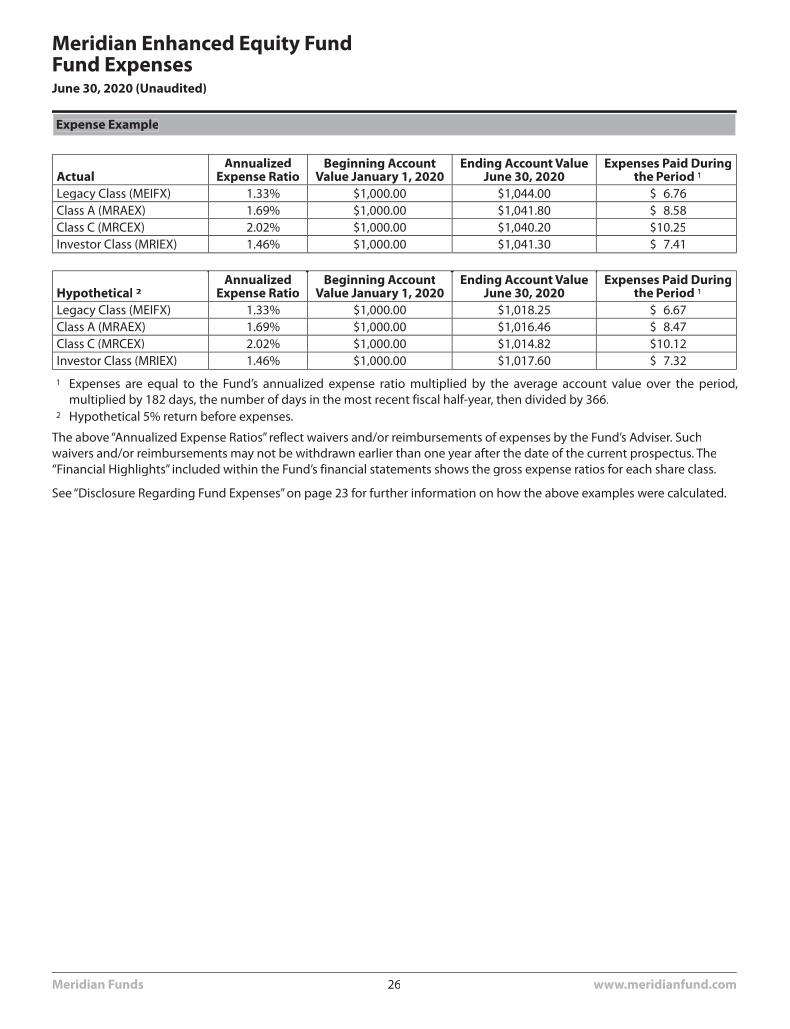
Meridian Enhanced Equity FundFund ExpensesJune 30, 2020 (Unaudited)
Expense Example
ActualAnnualized
Expense RatioBeginning Account
Value January 1, 2020Ending Account Value
June 30, 2020Expenses Paid During
the Period 1
Legacy Class (MEIFX) 1.33% $1,000.00 $1,044.00 $ 6.76Class A (MRAEX) 1.69% $1,000.00 $1,041.80 $ 8.58Class C (MRCEX) 2.02% $1,000.00 $1,040.20 $10.25Investor Class (MRIEX) 1.46% $1,000.00 $1,041.30 $ 7.41
Hypothetical 2Annualized
Expense RatioBeginning Account
Value January 1, 2020Ending Account Value
June 30, 2020Expenses Paid During
the Period 1
Legacy Class (MEIFX) 1.33% $1,000.00 $1,018.25 $ 6.67Class A (MRAEX) 1.69% $1,000.00 $1,016.46 $ 8.47Class C (MRCEX) 2.02% $1,000.00 $1,014.82 $10.12Investor Class (MRIEX) 1.46% $1,000.00 $1,017.60 $ 7.32
1 Expenses are equal to the Fund’s annualized expense ratio multiplied by the average account value over the period,multiplied by 182 days, the number of days in the most recent fiscal half-year, then divided by 366.
2 Hypothetical 5% return before expenses.
The above “Annualized Expense Ratios” reflect waivers and/or reimbursements of expenses by the Fund’s Adviser. Suchwaivers and/or reimbursements may not be withdrawn earlier than one year after the date of the current prospectus. The“Financial Highlights” included within the Fund’s financial statements shows the gross expense ratios for each share class.
See “Disclosure Regarding Fund Expenses” on page 23 for further information on how the above examples were calculated.
Meridian Funds 26 www.meridianfund.com
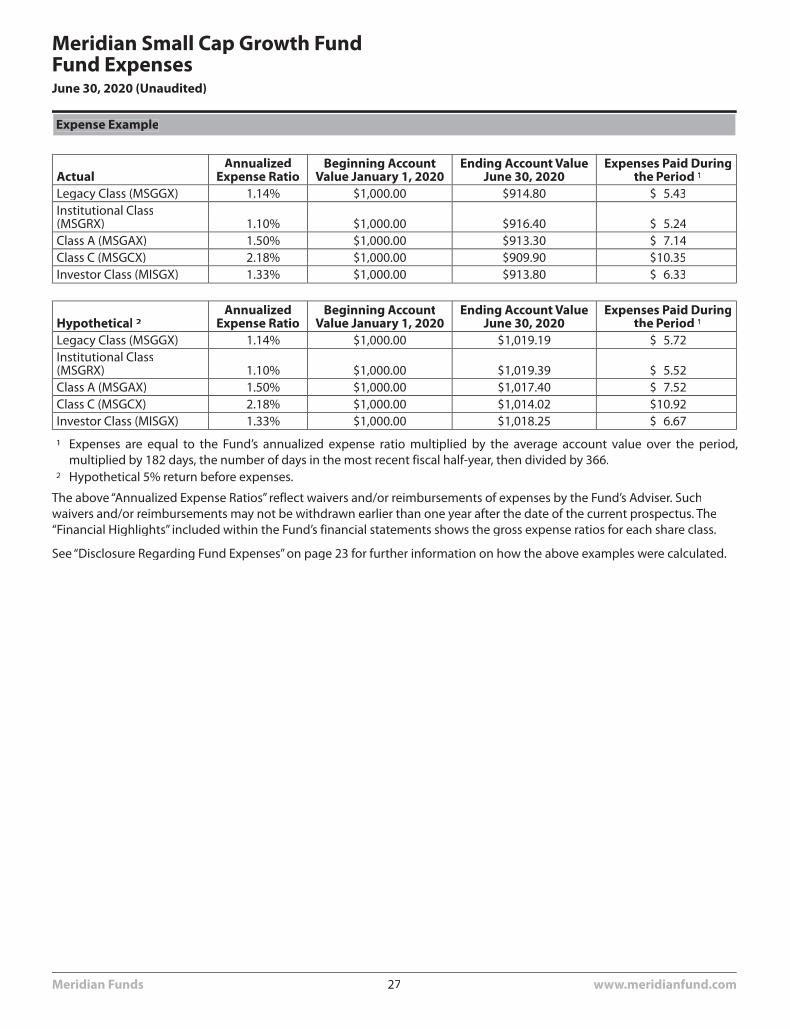
Meridian Small Cap Growth FundFund ExpensesJune 30, 2020 (Unaudited)
Expense Example
ActualAnnualized
Expense RatioBeginning Account
Value January 1, 2020Ending Account Value
June 30, 2020Expenses Paid During
the Period 1
Legacy Class (MSGGX) 1.14% $1,000.00 $914.80 $ 5.43Institutional Class(MSGRX) 1.10% $1,000.00 $916.40 $ 5.24Class A (MSGAX) 1.50% $1,000.00 $913.30 $ 7.14Class C (MSGCX) 2.18% $1,000.00 $909.90 $10.35Investor Class (MISGX) 1.33% $1,000.00 $913.80 $ 6.33
Hypothetical 2Annualized
Expense RatioBeginning Account
Value January 1, 2020Ending Account Value
June 30, 2020Expenses Paid During
the Period 1
Legacy Class (MSGGX) 1.14% $1,000.00 $1,019.19 $ 5.72Institutional Class(MSGRX) 1.10% $1,000.00 $1,019.39 $ 5.52Class A (MSGAX) 1.50% $1,000.00 $1,017.40 $ 7.52Class C (MSGCX) 2.18% $1,000.00 $1,014.02 $10.92Investor Class (MISGX) 1.33% $1,000.00 $1,018.25 $ 6.67
1 Expenses are equal to the Fund’s annualized expense ratio multiplied by the average account value over the period,multiplied by 182 days, the number of days in the most recent fiscal half-year, then divided by 366.
2 Hypothetical 5% return before expenses.
The above “Annualized Expense Ratios” reflect waivers and/or reimbursements of expenses by the Fund’s Adviser. Suchwaivers and/or reimbursements may not be withdrawn earlier than one year after the date of the current prospectus. The“Financial Highlights” included within the Fund’s financial statements shows the gross expense ratios for each share class.
See “Disclosure Regarding Fund Expenses” on page 23 for further information on how the above examples were calculated.
Meridian Funds 27 www.meridianfund.com
Disclosures Regarding Fund Performance
Past performance is not predictive of future performance. Current performance may be lower or higher than the quotedpast performance. Reported performance assumes reinvestment of Fund distributions. Reported performance does notreflect the deduction of taxes that a shareholder would pay on Fund distributions or the redemption of Fund shares, nordoes it reflect the 2% redemption fee on shares sold within 60 days of original purchase date. If reflected, the taxes and feeswould reduce the performance quoted. Net asset value, investment return and principal value will fluctuate, so shares, whenredeemed, may be worth more or less than their original cost. You can obtain the most current month-end performance atwww.meridianfund.com.
Performance prior to September 5, 2013 reflects the Fund’s performance under the management of Aster InvestmentManagement Co.
Legacy class shares are no longer offered to the public effective March 1, 2014, except under certain limited circumstances.
Investor Class, Class A, and Class C Shares of the Meridian Growth Fund are closed to new investors effective June 15, 2017.Existing investors may continue to purchase shares.
Investor Class, Class A, and Class C Shares of the Meridian Small Cap Growth Fund are closed to new investors effectiveJune 29, 2018. Existing investors may continue to purchase shares.
Indices are typically unmanaged, and do not reflect deductions for fees or expenses. You cannot invest directly in an index.
Investors should consider the investment objective and policies, risk considerations, charges and ongoing expensesof an investment carefully before investing. The prospectus contains this and other information relevant to aninvestment in any of the Meridian Funds. Please read the prospectus carefully before you invest. To obtain aprospectus, please contact your investment representative or the Funds' transfer agent at 800.446.6662 or accessour website at www.meridianfund.com.
Meridian Fund, Inc.Performance DisclosureJune 30, 2020 (Unaudited)
Meridian Funds 28 www.meridianfund.com
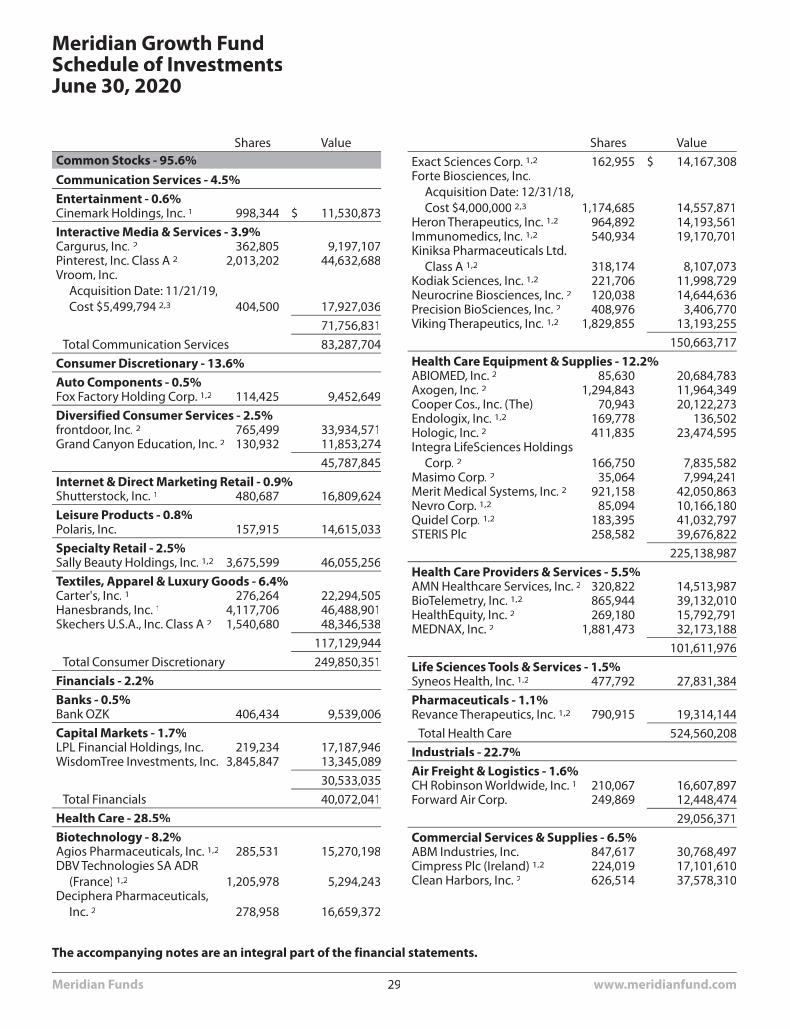
Shares ValueCommon Stocks - 95.6%Communication Services - 4.5%Entertainment - 0.6%Cinemark Holdings, Inc. 1 998,344 $ 11,530,873
Interactive Media & Services - 3.9%Cargurus, Inc. 2 362,805 9,197,107Pinterest, Inc. Class A 2 2,013,202 44,632,688Vroom, Inc.
Acquisition Date: 11/21/19,Cost $5,499,794 2,3 404,500 17,927,036
71,756,831
Total Communication Services 83,287,704
Consumer Discretionary - 13.6%Auto Components - 0.5%Fox Factory Holding Corp. 1,2 114,425 9,452,649
Diversified Consumer Services - 2.5%frontdoor, Inc. 2 765,499 33,934,571Grand Canyon Education, Inc. 2 130,932 11,853,274
45,787,845
Internet & Direct Marketing Retail - 0.9%Shutterstock, Inc. 1 480,687 16,809,624
Leisure Products - 0.8%Polaris, Inc. 157,915 14,615,033
Specialty Retail - 2.5%Sally Beauty Holdings, Inc. 1,2 3,675,599 46,055,256
Textiles, Apparel & Luxury Goods - 6.4%Carter's, Inc. 1 276,264 22,294,505Hanesbrands, Inc. 1 4,117,706 46,488,901Skechers U.S.A., Inc. Class A 2 1,540,680 48,346,538
117,129,944
Total Consumer Discretionary 249,850,351
Financials - 2.2%Banks - 0.5%Bank OZK 406,434 9,539,006
Capital Markets - 1.7%LPL Financial Holdings, Inc. 219,234 17,187,946WisdomTree Investments, Inc. 3,845,847 13,345,089
30,533,035
Total Financials 40,072,041
Health Care - 28.5%Biotechnology - 8.2%Agios Pharmaceuticals, Inc. 1,2 285,531 15,270,198DBV Technologies SA ADR
(France) 1,2 1,205,978 5,294,243Deciphera Pharmaceuticals,
Inc. 2 278,958 16,659,372
Shares Value
Exact Sciences Corp. 1,2 162,955 $ 14,167,308Forte Biosciences, Inc.
Acquisition Date: 12/31/18,Cost $4,000,000 2,3 1,174,685 14,557,871
Heron Therapeutics, Inc. 1,2 964,892 14,193,561Immunomedics, Inc. 1,2 540,934 19,170,701Kiniksa Pharmaceuticals Ltd.
Class A 1,2 318,174 8,107,073Kodiak Sciences, Inc. 1,2 221,706 11,998,729Neurocrine Biosciences, Inc. 2 120,038 14,644,636Precision BioSciences, Inc. 2 408,976 3,406,770Viking Therapeutics, Inc. 1,2 1,829,855 13,193,255
150,663,717
Health Care Equipment & Supplies - 12.2%ABIOMED, Inc. 2 85,630 20,684,783Axogen, Inc. 2 1,294,843 11,964,349Cooper Cos., Inc. (The) 70,943 20,122,273Endologix, Inc. 1,2 169,778 136,502Hologic, Inc. 2 411,835 23,474,595Integra LifeSciences Holdings
Corp. 2 166,750 7,835,582Masimo Corp. 2 35,064 7,994,241Merit Medical Systems, Inc. 2 921,158 42,050,863Nevro Corp. 1,2 85,094 10,166,180Quidel Corp. 1,2 183,395 41,032,797STERIS Plc 258,582 39,676,822
225,138,987
Health Care Providers & Services - 5.5%AMN Healthcare Services, Inc. 2 320,822 14,513,987BioTelemetry, Inc. 1,2 865,944 39,132,010HealthEquity, Inc. 2 269,180 15,792,791MEDNAX, Inc. 2 1,881,473 32,173,188
101,611,976
Life Sciences Tools & Services - 1.5%Syneos Health, Inc. 1,2 477,792 27,831,384
Pharmaceuticals - 1.1%Revance Therapeutics, Inc. 1,2 790,915 19,314,144
Total Health Care 524,560,208
Industrials - 22.7%Air Freight & Logistics - 1.6%CH Robinson Worldwide, Inc. 1 210,067 16,607,897Forward Air Corp. 249,869 12,448,474
29,056,371
Commercial Services & Supplies - 6.5%ABM Industries, Inc. 847,617 30,768,497Cimpress Plc (Ireland) 1,2 224,019 17,101,610Clean Harbors, Inc. 2 626,514 37,578,310
Meridian Growth FundSchedule of InvestmentsJune 30, 2020
The accompanying notes are an integral part of the financial statements.
Meridian Funds 29 www.meridianfund.com
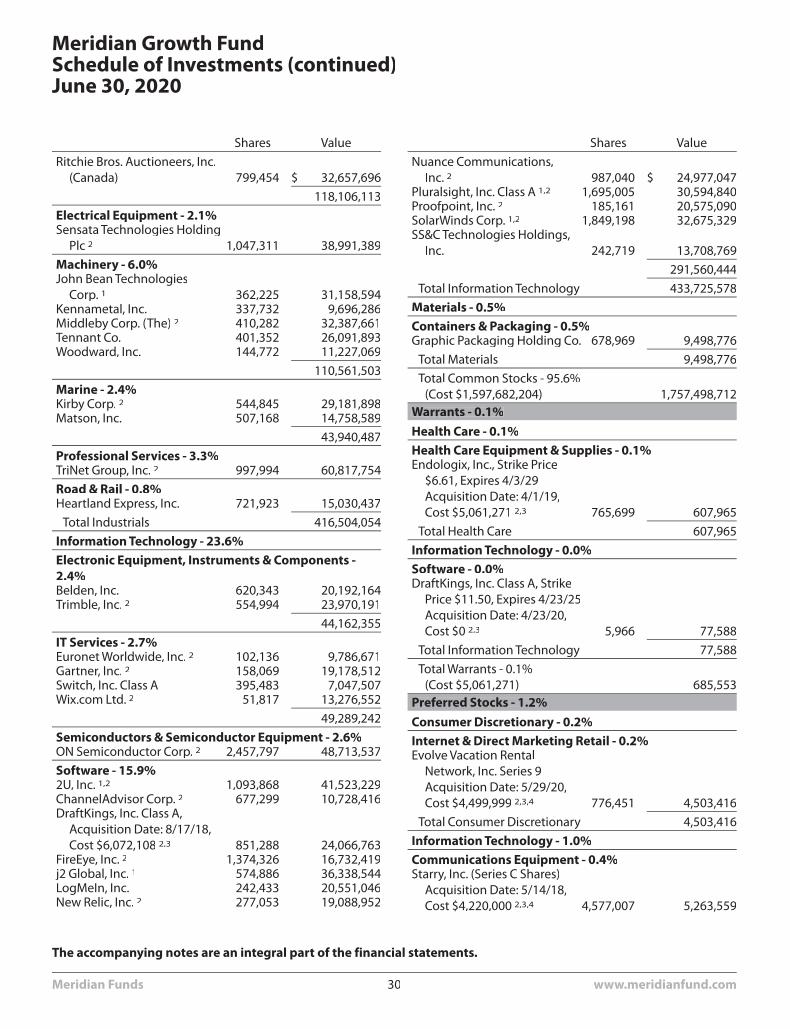
Shares Value
Ritchie Bros. Auctioneers, Inc.(Canada) 799,454 $ 32,657,696
118,106,113
Electrical Equipment - 2.1%Sensata Technologies Holding
Plc 2 1,047,311 38,991,389
Machinery - 6.0%John Bean Technologies
Corp. 1 362,225 31,158,594Kennametal, Inc. 337,732 9,696,286Middleby Corp. (The) 2 410,282 32,387,661Tennant Co. 401,352 26,091,893Woodward, Inc. 144,772 11,227,069
110,561,503
Marine - 2.4%Kirby Corp. 2 544,845 29,181,898Matson, Inc. 507,168 14,758,589
43,940,487
Professional Services - 3.3%TriNet Group, Inc. 2 997,994 60,817,754
Road & Rail - 0.8%Heartland Express, Inc. 721,923 15,030,437
Total Industrials 416,504,054
Information Technology - 23.6%Electronic Equipment, Instruments & Components -2.4%Belden, Inc. 620,343 20,192,164Trimble, Inc. 2 554,994 23,970,191
44,162,355
IT Services - 2.7%Euronet Worldwide, Inc. 2 102,136 9,786,671Gartner, Inc. 2 158,069 19,178,512Switch, Inc. Class A 395,483 7,047,507Wix.com Ltd. 2 51,817 13,276,552
49,289,242
Semiconductors & Semiconductor Equipment - 2.6%ON Semiconductor Corp. 2 2,457,797 48,713,537
Software - 15.9%2U, Inc. 1,2 1,093,868 41,523,229ChannelAdvisor Corp. 2 677,299 10,728,416DraftKings, Inc. Class A,
Acquisition Date: 8/17/18,Cost $6,072,108 2,3 851,288 24,066,763
FireEye, Inc. 2 1,374,326 16,732,419j2 Global, Inc. 1 574,886 36,338,544LogMeIn, Inc. 242,433 20,551,046New Relic, Inc. 2 277,053 19,088,952
Shares Value
Nuance Communications,Inc. 2 987,040 $ 24,977,047
Pluralsight, Inc. Class A 1,2 1,695,005 30,594,840Proofpoint, Inc. 2 185,161 20,575,090SolarWinds Corp. 1,2 1,849,198 32,675,329SS&C Technologies Holdings,
Inc. 242,719 13,708,769
291,560,444
Total Information Technology 433,725,578
Materials - 0.5%Containers & Packaging - 0.5%Graphic Packaging Holding Co. 678,969 9,498,776
Total Materials 9,498,776
Total Common Stocks - 95.6%(Cost $1,597,682,204) 1,757,498,712
Warrants - 0.1%Health Care - 0.1%Health Care Equipment & Supplies - 0.1%Endologix, Inc., Strike Price
$6.61, Expires 4/3/29Acquisition Date: 4/1/19,Cost $5,061,271 2,3 765,699 607,965
Total Health Care 607,965
Information Technology - 0.0%Software - 0.0%DraftKings, Inc. Class A, Strike
Price $11.50, Expires 4/23/25Acquisition Date: 4/23/20,Cost $0 2,3 5,966 77,588
Total Information Technology 77,588
Total Warrants - 0.1%(Cost $5,061,271) 685,553
Preferred Stocks - 1.2%Consumer Discretionary - 0.2%Internet & Direct Marketing Retail - 0.2%Evolve Vacation Rental
Network, Inc. Series 9Acquisition Date: 5/29/20,Cost $4,499,999 2,3,4 776,451 4,503,416
Total Consumer Discretionary 4,503,416
Information Technology - 1.0%Communications Equipment - 0.4%Starry, Inc. (Series C Shares)
Acquisition Date: 5/14/18,Cost $4,220,000 2,3,4 4,577,007 5,263,559
Meridian Growth FundSchedule of Investments (continued)June 30, 2020
The accompanying notes are an integral part of the financial statements.
Meridian Funds 30 www.meridianfund.com
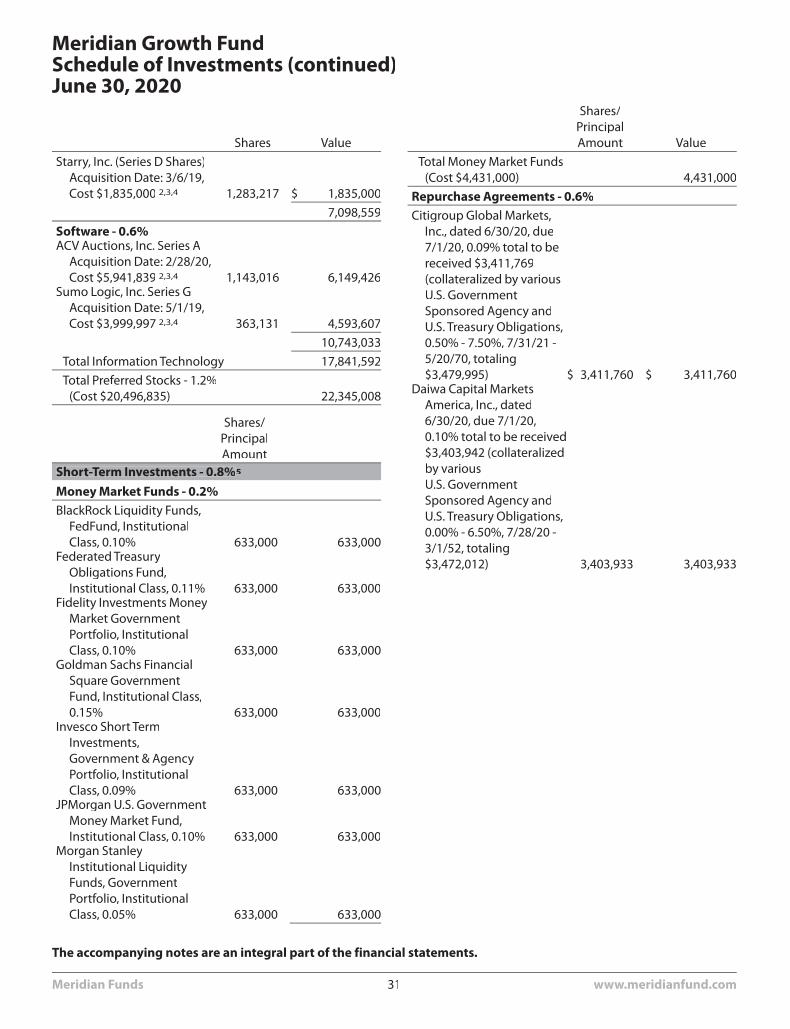
Shares Value
Starry, Inc. (Series D Shares)Acquisition Date: 3/6/19,Cost $1,835,000 2,3,4 1,283,217 $ 1,835,000
7,098,559
Software - 0.6%ACV Auctions, Inc. Series A
Acquisition Date: 2/28/20,Cost $5,941,839 2,3,4 1,143,016 6,149,426
Sumo Logic, Inc. Series GAcquisition Date: 5/1/19,Cost $3,999,997 2,3,4 363,131 4,593,607
10,743,033
Total Information Technology 17,841,592
Total Preferred Stocks - 1.2%(Cost $20,496,835) 22,345,008
Shares/PrincipalAmount
Short-Term Investments - 0.8%5
Money Market Funds - 0.2%BlackRock Liquidity Funds,
FedFund, InstitutionalClass, 0.10% 633,000 633,000
Federated TreasuryObligations Fund,Institutional Class, 0.11% 633,000 633,000
Fidelity Investments MoneyMarket GovernmentPortfolio, InstitutionalClass, 0.10% 633,000 633,000
Goldman Sachs FinancialSquare GovernmentFund, Institutional Class,0.15% 633,000 633,000
Invesco Short TermInvestments,Government & AgencyPortfolio, InstitutionalClass, 0.09% 633,000 633,000
JPMorgan U.S. GovernmentMoney Market Fund,Institutional Class, 0.10% 633,000 633,000
Morgan StanleyInstitutional LiquidityFunds, GovernmentPortfolio, InstitutionalClass, 0.05% 633,000 633,000
Shares/PrincipalAmount Value
Total Money Market Funds(Cost $4,431,000) 4,431,000
Repurchase Agreements - 0.6%Citigroup Global Markets,
Inc., dated 6/30/20, due7/1/20, 0.09% total to bereceived $3,411,769(collateralized by variousU.S. GovernmentSponsored Agency andU.S. Treasury Obligations,0.50% - 7.50%, 7/31/21 -5/20/70, totaling$3,479,995) $ 3,411,760 $ 3,411,760
Daiwa Capital MarketsAmerica, Inc., dated6/30/20, due 7/1/20,0.10% total to be received$3,403,942 (collateralizedby variousU.S. GovernmentSponsored Agency andU.S. Treasury Obligations,0.00% - 6.50%, 7/28/20 -3/1/52, totaling$3,472,012) 3,403,933 3,403,933
Meridian Growth FundSchedule of Investments (continued)June 30, 2020
The accompanying notes are an integral part of the financial statements.
Meridian Funds 31 www.meridianfund.com
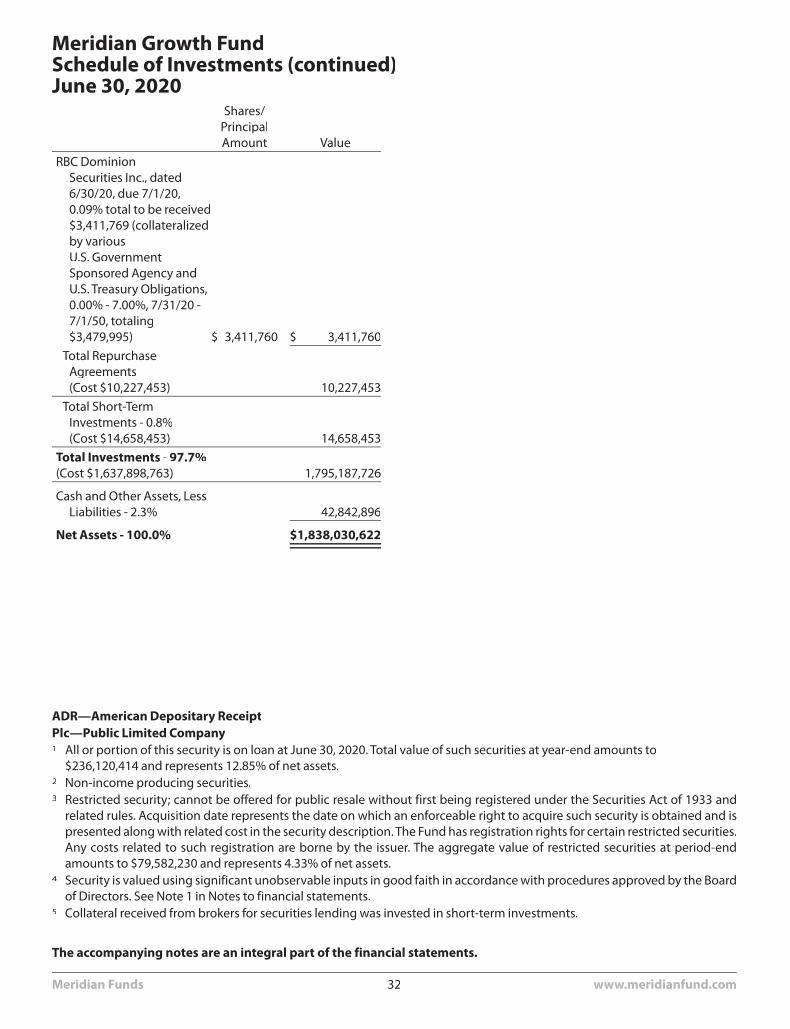
Shares/PrincipalAmount Value
RBC DominionSecurities Inc., dated6/30/20, due 7/1/20,0.09% total to be received$3,411,769 (collateralizedby variousU.S. GovernmentSponsored Agency andU.S. Treasury Obligations,0.00% - 7.00%, 7/31/20 -7/1/50, totaling$3,479,995) $ 3,411,760 $ 3,411,760
Total RepurchaseAgreements(Cost $10,227,453) 10,227,453
Total Short-TermInvestments - 0.8%(Cost $14,658,453) 14,658,453
Total Investments - 97.7%(Cost $1,637,898,763) 1,795,187,726
Cash and Other Assets, LessLiabilities - 2.3% 42,842,896
Net Assets - 100.0% $1,838,030,622
ADR—American Depositary ReceiptPlc—Public Limited Company1 All or portion of this security is on loan at June 30, 2020. Total value of such securities at year-end amounts to
$236,120,414 and represents 12.85% of net assets.2 Non-income producing securities.3 Restricted security; cannot be offered for public resale without first being registered under the Securities Act of 1933 and
related rules. Acquisition date represents the date on which an enforceable right to acquire such security is obtained and ispresented along with related cost in the security description. The Fund has registration rights for certain restricted securities.Any costs related to such registration are borne by the issuer. The aggregate value of restricted securities at period-endamounts to $79,582,230 and represents 4.33% of net assets.
4 Security is valued using significant unobservable inputs in good faith in accordance with procedures approved by the Boardof Directors. See Note 1 in Notes to financial statements.
5 Collateral received from brokers for securities lending was invested in short-term investments.
Meridian Growth FundSchedule of Investments (continued)June 30, 2020
The accompanying notes are an integral part of the financial statements.
Meridian Funds 32 www.meridianfund.com
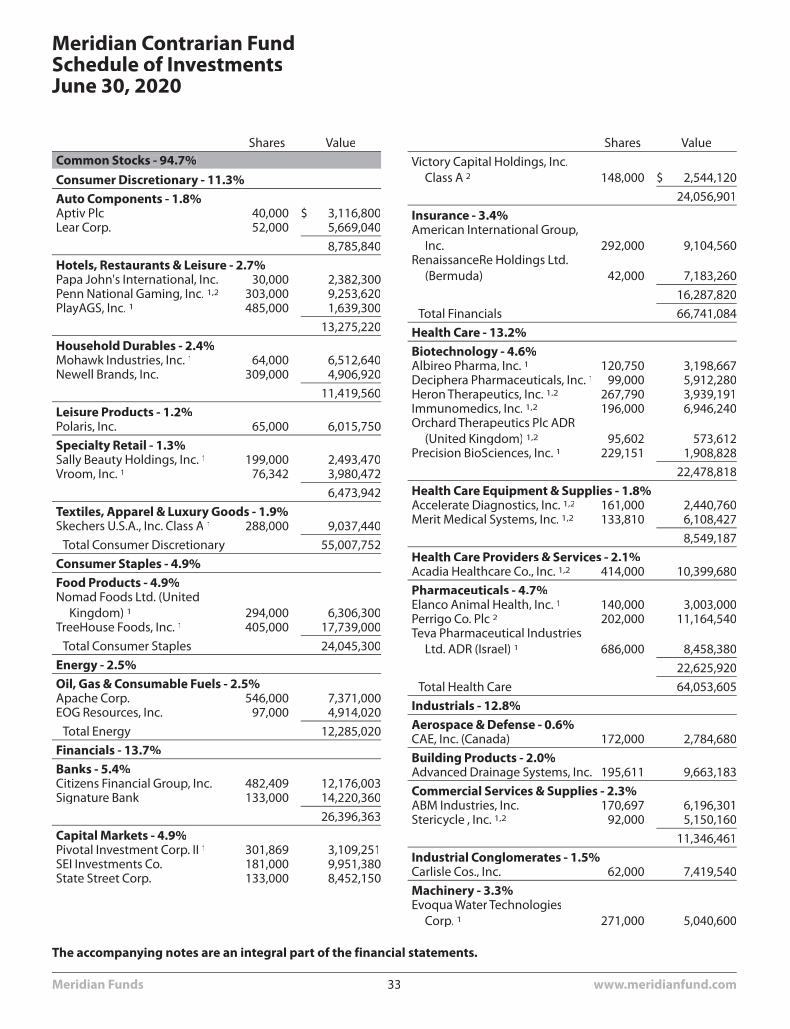
Shares ValueCommon Stocks - 94.7%Consumer Discretionary - 11.3%Auto Components - 1.8%Aptiv Plc 40,000 $ 3,116,800Lear Corp. 52,000 5,669,040
8,785,840
Hotels, Restaurants & Leisure - 2.7%Papa John's International, Inc. 30,000 2,382,300Penn National Gaming, Inc. 1,2 303,000 9,253,620PlayAGS, Inc. 1 485,000 1,639,300
13,275,220
Household Durables - 2.4%Mohawk Industries, Inc. 1 64,000 6,512,640Newell Brands, Inc. 309,000 4,906,920
11,419,560
Leisure Products - 1.2%Polaris, Inc. 65,000 6,015,750
Specialty Retail - 1.3%Sally Beauty Holdings, Inc. 1 199,000 2,493,470Vroom, Inc. 1 76,342 3,980,472
6,473,942
Textiles, Apparel & Luxury Goods - 1.9%Skechers U.S.A., Inc. Class A 1 288,000 9,037,440
Total Consumer Discretionary 55,007,752
Consumer Staples - 4.9%Food Products - 4.9%Nomad Foods Ltd. (United
Kingdom) 1 294,000 6,306,300TreeHouse Foods, Inc. 1 405,000 17,739,000
Total Consumer Staples 24,045,300
Energy - 2.5%Oil, Gas & Consumable Fuels - 2.5%Apache Corp. 546,000 7,371,000EOG Resources, Inc. 97,000 4,914,020
Total Energy 12,285,020
Financials - 13.7%Banks - 5.4%Citizens Financial Group, Inc. 482,409 12,176,003Signature Bank 133,000 14,220,360
26,396,363
Capital Markets - 4.9%Pivotal Investment Corp. II 1 301,869 3,109,251SEI Investments Co. 181,000 9,951,380State Street Corp. 133,000 8,452,150
Shares Value
Victory Capital Holdings, Inc.Class A 2 148,000 $ 2,544,120
24,056,901
Insurance - 3.4%American International Group,
Inc. 292,000 9,104,560RenaissanceRe Holdings Ltd.
(Bermuda) 42,000 7,183,260
16,287,820
Total Financials 66,741,084
Health Care - 13.2%Biotechnology - 4.6%Albireo Pharma, Inc. 1 120,750 3,198,667Deciphera Pharmaceuticals, Inc. 1 99,000 5,912,280Heron Therapeutics, Inc. 1,2 267,790 3,939,191Immunomedics, Inc. 1,2 196,000 6,946,240Orchard Therapeutics Plc ADR
(United Kingdom) 1,2 95,602 573,612Precision BioSciences, Inc. 1 229,151 1,908,828
22,478,818
Health Care Equipment & Supplies - 1.8%Accelerate Diagnostics, Inc. 1,2 161,000 2,440,760Merit Medical Systems, Inc. 1,2 133,810 6,108,427
8,549,187
Health Care Providers & Services - 2.1%Acadia Healthcare Co., Inc. 1,2 414,000 10,399,680
Pharmaceuticals - 4.7%Elanco Animal Health, Inc. 1 140,000 3,003,000Perrigo Co. Plc 2 202,000 11,164,540Teva Pharmaceutical Industries
Ltd. ADR (Israel) 1 686,000 8,458,380
22,625,920
Total Health Care 64,053,605
Industrials - 12.8%Aerospace & Defense - 0.6%CAE, Inc. (Canada) 172,000 2,784,680
Building Products - 2.0%Advanced Drainage Systems, Inc. 195,611 9,663,183
Commercial Services & Supplies - 2.3%ABM Industries, Inc. 170,697 6,196,301Stericycle , Inc. 1,2 92,000 5,150,160
11,346,461
Industrial Conglomerates - 1.5%Carlisle Cos., Inc. 62,000 7,419,540
Machinery - 3.3%Evoqua Water Technologies
Corp. 1 271,000 5,040,600
Meridian Contrarian FundSchedule of InvestmentsJune 30, 2020
The accompanying notes are an integral part of the financial statements.
Meridian Funds 33 www.meridianfund.com
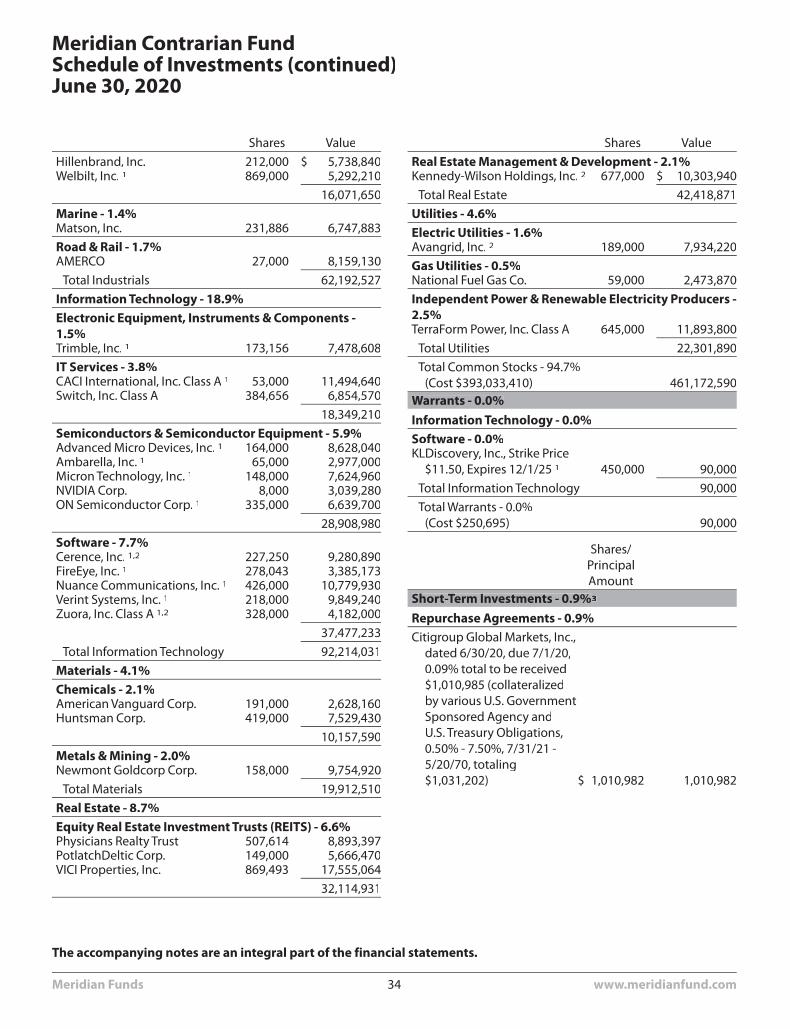
Shares Value
Hillenbrand, Inc. 212,000 $ 5,738,840Welbilt, Inc. 1 869,000 5,292,210
16,071,650
Marine - 1.4%Matson, Inc. 231,886 6,747,883
Road & Rail - 1.7%AMERCO 27,000 8,159,130
Total Industrials 62,192,527
Information Technology - 18.9%Electronic Equipment, Instruments & Components -1.5%Trimble, Inc. 1 173,156 7,478,608
IT Services - 3.8%CACI International, Inc. Class A 1 53,000 11,494,640Switch, Inc. Class A 384,656 6,854,570
18,349,210
Semiconductors & Semiconductor Equipment - 5.9%Advanced Micro Devices, Inc. 1 164,000 8,628,040Ambarella, Inc. 1 65,000 2,977,000Micron Technology, Inc. 1 148,000 7,624,960NVIDIA Corp. 8,000 3,039,280ON Semiconductor Corp. 1 335,000 6,639,700
28,908,980
Software - 7.7%Cerence, Inc. 1,2 227,250 9,280,890FireEye, Inc. 1 278,043 3,385,173Nuance Communications, Inc. 1 426,000 10,779,930Verint Systems, Inc. 1 218,000 9,849,240Zuora, Inc. Class A 1,2 328,000 4,182,000
37,477,233
Total Information Technology 92,214,031
Materials - 4.1%Chemicals - 2.1%American Vanguard Corp. 191,000 2,628,160Huntsman Corp. 419,000 7,529,430
10,157,590
Metals & Mining - 2.0%Newmont Goldcorp Corp. 158,000 9,754,920
Total Materials 19,912,510
Real Estate - 8.7%Equity Real Estate Investment Trusts (REITS) - 6.6%Physicians Realty Trust 507,614 8,893,397PotlatchDeltic Corp. 149,000 5,666,470VICI Properties, Inc. 869,493 17,555,064
32,114,931
Shares Value
Real Estate Management & Development - 2.1%Kennedy-Wilson Holdings, Inc. 2 677,000 $ 10,303,940
Total Real Estate 42,418,871
Utilities - 4.6%Electric Utilities - 1.6%Avangrid, Inc. 2 189,000 7,934,220
Gas Utilities - 0.5%National Fuel Gas Co. 59,000 2,473,870
Independent Power & Renewable Electricity Producers -2.5%TerraForm Power, Inc. Class A 645,000 11,893,800
Total Utilities 22,301,890
Total Common Stocks - 94.7%(Cost $393,033,410) 461,172,590
Warrants - 0.0%Information Technology - 0.0%Software - 0.0%KLDiscovery, Inc., Strike Price
$11.50, Expires 12/1/25 1 450,000 90,000
Total Information Technology 90,000
Total Warrants - 0.0%(Cost $250,695) 90,000
Shares/PrincipalAmount
Short-Term Investments - 0.9%3
Repurchase Agreements - 0.9%Citigroup Global Markets, Inc.,
dated 6/30/20, due 7/1/20,0.09% total to be received$1,010,985 (collateralizedby various U.S. GovernmentSponsored Agency andU.S. Treasury Obligations,0.50% - 7.50%, 7/31/21 -5/20/70, totaling$1,031,202) $ 1,010,982 1,010,982
Meridian Contrarian FundSchedule of Investments (continued)June 30, 2020
The accompanying notes are an integral part of the financial statements.
Meridian Funds 34 www.meridianfund.com
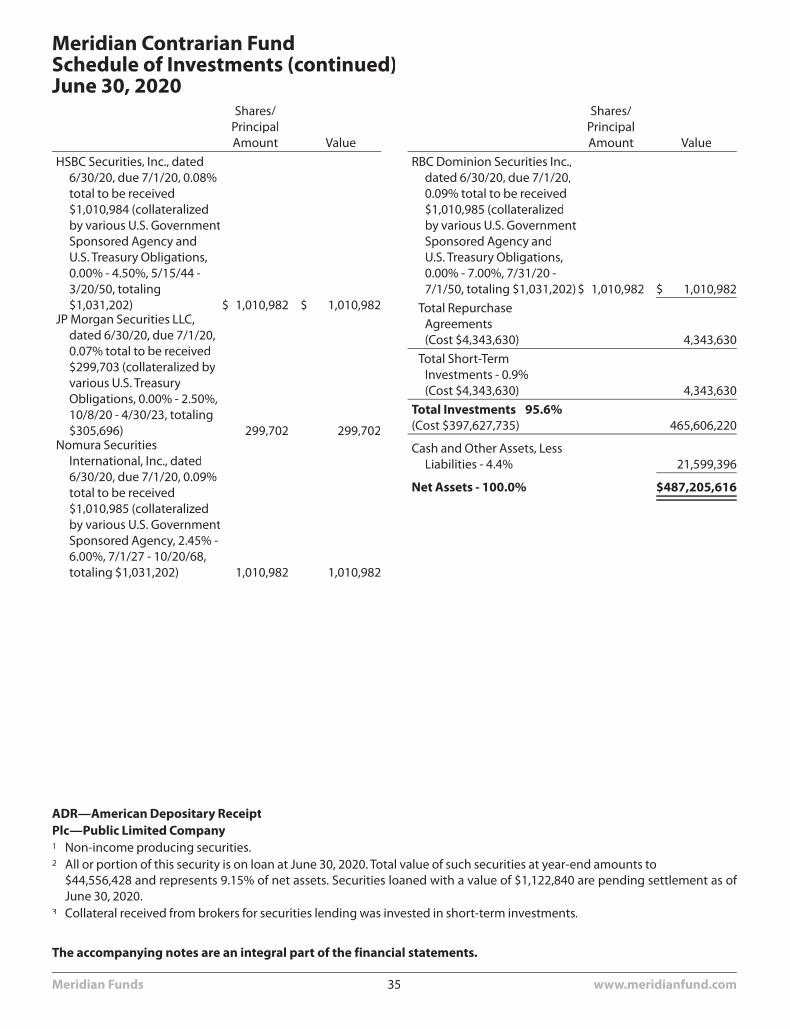
Shares/PrincipalAmount Value
HSBC Securities, Inc., dated6/30/20, due 7/1/20, 0.08%total to be received$1,010,984 (collateralizedby various U.S. GovernmentSponsored Agency andU.S. Treasury Obligations,0.00% - 4.50%, 5/15/44 -3/20/50, totaling$1,031,202) $ 1,010,982 $ 1,010,982
JP Morgan Securities LLC,dated 6/30/20, due 7/1/20,0.07% total to be received$299,703 (collateralized byvarious U.S. TreasuryObligations, 0.00% - 2.50%,10/8/20 - 4/30/23, totaling$305,696) 299,702 299,702
Nomura SecuritiesInternational, Inc., dated6/30/20, due 7/1/20, 0.09%total to be received$1,010,985 (collateralizedby various U.S. GovernmentSponsored Agency, 2.45% -6.00%, 7/1/27 - 10/20/68,totaling $1,031,202) 1,010,982 1,010,982
Shares/PrincipalAmount Value
RBC Dominion Securities Inc.,dated 6/30/20, due 7/1/20,0.09% total to be received$1,010,985 (collateralizedby various U.S. GovernmentSponsored Agency andU.S. Treasury Obligations,0.00% - 7.00%, 7/31/20 -7/1/50, totaling $1,031,202) $ 1,010,982 $ 1,010,982
Total RepurchaseAgreements(Cost $4,343,630) 4,343,630
Total Short-TermInvestments - 0.9%(Cost $4,343,630) 4,343,630
Total Investments - 95.6%(Cost $397,627,735) 465,606,220
Cash and Other Assets, LessLiabilities - 4.4% 21,599,396
Net Assets - 100.0% $487,205,616
ADR—American Depositary ReceiptPlc—Public Limited Company1 Non-income producing securities.2 All or portion of this security is on loan at June 30, 2020. Total value of such securities at year-end amounts to
$44,556,428 and represents 9.15% of net assets. Securities loaned with a value of $1,122,840 are pending settlement as ofJune 30, 2020.
3 Collateral received from brokers for securities lending was invested in short-term investments.
Meridian Contrarian FundSchedule of Investments (continued)June 30, 2020
The accompanying notes are an integral part of the financial statements.
Meridian Funds 35 www.meridianfund.com
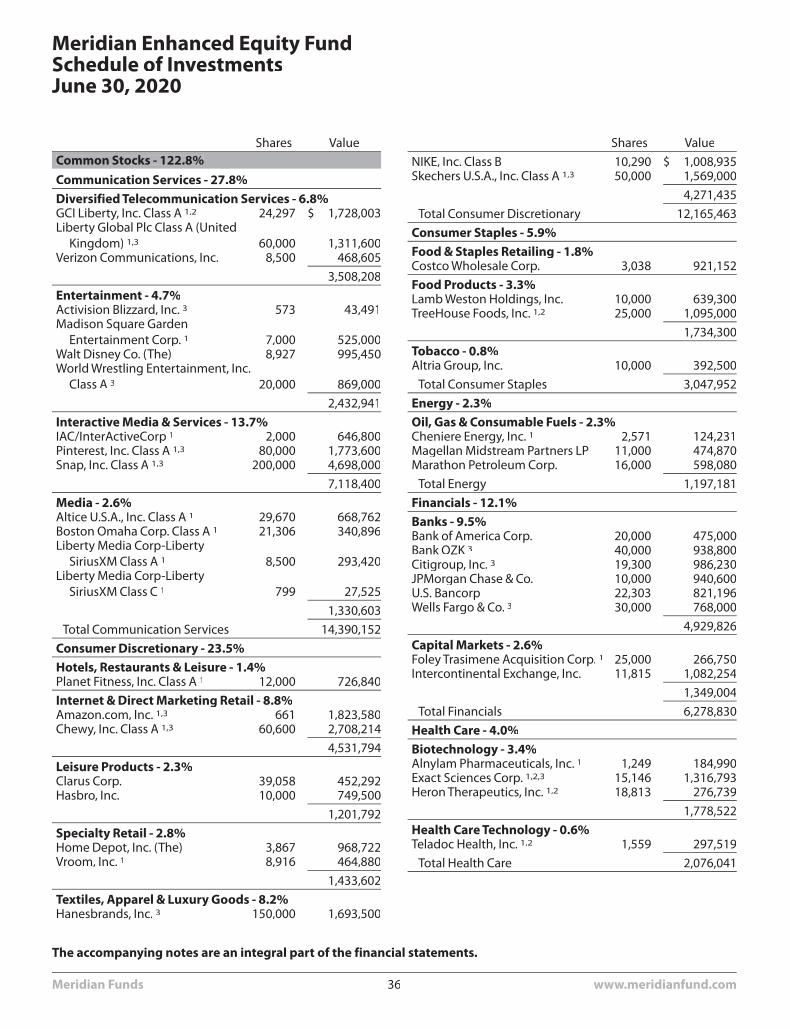
Shares ValueCommon Stocks - 122.8%Communication Services - 27.8%Diversified Telecommunication Services - 6.8%GCI Liberty, Inc. Class A 1,2 24,297 $ 1,728,003Liberty Global Plc Class A (United
Kingdom) 1,3 60,000 1,311,600Verizon Communications, Inc. 8,500 468,605
3,508,208
Entertainment - 4.7%Activision Blizzard, Inc. 3 573 43,491Madison Square Garden
Entertainment Corp. 1 7,000 525,000Walt Disney Co. (The) 8,927 995,450World Wrestling Entertainment, Inc.
Class A 3 20,000 869,000
2,432,941
Interactive Media & Services - 13.7%IAC/InterActiveCorp 1 2,000 646,800Pinterest, Inc. Class A 1,3 80,000 1,773,600Snap, Inc. Class A 1,3 200,000 4,698,000
7,118,400
Media - 2.6%Altice U.S.A., Inc. Class A 1 29,670 668,762Boston Omaha Corp. Class A 1 21,306 340,896Liberty Media Corp-Liberty
SiriusXM Class A 1 8,500 293,420Liberty Media Corp-Liberty
SiriusXM Class C 1 799 27,525
1,330,603
Total Communication Services 14,390,152
Consumer Discretionary - 23.5%Hotels, Restaurants & Leisure - 1.4%Planet Fitness, Inc. Class A 1 12,000 726,840
Internet & Direct Marketing Retail - 8.8%Amazon.com, Inc. 1,3 661 1,823,580Chewy, Inc. Class A 1,3 60,600 2,708,214
4,531,794
Leisure Products - 2.3%Clarus Corp. 39,058 452,292Hasbro, Inc. 10,000 749,500
1,201,792
Specialty Retail - 2.8%Home Depot, Inc. (The) 3,867 968,722Vroom, Inc. 1 8,916 464,880
1,433,602
Textiles, Apparel & Luxury Goods - 8.2%Hanesbrands, Inc. 3 150,000 1,693,500
Shares Value
NIKE, Inc. Class B 10,290 $ 1,008,935Skechers U.S.A., Inc. Class A 1,3 50,000 1,569,000
4,271,435
Total Consumer Discretionary 12,165,463
Consumer Staples - 5.9%Food & Staples Retailing - 1.8%Costco Wholesale Corp. 3,038 921,152
Food Products - 3.3%Lamb Weston Holdings, Inc. 10,000 639,300TreeHouse Foods, Inc. 1,2 25,000 1,095,000
1,734,300
Tobacco - 0.8%Altria Group, Inc. 10,000 392,500
Total Consumer Staples 3,047,952
Energy - 2.3%Oil, Gas & Consumable Fuels - 2.3%Cheniere Energy, Inc. 1 2,571 124,231Magellan Midstream Partners LP 11,000 474,870Marathon Petroleum Corp. 16,000 598,080
Total Energy 1,197,181
Financials - 12.1%Banks - 9.5%Bank of America Corp. 20,000 475,000Bank OZK 3 40,000 938,800Citigroup, Inc. 3 19,300 986,230JPMorgan Chase & Co. 10,000 940,600U.S. Bancorp 22,303 821,196Wells Fargo & Co. 3 30,000 768,000
4,929,826
Capital Markets - 2.6%Foley Trasimene Acquisition Corp. 1 25,000 266,750Intercontinental Exchange, Inc. 11,815 1,082,254
1,349,004
Total Financials 6,278,830
Health Care - 4.0%Biotechnology - 3.4%Alnylam Pharmaceuticals, Inc. 1 1,249 184,990Exact Sciences Corp. 1,2,3 15,146 1,316,793Heron Therapeutics, Inc. 1,2 18,813 276,739
1,778,522
Health Care Technology - 0.6%Teladoc Health, Inc. 1,2 1,559 297,519
Total Health Care 2,076,041
Meridian Enhanced Equity FundSchedule of InvestmentsJune 30, 2020
The accompanying notes are an integral part of the financial statements.
Meridian Funds 36 www.meridianfund.com
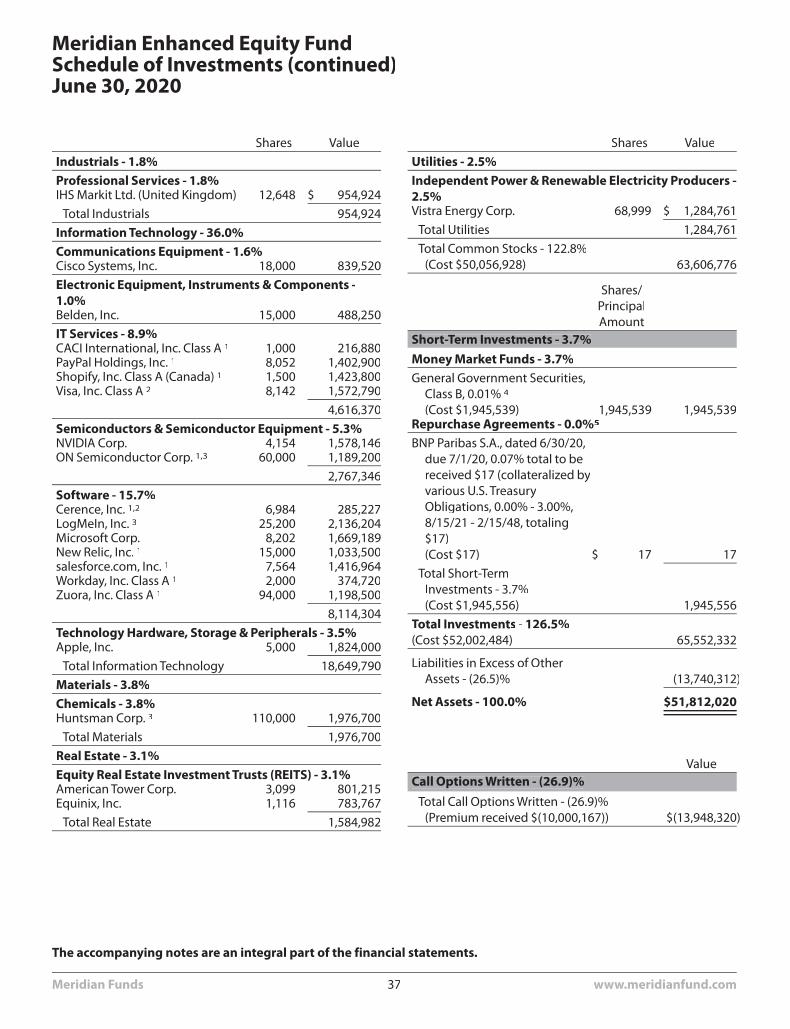
Shares Value
Industrials - 1.8%Professional Services - 1.8%IHS Markit Ltd. (United Kingdom) 12,648 $ 954,924
Total Industrials 954,924
Information Technology - 36.0%Communications Equipment - 1.6%Cisco Systems, Inc. 18,000 839,520
Electronic Equipment, Instruments & Components -1.0%Belden, Inc. 15,000 488,250
IT Services - 8.9%CACI International, Inc. Class A 1 1,000 216,880PayPal Holdings, Inc. 1 8,052 1,402,900Shopify, Inc. Class A (Canada) 1 1,500 1,423,800Visa, Inc. Class A 2 8,142 1,572,790
4,616,370
Semiconductors & Semiconductor Equipment - 5.3%NVIDIA Corp. 4,154 1,578,146ON Semiconductor Corp. 1,3 60,000 1,189,200
2,767,346
Software - 15.7%Cerence, Inc. 1,2 6,984 285,227LogMeIn, Inc. 3 25,200 2,136,204Microsoft Corp. 8,202 1,669,189New Relic, Inc. 1 15,000 1,033,500salesforce.com, Inc. 1 7,564 1,416,964Workday, Inc. Class A 1 2,000 374,720Zuora, Inc. Class A 1 94,000 1,198,500
8,114,304
Technology Hardware, Storage & Peripherals - 3.5%Apple, Inc. 5,000 1,824,000
Total Information Technology 18,649,790
Materials - 3.8%Chemicals - 3.8%Huntsman Corp. 3 110,000 1,976,700
Total Materials 1,976,700
Real Estate - 3.1%Equity Real Estate Investment Trusts (REITS) - 3.1%American Tower Corp. 3,099 801,215Equinix, Inc. 1,116 783,767
Total Real Estate 1,584,982
Shares Value
Utilities - 2.5%Independent Power & Renewable Electricity Producers -2.5%Vistra Energy Corp. 68,999 $ 1,284,761
Total Utilities 1,284,761
Total Common Stocks - 122.8%(Cost $50,056,928) 63,606,776
Shares/PrincipalAmount
Short-Term Investments - 3.7%Money Market Funds - 3.7%General Government Securities,
Class B, 0.01% 4
(Cost $1,945,539) 1,945,539 1,945,539Repurchase Agreements - 0.0%5
BNP Paribas S.A., dated 6/30/20,due 7/1/20, 0.07% total to bereceived $17 (collateralized byvarious U.S. TreasuryObligations, 0.00% - 3.00%,8/15/21 - 2/15/48, totaling$17)(Cost $17) $ 17 17
Total Short-TermInvestments - 3.7%(Cost $1,945,556) 1,945,556
Total Investments - 126.5%(Cost $52,002,484) 65,552,332
Liabilities in Excess of OtherAssets - (26.5)% (13,740,312)
Net Assets - 100.0% $51,812,020
ValueCall Options Written - (26.9)%
Total Call Options Written - (26.9)%(Premium received $(10,000,167)) $(13,948,320)
Meridian Enhanced Equity FundSchedule of Investments (continued)June 30, 2020
The accompanying notes are an integral part of the financial statements.
Meridian Funds 37 www.meridianfund.com
Plc—Public Limited Company1 Non-income producing securities.2 All or portion of this security is on loan at June 30, 2020. Total value of such securities at year-end amounts to
$4,291,688 and represents 8.28% of net assets.3 Securities, or a portion thereof, were pledged as collateral for written options by the fund.4 Security is held at broker.5 Collateral received from brokers for securities lending was invested in short-term investments.
Meridian Enhanced Equity FundSchedule of Investments (continued)June 30, 2020
The accompanying notes are an integral part of the financial statements.
Meridian Funds 38 www.meridianfund.com
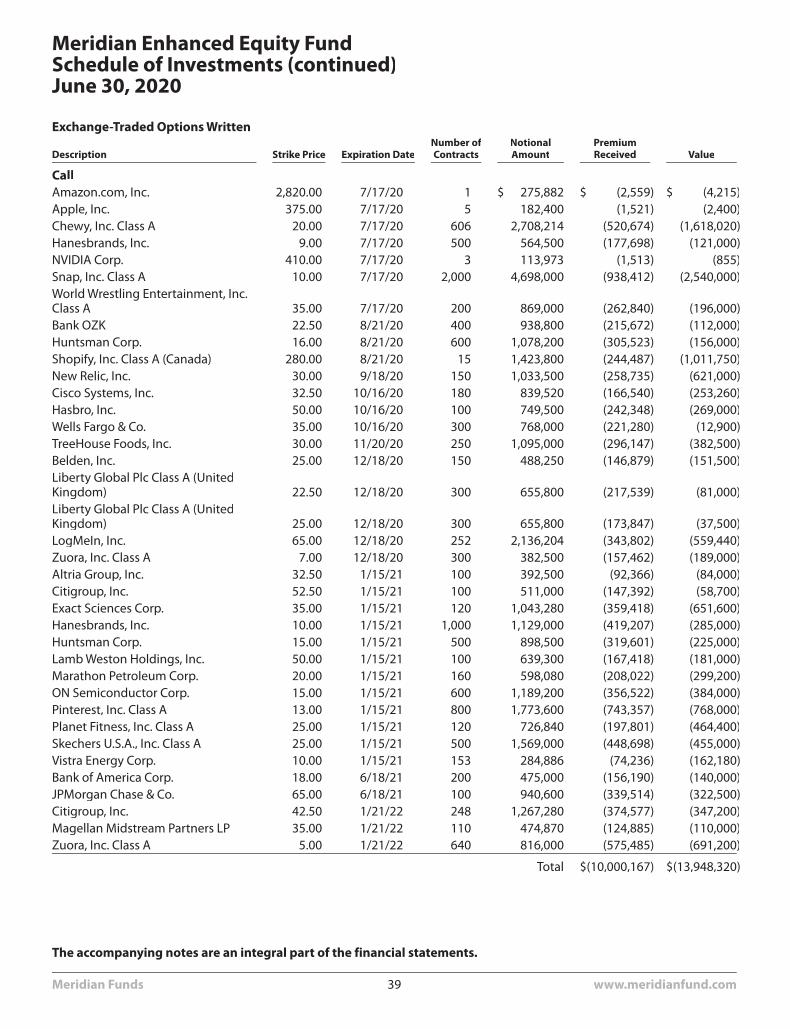
Exchange-Traded Options Written
Description Strike Price Expiration DateNumber ofContracts
NotionalAmount
PremiumReceived Value
CallAmazon.com, Inc. 2,820.00 7/17/20 1 $ 275,882 $ (2,559) $ (4,215)Apple, Inc. 375.00 7/17/20 5 182,400 (1,521) (2,400)Chewy, Inc. Class A 20.00 7/17/20 606 2,708,214 (520,674) (1,618,020)Hanesbrands, Inc. 9.00 7/17/20 500 564,500 (177,698) (121,000)NVIDIA Corp. 410.00 7/17/20 3 113,973 (1,513) (855)Snap, Inc. Class A 10.00 7/17/20 2,000 4,698,000 (938,412) (2,540,000)World Wrestling Entertainment, Inc.Class A 35.00 7/17/20 200 869,000 (262,840) (196,000)Bank OZK 22.50 8/21/20 400 938,800 (215,672) (112,000)Huntsman Corp. 16.00 8/21/20 600 1,078,200 (305,523) (156,000)Shopify, Inc. Class A (Canada) 280.00 8/21/20 15 1,423,800 (244,487) (1,011,750)New Relic, Inc. 30.00 9/18/20 150 1,033,500 (258,735) (621,000)Cisco Systems, Inc. 32.50 10/16/20 180 839,520 (166,540) (253,260)Hasbro, Inc. 50.00 10/16/20 100 749,500 (242,348) (269,000)Wells Fargo & Co. 35.00 10/16/20 300 768,000 (221,280) (12,900)TreeHouse Foods, Inc. 30.00 11/20/20 250 1,095,000 (296,147) (382,500)Belden, Inc. 25.00 12/18/20 150 488,250 (146,879) (151,500)Liberty Global Plc Class A (UnitedKingdom) 22.50 12/18/20 300 655,800 (217,539) (81,000)Liberty Global Plc Class A (UnitedKingdom) 25.00 12/18/20 300 655,800 (173,847) (37,500)LogMeIn, Inc. 65.00 12/18/20 252 2,136,204 (343,802) (559,440)Zuora, Inc. Class A 7.00 12/18/20 300 382,500 (157,462) (189,000)Altria Group, Inc. 32.50 1/15/21 100 392,500 (92,366) (84,000)Citigroup, Inc. 52.50 1/15/21 100 511,000 (147,392) (58,700)Exact Sciences Corp. 35.00 1/15/21 120 1,043,280 (359,418) (651,600)Hanesbrands, Inc. 10.00 1/15/21 1,000 1,129,000 (419,207) (285,000)Huntsman Corp. 15.00 1/15/21 500 898,500 (319,601) (225,000)Lamb Weston Holdings, Inc. 50.00 1/15/21 100 639,300 (167,418) (181,000)Marathon Petroleum Corp. 20.00 1/15/21 160 598,080 (208,022) (299,200)ON Semiconductor Corp. 15.00 1/15/21 600 1,189,200 (356,522) (384,000)Pinterest, Inc. Class A 13.00 1/15/21 800 1,773,600 (743,357) (768,000)Planet Fitness, Inc. Class A 25.00 1/15/21 120 726,840 (197,801) (464,400)Skechers U.S.A., Inc. Class A 25.00 1/15/21 500 1,569,000 (448,698) (455,000)Vistra Energy Corp. 10.00 1/15/21 153 284,886 (74,236) (162,180)Bank of America Corp. 18.00 6/18/21 200 475,000 (156,190) (140,000)JPMorgan Chase & Co. 65.00 6/18/21 100 940,600 (339,514) (322,500)Citigroup, Inc. 42.50 1/21/22 248 1,267,280 (374,577) (347,200)Magellan Midstream Partners LP 35.00 1/21/22 110 474,870 (124,885) (110,000)Zuora, Inc. Class A 5.00 1/21/22 640 816,000 (575,485) (691,200)
Total $(10,000,167) $(13,948,320)
Meridian Enhanced Equity FundSchedule of Investments (continued)June 30, 2020
The accompanying notes are an integral part of the financial statements.
Meridian Funds 39 www.meridianfund.com
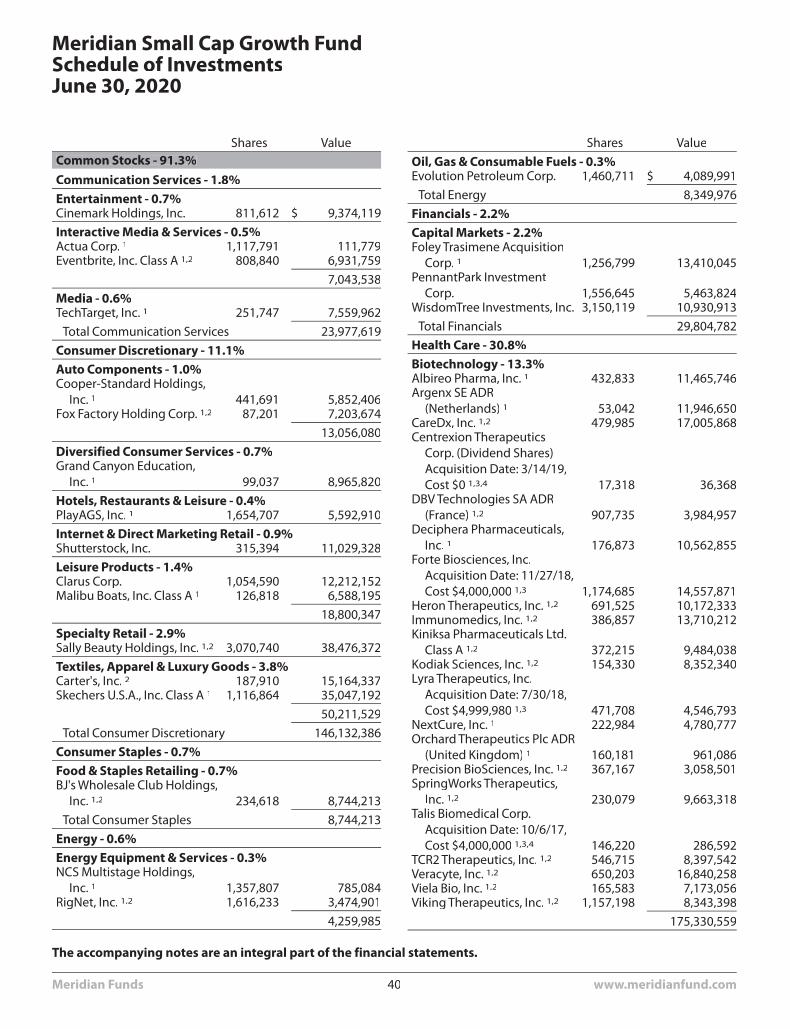
Shares ValueCommon Stocks - 91.3%Communication Services - 1.8%Entertainment - 0.7%Cinemark Holdings, Inc. 811,612 $ 9,374,119
Interactive Media & Services - 0.5%Actua Corp. 1 1,117,791 111,779Eventbrite, Inc. Class A 1,2 808,840 6,931,759
7,043,538
Media - 0.6%TechTarget, Inc. 1 251,747 7,559,962
Total Communication Services 23,977,619
Consumer Discretionary - 11.1%Auto Components - 1.0%Cooper-Standard Holdings,
Inc. 1 441,691 5,852,406Fox Factory Holding Corp. 1,2 87,201 7,203,674
13,056,080
Diversified Consumer Services - 0.7%Grand Canyon Education,
Inc. 1 99,037 8,965,820
Hotels, Restaurants & Leisure - 0.4%PlayAGS, Inc. 1 1,654,707 5,592,910
Internet & Direct Marketing Retail - 0.9%Shutterstock, Inc. 315,394 11,029,328
Leisure Products - 1.4%Clarus Corp. 1,054,590 12,212,152Malibu Boats, Inc. Class A 1 126,818 6,588,195
18,800,347
Specialty Retail - 2.9%Sally Beauty Holdings, Inc. 1,2 3,070,740 38,476,372
Textiles, Apparel & Luxury Goods - 3.8%Carter's, Inc. 2 187,910 15,164,337Skechers U.S.A., Inc. Class A 1 1,116,864 35,047,192
50,211,529
Total Consumer Discretionary 146,132,386
Consumer Staples - 0.7%Food & Staples Retailing - 0.7%BJ's Wholesale Club Holdings,
Inc. 1,2 234,618 8,744,213
Total Consumer Staples 8,744,213
Energy - 0.6%Energy Equipment & Services - 0.3%NCS Multistage Holdings,
Inc. 1 1,357,807 785,084RigNet, Inc. 1,2 1,616,233 3,474,901
4,259,985
Shares Value
Oil, Gas & Consumable Fuels - 0.3%Evolution Petroleum Corp. 1,460,711 $ 4,089,991
Total Energy 8,349,976
Financials - 2.2%Capital Markets - 2.2%Foley Trasimene Acquisition
Corp. 1 1,256,799 13,410,045PennantPark Investment
Corp. 1,556,645 5,463,824WisdomTree Investments, Inc. 3,150,119 10,930,913
Total Financials 29,804,782
Health Care - 30.8%Biotechnology - 13.3%Albireo Pharma, Inc. 1 432,833 11,465,746Argenx SE ADR
(Netherlands) 1 53,042 11,946,650CareDx, Inc. 1,2 479,985 17,005,868Centrexion Therapeutics
Corp. (Dividend Shares)Acquisition Date: 3/14/19,Cost $0 1,3,4 17,318 36,368
DBV Technologies SA ADR(France) 1,2 907,735 3,984,957
Deciphera Pharmaceuticals,Inc. 1 176,873 10,562,855
Forte Biosciences, Inc.Acquisition Date: 11/27/18,Cost $4,000,000 1,3 1,174,685 14,557,871
Heron Therapeutics, Inc. 1,2 691,525 10,172,333Immunomedics, Inc. 1,2 386,857 13,710,212Kiniksa Pharmaceuticals Ltd.
Class A 1,2 372,215 9,484,038Kodiak Sciences, Inc. 1,2 154,330 8,352,340Lyra Therapeutics, Inc.
Acquisition Date: 7/30/18,Cost $4,999,980 1,3 471,708 4,546,793
NextCure, Inc. 1 222,984 4,780,777Orchard Therapeutics Plc ADR
(United Kingdom) 1 160,181 961,086Precision BioSciences, Inc. 1,2 367,167 3,058,501SpringWorks Therapeutics,
Inc. 1,2 230,079 9,663,318Talis Biomedical Corp.
Acquisition Date: 10/6/17,Cost $4,000,000 1,3,4 146,220 286,592
TCR2 Therapeutics, Inc. 1,2 546,715 8,397,542Veracyte, Inc. 1,2 650,203 16,840,258Viela Bio, Inc. 1,2 165,583 7,173,056Viking Therapeutics, Inc. 1,2 1,157,198 8,343,398
175,330,559
Meridian Small Cap Growth FundSchedule of InvestmentsJune 30, 2020
The accompanying notes are an integral part of the financial statements.
Meridian Funds 40 www.meridianfund.com
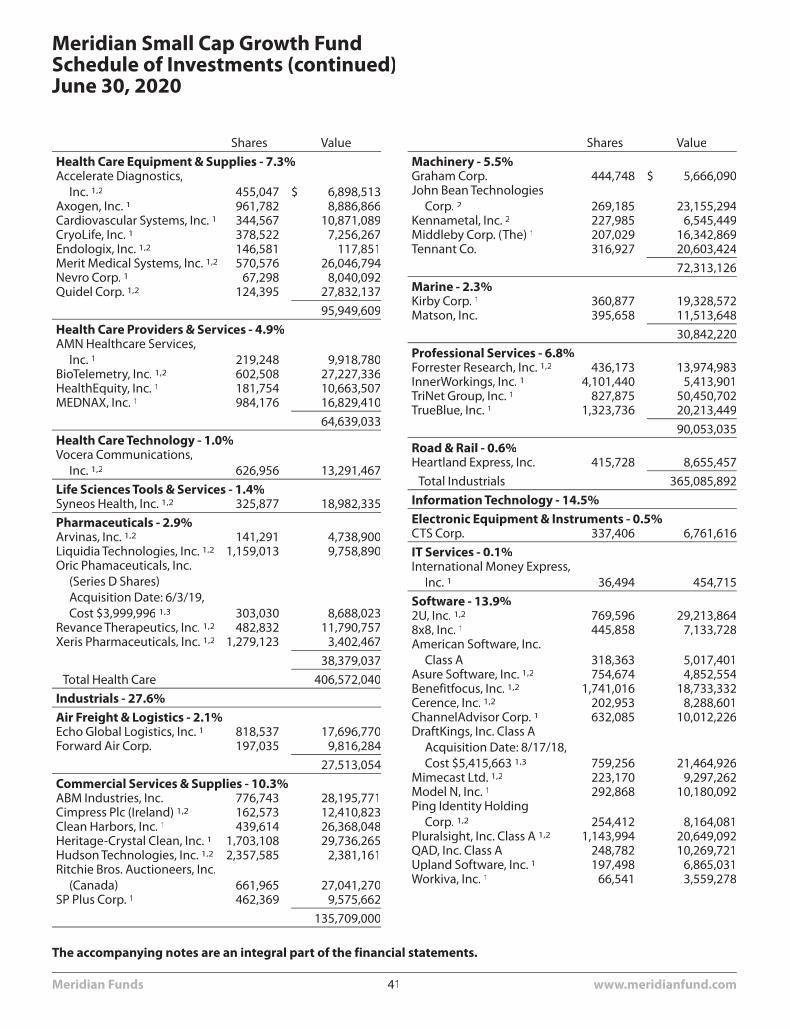
Shares Value
Health Care Equipment & Supplies - 7.3%Accelerate Diagnostics,
Inc. 1,2 455,047 $ 6,898,513Axogen, Inc. 1 961,782 8,886,866Cardiovascular Systems, Inc. 1 344,567 10,871,089CryoLife, Inc. 1 378,522 7,256,267Endologix, Inc. 1,2 146,581 117,851Merit Medical Systems, Inc. 1,2 570,576 26,046,794Nevro Corp. 1 67,298 8,040,092Quidel Corp. 1,2 124,395 27,832,137
95,949,609
Health Care Providers & Services - 4.9%AMN Healthcare Services,
Inc. 1 219,248 9,918,780BioTelemetry, Inc. 1,2 602,508 27,227,336HealthEquity, Inc. 1 181,754 10,663,507MEDNAX, Inc. 1 984,176 16,829,410
64,639,033
Health Care Technology - 1.0%Vocera Communications,
Inc. 1,2 626,956 13,291,467
Life Sciences Tools & Services - 1.4%Syneos Health, Inc. 1,2 325,877 18,982,335
Pharmaceuticals - 2.9%Arvinas, Inc. 1,2 141,291 4,738,900Liquidia Technologies, Inc. 1,2 1,159,013 9,758,890Oric Phamaceuticals, Inc.
(Series D Shares)Acquisition Date: 6/3/19,Cost $3,999,996 1,3 303,030 8,688,023
Revance Therapeutics, Inc. 1,2 482,832 11,790,757Xeris Pharmaceuticals, Inc. 1,2 1,279,123 3,402,467
38,379,037
Total Health Care 406,572,040
Industrials - 27.6%Air Freight & Logistics - 2.1%Echo Global Logistics, Inc. 1 818,537 17,696,770Forward Air Corp. 197,035 9,816,284
27,513,054
Commercial Services & Supplies - 10.3%ABM Industries, Inc. 776,743 28,195,771Cimpress Plc (Ireland) 1,2 162,573 12,410,823Clean Harbors, Inc. 1 439,614 26,368,048Heritage-Crystal Clean, Inc. 1 1,703,108 29,736,265Hudson Technologies, Inc. 1,2 2,357,585 2,381,161Ritchie Bros. Auctioneers, Inc.
(Canada) 661,965 27,041,270SP Plus Corp. 1 462,369 9,575,662
135,709,000
Shares Value
Machinery - 5.5%Graham Corp. 444,748 $ 5,666,090John Bean Technologies
Corp. 2 269,185 23,155,294Kennametal, Inc. 2 227,985 6,545,449Middleby Corp. (The) 1 207,029 16,342,869Tennant Co. 316,927 20,603,424
72,313,126
Marine - 2.3%Kirby Corp. 1 360,877 19,328,572Matson, Inc. 395,658 11,513,648
30,842,220
Professional Services - 6.8%Forrester Research, Inc. 1,2 436,173 13,974,983InnerWorkings, Inc. 1 4,101,440 5,413,901TriNet Group, Inc. 1 827,875 50,450,702TrueBlue, Inc. 1 1,323,736 20,213,449
90,053,035
Road & Rail - 0.6%Heartland Express, Inc. 415,728 8,655,457
Total Industrials 365,085,892
Information Technology - 14.5%Electronic Equipment & Instruments - 0.5%CTS Corp. 337,406 6,761,616
IT Services - 0.1%International Money Express,
Inc. 1 36,494 454,715
Software - 13.9%2U, Inc. 1,2 769,596 29,213,8648x8, Inc. 1 445,858 7,133,728American Software, Inc.
Class A 318,363 5,017,401Asure Software, Inc. 1,2 754,674 4,852,554Benefitfocus, Inc. 1,2 1,741,016 18,733,332Cerence, Inc. 1,2 202,953 8,288,601ChannelAdvisor Corp. 1 632,085 10,012,226DraftKings, Inc. Class A
Acquisition Date: 8/17/18,Cost $5,415,663 1,3 759,256 21,464,926
Mimecast Ltd. 1,2 223,170 9,297,262Model N, Inc. 1 292,868 10,180,092Ping Identity Holding
Corp. 1,2 254,412 8,164,081Pluralsight, Inc. Class A 1,2 1,143,994 20,649,092QAD, Inc. Class A 248,782 10,269,721Upland Software, Inc. 1 197,498 6,865,031Workiva, Inc. 1 66,541 3,559,278
Meridian Small Cap Growth FundSchedule of Investments (continued)June 30, 2020
The accompanying notes are an integral part of the financial statements.
Meridian Funds 41 www.meridianfund.com
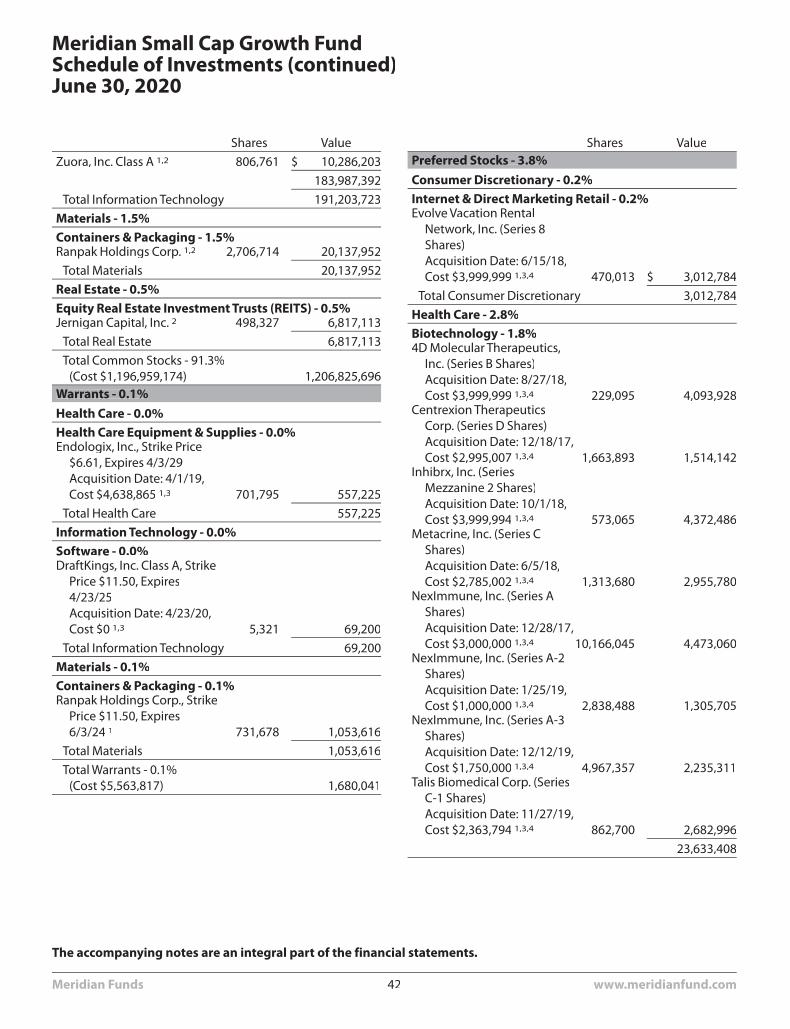
Shares Value
Zuora, Inc. Class A 1,2 806,761 $ 10,286,203
183,987,392
Total Information Technology 191,203,723
Materials - 1.5%Containers & Packaging - 1.5%Ranpak Holdings Corp. 1,2 2,706,714 20,137,952
Total Materials 20,137,952
Real Estate - 0.5%Equity Real Estate Investment Trusts (REITS) - 0.5%Jernigan Capital, Inc. 2 498,327 6,817,113
Total Real Estate 6,817,113
Total Common Stocks - 91.3%(Cost $1,196,959,174) 1,206,825,696
Warrants - 0.1%Health Care - 0.0%Health Care Equipment & Supplies - 0.0%Endologix, Inc., Strike Price
$6.61, Expires 4/3/29Acquisition Date: 4/1/19,Cost $4,638,865 1,3 701,795 557,225
Total Health Care 557,225
Information Technology - 0.0%Software - 0.0%DraftKings, Inc. Class A, Strike
Price $11.50, Expires4/23/25Acquisition Date: 4/23/20,Cost $0 1,3 5,321 69,200
Total Information Technology 69,200
Materials - 0.1%Containers & Packaging - 0.1%Ranpak Holdings Corp., Strike
Price $11.50, Expires6/3/24 1 731,678 1,053,616
Total Materials 1,053,616
Total Warrants - 0.1%(Cost $5,563,817) 1,680,041
Shares ValuePreferred Stocks - 3.8%Consumer Discretionary - 0.2%Internet & Direct Marketing Retail - 0.2%Evolve Vacation Rental
Network, Inc. (Series 8Shares)Acquisition Date: 6/15/18,Cost $3,999,999 1,3,4 470,013 $ 3,012,784
Total Consumer Discretionary 3,012,784
Health Care - 2.8%Biotechnology - 1.8%4D Molecular Therapeutics,
Inc. (Series B Shares)Acquisition Date: 8/27/18,Cost $3,999,999 1,3,4 229,095 4,093,928
Centrexion TherapeuticsCorp. (Series D Shares)Acquisition Date: 12/18/17,Cost $2,995,007 1,3,4 1,663,893 1,514,142
Inhibrx, Inc. (SeriesMezzanine 2 Shares)Acquisition Date: 10/1/18,Cost $3,999,994 1,3,4 573,065 4,372,486
Metacrine, Inc. (Series CShares)Acquisition Date: 6/5/18,Cost $2,785,002 1,3,4 1,313,680 2,955,780
NexImmune, Inc. (Series AShares)Acquisition Date: 12/28/17,Cost $3,000,000 1,3,4 10,166,045 4,473,060
NexImmune, Inc. (Series A-2Shares)Acquisition Date: 1/25/19,Cost $1,000,000 1,3,4 2,838,488 1,305,705
NexImmune, Inc. (Series A-3Shares)Acquisition Date: 12/12/19,Cost $1,750,000 1,3,4 4,967,357 2,235,311
Talis Biomedical Corp. (SeriesC-1 Shares)Acquisition Date: 11/27/19,Cost $2,363,794 1,3,4 862,700 2,682,996
23,633,408
Meridian Small Cap Growth FundSchedule of Investments (continued)June 30, 2020
The accompanying notes are an integral part of the financial statements.
Meridian Funds 42 www.meridianfund.com
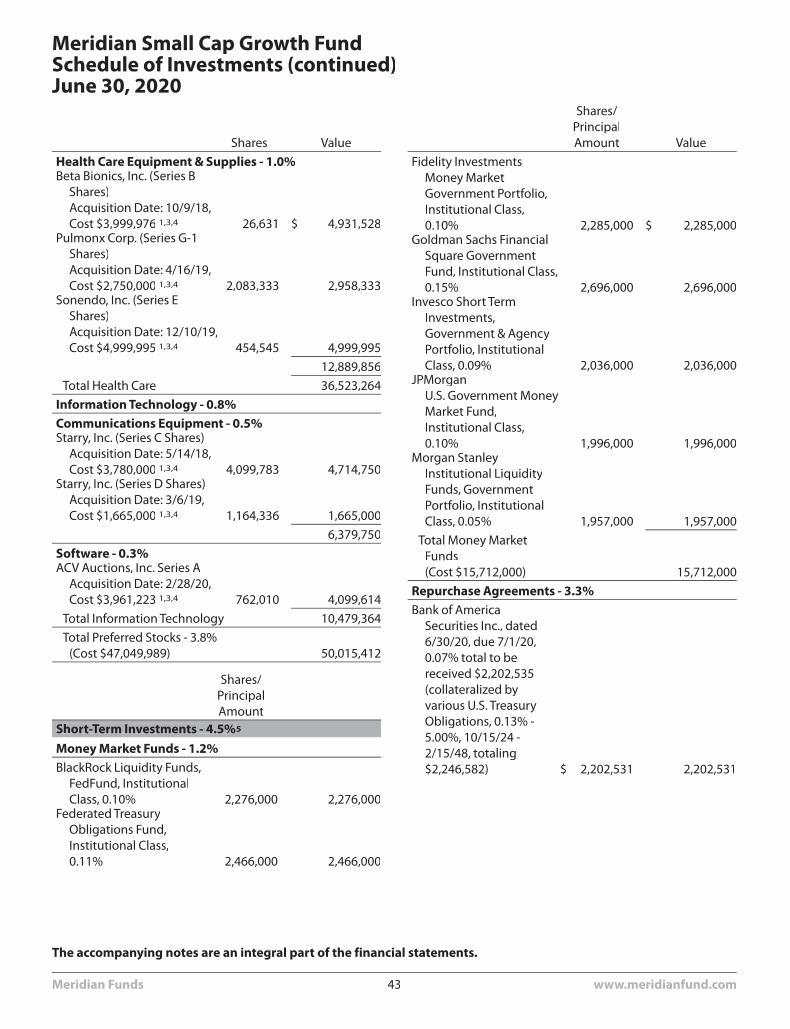
Shares Value
Health Care Equipment & Supplies - 1.0%Beta Bionics, Inc. (Series B
Shares)Acquisition Date: 10/9/18,Cost $3,999,976 1,3,4 26,631 $ 4,931,528
Pulmonx Corp. (Series G-1Shares)Acquisition Date: 4/16/19,Cost $2,750,000 1,3,4 2,083,333 2,958,333
Sonendo, Inc. (Series EShares)Acquisition Date: 12/10/19,Cost $4,999,995 1,3,4 454,545 4,999,995
12,889,856
Total Health Care 36,523,264
Information Technology - 0.8%Communications Equipment - 0.5%Starry, Inc. (Series C Shares)
Acquisition Date: 5/14/18,Cost $3,780,000 1,3,4 4,099,783 4,714,750
Starry, Inc. (Series D Shares)Acquisition Date: 3/6/19,Cost $1,665,000 1,3,4 1,164,336 1,665,000
6,379,750
Software - 0.3%ACV Auctions, Inc. Series A
Acquisition Date: 2/28/20,Cost $3,961,223 1,3,4 762,010 4,099,614
Total Information Technology 10,479,364
Total Preferred Stocks - 3.8%(Cost $47,049,989) 50,015,412
Shares/PrincipalAmount
Short-Term Investments - 4.5%5
Money Market Funds - 1.2%BlackRock Liquidity Funds,
FedFund, InstitutionalClass, 0.10% 2,276,000 2,276,000
Federated TreasuryObligations Fund,Institutional Class,0.11% 2,466,000 2,466,000
Shares/PrincipalAmount Value
Fidelity InvestmentsMoney MarketGovernment Portfolio,Institutional Class,0.10% 2,285,000 $ 2,285,000
Goldman Sachs FinancialSquare GovernmentFund, Institutional Class,0.15% 2,696,000 2,696,000
Invesco Short TermInvestments,Government & AgencyPortfolio, InstitutionalClass, 0.09% 2,036,000 2,036,000
JPMorganU.S. Government MoneyMarket Fund,Institutional Class,0.10% 1,996,000 1,996,000
Morgan StanleyInstitutional LiquidityFunds, GovernmentPortfolio, InstitutionalClass, 0.05% 1,957,000 1,957,000
Total Money MarketFunds(Cost $15,712,000) 15,712,000
Repurchase Agreements - 3.3%Bank of America
Securities Inc., dated6/30/20, due 7/1/20,0.07% total to bereceived $2,202,535(collateralized byvarious U.S. TreasuryObligations, 0.13% -5.00%, 10/15/24 -2/15/48, totaling$2,246,582) $ 2,202,531 2,202,531
Meridian Small Cap Growth FundSchedule of Investments (continued)June 30, 2020
The accompanying notes are an integral part of the financial statements.
Meridian Funds 43 www.meridianfund.com
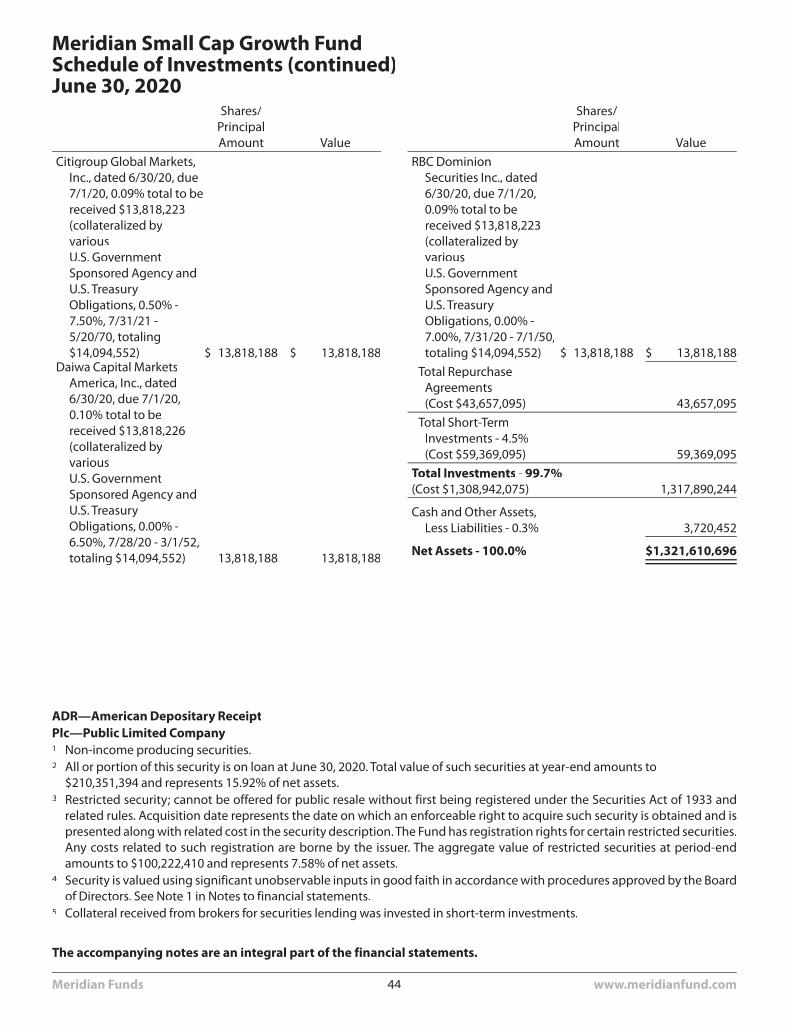
Shares/PrincipalAmount Value
Citigroup Global Markets,Inc., dated 6/30/20, due7/1/20, 0.09% total to bereceived $13,818,223(collateralized byvariousU.S. GovernmentSponsored Agency andU.S. TreasuryObligations, 0.50% -7.50%, 7/31/21 -5/20/70, totaling$14,094,552) $ 13,818,188 $ 13,818,188
Daiwa Capital MarketsAmerica, Inc., dated6/30/20, due 7/1/20,0.10% total to bereceived $13,818,226(collateralized byvariousU.S. GovernmentSponsored Agency andU.S. TreasuryObligations, 0.00% -6.50%, 7/28/20 - 3/1/52,totaling $14,094,552) 13,818,188 13,818,188
Shares/PrincipalAmount Value
RBC DominionSecurities Inc., dated6/30/20, due 7/1/20,0.09% total to bereceived $13,818,223(collateralized byvariousU.S. GovernmentSponsored Agency andU.S. TreasuryObligations, 0.00% -7.00%, 7/31/20 - 7/1/50,totaling $14,094,552) $ 13,818,188 $ 13,818,188
Total RepurchaseAgreements(Cost $43,657,095) 43,657,095
Total Short-TermInvestments - 4.5%(Cost $59,369,095) 59,369,095
Total Investments - 99.7%(Cost $1,308,942,075) 1,317,890,244
Cash and Other Assets,Less Liabilities - 0.3% 3,720,452
Net Assets - 100.0% $1,321,610,696
ADR—American Depositary ReceiptPlc—Public Limited Company1 Non-income producing securities.2 All or portion of this security is on loan at June 30, 2020. Total value of such securities at year-end amounts to
$210,351,394 and represents 15.92% of net assets.3 Restricted security; cannot be offered for public resale without first being registered under the Securities Act of 1933 and
related rules. Acquisition date represents the date on which an enforceable right to acquire such security is obtained and ispresented along with related cost in the security description. The Fund has registration rights for certain restricted securities.Any costs related to such registration are borne by the issuer. The aggregate value of restricted securities at period-endamounts to $100,222,410 and represents 7.58% of net assets.
4 Security is valued using significant unobservable inputs in good faith in accordance with procedures approved by the Boardof Directors. See Note 1 in Notes to financial statements.
5 Collateral received from brokers for securities lending was invested in short-term investments.
Meridian Small Cap Growth FundSchedule of Investments (continued)June 30, 2020
The accompanying notes are an integral part of the financial statements.
Meridian Funds 44 www.meridianfund.com
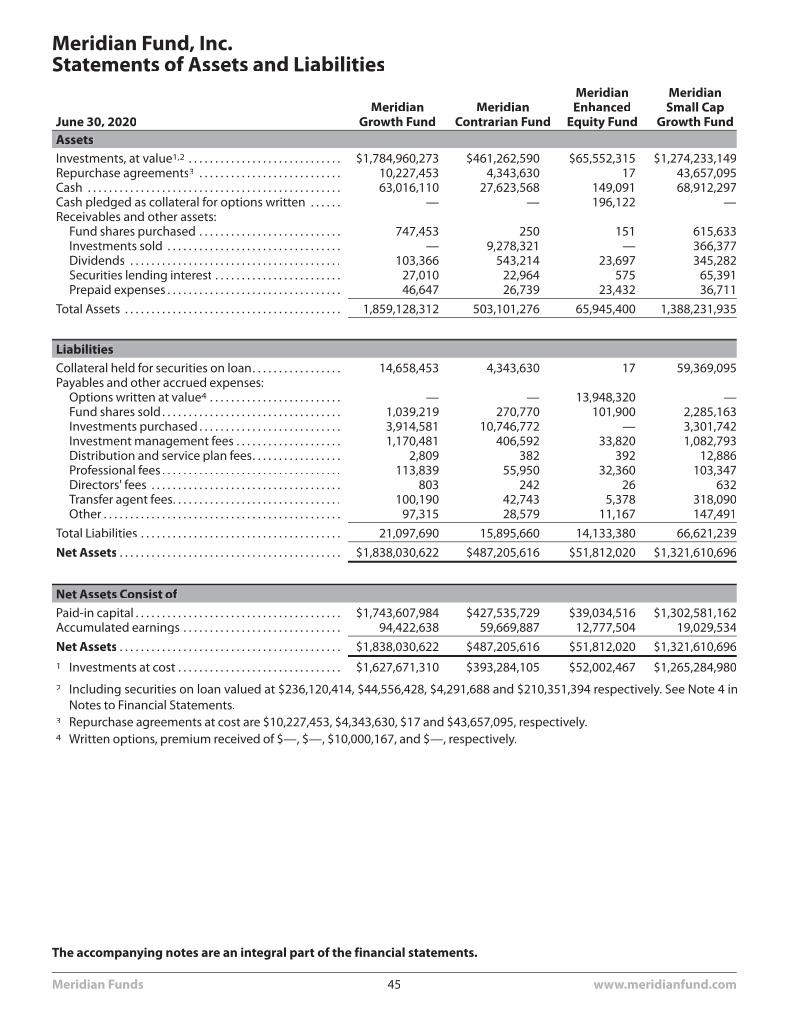
June 30, 2020Meridian
Growth FundMeridian
Contrarian Fund
MeridianEnhanced
Equity Fund
MeridianSmall Cap
Growth FundAssetsInvestments, at value1,2 . . . . . . . . . . . . . . . . . . . . . . . . . . . . . $1,784,960,273 $461,262,590 $65,552,315 $1,274,233,149Repurchase agreements3 . . . . . . . . . . . . . . . . . . . . . . . . . . . 10,227,453 4,343,630 17 43,657,095Cash . . . . . . . . . . . . . . . . . . . . . . . . . . . . . . . . . . . . . . . . . . . . . . . . 63,016,110 27,623,568 149,091 68,912,297Cash pledged as collateral for options written . . . . . . — — 196,122 —Receivables and other assets:
Fund shares purchased . . . . . . . . . . . . . . . . . . . . . . . . . . . 747,453 250 151 615,633Investments sold . . . . . . . . . . . . . . . . . . . . . . . . . . . . . . . . . — 9,278,321 — 366,377Dividends . . . . . . . . . . . . . . . . . . . . . . . . . . . . . . . . . . . . . . . . 103,366 543,214 23,697 345,282Securities lending interest . . . . . . . . . . . . . . . . . . . . . . . . 27,010 22,964 575 65,391Prepaid expenses . . . . . . . . . . . . . . . . . . . . . . . . . . . . . . . . . 46,647 26,739 23,432 36,711
Total Assets . . . . . . . . . . . . . . . . . . . . . . . . . . . . . . . . . . . . . . . . . 1,859,128,312 503,101,276 65,945,400 1,388,231,935
LiabilitiesCollateral held for securities on loan. . . . . . . . . . . . . . . . . 14,658,453 4,343,630 17 59,369,095Payables and other accrued expenses:
Options written at value4 . . . . . . . . . . . . . . . . . . . . . . . . . — — 13,948,320 —Fund shares sold . . . . . . . . . . . . . . . . . . . . . . . . . . . . . . . . . . 1,039,219 270,770 101,900 2,285,163Investments purchased . . . . . . . . . . . . . . . . . . . . . . . . . . . 3,914,581 10,746,772 — 3,301,742Investment management fees . . . . . . . . . . . . . . . . . . . . 1,170,481 406,592 33,820 1,082,793Distribution and service plan fees. . . . . . . . . . . . . . . . . 2,809 382 392 12,886Professional fees . . . . . . . . . . . . . . . . . . . . . . . . . . . . . . . . . . 113,839 55,950 32,360 103,347Directors' fees . . . . . . . . . . . . . . . . . . . . . . . . . . . . . . . . . . . . 803 242 26 632Transfer agent fees. . . . . . . . . . . . . . . . . . . . . . . . . . . . . . . . 100,190 42,743 5,378 318,090Other . . . . . . . . . . . . . . . . . . . . . . . . . . . . . . . . . . . . . . . . . . . . . 97,315 28,579 11,167 147,491
Total Liabilities . . . . . . . . . . . . . . . . . . . . . . . . . . . . . . . . . . . . . . 21,097,690 15,895,660 14,133,380 66,621,239
Net Assets . . . . . . . . . . . . . . . . . . . . . . . . . . . . . . . . . . . . . . . . . . $1,838,030,622 $487,205,616 $51,812,020 $1,321,610,696
Net Assets Consist ofPaid-in capital . . . . . . . . . . . . . . . . . . . . . . . . . . . . . . . . . . . . . . . $1,743,607,984 $427,535,729 $39,034,516 $1,302,581,162Accumulated earnings . . . . . . . . . . . . . . . . . . . . . . . . . . . . . . 94,422,638 59,669,887 12,777,504 19,029,534
Net Assets . . . . . . . . . . . . . . . . . . . . . . . . . . . . . . . . . . . . . . . . . . $1,838,030,622 $487,205,616 $51,812,020 $1,321,610,6961 Investments at cost . . . . . . . . . . . . . . . . . . . . . . . . . . . . . . . $1,627,671,310 $393,284,105 $52,002,467 $1,265,284,980
2 Including securities on loan valued at $236,120,414, $44,556,428, $4,291,688 and $210,351,394 respectively. See Note 4 inNotes to Financial Statements.
3 Repurchase agreements at cost are $10,227,453, $4,343,630, $17 and $43,657,095, respectively.4 Written options, premium received of $—, $—, $10,000,167, and $—, respectively.
Meridian Fund, Inc.Statements of Assets and Liabilities
The accompanying notes are an integral part of the financial statements.
Meridian Funds 45 www.meridianfund.com
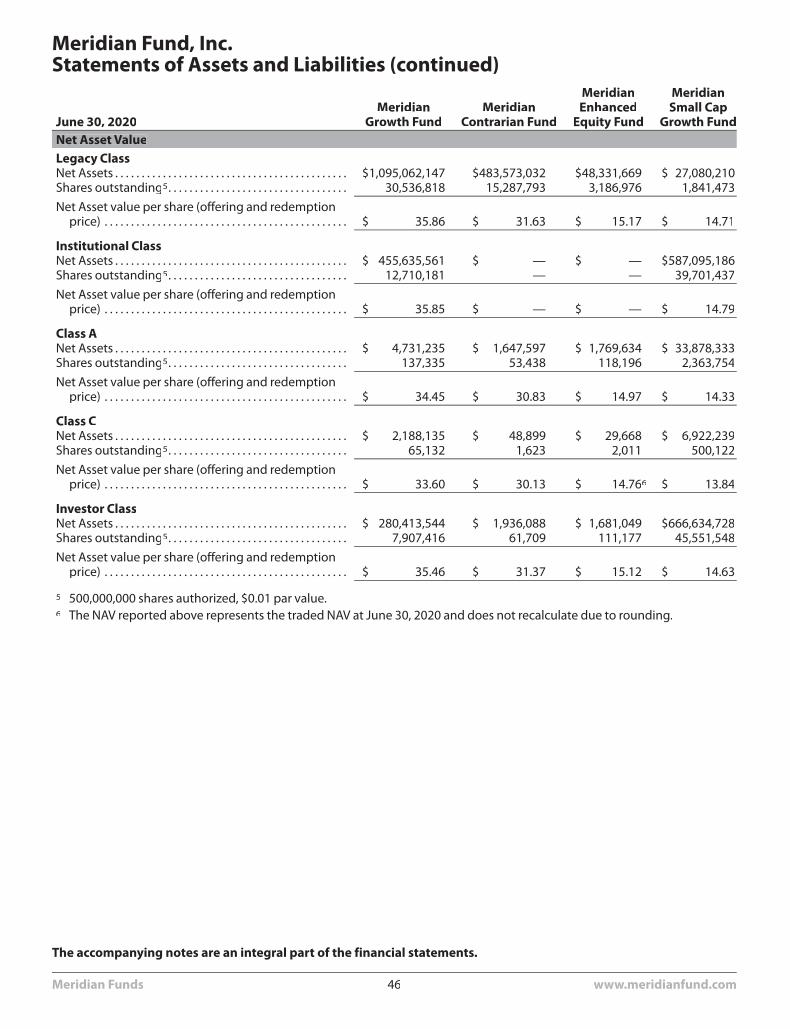
June 30, 2020Meridian
Growth FundMeridian
Contrarian Fund
MeridianEnhanced
Equity Fund
MeridianSmall Cap
Growth FundNet Asset ValueLegacy ClassNet Assets . . . . . . . . . . . . . . . . . . . . . . . . . . . . . . . . . . . . . . . . . . . . $1,095,062,147 $483,573,032 $48,331,669 $ 27,080,210Shares outstanding5. . . . . . . . . . . . . . . . . . . . . . . . . . . . . . . . . . 30,536,818 15,287,793 3,186,976 1,841,473
Net Asset value per share (offering and redemptionprice) . . . . . . . . . . . . . . . . . . . . . . . . . . . . . . . . . . . . . . . . . . . . . . $ 35.86 $ 31.63 $ 15.17 $ 14.71
Institutional ClassNet Assets . . . . . . . . . . . . . . . . . . . . . . . . . . . . . . . . . . . . . . . . . . . . $ 455,635,561 $ — $ — $587,095,186Shares outstanding5. . . . . . . . . . . . . . . . . . . . . . . . . . . . . . . . . . 12,710,181 — — 39,701,437
Net Asset value per share (offering and redemptionprice) . . . . . . . . . . . . . . . . . . . . . . . . . . . . . . . . . . . . . . . . . . . . . . $ 35.85 $ — $ — $ 14.79
Class ANet Assets . . . . . . . . . . . . . . . . . . . . . . . . . . . . . . . . . . . . . . . . . . . . $ 4,731,235 $ 1,647,597 $ 1,769,634 $ 33,878,333Shares outstanding5. . . . . . . . . . . . . . . . . . . . . . . . . . . . . . . . . . 137,335 53,438 118,196 2,363,754
Net Asset value per share (offering and redemptionprice) . . . . . . . . . . . . . . . . . . . . . . . . . . . . . . . . . . . . . . . . . . . . . . $ 34.45 $ 30.83 $ 14.97 $ 14.33
Class CNet Assets . . . . . . . . . . . . . . . . . . . . . . . . . . . . . . . . . . . . . . . . . . . . $ 2,188,135 $ 48,899 $ 29,668 $ 6,922,239Shares outstanding5. . . . . . . . . . . . . . . . . . . . . . . . . . . . . . . . . . 65,132 1,623 2,011 500,122
Net Asset value per share (offering and redemptionprice) . . . . . . . . . . . . . . . . . . . . . . . . . . . . . . . . . . . . . . . . . . . . . . $ 33.60 $ 30.13 $ 14.766 $ 13.84
Investor ClassNet Assets . . . . . . . . . . . . . . . . . . . . . . . . . . . . . . . . . . . . . . . . . . . . $ 280,413,544 $ 1,936,088 $ 1,681,049 $666,634,728Shares outstanding5. . . . . . . . . . . . . . . . . . . . . . . . . . . . . . . . . . 7,907,416 61,709 111,177 45,551,548
Net Asset value per share (offering and redemptionprice) . . . . . . . . . . . . . . . . . . . . . . . . . . . . . . . . . . . . . . . . . . . . . . $ 35.46 $ 31.37 $ 15.12 $ 14.63
5 500,000,000 shares authorized, $0.01 par value.6 The NAV reported above represents the traded NAV at June 30, 2020 and does not recalculate due to rounding.
Meridian Fund, Inc.Statements of Assets and Liabilities (continued)
The accompanying notes are an integral part of the financial statements.
Meridian Funds 46 www.meridianfund.com
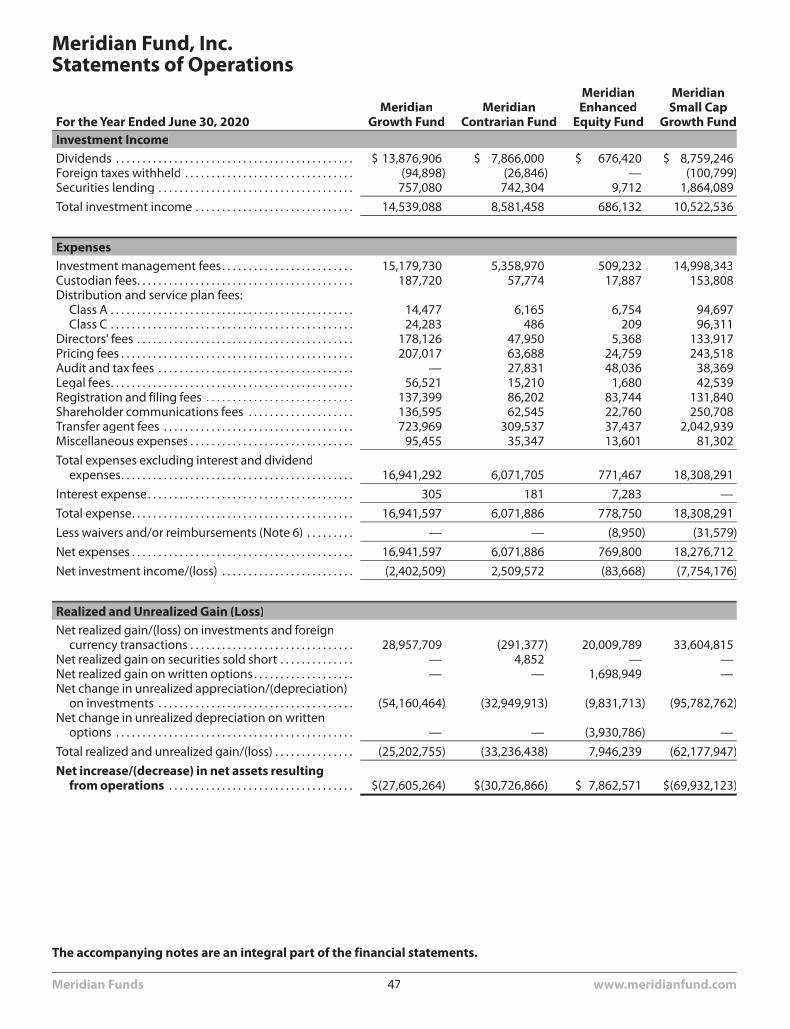
For the Year Ended June 30, 2020Meridian
Growth FundMeridian
Contrarian Fund
MeridianEnhanced
Equity Fund
MeridianSmall Cap
Growth FundInvestment IncomeDividends . . . . . . . . . . . . . . . . . . . . . . . . . . . . . . . . . . . . . . . . . . . . . $ 13,876,906 $ 7,866,000 $ 676,420 $ 8,759,246Foreign taxes withheld . . . . . . . . . . . . . . . . . . . . . . . . . . . . . . . . (94,898) (26,846) — (100,799)Securities lending . . . . . . . . . . . . . . . . . . . . . . . . . . . . . . . . . . . . . 757,080 742,304 9,712 1,864,089
Total investment income . . . . . . . . . . . . . . . . . . . . . . . . . . . . . . 14,539,088 8,581,458 686,132 10,522,536
ExpensesInvestment management fees. . . . . . . . . . . . . . . . . . . . . . . . . 15,179,730 5,358,970 509,232 14,998,343Custodian fees. . . . . . . . . . . . . . . . . . . . . . . . . . . . . . . . . . . . . . . . . 187,720 57,774 17,887 153,808Distribution and service plan fees:
Class A . . . . . . . . . . . . . . . . . . . . . . . . . . . . . . . . . . . . . . . . . . . . . . 14,477 6,165 6,754 94,697Class C . . . . . . . . . . . . . . . . . . . . . . . . . . . . . . . . . . . . . . . . . . . . . . 24,283 486 209 96,311
Directors' fees . . . . . . . . . . . . . . . . . . . . . . . . . . . . . . . . . . . . . . . . . 178,126 47,950 5,368 133,917Pricing fees . . . . . . . . . . . . . . . . . . . . . . . . . . . . . . . . . . . . . . . . . . . . 207,017 63,688 24,759 243,518Audit and tax fees . . . . . . . . . . . . . . . . . . . . . . . . . . . . . . . . . . . . . — 27,831 48,036 38,369Legal fees. . . . . . . . . . . . . . . . . . . . . . . . . . . . . . . . . . . . . . . . . . . . . . 56,521 15,210 1,680 42,539Registration and filing fees . . . . . . . . . . . . . . . . . . . . . . . . . . . . 137,399 86,202 83,744 131,840Shareholder communications fees . . . . . . . . . . . . . . . . . . . . 136,595 62,545 22,760 250,708Transfer agent fees . . . . . . . . . . . . . . . . . . . . . . . . . . . . . . . . . . . . 723,969 309,537 37,437 2,042,939Miscellaneous expenses . . . . . . . . . . . . . . . . . . . . . . . . . . . . . . . 95,455 35,347 13,601 81,302
Total expenses excluding interest and dividendexpenses. . . . . . . . . . . . . . . . . . . . . . . . . . . . . . . . . . . . . . . . . . . . 16,941,292 6,071,705 771,467 18,308,291
Interest expense. . . . . . . . . . . . . . . . . . . . . . . . . . . . . . . . . . . . . . . 305 181 7,283 —
Total expense. . . . . . . . . . . . . . . . . . . . . . . . . . . . . . . . . . . . . . . . . . 16,941,597 6,071,886 778,750 18,308,291
Less waivers and/or reimbursements (Note 6) . . . . . . . . . — — (8,950) (31,579)
Net expenses . . . . . . . . . . . . . . . . . . . . . . . . . . . . . . . . . . . . . . . . . . 16,941,597 6,071,886 769,800 18,276,712
Net investment income/(loss) . . . . . . . . . . . . . . . . . . . . . . . . . (2,402,509) 2,509,572 (83,668) (7,754,176)
Realized and Unrealized Gain (Loss)Net realized gain/(loss) on investments and foreign
currency transactions . . . . . . . . . . . . . . . . . . . . . . . . . . . . . . . 28,957,709 (291,377) 20,009,789 33,604,815Net realized gain on securities sold short . . . . . . . . . . . . . . — 4,852 — —Net realized gain on written options. . . . . . . . . . . . . . . . . . . — — 1,698,949 —Net change in unrealized appreciation/(depreciation)
on investments . . . . . . . . . . . . . . . . . . . . . . . . . . . . . . . . . . . . . (54,160,464) (32,949,913) (9,831,713) (95,782,762)Net change in unrealized depreciation on written
options . . . . . . . . . . . . . . . . . . . . . . . . . . . . . . . . . . . . . . . . . . . . . — — (3,930,786) —
Total realized and unrealized gain/(loss) . . . . . . . . . . . . . . . (25,202,755) (33,236,438) 7,946,239 (62,177,947)
Net increase/(decrease) in net assets resultingfrom operations . . . . . . . . . . . . . . . . . . . . . . . . . . . . . . . . . . . $(27,605,264) $(30,726,866) $ 7,862,571 $(69,932,123)
Meridian Fund, Inc.Statements of Operations
The accompanying notes are an integral part of the financial statements.
Meridian Funds 47 www.meridianfund.com
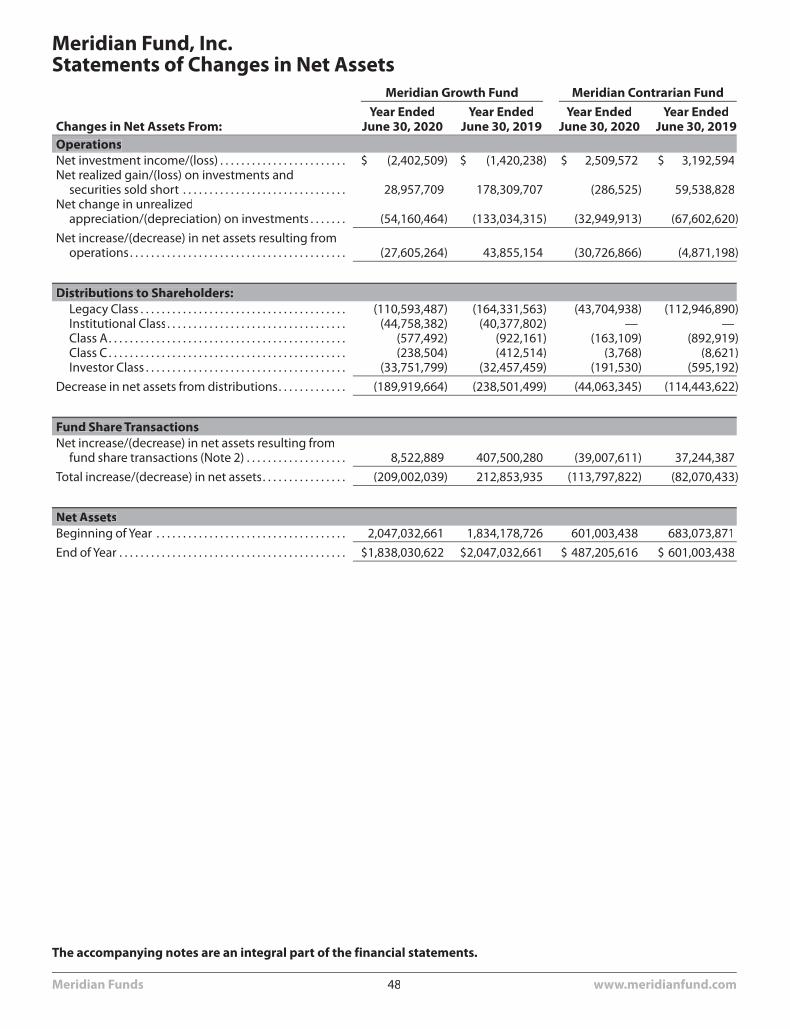
Meridian Growth Fund Meridian Contrarian Fund
Changes in Net Assets From:Year Ended
June 30, 2020Year Ended
June 30, 2019Year Ended
June 30, 2020Year Ended
June 30, 2019OperationsNet investment income/(loss) . . . . . . . . . . . . . . . . . . . . . . . . $ (2,402,509) $ (1,420,238) $ 2,509,572 $ 3,192,594Net realized gain/(loss) on investments and
securities sold short . . . . . . . . . . . . . . . . . . . . . . . . . . . . . . . 28,957,709 178,309,707 (286,525) 59,538,828Net change in unrealized
appreciation/(depreciation) on investments . . . . . . . (54,160,464) (133,034,315) (32,949,913) (67,602,620)
Net increase/(decrease) in net assets resulting fromoperations. . . . . . . . . . . . . . . . . . . . . . . . . . . . . . . . . . . . . . . . . (27,605,264) 43,855,154 (30,726,866) (4,871,198)
Distributions to Shareholders:Legacy Class . . . . . . . . . . . . . . . . . . . . . . . . . . . . . . . . . . . . . . . (110,593,487) (164,331,563) (43,704,938) (112,946,890)Institutional Class. . . . . . . . . . . . . . . . . . . . . . . . . . . . . . . . . . (44,758,382) (40,377,802) — —Class A. . . . . . . . . . . . . . . . . . . . . . . . . . . . . . . . . . . . . . . . . . . . . (577,492) (922,161) (163,109) (892,919)Class C . . . . . . . . . . . . . . . . . . . . . . . . . . . . . . . . . . . . . . . . . . . . . (238,504) (412,514) (3,768) (8,621)Investor Class . . . . . . . . . . . . . . . . . . . . . . . . . . . . . . . . . . . . . . (33,751,799) (32,457,459) (191,530) (595,192)
Decrease in net assets from distributions. . . . . . . . . . . . . (189,919,664) (238,501,499) (44,063,345) (114,443,622)
Fund Share TransactionsNet increase/(decrease) in net assets resulting from
fund share transactions (Note 2) . . . . . . . . . . . . . . . . . . . 8,522,889 407,500,280 (39,007,611) 37,244,387
Total increase/(decrease) in net assets. . . . . . . . . . . . . . . . (209,002,039) 212,853,935 (113,797,822) (82,070,433)
Net AssetsBeginning of Year . . . . . . . . . . . . . . . . . . . . . . . . . . . . . . . . . . . . 2,047,032,661 1,834,178,726 601,003,438 683,073,871
End of Year . . . . . . . . . . . . . . . . . . . . . . . . . . . . . . . . . . . . . . . . . . . $1,838,030,622 $2,047,032,661 $ 487,205,616 $ 601,003,438
Meridian Fund, Inc.Statements of Changes in Net Assets
The accompanying notes are an integral part of the financial statements.
Meridian Funds 48 www.meridianfund.com
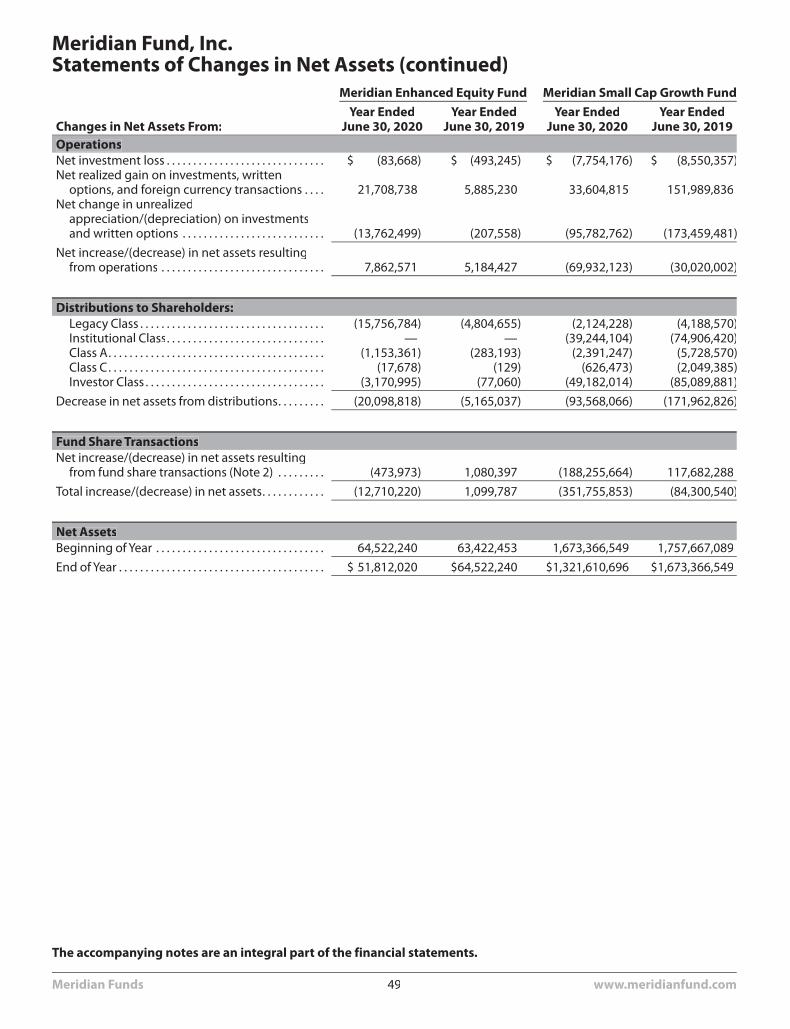
Meridian Enhanced Equity Fund Meridian Small Cap Growth Fund
Changes in Net Assets From:Year Ended
June 30, 2020Year Ended
June 30, 2019Year Ended
June 30, 2020Year Ended
June 30, 2019OperationsNet investment loss . . . . . . . . . . . . . . . . . . . . . . . . . . . . . . $ (83,668) $ (493,245) $ (7,754,176) $ (8,550,357)Net realized gain on investments, written
options, and foreign currency transactions . . . . 21,708,738 5,885,230 33,604,815 151,989,836Net change in unrealized
appreciation/(depreciation) on investmentsand written options . . . . . . . . . . . . . . . . . . . . . . . . . . . (13,762,499) (207,558) (95,782,762) (173,459,481)
Net increase/(decrease) in net assets resultingfrom operations . . . . . . . . . . . . . . . . . . . . . . . . . . . . . . . 7,862,571 5,184,427 (69,932,123) (30,020,002)
Distributions to Shareholders:Legacy Class . . . . . . . . . . . . . . . . . . . . . . . . . . . . . . . . . . . (15,756,784) (4,804,655) (2,124,228) (4,188,570)Institutional Class. . . . . . . . . . . . . . . . . . . . . . . . . . . . . . — — (39,244,104) (74,906,420)Class A. . . . . . . . . . . . . . . . . . . . . . . . . . . . . . . . . . . . . . . . . (1,153,361) (283,193) (2,391,247) (5,728,570)Class C. . . . . . . . . . . . . . . . . . . . . . . . . . . . . . . . . . . . . . . . . (17,678) (129) (626,473) (2,049,385)Investor Class . . . . . . . . . . . . . . . . . . . . . . . . . . . . . . . . . . (3,170,995) (77,060) (49,182,014) (85,089,881)
Decrease in net assets from distributions. . . . . . . . . (20,098,818) (5,165,037) (93,568,066) (171,962,826)
Fund Share TransactionsNet increase/(decrease) in net assets resulting
from fund share transactions (Note 2) . . . . . . . . . (473,973) 1,080,397 (188,255,664) 117,682,288
Total increase/(decrease) in net assets. . . . . . . . . . . . (12,710,220) 1,099,787 (351,755,853) (84,300,540)
Net AssetsBeginning of Year . . . . . . . . . . . . . . . . . . . . . . . . . . . . . . . . 64,522,240 63,422,453 1,673,366,549 1,757,667,089
End of Year . . . . . . . . . . . . . . . . . . . . . . . . . . . . . . . . . . . . . . . $ 51,812,020 $64,522,240 $1,321,610,696 $1,673,366,549
Meridian Fund, Inc.Statements of Changes in Net Assets (continued)
The accompanying notes are an integral part of the financial statements.
Meridian Funds 49 www.meridianfund.com
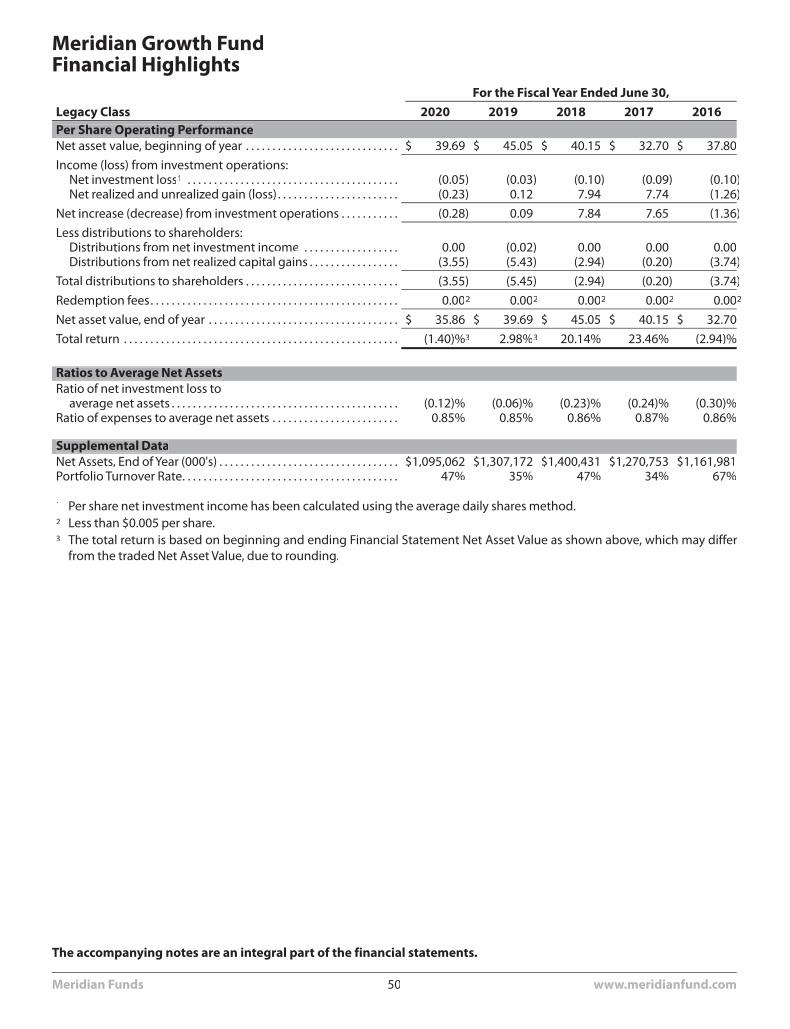
For the Fiscal Year Ended June 30,Legacy Class 2020 2019 2018 2017 2016Per Share Operating PerformanceNet asset value, beginning of year . . . . . . . . . . . . . . . . . . . . . . . . . . . . . $ 39.69 $ 45.05 $ 40.15 $ 32.70 $ 37.80
Income (loss) from investment operations:Net investment loss1 . . . . . . . . . . . . . . . . . . . . . . . . . . . . . . . . . . . . . . . . (0.05) (0.03) (0.10) (0.09) (0.10)Net realized and unrealized gain (loss). . . . . . . . . . . . . . . . . . . . . . . (0.23) 0.12 7.94 7.74 (1.26)
Net increase (decrease) from investment operations . . . . . . . . . . . (0.28) 0.09 7.84 7.65 (1.36)
Less distributions to shareholders:Distributions from net investment income . . . . . . . . . . . . . . . . . . 0.00 (0.02) 0.00 0.00 0.00Distributions from net realized capital gains . . . . . . . . . . . . . . . . . (3.55) (5.43) (2.94) (0.20) (3.74)
Total distributions to shareholders . . . . . . . . . . . . . . . . . . . . . . . . . . . . . (3.55) (5.45) (2.94) (0.20) (3.74)
Redemption fees. . . . . . . . . . . . . . . . . . . . . . . . . . . . . . . . . . . . . . . . . . . . . . . 0.002 0.002 0.002 0.002 0.002
Net asset value, end of year . . . . . . . . . . . . . . . . . . . . . . . . . . . . . . . . . . . . $ 35.86 $ 39.69 $ 45.05 $ 40.15 $ 32.70
Total return . . . . . . . . . . . . . . . . . . . . . . . . . . . . . . . . . . . . . . . . . . . . . . . . . . . . (1.40)%3 2.98%3 20.14% 23.46% (2.94)%
Ratios to Average Net AssetsRatio of net investment loss to
average net assets . . . . . . . . . . . . . . . . . . . . . . . . . . . . . . . . . . . . . . . . . . . (0.12)% (0.06)% (0.23)% (0.24)% (0.30)%Ratio of expenses to average net assets . . . . . . . . . . . . . . . . . . . . . . . . 0.85% 0.85% 0.86% 0.87% 0.86%
Supplemental DataNet Assets, End of Year (000's) . . . . . . . . . . . . . . . . . . . . . . . . . . . . . . . . . . $1,095,062 $1,307,172 $1,400,431 $1,270,753 $1,161,981Portfolio Turnover Rate. . . . . . . . . . . . . . . . . . . . . . . . . . . . . . . . . . . . . . . . . 47% 35% 47% 34% 67%
1 Per share net investment income has been calculated using the average daily shares method.2 Less than $0.005 per share.3 The total return is based on beginning and ending Financial Statement Net Asset Value as shown above, which may differ
from the traded Net Asset Value, due to rounding.
Meridian Growth FundFinancial Highlights
The accompanying notes are an integral part of the financial statements.
Meridian Funds 50 www.meridianfund.com
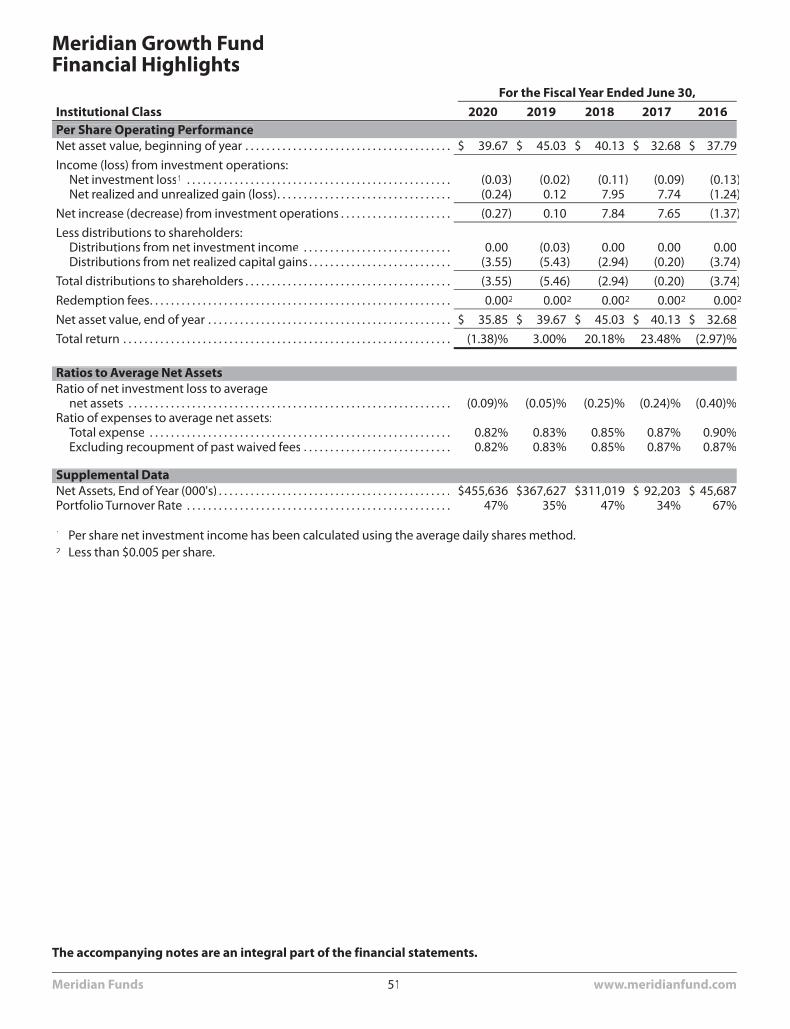
For the Fiscal Year Ended June 30,Institutional Class 2020 2019 2018 2017 2016Per Share Operating PerformanceNet asset value, beginning of year . . . . . . . . . . . . . . . . . . . . . . . . . . . . . . . . . . . . . . . $ 39.67 $ 45.03 $ 40.13 $ 32.68 $ 37.79
Income (loss) from investment operations:Net investment loss1 . . . . . . . . . . . . . . . . . . . . . . . . . . . . . . . . . . . . . . . . . . . . . . . . . . (0.03) (0.02) (0.11) (0.09) (0.13)Net realized and unrealized gain (loss). . . . . . . . . . . . . . . . . . . . . . . . . . . . . . . . . (0.24) 0.12 7.95 7.74 (1.24)
Net increase (decrease) from investment operations . . . . . . . . . . . . . . . . . . . . . (0.27) 0.10 7.84 7.65 (1.37)
Less distributions to shareholders:Distributions from net investment income . . . . . . . . . . . . . . . . . . . . . . . . . . . . 0.00 (0.03) 0.00 0.00 0.00Distributions from net realized capital gains . . . . . . . . . . . . . . . . . . . . . . . . . . . (3.55) (5.43) (2.94) (0.20) (3.74)
Total distributions to shareholders . . . . . . . . . . . . . . . . . . . . . . . . . . . . . . . . . . . . . . . (3.55) (5.46) (2.94) (0.20) (3.74)
Redemption fees. . . . . . . . . . . . . . . . . . . . . . . . . . . . . . . . . . . . . . . . . . . . . . . . . . . . . . . . . 0.002 0.002 0.002 0.002 0.002
Net asset value, end of year . . . . . . . . . . . . . . . . . . . . . . . . . . . . . . . . . . . . . . . . . . . . . . $ 35.85 $ 39.67 $ 45.03 $ 40.13 $ 32.68
Total return . . . . . . . . . . . . . . . . . . . . . . . . . . . . . . . . . . . . . . . . . . . . . . . . . . . . . . . . . . . . . . (1.38)% 3.00% 20.18% 23.48% (2.97)%
Ratios to Average Net AssetsRatio of net investment loss to average
net assets . . . . . . . . . . . . . . . . . . . . . . . . . . . . . . . . . . . . . . . . . . . . . . . . . . . . . . . . . . . . . (0.09)% (0.05)% (0.25)% (0.24)% (0.40)%Ratio of expenses to average net assets:
Total expense . . . . . . . . . . . . . . . . . . . . . . . . . . . . . . . . . . . . . . . . . . . . . . . . . . . . . . . . . 0.82% 0.83% 0.85% 0.87% 0.90%Excluding recoupment of past waived fees . . . . . . . . . . . . . . . . . . . . . . . . . . . . 0.82% 0.83% 0.85% 0.87% 0.87%
Supplemental DataNet Assets, End of Year (000's) . . . . . . . . . . . . . . . . . . . . . . . . . . . . . . . . . . . . . . . . . . . . $455,636 $367,627 $311,019 $ 92,203 $ 45,687Portfolio Turnover Rate . . . . . . . . . . . . . . . . . . . . . . . . . . . . . . . . . . . . . . . . . . . . . . . . . . 47% 35% 47% 34% 67%
1 Per share net investment income has been calculated using the average daily shares method.2 Less than $0.005 per share.
Meridian Growth FundFinancial Highlights
The accompanying notes are an integral part of the financial statements.
Meridian Funds 51 www.meridianfund.com
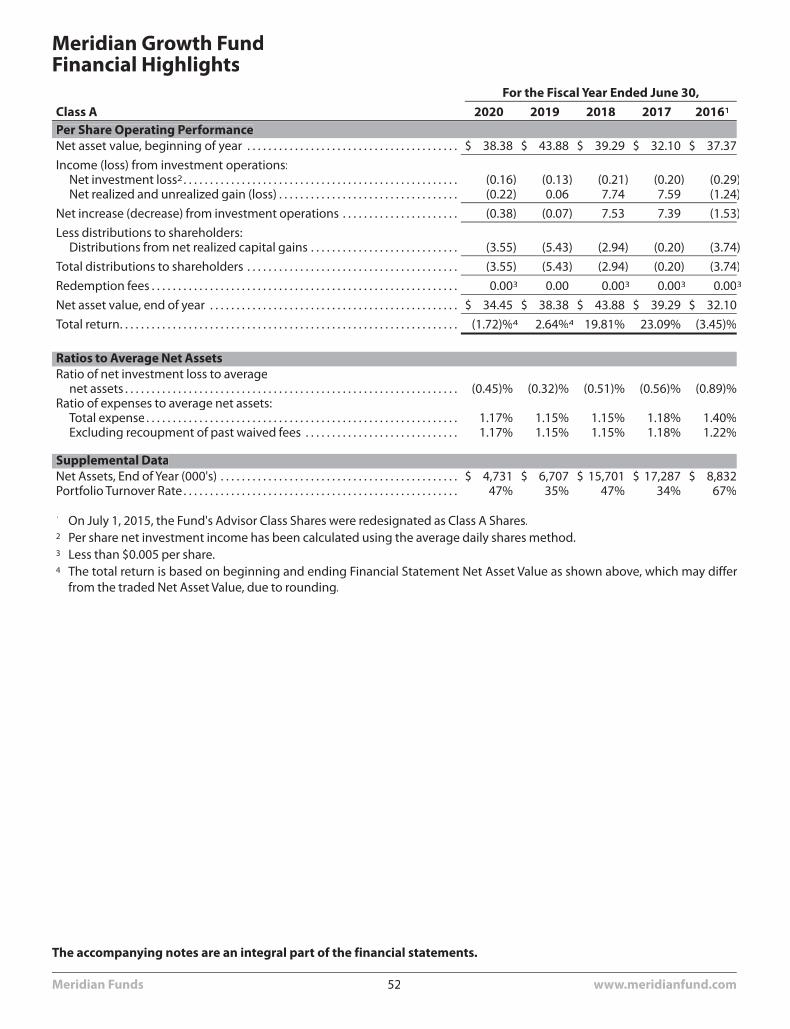
For the Fiscal Year Ended June 30,Class A 2020 2019 2018 2017 20161
Per Share Operating PerformanceNet asset value, beginning of year . . . . . . . . . . . . . . . . . . . . . . . . . . . . . . . . . . . . . . . . $ 38.38 $ 43.88 $ 39.29 $ 32.10 $ 37.37
Income (loss) from investment operations:Net investment loss2. . . . . . . . . . . . . . . . . . . . . . . . . . . . . . . . . . . . . . . . . . . . . . . . . . . . (0.16) (0.13) (0.21) (0.20) (0.29)Net realized and unrealized gain (loss) . . . . . . . . . . . . . . . . . . . . . . . . . . . . . . . . . . (0.22) 0.06 7.74 7.59 (1.24)
Net increase (decrease) from investment operations . . . . . . . . . . . . . . . . . . . . . . (0.38) (0.07) 7.53 7.39 (1.53)
Less distributions to shareholders:Distributions from net realized capital gains . . . . . . . . . . . . . . . . . . . . . . . . . . . . (3.55) (5.43) (2.94) (0.20) (3.74)
Total distributions to shareholders . . . . . . . . . . . . . . . . . . . . . . . . . . . . . . . . . . . . . . . . (3.55) (5.43) (2.94) (0.20) (3.74)
Redemption fees . . . . . . . . . . . . . . . . . . . . . . . . . . . . . . . . . . . . . . . . . . . . . . . . . . . . . . . . . . 0.003 0.00 0.003 0.003 0.003
Net asset value, end of year . . . . . . . . . . . . . . . . . . . . . . . . . . . . . . . . . . . . . . . . . . . . . . . $ 34.45 $ 38.38 $ 43.88 $ 39.29 $ 32.10
Total return. . . . . . . . . . . . . . . . . . . . . . . . . . . . . . . . . . . . . . . . . . . . . . . . . . . . . . . . . . . . . . . . (1.72)%4 2.64%4 19.81% 23.09% (3.45)%
Ratios to Average Net AssetsRatio of net investment loss to average
net assets . . . . . . . . . . . . . . . . . . . . . . . . . . . . . . . . . . . . . . . . . . . . . . . . . . . . . . . . . . . . . . . (0.45)% (0.32)% (0.51)% (0.56)% (0.89)%Ratio of expenses to average net assets:
Total expense . . . . . . . . . . . . . . . . . . . . . . . . . . . . . . . . . . . . . . . . . . . . . . . . . . . . . . . . . . . 1.17% 1.15% 1.15% 1.18% 1.40%Excluding recoupment of past waived fees . . . . . . . . . . . . . . . . . . . . . . . . . . . . . 1.17% 1.15% 1.15% 1.18% 1.22%
Supplemental DataNet Assets, End of Year (000's) . . . . . . . . . . . . . . . . . . . . . . . . . . . . . . . . . . . . . . . . . . . . . $ 4,731 $ 6,707 $ 15,701 $ 17,287 $ 8,832Portfolio Turnover Rate . . . . . . . . . . . . . . . . . . . . . . . . . . . . . . . . . . . . . . . . . . . . . . . . . . . . 47% 35% 47% 34% 67%
1 On July 1, 2015, the Fund's Advisor Class Shares were redesignated as Class A Shares.2 Per share net investment income has been calculated using the average daily shares method.3 Less than $0.005 per share.4 The total return is based on beginning and ending Financial Statement Net Asset Value as shown above, which may differ
from the traded Net Asset Value, due to rounding.
Meridian Growth FundFinancial Highlights
The accompanying notes are an integral part of the financial statements.
Meridian Funds 52 www.meridianfund.com
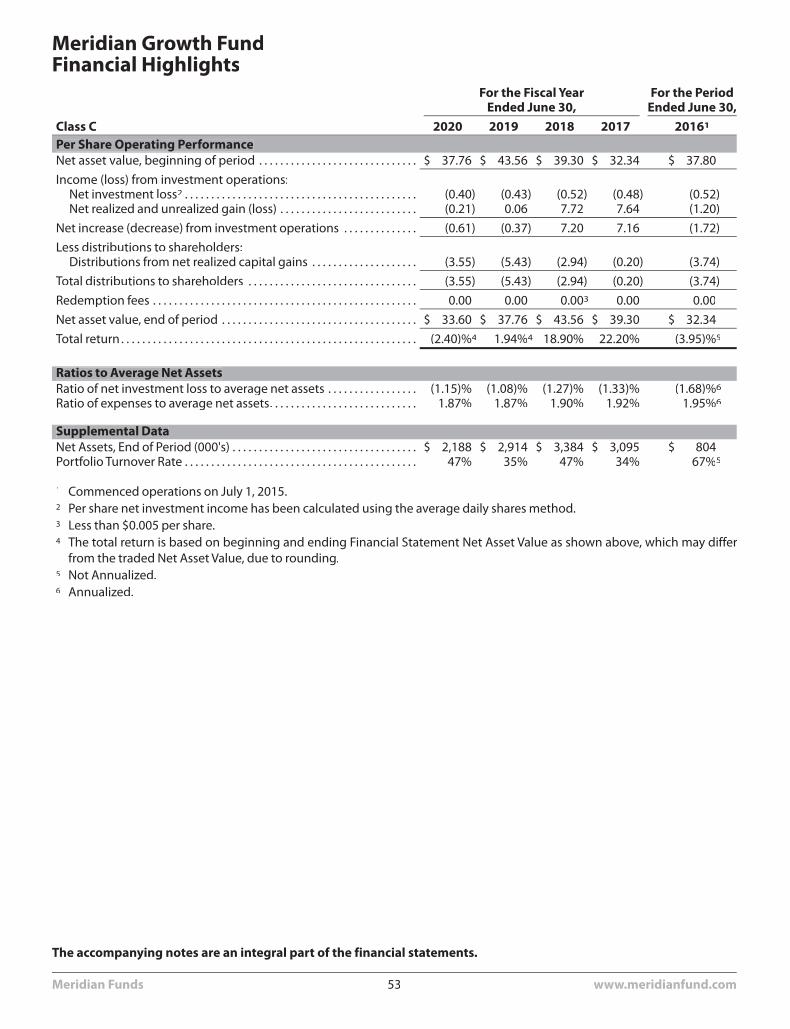
For the Fiscal YearEnded June 30,
For the PeriodEnded June 30,
Class C 2020 2019 2018 2017 20161
Per Share Operating PerformanceNet asset value, beginning of period . . . . . . . . . . . . . . . . . . . . . . . . . . . . . . $ 37.76 $ 43.56 $ 39.30 $ 32.34 $ 37.80
Income (loss) from investment operations:Net investment loss2 . . . . . . . . . . . . . . . . . . . . . . . . . . . . . . . . . . . . . . . . . . . . (0.40) (0.43) (0.52) (0.48) (0.52)Net realized and unrealized gain (loss) . . . . . . . . . . . . . . . . . . . . . . . . . . (0.21) 0.06 7.72 7.64 (1.20)
Net increase (decrease) from investment operations . . . . . . . . . . . . . . (0.61) (0.37) 7.20 7.16 (1.72)
Less distributions to shareholders:Distributions from net realized capital gains . . . . . . . . . . . . . . . . . . . . (3.55) (5.43) (2.94) (0.20) (3.74)
Total distributions to shareholders . . . . . . . . . . . . . . . . . . . . . . . . . . . . . . . . (3.55) (5.43) (2.94) (0.20) (3.74)
Redemption fees . . . . . . . . . . . . . . . . . . . . . . . . . . . . . . . . . . . . . . . . . . . . . . . . . . 0.00 0.00 0.003 0.00 0.00
Net asset value, end of period . . . . . . . . . . . . . . . . . . . . . . . . . . . . . . . . . . . . . $ 33.60 $ 37.76 $ 43.56 $ 39.30 $ 32.34
Total return . . . . . . . . . . . . . . . . . . . . . . . . . . . . . . . . . . . . . . . . . . . . . . . . . . . . . . . . (2.40)%4 1.94%4 18.90% 22.20% (3.95)%5
Ratios to Average Net AssetsRatio of net investment loss to average net assets . . . . . . . . . . . . . . . . . (1.15)% (1.08)% (1.27)% (1.33)% (1.68)%6
Ratio of expenses to average net assets. . . . . . . . . . . . . . . . . . . . . . . . . . . . 1.87% 1.87% 1.90% 1.92% 1.95%6
Supplemental DataNet Assets, End of Period (000's) . . . . . . . . . . . . . . . . . . . . . . . . . . . . . . . . . . . $ 2,188 $ 2,914 $ 3,384 $ 3,095 $ 804Portfolio Turnover Rate . . . . . . . . . . . . . . . . . . . . . . . . . . . . . . . . . . . . . . . . . . . . 47% 35% 47% 34% 67%5
1 Commenced operations on July 1, 2015.2 Per share net investment income has been calculated using the average daily shares method.3 Less than $0.005 per share.4 The total return is based on beginning and ending Financial Statement Net Asset Value as shown above, which may differ
from the traded Net Asset Value, due to rounding.5 Not Annualized.6 Annualized.
Meridian Growth FundFinancial Highlights
The accompanying notes are an integral part of the financial statements.
Meridian Funds 53 www.meridianfund.com
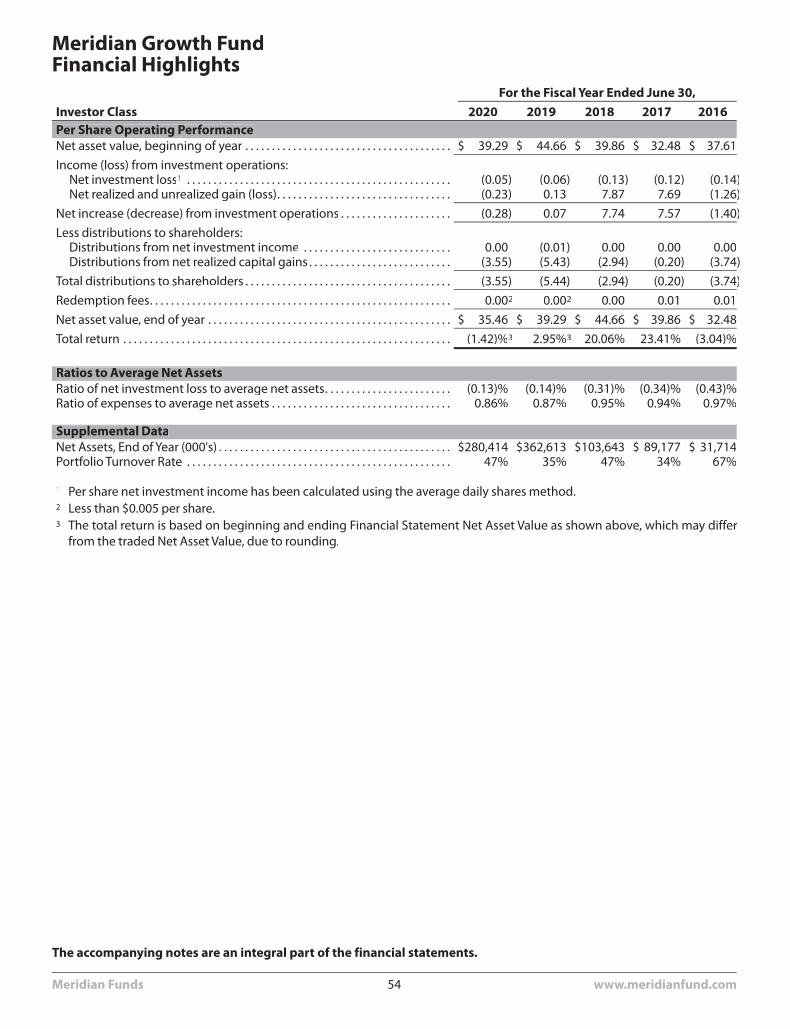
For the Fiscal Year Ended June 30,Investor Class 2020 2019 2018 2017 2016Per Share Operating PerformanceNet asset value, beginning of year . . . . . . . . . . . . . . . . . . . . . . . . . . . . . . . . . . . . . . . $ 39.29 $ 44.66 $ 39.86 $ 32.48 $ 37.61
Income (loss) from investment operations:Net investment loss1 . . . . . . . . . . . . . . . . . . . . . . . . . . . . . . . . . . . . . . . . . . . . . . . . . . (0.05) (0.06) (0.13) (0.12) (0.14)Net realized and unrealized gain (loss). . . . . . . . . . . . . . . . . . . . . . . . . . . . . . . . . (0.23) 0.13 7.87 7.69 (1.26)
Net increase (decrease) from investment operations . . . . . . . . . . . . . . . . . . . . . (0.28) 0.07 7.74 7.57 (1.40)
Less distributions to shareholders:Distributions from net investment income . . . . . . . . . . . . . . . . . . . . . . . . . . . . 0.00 (0.01) 0.00 0.00 0.00Distributions from net realized capital gains . . . . . . . . . . . . . . . . . . . . . . . . . . . (3.55) (5.43) (2.94) (0.20) (3.74)
Total distributions to shareholders . . . . . . . . . . . . . . . . . . . . . . . . . . . . . . . . . . . . . . . (3.55) (5.44) (2.94) (0.20) (3.74)
Redemption fees. . . . . . . . . . . . . . . . . . . . . . . . . . . . . . . . . . . . . . . . . . . . . . . . . . . . . . . . . 0.002 0.002 0.00 0.01 0.01
Net asset value, end of year . . . . . . . . . . . . . . . . . . . . . . . . . . . . . . . . . . . . . . . . . . . . . . $ 35.46 $ 39.29 $ 44.66 $ 39.86 $ 32.48
Total return . . . . . . . . . . . . . . . . . . . . . . . . . . . . . . . . . . . . . . . . . . . . . . . . . . . . . . . . . . . . . . (1.42)%3 2.95%3 20.06% 23.41% (3.04)%
Ratios to Average Net AssetsRatio of net investment loss to average net assets. . . . . . . . . . . . . . . . . . . . . . . . (0.13)% (0.14)% (0.31)% (0.34)% (0.43)%Ratio of expenses to average net assets . . . . . . . . . . . . . . . . . . . . . . . . . . . . . . . . . . 0.86% 0.87% 0.95% 0.94% 0.97%
Supplemental DataNet Assets, End of Year (000's) . . . . . . . . . . . . . . . . . . . . . . . . . . . . . . . . . . . . . . . . . . . . $280,414 $362,613 $103,643 $ 89,177 $ 31,714Portfolio Turnover Rate . . . . . . . . . . . . . . . . . . . . . . . . . . . . . . . . . . . . . . . . . . . . . . . . . . 47% 35% 47% 34% 67%
1 Per share net investment income has been calculated using the average daily shares method.2 Less than $0.005 per share.3 The total return is based on beginning and ending Financial Statement Net Asset Value as shown above, which may differ
from the traded Net Asset Value, due to rounding.
Meridian Growth FundFinancial Highlights
The accompanying notes are an integral part of the financial statements.
Meridian Funds 54 www.meridianfund.com
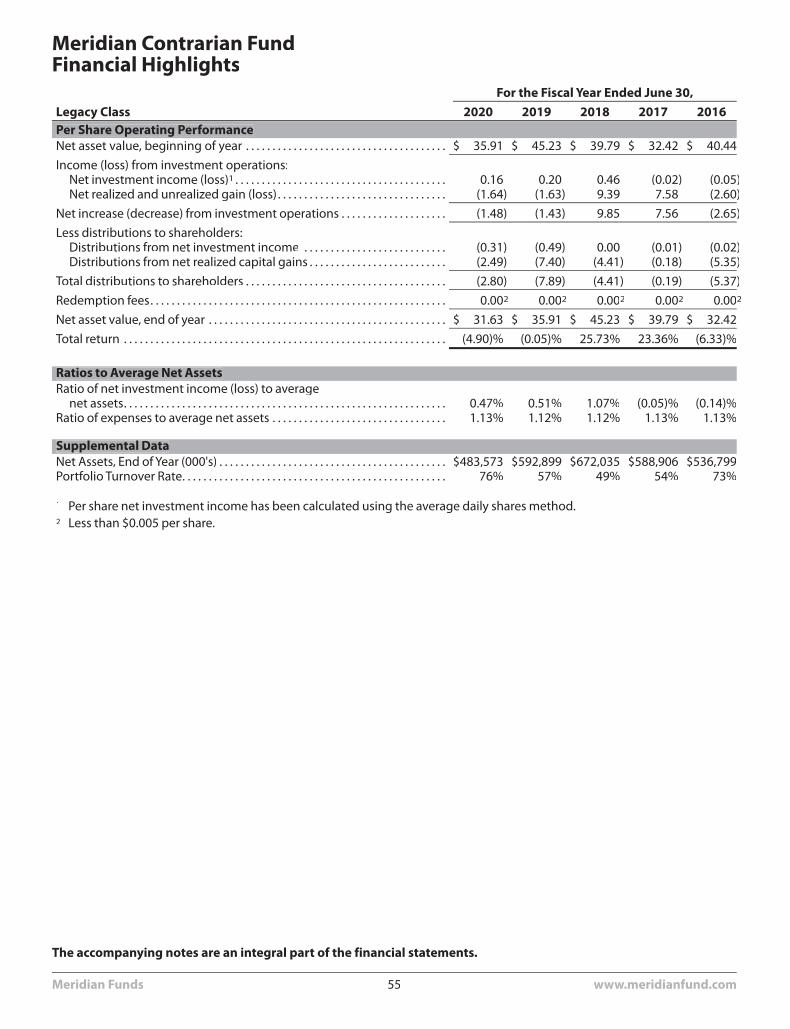
For the Fiscal Year Ended June 30,Legacy Class 2020 2019 2018 2017 2016Per Share Operating PerformanceNet asset value, beginning of year . . . . . . . . . . . . . . . . . . . . . . . . . . . . . . . . . . . . . . $ 35.91 $ 45.23 $ 39.79 $ 32.42 $ 40.44
Income (loss) from investment operations:Net investment income (loss)1 . . . . . . . . . . . . . . . . . . . . . . . . . . . . . . . . . . . . . . . . 0.16 0.20 0.46 (0.02) (0.05)Net realized and unrealized gain (loss). . . . . . . . . . . . . . . . . . . . . . . . . . . . . . . . (1.64) (1.63) 9.39 7.58 (2.60)
Net increase (decrease) from investment operations . . . . . . . . . . . . . . . . . . . . (1.48) (1.43) 9.85 7.56 (2.65)
Less distributions to shareholders:Distributions from net investment income . . . . . . . . . . . . . . . . . . . . . . . . . . . (0.31) (0.49) 0.00 (0.01) (0.02)Distributions from net realized capital gains . . . . . . . . . . . . . . . . . . . . . . . . . . (2.49) (7.40) (4.41) (0.18) (5.35)
Total distributions to shareholders . . . . . . . . . . . . . . . . . . . . . . . . . . . . . . . . . . . . . . (2.80) (7.89) (4.41) (0.19) (5.37)
Redemption fees. . . . . . . . . . . . . . . . . . . . . . . . . . . . . . . . . . . . . . . . . . . . . . . . . . . . . . . . 0.002 0.002 0.002 0.002 0.002
Net asset value, end of year . . . . . . . . . . . . . . . . . . . . . . . . . . . . . . . . . . . . . . . . . . . . . $ 31.63 $ 35.91 $ 45.23 $ 39.79 $ 32.42
Total return . . . . . . . . . . . . . . . . . . . . . . . . . . . . . . . . . . . . . . . . . . . . . . . . . . . . . . . . . . . . . (4.90)% (0.05)% 25.73% 23.36% (6.33)%
Ratios to Average Net AssetsRatio of net investment income (loss) to average
net assets. . . . . . . . . . . . . . . . . . . . . . . . . . . . . . . . . . . . . . . . . . . . . . . . . . . . . . . . . . . . . 0.47% 0.51% 1.07% (0.05)% (0.14)%Ratio of expenses to average net assets . . . . . . . . . . . . . . . . . . . . . . . . . . . . . . . . . 1.13% 1.12% 1.12% 1.13% 1.13%
Supplemental DataNet Assets, End of Year (000's) . . . . . . . . . . . . . . . . . . . . . . . . . . . . . . . . . . . . . . . . . . . $483,573 $592,899 $672,035 $588,906 $536,799Portfolio Turnover Rate. . . . . . . . . . . . . . . . . . . . . . . . . . . . . . . . . . . . . . . . . . . . . . . . . . 76% 57% 49% 54% 73%
1 Per share net investment income has been calculated using the average daily shares method.2 Less than $0.005 per share.
Meridian Contrarian FundFinancial Highlights
The accompanying notes are an integral part of the financial statements.
Meridian Funds 55 www.meridianfund.com
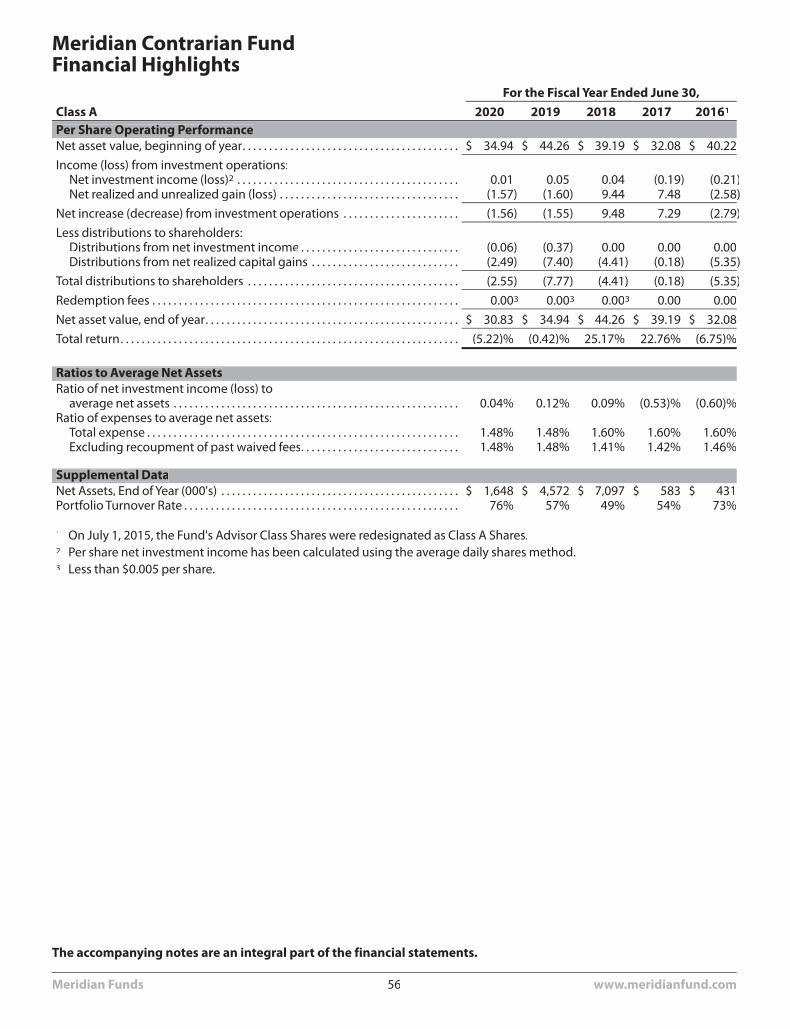
For the Fiscal Year Ended June 30,Class A 2020 2019 2018 2017 20161
Per Share Operating PerformanceNet asset value, beginning of year. . . . . . . . . . . . . . . . . . . . . . . . . . . . . . . . . . . . . . . . . $ 34.94 $ 44.26 $ 39.19 $ 32.08 $ 40.22
Income (loss) from investment operations:Net investment income (loss)2 . . . . . . . . . . . . . . . . . . . . . . . . . . . . . . . . . . . . . . . . . . 0.01 0.05 0.04 (0.19) (0.21)Net realized and unrealized gain (loss) . . . . . . . . . . . . . . . . . . . . . . . . . . . . . . . . . . (1.57) (1.60) 9.44 7.48 (2.58)
Net increase (decrease) from investment operations . . . . . . . . . . . . . . . . . . . . . . (1.56) (1.55) 9.48 7.29 (2.79)
Less distributions to shareholders:Distributions from net investment income . . . . . . . . . . . . . . . . . . . . . . . . . . . . . . (0.06) (0.37) 0.00 0.00 0.00Distributions from net realized capital gains . . . . . . . . . . . . . . . . . . . . . . . . . . . . (2.49) (7.40) (4.41) (0.18) (5.35)
Total distributions to shareholders . . . . . . . . . . . . . . . . . . . . . . . . . . . . . . . . . . . . . . . . (2.55) (7.77) (4.41) (0.18) (5.35)
Redemption fees . . . . . . . . . . . . . . . . . . . . . . . . . . . . . . . . . . . . . . . . . . . . . . . . . . . . . . . . . . 0.003 0.003 0.003 0.00 0.00
Net asset value, end of year. . . . . . . . . . . . . . . . . . . . . . . . . . . . . . . . . . . . . . . . . . . . . . . . $ 30.83 $ 34.94 $ 44.26 $ 39.19 $ 32.08
Total return. . . . . . . . . . . . . . . . . . . . . . . . . . . . . . . . . . . . . . . . . . . . . . . . . . . . . . . . . . . . . . . . (5.22)% (0.42)% 25.17% 22.76% (6.75)%
Ratios to Average Net AssetsRatio of net investment income (loss) to
average net assets . . . . . . . . . . . . . . . . . . . . . . . . . . . . . . . . . . . . . . . . . . . . . . . . . . . . . . 0.04% 0.12% 0.09% (0.53)% (0.60)%Ratio of expenses to average net assets:
Total expense . . . . . . . . . . . . . . . . . . . . . . . . . . . . . . . . . . . . . . . . . . . . . . . . . . . . . . . . . . . 1.48% 1.48% 1.60% 1.60% 1.60%Excluding recoupment of past waived fees. . . . . . . . . . . . . . . . . . . . . . . . . . . . . . 1.48% 1.48% 1.41% 1.42% 1.46%
Supplemental DataNet Assets, End of Year (000's) . . . . . . . . . . . . . . . . . . . . . . . . . . . . . . . . . . . . . . . . . . . . . $ 1,648 $ 4,572 $ 7,097 $ 583 $ 431Portfolio Turnover Rate . . . . . . . . . . . . . . . . . . . . . . . . . . . . . . . . . . . . . . . . . . . . . . . . . . . . 76% 57% 49% 54% 73%
1 On July 1, 2015, the Fund's Advisor Class Shares were redesignated as Class A Shares.2 Per share net investment income has been calculated using the average daily shares method.3 Less than $0.005 per share.
Meridian Contrarian FundFinancial Highlights
The accompanying notes are an integral part of the financial statements.
Meridian Funds 56 www.meridianfund.com
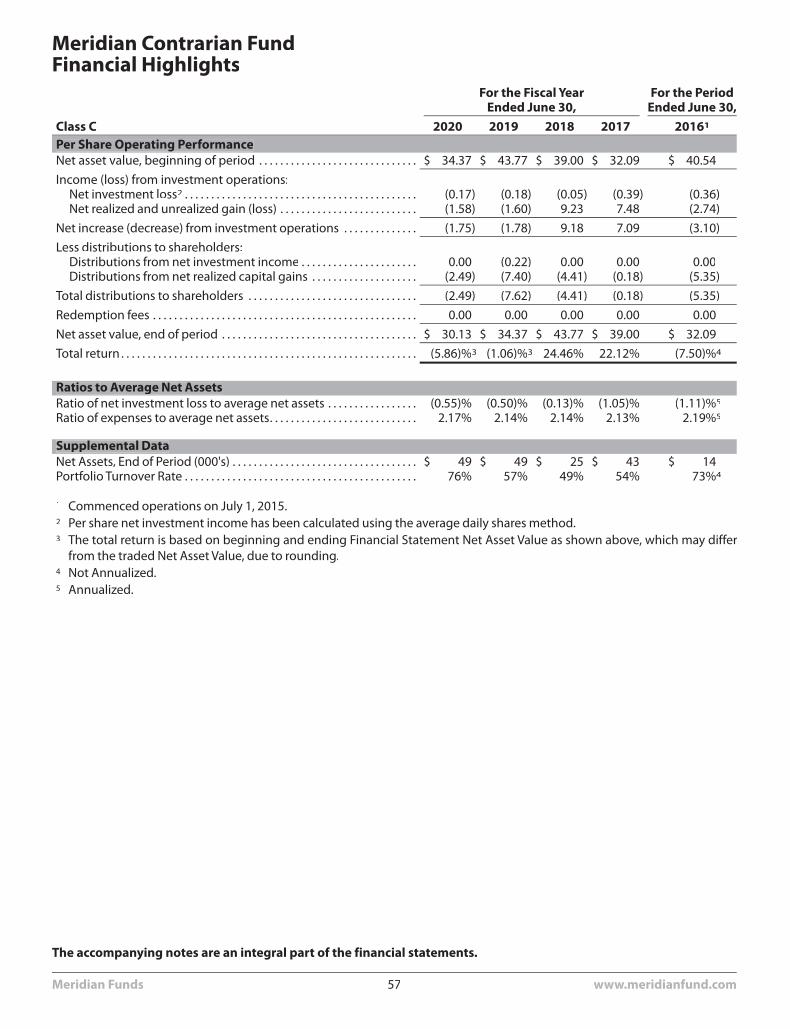
For the Fiscal YearEnded June 30,
For the PeriodEnded June 30,
Class C 2020 2019 2018 2017 20161
Per Share Operating PerformanceNet asset value, beginning of period . . . . . . . . . . . . . . . . . . . . . . . . . . . . . . $ 34.37 $ 43.77 $ 39.00 $ 32.09 $ 40.54
Income (loss) from investment operations:Net investment loss2 . . . . . . . . . . . . . . . . . . . . . . . . . . . . . . . . . . . . . . . . . . . . (0.17) (0.18) (0.05) (0.39) (0.36)Net realized and unrealized gain (loss) . . . . . . . . . . . . . . . . . . . . . . . . . . (1.58) (1.60) 9.23 7.48 (2.74)
Net increase (decrease) from investment operations . . . . . . . . . . . . . . (1.75) (1.78) 9.18 7.09 (3.10)
Less distributions to shareholders:Distributions from net investment income . . . . . . . . . . . . . . . . . . . . . . 0.00 (0.22) 0.00 0.00 0.00Distributions from net realized capital gains . . . . . . . . . . . . . . . . . . . . (2.49) (7.40) (4.41) (0.18) (5.35)
Total distributions to shareholders . . . . . . . . . . . . . . . . . . . . . . . . . . . . . . . . (2.49) (7.62) (4.41) (0.18) (5.35)
Redemption fees . . . . . . . . . . . . . . . . . . . . . . . . . . . . . . . . . . . . . . . . . . . . . . . . . . 0.00 0.00 0.00 0.00 0.00
Net asset value, end of period . . . . . . . . . . . . . . . . . . . . . . . . . . . . . . . . . . . . . $ 30.13 $ 34.37 $ 43.77 $ 39.00 $ 32.09
Total return . . . . . . . . . . . . . . . . . . . . . . . . . . . . . . . . . . . . . . . . . . . . . . . . . . . . . . . . (5.86)%3 (1.06)%3 24.46% 22.12% (7.50)%4
Ratios to Average Net AssetsRatio of net investment loss to average net assets . . . . . . . . . . . . . . . . . (0.55)% (0.50)% (0.13)% (1.05)% (1.11)%5
Ratio of expenses to average net assets. . . . . . . . . . . . . . . . . . . . . . . . . . . . 2.17% 2.14% 2.14% 2.13% 2.19%5
Supplemental DataNet Assets, End of Period (000's) . . . . . . . . . . . . . . . . . . . . . . . . . . . . . . . . . . . $ 49 $ 49 $ 25 $ 43 $ 14Portfolio Turnover Rate . . . . . . . . . . . . . . . . . . . . . . . . . . . . . . . . . . . . . . . . . . . . 76% 57% 49% 54% 73%4
1 Commenced operations on July 1, 2015.2 Per share net investment income has been calculated using the average daily shares method.3 The total return is based on beginning and ending Financial Statement Net Asset Value as shown above, which may differ
from the traded Net Asset Value, due to rounding.4 Not Annualized.5 Annualized.
Meridian Contrarian FundFinancial Highlights
The accompanying notes are an integral part of the financial statements.
Meridian Funds 57 www.meridianfund.com
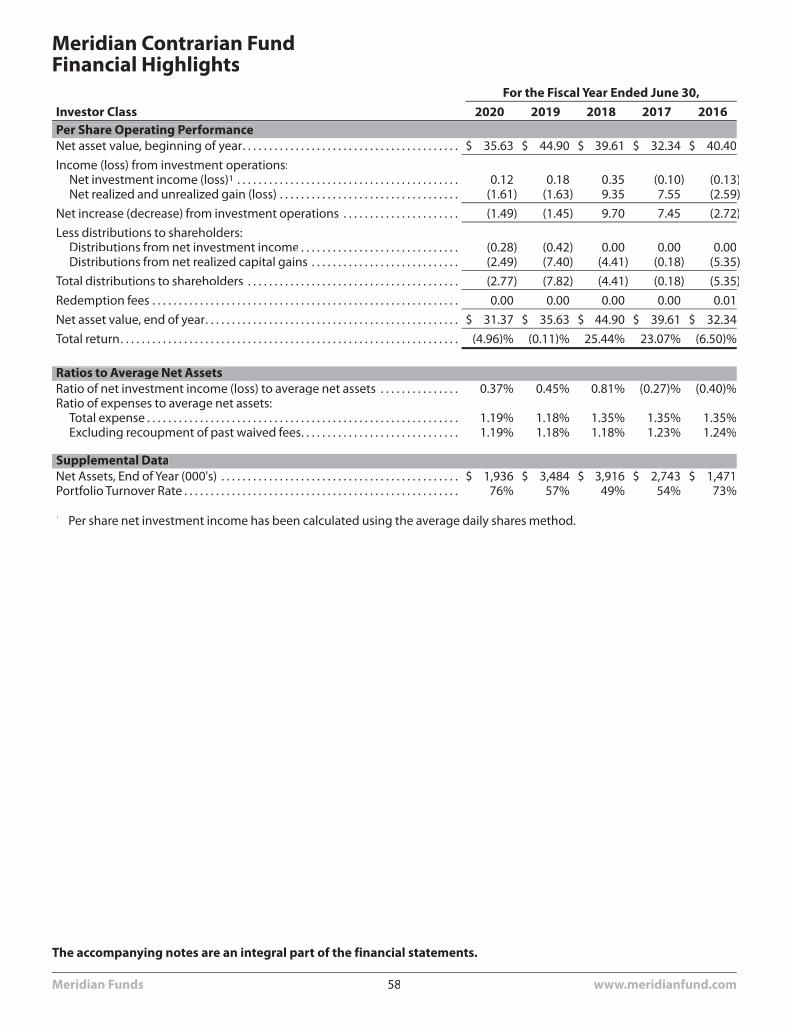
For the Fiscal Year Ended June 30,Investor Class 2020 2019 2018 2017 2016Per Share Operating PerformanceNet asset value, beginning of year. . . . . . . . . . . . . . . . . . . . . . . . . . . . . . . . . . . . . . . . . $ 35.63 $ 44.90 $ 39.61 $ 32.34 $ 40.40
Income (loss) from investment operations:Net investment income (loss)1 . . . . . . . . . . . . . . . . . . . . . . . . . . . . . . . . . . . . . . . . . . 0.12 0.18 0.35 (0.10) (0.13)Net realized and unrealized gain (loss) . . . . . . . . . . . . . . . . . . . . . . . . . . . . . . . . . . (1.61) (1.63) 9.35 7.55 (2.59)
Net increase (decrease) from investment operations . . . . . . . . . . . . . . . . . . . . . . (1.49) (1.45) 9.70 7.45 (2.72)
Less distributions to shareholders:Distributions from net investment income . . . . . . . . . . . . . . . . . . . . . . . . . . . . . . (0.28) (0.42) 0.00 0.00 0.00Distributions from net realized capital gains . . . . . . . . . . . . . . . . . . . . . . . . . . . . (2.49) (7.40) (4.41) (0.18) (5.35)
Total distributions to shareholders . . . . . . . . . . . . . . . . . . . . . . . . . . . . . . . . . . . . . . . . (2.77) (7.82) (4.41) (0.18) (5.35)
Redemption fees . . . . . . . . . . . . . . . . . . . . . . . . . . . . . . . . . . . . . . . . . . . . . . . . . . . . . . . . . . 0.00 0.00 0.00 0.00 0.01
Net asset value, end of year. . . . . . . . . . . . . . . . . . . . . . . . . . . . . . . . . . . . . . . . . . . . . . . . $ 31.37 $ 35.63 $ 44.90 $ 39.61 $ 32.34
Total return. . . . . . . . . . . . . . . . . . . . . . . . . . . . . . . . . . . . . . . . . . . . . . . . . . . . . . . . . . . . . . . . (4.96)% (0.11)% 25.44% 23.07% (6.50)%
Ratios to Average Net AssetsRatio of net investment income (loss) to average net assets . . . . . . . . . . . . . . . 0.37% 0.45% 0.81% (0.27)% (0.40)%Ratio of expenses to average net assets:
Total expense . . . . . . . . . . . . . . . . . . . . . . . . . . . . . . . . . . . . . . . . . . . . . . . . . . . . . . . . . . . 1.19% 1.18% 1.35% 1.35% 1.35%Excluding recoupment of past waived fees. . . . . . . . . . . . . . . . . . . . . . . . . . . . . . 1.19% 1.18% 1.18% 1.23% 1.24%
Supplemental DataNet Assets, End of Year (000's) . . . . . . . . . . . . . . . . . . . . . . . . . . . . . . . . . . . . . . . . . . . . . $ 1,936 $ 3,484 $ 3,916 $ 2,743 $ 1,471Portfolio Turnover Rate . . . . . . . . . . . . . . . . . . . . . . . . . . . . . . . . . . . . . . . . . . . . . . . . . . . . 76% 57% 49% 54% 73%
1 Per share net investment income has been calculated using the average daily shares method.
Meridian Contrarian FundFinancial Highlights
The accompanying notes are an integral part of the financial statements.
Meridian Funds 58 www.meridianfund.com
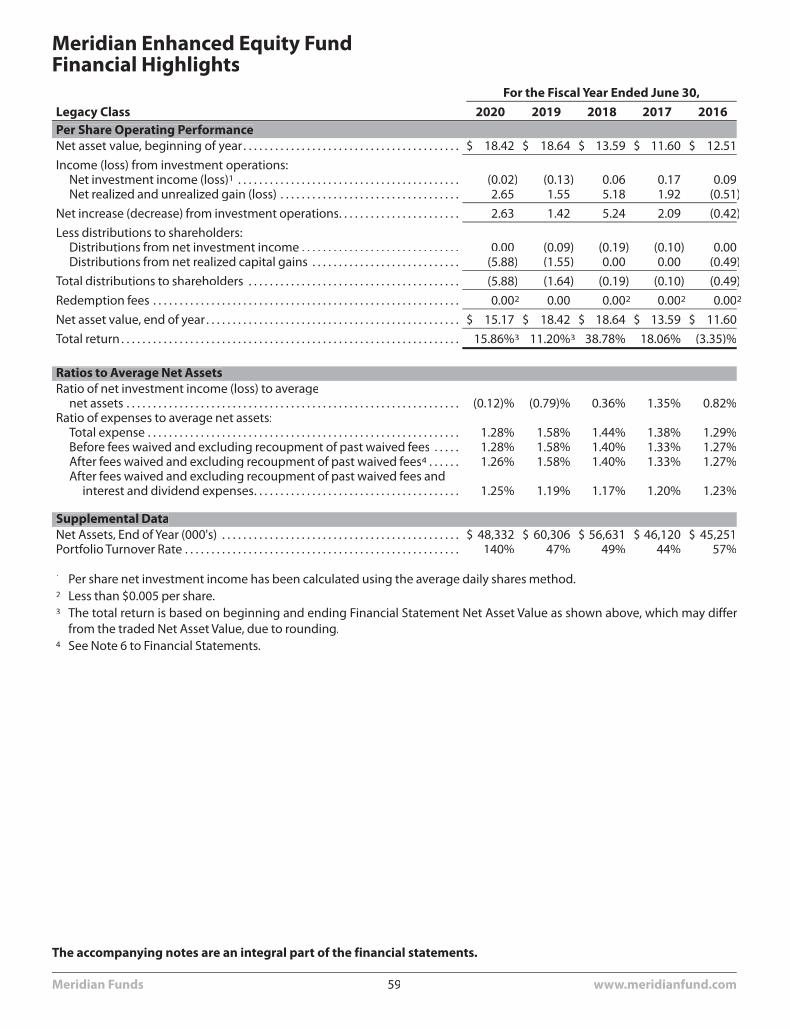
For the Fiscal Year Ended June 30,Legacy Class 2020 2019 2018 2017 2016Per Share Operating PerformanceNet asset value, beginning of year . . . . . . . . . . . . . . . . . . . . . . . . . . . . . . . . . . . . . . . . . $ 18.42 $ 18.64 $ 13.59 $ 11.60 $ 12.51
Income (loss) from investment operations:Net investment income (loss)1 . . . . . . . . . . . . . . . . . . . . . . . . . . . . . . . . . . . . . . . . . . (0.02) (0.13) 0.06 0.17 0.09Net realized and unrealized gain (loss) . . . . . . . . . . . . . . . . . . . . . . . . . . . . . . . . . . 2.65 1.55 5.18 1.92 (0.51)
Net increase (decrease) from investment operations. . . . . . . . . . . . . . . . . . . . . . . 2.63 1.42 5.24 2.09 (0.42)
Less distributions to shareholders:Distributions from net investment income . . . . . . . . . . . . . . . . . . . . . . . . . . . . . . 0.00 (0.09) (0.19) (0.10) 0.00Distributions from net realized capital gains . . . . . . . . . . . . . . . . . . . . . . . . . . . . (5.88) (1.55) 0.00 0.00 (0.49)
Total distributions to shareholders . . . . . . . . . . . . . . . . . . . . . . . . . . . . . . . . . . . . . . . . (5.88) (1.64) (0.19) (0.10) (0.49)
Redemption fees . . . . . . . . . . . . . . . . . . . . . . . . . . . . . . . . . . . . . . . . . . . . . . . . . . . . . . . . . . 0.002 0.00 0.002 0.002 0.002
Net asset value, end of year . . . . . . . . . . . . . . . . . . . . . . . . . . . . . . . . . . . . . . . . . . . . . . . . $ 15.17 $ 18.42 $ 18.64 $ 13.59 $ 11.60
Total return . . . . . . . . . . . . . . . . . . . . . . . . . . . . . . . . . . . . . . . . . . . . . . . . . . . . . . . . . . . . . . . . 15.86%3 11.20%3 38.78% 18.06% (3.35)%
Ratios to Average Net AssetsRatio of net investment income (loss) to average
net assets . . . . . . . . . . . . . . . . . . . . . . . . . . . . . . . . . . . . . . . . . . . . . . . . . . . . . . . . . . . . . . . (0.12)% (0.79)% 0.36% 1.35% 0.82%Ratio of expenses to average net assets:
Total expense . . . . . . . . . . . . . . . . . . . . . . . . . . . . . . . . . . . . . . . . . . . . . . . . . . . . . . . . . . . 1.28% 1.58% 1.44% 1.38% 1.29%Before fees waived and excluding recoupment of past waived fees . . . . . 1.28% 1.58% 1.40% 1.33% 1.27%After fees waived and excluding recoupment of past waived fees4 . . . . . . 1.26% 1.58% 1.40% 1.33% 1.27%After fees waived and excluding recoupment of past waived fees and
interest and dividend expenses. . . . . . . . . . . . . . . . . . . . . . . . . . . . . . . . . . . . . . . 1.25% 1.19% 1.17% 1.20% 1.23%
Supplemental DataNet Assets, End of Year (000's) . . . . . . . . . . . . . . . . . . . . . . . . . . . . . . . . . . . . . . . . . . . . . $ 48,332 $ 60,306 $ 56,631 $ 46,120 $ 45,251Portfolio Turnover Rate . . . . . . . . . . . . . . . . . . . . . . . . . . . . . . . . . . . . . . . . . . . . . . . . . . . . 140% 47% 49% 44% 57%
1 Per share net investment income has been calculated using the average daily shares method.2 Less than $0.005 per share.3 The total return is based on beginning and ending Financial Statement Net Asset Value as shown above, which may differ
from the traded Net Asset Value, due to rounding.4 See Note 6 to Financial Statements.
Meridian Enhanced Equity FundFinancial Highlights
The accompanying notes are an integral part of the financial statements.
Meridian Funds 59 www.meridianfund.com
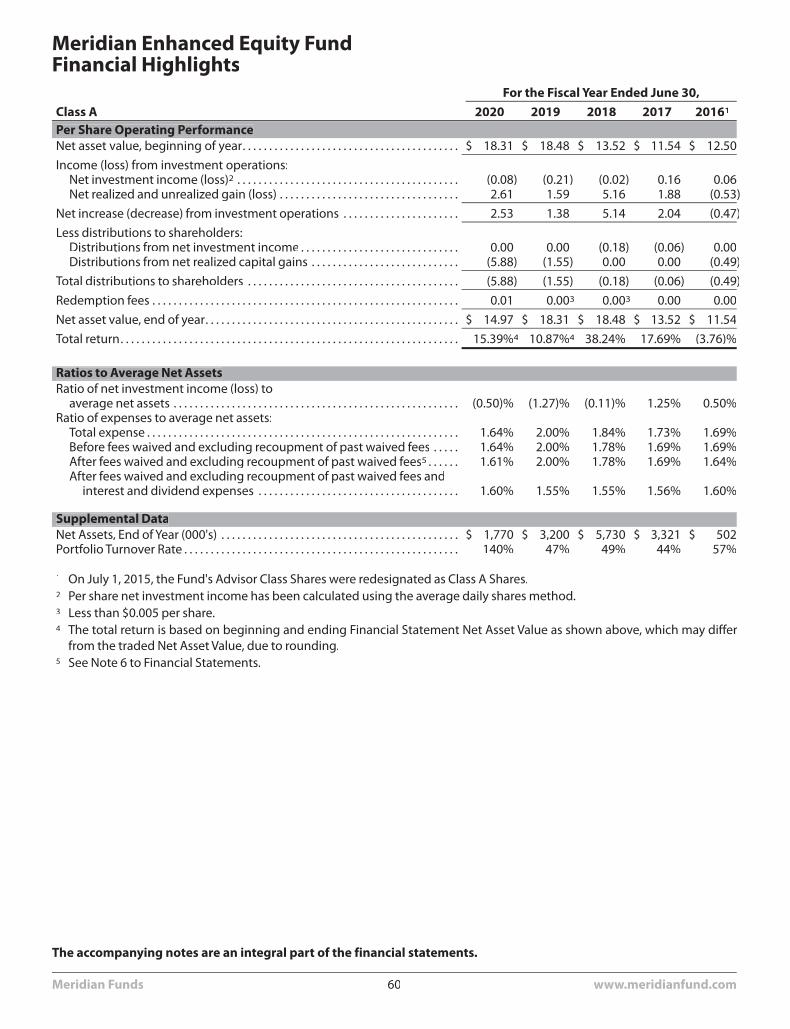
For the Fiscal Year Ended June 30,Class A 2020 2019 2018 2017 20161
Per Share Operating PerformanceNet asset value, beginning of year. . . . . . . . . . . . . . . . . . . . . . . . . . . . . . . . . . . . . . . . . $ 18.31 $ 18.48 $ 13.52 $ 11.54 $ 12.50
Income (loss) from investment operations:Net investment income (loss)2 . . . . . . . . . . . . . . . . . . . . . . . . . . . . . . . . . . . . . . . . . . (0.08) (0.21) (0.02) 0.16 0.06Net realized and unrealized gain (loss) . . . . . . . . . . . . . . . . . . . . . . . . . . . . . . . . . . 2.61 1.59 5.16 1.88 (0.53)
Net increase (decrease) from investment operations . . . . . . . . . . . . . . . . . . . . . . 2.53 1.38 5.14 2.04 (0.47)
Less distributions to shareholders:Distributions from net investment income . . . . . . . . . . . . . . . . . . . . . . . . . . . . . . 0.00 0.00 (0.18) (0.06) 0.00Distributions from net realized capital gains . . . . . . . . . . . . . . . . . . . . . . . . . . . . (5.88) (1.55) 0.00 0.00 (0.49)
Total distributions to shareholders . . . . . . . . . . . . . . . . . . . . . . . . . . . . . . . . . . . . . . . . (5.88) (1.55) (0.18) (0.06) (0.49)
Redemption fees . . . . . . . . . . . . . . . . . . . . . . . . . . . . . . . . . . . . . . . . . . . . . . . . . . . . . . . . . . 0.01 0.003 0.003 0.00 0.00
Net asset value, end of year. . . . . . . . . . . . . . . . . . . . . . . . . . . . . . . . . . . . . . . . . . . . . . . . $ 14.97 $ 18.31 $ 18.48 $ 13.52 $ 11.54
Total return. . . . . . . . . . . . . . . . . . . . . . . . . . . . . . . . . . . . . . . . . . . . . . . . . . . . . . . . . . . . . . . . 15.39%4 10.87%4 38.24% 17.69% (3.76)%
Ratios to Average Net AssetsRatio of net investment income (loss) to
average net assets . . . . . . . . . . . . . . . . . . . . . . . . . . . . . . . . . . . . . . . . . . . . . . . . . . . . . . (0.50)% (1.27)% (0.11)% 1.25% 0.50%Ratio of expenses to average net assets:
Total expense . . . . . . . . . . . . . . . . . . . . . . . . . . . . . . . . . . . . . . . . . . . . . . . . . . . . . . . . . . . 1.64% 2.00% 1.84% 1.73% 1.69%Before fees waived and excluding recoupment of past waived fees . . . . . 1.64% 2.00% 1.78% 1.69% 1.69%After fees waived and excluding recoupment of past waived fees5 . . . . . . 1.61% 2.00% 1.78% 1.69% 1.64%After fees waived and excluding recoupment of past waived fees and
interest and dividend expenses . . . . . . . . . . . . . . . . . . . . . . . . . . . . . . . . . . . . . . 1.60% 1.55% 1.55% 1.56% 1.60%
Supplemental DataNet Assets, End of Year (000's) . . . . . . . . . . . . . . . . . . . . . . . . . . . . . . . . . . . . . . . . . . . . . $ 1,770 $ 3,200 $ 5,730 $ 3,321 $ 502Portfolio Turnover Rate . . . . . . . . . . . . . . . . . . . . . . . . . . . . . . . . . . . . . . . . . . . . . . . . . . . . 140% 47% 49% 44% 57%
1 On July 1, 2015, the Fund's Advisor Class Shares were redesignated as Class A Shares.2 Per share net investment income has been calculated using the average daily shares method.3 Less than $0.005 per share.4 The total return is based on beginning and ending Financial Statement Net Asset Value as shown above, which may differ
from the traded Net Asset Value, due to rounding.5 See Note 6 to Financial Statements.
Meridian Enhanced Equity FundFinancial Highlights
The accompanying notes are an integral part of the financial statements.
Meridian Funds 60 www.meridianfund.com
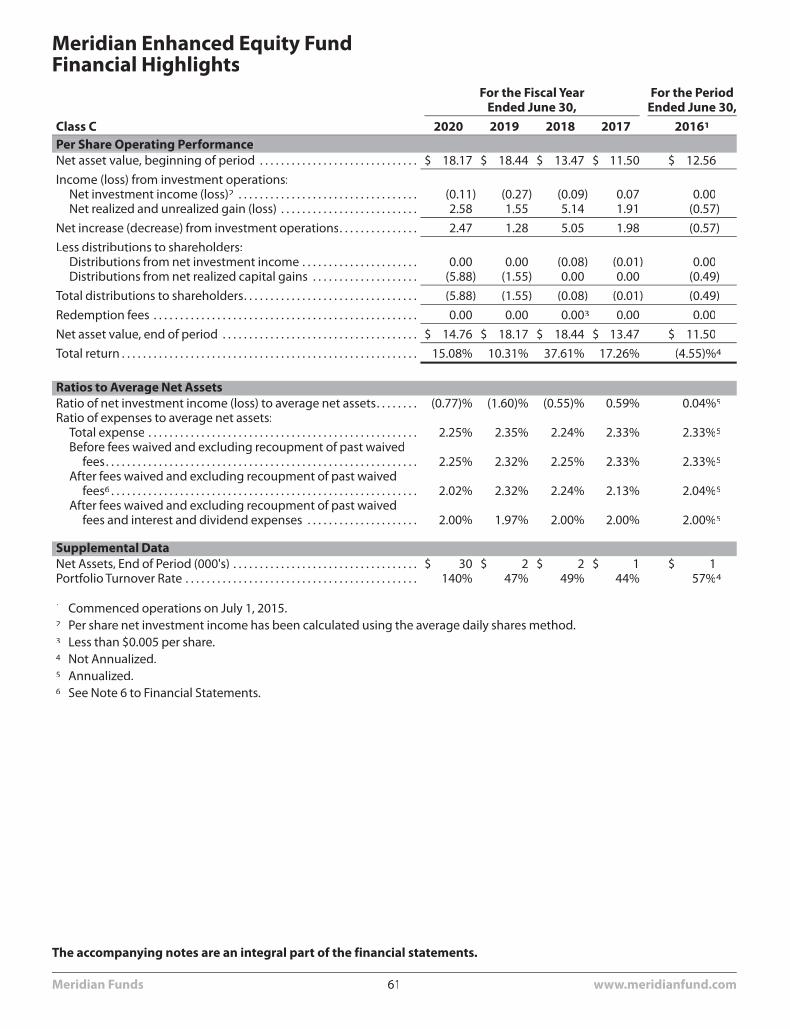
For the Fiscal YearEnded June 30,
For the PeriodEnded June 30,
Class C 2020 2019 2018 2017 20161
Per Share Operating PerformanceNet asset value, beginning of period . . . . . . . . . . . . . . . . . . . . . . . . . . . . . . $ 18.17 $ 18.44 $ 13.47 $ 11.50 $ 12.56
Income (loss) from investment operations:Net investment income (loss)2 . . . . . . . . . . . . . . . . . . . . . . . . . . . . . . . . . . (0.11) (0.27) (0.09) 0.07 0.00Net realized and unrealized gain (loss) . . . . . . . . . . . . . . . . . . . . . . . . . . 2.58 1.55 5.14 1.91 (0.57)
Net increase (decrease) from investment operations. . . . . . . . . . . . . . . 2.47 1.28 5.05 1.98 (0.57)
Less distributions to shareholders:Distributions from net investment income . . . . . . . . . . . . . . . . . . . . . . 0.00 0.00 (0.08) (0.01) 0.00Distributions from net realized capital gains . . . . . . . . . . . . . . . . . . . . (5.88) (1.55) 0.00 0.00 (0.49)
Total distributions to shareholders. . . . . . . . . . . . . . . . . . . . . . . . . . . . . . . . . (5.88) (1.55) (0.08) (0.01) (0.49)
Redemption fees . . . . . . . . . . . . . . . . . . . . . . . . . . . . . . . . . . . . . . . . . . . . . . . . . . 0.00 0.00 0.003 0.00 0.00
Net asset value, end of period . . . . . . . . . . . . . . . . . . . . . . . . . . . . . . . . . . . . . $ 14.76 $ 18.17 $ 18.44 $ 13.47 $ 11.50
Total return . . . . . . . . . . . . . . . . . . . . . . . . . . . . . . . . . . . . . . . . . . . . . . . . . . . . . . . . 15.08% 10.31% 37.61% 17.26% (4.55)%4
Ratios to Average Net AssetsRatio of net investment income (loss) to average net assets. . . . . . . . (0.77)% (1.60)% (0.55)% 0.59% 0.04%5
Ratio of expenses to average net assets:Total expense . . . . . . . . . . . . . . . . . . . . . . . . . . . . . . . . . . . . . . . . . . . . . . . . . . . 2.25% 2.35% 2.24% 2.33% 2.33%5
Before fees waived and excluding recoupment of past waivedfees. . . . . . . . . . . . . . . . . . . . . . . . . . . . . . . . . . . . . . . . . . . . . . . . . . . . . . . . . . . 2.25% 2.32% 2.25% 2.33% 2.33%5
After fees waived and excluding recoupment of past waivedfees6 . . . . . . . . . . . . . . . . . . . . . . . . . . . . . . . . . . . . . . . . . . . . . . . . . . . . . . . . . . 2.02% 2.32% 2.24% 2.13% 2.04%5
After fees waived and excluding recoupment of past waivedfees and interest and dividend expenses . . . . . . . . . . . . . . . . . . . . . 2.00% 1.97% 2.00% 2.00% 2.00%5
Supplemental DataNet Assets, End of Period (000's) . . . . . . . . . . . . . . . . . . . . . . . . . . . . . . . . . . . $ 30 $ 2 $ 2 $ 1 $ 1Portfolio Turnover Rate . . . . . . . . . . . . . . . . . . . . . . . . . . . . . . . . . . . . . . . . . . . . 140% 47% 49% 44% 57%4
1 Commenced operations on July 1, 2015.2 Per share net investment income has been calculated using the average daily shares method.3 Less than $0.005 per share.4 Not Annualized.5 Annualized.6 See Note 6 to Financial Statements.
Meridian Enhanced Equity FundFinancial Highlights
The accompanying notes are an integral part of the financial statements.
Meridian Funds 61 www.meridianfund.com
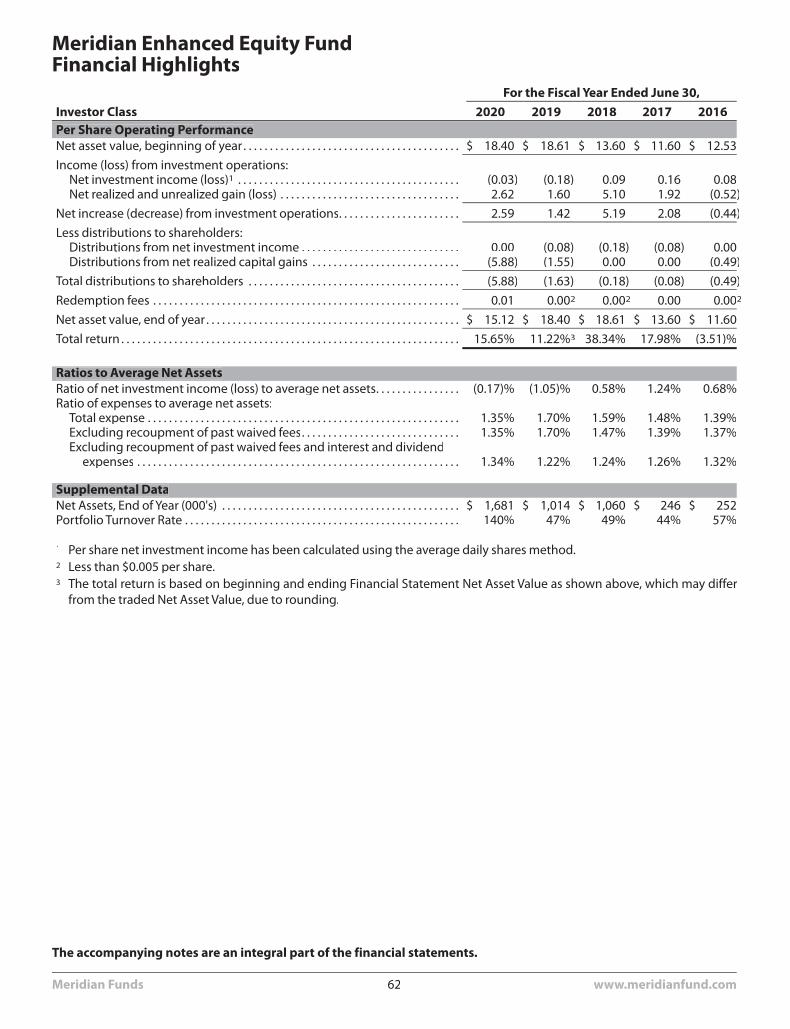
For the Fiscal Year Ended June 30,Investor Class 2020 2019 2018 2017 2016Per Share Operating PerformanceNet asset value, beginning of year . . . . . . . . . . . . . . . . . . . . . . . . . . . . . . . . . . . . . . . . . $ 18.40 $ 18.61 $ 13.60 $ 11.60 $ 12.53
Income (loss) from investment operations:Net investment income (loss)1 . . . . . . . . . . . . . . . . . . . . . . . . . . . . . . . . . . . . . . . . . . (0.03) (0.18) 0.09 0.16 0.08Net realized and unrealized gain (loss) . . . . . . . . . . . . . . . . . . . . . . . . . . . . . . . . . . 2.62 1.60 5.10 1.92 (0.52)
Net increase (decrease) from investment operations. . . . . . . . . . . . . . . . . . . . . . . 2.59 1.42 5.19 2.08 (0.44)
Less distributions to shareholders:Distributions from net investment income . . . . . . . . . . . . . . . . . . . . . . . . . . . . . . 0.00 (0.08) (0.18) (0.08) 0.00Distributions from net realized capital gains . . . . . . . . . . . . . . . . . . . . . . . . . . . . (5.88) (1.55) 0.00 0.00 (0.49)
Total distributions to shareholders . . . . . . . . . . . . . . . . . . . . . . . . . . . . . . . . . . . . . . . . (5.88) (1.63) (0.18) (0.08) (0.49)
Redemption fees . . . . . . . . . . . . . . . . . . . . . . . . . . . . . . . . . . . . . . . . . . . . . . . . . . . . . . . . . . 0.01 0.002 0.002 0.00 0.002
Net asset value, end of year . . . . . . . . . . . . . . . . . . . . . . . . . . . . . . . . . . . . . . . . . . . . . . . . $ 15.12 $ 18.40 $ 18.61 $ 13.60 $ 11.60
Total return . . . . . . . . . . . . . . . . . . . . . . . . . . . . . . . . . . . . . . . . . . . . . . . . . . . . . . . . . . . . . . . . 15.65% 11.22%3 38.34% 17.98% (3.51)%
Ratios to Average Net AssetsRatio of net investment income (loss) to average net assets. . . . . . . . . . . . . . . . (0.17)% (1.05)% 0.58% 1.24% 0.68%Ratio of expenses to average net assets:
Total expense . . . . . . . . . . . . . . . . . . . . . . . . . . . . . . . . . . . . . . . . . . . . . . . . . . . . . . . . . . . 1.35% 1.70% 1.59% 1.48% 1.39%Excluding recoupment of past waived fees. . . . . . . . . . . . . . . . . . . . . . . . . . . . . . 1.35% 1.70% 1.47% 1.39% 1.37%Excluding recoupment of past waived fees and interest and dividend
expenses . . . . . . . . . . . . . . . . . . . . . . . . . . . . . . . . . . . . . . . . . . . . . . . . . . . . . . . . . . . . . 1.34% 1.22% 1.24% 1.26% 1.32%
Supplemental DataNet Assets, End of Year (000's) . . . . . . . . . . . . . . . . . . . . . . . . . . . . . . . . . . . . . . . . . . . . . $ 1,681 $ 1,014 $ 1,060 $ 246 $ 252Portfolio Turnover Rate . . . . . . . . . . . . . . . . . . . . . . . . . . . . . . . . . . . . . . . . . . . . . . . . . . . . 140% 47% 49% 44% 57%
1 Per share net investment income has been calculated using the average daily shares method.2 Less than $0.005 per share.3 The total return is based on beginning and ending Financial Statement Net Asset Value as shown above, which may differ
from the traded Net Asset Value, due to rounding.
Meridian Enhanced Equity FundFinancial Highlights
The accompanying notes are an integral part of the financial statements.
Meridian Funds 62 www.meridianfund.com
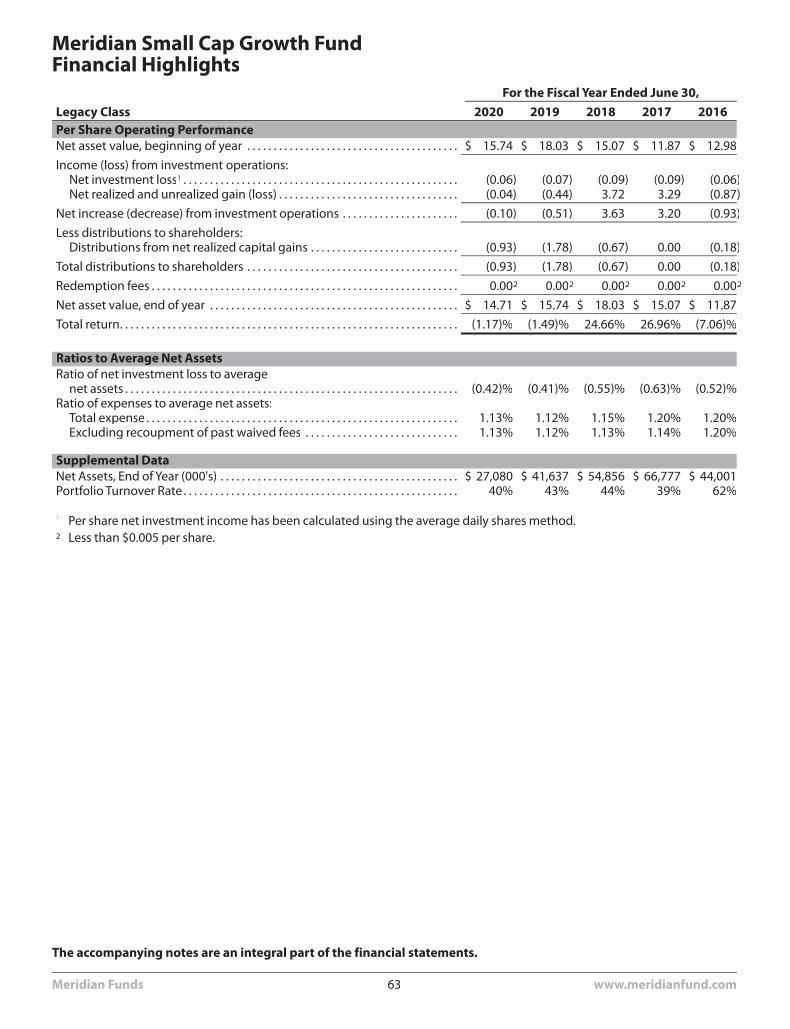
For the Fiscal Year Ended June 30,Legacy Class 2020 2019 2018 2017 2016Per Share Operating PerformanceNet asset value, beginning of year . . . . . . . . . . . . . . . . . . . . . . . . . . . . . . . . . . . . . . . . $ 15.74 $ 18.03 $ 15.07 $ 11.87 $ 12.98
Income (loss) from investment operations:Net investment loss1. . . . . . . . . . . . . . . . . . . . . . . . . . . . . . . . . . . . . . . . . . . . . . . . . . . . (0.06) (0.07) (0.09) (0.09) (0.06)Net realized and unrealized gain (loss) . . . . . . . . . . . . . . . . . . . . . . . . . . . . . . . . . . (0.04) (0.44) 3.72 3.29 (0.87)
Net increase (decrease) from investment operations . . . . . . . . . . . . . . . . . . . . . . (0.10) (0.51) 3.63 3.20 (0.93)
Less distributions to shareholders:Distributions from net realized capital gains . . . . . . . . . . . . . . . . . . . . . . . . . . . . (0.93) (1.78) (0.67) 0.00 (0.18)
Total distributions to shareholders . . . . . . . . . . . . . . . . . . . . . . . . . . . . . . . . . . . . . . . . (0.93) (1.78) (0.67) 0.00 (0.18)
Redemption fees . . . . . . . . . . . . . . . . . . . . . . . . . . . . . . . . . . . . . . . . . . . . . . . . . . . . . . . . . . 0.002 0.002 0.002 0.002 0.002
Net asset value, end of year . . . . . . . . . . . . . . . . . . . . . . . . . . . . . . . . . . . . . . . . . . . . . . . $ 14.71 $ 15.74 $ 18.03 $ 15.07 $ 11.87
Total return. . . . . . . . . . . . . . . . . . . . . . . . . . . . . . . . . . . . . . . . . . . . . . . . . . . . . . . . . . . . . . . . (1.17)% (1.49)% 24.66% 26.96% (7.06)%
Ratios to Average Net AssetsRatio of net investment loss to average
net assets . . . . . . . . . . . . . . . . . . . . . . . . . . . . . . . . . . . . . . . . . . . . . . . . . . . . . . . . . . . . . . . (0.42)% (0.41)% (0.55)% (0.63)% (0.52)%Ratio of expenses to average net assets:
Total expense . . . . . . . . . . . . . . . . . . . . . . . . . . . . . . . . . . . . . . . . . . . . . . . . . . . . . . . . . . . 1.13% 1.12% 1.15% 1.20% 1.20%Excluding recoupment of past waived fees . . . . . . . . . . . . . . . . . . . . . . . . . . . . . 1.13% 1.12% 1.13% 1.14% 1.20%
Supplemental DataNet Assets, End of Year (000's) . . . . . . . . . . . . . . . . . . . . . . . . . . . . . . . . . . . . . . . . . . . . . $ 27,080 $ 41,637 $ 54,856 $ 66,777 $ 44,001Portfolio Turnover Rate . . . . . . . . . . . . . . . . . . . . . . . . . . . . . . . . . . . . . . . . . . . . . . . . . . . . 40% 43% 44% 39% 62%
1 Per share net investment income has been calculated using the average daily shares method.2 Less than $0.005 per share.
Meridian Small Cap Growth FundFinancial Highlights
The accompanying notes are an integral part of the financial statements.
Meridian Funds 63 www.meridianfund.com
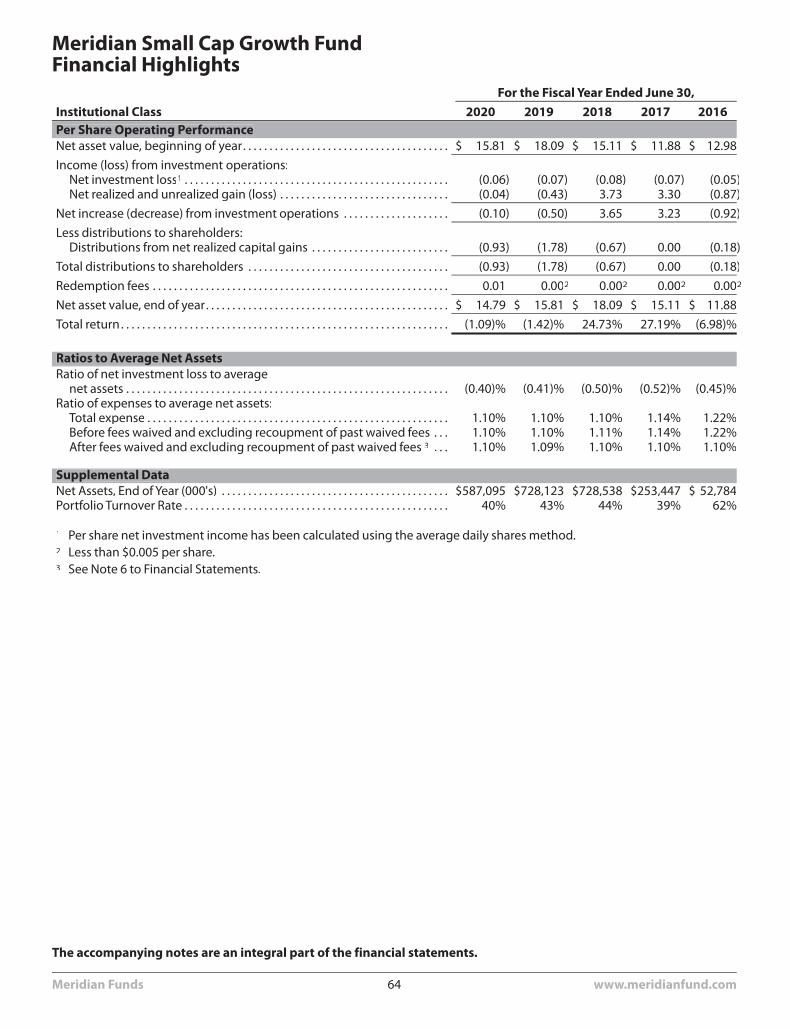
For the Fiscal Year Ended June 30,Institutional Class 2020 2019 2018 2017 2016Per Share Operating PerformanceNet asset value, beginning of year. . . . . . . . . . . . . . . . . . . . . . . . . . . . . . . . . . . . . . . $ 15.81 $ 18.09 $ 15.11 $ 11.88 $ 12.98
Income (loss) from investment operations:Net investment loss1 . . . . . . . . . . . . . . . . . . . . . . . . . . . . . . . . . . . . . . . . . . . . . . . . . . (0.06) (0.07) (0.08) (0.07) (0.05)Net realized and unrealized gain (loss) . . . . . . . . . . . . . . . . . . . . . . . . . . . . . . . . (0.04) (0.43) 3.73 3.30 (0.87)
Net increase (decrease) from investment operations . . . . . . . . . . . . . . . . . . . . (0.10) (0.50) 3.65 3.23 (0.92)
Less distributions to shareholders:Distributions from net realized capital gains . . . . . . . . . . . . . . . . . . . . . . . . . . (0.93) (1.78) (0.67) 0.00 (0.18)
Total distributions to shareholders . . . . . . . . . . . . . . . . . . . . . . . . . . . . . . . . . . . . . . (0.93) (1.78) (0.67) 0.00 (0.18)
Redemption fees . . . . . . . . . . . . . . . . . . . . . . . . . . . . . . . . . . . . . . . . . . . . . . . . . . . . . . . . 0.01 0.002 0.002 0.002 0.002
Net asset value, end of year. . . . . . . . . . . . . . . . . . . . . . . . . . . . . . . . . . . . . . . . . . . . . . $ 14.79 $ 15.81 $ 18.09 $ 15.11 $ 11.88
Total return. . . . . . . . . . . . . . . . . . . . . . . . . . . . . . . . . . . . . . . . . . . . . . . . . . . . . . . . . . . . . . (1.09)% (1.42)% 24.73% 27.19% (6.98)%
Ratios to Average Net AssetsRatio of net investment loss to average
net assets . . . . . . . . . . . . . . . . . . . . . . . . . . . . . . . . . . . . . . . . . . . . . . . . . . . . . . . . . . . . . (0.40)% (0.41)% (0.50)% (0.52)% (0.45)%Ratio of expenses to average net assets:
Total expense . . . . . . . . . . . . . . . . . . . . . . . . . . . . . . . . . . . . . . . . . . . . . . . . . . . . . . . . . 1.10% 1.10% 1.10% 1.14% 1.22%Before fees waived and excluding recoupment of past waived fees . . . 1.10% 1.10% 1.11% 1.14% 1.22%After fees waived and excluding recoupment of past waived fees 3 . . . 1.10% 1.09% 1.10% 1.10% 1.10%
Supplemental DataNet Assets, End of Year (000's) . . . . . . . . . . . . . . . . . . . . . . . . . . . . . . . . . . . . . . . . . . . $587,095 $728,123 $728,538 $253,447 $ 52,784Portfolio Turnover Rate . . . . . . . . . . . . . . . . . . . . . . . . . . . . . . . . . . . . . . . . . . . . . . . . . . 40% 43% 44% 39% 62%
1 Per share net investment income has been calculated using the average daily shares method.2 Less than $0.005 per share.3 See Note 6 to Financial Statements.
Meridian Small Cap Growth FundFinancial Highlights
The accompanying notes are an integral part of the financial statements.
Meridian Funds 64 www.meridianfund.com
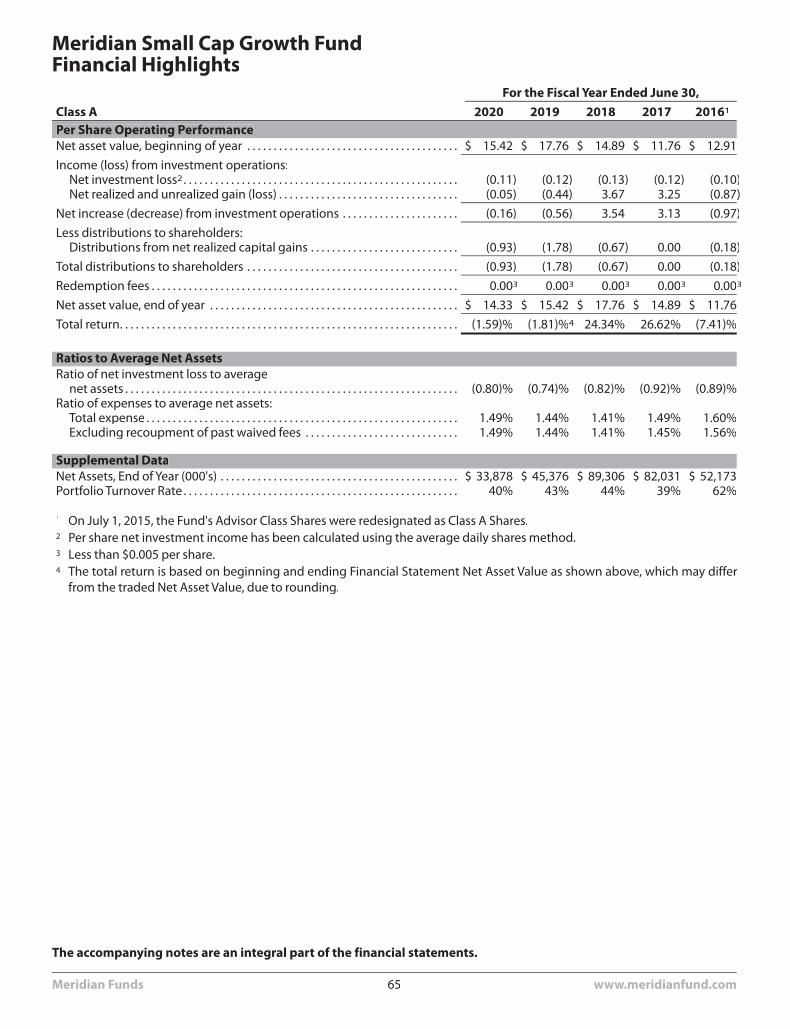
For the Fiscal Year Ended June 30,Class A 2020 2019 2018 2017 20161
Per Share Operating PerformanceNet asset value, beginning of year . . . . . . . . . . . . . . . . . . . . . . . . . . . . . . . . . . . . . . . . $ 15.42 $ 17.76 $ 14.89 $ 11.76 $ 12.91
Income (loss) from investment operations:Net investment loss2. . . . . . . . . . . . . . . . . . . . . . . . . . . . . . . . . . . . . . . . . . . . . . . . . . . . (0.11) (0.12) (0.13) (0.12) (0.10)Net realized and unrealized gain (loss) . . . . . . . . . . . . . . . . . . . . . . . . . . . . . . . . . . (0.05) (0.44) 3.67 3.25 (0.87)
Net increase (decrease) from investment operations . . . . . . . . . . . . . . . . . . . . . . (0.16) (0.56) 3.54 3.13 (0.97)
Less distributions to shareholders:Distributions from net realized capital gains . . . . . . . . . . . . . . . . . . . . . . . . . . . . (0.93) (1.78) (0.67) 0.00 (0.18)
Total distributions to shareholders . . . . . . . . . . . . . . . . . . . . . . . . . . . . . . . . . . . . . . . . (0.93) (1.78) (0.67) 0.00 (0.18)
Redemption fees . . . . . . . . . . . . . . . . . . . . . . . . . . . . . . . . . . . . . . . . . . . . . . . . . . . . . . . . . . 0.003 0.003 0.003 0.003 0.003
Net asset value, end of year . . . . . . . . . . . . . . . . . . . . . . . . . . . . . . . . . . . . . . . . . . . . . . . $ 14.33 $ 15.42 $ 17.76 $ 14.89 $ 11.76
Total return. . . . . . . . . . . . . . . . . . . . . . . . . . . . . . . . . . . . . . . . . . . . . . . . . . . . . . . . . . . . . . . . (1.59)% (1.81)%4 24.34% 26.62% (7.41)%
Ratios to Average Net AssetsRatio of net investment loss to average
net assets . . . . . . . . . . . . . . . . . . . . . . . . . . . . . . . . . . . . . . . . . . . . . . . . . . . . . . . . . . . . . . . (0.80)% (0.74)% (0.82)% (0.92)% (0.89)%Ratio of expenses to average net assets:
Total expense . . . . . . . . . . . . . . . . . . . . . . . . . . . . . . . . . . . . . . . . . . . . . . . . . . . . . . . . . . . 1.49% 1.44% 1.41% 1.49% 1.60%Excluding recoupment of past waived fees . . . . . . . . . . . . . . . . . . . . . . . . . . . . . 1.49% 1.44% 1.41% 1.45% 1.56%
Supplemental DataNet Assets, End of Year (000's) . . . . . . . . . . . . . . . . . . . . . . . . . . . . . . . . . . . . . . . . . . . . . $ 33,878 $ 45,376 $ 89,306 $ 82,031 $ 52,173Portfolio Turnover Rate . . . . . . . . . . . . . . . . . . . . . . . . . . . . . . . . . . . . . . . . . . . . . . . . . . . . 40% 43% 44% 39% 62%
1 On July 1, 2015, the Fund's Advisor Class Shares were redesignated as Class A Shares.2 Per share net investment income has been calculated using the average daily shares method.3 Less than $0.005 per share.4 The total return is based on beginning and ending Financial Statement Net Asset Value as shown above, which may differ
from the traded Net Asset Value, due to rounding.
Meridian Small Cap Growth FundFinancial Highlights
The accompanying notes are an integral part of the financial statements.
Meridian Funds 65 www.meridianfund.com
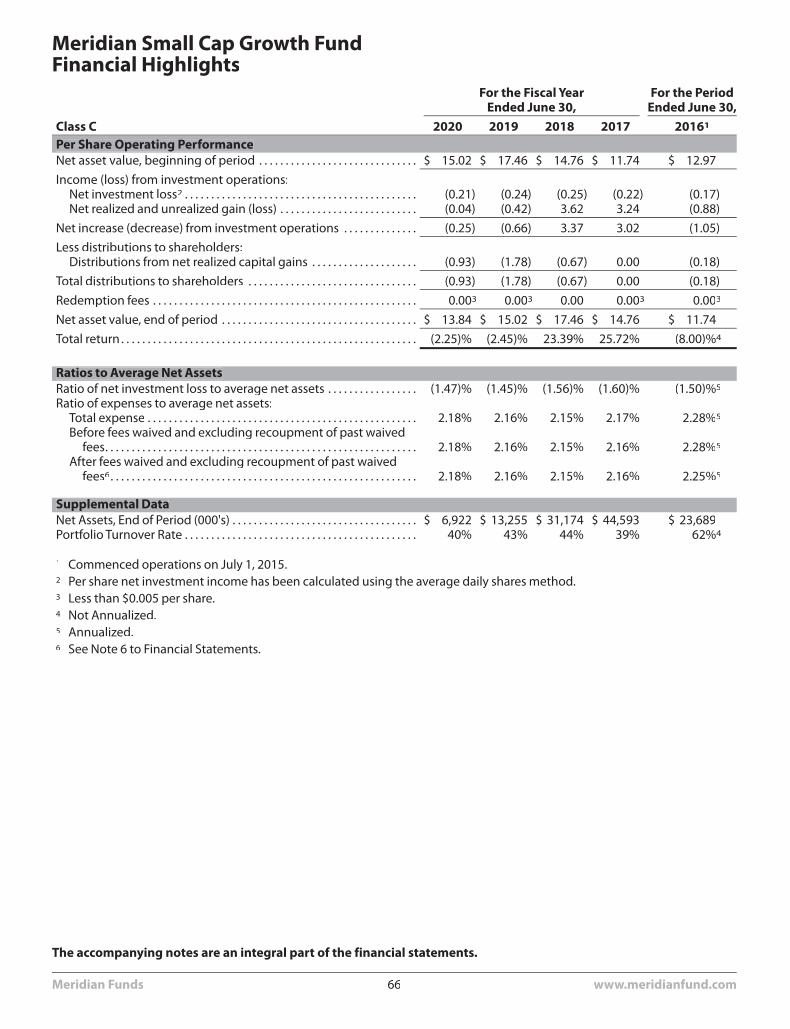
For the Fiscal YearEnded June 30,
For the PeriodEnded June 30,
Class C 2020 2019 2018 2017 20161
Per Share Operating PerformanceNet asset value, beginning of period . . . . . . . . . . . . . . . . . . . . . . . . . . . . . . $ 15.02 $ 17.46 $ 14.76 $ 11.74 $ 12.97
Income (loss) from investment operations:Net investment loss2 . . . . . . . . . . . . . . . . . . . . . . . . . . . . . . . . . . . . . . . . . . . . (0.21) (0.24) (0.25) (0.22) (0.17)Net realized and unrealized gain (loss) . . . . . . . . . . . . . . . . . . . . . . . . . . (0.04) (0.42) 3.62 3.24 (0.88)
Net increase (decrease) from investment operations . . . . . . . . . . . . . . (0.25) (0.66) 3.37 3.02 (1.05)
Less distributions to shareholders:Distributions from net realized capital gains . . . . . . . . . . . . . . . . . . . . (0.93) (1.78) (0.67) 0.00 (0.18)
Total distributions to shareholders . . . . . . . . . . . . . . . . . . . . . . . . . . . . . . . . (0.93) (1.78) (0.67) 0.00 (0.18)
Redemption fees . . . . . . . . . . . . . . . . . . . . . . . . . . . . . . . . . . . . . . . . . . . . . . . . . . 0.003 0.003 0.00 0.003 0.003
Net asset value, end of period . . . . . . . . . . . . . . . . . . . . . . . . . . . . . . . . . . . . . $ 13.84 $ 15.02 $ 17.46 $ 14.76 $ 11.74
Total return . . . . . . . . . . . . . . . . . . . . . . . . . . . . . . . . . . . . . . . . . . . . . . . . . . . . . . . . (2.25)% (2.45)% 23.39% 25.72% (8.00)%4
Ratios to Average Net AssetsRatio of net investment loss to average net assets . . . . . . . . . . . . . . . . . (1.47)% (1.45)% (1.56)% (1.60)% (1.50)%5
Ratio of expenses to average net assets:Total expense . . . . . . . . . . . . . . . . . . . . . . . . . . . . . . . . . . . . . . . . . . . . . . . . . . . 2.18% 2.16% 2.15% 2.17% 2.28%5
Before fees waived and excluding recoupment of past waivedfees. . . . . . . . . . . . . . . . . . . . . . . . . . . . . . . . . . . . . . . . . . . . . . . . . . . . . . . . . . . 2.18% 2.16% 2.15% 2.16% 2.28%5
After fees waived and excluding recoupment of past waivedfees6. . . . . . . . . . . . . . . . . . . . . . . . . . . . . . . . . . . . . . . . . . . . . . . . . . . . . . . . . . 2.18% 2.16% 2.15% 2.16% 2.25%5
Supplemental DataNet Assets, End of Period (000's) . . . . . . . . . . . . . . . . . . . . . . . . . . . . . . . . . . . $ 6,922 $ 13,255 $ 31,174 $ 44,593 $ 23,689Portfolio Turnover Rate . . . . . . . . . . . . . . . . . . . . . . . . . . . . . . . . . . . . . . . . . . . . 40% 43% 44% 39% 62%4
1 Commenced operations on July 1, 2015.2 Per share net investment income has been calculated using the average daily shares method.3 Less than $0.005 per share.4 Not Annualized.5 Annualized.6 See Note 6 to Financial Statements.
Meridian Small Cap Growth FundFinancial Highlights
The accompanying notes are an integral part of the financial statements.
Meridian Funds 66 www.meridianfund.com
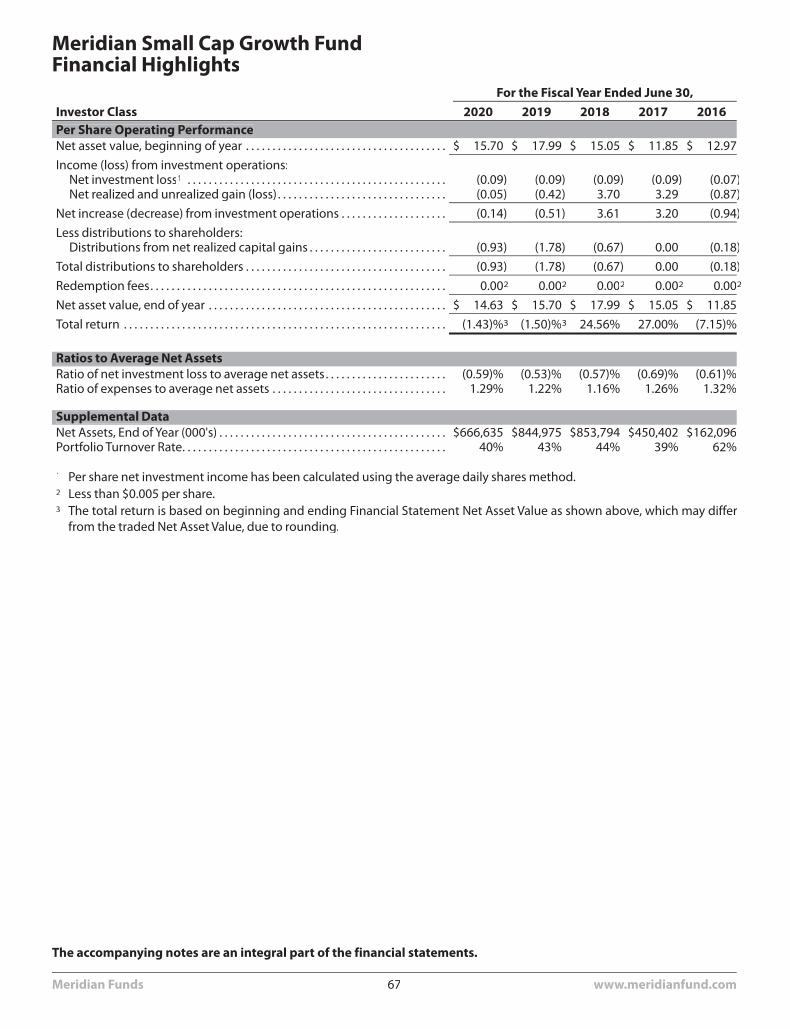
For the Fiscal Year Ended June 30,Investor Class 2020 2019 2018 2017 2016Per Share Operating PerformanceNet asset value, beginning of year . . . . . . . . . . . . . . . . . . . . . . . . . . . . . . . . . . . . . . $ 15.70 $ 17.99 $ 15.05 $ 11.85 $ 12.97
Income (loss) from investment operations:Net investment loss1 . . . . . . . . . . . . . . . . . . . . . . . . . . . . . . . . . . . . . . . . . . . . . . . . . (0.09) (0.09) (0.09) (0.09) (0.07)Net realized and unrealized gain (loss). . . . . . . . . . . . . . . . . . . . . . . . . . . . . . . . (0.05) (0.42) 3.70 3.29 (0.87)
Net increase (decrease) from investment operations . . . . . . . . . . . . . . . . . . . . (0.14) (0.51) 3.61 3.20 (0.94)
Less distributions to shareholders:Distributions from net realized capital gains . . . . . . . . . . . . . . . . . . . . . . . . . . (0.93) (1.78) (0.67) 0.00 (0.18)
Total distributions to shareholders . . . . . . . . . . . . . . . . . . . . . . . . . . . . . . . . . . . . . . (0.93) (1.78) (0.67) 0.00 (0.18)
Redemption fees. . . . . . . . . . . . . . . . . . . . . . . . . . . . . . . . . . . . . . . . . . . . . . . . . . . . . . . . 0.002 0.002 0.002 0.002 0.002
Net asset value, end of year . . . . . . . . . . . . . . . . . . . . . . . . . . . . . . . . . . . . . . . . . . . . . $ 14.63 $ 15.70 $ 17.99 $ 15.05 $ 11.85
Total return . . . . . . . . . . . . . . . . . . . . . . . . . . . . . . . . . . . . . . . . . . . . . . . . . . . . . . . . . . . . . (1.43)%3 (1.50)%3 24.56% 27.00% (7.15)%
Ratios to Average Net AssetsRatio of net investment loss to average net assets. . . . . . . . . . . . . . . . . . . . . . . (0.59)% (0.53)% (0.57)% (0.69)% (0.61)%Ratio of expenses to average net assets . . . . . . . . . . . . . . . . . . . . . . . . . . . . . . . . . 1.29% 1.22% 1.16% 1.26% 1.32%
Supplemental DataNet Assets, End of Year (000's) . . . . . . . . . . . . . . . . . . . . . . . . . . . . . . . . . . . . . . . . . . . $666,635 $844,975 $853,794 $450,402 $162,096Portfolio Turnover Rate. . . . . . . . . . . . . . . . . . . . . . . . . . . . . . . . . . . . . . . . . . . . . . . . . . 40% 43% 44% 39% 62%
1 Per share net investment income has been calculated using the average daily shares method.2 Less than $0.005 per share.3 The total return is based on beginning and ending Financial Statement Net Asset Value as shown above, which may differ
from the traded Net Asset Value, due to rounding.
Meridian Small Cap Growth FundFinancial Highlights
The accompanying notes are an integral part of the financial statements.
Meridian Funds 67 www.meridianfund.com
1. Organization and Significant Accounting Policies: Meridian Fund, Inc. (the “Meridian Funds” or the “Company”)comprises the following separate series: the Meridian Growth Fund (the “Growth Fund”), the Meridian Contrarian Fund(the “Contrarian Fund”), the Meridian Enhanced Equity Fund (the “Enhanced Equity Fund”) (formerly Meridian EquityIncome Fund), and the Meridian Small Cap Growth Fund (the “Small Cap Growth Fund”) (each a “Fund” and collectively,the “Funds”). The Company is registered as an open-end investment company under the Investment Company Act of1940 and is organized as a Maryland corporation. Each Fund is classified as a "diversified" management investmentcompany.
Meridian Funds offer five share classes: Legacy Class Shares, Investor Class Shares, Class A Shares, Class C Shares andInstitutional Class Shares. Prior to July 1, 2015, Class A Shares were known as Advisor Class Shares. As of June 30, 2020,Institutional Class Shares of the Enhanced Equity Fund and Contrarian Fund are not currently being offered for sale.Effective June 15, 2017, Investor Class, Class A, and Class C Shares of the Growth Fund are closed to new investors.Effective June 29, 2018, Investor Class, Class A, and Class C Shares of the Small Cap Growth Fund are closed to newinvestors. Legacy Class Shares are available to investors who have continuously held an investment in any MeridianFund prior to November 15, 2013. Effective November 1, 2018, direct initial purchases of Legacy Class Shares arepermitted in the Enhanced Equity Fund. Institutional Class Shares are available to certain eligible investors includingendowments, foundations and qualified retirement plans. Class A, Class C and Investor Class Shares are available forpurchase through financial intermediary platforms. Class A Shares are subject to a maximum initial sales charge (front-end load) of 5.75%. Class C Shares are subject to a 1.00% contingent deferred sales charge ("CDSC") if redeemed withinone year of purchase. Investor Class Shares are not subject to front-end load or CDSC and require a higher minimuminitial investment. All Classes have identical rights and privileges with respect to the Fund in general, and exclusivevoting rights with respect to Class specific matters. Net Asset Value ("NAV") per share may differ by class due to eachclass having its own expenses directly attributable to that class. Investor Class, Class A and Class C Shares are subject tosub-transfer agent fees. Class A and Class C Shares are also subject to certain expenses related to the distribution ofthese shares. See Note 6 for further information on additional share classes.
The primary investment objectives of the Growth Fund, Contrarian Fund, and Enhanced Equity Fund are to seek long-term growth of capital.
The primary investment objective of the Small Cap Growth Fund is to seek long-term growth of capital by investingprimarily in equity securities of small capitalization companies.
The following significant accounting policies are consistently followed by the Funds in the preparation of their financialstatements in conformity with U.S. GAAP. Each Fund is considered an investment company under U.S. GAAP and followsthe accounting and reporting guidance in the Financial Accounting Standards Board (FASB) Accounting StandardsCodification Topic 946, Financial Services - Investment Companies.
a. Cash & Cash Equivalents: Each Fund considers its investment in a FDIC insured interest bearing account to becash and cash equivalents. Cash and cash equivalents are valued at cost plus any accrued interest. The Fundsmaintain cash balances, which, at times may exceed federally insured limits. The Funds maintain these balanceswith a high quality financial institution. The Funds may incur charges on cash overdrafts.
b. Share Valuation: The NAV of each Fund is calculated by dividing the sum of the value of the securities held byeach Fund, plus cash or other assets, minus all liabilities (including estimated accrued expenses), by the totalnumber of shares outstanding of each Fund. The result is rounded to the nearest cent. Each Fund’s shares will notbe priced on the days in which the New York Stock Exchange ("NYSE") is closed for trading.
c. Investment Valuations: Equity securities are valued at the closing price or last sales price on the principalexchange or market on which they are traded; or, if there were no sales that day, at the last reported bid price.
Fixed income (debt) securities are valued on the basis of last available bid prices or current market quotationsprovided by dealers or pricing services. In determining the value of a particular investment, pricing services mayuse certain information with respect to transactions in such investments, quotations from dealers, pricingmatrixes, market transactions in comparable investments, various relationships observed in the market betweeninvestments and calculated yield measures.
Investments in open-end U.S. mutual funds are valued at NAV each business day.
Meridian Fund, Inc.Notes to Financial StatementsJune 30, 2020
Meridian Funds 68 www.meridianfund.com
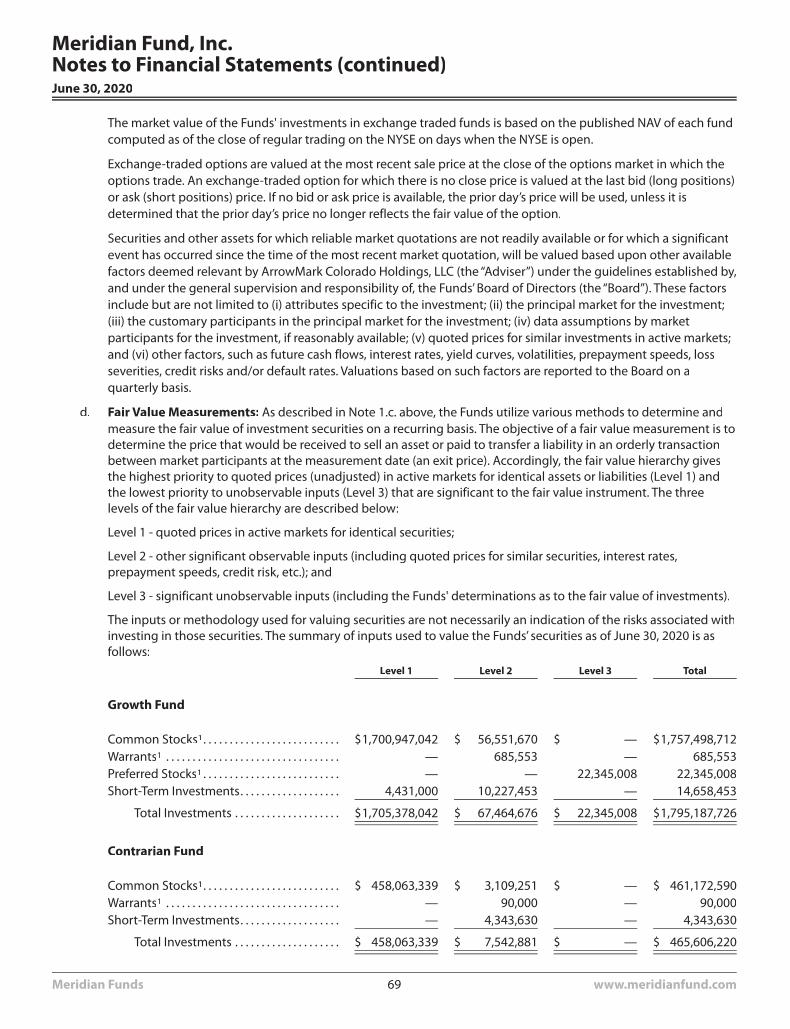
The market value of the Funds' investments in exchange traded funds is based on the published NAV of each fundcomputed as of the close of regular trading on the NYSE on days when the NYSE is open.
Exchange-traded options are valued at the most recent sale price at the close of the options market in which theoptions trade. An exchange-traded option for which there is no close price is valued at the last bid (long positions)or ask (short positions) price. If no bid or ask price is available, the prior day’s price will be used, unless it isdetermined that the prior day’s price no longer reflects the fair value of the option.
Securities and other assets for which reliable market quotations are not readily available or for which a significantevent has occurred since the time of the most recent market quotation, will be valued based upon other availablefactors deemed relevant by ArrowMark Colorado Holdings, LLC (the “Adviser”) under the guidelines established by,and under the general supervision and responsibility of, the Funds’ Board of Directors (the “Board”). These factorsinclude but are not limited to (i) attributes specific to the investment; (ii) the principal market for the investment;(iii) the customary participants in the principal market for the investment; (iv) data assumptions by marketparticipants for the investment, if reasonably available; (v) quoted prices for similar investments in active markets;and (vi) other factors, such as future cash flows, interest rates, yield curves, volatilities, prepayment speeds, lossseverities, credit risks and/or default rates. Valuations based on such factors are reported to the Board on aquarterly basis.
d. Fair Value Measurements: As described in Note 1.c. above, the Funds utilize various methods to determine andmeasure the fair value of investment securities on a recurring basis. The objective of a fair value measurement is todetermine the price that would be received to sell an asset or paid to transfer a liability in an orderly transactionbetween market participants at the measurement date (an exit price). Accordingly, the fair value hierarchy givesthe highest priority to quoted prices (unadjusted) in active markets for identical assets or liabilities (Level 1) andthe lowest priority to unobservable inputs (Level 3) that are significant to the fair value instrument. The threelevels of the fair value hierarchy are described below:
Level 1 - quoted prices in active markets for identical securities;
Level 2 - other significant observable inputs (including quoted prices for similar securities, interest rates,prepayment speeds, credit risk, etc.); and
Level 3 - significant unobservable inputs (including the Funds' determinations as to the fair value of investments).
The inputs or methodology used for valuing securities are not necessarily an indication of the risks associated withinvesting in those securities. The summary of inputs used to value the Funds’ securities as of June 30, 2020 is asfollows:
Level 1 Level 2 Level 3 Total
Growth Fund
Common Stocks1. . . . . . . . . . . . . . . . . . . . . . . . . . $1,700,947,042 $ 56,551,670 $ — $1,757,498,712Warrants1 . . . . . . . . . . . . . . . . . . . . . . . . . . . . . . . . . — 685,553 — 685,553Preferred Stocks1 . . . . . . . . . . . . . . . . . . . . . . . . . . — — 22,345,008 22,345,008Short-Term Investments. . . . . . . . . . . . . . . . . . . 4,431,000 10,227,453 — 14,658,453
Total Investments . . . . . . . . . . . . . . . . . . . . $1,705,378,042 $ 67,464,676 $ 22,345,008 $1,795,187,726
Contrarian Fund
Common Stocks1. . . . . . . . . . . . . . . . . . . . . . . . . . $ 458,063,339 $ 3,109,251 $ — $ 461,172,590Warrants1 . . . . . . . . . . . . . . . . . . . . . . . . . . . . . . . . . — 90,000 — 90,000Short-Term Investments. . . . . . . . . . . . . . . . . . . — 4,343,630 — 4,343,630
Total Investments . . . . . . . . . . . . . . . . . . . . $ 458,063,339 $ 7,542,881 $ — $ 465,606,220
Meridian Fund, Inc.Notes to Financial Statements (continued)June 30, 2020
Meridian Funds 69 www.meridianfund.com
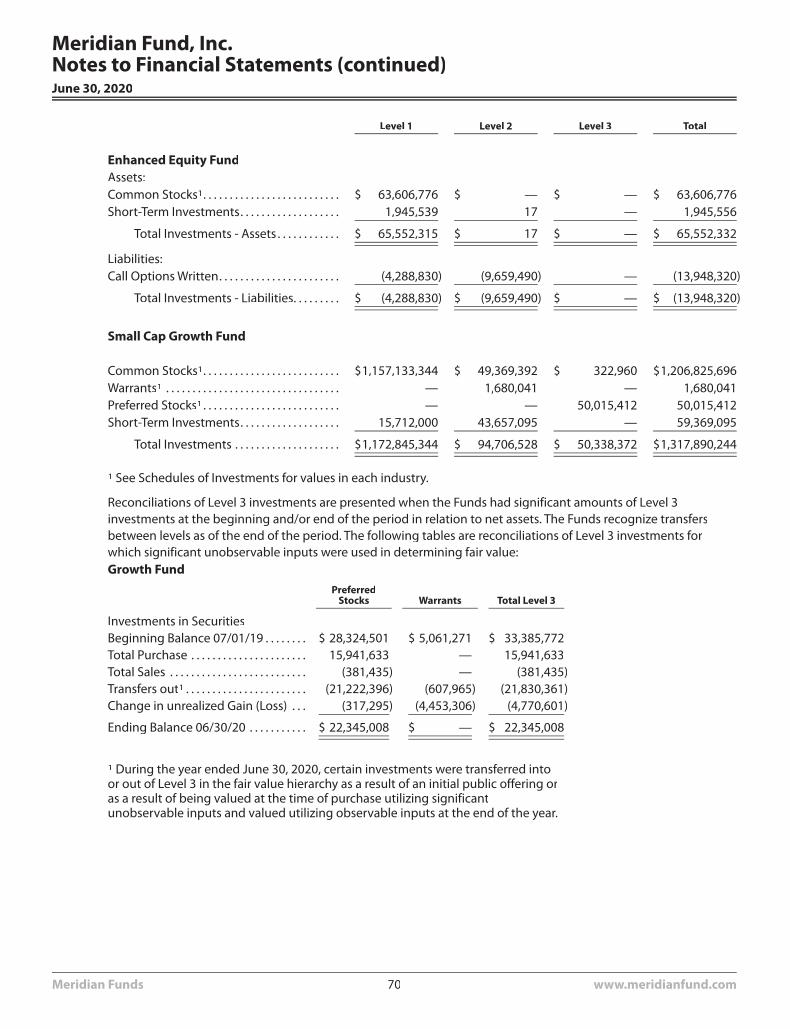
Level 1 Level 2 Level 3 Total
Enhanced Equity FundAssets:Common Stocks1. . . . . . . . . . . . . . . . . . . . . . . . . . $ 63,606,776 $ — $ — $ 63,606,776Short-Term Investments. . . . . . . . . . . . . . . . . . . 1,945,539 17 — 1,945,556
Total Investments - Assets . . . . . . . . . . . . $ 65,552,315 $ 17 $ — $ 65,552,332
Liabilities:Call Options Written. . . . . . . . . . . . . . . . . . . . . . . (4,288,830) (9,659,490) — (13,948,320)
Total Investments - Liabilities. . . . . . . . . $ (4,288,830) $ (9,659,490) $ — $ (13,948,320)
Small Cap Growth Fund
Common Stocks1. . . . . . . . . . . . . . . . . . . . . . . . . . $1,157,133,344 $ 49,369,392 $ 322,960 $1,206,825,696Warrants1 . . . . . . . . . . . . . . . . . . . . . . . . . . . . . . . . . — 1,680,041 — 1,680,041Preferred Stocks1 . . . . . . . . . . . . . . . . . . . . . . . . . . — — 50,015,412 50,015,412Short-Term Investments. . . . . . . . . . . . . . . . . . . 15,712,000 43,657,095 — 59,369,095
Total Investments . . . . . . . . . . . . . . . . . . . . $1,172,845,344 $ 94,706,528 $ 50,338,372 $1,317,890,244
1 See Schedules of Investments for values in each industry.
Reconciliations of Level 3 investments are presented when the Funds had significant amounts of Level 3investments at the beginning and/or end of the period in relation to net assets. The Funds recognize transfersbetween levels as of the end of the period. The following tables are reconciliations of Level 3 investments forwhich significant unobservable inputs were used in determining fair value:Growth Fund
PreferredStocks Warrants Total Level 3
Investments in SecuritiesBeginning Balance 07/01/19 . . . . . . . . $ 28,324,501 $ 5,061,271 $ 33,385,772Total Purchase . . . . . . . . . . . . . . . . . . . . . . 15,941,633 — 15,941,633Total Sales . . . . . . . . . . . . . . . . . . . . . . . . . . (381,435) — (381,435)Transfers out1 . . . . . . . . . . . . . . . . . . . . . . . (21,222,396) (607,965) (21,830,361)Change in unrealized Gain (Loss) . . . (317,295) (4,453,306) (4,770,601)
Ending Balance 06/30/20 . . . . . . . . . . . $ 22,345,008 $ — $ 22,345,008
1 During the year ended June 30, 2020, certain investments were transferred intoor out of Level 3 in the fair value hierarchy as a result of an initial public offering oras a result of being valued at the time of purchase utilizing significantunobservable inputs and valued utilizing observable inputs at the end of the year.
Meridian Fund, Inc.Notes to Financial Statements (continued)June 30, 2020
Meridian Funds 70 www.meridianfund.com
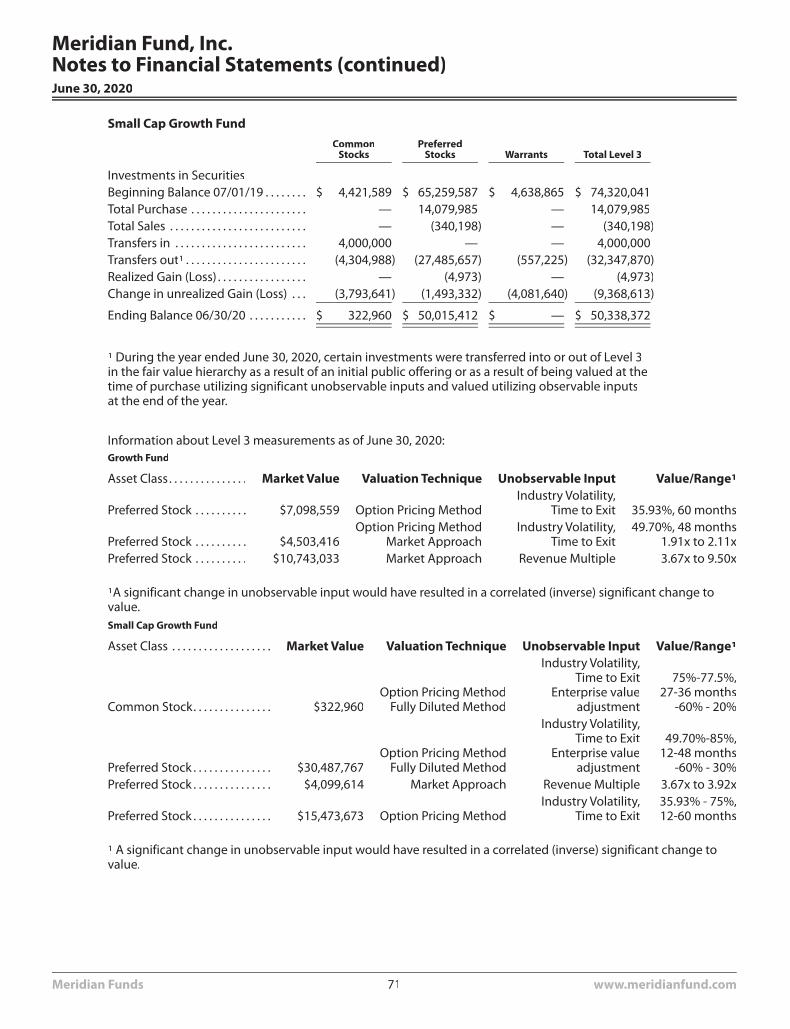
Small Cap Growth FundCommon
StocksPreferred
Stocks Warrants Total Level 3
Investments in SecuritiesBeginning Balance 07/01/19 . . . . . . . . $ 4,421,589 $ 65,259,587 $ 4,638,865 $ 74,320,041Total Purchase . . . . . . . . . . . . . . . . . . . . . . — 14,079,985 — 14,079,985Total Sales . . . . . . . . . . . . . . . . . . . . . . . . . . — (340,198) — (340,198)Transfers in . . . . . . . . . . . . . . . . . . . . . . . . . 4,000,000 — — 4,000,000Transfers out1 . . . . . . . . . . . . . . . . . . . . . . . (4,304,988) (27,485,657) (557,225) (32,347,870)Realized Gain (Loss) . . . . . . . . . . . . . . . . . — (4,973) — (4,973)Change in unrealized Gain (Loss) . . . (3,793,641) (1,493,332) (4,081,640) (9,368,613)
Ending Balance 06/30/20 . . . . . . . . . . . $ 322,960 $ 50,015,412 $ — $ 50,338,372
1 During the year ended June 30, 2020, certain investments were transferred into or out of Level 3in the fair value hierarchy as a result of an initial public offering or as a result of being valued at thetime of purchase utilizing significant unobservable inputs and valued utilizing observable inputsat the end of the year.
Information about Level 3 measurements as of June 30, 2020:Growth Fund
Asset Class. . . . . . . . . . . . . . . Market Value Valuation Technique Unobservable Input Value/Range1
Preferred Stock . . . . . . . . . . $7,098,559 Option Pricing MethodIndustry Volatility,
Time to Exit 35.93%, 60 months
Preferred Stock . . . . . . . . . . $4,503,416Option Pricing Method
Market ApproachIndustry Volatility,
Time to Exit49.70%, 48 months
1.91x to 2.11xPreferred Stock . . . . . . . . . . $10,743,033 Market Approach Revenue Multiple 3.67x to 9.50x
1A significant change in unobservable input would have resulted in a correlated (inverse) significant change tovalue.Small Cap Growth Fund
Asset Class . . . . . . . . . . . . . . . . . . . Market Value Valuation Technique Unobservable Input Value/Range1
Common Stock. . . . . . . . . . . . . . . $322,960Option Pricing Method
Fully Diluted Method
Industry Volatility,Time to Exit
Enterprise valueadjustment
75%-77.5%,27-36 months
-60% - 20%
Preferred Stock . . . . . . . . . . . . . . . $30,487,767Option Pricing Method
Fully Diluted Method
Industry Volatility,Time to Exit
Enterprise valueadjustment
49.70%-85%,12-48 months
-60% - 30%Preferred Stock . . . . . . . . . . . . . . . $4,099,614 Market Approach Revenue Multiple 3.67x to 3.92x
Preferred Stock . . . . . . . . . . . . . . . $15,473,673 Option Pricing MethodIndustry Volatility,
Time to Exit35.93% - 75%,12-60 months
1 A significant change in unobservable input would have resulted in a correlated (inverse) significant change tovalue.
Meridian Fund, Inc.Notes to Financial Statements (continued)June 30, 2020
Meridian Funds 71 www.meridianfund.com
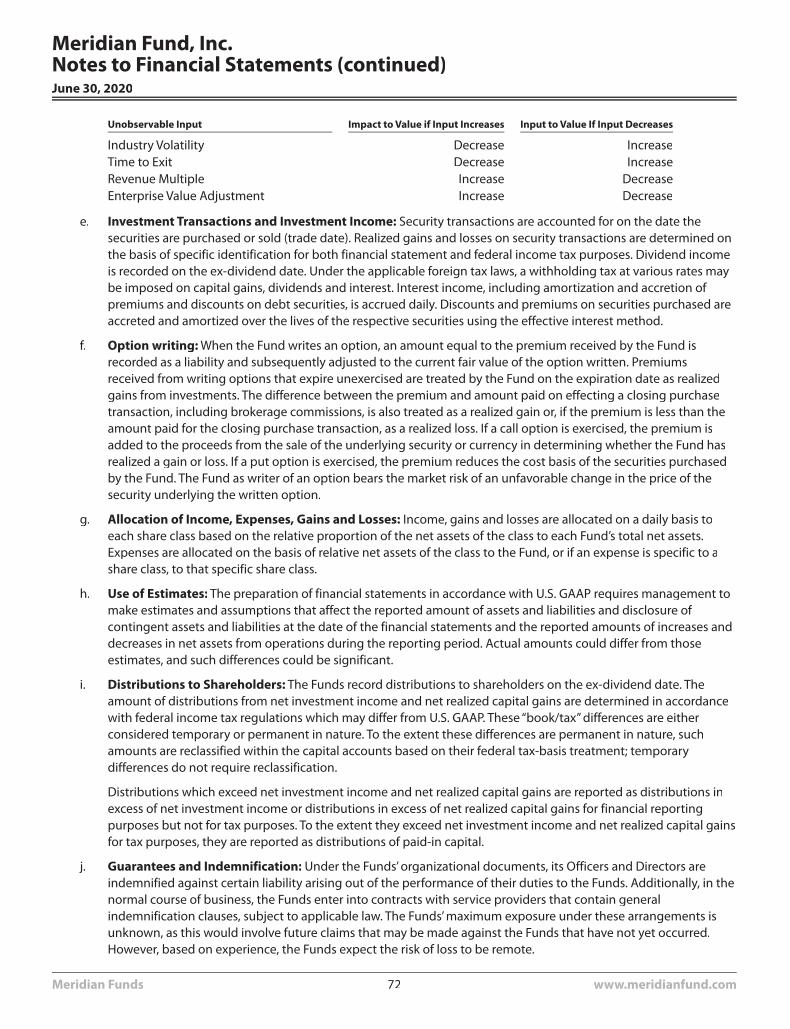
Unobservable Input Impact to Value if Input Increases Input to Value If Input Decreases
Industry Volatility Decrease IncreaseTime to Exit Decrease IncreaseRevenue Multiple Increase DecreaseEnterprise Value Adjustment Increase Decrease
e. Investment Transactions and Investment Income: Security transactions are accounted for on the date thesecurities are purchased or sold (trade date). Realized gains and losses on security transactions are determined onthe basis of specific identification for both financial statement and federal income tax purposes. Dividend incomeis recorded on the ex-dividend date. Under the applicable foreign tax laws, a withholding tax at various rates maybe imposed on capital gains, dividends and interest. Interest income, including amortization and accretion ofpremiums and discounts on debt securities, is accrued daily. Discounts and premiums on securities purchased areaccreted and amortized over the lives of the respective securities using the effective interest method.
f. Option writing: When the Fund writes an option, an amount equal to the premium received by the Fund isrecorded as a liability and subsequently adjusted to the current fair value of the option written. Premiumsreceived from writing options that expire unexercised are treated by the Fund on the expiration date as realizedgains from investments. The difference between the premium and amount paid on effecting a closing purchasetransaction, including brokerage commissions, is also treated as a realized gain or, if the premium is less than theamount paid for the closing purchase transaction, as a realized loss. If a call option is exercised, the premium isadded to the proceeds from the sale of the underlying security or currency in determining whether the Fund hasrealized a gain or loss. If a put option is exercised, the premium reduces the cost basis of the securities purchasedby the Fund. The Fund as writer of an option bears the market risk of an unfavorable change in the price of thesecurity underlying the written option.
g. Allocation of Income, Expenses, Gains and Losses: Income, gains and losses are allocated on a daily basis toeach share class based on the relative proportion of the net assets of the class to each Fund’s total net assets.Expenses are allocated on the basis of relative net assets of the class to the Fund, or if an expense is specific to ashare class, to that specific share class.
h. Use of Estimates: The preparation of financial statements in accordance with U.S. GAAP requires management tomake estimates and assumptions that affect the reported amount of assets and liabilities and disclosure ofcontingent assets and liabilities at the date of the financial statements and the reported amounts of increases anddecreases in net assets from operations during the reporting period. Actual amounts could differ from thoseestimates, and such differences could be significant.
i. Distributions to Shareholders: The Funds record distributions to shareholders on the ex-dividend date. Theamount of distributions from net investment income and net realized capital gains are determined in accordancewith federal income tax regulations which may differ from U.S. GAAP. These “book/tax” differences are eitherconsidered temporary or permanent in nature. To the extent these differences are permanent in nature, suchamounts are reclassified within the capital accounts based on their federal tax-basis treatment; temporarydifferences do not require reclassification.
Distributions which exceed net investment income and net realized capital gains are reported as distributions inexcess of net investment income or distributions in excess of net realized capital gains for financial reportingpurposes but not for tax purposes. To the extent they exceed net investment income and net realized capital gainsfor tax purposes, they are reported as distributions of paid-in capital.
j. Guarantees and Indemnification: Under the Funds’ organizational documents, its Officers and Directors areindemnified against certain liability arising out of the performance of their duties to the Funds. Additionally, in thenormal course of business, the Funds enter into contracts with service providers that contain generalindemnification clauses, subject to applicable law. The Funds’ maximum exposure under these arrangements isunknown, as this would involve future claims that may be made against the Funds that have not yet occurred.However, based on experience, the Funds expect the risk of loss to be remote.
Meridian Fund, Inc.Notes to Financial Statements (continued)June 30, 2020
Meridian Funds 72 www.meridianfund.com
k. Recent Accounting Standards: In August 2018, the Financial Accounting Standards Board issued AccountingStandards Update 2018-13 “Changes to the Disclosure Requirements for Fair Value Measurement” which modifiesdisclosure requirements for fair value measurements. The guidance is effective for fiscal years beginning afterDecember 15, 2019 and for interim periods within those fiscal years. The Funds have partially adopted the newaccounting standard while management continues to evaluate the remaining aspects of this guidance to theFunds.
Meridian Fund, Inc.Notes to Financial Statements (continued)June 30, 2020
Meridian Funds 73 www.meridianfund.com
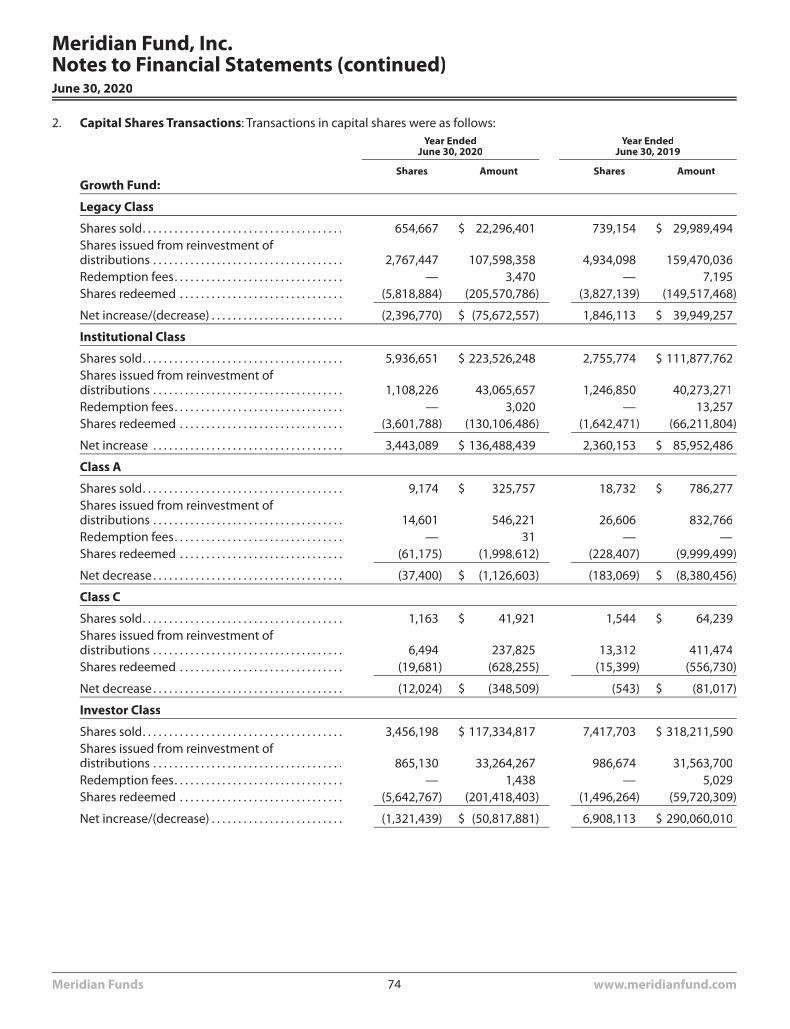
2. Capital Shares Transactions: Transactions in capital shares were as follows:Year Ended
June 30, 2020Year Ended
June 30, 2019
Shares Amount Shares AmountGrowth Fund:
Legacy Class
Shares sold. . . . . . . . . . . . . . . . . . . . . . . . . . . . . . . . . . . . . . 654,667 $ 22,296,401 739,154 $ 29,989,494Shares issued from reinvestment ofdistributions . . . . . . . . . . . . . . . . . . . . . . . . . . . . . . . . . . . . 2,767,447 107,598,358 4,934,098 159,470,036Redemption fees. . . . . . . . . . . . . . . . . . . . . . . . . . . . . . . . — 3,470 — 7,195Shares redeemed . . . . . . . . . . . . . . . . . . . . . . . . . . . . . . . (5,818,884) (205,570,786) (3,827,139) (149,517,468)
Net increase/(decrease) . . . . . . . . . . . . . . . . . . . . . . . . . (2,396,770) $ (75,672,557) 1,846,113 $ 39,949,257
Institutional Class
Shares sold. . . . . . . . . . . . . . . . . . . . . . . . . . . . . . . . . . . . . . 5,936,651 $ 223,526,248 2,755,774 $ 111,877,762Shares issued from reinvestment ofdistributions . . . . . . . . . . . . . . . . . . . . . . . . . . . . . . . . . . . . 1,108,226 43,065,657 1,246,850 40,273,271Redemption fees. . . . . . . . . . . . . . . . . . . . . . . . . . . . . . . . — 3,020 — 13,257Shares redeemed . . . . . . . . . . . . . . . . . . . . . . . . . . . . . . . (3,601,788) (130,106,486) (1,642,471) (66,211,804)
Net increase . . . . . . . . . . . . . . . . . . . . . . . . . . . . . . . . . . . . 3,443,089 $ 136,488,439 2,360,153 $ 85,952,486
Class A
Shares sold. . . . . . . . . . . . . . . . . . . . . . . . . . . . . . . . . . . . . . 9,174 $ 325,757 18,732 $ 786,277Shares issued from reinvestment ofdistributions . . . . . . . . . . . . . . . . . . . . . . . . . . . . . . . . . . . . 14,601 546,221 26,606 832,766Redemption fees. . . . . . . . . . . . . . . . . . . . . . . . . . . . . . . . — 31 — —Shares redeemed . . . . . . . . . . . . . . . . . . . . . . . . . . . . . . . (61,175) (1,998,612) (228,407) (9,999,499)
Net decrease . . . . . . . . . . . . . . . . . . . . . . . . . . . . . . . . . . . . (37,400) $ (1,126,603) (183,069) $ (8,380,456)
Class C
Shares sold. . . . . . . . . . . . . . . . . . . . . . . . . . . . . . . . . . . . . . 1,163 $ 41,921 1,544 $ 64,239Shares issued from reinvestment ofdistributions . . . . . . . . . . . . . . . . . . . . . . . . . . . . . . . . . . . . 6,494 237,825 13,312 411,474Shares redeemed . . . . . . . . . . . . . . . . . . . . . . . . . . . . . . . (19,681) (628,255) (15,399) (556,730)
Net decrease . . . . . . . . . . . . . . . . . . . . . . . . . . . . . . . . . . . . (12,024) $ (348,509) (543) $ (81,017)
Investor Class
Shares sold. . . . . . . . . . . . . . . . . . . . . . . . . . . . . . . . . . . . . . 3,456,198 $ 117,334,817 7,417,703 $ 318,211,590Shares issued from reinvestment ofdistributions . . . . . . . . . . . . . . . . . . . . . . . . . . . . . . . . . . . . 865,130 33,264,267 986,674 31,563,700Redemption fees. . . . . . . . . . . . . . . . . . . . . . . . . . . . . . . . — 1,438 — 5,029Shares redeemed . . . . . . . . . . . . . . . . . . . . . . . . . . . . . . . (5,642,767) (201,418,403) (1,496,264) (59,720,309)
Net increase/(decrease) . . . . . . . . . . . . . . . . . . . . . . . . . (1,321,439) $ (50,817,881) 6,908,113 $ 290,060,010
Meridian Fund, Inc.Notes to Financial Statements (continued)June 30, 2020
Meridian Funds 74 www.meridianfund.com
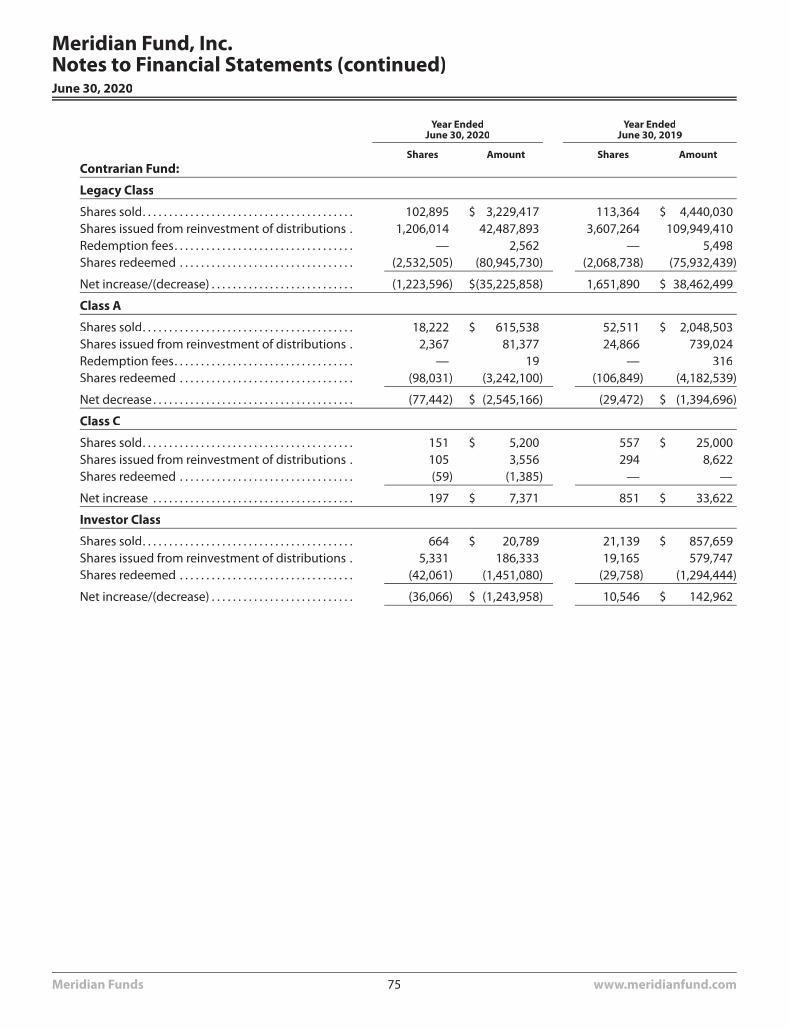
Year EndedJune 30, 2020
Year EndedJune 30, 2019
Shares Amount Shares AmountContrarian Fund:
Legacy Class
Shares sold. . . . . . . . . . . . . . . . . . . . . . . . . . . . . . . . . . . . . . . . 102,895 $ 3,229,417 113,364 $ 4,440,030Shares issued from reinvestment of distributions . 1,206,014 42,487,893 3,607,264 109,949,410Redemption fees. . . . . . . . . . . . . . . . . . . . . . . . . . . . . . . . . . — 2,562 — 5,498Shares redeemed . . . . . . . . . . . . . . . . . . . . . . . . . . . . . . . . . (2,532,505) (80,945,730) (2,068,738) (75,932,439)
Net increase/(decrease) . . . . . . . . . . . . . . . . . . . . . . . . . . . (1,223,596) $(35,225,858) 1,651,890 $ 38,462,499
Class A
Shares sold. . . . . . . . . . . . . . . . . . . . . . . . . . . . . . . . . . . . . . . . 18,222 $ 615,538 52,511 $ 2,048,503Shares issued from reinvestment of distributions . 2,367 81,377 24,866 739,024Redemption fees. . . . . . . . . . . . . . . . . . . . . . . . . . . . . . . . . . — 19 — 316Shares redeemed . . . . . . . . . . . . . . . . . . . . . . . . . . . . . . . . . (98,031) (3,242,100) (106,849) (4,182,539)
Net decrease . . . . . . . . . . . . . . . . . . . . . . . . . . . . . . . . . . . . . . (77,442) $ (2,545,166) (29,472) $ (1,394,696)
Class C
Shares sold. . . . . . . . . . . . . . . . . . . . . . . . . . . . . . . . . . . . . . . . 151 $ 5,200 557 $ 25,000Shares issued from reinvestment of distributions . 105 3,556 294 8,622Shares redeemed . . . . . . . . . . . . . . . . . . . . . . . . . . . . . . . . . (59) (1,385) — —
Net increase . . . . . . . . . . . . . . . . . . . . . . . . . . . . . . . . . . . . . . 197 $ 7,371 851 $ 33,622
Investor Class
Shares sold. . . . . . . . . . . . . . . . . . . . . . . . . . . . . . . . . . . . . . . . 664 $ 20,789 21,139 $ 857,659Shares issued from reinvestment of distributions . 5,331 186,333 19,165 579,747Shares redeemed . . . . . . . . . . . . . . . . . . . . . . . . . . . . . . . . . (42,061) (1,451,080) (29,758) (1,294,444)
Net increase/(decrease) . . . . . . . . . . . . . . . . . . . . . . . . . . . (36,066) $ (1,243,958) 10,546 $ 142,962
Meridian Fund, Inc.Notes to Financial Statements (continued)June 30, 2020
Meridian Funds 75 www.meridianfund.com
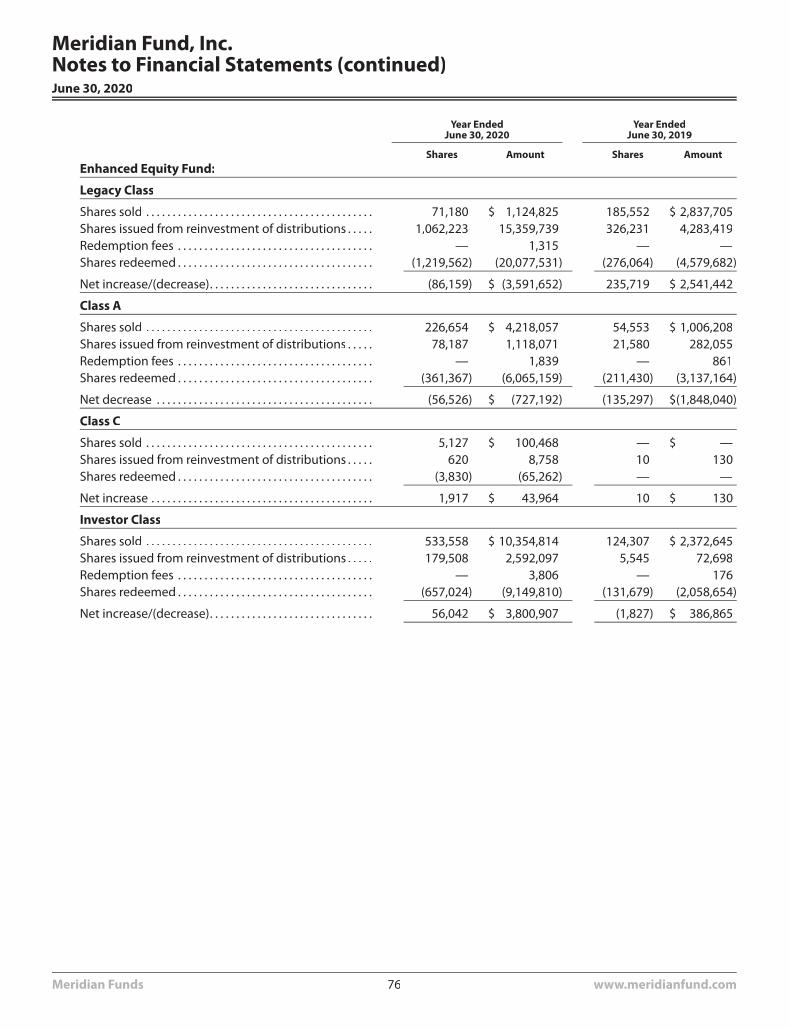
Year EndedJune 30, 2020
Year EndedJune 30, 2019
Shares Amount Shares AmountEnhanced Equity Fund:
Legacy Class
Shares sold . . . . . . . . . . . . . . . . . . . . . . . . . . . . . . . . . . . . . . . . . . . 71,180 $ 1,124,825 185,552 $ 2,837,705Shares issued from reinvestment of distributions . . . . . 1,062,223 15,359,739 326,231 4,283,419Redemption fees . . . . . . . . . . . . . . . . . . . . . . . . . . . . . . . . . . . . . — 1,315 — —Shares redeemed . . . . . . . . . . . . . . . . . . . . . . . . . . . . . . . . . . . . . (1,219,562) (20,077,531) (276,064) (4,579,682)
Net increase/(decrease). . . . . . . . . . . . . . . . . . . . . . . . . . . . . . . (86,159) $ (3,591,652) 235,719 $ 2,541,442
Class A
Shares sold . . . . . . . . . . . . . . . . . . . . . . . . . . . . . . . . . . . . . . . . . . . 226,654 $ 4,218,057 54,553 $ 1,006,208Shares issued from reinvestment of distributions . . . . . 78,187 1,118,071 21,580 282,055Redemption fees . . . . . . . . . . . . . . . . . . . . . . . . . . . . . . . . . . . . . — 1,839 — 861Shares redeemed . . . . . . . . . . . . . . . . . . . . . . . . . . . . . . . . . . . . . (361,367) (6,065,159) (211,430) (3,137,164)
Net decrease . . . . . . . . . . . . . . . . . . . . . . . . . . . . . . . . . . . . . . . . . (56,526) $ (727,192) (135,297) $(1,848,040)
Class C
Shares sold . . . . . . . . . . . . . . . . . . . . . . . . . . . . . . . . . . . . . . . . . . . 5,127 $ 100,468 — $ —Shares issued from reinvestment of distributions . . . . . 620 8,758 10 130Shares redeemed . . . . . . . . . . . . . . . . . . . . . . . . . . . . . . . . . . . . . (3,830) (65,262) — —
Net increase . . . . . . . . . . . . . . . . . . . . . . . . . . . . . . . . . . . . . . . . . . 1,917 $ 43,964 10 $ 130
Investor Class
Shares sold . . . . . . . . . . . . . . . . . . . . . . . . . . . . . . . . . . . . . . . . . . . 533,558 $ 10,354,814 124,307 $ 2,372,645Shares issued from reinvestment of distributions . . . . . 179,508 2,592,097 5,545 72,698Redemption fees . . . . . . . . . . . . . . . . . . . . . . . . . . . . . . . . . . . . . — 3,806 — 176Shares redeemed . . . . . . . . . . . . . . . . . . . . . . . . . . . . . . . . . . . . . (657,024) (9,149,810) (131,679) (2,058,654)
Net increase/(decrease). . . . . . . . . . . . . . . . . . . . . . . . . . . . . . . 56,042 $ 3,800,907 (1,827) $ 386,865
Meridian Fund, Inc.Notes to Financial Statements (continued)June 30, 2020
Meridian Funds 76 www.meridianfund.com
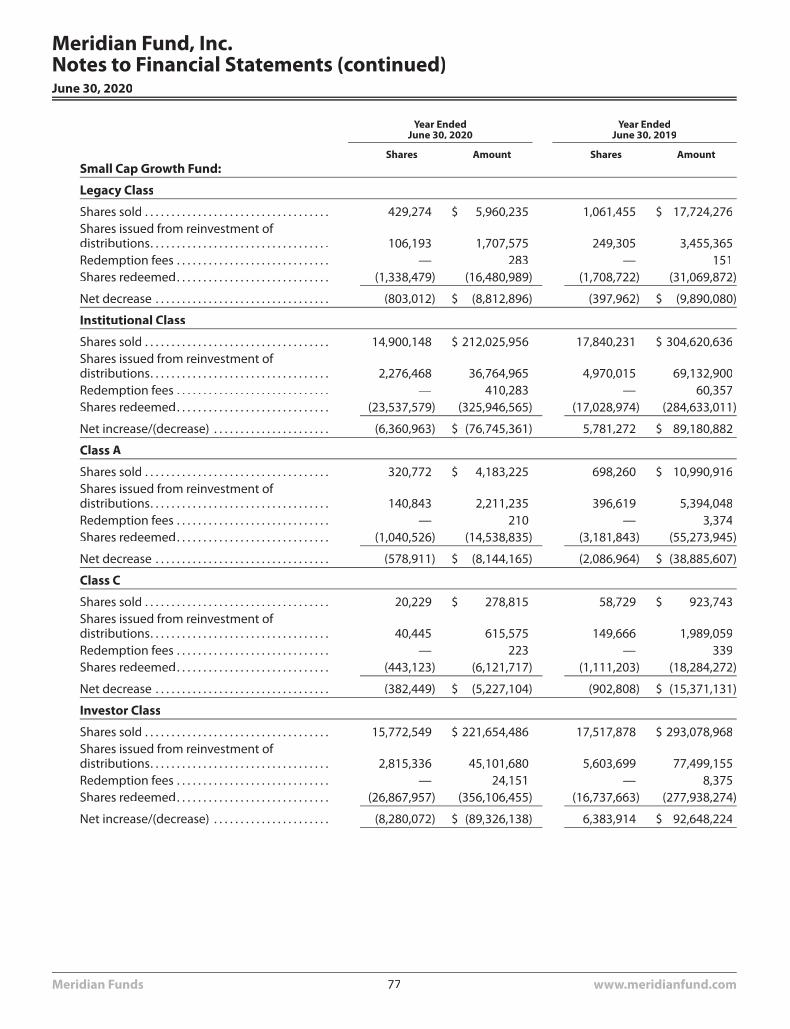
Year EndedJune 30, 2020
Year EndedJune 30, 2019
Shares Amount Shares AmountSmall Cap Growth Fund:
Legacy Class
Shares sold . . . . . . . . . . . . . . . . . . . . . . . . . . . . . . . . . . . 429,274 $ 5,960,235 1,061,455 $ 17,724,276Shares issued from reinvestment ofdistributions. . . . . . . . . . . . . . . . . . . . . . . . . . . . . . . . . . 106,193 1,707,575 249,305 3,455,365Redemption fees . . . . . . . . . . . . . . . . . . . . . . . . . . . . . — 283 — 151Shares redeemed. . . . . . . . . . . . . . . . . . . . . . . . . . . . . (1,338,479) (16,480,989) (1,708,722) (31,069,872)
Net decrease . . . . . . . . . . . . . . . . . . . . . . . . . . . . . . . . . (803,012) $ (8,812,896) (397,962) $ (9,890,080)
Institutional Class
Shares sold . . . . . . . . . . . . . . . . . . . . . . . . . . . . . . . . . . . 14,900,148 $ 212,025,956 17,840,231 $ 304,620,636Shares issued from reinvestment ofdistributions. . . . . . . . . . . . . . . . . . . . . . . . . . . . . . . . . . 2,276,468 36,764,965 4,970,015 69,132,900Redemption fees . . . . . . . . . . . . . . . . . . . . . . . . . . . . . — 410,283 — 60,357Shares redeemed. . . . . . . . . . . . . . . . . . . . . . . . . . . . . (23,537,579) (325,946,565) (17,028,974) (284,633,011)
Net increase/(decrease) . . . . . . . . . . . . . . . . . . . . . . (6,360,963) $ (76,745,361) 5,781,272 $ 89,180,882
Class A
Shares sold . . . . . . . . . . . . . . . . . . . . . . . . . . . . . . . . . . . 320,772 $ 4,183,225 698,260 $ 10,990,916Shares issued from reinvestment ofdistributions. . . . . . . . . . . . . . . . . . . . . . . . . . . . . . . . . . 140,843 2,211,235 396,619 5,394,048Redemption fees . . . . . . . . . . . . . . . . . . . . . . . . . . . . . — 210 — 3,374Shares redeemed. . . . . . . . . . . . . . . . . . . . . . . . . . . . . (1,040,526) (14,538,835) (3,181,843) (55,273,945)
Net decrease . . . . . . . . . . . . . . . . . . . . . . . . . . . . . . . . . (578,911) $ (8,144,165) (2,086,964) $ (38,885,607)
Class C
Shares sold . . . . . . . . . . . . . . . . . . . . . . . . . . . . . . . . . . . 20,229 $ 278,815 58,729 $ 923,743Shares issued from reinvestment ofdistributions. . . . . . . . . . . . . . . . . . . . . . . . . . . . . . . . . . 40,445 615,575 149,666 1,989,059Redemption fees . . . . . . . . . . . . . . . . . . . . . . . . . . . . . — 223 — 339Shares redeemed. . . . . . . . . . . . . . . . . . . . . . . . . . . . . (443,123) (6,121,717) (1,111,203) (18,284,272)
Net decrease . . . . . . . . . . . . . . . . . . . . . . . . . . . . . . . . . (382,449) $ (5,227,104) (902,808) $ (15,371,131)
Investor Class
Shares sold . . . . . . . . . . . . . . . . . . . . . . . . . . . . . . . . . . . 15,772,549 $ 221,654,486 17,517,878 $ 293,078,968Shares issued from reinvestment ofdistributions. . . . . . . . . . . . . . . . . . . . . . . . . . . . . . . . . . 2,815,336 45,101,680 5,603,699 77,499,155Redemption fees . . . . . . . . . . . . . . . . . . . . . . . . . . . . . — 24,151 — 8,375Shares redeemed. . . . . . . . . . . . . . . . . . . . . . . . . . . . . (26,867,957) (356,106,455) (16,737,663) (277,938,274)
Net increase/(decrease) . . . . . . . . . . . . . . . . . . . . . . (8,280,072) $ (89,326,138) 6,383,914 $ 92,648,224
Meridian Fund, Inc.Notes to Financial Statements (continued)June 30, 2020
Meridian Funds 77 www.meridianfund.com
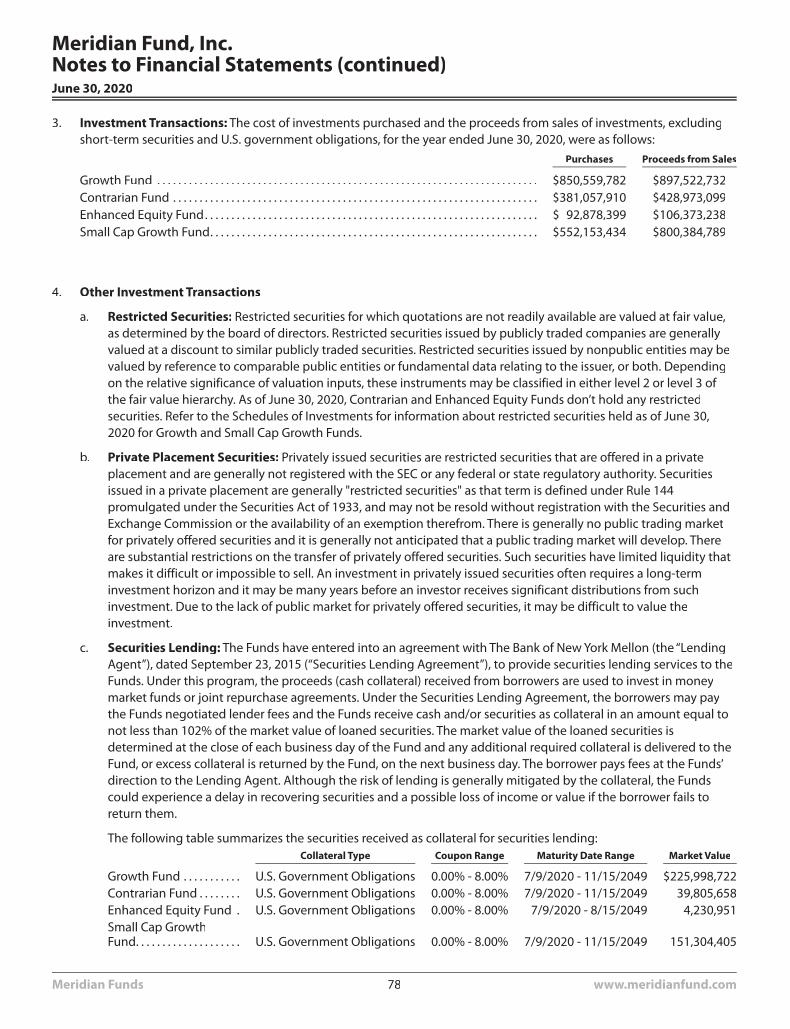
3. Investment Transactions: The cost of investments purchased and the proceeds from sales of investments, excludingshort-term securities and U.S. government obligations, for the year ended June 30, 2020, were as follows:
Purchases Proceeds from Sales
Growth Fund . . . . . . . . . . . . . . . . . . . . . . . . . . . . . . . . . . . . . . . . . . . . . . . . . . . . . . . . . . . . . . . . . . . . . . . . $850,559,782 $897,522,732Contrarian Fund . . . . . . . . . . . . . . . . . . . . . . . . . . . . . . . . . . . . . . . . . . . . . . . . . . . . . . . . . . . . . . . . . . . . . $381,057,910 $428,973,099Enhanced Equity Fund. . . . . . . . . . . . . . . . . . . . . . . . . . . . . . . . . . . . . . . . . . . . . . . . . . . . . . . . . . . . . . . $ 92,878,399 $106,373,238Small Cap Growth Fund. . . . . . . . . . . . . . . . . . . . . . . . . . . . . . . . . . . . . . . . . . . . . . . . . . . . . . . . . . . . . . $552,153,434 $800,384,789
4. Other Investment Transactions
a. Restricted Securities: Restricted securities for which quotations are not readily available are valued at fair value,as determined by the board of directors. Restricted securities issued by publicly traded companies are generallyvalued at a discount to similar publicly traded securities. Restricted securities issued by nonpublic entities may bevalued by reference to comparable public entities or fundamental data relating to the issuer, or both. Dependingon the relative significance of valuation inputs, these instruments may be classified in either level 2 or level 3 ofthe fair value hierarchy. As of June 30, 2020, Contrarian and Enhanced Equity Funds don’t hold any restrictedsecurities. Refer to the Schedules of Investments for information about restricted securities held as of June 30,2020 for Growth and Small Cap Growth Funds.
b. Private Placement Securities: Privately issued securities are restricted securities that are offered in a privateplacement and are generally not registered with the SEC or any federal or state regulatory authority. Securitiesissued in a private placement are generally "restricted securities" as that term is defined under Rule 144promulgated under the Securities Act of 1933, and may not be resold without registration with the Securities andExchange Commission or the availability of an exemption therefrom. There is generally no public trading marketfor privately offered securities and it is generally not anticipated that a public trading market will develop. Thereare substantial restrictions on the transfer of privately offered securities. Such securities have limited liquidity thatmakes it difficult or impossible to sell. An investment in privately issued securities often requires a long-terminvestment horizon and it may be many years before an investor receives significant distributions from suchinvestment. Due to the lack of public market for privately offered securities, it may be difficult to value theinvestment.
c. Securities Lending: The Funds have entered into an agreement with The Bank of New York Mellon (the “LendingAgent”), dated September 23, 2015 (“Securities Lending Agreement”), to provide securities lending services to theFunds. Under this program, the proceeds (cash collateral) received from borrowers are used to invest in moneymarket funds or joint repurchase agreements. Under the Securities Lending Agreement, the borrowers may paythe Funds negotiated lender fees and the Funds receive cash and/or securities as collateral in an amount equal tonot less than 102% of the market value of loaned securities. The market value of the loaned securities isdetermined at the close of each business day of the Fund and any additional required collateral is delivered to theFund, or excess collateral is returned by the Fund, on the next business day. The borrower pays fees at the Funds’direction to the Lending Agent. Although the risk of lending is generally mitigated by the collateral, the Fundscould experience a delay in recovering securities and a possible loss of income or value if the borrower fails toreturn them.
The following table summarizes the securities received as collateral for securities lending:Collateral Type Coupon Range Maturity Date Range Market Value
Growth Fund . . . . . . . . . . . U.S. Government Obligations 0.00% - 8.00% 7/9/2020 - 11/15/2049 $225,998,722Contrarian Fund . . . . . . . . U.S. Government Obligations 0.00% - 8.00% 7/9/2020 - 11/15/2049 39,805,658Enhanced Equity Fund . U.S. Government Obligations 0.00% - 8.00% 7/9/2020 - 8/15/2049 4,230,951Small Cap GrowthFund. . . . . . . . . . . . . . . . . . . . U.S. Government Obligations 0.00% - 8.00% 7/9/2020 - 11/15/2049 151,304,405
Meridian Fund, Inc.Notes to Financial Statements (continued)June 30, 2020
Meridian Funds 78 www.meridianfund.com
Income generated from securities lending is presented in the Statements of Operations. As of June 30, 2020, thetotal value of securities on loan for the Growth Fund, Contrarian Fund, Enhanced Equity Fund, and the Small CapGrowth Fund were $236,120,414, $44,556,428, $4,291,688, and $210,351,394, respectively. Securities on loan arefootnoted in the Schedules of Investments. As of June 30, 2020, the total collateral value for the Growth Fund,Contrarian Fund, Enhanced Equity Fund, and the Small Cap Growth Fund were $240,657,175, $44,149,288,$4,230,968 and $210,673,500, respectively.
d. Repurchase Agreements and Joint Repurchase Agreements: The Funds may enter into repurchase agreementsfor temporary cash management purposes provided that the value of the underlying collateral, including accruedinterest, will equal or exceed the value of the repurchase agreement during the term of the agreement. Theunderlying collateral for all repurchase agreements is held in safekeeping by the Funds' custodian or at the FederalReserve Bank. If the seller defaults and the value of the collateral declines, or if bankruptcy proceedingscommence with respect to the seller of the security, realization of the collateral by the Funds may be delayed orlimited.
Additionally, the Funds may enter into joint repurchase agreements for reinvestment of cash collateral onsecurities lending transactions under the securities lending program offered by the Lending Agent (the“Program”), provided that the value of the underlying collateral, including accrued interest will equal or exceedthe value of the joint repurchase agreement during the term of the agreement. The Funds participate on a pro ratabasis with other clients of the Lending Agent in its share of the underlying collateral under such joint repurchaseagreements and in its share of proceeds from any repurchase or other disposition of the underlying collateral. Theunderlying collateral for joint repurchase agreements is held in safekeeping by the Funds’ custodian or at theFederal Reserve Bank. If the seller defaults and the value of the collateral declines, or if bankruptcy proceedingscommence with respect to the seller of the security, realization of the collateral by the Funds may be delayed orlimited. Pursuant to the Program, the Funds are indemnified for such losses by the Lending Agent.
At June 30, 2020, the market value of repurchase agreements or joint repurchase agreements outstanding for theGrowth Fund, Contrarian Fund, Enhanced Equity Fund, and the Small Cap Growth Fund were $10,227,453,$4,343,630, $17 and $43,657,095, respectively.
e. Master Netting Arrangements: The Funds may enter into master netting agreements with their counterpartiesfor the repurchase agreements, which provide the right, in the event of default (including bankruptcy orinsolvency) for the non-defaulting party to liquidate the collateral and calculate net exposure to the defaultingparty or request additional collateral. For financial reporting purposes, the Funds do not offset financial assets andfinancial liabilities that are subject to master netting agreements in the Statements of Assets and Liabilities.
Meridian Fund, Inc.Notes to Financial Statements (continued)June 30, 2020
Meridian Funds 79 www.meridianfund.com
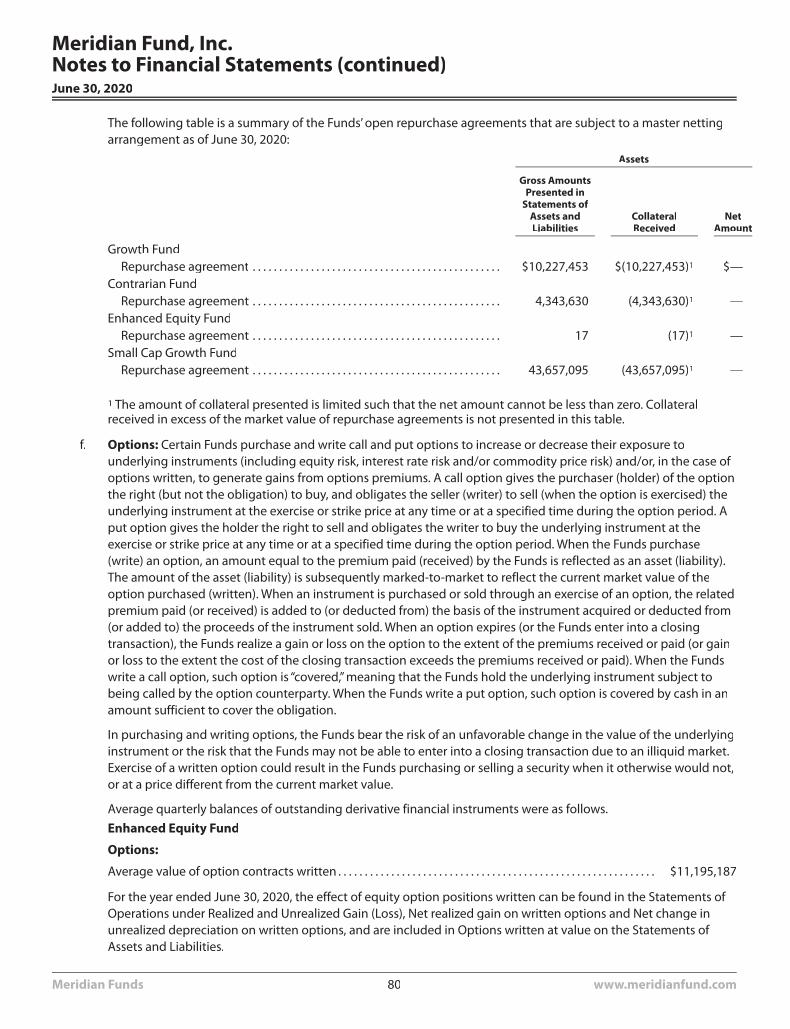
The following table is a summary of the Funds’ open repurchase agreements that are subject to a master nettingarrangement as of June 30, 2020:
Assets
Gross AmountsPresented in
Statements ofAssets andLiabilities
CollateralReceived
NetAmount
Growth FundRepurchase agreement . . . . . . . . . . . . . . . . . . . . . . . . . . . . . . . . . . . . . . . . . . . . . . . $10,227,453 $(10,227,453)1 $—
Contrarian FundRepurchase agreement . . . . . . . . . . . . . . . . . . . . . . . . . . . . . . . . . . . . . . . . . . . . . . . 4,343,630 (4,343,630)1 —
Enhanced Equity FundRepurchase agreement . . . . . . . . . . . . . . . . . . . . . . . . . . . . . . . . . . . . . . . . . . . . . . . 17 (17)1 —
Small Cap Growth FundRepurchase agreement . . . . . . . . . . . . . . . . . . . . . . . . . . . . . . . . . . . . . . . . . . . . . . . 43,657,095 (43,657,095)1 —
1 The amount of collateral presented is limited such that the net amount cannot be less than zero. Collateralreceived in excess of the market value of repurchase agreements is not presented in this table.
f. Options: Certain Funds purchase and write call and put options to increase or decrease their exposure tounderlying instruments (including equity risk, interest rate risk and/or commodity price risk) and/or, in the case ofoptions written, to generate gains from options premiums. A call option gives the purchaser (holder) of the optionthe right (but not the obligation) to buy, and obligates the seller (writer) to sell (when the option is exercised) theunderlying instrument at the exercise or strike price at any time or at a specified time during the option period. Aput option gives the holder the right to sell and obligates the writer to buy the underlying instrument at theexercise or strike price at any time or at a specified time during the option period. When the Funds purchase(write) an option, an amount equal to the premium paid (received) by the Funds is reflected as an asset (liability).The amount of the asset (liability) is subsequently marked-to-market to reflect the current market value of theoption purchased (written). When an instrument is purchased or sold through an exercise of an option, the relatedpremium paid (or received) is added to (or deducted from) the basis of the instrument acquired or deducted from(or added to) the proceeds of the instrument sold. When an option expires (or the Funds enter into a closingtransaction), the Funds realize a gain or loss on the option to the extent of the premiums received or paid (or gainor loss to the extent the cost of the closing transaction exceeds the premiums received or paid). When the Fundswrite a call option, such option is “covered,” meaning that the Funds hold the underlying instrument subject tobeing called by the option counterparty. When the Funds write a put option, such option is covered by cash in anamount sufficient to cover the obligation.
In purchasing and writing options, the Funds bear the risk of an unfavorable change in the value of the underlyinginstrument or the risk that the Funds may not be able to enter into a closing transaction due to an illiquid market.Exercise of a written option could result in the Funds purchasing or selling a security when it otherwise would not,or at a price different from the current market value.
Average quarterly balances of outstanding derivative financial instruments were as follows.
Enhanced Equity Fund
Options:
Average value of option contracts written . . . . . . . . . . . . . . . . . . . . . . . . . . . . . . . . . . . . . . . . . . . . . . . . . . . . . . . . . . . . $11,195,187
For the year ended June 30, 2020, the effect of equity option positions written can be found in the Statements ofOperations under Realized and Unrealized Gain (Loss), Net realized gain on written options and Net change inunrealized depreciation on written options, and are included in Options written at value on the Statements ofAssets and Liabilities.
Meridian Fund, Inc.Notes to Financial Statements (continued)June 30, 2020
Meridian Funds 80 www.meridianfund.com
g. Warrants: The Company can invest in warrants and stock purchase rights of companies of any marketcapitalization. A warrant gives the Company the right to buy stock, typically from the issuer. The warrant specifiesthe amount of underlying stock, the purchase (or "exercise") price, and the date the warrant expires. Certainwarrants may permit, without legal obligation, net settlement for stock or cash. The Company has no obligation toexercise the warrant and buy the stock.
h. Short Sales: The Funds may enter into short sales. A short sale occurs when a fund sells a security it generally doesnot own (the security is borrowed), in anticipation of a decline in the security’s price. The initial amount of a shortsale is recorded as a liability which is marked-to-market daily. Fluctuations in the value of the short liability arerecorded as unrealized gains or losses. If a Fund shorts a security when also holding a long position in the security(a “short against the box”), as the security’s price declines, the short position increases in value, offsetting the longposition’s decrease in value. The opposite effect occurs if the security’s price rises. A Fund realizes a gain or lossupon closing of the short sale (returning the security to the counterparty by way of purchase or delivery of a longposition owned). Possible losses from short sales may be unlimited, whereas losses from security purchasescannot exceed the total amount invested. The Funds are liable to the buyer for any dividends payable on securitieswhile those securities are in a short position. These dividends are an expense of the Funds. The Funds designatecollateral consisting of cash, U.S. government securities or other liquid assets sufficient to collateralize the marketvalue of short positions.
5. Market and Debt Securities Risk
In the normal course of business, each Fund's investment activities expose it to various types of risk associated with thefinancial instruments and markets in which it invests. The significant types of financial risks each Fund is exposed toinclude market risk and debt securities risk. Each Fund’s prospectus provides details of these and other types of risk.
Market Risk: Market risk refers to the possibility that the market values of securities or other investments that a Fundholds will fall, sometimes rapidly or unpredictably, or fail to rise. Security values may fall or fail to rise because of avariety of factors affecting (or the market’s perception of) individual companies or other issuers (e.g., an unfavorableearnings report), industries or sectors, or the market as a whole, reducing the value of an investment in a Fund.Accordingly, an investment in the Fund could lose money over short or even long periods. The market values of thesecurities the Fund holds also can be affected by changes (or perceived changes) in U.S. or foreign economies andfinancial markets, and the liquidity of these securities, among other factors. In general, equity securities tend to havegreater price volatility than debt securities. In addition, stock prices may be sensitive to rising interest rates, as the costof capital rises and borrowing costs increase. As a result, the value of your investments in a Fund may be more or lessthan the value of your purchase price.
Debt Securities Risk: Each Fund may invest in debt securities of both government and corporate issuers. A decline inprevailing levels of interest rates generally increases the value of debt securities in a Fund’s portfolio, while an increasein rates usually reduces the value of those securities. The value of a Fund’s debt securities, including bonds andconvertible securities, are affected by movements in interest rates; if interest rates rise, the value of these securities mayfall. Generally, the longer the average maturity of a debt security, the greater the change in its value. As a result, to theextent that a Fund invests in debt securities, interest rate fluctuations will affect the Fund’s net asset value, but not theincome it receives from debt securities it owns. Debt securities are also subject to credit, liquidity risk and prepaymentand extension risk. Credit risk is the risk that the entity that issued a debt security may become unable to makepayments of principal and interest, and includes the risk of default. Liquidity risk is the risk that a Fund may not be ableto sell portfolio securities because there are too few buyers for them. Prepayment and extension risk is the risk that aloan, bond or other security might be called or otherwise converted, prepaid or redeemed before maturity. If a loan orsecurity is converted, prepaid or redeemed before maturity, particularly during a time of declining interest rates orspreads, the portfolio managers may not be able to invest the proceeds in securities or loans providing as high a levelof income, resulting in a reduced yield to a Fund. Conversely, as interest rates rise or spreads widen, the likelihood ofprepayment decreases. The portfolio managers may be unable to capitalize on securities with higher interest rates orwider spreads because a Fund’s investments are locked in at a lower rate for a longer period of time.
Options Risk: Investments in options involve risks different from, and possibly greater than, investing directly in theunderlying security, asset or other reference, including, among others, the risk that the counterparty to an option may
Meridian Fund, Inc.Notes to Financial Statements (continued)June 30, 2020
Meridian Funds 81 www.meridianfund.com
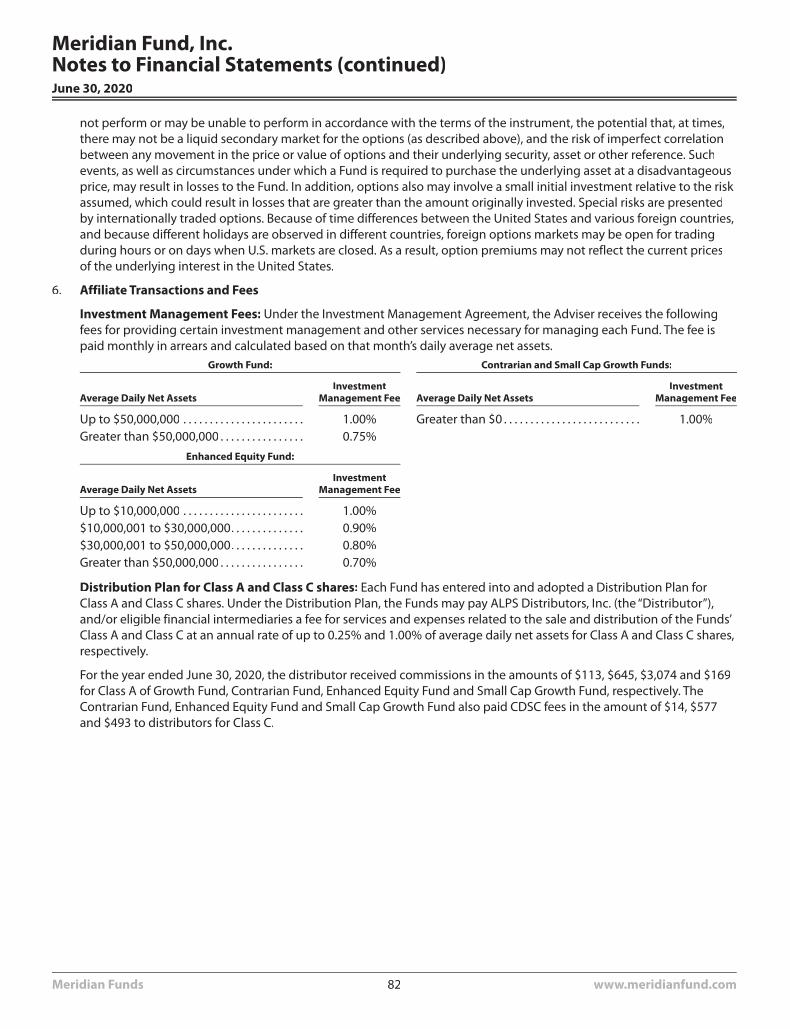
not perform or may be unable to perform in accordance with the terms of the instrument, the potential that, at times,there may not be a liquid secondary market for the options (as described above), and the risk of imperfect correlationbetween any movement in the price or value of options and their underlying security, asset or other reference. Suchevents, as well as circumstances under which a Fund is required to purchase the underlying asset at a disadvantageousprice, may result in losses to the Fund. In addition, options also may involve a small initial investment relative to the riskassumed, which could result in losses that are greater than the amount originally invested. Special risks are presentedby internationally traded options. Because of time differences between the United States and various foreign countries,and because different holidays are observed in different countries, foreign options markets may be open for tradingduring hours or on days when U.S. markets are closed. As a result, option premiums may not reflect the current pricesof the underlying interest in the United States.
6. Affiliate Transactions and Fees
Investment Management Fees: Under the Investment Management Agreement, the Adviser receives the followingfees for providing certain investment management and other services necessary for managing each Fund. The fee ispaid monthly in arrears and calculated based on that month’s daily average net assets.
Growth Fund: Contrarian and Small Cap Growth Funds:
Average Daily Net AssetsInvestment
Management Fee Average Daily Net AssetsInvestment
Management Fee
Up to $50,000,000 . . . . . . . . . . . . . . . . . . . . . . . 1.00% Greater than $0 . . . . . . . . . . . . . . . . . . . . . . . . . . 1.00%Greater than $50,000,000 . . . . . . . . . . . . . . . . 0.75%
Enhanced Equity Fund:
Average Daily Net AssetsInvestment
Management Fee
Up to $10,000,000 . . . . . . . . . . . . . . . . . . . . . . . 1.00%$10,000,001 to $30,000,000. . . . . . . . . . . . . . 0.90%$30,000,001 to $50,000,000. . . . . . . . . . . . . . 0.80%Greater than $50,000,000 . . . . . . . . . . . . . . . . 0.70%
Distribution Plan for Class A and Class C shares: Each Fund has entered into and adopted a Distribution Plan forClass A and Class C shares. Under the Distribution Plan, the Funds may pay ALPS Distributors, Inc. (the “Distributor”),and/or eligible financial intermediaries a fee for services and expenses related to the sale and distribution of the Funds’Class A and Class C at an annual rate of up to 0.25% and 1.00% of average daily net assets for Class A and Class C shares,respectively.
For the year ended June 30, 2020, the distributor received commissions in the amounts of $113, $645, $3,074 and $169for Class A of Growth Fund, Contrarian Fund, Enhanced Equity Fund and Small Cap Growth Fund, respectively. TheContrarian Fund, Enhanced Equity Fund and Small Cap Growth Fund also paid CDSC fees in the amount of $14, $577and $493 to distributors for Class C.
Meridian Fund, Inc.Notes to Financial Statements (continued)June 30, 2020
Meridian Funds 82 www.meridianfund.com
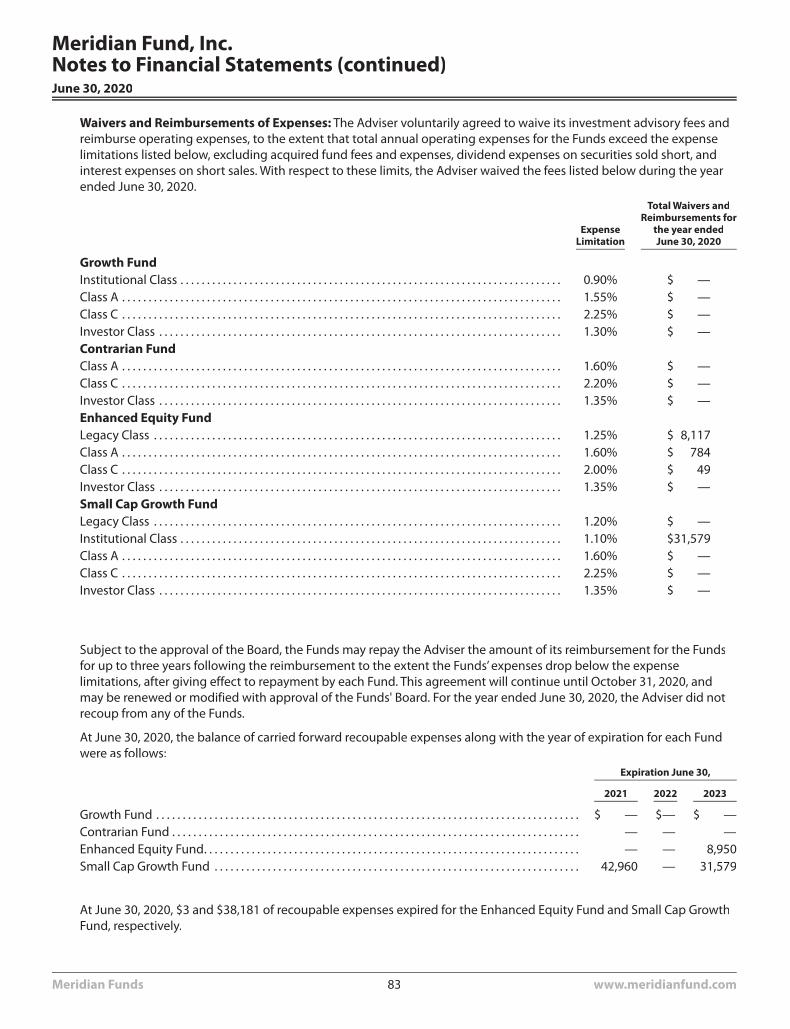
Waivers and Reimbursements of Expenses: The Adviser voluntarily agreed to waive its investment advisory fees andreimburse operating expenses, to the extent that total annual operating expenses for the Funds exceed the expenselimitations listed below, excluding acquired fund fees and expenses, dividend expenses on securities sold short, andinterest expenses on short sales. With respect to these limits, the Adviser waived the fees listed below during the yearended June 30, 2020.
ExpenseLimitation
Total Waivers andReimbursements for
the year endedJune 30, 2020
Growth FundInstitutional Class . . . . . . . . . . . . . . . . . . . . . . . . . . . . . . . . . . . . . . . . . . . . . . . . . . . . . . . . . . . . . . . . . . . . . . . . 0.90% $ —Class A . . . . . . . . . . . . . . . . . . . . . . . . . . . . . . . . . . . . . . . . . . . . . . . . . . . . . . . . . . . . . . . . . . . . . . . . . . . . . . . . . . . 1.55% $ —Class C . . . . . . . . . . . . . . . . . . . . . . . . . . . . . . . . . . . . . . . . . . . . . . . . . . . . . . . . . . . . . . . . . . . . . . . . . . . . . . . . . . . 2.25% $ —Investor Class . . . . . . . . . . . . . . . . . . . . . . . . . . . . . . . . . . . . . . . . . . . . . . . . . . . . . . . . . . . . . . . . . . . . . . . . . . . . 1.30% $ —Contrarian FundClass A . . . . . . . . . . . . . . . . . . . . . . . . . . . . . . . . . . . . . . . . . . . . . . . . . . . . . . . . . . . . . . . . . . . . . . . . . . . . . . . . . . . 1.60% $ —Class C . . . . . . . . . . . . . . . . . . . . . . . . . . . . . . . . . . . . . . . . . . . . . . . . . . . . . . . . . . . . . . . . . . . . . . . . . . . . . . . . . . . 2.20% $ —Investor Class . . . . . . . . . . . . . . . . . . . . . . . . . . . . . . . . . . . . . . . . . . . . . . . . . . . . . . . . . . . . . . . . . . . . . . . . . . . . 1.35% $ —Enhanced Equity FundLegacy Class . . . . . . . . . . . . . . . . . . . . . . . . . . . . . . . . . . . . . . . . . . . . . . . . . . . . . . . . . . . . . . . . . . . . . . . . . . . . . 1.25% $ 8,117Class A . . . . . . . . . . . . . . . . . . . . . . . . . . . . . . . . . . . . . . . . . . . . . . . . . . . . . . . . . . . . . . . . . . . . . . . . . . . . . . . . . . . 1.60% $ 784Class C . . . . . . . . . . . . . . . . . . . . . . . . . . . . . . . . . . . . . . . . . . . . . . . . . . . . . . . . . . . . . . . . . . . . . . . . . . . . . . . . . . . 2.00% $ 49Investor Class . . . . . . . . . . . . . . . . . . . . . . . . . . . . . . . . . . . . . . . . . . . . . . . . . . . . . . . . . . . . . . . . . . . . . . . . . . . . 1.35% $ —Small Cap Growth FundLegacy Class . . . . . . . . . . . . . . . . . . . . . . . . . . . . . . . . . . . . . . . . . . . . . . . . . . . . . . . . . . . . . . . . . . . . . . . . . . . . . 1.20% $ —Institutional Class . . . . . . . . . . . . . . . . . . . . . . . . . . . . . . . . . . . . . . . . . . . . . . . . . . . . . . . . . . . . . . . . . . . . . . . . 1.10% $31,579Class A . . . . . . . . . . . . . . . . . . . . . . . . . . . . . . . . . . . . . . . . . . . . . . . . . . . . . . . . . . . . . . . . . . . . . . . . . . . . . . . . . . . 1.60% $ —Class C . . . . . . . . . . . . . . . . . . . . . . . . . . . . . . . . . . . . . . . . . . . . . . . . . . . . . . . . . . . . . . . . . . . . . . . . . . . . . . . . . . . 2.25% $ —Investor Class . . . . . . . . . . . . . . . . . . . . . . . . . . . . . . . . . . . . . . . . . . . . . . . . . . . . . . . . . . . . . . . . . . . . . . . . . . . . 1.35% $ —
Subject to the approval of the Board, the Funds may repay the Adviser the amount of its reimbursement for the Fundsfor up to three years following the reimbursement to the extent the Funds’ expenses drop below the expenselimitations, after giving effect to repayment by each Fund. This agreement will continue until October 31, 2020, andmay be renewed or modified with approval of the Funds' Board. For the year ended June 30, 2020, the Adviser did notrecoup from any of the Funds.
At June 30, 2020, the balance of carried forward recoupable expenses along with the year of expiration for each Fundwere as follows:
Expiration June 30,
2021 2022 2023
Growth Fund . . . . . . . . . . . . . . . . . . . . . . . . . . . . . . . . . . . . . . . . . . . . . . . . . . . . . . . . . . . . . . . . . . . . . . . . . . . . . . . . $ — $— $ —Contrarian Fund . . . . . . . . . . . . . . . . . . . . . . . . . . . . . . . . . . . . . . . . . . . . . . . . . . . . . . . . . . . . . . . . . . . . . . . . . . . . . — — —Enhanced Equity Fund. . . . . . . . . . . . . . . . . . . . . . . . . . . . . . . . . . . . . . . . . . . . . . . . . . . . . . . . . . . . . . . . . . . . . . . — — 8,950Small Cap Growth Fund . . . . . . . . . . . . . . . . . . . . . . . . . . . . . . . . . . . . . . . . . . . . . . . . . . . . . . . . . . . . . . . . . . . . . 42,960 — 31,579
At June 30, 2020, $3 and $38,181 of recoupable expenses expired for the Enhanced Equity Fund and Small Cap GrowthFund, respectively.
Meridian Fund, Inc.Notes to Financial Statements (continued)June 30, 2020
Meridian Funds 83 www.meridianfund.com
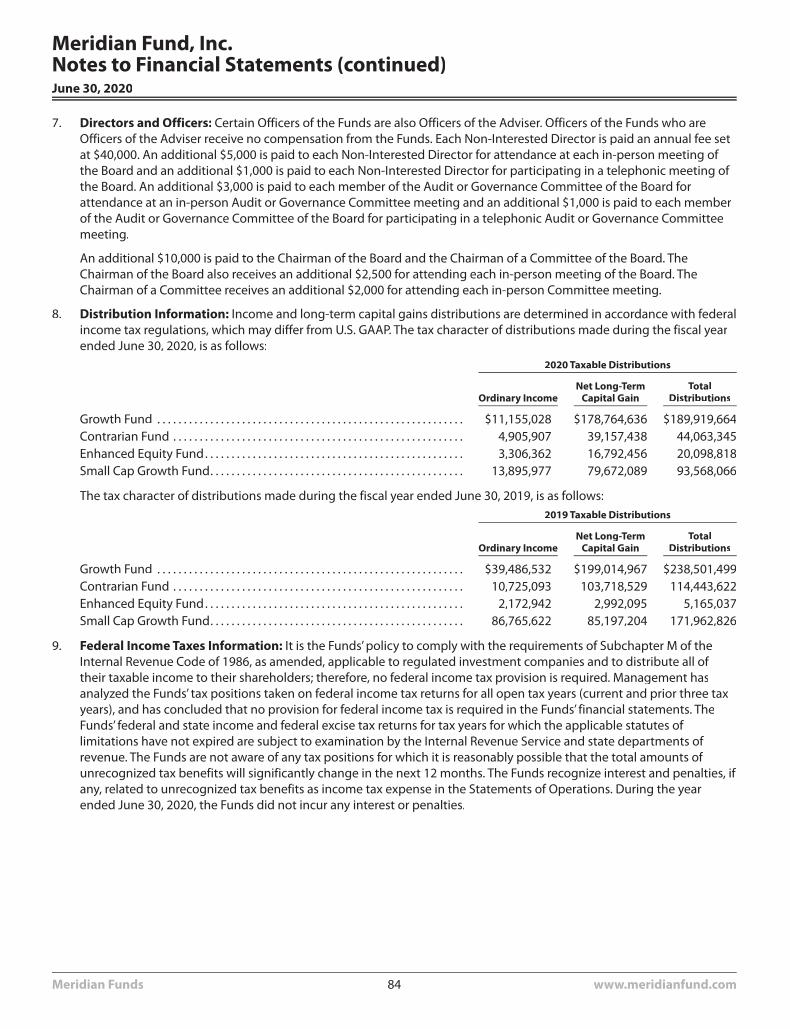
7. Directors and Officers: Certain Officers of the Funds are also Officers of the Adviser. Officers of the Funds who areOfficers of the Adviser receive no compensation from the Funds. Each Non-Interested Director is paid an annual fee setat $40,000. An additional $5,000 is paid to each Non-Interested Director for attendance at each in-person meeting ofthe Board and an additional $1,000 is paid to each Non-Interested Director for participating in a telephonic meeting ofthe Board. An additional $3,000 is paid to each member of the Audit or Governance Committee of the Board forattendance at an in-person Audit or Governance Committee meeting and an additional $1,000 is paid to each memberof the Audit or Governance Committee of the Board for participating in a telephonic Audit or Governance Committeemeeting.
An additional $10,000 is paid to the Chairman of the Board and the Chairman of a Committee of the Board. TheChairman of the Board also receives an additional $2,500 for attending each in-person meeting of the Board. TheChairman of a Committee receives an additional $2,000 for attending each in-person Committee meeting.
8. Distribution Information: Income and long-term capital gains distributions are determined in accordance with federalincome tax regulations, which may differ from U.S. GAAP. The tax character of distributions made during the fiscal yearended June 30, 2020, is as follows:
2020 Taxable Distributions
Ordinary IncomeNet Long-Term
Capital GainTotal
Distributions
Growth Fund . . . . . . . . . . . . . . . . . . . . . . . . . . . . . . . . . . . . . . . . . . . . . . . . . . . . . . . . . . $11,155,028 $178,764,636 $189,919,664Contrarian Fund . . . . . . . . . . . . . . . . . . . . . . . . . . . . . . . . . . . . . . . . . . . . . . . . . . . . . . . 4,905,907 39,157,438 44,063,345Enhanced Equity Fund. . . . . . . . . . . . . . . . . . . . . . . . . . . . . . . . . . . . . . . . . . . . . . . . . 3,306,362 16,792,456 20,098,818Small Cap Growth Fund. . . . . . . . . . . . . . . . . . . . . . . . . . . . . . . . . . . . . . . . . . . . . . . . 13,895,977 79,672,089 93,568,066
The tax character of distributions made during the fiscal year ended June 30, 2019, is as follows:2019 Taxable Distributions
Ordinary IncomeNet Long-Term
Capital GainTotal
Distributions
Growth Fund . . . . . . . . . . . . . . . . . . . . . . . . . . . . . . . . . . . . . . . . . . . . . . . . . . . . . . . . . . $39,486,532 $199,014,967 $238,501,499Contrarian Fund . . . . . . . . . . . . . . . . . . . . . . . . . . . . . . . . . . . . . . . . . . . . . . . . . . . . . . . 10,725,093 103,718,529 114,443,622Enhanced Equity Fund. . . . . . . . . . . . . . . . . . . . . . . . . . . . . . . . . . . . . . . . . . . . . . . . . 2,172,942 2,992,095 5,165,037Small Cap Growth Fund. . . . . . . . . . . . . . . . . . . . . . . . . . . . . . . . . . . . . . . . . . . . . . . . 86,765,622 85,197,204 171,962,826
9. Federal Income Taxes Information: It is the Funds’ policy to comply with the requirements of Subchapter M of theInternal Revenue Code of 1986, as amended, applicable to regulated investment companies and to distribute all oftheir taxable income to their shareholders; therefore, no federal income tax provision is required. Management hasanalyzed the Funds’ tax positions taken on federal income tax returns for all open tax years (current and prior three taxyears), and has concluded that no provision for federal income tax is required in the Funds’ financial statements. TheFunds’ federal and state income and federal excise tax returns for tax years for which the applicable statutes oflimitations have not expired are subject to examination by the Internal Revenue Service and state departments ofrevenue. The Funds are not aware of any tax positions for which it is reasonably possible that the total amounts ofunrecognized tax benefits will significantly change in the next 12 months. The Funds recognize interest and penalties, ifany, related to unrecognized tax benefits as income tax expense in the Statements of Operations. During the yearended June 30, 2020, the Funds did not incur any interest or penalties.
Meridian Fund, Inc.Notes to Financial Statements (continued)June 30, 2020
Meridian Funds 84 www.meridianfund.com
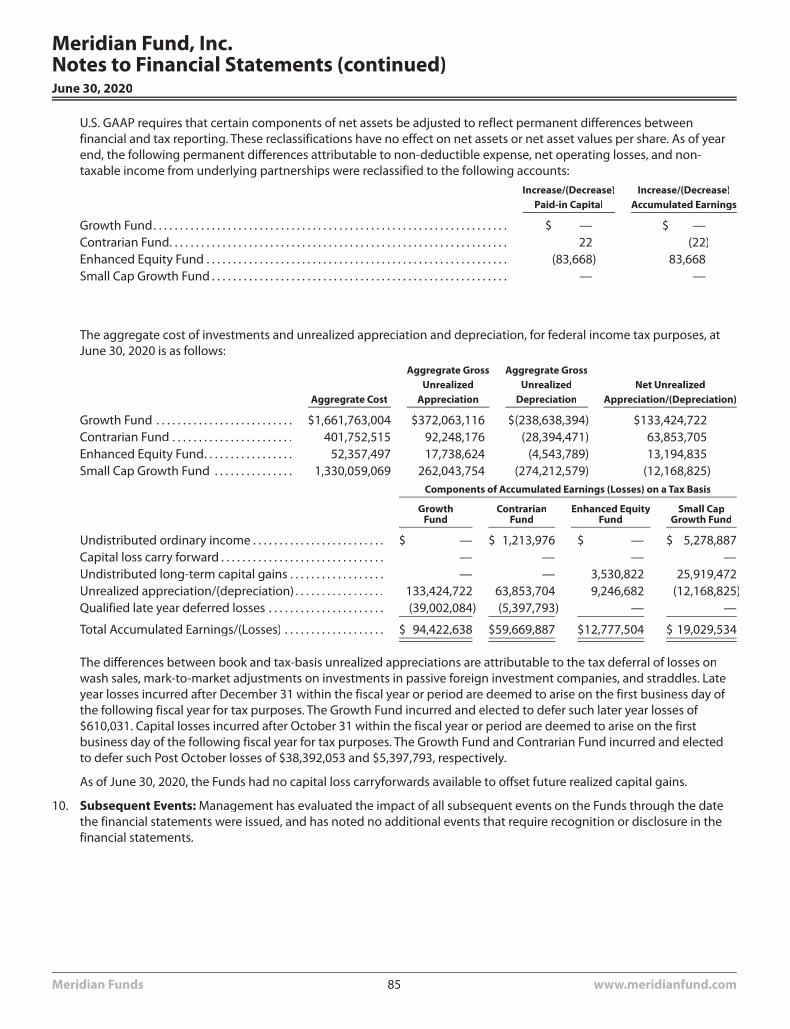
U.S. GAAP requires that certain components of net assets be adjusted to reflect permanent differences betweenfinancial and tax reporting. These reclassifications have no effect on net assets or net asset values per share. As of yearend, the following permanent differences attributable to non-deductible expense, net operating losses, and non-taxable income from underlying partnerships were reclassified to the following accounts:
Increase/(Decrease)Paid-in Capital
Increase/(Decrease)Accumulated Earnings
Growth Fund. . . . . . . . . . . . . . . . . . . . . . . . . . . . . . . . . . . . . . . . . . . . . . . . . . . . . . . . . . . . . . . . . . . $ — $ —Contrarian Fund. . . . . . . . . . . . . . . . . . . . . . . . . . . . . . . . . . . . . . . . . . . . . . . . . . . . . . . . . . . . . . . . 22 (22)Enhanced Equity Fund . . . . . . . . . . . . . . . . . . . . . . . . . . . . . . . . . . . . . . . . . . . . . . . . . . . . . . . . . (83,668) 83,668Small Cap Growth Fund . . . . . . . . . . . . . . . . . . . . . . . . . . . . . . . . . . . . . . . . . . . . . . . . . . . . . . . . — —
The aggregate cost of investments and unrealized appreciation and depreciation, for federal income tax purposes, atJune 30, 2020 is as follows:
Aggregrate Cost
Aggregrate GrossUnrealized
Appreciation
Aggregrate GrossUnrealized
DepreciationNet Unrealized
Appreciation/(Depreciation)
Growth Fund . . . . . . . . . . . . . . . . . . . . . . . . . . $1,661,763,004 $372,063,116 $(238,638,394) $133,424,722Contrarian Fund . . . . . . . . . . . . . . . . . . . . . . . 401,752,515 92,248,176 (28,394,471) 63,853,705Enhanced Equity Fund. . . . . . . . . . . . . . . . . 52,357,497 17,738,624 (4,543,789) 13,194,835Small Cap Growth Fund . . . . . . . . . . . . . . . 1,330,059,069 262,043,754 (274,212,579) (12,168,825)
Components of Accumulated Earnings (Losses) on a Tax Basis
GrowthFund
ContrarianFund
Enhanced EquityFund
Small CapGrowth Fund
Undistributed ordinary income . . . . . . . . . . . . . . . . . . . . . . . . . $ — $ 1,213,976 $ — $ 5,278,887Capital loss carry forward . . . . . . . . . . . . . . . . . . . . . . . . . . . . . . . — — — —Undistributed long-term capital gains . . . . . . . . . . . . . . . . . . — — 3,530,822 25,919,472Unrealized appreciation/(depreciation) . . . . . . . . . . . . . . . . . 133,424,722 63,853,704 9,246,682 (12,168,825)Qualified late year deferred losses . . . . . . . . . . . . . . . . . . . . . . (39,002,084) (5,397,793) — —
Total Accumulated Earnings/(Losses) . . . . . . . . . . . . . . . . . . . $ 94,422,638 $59,669,887 $12,777,504 $ 19,029,534
The differences between book and tax-basis unrealized appreciations are attributable to the tax deferral of losses onwash sales, mark-to-market adjustments on investments in passive foreign investment companies, and straddles. Lateyear losses incurred after December 31 within the fiscal year or period are deemed to arise on the first business day ofthe following fiscal year for tax purposes. The Growth Fund incurred and elected to defer such later year losses of$610,031. Capital losses incurred after October 31 within the fiscal year or period are deemed to arise on the firstbusiness day of the following fiscal year for tax purposes. The Growth Fund and Contrarian Fund incurred and electedto defer such Post October losses of $38,392,053 and $5,397,793, respectively.
As of June 30, 2020, the Funds had no capital loss carryforwards available to offset future realized capital gains.
10. Subsequent Events: Management has evaluated the impact of all subsequent events on the Funds through the datethe financial statements were issued, and has noted no additional events that require recognition or disclosure in thefinancial statements.
Meridian Fund, Inc.Notes to Financial Statements (continued)June 30, 2020
Meridian Funds 85 www.meridianfund.com
Report of Independent Registered Public Accounting FirmTo the Shareholders of Meridian Growth Fund, Meridian Contrarian Fund, Meridian Enhanced Equity Fund, and MeridianSmall Cap Growth Fund and Board of Directors of Meridian Fund, Inc.
We have audited the accompanying statements of assets and liabilities, including the schedules of investments, of MeridianFund, Inc. comprising Meridian Growth Fund, Meridian Contrarian Fund, Meridian Enhanced Equity Fund, and MeridianSmall Cap Growth Fund (the “Funds”) as of June 30, 2020, the related statements of operations for the year then ended, thestatements of changes in net assets for each of the two years in the period then ended, including the related notes, and thefinancial highlights for each of the three years in the period then ended (collectively referred to as the “financialstatements”). In our opinion, the financial statements present fairly, in all material respects, the financial position of each ofthe Funds as of June 30, 2020, the results of their operations for the year then ended, the changes in their net assets for eachof the two years in the period then ended, and the financial highlights for each of the three years in the period then ended,in conformity with accounting principles generally accepted in the United States of America.
The Funds’ financial highlights for the years ended June 30, 2017, and prior, were audited by other auditors whose reportdated August 24, 2017, expressed an unqualified opinion on those financial highlights.
These financial statements are the responsibility of the Funds’ management. Our responsibility is to express an opinion onthe Funds’ financial statements based on our audits. We are a public accounting firm registered with the Public CompanyAccounting Oversight Board (United States) (“PCAOB”) and are required to be independent with respect to the Funds inaccordance with the U.S. federal securities laws and the applicable rules and regulations of the Securities and ExchangeCommission and the PCAOB.
We conducted our audits in accordance with the standards of the PCAOB. Those standards require that we plan and performthe audit to obtain reasonable assurance about whether the financial statements are free of material misstatement whetherdue to error or fraud.
Our audits included performing procedures to assess the risks of material misstatement of the financial statements, whetherdue to error or fraud, and performing procedures that respond to those risks. Such procedures included examining, on a testbasis, evidence regarding the amounts and disclosures in the financial statements. Our procedures included confirmation ofsecurities owned as of June 30, 2020, by correspondence with the custodian, brokers, and transfer agents or by otherappropriate auditing procedures where replies from brokers or counterparties were not received. Our audits also includedevaluating the accounting principles used and significant estimates made by management, as well as evaluating the overallpresentation of the financial statements. We believe that our audits provide a reasonable basis for our opinion.
We have served as the Funds’ auditor since 2018.
Cohen & Company, Ltd.
Cleveland, Ohio
August 25, 2020
Meridian Funds 86 www.meridianfund.com
Board Consideration of Liquidity Risk Management ProgramThe Company has adopted and implemented a liquidity risk management program (the “Program”), as consistent withRule 22e-4 to govern the Company’s approach to managing liquidity risk for each Fund. The Program is overseen by theLiquidity Committee (the “Committee”), which is comprised of the Company’s Treasurer, Secretary, Assistant Treasurer and acompliance representative of the Company’s investment adviser, ArrowMark Colorado Holdings, LLC. The Company’s Boardof Directors (the “Board”) has approved the designation of the Committee to oversee the Program.
The Program’s principal objectives include supporting each Fund’s compliance with limits on investments in illiquid assetsand mitigating the risk that a Fund will be unable to meet its redemption obligations in a timely manner. The Program alsoincludes a number of elements that support the management and assessment of liquidity risk, including an annualassessment of factors that influence a Fund’s liquidity and the periodic classification and re-classification of the Fund’sinvestments into groupings that reflect the Committee’s assessment of their relative liquidity under current marketconditions.
At a meeting of the Board held on May 12, 2020, the Committee provided a report (the “Report”) to the Board addressing theoperation, adequacy, and effectiveness of the Program, including any material changes to the Program for the period fromthe inception of the Company’s program on May 14, 2019 through March 31, 2020 (“Reporting Period”). The Reportconcluded that the Company’s Program was reasonably designed to assess and manage each Fund’s liquidity risk and wasadequately and effectively implemented during the Reporting Period. There were no material changes to the Programduring the Reporting Period. The Report further concluded that the Company’s investment strategies continue to beappropriate given the Company’s status as an open-end fund.
There can be no assurance that the Program will achieve its objectives in the future. Additional information regarding risksof investing in the Company, including liquidity risks presented by the Company’s investment portfolio, is found in theCompany’s Prospectus and Statement of Additional Information.
Meridian Funds 87 www.meridianfund.com
The individuals listed below serve as directors or officers of Meridian Fund, Inc. (the “Meridian Funds”). Each director of the Meridian Funds servesuntil a successor is elected and qualified or until resignation. Each officer of the Meridian Funds is elected annually by the Board of Directors. Theaddress of all officers and directors is 100 Fillmore Street, Suite 325, Denver, CO 80206. The Meridian Funds’ Statement of Additional Information(SAI) includes more information about the Directors. To request a free copy, call Meridian at 1-800-446-6662.
Interested Directors*Positions(s) Held withFund:
Length of Service(Beginning Date)
Principal Occupation(s)During Past 5 Years
Number ofPortfolios Overseen
OtherDirectorships
Michael Stolper* (75) Director Indefinite termsince May 3, 1985
President, Stolper &Company, Inc. (aninvestment adviser),September 1975 toDecember 2017; Trustee,Ewing Marion KauffmanFoundation, March 2010to present.
4 StoneCastleFinancial Corp.;
Windowpane Funds(one portfolio)
* Mr. Stolper is treated as an “interested” person of the Funds, as such term is defined in the 1940 Act, because, as a result of his prior ownership interest in Aster InvestmentManagement, Inc. (the “Previous Investment Adviser”, the previous investment adviser to the Meridian Enhanced Equity Fund, Meridian Growth Fund, and Meridian ContrarianFund.)
Non-Interested Directors Position(s) Held with Fund:Length of Service(Beginning Date)
Princiapl Occupation(s)During Past 5 Years
Number of PortfoliosOverseen Other Directorships
Guy M. Arnold (52) Director Indefinite term sinceMay 12, 2015
President of HuntDevelopment Group fromJuly 2015 to present;Owner/Manager of GMAHoldings, LLC from January2013 to July 2015.
4 StoneCastleFinancial Corp.;MidFirst Bank –
ColoradoAdvisory
Member; TheChildren’s
Hospital ofColorado Finance
Committee
John S. Emrich, CFA (52) Director Indefinite term sinceOctober 6, 2010
Private Investor, January2011 to present Memberand Manager,Iroquois Valley Farms, LLC,June 2012 to August 2015.
4 StoneCastleFinancial Corp.;Destra Funds (4
Funds); CleanEnergy Federal
Credit Union
Michael S. Erickson (68) Director Indefinite term sinceMay 3, 1985
Private Investor,August 2007 to present;Treasurer and Vice President,Erickson Holding Corp., 2003to present; Treasurer, VicePresident and Manager,McGee Island LLC, 2015 topresent.
4 Destra Funds (4Funds)
James Bernard Glavin (85) Director and Chairmanof the Board
Indefinite term sinceMay 3, 1985
Retired; previouslyChairman of the Board,Orchestra Theraputics,Inc.
4 None
Edward F. Keely, CFA (53) Director Indefinite term sinceFebruary 13, 2015
Chief InvestmentOfficer/Portfolio Manager atBorgen Investment Group,2008 to present.
4 None
OfficersPosition(s) Held withFund: Length of Service
Principal Occupation(s)During Past 5 Years
David Corkins (53) President (PrincipalExecutive Officer)
Indefinite; SinceSeptember 5, 2013
Co-Founder, Principal and PortfolioManager, ArrowMark Colorado Holdings,LLC
Rick Grove (51) Vice President,Secretary and ChiefCompliance Officer
Indefinite; SinceSeptember 5, 2013
Chief Compliance Officer, ArrowMarkColorado Holdings, LLC; formerly, ChiefOperating Officer, ArrowMark ColoradoHoldings, LLC
Katie Jones (36) Chief Financial Officer(Principal FinancialOfficer) and Treasurer
Indefinite; SinceAugust 12, 2014
Controller, ArrowMark Colorado Holdings,LLC; formerly, Assistant Treasurer, MeridianFund, Inc.
Kelsey Auble (30) Assistant Treasurer Indefinite; SinceNovember 12, 2019
Assistant Controller, ArrowMark ColoradoHoldings, LLC; formerly, AlternativeInvestment Accounting Supervisor, ALPSFund Services
Meridian Fund, Inc.Information About the Directors and Officers
Meridian Funds 88 www.meridianfund.com
The information set forth below is for each Fund’s fiscal year as required by federal laws. Shareholders, however, must reportdistributions on a calendar year basis for income tax purposes, which may include distributions for portions of two fiscalyears of a fund. Accordingly, the information needed by shareholders for income tax purposes will be sent to them in early2019. Please consult your tax advisor for proper treatment of this information.
For the period July 1, 2019 to June 30, 2020, the Funds reported the following terms with regard to distributions paid duringthe period. All information is based on financial information available as of the date of this annual report and, accordingly, issubject to change. For each item, it is the intention of each Fund to report the maximum amount permitted under theInternal Revenue Code and the regulations thereunder.
Pursuant to Internal Revenue Code Section 852(b)(3), the Growth Fund, Contrarian Fund, Enhanced Equity Fund, and SmallCap Growth Fund reported $178,764,636, $39,157,438, $16,792,456, and $79,672,089, respectively, as long-term capital gaindistribution for the year ended June 30, 2020.
Pursuant to Internal Revenue Code Section 854(b)(2), the Funds listed below report a percentage of their ordinary incomedividends distributed during the year ended June 30, 2020 as qualifying for the corporate dividends-received deduction:
Growth Fund 61.14%Contrarian Fund 100%Enhanced Equity Fund 5.90%Small Cap Growth Fund 17.00%
Pursuant to Section 1 (h)(11) of the Internal Revenue Code, the Funds listed below report the following amounts of theirincome dividends paid during the year ended June 30, 2020 as qualified dividend income (QDI):
Growth Fund 70.14%Contrarian Fund 100%Enhanced Equity Fund 5.72%Small Cap Growth Fund 14.41%
The Funds report a portion of the net income dividends distributed during the year ended June 30, 2020, as QualifiedInterest Income (QII), as defined in the Internal Revenue Code as follows:
Growth Fund 0%Contrarian Fund 2.75%Enhanced Equity Fund 0%Small Cap Growth Fund 0%
The Funds report a portion of the short term capital gain dividends distributed during the year ended June 30, 2020, asQualified Short-Term Gain, as defined in the Internal Revenue Code as follows:
Growth Fund 100%Contrarian Fund 0%Enhanced Equity Fund 100%Small Cap Growth Fund 100%
U.S. Government interest represents the amount of interest that was derived from direct U.S. Government obligations anddistributed during the fiscal year. This amount is reflected as a percentage of total ordinary income distributions (the total ofshort-term capital gain and net investment income distributions). Generally, interest from direct U.S. Governmentobligations is exempt from state income tax. However, for residents of California, Connecticut and New York, the statutorythreshold requirements were not satisfied to permit exception of these amounts from state income for the Funds.
Meridian Fund, Inc.2020 TAX NOTICE TO SHAREHOLDERS (Unaudited)
Meridian Funds 89 www.meridianfund.com
U.S. Government interest:
Growth Fund 0%Contrarian Fund 0%Enhanced Equity Fund 0%Small Cap Growth Fund 0%
Meridian Fund, Inc.2020 TAX NOTICE TO SHAREHOLDERS (Unaudited) (continued)
Meridian Funds 90 www.meridianfund.com
Average Annual Total Return: This is a commonly used method to express an investment’s performance over a particular,usually multi-year time period. It expresses the return that would have been necessary each year to equal the investment’sactual cumulative performance (including change in NAV or offer price and reinvested distributions and capital gains, if any)over the time period being considered.
Call Option: An agreement that gives an investor the right (but not the obligation) to buy a stock, bond, commodity, orother instrument at a specified price within a specific time period.
Russell 2000® Growth Index: An index that measures the performance of those Russell 2000 companies with higher price-to-book ratios and higher forecasted growth values. The index returns assume reinvestment of distributions, but do notreflect any applicable sales charges or management fees.
Russell 2500® Growth Index: Measures the performances of the small to mid-cap growth segment of the U.S. equityuniverse. It includes those Russell 2500® Index companies with higher price-to-book ratios and higher forecasted growthvalues.
Russell 2500® Index: Measures the performance of the small to mid-cap segment of the U.S. equity universe, commonlyreferred to as "smid" cap. The Russell 2500™ is a subset of the Russell 3000® Index.
Russell 2500® Value Index: Measures the performance of the small to mid-cap value segment of the U.S. equity universe. Itincludes those Russell 2500 companies that are considered more value oriented relative to the overall market as defined byRussell’s leading style methodology. One cannot invest directly into an index.
S&P 500® Index: A commonly recognized market-capitalization-weighted index of 500 widely held equity securities,designed to measure broad U. S. equity performance.
Meridian Fund, Inc.Glossary of Terms Used in this Report (Unaudited)
Meridian Funds 91 www.meridianfund.com
Meridian Fund, Inc. shareholders are entitled to know how we protect personal information and how we limit disclosure.
Information sources. We obtain nonpublic personal information about our shareholders from the following sources:
• Applications or other forms
• Transactions with us, our affiliates, or others
Protection of information. We do not disclose any nonpublic personal information about current or former shareholders,except as permitted or required by law. Personal information refers to information that personally identifies you or yourfinancial accounts. This includes among other items, your social security numbers, your address and account transactions.We do not sell your personal information to anyone.
Disclosure of information. We may send your financial adviser or other financial intermediaries or individuals (asdesignated by you) copies of confirmations, quarterly account statements and other documents reporting activity in youraccounts. We may also provide your personal information to firms that assist us in servicing your account, such as ourtransfer agent. If at any time in the future it is necessary to disclose your personal information in a way that is inconsistentwith this policy, we will give you advance notice of the proposed change so that you will have the opportunity to opt out ofsuch disclosure. We will not disclose your personal information to any other unaffiliated third parties, except as permitted orrequired by law, unless you have specifically asked us to do so; that is, opted in.
Security measures. To protect your personal information, we permit access only by authorized employees or serviceproviders. We maintain physical, electronic and procedural safeguards to protect your personal account information. Ouremployees and agents have access to that information only so that they may offer products or provide services to you, forexample, when responding to questions directly related to your account. If you ever find that your account information isincomplete, inaccurate or not current, please write to us at Meridian Fund, Inc., P.O. Box 9792, Providence, RI 02940 or call usat 1-800-446-6662. This privacy policy applies to all Meridian Fund, Inc. accounts you presently have, or may open in thefuture using your social security number, whether or not you remain a shareholder of a Fund. If you have any questions orconcerns, please contact us at the address or telephone number above.
MERIDIAN FUND, INC. PRIVACY POLICY NOTICE
For more information about MERIDIAN FUND, INC. the following documents are available free upon request. You can downloadshareholder reports and the Funds’ Statement of Additional Information at no cost from our website at www.meridianfund.com.
Annual/Semi-annual Reports:
The Funds’ Annual and Semi-annual Reports to Shareholders contain detailed information about the Funds’ portfolios.
In the Funds’ Annual Report, you will find a discussion of market conditions and investment strategies that significantlyaffected the Funds’ performance during the last fiscal year.
Statement of Additional Information (SAI):
The SAI provides additional information about the Funds, including operations and investment strategies.
You may obtain free copies of the reports and the SAI, request other information or make shareholder inquiries, by visitingthe Meridian Fund, Inc. website at www.meridianfund.com. To request additional information or to speak with arepresentative of the Funds, contact us at:
MERIDIAN FUND, INC.P.O. Box 9792
Providence, RI 029401-800-446-6662
You can also review the Funds’ reports and SAI:
• By electronic request at the following E-mail address: [email protected]
• Free from the Commission’s Website at http://www.sec.gov.
(Investment Company Act File No. 811-04014)

THIS PAGE INTENTIONALLY LEFT BLANK

THIS PAGE INTENTIONALLY LEFT BLANK
Proxy Voting GuidelinesThe Adviser is responsible for exercising the voting rights associated with the securities purchased and held bythe Funds. A description of the policies and procedures that the Adviser uses in fulfilling this responsibility andinformation regarding how those proxies were voted during the most recent 12-month period ended June 30 areavailable without charge upon request by calling toll free (800) 446-6662. These items are also available on theSecurities and Exchange Commission’s website at http://www.sec.gov.
Quarterly Portfolio DisclosureThe Adviser files a complete listing of portfolio holdings for each Fund as of the end of the first and third quartersof each fiscal year as an exhibit to its reports on Form N-PORT, and for reporting periods prior to March 31, 2019,filed such information on Form N-Q. The complete listing is available on the Commission’s website athttp://www.sec.gov.
Contact UsBy phone from 9:00 AM to 6:00 PM EST on any business day at the following if you are an:
Individual Investor:(800) 446-6662
Institutional Investor:(303) 398-2929
Financial Advisor:(877) 796-3434
Key InformationInvestment AdviserArrowMark Colorado Holdings, LLC100 Fillmore Street, Suite 325Denver, CO 80206
DistributorALPS Distributors, Inc.1290 Broadway, Suite 1000Denver, CO 80203
Administrator, Transfer Agent and Disbursing AgentBNY Mellon Investment Servicing (US) Inc.760 Moore RoadKing of Prussia, PA 19406
CustodianThe Bank of New York MellonOne Wall StreetNew York, NY 10286
CounselDavis Graham & Stubbs LLP1550 17th Street, Suite 500Denver, CO 80202
Independent Registered Public Accounting FirmCohen & Company, Ltd.1350 Euclid Ave., Suite 800Cleveland, OH 44115
Directors and Officers
DirectorsJames Bernard Glavin, ChairmanGuy M. ArnoldJohn S. EmrichMichael S. EricksonEdward F. KeelyMichael Stolper*
OfficersDavid Corkins, PresidentKatie Jones, Chief Financial Officer and TreasurerRichard Grove, Vice President, Secretary and Chief
Compliance OfficerKelsey Auble, Assistant Treasurer
*Interested Director
Meridian Fund, Inc.Other Information (Unaudited)June 30, 2020
Related Documents