Mergers and Marginal Costs: New Evidence on Hospital Buyer Power Stuart Craig * University of Pennsylvania, The Wharton School [email protected] Matthew Grennan University of Pennsylvania, The Wharton School & NBER [email protected] Ashley Swanson Columbia University, Graduate School of Business & NBER [email protected] May 15, 2020 Abstract We estimate the effects of hospital mergers, using detailed data containing medical supply transactions (representing 23 percent of operating costs) from a sample of US hospitals 2009-2015. Pre-merger price variation across hospitals (Gini coefficient 7 per- cent) suggests significant opportunities for cost decreases. However, we observe limited evidence of actual savings. In this retrospective sample, targets realized 1.9 percent savings; acquirers realize no significant savings. Examining treatment effect hetero- geneity to shed light on theories of “buyer power,” we find that savings, when they occur, tend to be local, and potential benefits of savings may be offset by managerial costs of merging. * The data used in this paper were generously provided, in part, by the ECRI Institute (www.ecri.org). We gratefully acknowledge financial support from the Leonard Davis Institute, Wharton Dean’s Research Fund and Public Policy Initiative, the Wolpow Family, and NSF Grant SES-1559485. We thank Zack Cooper, Martin Gaynor, Charlie Gray, Matthew Schmitt, and John Van Reenen for assistance in constructing the merger panel; and audiences at the Annual Health Economics Conference and Bates White Life Sciences Symposium for their insights. Harrison Byers, Caleb Diaz-Spatharos, and Gi Heung Kim provided excellent research assistance. Any errors are our own. 1

Welcome message from author
This document is posted to help you gain knowledge. Please leave a comment to let me know what you think about it! Share it to your friends and learn new things together.
Transcript

Mergers and Marginal Costs:New Evidence on Hospital Buyer Power
Stuart Craig∗
University of Pennsylvania, The Wharton [email protected]
Matthew GrennanUniversity of Pennsylvania, The Wharton School & NBER
Ashley SwansonColumbia University, Graduate School of Business & NBER
May 15, 2020
Abstract
We estimate the effects of hospital mergers, using detailed data containing medicalsupply transactions (representing 23 percent of operating costs) from a sample of UShospitals 2009-2015. Pre-merger price variation across hospitals (Gini coefficient 7 per-cent) suggests significant opportunities for cost decreases. However, we observe limitedevidence of actual savings. In this retrospective sample, targets realized 1.9 percentsavings; acquirers realize no significant savings. Examining treatment effect hetero-geneity to shed light on theories of “buyer power,” we find that savings, when theyoccur, tend to be local, and potential benefits of savings may be offset by managerialcosts of merging.
∗The data used in this paper were generously provided, in part, by the ECRI Institute (www.ecri.org). Wegratefully acknowledge financial support from the Leonard Davis Institute, Wharton Dean’s Research Fundand Public Policy Initiative, the Wolpow Family, and NSF Grant SES-1559485. We thank Zack Cooper,Martin Gaynor, Charlie Gray, Matthew Schmitt, and John Van Reenen for assistance in constructing themerger panel; and audiences at the Annual Health Economics Conference and Bates White Life SciencesSymposium for their insights. Harrison Byers, Caleb Diaz-Spatharos, and Gi Heung Kim provided excellentresearch assistance. Any errors are our own.
1
1 Introduction
In the last several decades, hospital systems have consolidated substantially through hori-
zontal mergers (Cutler and Scott Morton 2013; Gaynor and Town 2012).1 Researchers and
regulators have raised concerns about these mergers’ potential negative welfare effects due
to increased concentration, and hospital mergers are heavily represented in Federal Trade
Commission investigations (Coate 2018; Dafny 2014). A typical justification for these (and
many other) horizontal mergers is their potential to generate various “efficiencies,” leading
to lower prices, improved quality, enhanced service, and/or new product introductions, with
a particular emphasis on price (U.S. Department of Justice and the Federal Trade Commis-
sion 2010; Vogt and Town 2006). A necessary, though not sufficient, condition for mergers
to lower prices is that they first lower marginal costs. Whether any true marginal cost
reductions should then be counted as “cognizable efficiencies” by antitrust authorities is a
contentious issue.2
In this merger retrospective, we provide new estimates of the effects of hospital mergers
on marginal costs, using unique data containing hospital supply purchase orders issued by a
large sample of US hospitals from 2009-2015.3 These estimates are interesting not only as a
window into potential downstream price effects, but also in that they allow us to investigate
“buyer power.” For each of the products in our data, prices are determined in negotiation.4
It is conventional wisdom that “bigger is better” in bilateral negotiations, and this issue has
broad policy relevance, not just for antitrust (Carlton and Israel 2011) but also as a key
issue for evaluating the efficiency of decentralized procurement markets.5
1Much of this consolidation took place during the merger wave of the 1990s; more recently, the AffordableCare Act (ACA) spurred another merger wave, with 105 deals reported in 2012 alone, up from 50 to 60annually in the pre-recession years of 2005-2007 (Dafny 2014). The merger wave of the 1990s was coincidentwith the rise of managed care, though some researchers dispute that this relationship was causal (Town et al.2007). The merger wave during the ACA years has been associated with hospitals anticipating the needfor large, coordinated organizations to manage population health under payment reforms such as bundledpayment and Accountable Care Organizations (Dafny 2014).
2As discussed in Section 3, marginal cost reductions could be welfare-neutral – a transfer between up-stream and downstream firms – or themselves welfare-reducing (Hemphill and Rose 2018). See, e.g., therecent decision on the unsuccessful bid to merge Anthem and Cigna, two larger health insurers: “Since themedical cost savings will not be accomplished by streamlining the two firms’ operations, creating a betterproduct that neither carrier can offer alone, or even by enabling the providers to operate more efficiently,they do not represent any ‘efficiency’ that will be introduced into the marketplace.” (United States DistrictCourt for the District of Columbia 2017)
3Hospital supplies and devices accounted for a quarter of the growth in inpatient hospital spendingbetween 2001 and 2006 (Maeda et al. 2012).
4The contracting environment is described further in Grennan and Swanson (2019) and Appendix B.5For example, many policymakers advocate for more centralized procurement of healthcare products and
services by federal and state governments (LaVito 2018), rather than procurement via decentralized bilateralbargaining as is the norm in the U.S.
2

The hospital supply product markets in our full dataset account for 23 percent of hospital
operating costs (34 percent, excluding labor). Thus, savings on supply input costs represent
perhaps the largest potential merger-related savings that are unambiguously marginal.6 In
the current context, negotiation can take place directly between a hospital or health system
administrator and a representative of the product’s manufacturer, or hospitals may rely on
group purchasing organizations (GPOs) to negotiate their contracts for some products.7
In calculating the potential savings they could achieve as an integrated entity, merging
parties typically cite the wide variation in prices paid across hospitals and argue that the
merged entity will be able to obtain discounts based on taking the best price among the
merging parties, plus leveraging any “buyer power” the larger merged entity might possess.
This variation is indeed large, with a Gini coefficient of 0.073 (or a coefficient of variation of
0.219) for the average category, across hospitals for the same exact brand-month.8 Together,
the magnitude and variation in supply spending are also substantial relative to both hospital
profit margins and downstream costs of hospital care.9 However, whereas a hospital’s exercise
of market power as a supplier of health care services might entail renegotiation over a menu of
prices with a handful of commercial insurers, that same hospital’s exercise of market power
as a buyer of medical and surgical supplies might entail renegotiations with hundreds of
vendors and also might require substantial managerial effort obtaining buy-in from disparate
6When labor costs are cited as merger “efficiencies,” they are often either administrative in nature ordue to the shifting of services across facilities. The former are arguably less “marginal,” while the latter mayinvolve a quality tradeoff (Noether and May 2017).
7In theory, GPOs allow hospitals to pool their purchasing power without formally integrating. In practice,GPO prices are typically used as a starting point for direct hospital-manufacturer negotiations for physicianpreference items and capital equipment (Schneller 2009). We do not directly observe which products arepurchased via a GPO in our data, but we note that there is significant price dispersion in all productcategories in our data in spite of them. As discussed in Section 3, we consider GPOs to be an unobservedfeature of the setting that may mediate the effects of mergers for some products.
8The Gini coefficient (equivalent to one half of the mean absolute difference between any randomlyselected pair of hospitals) is a useful benchmark for potential savings, as it translates the pre-merger pricevariation in our data into the expected savings that might be achieved if the worse off party in a random pairof hospitals were able to improve their price by “splitting the difference.” To see a more extreme example,the merging parties in the Anthem-Cigna case argued that the integrated entity would obtain the best oftheir pre-merger prices United States District Court for the District of Columbia 2017. We note that theGini coefficient would only precisely align with theoretical expected savings in a very restrictive model ofpossible sources of contracting heterogeneity. However, it represents the type of expected savings calculationmerging hospitals might perform, as input prices are not typically shared during pre-merger due diligence.
9According to the American Hospital Association 2018 Trendbook, the average hospital operating mar-gin in 1995-2016 was 4.4 percent (https://www.aha.org/system/files/2018-05/2018-chartbook-table-4-1.pdf).Regarding the potential for meaningful pass-through, the coefficient of variation in the cost of a knee re-placement at hospitals in different markets is 0.32 (Cooper et al. 2019), for example, while the coefficient ofvariation across hospitals in our data for knee prostheses is 0.24.
3

end-users within the hospital.10 That is, it may be relatively costly to reduce costs.11
This paper builds on a large body of literature on the effects of hospital mergers, and
particularly on recent work that estimates the effects of mergers on overall hospital costs
(e.g., Dranove and Lindrooth 2003; Harrison 2010; Schmitt 2017) and on labor costs (Prager
and Schmitt 2019).12 We follow this literature in estimating difference-in-differences models
that compare cost trends at target and acquirer hospitals to control hospitals. The unique
contribution of this paper relative to this prior literature is the fine-grained nature of the
cost data, with precise prices and quantities paid across nearly all hospital supplies at the
sample hospitals.
We find that, for a fixed basket of 37 of the most important hospital supply categories, the
average merger target in our sample can expect to save 1.9 percent or $214 thousand dollars
per year (95 percent confidence interval [$79,568, $349,236]), while the average acquirer can
expect no savings (point estimate -$90 thousand “savings”; confidence interval [-$158,518,
-$21,968]). To put this in context with a simple example, for a merger with the same size
target and acquirer, this would suggest total savings across merging parties of 1.9−0.92
= 0.5
percent.13 Based upon our understanding of the information typically available to merging
parties regarding input costs, a simple approach via which merging parties might claim
expected savings would be based on a measure of price dispersion such as the Gini coefficient
(across hospitals, controlling for brand-time), which gives an estimate of what expected
savings would be if two randomly chosen hospitals in the data were to merge and obtain
the better of their contracts for every item they purchase. Our results would translate into
average realized savings that are about 7 percent of that claimed under this approach. If
merging parties claimed higher expected savings based on supposed greater “buyer power” of
the integrated entity, this ratio of realized savings to expected savings would be even lower.
In addition to being interesting in their own right, mergers also provide useful variation to
10This price variation has been found to be driven by heterogeneity in hospital preferences and bargain-ing ability (Grennan 2013, 2014), and by variation in information and contracting frictions (Grennan andSwanson 2018, 2019).
11Following this logic, if savings on “important” product categories in our analysis here are easier toobtain than savings on the more than 3,000 medical supply categories in our data, our results are likely anupper bound on total supply savings achieved post-merger.
12The general literature to date on the effects of hospital concentration has not suggested that consolida-tion improves efficiency. While an exhaustive review of the evidence is outside the scope of this paper, thedominant narrative appears to be one of mergers decreasing quality (Beckert et al. 2012; Capps 2005; Hoand Hamilton 2000; Romano and Balan 2011; Town et al. 2006), increasing prices (Capps and Dranove 2004;Dafny 2009; Dafny et al. 2017; Haas-Wilson and Garmon 2011; Krishnan 2001; Sacher and Vita 2001; Tenn2011; Thompson 2011), and weakly decreasing costs (Dranove and Lindrooth 2003; Harrison 2010; Schmitt2017).
13Most mergers involve acquirers that are larger than targets, so the average merger would tend to involveeven smaller savings. And of course these are average treatment effect estimates, so the outcomes for anyparticular merger could differ.
4

examine economic mechanisms underlying “buyer power” at a scale beyond individual case
studies, as they represent a shock to hospital system size that is plausibly uncorrelated with
trends in any particular supply category market.14 As discussed in Section 3, the literature on
buyer power points to multiple theoretical mechanisms via which increased buyer size might
impact input prices, and we examine several of these through triple-difference specifications
allowing for heterogeneity in the merger treatment effects.
Much like in markets for hospital services, prices in hospital input markets are typically
determined via bilateral negotiations. The literature over time has developed an increas-
ingly sophisticated approach to modeling downstream hospital price negotiations (Town and
Vistnes 2001; Capps et al. 2003; Ho 2006, 2009), and many of the same principles apply to
considering input price negotiations. In such an environment, the effects of mergers can be
complex, depending on how they impact market structure and bargaining abilities (Dafny
et al. 2017; Gowrisankaran et al. 2015; Grennan 2013; Lewis and Pflum 2015). Further, while
market power in upstream supply markets may decrease input prices directly, an important
countervailing indirect effect may occur: market power in downstream markets for hospital
services may lead to higher downstream prices, and that greater overall pie may be “shared”
with suppliers (Ho and Lee 2017). Finally, as managerial attention, skill, and incentives play
an important role in supply contracting, mergers may have disruptive effects in the short
run and may be mediated by geographic proximity, and returns to scale may be positive or
negative in the long run (Agrawal et al. 1992; Beckmann 1960; Fulop et al. 2002; Minemyer
2017; Uysal et al. 2008).
To shed light on mechanisms underlying pricing, we explore heterogeneity in our reduced
form merger treatment effects by: merging parties’ size and market overlap, supply market
concentration, and downstream market power. Our analyses consider whether cost reduc-
tions (if any) are achieved through lower negotiated prices, cost-reducing shifts in utilization,
or both. We also examine the role of “standardization.”15 Recent research has found that
restrictive networks of health care providers (Gruber and McKnight 2016; Ho and Lee 2018),
restrictive drug formularies (Duggan and Scott Morton 2010), and restrictive pharmacy net-
works (Starc and Swanson 2018) can lead to lower costs for insurers; similarly, hospitals
argue that standardization of medical supply purchasing results in large savings (Noether
and May 2017).
We find that target hospitals’ post-merger savings are driven by a 3.4 percent decrease
14The product markets we consider vary in several dimensions that are likely to affect bargaining andmediate the effects of mergers: these include supplier concentration, the strength of brand preferences basedon perceived heterogeneity in quality, and the relative importance of contracting intermediaries.
15Throughout this paper, we follow industry terminology and use the term “standardization” to refer tohospitals’ use of restrictive supply sets; e.g., use of one implant vendor for most joint replacement procedures.
5

in prices negotiated within physician preference item (PPI) brands.16 PPIs are expensive
implantable devices over which physicians typically have strong brand preferences, and are
frequent targets in policy discussions around excessive spending on medical technologies and
tensions between physicians and hospitals as coproducers of health care.17 This within-
brand effect is slightly smaller, though not statistically different, from the within-category
effect of 3.8 percent (which accounts for shifts in quantity utilized to different brands within
the category). Thus, targets’ PPI savings can be almost entirely accounted for by targets
negotiating lower prices, rather than cost-saving changes in usage patterns. These savings are
significantly larger for local mergers (5.9 percent). The point estimates are also larger when
the acquiring system is large (4.3 percent). Targets do not show economically or statistically
significant savings on relatively inexpensive non-PPI supplies. Finally, there is no effect of
merging on targets’ standardization rates.
By contrast, acquirers show little evidence of savings post-merger. We document a quite
small, though statistically significant, increase (1.7 percent within brand; 1.2 percent within
category) in acquirers’ PPI costs post-merger. These are only slightly counterbalanced by a
small, marginally significant 1.2 percent reduction in acquirers’ non-PPI prices. Interestingly,
the cost increase point estimate for PPIs is larger for large acquirers than for small acquirers.18 Finally, we find some evidence that acquirers are more standardized after merging, though
this finding is sensitive to specification.
In sum, the net effect of merging on any given party’s costs is small. Where significant
effects do exist, they depend on multiple countervailing forces, and these forces bear out
unevenly across targets and acquirers. Our findings are consistent with mergers inducing an
increase in buyer power that is (1) driven by local returns to scale, and (2) more influential
for merger targets than for (even small) acquirers. The finding of a positive price effect for
large acquirers is consistent with the costs of a merger disrupting management outweighing
any benefit from improved buyer power, for merging parties experiencing small relative size
increases. We find little evidence that savings, where they exist, are mediated by supplier
concentration or by a change in downstream market power. Notably, in contrast to previous
16The acronym PPI is commonly used in the healthcare industry (e.g., Lagasse 2018) and we accordinglyuse it here as well, but note that it refers everywhere in this manuscript to “physician preference item” andnot to any price index as is common in economics (e.g., “producer price index.”)
17Past efforts by hospitals to shift utilization of surgical materials and devices have encountered significantresistance from surgeons (Nugent et al. 1999). Navathe et al. (2017) estimate that one health system’sparticipation in a bundled payment program led to substantial savings on joint implant costs, perhaps aidedby that system’s gainsharing arrangements with physicians.
18As discussed in Section 3, there are several managerial and economic theories via which mergers mightincrease input prices. The finding in our baseline specifications of a positive price effect for large acquirers isconsistent with these theories. However, we interpret this result with some caution, as it (unlike the resultfor targets’ purchase of PPIs) disappears in analyses of longer time horizons.
6
empirical findings on restrictive contracting by insurers, we find no evidence that merger
savings are amplified when hospitals are standardized.
2 Data and Setting
2.1 Hospital Purchasing Data
The primary data used in this study come from a unique database of all supply purchases
made by over 1,000 US hospitals during the period 2009-2015. The data are from the
PriceGuideTM
benchmarking service (hereafter, “PriceGuide data”) offered by the ECRI
Institute, a non-profit health care research organization. For each transaction, we observe
price, quantity, transaction month, and supplier.19
Our analyses consider price negotiations between hospitals and suppliers for a large num-
ber of important product categories. Throughout this draft, we use the term “product cate-
gory” to refer to the “Universal Medical Device Nomenclature System (UMDNS)” grouping
code included in the transaction files. The UMDNS system generally classifies products by
intended purpose and mechanism of action (e.g., drug-eluting coronary stents have UMDNS
code 20383). We use the term “brand” to refer to the “product” level at which prices
are negotiated; e.g., Medtronic Resolute Integrity drug-eluting coronary stent. In practice,
we identify brands using an algorithmic approach that groups together stock-keeping-units
within manufacturers that vary in terms of factors such as size and color, but not price.20
Finally, we use “product class” to refer to the distinction between FDA risk classes I-II,
which tend to be commodities (e.g., dressings) and other medical/surgical products (e.g.,
catheters), vs. FDA risk class III, which are placed in this class because they are deemed
“necessary for the sustainment of life” and thus tend to include high-tech physician prefer-
ence items (e.g., coronary stents).
Our empirical analyses examine products that are among the top 50 product categories by
either total spending or transactions. There are 71 such “top” categories total, but once we
19The reported data are of high quality because they are typically transmitted as a direct extract from ahospital’s materials management database. Hospitals have strong incentives to report accurately because theanalytics the benchmarking service’s web portal provides are based on comparing the hospital’s submitteddata to that of others in the database. For the current exercise, one might be concerned that mergers mightintroduce measurement error in the attribution of transactions to specific facilities; e.g., a target facility’stransactions might be attributed to the acquiring system due to centralized reporting in the post-mergerperiod. To investigate this issue, we estimated whether merging hospitals in the overall AHA merger sample(described in Section 2.3 below) are more or less likely to report PriceGuide transactions post-merger, relativeto matched controls. We found no significant effects of M&A activity on subsequent PriceGuide reporting.
20The algorithm endeavors to balance our goal of identifying meaningful, pricing-relevant differences inproduct attributes (e.g., quality) against the potential for sparsity problems. As discussed in Appendix A.1,the patterns we document are insensitive to how we classify brands.
7

omit product categories that are too broad or with missing or inconsistent data, 37 remain.21
2.2 Hospital and Merger Data
To perform the analysis in the current study, we obtained permission to contract a trusted
third-party to match facilities in the PriceGuide data to outside data from the Centers for
Medicare and Medicaid Services (CMS), the American Hospital Association, and a merger
roster. The third-party then provided us with access to the merged data for analysis, with
hospital-identifiable information removed.
We obtained merger data from Cooper et al. (2019), which contain nearly all hospital
mergers from 2000-2014. The data were generated by correcting known problems in the
AHA: errors in timing of mergers due to lagged survey response and erroneous combination
of multiple facilities into single observations post-merger. These data were cross-checked
against data from Schmitt (2017) and several business intelligence databases: Irving Levin
Associates, Factset, and SDC Platinum. For more details on the merger data, see Appendix
D of Cooper et al. (2019).
2.3 Representativeness
Each analytic sample includes facilities in the PriceGuide data that merged uniquely by
name and location to general acute care hospitals in the AHA data. The top panel of Table
1 describes how the full sample of AHA-surveyed general acute care hospitals compares to
our sample of PriceGuide subscribers. The facilities in the purchase order data voluntarily
joined a subscription service that allows them to benchmark their own prices and quantities
to those of other members in the database and thus may not be a random sample of US
hospitals. In particular, subscription is costly, so we expect hospitals with greater concerns
about, or attention to, supply costs to be over-represented in the database.22 The PriceGuide
data contain a large number (855) of hospitals, covering 17 percent of the hospitals in the
21Some categories in the UMDNS grouping are excessively broad and would not necessarily be used in thesame procedures or by the same providers. Codes such as “food item,” “office supplies,” and various “kits”are flagged as too broad based on their descriptions. For example, “IVD Kits” include microbial detectionkits costing $2.14 on average, as well as tests for antibiotic-resistant bacteria colonization costing $4,400 onaverage. We also excluded codes for which we could not confidently calculate price per unit due to missingconversion factors (e.g., 10 units per box) or inconsistent unit of measure (e.g., “box” vs. “case”). Othercategories were omitted based on “reasonableness” of the observed price variation – categories for whichthe coefficient of variation in price exceeded 200 percent were excluded. See Appendix A and Grennan andSwanson (2019) for further details and examples.
22For example, in a survey of database members, “cost reduction on PPIs” and “cost reduction oncommodities” were the first and second (and nearly tied) most commonly cited reasons for joining. Thisis in accord with our own conversations with purchasing managers who cite a broad array of reasons andproduct areas as motivations for benchmarking.
8

AHA sample.23 These hospitals tend to be relatively large (in terms of employment, bed
count, and admissions), they use more technologies, and they are more often teaching and
nonprofit hospitals, relative to the overall AHA sample. The PriceGuide sample also weights
the Northeast and West Census regions of the US, as opposed to the Midwest and South
regions, relatively heavily.
The second and third panels of Table 1 summarize the M&A transactions in the AHA and
PriceGuide samples from 2009-2015.24 The full AHA merger panel contains 445 transactions
impacting 661 targets and 1,753 acquirers. The full PriceGuide merger panel covers a large
sample of these: 211 transactions impacting 121 targets and 301 acquirers. However, our
analytic samples are limited to the first transaction observed for each target and acquirer in
the PriceGuide data, and our main specifications include only those transactions for which we
observe at least one full year of pre- and post-merger data.25 Because PriceGuide members
join the database in a staggered fashion over time, such that our data include many more
hospitals in 2015 than in 2009, this requirement reduces our sample to 33 target hospitals and
86 acquirer hospitals taking part in 49 unique transactions, and 433 non-merging controls.26
It also bears noting that for most of our mergers, we have detailed purchasing data for either
the target or acquirer, not both; thus, we have little ability to explore price convergence for
the different parties involved in a given merger. While this restriction is costly, our sample
contains many merger case studies – whereas many analyses have considered single mergers
in isolation (Kwoka 2015) – and the rich transaction-level cost information across 37 different
product categories compensates in detail for these limitations.
Focusing on the third panel, a comparison of columns (2) and (3) to column (1) illustrates
that, along most dimensions, the PriceGuide merger samples are slightly more representative
of the AHA merger sample on observables, than the full PriceGuide sample is of the full AHA
sample. This is primarily because larger hospitals are more likely to be involved in M&A
transactions. However, it remains the case that our analyses are identified from a sample of
relatively large hospitals enrolled in a benchmarking service; if, for example, this implies that
23The full PriceGuide database include 2,876 facilities. 1,155 of these facilities satisfy the basic inclusioncriteria that they be coded as “Hospitals” or “Health Systems” internally in the database, and that weobserve the date of database join – as described in the empirical specifications below, we try multipledifferent approaches to ensure that “benchmarking database join” effects as documented in Grennan andSwanson (2019) are not conflated with merger effects. Of these, 891 hospitals match uniquely to a generalacute care hospital in the AHA data based on name and location. Finally, 855 AHA-matched hospitalspurchase at least one of our focal product categories.
24All analytic samples used in this study impose that merging facilities have at least one calendar year oftransaction data pre- and post-merger. Accordingly, all mergers in this study take place during 2010-2014.
25Post-merger here refers to years following the calendar year of the merger (i.e. y > τh).26We have about equal numbers of target and acquirer transactions: 23 transactions involving 33 target
hospitals, and 31 transactions involving 86 acquirer hospitals.
9
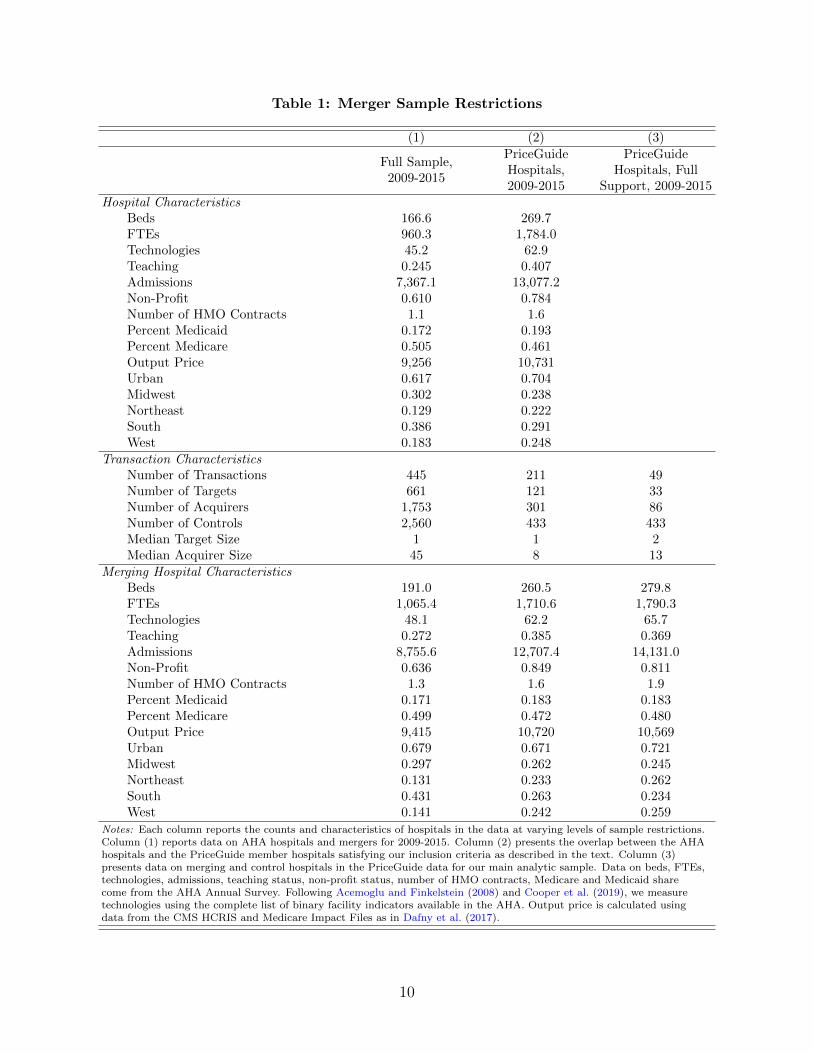
Table 1: Merger Sample Restrictions
(1) (2) (3)
Full Sample,2009-2015
PriceGuideHospitals,2009-2015
PriceGuideHospitals, Full
Support, 2009-2015Hospital Characteristics
Beds 166.6 269.7FTEs 960.3 1,784.0Technologies 45.2 62.9Teaching 0.245 0.407Admissions 7,367.1 13,077.2Non-Profit 0.610 0.784Number of HMO Contracts 1.1 1.6Percent Medicaid 0.172 0.193Percent Medicare 0.505 0.461Output Price 9,256 10,731Urban 0.617 0.704Midwest 0.302 0.238Northeast 0.129 0.222South 0.386 0.291West 0.183 0.248
Transaction CharacteristicsNumber of Transactions 445 211 49Number of Targets 661 121 33Number of Acquirers 1,753 301 86Number of Controls 2,560 433 433Median Target Size 1 1 2Median Acquirer Size 45 8 13
Merging Hospital CharacteristicsBeds 191.0 260.5 279.8FTEs 1,065.4 1,710.6 1,790.3Technologies 48.1 62.2 65.7Teaching 0.272 0.385 0.369Admissions 8,755.6 12,707.4 14,131.0Non-Profit 0.636 0.849 0.811Number of HMO Contracts 1.3 1.6 1.9Percent Medicaid 0.171 0.183 0.183Percent Medicare 0.499 0.472 0.480Output Price 9,415 10,720 10,569Urban 0.679 0.671 0.721Midwest 0.297 0.262 0.245Northeast 0.131 0.233 0.262South 0.431 0.263 0.234West 0.141 0.242 0.259
Notes: Each column reports the counts and characteristics of hospitals in the data at varying levels of sample restrictions.Column (1) reports data on AHA hospitals and mergers for 2009-2015. Column (2) presents the overlap between the AHAhospitals and the PriceGuide member hospitals satisfying our inclusion criteria as described in the text. Column (3)presents data on merging and control hospitals in the PriceGuide data for our main analytic sample. Data on beds, FTEs,technologies, admissions, teaching status, non-profit status, number of HMO contracts, Medicare and Medicaid sharecome from the AHA Annual Survey. Following Acemoglu and Finkelstein (2008) and Cooper et al. (2019), we measuretechnologies using the complete list of binary facility indicators available in the AHA. Output price is calculated usingdata from the CMS HCRIS and Medicare Impact Files as in Dafny et al. (2017).
10
sample hospitals are especially sophisticated, they may benefit more or less from merging
than the average treated hospital in the AHA data.27 The matching specifications described
in Section 4.1 are intended to ameliorate concerns regarding internal validity of our estimates
given sample selection, but cannot speak directly to questions of external validity.
Appendix E addresses external validity by reweighting our regression sample to approx-
imate the national distribution of merging hospitals on various observable characteristics.
These results are qualitatively similar, with point estimates that are slightly smaller in mag-
nitude. However, we offer all findings in this study with the caveat that we cannot rule out
bias driven by dimensions of sample selection not observable in publicly-available sources.
2.4 Price Variation, by Product Class
Each product category in our analytic sample is summarized in Table 2.
The top panel of Table 2 contains non-PPIs. Non-PPI products can be used in a hospital
setting by staff members with a variety of roles and scopes of practice. Some of these are
essentially commodities (e.g., surgical drapes): conditional on a few characteristics, such as
material, we do not expect particular manufacturers to be strongly preferred. Some are used
by physicians in moderately invasive procedures and brands may vary in perceived quality
(e.g., surgical staplers), but they tend to be less critically linked to patient outcomes than
Class III PPIs. The average non-PPI category is purchased by 483 sample hospitals. A non-
PPI product costs $714 per unit on average, and the average sample hospital spent $13,459
per month on the average non-PPI. These averages obscure substantial heterogeneity. For
example, nylon sutures cost $8 per unit, while bone grafts cost $2,562 per unit.
The bottom panel of Table 2 contains physician preference items. For PPIs, usage is
driven by brand preferences of physicians, often surgeons, choosing which brand to use to
treat a given patient. PPIs tend to be expensive cardiac and orthopedic surgical implants
used in advanced procedures and are not purchased by all hospitals: only 378 sample hospi-
tals purchased the average PPI, and only 254 purchased “Cardiac Valve Prostheses.” PPIs
are also used less frequently by hospitals that purchase them: the average PPI category sees
15 products used per month vs. 172 for non-PPIs. Nevertheless, purchasing hospitals spend
twice as much per month on the average PPI category ($30,900 vs. $13,459), due to PPIs’
27For one product category, coronary stents, we have been able to compare the PriceGuide sample to anexternal source that is explicitly intended to provide an accurate picture of market shares and prices by USregion: the Millennium Research Group’s (MRG) Markettrack
TM
survey of catheter labs. As discussed inGrennan and Swanson (2019), the prices paid in the MRG and PriceGuide samples during 2010-2013 arestatistically close to one another, with the average prices paid (controlling for brand-time trends) in theMRG sample being slightly higher (mean $1,666, s.d. $149) than those paid by hospitals in the PriceGuidesample (mean $1,631, s.d. $120) during the period before they joined the benchmarking service.
11
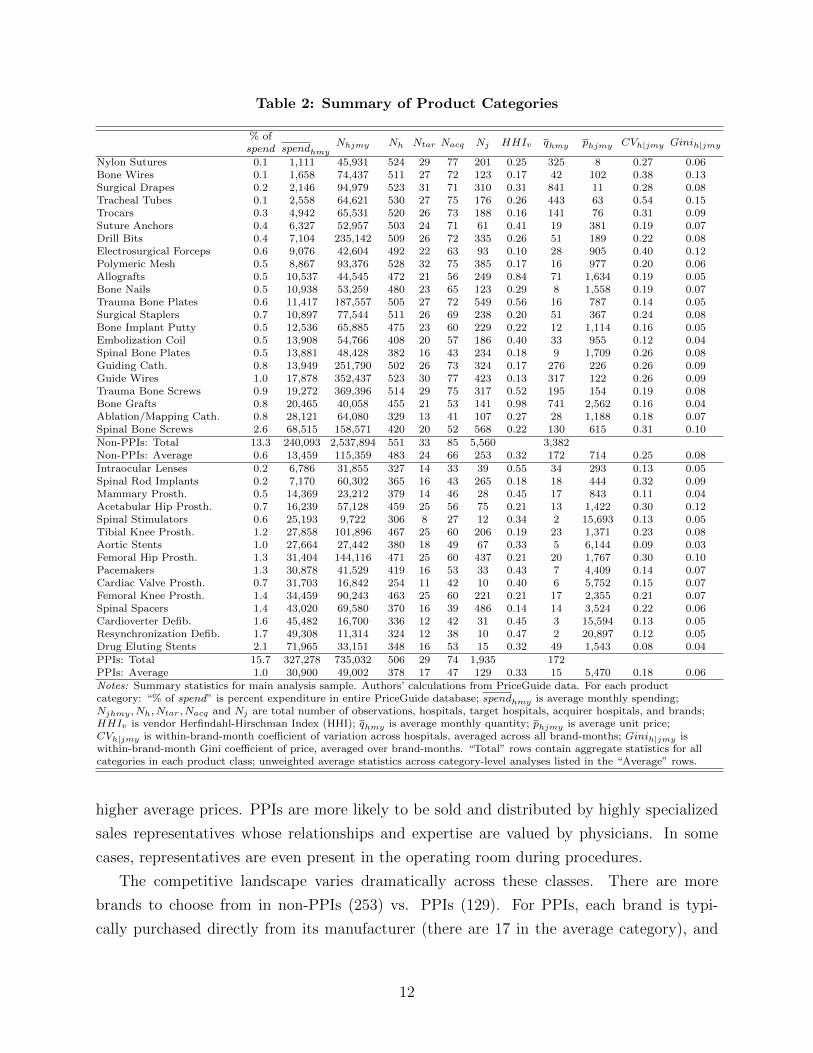
Table 2: Summary of Product Categories
% ofspend spendhmy
Nhjmy Nh Ntar Nacq Nj HHIv qhmy phjmy CVh|jmy Ginih|jmy
Nylon Sutures 0.1 1,111 45,931 524 29 77 201 0.25 325 8 0.27 0.06Bone Wires 0.1 1,658 74,437 511 27 72 123 0.17 42 102 0.38 0.13Surgical Drapes 0.2 2,146 94,979 523 31 71 310 0.31 841 11 0.28 0.08Tracheal Tubes 0.1 2,558 64,621 530 27 75 176 0.26 443 63 0.54 0.15Trocars 0.3 4,942 65,531 520 26 73 188 0.16 141 76 0.31 0.09Suture Anchors 0.4 6,327 52,957 503 24 71 61 0.41 19 381 0.19 0.07Drill Bits 0.4 7,104 235,142 509 26 72 335 0.26 51 189 0.22 0.08Electrosurgical Forceps 0.6 9,076 42,604 492 22 63 93 0.10 28 905 0.40 0.12Polymeric Mesh 0.5 8,867 93,376 528 32 75 385 0.17 16 977 0.20 0.06Allografts 0.5 10,537 44,545 472 21 56 249 0.84 71 1,634 0.19 0.05Bone Nails 0.5 10,938 53,259 480 23 65 123 0.29 8 1,558 0.19 0.07Trauma Bone Plates 0.6 11,417 187,557 505 27 72 549 0.56 16 787 0.14 0.05Surgical Staplers 0.7 10,897 77,544 511 26 69 238 0.20 51 367 0.24 0.08Bone Implant Putty 0.5 12,536 65,885 475 23 60 229 0.22 12 1,114 0.16 0.05Embolization Coil 0.5 13,908 54,766 408 20 57 186 0.40 33 955 0.12 0.04Spinal Bone Plates 0.5 13,881 48,428 382 16 43 234 0.18 9 1,709 0.26 0.08Guiding Cath. 0.8 13,949 251,790 502 26 73 324 0.17 276 226 0.26 0.09Guide Wires 1.0 17,878 352,437 523 30 77 423 0.13 317 122 0.26 0.09Trauma Bone Screws 0.9 19,272 369,396 514 29 75 317 0.52 195 154 0.19 0.08Bone Grafts 0.8 20,465 40,058 455 21 53 141 0.98 741 2,562 0.16 0.04Ablation/Mapping Cath. 0.8 28,121 64,080 329 13 41 107 0.27 28 1,188 0.18 0.07Spinal Bone Screws 2.6 68,515 158,571 420 20 52 568 0.22 130 615 0.31 0.10Non-PPIs: Total 13.3 240,093 2,537,894 551 33 85 5,560 3,382Non-PPIs: Average 0.6 13,459 115,359 483 24 66 253 0.32 172 714 0.25 0.08
Intraocular Lenses 0.2 6,786 31,855 327 14 33 39 0.55 34 293 0.13 0.05Spinal Rod Implants 0.2 7,170 60,302 365 16 43 265 0.18 18 444 0.32 0.09Mammary Prosth. 0.5 14,369 23,212 379 14 46 28 0.45 17 843 0.11 0.04Acetabular Hip Prosth. 0.7 16,239 57,128 459 25 56 75 0.21 13 1,422 0.30 0.12Spinal Stimulators 0.6 25,193 9,722 306 8 27 12 0.34 2 15,693 0.13 0.05Tibial Knee Prosth. 1.2 27,858 101,896 467 25 60 206 0.19 23 1,371 0.23 0.08Aortic Stents 1.0 27,664 27,442 380 18 49 67 0.33 5 6,144 0.09 0.03Femoral Hip Prosth. 1.3 31,404 144,116 471 25 60 437 0.21 20 1,767 0.30 0.10Pacemakers 1.3 30,878 41,529 419 16 53 33 0.43 7 4,409 0.14 0.07Cardiac Valve Prosth. 0.7 31,703 16,842 254 11 42 10 0.40 6 5,752 0.15 0.07Femoral Knee Prosth. 1.4 34,459 90,243 463 25 60 221 0.21 17 2,355 0.21 0.07Spinal Spacers 1.4 43,020 69,580 370 16 39 486 0.14 14 3,524 0.22 0.06Cardioverter Defib. 1.6 45,482 16,700 336 12 42 31 0.45 3 15,594 0.13 0.05Resynchronization Defib. 1.7 49,308 11,314 324 12 38 10 0.47 2 20,897 0.12 0.05Drug Eluting Stents 2.1 71,965 33,151 348 16 53 15 0.32 49 1,543 0.08 0.04PPIs: Total 15.7 327,278 735,032 506 29 74 1,935 172PPIs: Average 1.0 30,900 49,002 378 17 47 129 0.33 15 5,470 0.18 0.06
Notes: Summary statistics for main analysis sample. Authors’ calculations from PriceGuide data. For each productcategory: “% of spend” is percent expenditure in entire PriceGuide database; spendhmy is average monthly spending;Njhmy , Nh, Ntar, Nacq and Nj are total number of observations, hospitals, target hospitals, acquirer hospitals, and brands;HHIv is vendor Herfindahl-Hirschman Index (HHI); qhmy is average monthly quantity; phjmy is average unit price;CVh|jmy is within-brand-month coefficient of variation across hospitals, averaged across all brand-months; Ginih|jmy iswithin-brand-month Gini coefficient of price, averaged over brand-months. “Total” rows contain aggregate statistics for allcategories in each product class; unweighted average statistics across category-level analyses listed in the “Average” rows.
higher average prices. PPIs are more likely to be sold and distributed by highly specialized
sales representatives whose relationships and expertise are valued by physicians. In some
cases, representatives are even present in the operating room during procedures.
The competitive landscape varies dramatically across these classes. There are more
brands to choose from in non-PPIs (253) vs. PPIs (129). For PPIs, each brand is typi-
cally purchased directly from its manufacturer (there are 17 in the average category), and
12

hospitals/systems tend to negotiate their own prices. By contrast, the average non-PPI is
available from 39 vendors, brands produced by a particular manufacturer may be sold by
multiple vendors, and hospitals are more likely to rely on GPO pricing (Schneller 2009).
Despite these differences, both classes are highly concentrated according to the standards
typically applied by the US Department of Justice (DoJ) and Federal Trade Commission
(FTC), and there is a great deal of price dispersion: the average coefficient of variation, con-
trolling for brand-month fixed effects, is 0.25 in non-PPIs and 0.18 in PPIs. The analogous
Gini coefficient is 0.08 in non-PPIs and 0.06 in PPIs. This variation in prices across hos-
pitals could imply large potential savings to be captured by merging parties, if the merged
entity can achieve equivalent or better pricing than the best of the pre-merger contracts. To
the extent that a larger merged party will have more “buyer power”, savings could be even
larger. Whether this will indeed happen depends upon the economic mechanisms at work.
3 Mechanisms of Interest
The welfare effects of any merger “efficiencies” driven by input cost reductions will depend
on the underlying mechanisms (Carlton and Israel 2011). In evaluating proposed mergers,
the FTC and DoJ consider whether cost savings are likely to be large, whether they are
likely to pass through to consumers, and whether they are “likely to be accomplished with
the proposed merger and unlikely to be accomplished in the absence of either the proposed
merger or another means having comparable anticompetitive effects” (that is, whether they
are “merger-specific” (U.S. Department of Justice and the Federal Trade Commission 2010)).
Thus, the agencies’ consideration of cost savings focuses for the most part on potential welfare
gains in the downstream market.
Input cost savings could also be welfare-neutral – a transfer between upstream and down-
stream firms – or themselves welfare-reducing. Hemphill and Rose (2018) distinguish cases
where mergers increase monopsony power or bargaining leverage from cases where there are
real resource savings, such as reduced waste. They conclude that the former cases reduce
competition and should not be viewed by regulators as cognizable efficiencies.28
Hospital costs include substantial fixed and variable components. The variable portion
of hospital costs scales with the number and severity of patients treated, the quantity of
labor and “capital” inputs used per patient, and the prices of those inputs. The prices of
inputs are, in turn, determined by brand choice and the price negotiated within each brand.
Mergers may in theory impact any part of the hospital’s cost function. However, fixed costs
28One potential harm cited is dynamic inefficiency, in which upstream firms reduce investment and inno-vation due to increased downstream monopsony power.
13

are unlikely to pass through to patients in the short run, changes in patient mix raise a
battery of questions regarding agency and quality of care, and potential negative effects of
monopsony power on labor costs are not rated kindly by antitrust authorities.29 Thus, in
this study, we focus on variable costs that are truly marginal in the sense that they are
incurred along with the provision of additional patient care – those costs most likely to
impact downstream prices. Specifically, we examine whether mergers lead to economies of
scale in variable supply costs due to changes in negotiated prices and/or input choices.
Analyzing prices requires close attention to the details of hospital procurement. In hos-
pital input markets, prices are determined via bilateral negotiations between suppliers and
hospitals. In some cases, a GPO may negotiate on behalf of its hospital members. For prod-
ucts purchased through a GPO, a merger could impact purchasing if it moved the combined
entity to a more favorable GPO membership volume tier, or if it induced a change in GPO
(which could be favorable for some products and unfavorable for others). In many cases,
though, the GPO price acts as a starting point for individual hospital/system negotiations,
or there is no relevant GPO contract for a given product. This may explain the presence of
significant price dispersion in all product categories in our data in spite of the GPO market
being dominated by a few large players (Gooch 2017). Thus, much of hospital purchasing is
the result of direct bilateral bargaining between suppliers and a given hospital/system.
The effect of mergers on bilateral bargaining is ambiguous in the economics literature.
A merger could affect a supplier’s marginal cost or bargaining position (e.g., via economies
of scale in distribution). It could also affect the integrated buyer’s bargaining position (e.g.,
via introducing competition from another supplier if there are fixed or search costs involved
in contracting). In general, larger buyer firms may obtain better prices if the bargaining-
surplus function is concave, in which case the supplier’s surplus in bargaining with two
independent firms is smaller at the margin than the average surplus in bargaining jointly
with an integrated firm (Chipty and Snyder 1999; Horn and Wolinsky 1988; Inderst and Wey
2007; Stole and Zwiebel 1996). Further, larger buyer firms may spur competition among
multiple suppliers (Dana 2012; Gans and King 2002; Marvel and Yang 2008; Snyder 1996,
1998), implying an important role for supplier market structure. A merger may also affect
the buyer’s bargaining power/ability (the share of gains from trade obtained, conditional
on bargaining positions). In work on insurer-hospital bargaining, Lewis and Pflum (2015)
find that bargaining power is a greater determinant of post-merger markups than bargaining
position.
Post-merger changes in bargaining power may be driven by various factors, including
29See discussion in Gaynor and Town (2012), regarding the DoJ’s allegation of competitive harm in thepurchase of physician and nursing services.
14

firm organizational structure, information, incentives, management, and leadership. These
same factors may impact the efficiency of input utilization within firms. It is important to
note that these effects may be positive or negative. On the one hand, Bloom et al. (2014)
find that larger hospitals have better management practices. Conversely, mergers may have
disruptive impacts on management, organizational culture, or earnings (Agrawal et al. 1992;
Beckmann 1960; Fulop et al. 2002; Minemyer 2017).
Input choice and input pricing may also interact. Dana (2012) posits that buyer groups’
primary advantage results from their commitment to purchase from a single supplier in differ-
entiated product markets. We see evidence of this in the hospital-insurer bargaining world:
Sorensen (2003) shows that insurers’ steering ability impacts pricing more than insurers’
size; Gowrisankaran et al. (2015) model how insurers steer patients towards cheaper hospi-
tals; and Ho and Lee (2018) note that restrictive hospital networks could reduce insurers’
prices by up to 30 percent.
In this particular context, it is also important to note that hospital mergers entail changes
in market power both upstream (with respect to suppliers) and downstream (with respect
to insurers). This creates a linkage between upstream and downstream prices, as both
negotiations will depend on total surplus. For example, while a merger-induced increase in
market power in upstream supply markets may have a direct negative effect on input prices,
a contemporaneous increase in market power in downstream markets for hospital services
would simultaneously have a direct positive effect on service prices, and that greater overall
pie may be “shared” with suppliers. Ho and Lee (2017) document how similar countervailing
forces create variation in the effects of insurer competition, when such competition impacts
upstream negotiations with hospitals and downstream negotiations with employers.
Many of these mechanisms may depend on details such as the geographic location of the
merging hospitals or the extent of competition among suppliers. Prior research has found that
geographic proximity is a success factor for mergers, perhaps due to information advantages
(Uysal et al. 2008). If transmission of management that might affect bargaining power is
similarly impacted by geographic proximity, then mergers involving hospitals with market
overlap may be more successful at reducing costs. The geography of medical supply sales
and hospital competition may matter as well. For example, economies of scale in distribution
might be achieved, or joint post-merger negotiation of supply contracts might be easier, if
hospitals are in the same geographic sales territories for suppliers. A countervailing factor
would be that mergers of hospitals competing in the same local hospital markets may, as
noted above, involve downstream price increases for hospital services that could theoretically
be shared with hospitals’ suppliers.
Competition among suppliers could likewise interact with the mechanisms via which
15

mergers might affect input prices. In a competitive market where markups are low, mergers
are only likely to affect prices via cost mechanisms like potential economies of scale in
distribution. In a less competitive market, cost changes might be less likely to be passed
through, while other changes to bargaining position or bargaining power/ability would have
larger potential effects.
4 Empirical Specification and Identification
We estimate two difference-in-differences price specifications. First, using a dataset contain-
ing unit prices for each product category (UMDNS code) u, hospital h, brand j, month m,
year y, we estimate:
lnPuhjmy = αu ∗ 1[y = τh] + βu ∗ 1[y > τh] + θhj + θjmy +XhmyθX + εuhjmy (1)
where τh is the year of hospital h’s merger (if any), θhj is a hospital-brand fixed effect, and
θjmy denotes brand-month-year fixed effects (with j implicitly uj as brands do not span
categories by construction).30 XhmyθX can in principle control for any further time-varying
hospital characteristics, but in our baseline analyses it contains a single dummy variable to
indicate month-years after the hospital joins the benchmarking database, so that join effects
are not conflated with merger effects.31 The month of merger is unknown, so we estimate
separate treatment effects for the merger year (αu) and the post-merger period (βu).32,33
30Brand-specific time trends are necessary to control for the presence of brands both early and late intheir life cycles in these data. Measuring these trends at the monthly, rather than yearly, level becomesimportant for our event study specifications in Section 5.2.1 below; we do so here as well for the sake ofconsistency.
3167 percent of hospitals are post-join for at least one year prior to the merger event in which they areused. Appendix Table A14 includes estimates using only such hospitals. The results are slightly larger inabsolute magnitude, though broadly consistent with our main findings.
32In our baseline results, we report specifications focusing on one year pre-merger, the year in which themerger occurs, and one year post-merger. Appendix I also contains analyses for alternative time horizons.In each specification, we always limit our estimation sample to the set of hospitals with complete pre-and post-merger data over the specified timing support, and use only the specified range of years. Thisdecision enables us to interpret the resulting treatment effect as the effect of merging on the average treatedhospital over that time horizon. We consider this to be clean and transparent regarding how each of themany “experiments” in our data generate our estimates. The recent literature on difference-in-differencesestimation with staggered treatment notes that two-way fixed effects difference-in-differences estimates areweighted averages of all possible 2X2 difference-in-differences in the sample, where the weight on a given“experiment” depends on the timing of treatment (Borusyak and Jaravel 2017; Goodman-Bacon 2018).
33Prior work has shown that these hospital supply contracts are typically renegotiated roughly annually(Grennan and Swanson 2019), and we find that the same is true across our focal product categories. Theeffects of hospital mergers on hospital procedure prices have been shown to manifest immediately post-merger (Cooper et al. (2019)); thus, we consider it fair to look for treatment effects on hospital input pricesimmediately post-merger. Focusing on βu allows us to estimate merger treatment effects that are unlikely to
16

We estimate separate regressions for acquirers and targets; the acquirers regression excludes
targets, and vice versa. Finally, within each hospital-UMDNS code, we weight each brand
using quantity share within hospital. This approach allows us to interpret the resulting
coefficient of interest βu as the treatment effect of merging on the average unit price of
product u while also including brand-level controls on the right-hand side.34 For estimation
of specification (1), we hold quantity share weights across brands fixed at those observed
for the hospital’s first year in the analytic sample. Intuitively, this regression examines the
weighted average within-brand effect of mergers on negotiated prices, for brands purchased
both before and after the merger.
Next, using the same dataset, we estimate:
lnPuhjmy = αu ∗ 1[y = τh] + βu ∗ 1[y > τh] + θuh + θjmy +XhmyθX + εuhjmy (2)
where θuh denotes a set of hospital fixed effects (that vary by category in regressions where
we pool categories). To avoid overweighting products purchased in small quantities in this
specification, we weight each hospital-brand-year using the brand’s quantity share within the
hospital-year. Intuitively, this regression examines the effect of mergers on negotiated prices
per unit across all brands within-category. That is, specification (1) uses fixed pre-merger
quantity share weights, while specification (2) uses contemporaneous quantity share weights;
thus, the estimates from (1) measure the extent to which renegotiation leads to lower prices
for the same brand at the same hospital, and (2) will further include the extent to which
the hospital switches usage to different brands. We find this specification of interest because
switching to cheaper brands could be one mechanism via which savings could be achieved.
However, we interpret these results cautiously, as changes in usage patterns could affect
welfare via mechanisms other than price changes, if there are average or patient-specific
match quality differences across brands within a category.35 In all regressions where the
dependent variable is price, standard errors are clustered by hospital-brand.
In addition to the product category-specific regressions, we also estimate pooled regres-
sions across all categories within each class (PPI vs. non-PPI). We stack all category-specific
data within each class and estimate specifications (1) and (2) with a single α and β for the
be biased downward by delayed price adjustments due to structured renegotiations. In unreported analyses,we estimate the effect of mergers on renegotiation timing and find no statistically significant effects atconventional levels.
34Note that we would obtain similar estimates if we just estimated a regression where the unit of observa-tion was the hospital-use case-month-year (for example, a separate observation for each coronary stent usedby a hospital in a given year) and ran (unweighted) OLS.
35We have made efforts to restrict our analysis to reasonably well-defined product categories in an effortto minimize extreme versions of this issue. For example, In-Vitro Diagnostic Kits include $5 kits for simpletests and $5,000 kits for rare and complex tests.
17
class, weighting by the total expenditure share for each category across all years of the data.36
4.1 Identification
Our empirical approach compares input price trends at merging hospitals to those at non-
merging hospitals, around the time of the merger. In Table 3 below, we compare merging
and non-merging hospitals in our final analytic sample. Columns in each panel of Table 3
compare the full set of controls (1) to merging target (3) and acquirer (5) hospitals.
Relative to all non-merging controls, target hospitals tend to be smaller (lower employ-
ment, fewer beds); they are also less likely to be teaching hospitals and more likely to
have non-profit ownership. Although they are smaller than controls, they tend to use more
technologies, and have higher monthly purchase quantities for the product categories they
purchase.37 Relative to the average control hospital, target relationships with payers are
nuanced: they have above-average contracting with managed care organizations (proxied by
count of contracts with health maintenance organizations (HMOs)); they rely relatively less
on Medicaid and more on Medicare for admissions; and their average case-mix-adjusted price
per inpatient admission is significantly lower.
Acquirers show a different pattern. Relative to controls, they: are larger; are more
often teaching hospitals and more often non-profit; use more technologies; have more HMO
contracts; and have a similar price per admission.
Given these differences in composition, we might be concerned that merging and non-
merging hospitals exhibit very different purchasing patterns even prior to the merger, and
more importantly, that they might have different latent trends in input purchasing (which
would invalidate the core assumption behind the differences-in-differences research design).
To address this issue, first we note that the input price indices for merging and non-merging
hospitals are not very different. In Table 3, we see that, relative to non-merging control
hospitals, targets have about 2-3 percent lower prices pre-merger, while acquirers have about
3-5 percent lower prices pre-merger.38
We also address observed differences directly in our preferred specifications. We match
both target and acquirer hospitals to a subset of non-merging hospitals in order to ensure that
36This approach allows us to frame our findings in terms of total potential savings associated with hori-zontal mergers. Implicitly, however, this approach downweights product categories with low spending sharesand hospitals that tend to purchase less expensive product categories.
37Following Acemoglu and Finkelstein (2008) and Cooper et al. (2019) we measure technologies using thecomplete list of 153 binary facility indicators available in the AHA. These vary widely, encompassing burncare, chemotherapy, Meals on Wheels, psychiatric child/adolescent services, and proton beam therapy.
38Input price indices are hospital fixed effects recovered from a stacked regression of log price on brand-month-year fixed effects and hospital fixed effects. Intuitively, they represent hospital-level residual pricevariation holding the basket of product categories and brands fixed.
18

Table 3: Comparison of Merging and Non-Merging Hospitals
(1) (2) (3) (4) (5)
ControlsTarget Controls
(Matched)Targets
AcquirerControls
(Matched)Acquirers
Panel A: Non-PPI Purchasers
FTEs 2,540 2,533 2,246 2,893 2,713Technologies 74.26 77.69 76.13 79.28 79.53Beds 355.08 333.62 306.37 406.51 404.91Number of Unique Products 49.09 32.24 34.95 37.77 42.01Average Monthly Quantity 244.80 326.99 356.36 229.31 220.11Admissions 17,431 16,936 15,384 20,458 19,995Teaching 0.55 0.49 0.39 0.63 0.60Non-Profit 0.75 0.94 0.91 0.81 0.77Number of HMO Contracts 1.68 1.95 2.05 1.89 1.85Percent Medicaid 0.20 0.16 0.15 0.19 0.20Percent Medicare 0.44 0.49 0.51 0.45 0.45Output Price 12,440 12,397 9,518 12,624 12,593Input Price Index (θh) 4.95 4.96 4.93 4.95 4.92
Number of Hospitals 433 286 33 369 85
Panel B: PPI Purchasers
FTEs 2,674 2,484 2,366 2,945 2,897Technologies 75.74 78.78 79.62 78.86 81.46Beds 372.06 346.59 324.79 417.31 427.50Number of Unique Products 23.68 15.08 16.50 15.12 18.73Average Monthly Quantity 24.34 27.48 31.90 27.14 30.35Admissions 18,336 17,258 16,314 20,865 20,964Teaching 0.58 0.50 0.43 0.63 0.64Non-Profit 0.75 0.95 0.93 0.80 0.75Number of HMO Contracts 1.71 2.01 2.03 1.91 1.77Percent Medicaid 0.20 0.16 0.15 0.19 0.20Percent Medicare 0.44 0.48 0.50 0.45 0.44Output Price 12,693 12,250 9,538 12,816 12,711Input Price Index (θh) 7.22 7.21 7.19 7.21 7.17
Number of Hospitals 403 242 29 330 74
Notes: Each column reports the counts and characteristics of merging and non-merging hospitals in the data. Column (1)shows characteristics of all non-merging hospitals. Column (2) shows the subset of these controls that serve as thematched sample of controls for target hospitals. Column (3) shows characteristics of target hospitals. Column (4) showsthe characteristics of matched controls for acquirer hospitals. Column (5) shows the characteristics of acquirer hospitals.Panel A shows the samples used for estimation for non-PPI products and Panel B shows the samples used for estimationfor PPIs. Matching is at the hospital-UMDNS level, so N of matched samples is the superset of controls used in eachclass-merger type, and variable means are weighted the same as each hospital’s weight in the pooled regressions. Data onbeds, full time equivalent employees (FTEs), technologies, admissions, teaching status, non-profit status, number of HMOcontracts, and Medicare and Medicaid share come from the AHA Annual Survey. Following Acemoglu and Finkelstein(2008) and Cooper et al. (2019) we measure technologies using the complete list of binary facility indicators available inthe AHA. Output price is calculated using data from the CMS HCRIS and Medicare Impact Files as in Dafny et al. (2017).
“treated” merging hospitals are similar to the “control” non-merging hospitals, at least along
observable dimensions. Within each product category, we match each merging hospital to
its 10 nearest non-merging neighbors using Mahalanobis distance.39 Distances are calculated
39Appendix D discusses the performance of alternative matching algorithms, and includes pooled regres-sion results for a subset of matching approaches.
19
based on the hospital’s following characteristics as in Dranove and Lindrooth (2003): inputs
and outputs (log admissions, log full-time equivalent (FTE) employment, log technologies,
number of unique products purchased, and average monthly purchase quantity); number of
beds; payer mix (Medicare and Medicaid share of discharges, number of HMO contracts);
teaching hospital status; and non-profit ownership. The weighted average characteristics of
the matched samples are included in columns (2) and (4) of Table 3. The matched samples
for both the target and acquirer samples are closer on most observable dimensions within
both PPIs and non-PPIs.
In implementing the preferred specification, we generate a dataset containing a copy of
each transaction for each of the 10 neighbors along with the full set of data from each treated
hospital. Each of the 10 neighbors is therefore weighted equally in specifications (1) and (2),
though some control hospitals are used as a comparison for multiple treated hospitals. For
the stacked class-level regressions, matching is performed within each product category.
As discussed in detail in Dafny (2009), we note that this reduced form identification
approach cannot address endogenous selection of hospitals into the merger “treatment” on
unobserved dimensions. In order to provide greater confidence that our results are not
driven by differential trends across merging and control hospitals, we augment our results
with detailed monthly event studies with different pre- and post-merger time horizons. The
results are reassuring as to our main conclusions; and to the extent that endogeneity bias
remains, it must be due to time-varying factors that are precisely contemporaneous with the
mergers in our sample.
Lastly, we only observe mergers which were proposed and consummated. Implicitly,
this subset of all potential mergers that might take place was deemed to have lower anti-
competitive effects by antitrust enforcement agencies. In the event that cost savings were
used as a justification for these mergers, the cost savings we estimate are likely an upper
bound on what one might expect from the average proposed horizontal merger in this setting.
5 Estimates of Merger Treatment Effects
We discuss results in three subsections, beginning with the effect of mergers on prices for each
product category. We then consider the pooled effects obtained by stacking the categories
into a single regression for each product class. Finally, we use triple-differences versions of
the pooled regressions to evaluate treatment effect heterogeneity corresponding with various
potential buyer power mechanisms.
20
5.1 Product Category-Specific Price Effects
In Figure 1, product categories are grouped by class (non-PPIs vs. PPIs), then ordered
from top to bottom in order of increasing total expenditure in the database. We show the
estimated coefficients βu and corresponding 95 percent confidence intervals for specifications
(1 – hj fixed effects; solid markers) and (2 – h fixed effects; hollow markers).
The first pattern of interest is that, for both targets (left) and acquirers (right), the
within-hospital-category estimates (hollow markers) closely mimic the within-hospital-brand
estimates (solid markers), and the point estimates of the two are rarely statistically signifi-
cantly different.40 This suggests that there is not a prevalence of large changes in composition
of products purchased to higher or lower dollar products post-merger. Given this, and given
our concerns that any such switching might have ambiguous welfare effects, we focus most
of our discussion on within-hospital-brand differences moving forward.
Next, we focus on the left panel: merger effects on target hospitals. Among non-PPIs
(circle markers), there is no discernible pattern of savings post-merger. Point estimates are a
near equal mix of positive and negative, with most small in magnitude and not statistically
different from zero. Exceptions include significant price decreases within-hospital-brand of
3 and 15 percent, respectively, for trauma bone plates and polymeric mesh.
In contrast, among PPIs (triangle markers), the majority of within-hospital-brand price
effect point estimates are negative. Also, several of these effects are significant at the category
level, including decreases on the order of 5-9 percent for cardioverter defibrillators, femoral
knee prostheses, mammary prostheses, and pacemakers.
We observe a dramatically different pattern for acquirers in the right panel of Figure 1.
Price effects are generally more precise, as expected given the larger sample of acquirers. The
point estimates are also clustered much closer to zero for both non-PPI products and PPI
products. Among non-PPI products, we observe several negative and significant results on
the order of 2-4 percent for bone implant putty, drill bits, spinal bone plates, trauma bone
plates, and trauma bone screws. Second, in contrast to the target results, the coefficient
estimates for some PPIs are positive, ranging from 2-5 percent for acetabular hip prostheses,
cardioverter defibrillators, drug eluting stents, and spinal stimulators.
Finally, it bears noting that the variation in treatment effects documented in Figure 1 is
not driven by the latent relationship between savings potential and savings achieved, either
across or within product class. As shown in Appendix Figure A3, the relationship between
treatment effects and ex ante potential savings as measured by the Gini coefficient is quite
flat. One exception is a negative relationship for targets’ purchase of non-PPIs, which is
40Section 5.3.1 below provides more detailed evidence on switching patterns and overall quantity effects.
21

Figure 1: Merger Treatment Effects
Notes: Regression coefficients from specifications (1) and (2), post-merger year τh + 1 only. Authors’ calculationsfrom PriceGuide data. Bars indicate 95% confidence interval with standard errors clustered at hospital-brandlevel. Left panel: Targets. Right panel: Acquirers. Circular/green markers: non-PPIs. Triangular/orange markers:PPIs. Solid markers: specification (1), within-brand price effects. Hollow markers: specification (2),within-category price effects.
22
entirely driven by the (large but insignificant) effect for tracheal tubes in Figure 1.
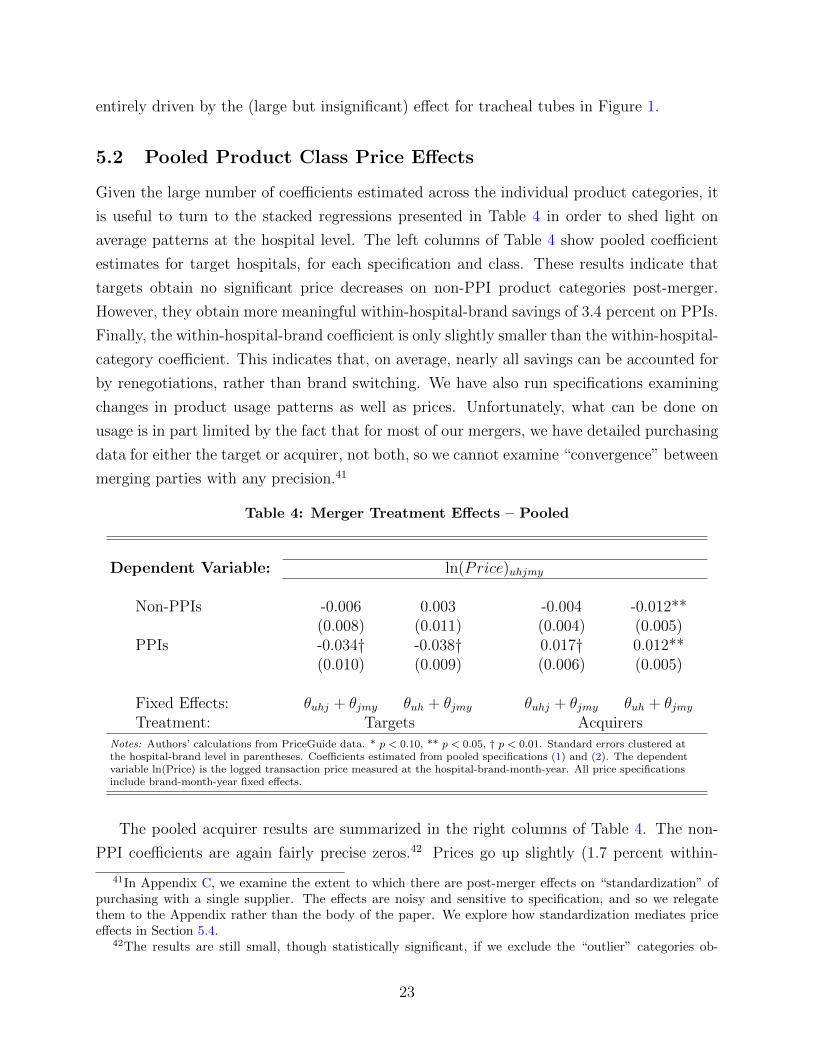
5.2 Pooled Product Class Price Effects
Given the large number of coefficients estimated across the individual product categories, it
is useful to turn to the stacked regressions presented in Table 4 in order to shed light on
average patterns at the hospital level. The left columns of Table 4 show pooled coefficient
estimates for target hospitals, for each specification and class. These results indicate that
targets obtain no significant price decreases on non-PPI product categories post-merger.
However, they obtain more meaningful within-hospital-brand savings of 3.4 percent on PPIs.
Finally, the within-hospital-brand coefficient is only slightly smaller than the within-hospital-
category coefficient. This indicates that, on average, nearly all savings can be accounted for
by renegotiations, rather than brand switching. We have also run specifications examining
changes in product usage patterns as well as prices. Unfortunately, what can be done on
usage is in part limited by the fact that for most of our mergers, we have detailed purchasing
data for either the target or acquirer, not both, so we cannot examine “convergence” between
merging parties with any precision.41
Table 4: Merger Treatment Effects – Pooled
Dependent Variable: ln(Price)uhjmy
Non-PPIs -0.006 0.003 -0.004 -0.012**(0.008) (0.011) (0.004) (0.005)
PPIs -0.034† -0.038† 0.017† 0.012**(0.010) (0.009) (0.006) (0.005)
Fixed Effects: θuhj + θjmy θuh + θjmy θuhj + θjmy θuh + θjmyTreatment: Targets Acquirers
Notes: Authors’ calculations from PriceGuide data. * p < 0.10, ** p < 0.05, † p < 0.01. Standard errors clustered atthe hospital-brand level in parentheses. Coefficients estimated from pooled specifications (1) and (2). The dependentvariable ln(Price) is the logged transaction price measured at the hospital-brand-month-year. All price specificationsinclude brand-month-year fixed effects.
The pooled acquirer results are summarized in the right columns of Table 4. The non-
PPI coefficients are again fairly precise zeros.42 Prices go up slightly (1.7 percent within-
41In Appendix C, we examine the extent to which there are post-merger effects on “standardization” ofpurchasing with a single supplier. The effects are noisy and sensitive to specification, and so we relegatethem to the Appendix rather than the body of the paper. We explore how standardization mediates priceeffects in Section 5.4.
42The results are still small, though statistically significant, if we exclude the “outlier” categories ob-
23
hospital-brand, 1.2 percent within-hospital-category) post-merger for acquirers’ purchase of
PPIs. This result is interesting because, although there are several managerial and economic
theories via which mergers might increase input prices (relative to non-merging control hos-
pital trends), we might expect most of these mechanisms to perhaps be less prevalent among
acquirers, who are typically the larger (sometimes significantly larger) or more dominant
entity involved in the merger. We return to how we interpret this result as we examine
event study evidence, robustness to matching and inference decisions, and treatment effect
heterogeneity.
5.2.1 Event studies of merger treatment timing
We next examine whether the results above are (1) driven by preexisting differential trends
in prices among merging facilities; or (2) biased due to merger effects that develop slowly
over time (e.g., due to fixed contracts that take time to renegotiate as in Grennan and
Swanson (2019)). In Figure 2 below, the left panels show pooled raw average price trends,
controlling only for brand-category fixed effects to account for the fact that hospitals may
use very different amounts of various products. The right panels show the pooled event
studies for the within-brand version of the above difference-in-differences specification, fully
controlling for hospital-brand effects and brand-specific time trends. We focus on PPI prices
for targets (top panels) and acquirers (bottom panels); the analogous results for non-PPIs are
in Appendix Figure A4. In each panel, we show one full calendar year pre- and post-merger;
the year of merger is highlighted in gray.43
As expected in markets with evolving technology and new product entry, PPI prices
are decreasing for both targets and acquirers. In panel (a), it appears that targets have a
steeper negative trend pre-merger than their matched controls. However, this may be driven
by any number of features that differ between targets and controls, such as different patterns
in when expensive brands are purchased throughout the year. Indeed, in panel (b), which
controls for such compositional differences, there is little evidence of remaining pre-trends
in our preferred specification, and there is strong evidence that targets’ PPI prices decrease
more steeply in the merger and post-merger year. For acquirers, we observe in panels (c)
served in Figure 1: tracheal tubes, polymeric mesh, and embolization coils. The within-hospital-brand effectincreases in magnitude to -0.9 percent, the within-hospital-category effect to -1.5 percent, and each aresignificant at the 5 percent level.
43The first and second panels of Appendix Table A15 compare our baseline difference-in-differences results,in which the treatment effect of merging is identified by comparing the post-merger year τh + 1 to the pre-merger year τh−1, to an alternative set of estimates comparing τh and τh +1 to τh−1. Intuitively, the latterimposes α = β in specification (1). The point estimates are slightly smaller in magnitude in the specificationwith α = β, indicating that most, but not all, of the treatment effect of interest is realized in the mergeryear.
24

Figure 2: Merger Treatment Effects – Event Studies, PPIs
Panel A: Targets(a) Average Prices (b) Estimated Treatment Effect
Panel B: Acquirers(c) Average Prices (d) Estimated Treatment Effect
Notes: Authors’ calculations from PriceGuide data. The left panels present the raw average price for treatedhospitals and matched controls, adjusted for the composition of products using a product-category-brandfixed-effect. The right panels present regression coefficients from pooled event study version of specifications (1),each month within one year of merger year τh. Hold-out date is December of last pre-merger year; all coefficientsrepresented relative to pre-merger year mean. Bars indicate the 95% confidence interval with standard errorsclustered by hospital-brand.
and (d) that acquirers’ and control hospitals’ prices are on a parallel downward trend in the
pre-merger year, consistent with our identifying assumption. Interestingly, it appears that
the positive price effects for acquirers purchasing PPIs are driven by a slightly flatter trend
among acquirers in the merger year than we observe for non-merging controls. Finally, in
both panels (b) and (d), although the point estimates suggest that savings begin accruing
early in the merger year, the standard errors are such that we cannot rule out zero price
effects for the first five to eight months of the merger year. This could be due to price effects
being realized slowly over time, or to mergers being consummated during the later part of
the grayed-out “merger year.” Unfortunately, we do not observe the exact timing of the
25
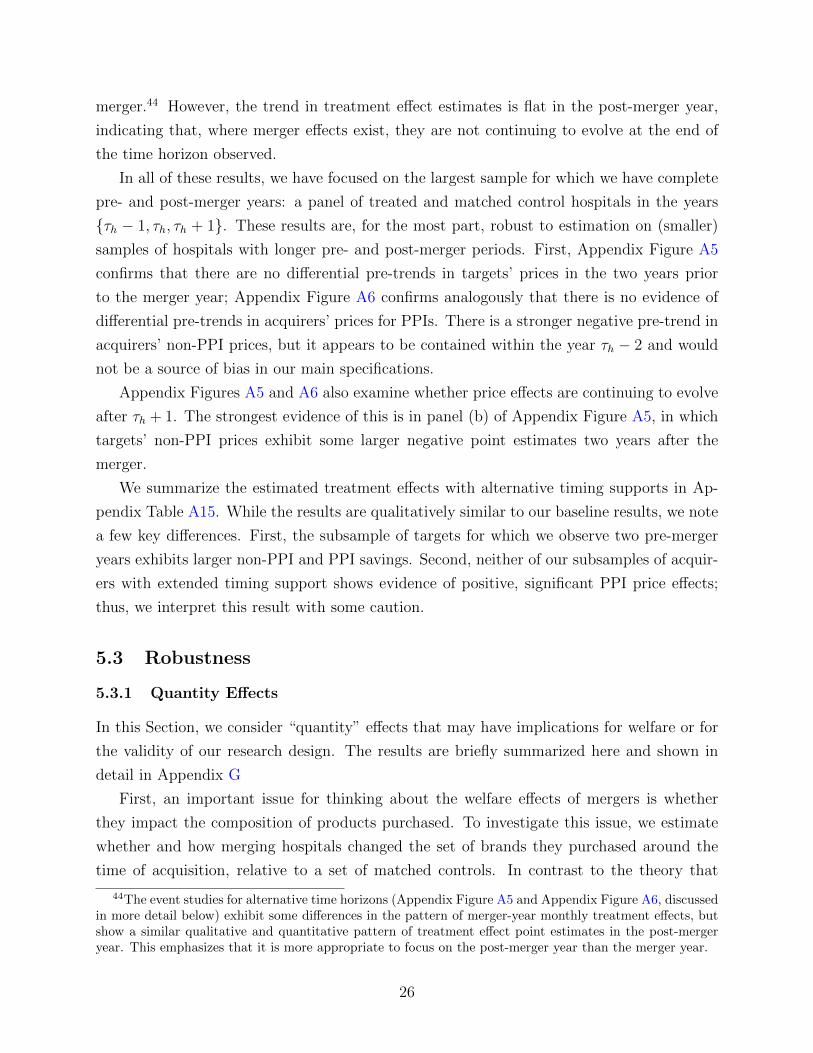
merger.44 However, the trend in treatment effect estimates is flat in the post-merger year,
indicating that, where merger effects exist, they are not continuing to evolve at the end of
the time horizon observed.
In all of these results, we have focused on the largest sample for which we have complete
pre- and post-merger years: a panel of treated and matched control hospitals in the years
{τh − 1, τh, τh + 1}. These results are, for the most part, robust to estimation on (smaller)
samples of hospitals with longer pre- and post-merger periods. First, Appendix Figure A5
confirms that there are no differential pre-trends in targets’ prices in the two years prior
to the merger year; Appendix Figure A6 confirms analogously that there is no evidence of
differential pre-trends in acquirers’ prices for PPIs. There is a stronger negative pre-trend in
acquirers’ non-PPI prices, but it appears to be contained within the year τh − 2 and would
not be a source of bias in our main specifications.
Appendix Figures A5 and A6 also examine whether price effects are continuing to evolve
after τh + 1. The strongest evidence of this is in panel (b) of Appendix Figure A5, in which
targets’ non-PPI prices exhibit some larger negative point estimates two years after the
merger.
We summarize the estimated treatment effects with alternative timing supports in Ap-
pendix Table A15. While the results are qualitatively similar to our baseline results, we note
a few key differences. First, the subsample of targets for which we observe two pre-merger
years exhibits larger non-PPI and PPI savings. Second, neither of our subsamples of acquir-
ers with extended timing support shows evidence of positive, significant PPI price effects;
thus, we interpret this result with some caution.
5.3 Robustness
5.3.1 Quantity Effects
In this Section, we consider “quantity” effects that may have implications for welfare or for
the validity of our research design. The results are briefly summarized here and shown in
detail in Appendix G
First, an important issue for thinking about the welfare effects of mergers is whether
they impact the composition of products purchased. To investigate this issue, we estimate
whether and how merging hospitals changed the set of brands they purchased around the
time of acquisition, relative to a set of matched controls. In contrast to the theory that
44The event studies for alternative time horizons (Appendix Figure A5 and Appendix Figure A6, discussedin more detail below) exhibit some differences in the pattern of merger-year monthly treatment effects, butshow a similar qualitative and quantitative pattern of treatment effect point estimates in the post-mergeryear. This emphasizes that it is more appropriate to focus on the post-merger year than the merger year.
26

merging would lead to greater switching (due to standardization or to some other alteration
of procurement practices), we find that brand switching is significantly less likely for merging
hospitals than for matched controls, with similar results for targets and acquirers. This would
be consistent with mergers disrupting the regular procurement activities of merging firms,
but other mechanisms may also be at work here. Taken together with our finding in Figure 1
and Table 4 that the treatment effects of merging on prices within hospital-category are very
similar to the treatment effects within hospital-brand, these results suggest that, although
we do observe a different pattern of brand switching post-merger among treated hospitals
(relative to controls), this pattern does not significantly change the composition of brands
purchased in favor of higher or lower dollar products post-merger. Thus, switching patterns
have little implication for savings via switching to cheaper brands, but they may be related
to documented price effects through the threat of switching or propensity to renegotiate. We
also caution that merging hospitals’ relative lack of switching could have positive or negative
effects on the quality of products purchased.
Second, we examined the effect of mergers on purchase volume, motivated by the logic
that targets may have enjoyed price reductions due to increases in their quantity purchased
rather than changes in negotiated prices.45 In the Appendix, we report the results of
differences-in-differences specifications with ln(Quhy) as the dependent variable. The sum-
mary results mostly suggest that there is no consistent effect of mergers on volume of supplies
purchased. Importantly, comparing Figure A2 to Figure 1, we do not find evidence that sav-
ings are correlated with quantity effects.
Lastly, we investigate whether there is nonrandom attrition in our sample. For example,
if merging hospitals are more likely to disappear from our sample after a merger takes
place, then the price treatment effects we estimate may be systematically biased upward or
downward. We find that there is some differential attrition of targets. However, as discussed
in Appendix G, this is greatly driven by targets merging at the end of our sample, and
dropping those targets has no effect on our documented pattern of price effects.46
5.3.2 Sensitivity of Price Treatment Effects
We have examined the sensitivity of our results to several decisions regarding modeling,
regression sample, and inference. In Appendix Table A5, we present estimates from spec-
ifications (1) and (2) using different matching approaches. Panel A presents the baseline
estimates for reference. Panel B presents the non-matched results, using all non-merging
45We thank an anonymous referee for this comment.46We speculate that this differential attrition may be driven by a longer delay in data submission for
targets post-merger.
27
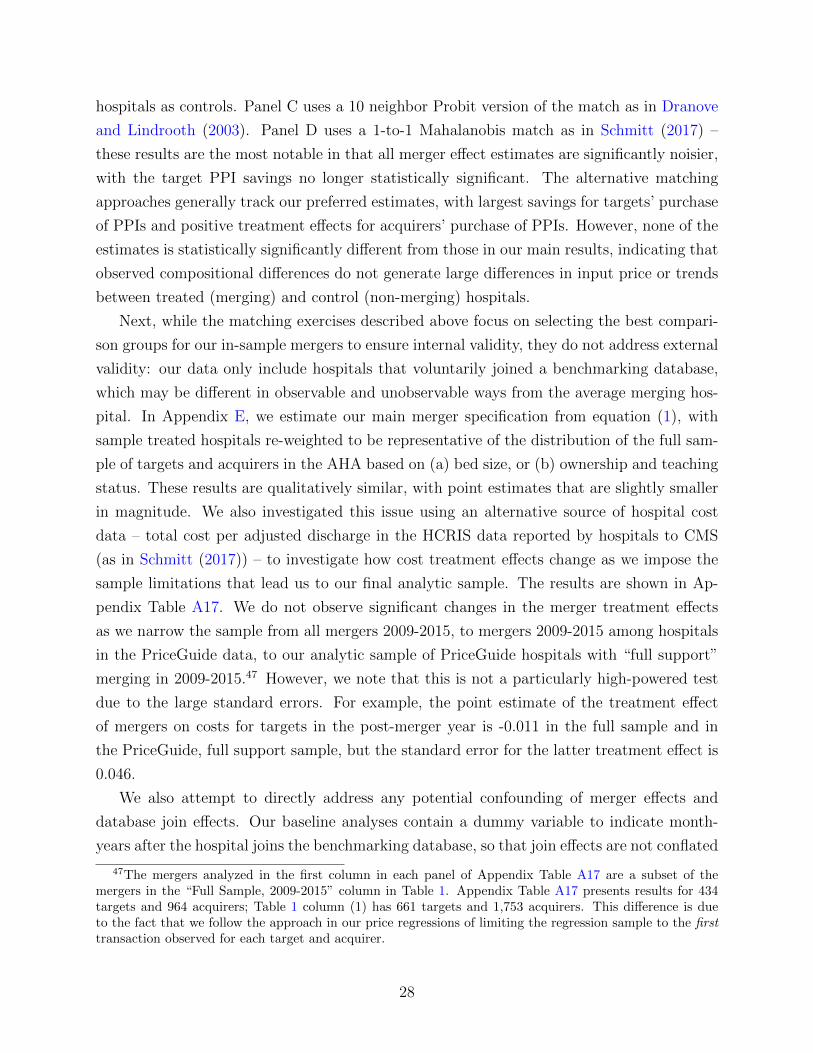
hospitals as controls. Panel C uses a 10 neighbor Probit version of the match as in Dranove
and Lindrooth (2003). Panel D uses a 1-to-1 Mahalanobis match as in Schmitt (2017) –
these results are the most notable in that all merger effect estimates are significantly noisier,
with the target PPI savings no longer statistically significant. The alternative matching
approaches generally track our preferred estimates, with largest savings for targets’ purchase
of PPIs and positive treatment effects for acquirers’ purchase of PPIs. However, none of the
estimates is statistically significantly different from those in our main results, indicating that
observed compositional differences do not generate large differences in input price or trends
between treated (merging) and control (non-merging) hospitals.
Next, while the matching exercises described above focus on selecting the best compari-
son groups for our in-sample mergers to ensure internal validity, they do not address external
validity: our data only include hospitals that voluntarily joined a benchmarking database,
which may be different in observable and unobservable ways from the average merging hos-
pital. In Appendix E, we estimate our main merger specification from equation (1), with
sample treated hospitals re-weighted to be representative of the distribution of the full sam-
ple of targets and acquirers in the AHA based on (a) bed size, or (b) ownership and teaching
status. These results are qualitatively similar, with point estimates that are slightly smaller
in magnitude. We also investigated this issue using an alternative source of hospital cost
data – total cost per adjusted discharge in the HCRIS data reported by hospitals to CMS
(as in Schmitt (2017)) – to investigate how cost treatment effects change as we impose the
sample limitations that lead us to our final analytic sample. The results are shown in Ap-
pendix Table A17. We do not observe significant changes in the merger treatment effects
as we narrow the sample from all mergers 2009-2015, to mergers 2009-2015 among hospitals
in the PriceGuide data, to our analytic sample of PriceGuide hospitals with “full support”
merging in 2009-2015.47 However, we note that this is not a particularly high-powered test
due to the large standard errors. For example, the point estimate of the treatment effect
of mergers on costs for targets in the post-merger year is -0.011 in the full sample and in
the PriceGuide, full support sample, but the standard error for the latter treatment effect is
0.046.
We also attempt to directly address any potential confounding of merger effects and
database join effects. Our baseline analyses contain a dummy variable to indicate month-
years after the hospital joins the benchmarking database, so that join effects are not conflated
47The mergers analyzed in the first column in each panel of Appendix Table A17 are a subset of themergers in the “Full Sample, 2009-2015” column in Table 1. Appendix Table A17 presents results for 434targets and 964 acquirers; Table 1 column (1) has 661 targets and 1,753 acquirers. This difference is dueto the fact that we follow the approach in our price regressions of limiting the regression sample to the firsttransaction observed for each target and acquirer.
28

with merger effects. Appendix Table A14 shows a slightly cleaner specification, estimated
only on hospitals whose three focal periods {τh − 1, τh, τh + 1} are entirely post-join.48 The
results are slightly larger in absolute magnitude, but confirm our main findings.
Next, we address potential bias introduced by hospitals’ involvement in multiple mergers.
Our main specification identifies the first merger for each of our treated hospitals over the
sample period 2009-2015. At baseline, we impose that treated hospitals have no merger in
τh − 1, and that matched control hospitals have no merger in {τh − 1, τh, τh + 1}. In Panel
C of Appendix Table A14, we implement a stricter version of this restriction, ensuring that
no mergers occur between τh − 2 and τh + 1 except for the focal merger in τh, applying this
rule to both treated and matched control hospitals. The results are qualitatively similar to
our main estimates in Table 4.
Lastly, Appendix Table A16 explores various alternative approaches to standard errors:
a wild bootstrap method as well as alternative clustering at the hospital-vendor and system-
UMDNS levels. Our main findings are stable across approaches to standard errors.
5.4 Price Treatment Effect Heterogeneity and Mechanisms
In this Section, we examine heterogeneity in treatment effects along several dimensions in
order to explore mechanisms. This is intended not to be an exhaustive exploration, but
rather to shed light on those mechanisms highlighted in Section 3 for which we have relevant
data.49 For the sake of brevity, we continue to focus discussion on within-hospital-brand
price effects, as our previous results indicated that these were where the strongest evidence
of merger-driven savings were concentrated. Within-hospital-category results are available
in Appendix Table A18.
5.4.1 Size effects
As noted previously, much of the literature regarding mergers and cost savings focuses on
advantages associated with firm size. Within our sample, we observe substantial variation in
the (absolute and relative) buyer firm size change induced by the merger: with one exception,
all of our transactions involve 1-2 target hospitals, but our acquirer systems range from very
small (1 or 2 hospitals) to large (over 70 hospitals). The effect of target and acquirer size
on purchasing is ex ante ambiguous. Theories such as that of Chipty and Snyder (1999) and
others would predict that – if the surplus function is concave – we should see larger effects
48We also remove matched controls when their associated treated hospital is removed from the data basedon this restriction.
49There are numerous interesting questions for which we do not have relevant data. E.g., regarding thesupplier’s cost function, regarding convergence of target and acquirer prices for a given merging pair, etc.
29

when a merger entails a larger change in the size of a hospital system. This would predict
the largest effects on targets’ prices when acquirers are large. On the other hand, price
decreases may be driven by improved management practices, and there may be economies or
diseconomies of scale in sharing management between merging hospitals (Beckmann 1960).
The top two rows in each panel of Table 5 show separate results for mergers involving
small (1-3 hospitals) vs. large (4+ hospitals) acquirers.50 For both targets and acquirers,
point estimates of merger price effects for non-PPIs are small and negative (2.1 percent for
targets and 0.6 percent for acquirers) when the merger involves small acquirers. The positive
treatment effect previously documented for acquirers’ PPI prices appears to be driven by
large acquirers. The savings on PPIs for targets is slightly larger for large acquirer mergers
(average acquirer system size of 41.8 hospitals) than for small acquirer mergers (average size
1.8 hospitals). These point estimates are consistent with mergers involving countervailing
effects of improved buyer power and managerial disruption. The net effect is small and
negative for merging parties with the largest relative system size change (small targets of
large acquirers), but small and positive for merging parties with the smallest relative system
size change (large acquirers of small targets). However, these differences are not statistically
significant.
5.4.2 Geographic proximity
Next, as noted in Schmitt (2017), many of the mergers in the recent “great reconsolidation”
involve hospital systems acquiring hospitals in distant geographic markets. We next split the
treatment effects according to whether any of the merging hospitals share a hospital referral
region (HRR).51 Heterogeneity in merger effects by market overlap may be due to local
economies of scale in management or distribution of inputs, to local diffusion of management
practices, to the countervailing effects of changes in upstream and downstream market power,
or to the relative roles of bargaining power vs. bargaining position in mediating merger-
related cost savings.
We compare treatment effects for in- vs. out-of-market mergers in the second pair of rows
in each panel of Table 5. The strongest merger savings previously documented – for targets’
purchase of PPIs – are concentrated in in-market mergers, where we see a price decrease post-
merger of 6 percent, relative to the control trend. Targets also achieve larger reductions on
non-PPIs when there is market overlap (2.5 percent savings, versus price increases of 1.1 per-
cent for out of HRR mergers). Acquirers show price increases for both in- and out-of-market
50Our average sample target is acquired by a 26-hospital system; our average sample acquirer is part ofan 11-hospital system prior to the focal merger.
51See Appendix F for alternative market definitions.
30
Table 5: Merger Treatment Effects – Heterogeneity, Within Brand
Targets AcquirersNtar β SE Nacq β SE
Panel A: Non-PPIsAcquirer Size
Small 13 -0.021* (0.012) 26 -0.006 (0.006)Large 20 0.007 (0.012) 59 -0.000 (0.006)Difference 0.028 (0.019) 0.006 (0.009)
Market ExposureIn HRR 14 -0.025** (0.011) 36 -0.007 (0.005)Out of HRR 19 0.011 (0.012) 49 0.003 (0.007)Difference -0.036** (0.018) -0.010 (0.008)
Vendor Market StructureHigh HHI 33 -0.004 (0.012) 85 -0.004 (0.006)Low HHI 33 -0.008 (0.010) 85 -0.004 (0.006)Difference 0.003 (0.016) 0.001 (0.008)
Controlling for Output PricePost-Merger 33 0.000 (0.008) 85 -0.005 (0.004)ln(Output Price) 0.023 (0.018) 0.003 (0.005)
Standardization InteractionPost-Merger 30 -0.013 (0.009) 80 0.000 (0.005)Post X Std. 0.015 (0.016) -0.009 (0.008)
Panel B: PPIsAcquirer Size
Small 12 -0.023 (0.015) 26 0.009 (0.006)Large 17 -0.043** (0.018) 48 0.026** (0.010)Difference -0.021 (0.026) 0.016 (0.012)
Market ExposureIn HRR 12 -0.059† (0.018) 35 0.014** (0.007)Out of HRR 17 -0.012 (0.011) 39 0.023** (0.009)Difference -0.047** (0.021) -0.008 (0.010)
Vendor Market StructureHigh HHI 29 -0.052† (0.012) 74 0.011** (0.004)Low HHI 29 -0.027* (0.014) 74 0.021** (0.009)Difference -0.025 (0.019) -0.009 (0.010)
Controlling for Output PricePost-Merger 29 -0.037† (0.011) 74 0.018† (0.006)ln(Output Price) 0.034* (0.018) 0.020† (0.008)
Standardization InteractionPost-Merger 28 -0.054** (0.024) 65 0.007 (0.009)Post X Std. 0.031 (0.027) 0.016 (0.012)
Notes: Authors’ calculations from PriceGuide data. * p < 0.10, ** p < 0.05, † p < 0.01. Standard errors clustered at thehospital-brand level in parentheses. Coefficients estimated from pooled specification (1). The dependent variable is the loggedtransaction price measured at the hospital-brand-month-year. Small acquirers are hospital systems consisting of 1-3 hospitalspre-merger, and large acquirers are hospital systems with more than 3 hospitals. A target is categorized as “In HRR” if thereis at least one hospital in the acquiring system in the same HRR, and vice versa. A product category is classified as “High”concentration if its vendor HHI is above the median within its product class. ln(Output Price) is estimated using the HCRISas in Dafny et al. (2017). Standardization is an indicator for whether the hospital purchased at least 75% of all units in aproduct category from a single vendor in its first sample year.
mergers; point estimates are smaller, but not significantly so, for in-market mergers. These
results stand in contrast to the large out-of-market merger effects documented in Schmitt
31

(2017), in which merger effects were strongest for targets in out-of-market acquisitions, per-
haps due to the differing nature of the marginal costs of inputs in our purchasing data from
hospital costs more broadly construed. Instead, they echo Dranove and Lindrooth (2003), in
which cost savings are greatest when previously independent hospitals integrate under a sin-
gle license and consolidate facilities. They are also consistent with theories of concavity and
economies of scale, given the qualitative fact that some non-PPIs and almost all PPIs tend
to be sold by highly specialized, regional sales representatives who spend large amounts of
time with a few local accounts. Finally, our results are consistent with Farrell and Shapiro
(2001)’s argument that the agencies should give consideration to “efficiencies based upon
the close integration of specific, hard-to-trade assets owned by the merging parties,” while
noting that “the same conditions that tend to make synergies more merger-specific and more
beneficial to consumers also tend to make the merger itself more problematic.” I.e., we find
evidence of greater savings associated with local mergers; unfortunately, Cooper et al. (2019)
and others also find evidence of greater anticompetitive effects of local hospital mergers in
the downstream markets for hospital services.
5.4.3 Supplier market structure
We also examine whether merger effects are mediated by supply-side market structure. To
this end, we separate UMDNS codes within each product class into those above or below the
median HHI for the class. As noted in Table 2, the product categories analyzed in this paper
are almost all moderate-high concentration according to typical FTC and DoJ standards.
That said, the mean “High HHI” non-PPI has an HHI of 0.419, vs. 0.179 among the “Low
HHI” non-PPIs; the same measures among PPIs are 0.497 and 0.227, respectively. The
third pair of rows in each panel of Table 5 show that there is no economically or statistically
significant difference in price effects as a function of supplier competition.52
5.4.4 Downstream hospital-insurer market power
The fourth pair of rows in each panel of Table 5 examines whether the cost effects documented
above are muted due to mergers causing hospitals’ supply side and demand side market power
to increase concurrently. For example, if merger-enabled market power allowed hospitals to
exercise monopoly power and increase procedure prices, some of that pie could be shared
with suppliers, mitigating cost decreases due to increased monopsony power.53 To that end,
52Appendix Figure A7 presents this in richer detail, in the form of a scatterplot of the treatment effectestimates from Figure 1 vs. vendor HHI for each UMDNS code. Each scatterplot is essentially a cloud, withno clear relationship between merger price effect and vendor HHI.
53Most bargaining models predict that prices will be a function of the overall pie; see, e.g., the discussionof insurer-hospital bargaining in Ho and Lee (2017).
32

we estimate our same input price regression specifications, controlling for output prices.54
We employ the method described in Dafny et al. (2017) to infer hospital prices from HCRIS
reports. The results indicate that, while hospitals’ downstream price changes tend to be
positively correlated with upstream price changes, this does not change the estimated merger
treatment effect.
5.4.5 Standardization and renegotiation
The final set of rows in each panel of Table 5 examines the interaction between merger
effects and standardization. We estimate a simple modification of the above specifications,
in which the year-of and post-merger dummies are interacted with a dummy for pre-merger
standardization at the hospital-category-level. That is, this specification indicates whether
merger-induced savings are larger for hospitals that were standardized pre-merger.
The results confirm our previous result that targets receive savings on PPIs after merg-
ing.55 However, the merger price effect is not significantly amplified for hospital-categories
that are standardized, for any combination of product class and type of merging entity. For
targets, standardization appears to diminish post-merger savings, if anything.
6 Conclusion
The US hospital industry has experienced a large amount of contentious consolidation via
mergers over the last several decades. Marginal cost savings have been perhaps the most
common justification offered for these mergers, often appealing to the large input price
variation across hospitals and notions that “buyer power” is increasing in hospital system
size. Prior research examining aggregated accounting measures of hospital costs has found
mixed results.
In this study, we use data on all purchase orders issued by a large set of US hospitals
2009-15 in order to conduct a detailed examination of the effects of mergers on the prices paid
for medical/surgical supplies, an important component of hospital marginal costs. The most
robust finding is target savings of 3.4 percent on targets’ purchase of physician preference
items. Across our 37 product categories, targets save an estimated $214,402 per year (1.9
percent) due to within-brand price decreases after horizontal mergers, whereas acquirers
54The goal of this regression is simply to test for the “mitigation” effect described above. In a model likeHo and Lee (2017), input and output prices will be codetermined and thus we would need to use extremecare in interpreting any parameter estimates in this regression.
55This correlation is significant for acquirers’ non-PPI prices, and marginally significant for targets’ PPIprices.
33

experience an (insignificant) average net price increase of $90,243.56 Perhaps the simplest
way to summarize these findings is that, given the precision of our estimates, we can rule
out average input price savings of greater than 3.1 percent at the 95 percent level for both
targets and acquirers. This seems modest relative to the cross-sectional price variation across
hospitals and claims of potential savings via increased“buyer power.”
The variety of product categories in the data allows us to look more closely at merger
effects and examine mechanisms underlying “buyer power” (which has previously been stud-
ied in theory and in case studies of specific product markets). We examine heterogeneity
in merger treatment effects across different product categories, and by acquirer size, market
overlap, and vendor market concentration. We find that the observed target savings on PPIs
is driven by local mergers. These savings may be consistent with local returns to scale in
sales and distribution or transfer of managerial practices. Merger treatment effects on tar-
gets are also larger when acquirers are larger, consistent with savings driven by concavity in
the surplus function as in Chipty and Snyder (1999), though the size comparison is not sta-
tistically significant. These findings are echoed in the results for acquirers’ purchase of PPIs,
in which price increases are smallest for small acquirers (where the relative size increase is
larger) and for local mergers. While there are multiple factors that may drive cost increases
after a merger – e.g., managerial attention – the countervailing force of increased buyer
power is most powerful for local mergers involving larger relative size changes. Our remain-
ing explorations suggest that our average treatment effects are not obscuring a great deal
of heterogeneity: merger effects on marginal costs are small regardless of standardization,
supplier concentration, or downstream prices.
Antitrust agencies consider a merger’s “efficiencies” to be cognizable if they are likely
to occur if the merger proceeds, and unlikely to occur if it does not. The agencies also
ask whether efficiencies are large and/or likely to pass through to consumers (Farrell and
Shapiro 2001). We have limited ability in our data to speak to the merger-specificity of the
savings we document, or to potential pass-through. However, whether cognizable or not,
our estimates of post-merger savings are small, indicating little effect of mergers on buyer
power. Moreover, estimated savings are largest for local mergers where hospitals’ market
power vis a vis insurers is also likely to increase (Cooper et al. 2019). Finally, the largest
estimated savings, by targets on PPIs, can entirely be attributed to renegotiation, rather than
brand switching, in that savings estimates within hospital-brand are statistically equivalent
to estimates within hospital-category. This transfer of surplus from device manufacturers to
56Calculation details in Appendix H. For comparison, a recent AHA-sponsored study documented adecrease in operating expenses of 2.5 percent for acquired hospitals (Noether and May 2017); our estimateis lower, though our 95 percent confidence interval would include 2.5 percent.
34
hospitals is suggestive of increased monopsony power and may not increase efficiency. For
example, it may negatively impact dynamic incentives of suppliers to innovate or maintain
product quality or manufacturing reliability (see discussion in Hemphill and Rose (2018)).
While each proposed merger should certainly be judged on its own merits, given its specific
context, each of these features of our findings urges caution regarding the use of expected
hospital purchasing efficiencies as justification for horizontal hospital mergers.
We offer these and all results with the caveat that our sample size of mergers is smaller
than we would like due to the relative newness of detailed purchasing order data availability.
Another drawback of our data is that we do not observe which products are purchased
through group purchasing organizations, which are an important feature of the setting that
may mediate the effects of mergers for some products. However, our data cover a larger
sample than that of many merger retrospective case studies from which economists have
learned a great deal (e.g. Miller and Weinberg (2017)). We also believe the detail and
breadth of the purchasing data brings new light to the study of hospitals and buyer power
broadly, and mergers specifically.
For hospital mergers in particular, another important phenomenon to consider is the
simultaneity of input market negotiation and output market negotiation. We control for
this using a proxy for hospital output prices. However, a more detailed study would require
matching hospital purchasing data with private insurer claims, and modeling demand and
negotiated prices explicitly in both upstream and downstream markets. We see this as an
important area for future research.
References
Acemoglu, D. and Finkelstein, A. (2008). Input and technology choices in regulated indus-
tries: Evidence from the health care sector. Journal of Political Economy, 116(5):837–880.
Agrawal, A., Jaffe, J. F., and Mandelker, G. N. (1992). The post-merger performance of
acquiring firms: A re-examination of an anomaly. Journal of Finance, XLVII(4):1605–
1621.
Beckert, W., Christensen, M., and Collyer, K. (2012). Choice of NHS-Funded hospital
services in England. The Economic Journal, 122(560).
Beckmann, M. J. (1960). Some aspects of returns to scale in business administration. Quar-
terly Journal of Economics, 74(3):464–471.
35

Bloom, N., Sadun, R., and VanReenen, J. (2014). Does management matter in healthcare?
Stanford Mimeo.
Borusyak, K. and Jaravel, X. (2017). Revisiting event study designs. Harvard University
Working Paper.
Capps, C. (2005). The quality effects of hospital mergers. In Economic analysis group
discussion paper, volume 5-6. U.S. Dept. of Justice, Antitrust Division.
Capps, C. and Dranove, D. (2004). Hospital consolidation and negotiated PPO prices. Health
Affairs, 23(2):87–109.
Capps, C., Dranove, D., and Satterthwaite, M. (2003). Competition and market power in
option demand markets. RAND Journal of Economics, 34(4):737–763.
Carlton, D. W. and Israel, M. (2011). Proper treatment of buyer power in merger review.
Review of Industrial Organization, 39(1/2):127–136.
Chipty, T. and Snyder, C. M. (1999). The role of firm size in bilateral bargaining: A study
of the cable television industry. The Review of Economics and Statistics, 81(2):326–340.
Coate, M. B. (2018). The merger review process at the federal trade commis-
sion from 1989 to 2016. Available at SSRN: https://ssrn.com/abstract=2955987 or
http://dx.doi.org/10.2139/ssrn.2955987.
Cooper, Z., Craig, S., Gaynor, M., and Van Reenen, J. (2019). The price ain’t right? Hospital
prices and health spending on the privately insured. Quarterly Journal of Economics,
134:51–107.
Cutler, D. M. and Scott Morton, F. (2013). Hospitals, market share, and consolidation.
JAMA, 310(18):1964–70.
Dafny, L. (2009). Estimation and identification of merger effects: An application to hospital
mergers. The Journal of Law and Economics, 52:523–550.
Dafny, L. (2014). Hospital industry consolidation - still more to come? New England Journal
of Medicine, 370:198–199.
Dafny, L., Ho, K., and Lee, R. S. (2017). The price effects of cross-market mergers: Theory
and evidence from the hospital industry. Mimeo.
Dana, J. (2012). Buyer groups as strategic commitments. Games and Economic Behavior,
74(2):470–485.
36

Dranove, D. and Lindrooth, R. (2003). Hospital consolidation and costs: Another look at
the evidence. Journal of Health Economics.
Duggan, M. and Scott Morton, F. (2010). The impact of Medicare Part D on pharmaceutical
prices and utilization. American Economic Review, 100(1):590–607.
Farrell, J. and Shapiro, C. (2001). Scale economies and synergies in horizontal merger
analysis. Antitrust Law Journal, 68:685–710.
Fulop, N., Protopsaltis, G., Hutchings, A., King, A., Allen, P., Normand, C., and Walters,
R. (2002). Process and impact of mergers of NHS trusts: multicentre case study and
management cost analysis. BMJ, 325.
Gans, J. S. and King, S. P. (2002). Exclusionary contracts and competition for large buyers.
International Journal of Industrial Organization, 20(9):1363–1381.
Gaynor, M. and Town, R. J. (2012). Competition in health care markets. In McGuire,
T. G., Pauly, M. V., and Barros, P., editors, Handbook of Health Economics, volume 2,
pages 499–637. Elsevier B. V.
Gooch, K. (2017). 4 of the largest gpos. Becker’s Hospital CFO Report.
Goodman-Bacon, A. (2018). Difference-in-differences with variation in treatment timing.
Working paper.
Gowrisankaran, G., Nevo, A., and Town, R. (2015). Mergers when prices are negotiated:
Evidence from the hospital industry. The American Economic Review, 105(1):172–203.
Grennan, M. (2013). Price discrimination and bargaining: Empirical evidence from medical
devices. American Economic Review, 103(1):145–177.
Grennan, M. (2014). Bargaining ability and competitive advantage: Empirical evidence from
medical devices. Management Science, 60(12):3011–3025.
Grennan, M. and Swanson, A. (2018). Diagnosing price dispersion. Working paper.
Grennan, M. and Swanson, A. (2019). Transparency and negotiated prices: The value of
information in hospital-supplier bargaining. Journal of Political Economy. forthcoming.
Gruber, J. and McKnight, R. (2016). Controlling health care costs through limited net-
work insurance plans: Evidence from Massachusetts state employees. American Economic
Journal: Economic Policy, 8(2):219–50.
37

Haas-Wilson, D. and Garmon, C. (2011). Hospital mergers and competitive effects: Two
retrospective analyses. International Journal of the Economics of Business, 18(1):17–32.
Harrison, T. D. (2010). Do mergers really reduce costs? Evidence from hospitals. Economic
Inquiry, 49(4):1054–1069.
Hemphill, C. S. and Rose, N. L. (2018). Mergers that harm sellers. The Yale Law Journal,
127(1).
Ho, K. (2006). The welfare effects of restricted hospital choice in the us medical care market.
Journal of Applied Econometrics, 21(7):1039–1079.
Ho, K. (2009). Insurer-provider networks in the medical care market. American Economic
Review, 99(1):393–430.
Ho, K. and Lee, R. S. (2017). Insurer competition in health care markets. Econometrica,
85(2):379–417.
Ho, K. and Lee, R. S. (2018). Equilibrium provider networks: Bargaining and exclusion in
health care markets. Manuscript.
Ho, V. and Hamilton, B. H. (2000). Hospital mergers and acquisitions: Does market consol-
idation harm patients? Journal of Health Economics, 19(3):408–419.
Horn, H. and Wolinsky, A. (1988). Bilateral monopolies and incentives for merger. RAND
Journal of Economics, 19:408–419.
Inderst, R. and Wey, C. (2007). Buyer power and supplier incentives. European Economic
Review, 51:647–667.
Krishnan, R. (2001). Market restructuring and pricing in the hospital industry. Journal of
Health Economics, 20:213–237.
Kwoka, J. (2015). Mergers, Merger Controls, and Remedies: A Retrospective Analysis of
U.S. Policy. The MIT Press, Cambridge, MA.
Lagasse, J. (2018). Here’s a big supply chain cost-savings opportunity: physician preference
items. Healthcare Finance.
LaVito, A. (2018). Trump administration opens up more drugs covered by medicare to price
negotiations. CNBC.com.
38
Lewis, M. and Pflum, K. (2015). Diagnosing hospital system bargaining power in managed
care networks. American Economic Journal: Economic Policy, 7(1):243–74.
Maeda, J. L., Raetzman, S. O., and Friedman, B. S. (2012). What hospital inpatient services
contributed the most to the 2001-2006 growth in the cost per case? Health Services
Research, 47(5):1814–1835.
Marvel, H. P. and Yang, H. (2008). Group purchasing, nonlinear tariffs, and oligopoly.
International Journal of Industrial Organization, 26(5):1090–1105.
Miller, N. and Weinberg, M. (2017). Understanding the price effects of the millercoors joint
venture. Econometrica, 85(6):1763–91.
Minemyer, P. (2017). Geisinger’s turnaround offers lessons on integrated delivery. Fierce-
Healthcare.
Navathe, A. S., Troxel, A. B., Liao, J. M., Nan, N., Zhu, J., Zhong, W., and Emanuel,
E. J. (2017). Cost of joint replacement using bundled payment models. JAMA Internal
Medicine, 177(2):214–222.
Noether, M. and May, S. (2017). Hospital merger benefits: Views from hospital leaders and
econometric analysis. Technical report, Charles River Associates.
Nugent, W. C., Kilo, C. M., Ross, C. S., Marrin, A. S., Berwick, D. M., and Roessner, J.
(1999). Improving Outcomes and Reducing Costs in Adult Cardiac Surgery. Institute for
Healthcare Improvement, Boston, MA.
Prager, E. and Schmitt, M. (2019). Employer consolidation and wages: Evidence from
hospitals. Working paper.
Romano, P. S. and Balan, D. J. (2011). A retrospective analysis of the clinical quality
effects of acquisition of Highland Park Hospital by Evanston Northwestern Healthcare.
International Journal of the Economics of Business, 18(1):45–64.
Sacher, S. and Vita, M. (2001). The competitive effects of a not-for-profit hospital merger:
A case study. Journal of Industrial Economics, 49(1):63–84.
Schmitt, M. (2017). Do hospital mergers reduce costs? Journal of Health Economics,
52:74–94.
Schneller, E. S. (2009). The value of group purchasing - 2009: Meeting the need for strategic
savings. Health Care Sector Advances, Inc.
39

Sela, R. J. and Simonoff, J. S. (2011). Reemtree: Regression trees with random effects. R
package version 0.90.3.
Snyder, C. M. (1996). A dynamic theory of countervailing power. Rand Journal of Eco-
nomics, 27:747–769.
Snyder, C. M. (1998). Why do larger buyers pay lower prices? Intense supplier competition.
Economics Letters, 58:205–209.
Sorensen, A. (2003). Insurer-hospital bargaining: Negotiated discounts in post-deregulation
Connecticut. Journal of Industrial Economics.
Starc, A. and Swanson, A. (2018). Preferred pharmacy networks and drug costs. Working
paper.
Stole, L. and Zwiebel, J. (1996). Intra-firm bargaining under non-binding contracts. Review
of Economic Studies, 63:375–410.
Tenn, S. (2011). The price effects of hospital mergers: A case study of the Sutter-Summit
transaction. International Journal of the Economics of Business, 18(1):65–82.
Thompson, E. (2011). The effect of hospital mergers on inpatient prices: A case study of the
New Hanover-Cape Fear transaction. International Journal of the Economics of Business,
18(1):91–101.
Tousi, K. and Kawalek, C. (2009). Designing for profitability: A new approach to territory
alignment. ZS Associates: Sales and Marketing Insights.
Town, R. J. and Vistnes, G. (2001). Hospital competition in hmo networks. Journal of
Health Economics, 20(5):733–752.
Town, R. J., Wholey, D. R., Feldman, R., and Burns, L. R. (2006). The welfare consequences
of hospital mergers. National Bureau of Economic Research.
Town, R. J., Wholey, D. R., Feldman, R., and Burns, L. R. (2007). Revisiting the relationship
between managed care and hospital consolidation. Health Services Research, 42(1):219–
238.
United States District Court for the District of Columbia (2017). Memorandum Opinion,
United States of America vs. Anthem, Inc., et al. Civil Action No. 16-1493 (ABJ).
40
U.S. Department of Justice and the Federal Trade Commission (2010). Horizon-
tal merger guidelines. https://www.ftc.gov/sites/default/files/attachments/merger-
review/100819hmg.pdf.
Uysal, V. B., Kedia, S., and Panchapagesan, V. (2008). Geography and acquirer returns.
Journal of Financial Intermediation, 17:256–275.
Vogt, W. B. and Town, R. J. (2006). How has hospital consolidation affected the price and
quality of care? Synthesis Report 9, Robert Wood Johnson Foundation.
41

ELECTRONIC APPENDICES – NOT FOR PRINT PUBLICATION
42

A Data Appendix
The primary data used in this study come from a unique database of all supply purchases
made by over 1,000 US hospitals during the period 2009-2015. The data are from the
PriceGuideTM
benchmarking service (hereafter, “PriceGuide data”) offered by the ECRI
Institute, a non-profit health care research organization. For each transaction, we observe
price, quantity, transaction month, and supplier for a wide range of product categories.
The reported data are of high quality because they are typically transmitted as a direct
extract from a hospital’s materials management database. Hospitals have strong incentives
to report accurately because the analytics the benchmarking service’s web portal provides
are based on comparing the hospital’s submitted data to that of others in the database.57
The raw transactions data contain 116 million observations for 2,876 members across
3,394 product categories and 2.7 million stock keeping units (SKUs). Our analyses include
37 important product categories, defined by their UMDNS codes. We restricted to the top
50 categories by spending or number of transactions, yielding 71 categories total. From
these, we excluded categories that were too broad or where data quality seemed to be an
issue. We did this based on “reasonableness” of the observed price variation – categories for
which the coefficient of variation in price exceeded 200 percent were excluded – and selected
categories by hand that seemed excessively broad based on their UMDNS names: Industrial
Supplies, Computer Supplies, Food Item, Stickers, Office Supplies, Tests, Solutions, Pharma-
ceuticals, Nutritional Supplements, IV Administration Kits, and In-Vitro Diagnostic (IVD)
Kits.58 Next, we rationalized the multiple units of measure in which different transactions’
quantities were reported. Although many medical and surgical product categories are sold
by the unit (e.g., a single coronary stent), others are sold in pairs, boxes, cases, etc. The
transactions data indicates this distinction in the “unit of measure” field, and further notes
how many subunits are in each unit of measure using a “conversion factor” field. In order
to perform our analyses on the cleanest and most internally-consistent transactions data
possible, we transformed all transactions into price per single unit and quantity of single
units purchased.59. Finally, we utilized machine learning methods to categorize SKUs into
57Nonetheless, there is some evidence that the data are incomplete. For example, we find it unrealisticthat some broadly used categories (e.g. examination gloves) do not include data from all hospitals.
58For example, “IVD Kits” include microbial detection kits costing $2.14 on average, as well as tests forantibiotic-resistant bacteria colonization costing $4,400 on average.
59This required excluding codes for which we could not confidently calculate price per unit due to missingconversion factors (e.g., 10 units per box) or inconsistent unit of measure. For example, some products werereported in “boxes” for some transactions and “cases” for others, such that we could ascertain units per boxand boxes per case, but not units per case. For our analytic sample, we excluded product categories wherethe modal unit of measure accounted for less than one-half of the data or where the quantity conversionfactor was missing for at least one-third of the data.
43

brand IDs, in order to appropriately control for brand-specific price trends. The next Section
provides more detail on assignment of brand IDs.
A.1 Identifying Brands in the Transaction Data
The absence of a brand identifier in the database creates a problem of sparsity, in which
many SKUs are purchased by only a small number of hospitals, or in only a small number of
months. The most thorough method we employed to identify brands, for a subset of products,
involved examining manufacturer catalogs, finding likely brand names, searching for similar
strings within the item description field, and validating SKUs for those brands against the
catalog numbers. This was infeasible for all product categories due to the large number
of manufacturers and SKUs. Additionally, many manufacturers’ websites were found to be
difficult to navigate, particularly once we extended the analysis beyond high-dollar physician
preference items. Finally, the item description field was often uninformative as to brand.
Hence, we used an algorithmic approach to assign brand identifiers for the other product
categories.
Our preferred algorithm implements the Random Effect Expectation-Maximization (RE-
EM) estimation method from Sela and Simonoff (2011), which is an adaptation of a recursive
partitioning tree algorithm to allow for group effects. With no particular assumption made
about the significance of each letter within a SKU, recursive partitioning tree allows us to
obtain overfitting-proof groupings that minimizes the 10-fold cross validation error. Further-
more, the group effects in the RE-EM estimation method allow us to control for systematic
heterogeneity in price across hospital-time.
Given a transaction i = 1, . . . , N where N is the size of the dataset within a UMDNS
code, price pi of the transaction, dummy matrix Zi indicating each transaction’s hospital-
time group, group effect bi, and attribute vector Di = {di1, . . . , diL} where dil is the lth digit
of the SKU associated with transaction i, the RE-EM proceeds as follows:
1. Initialize estimated group effect bi to zero.
2. Iterate through the following steps until the estimated hospital-time effect bi converges.
(a) Estimate a regression tree with recursive partitioning on price adjusted by hospital-
time group effect, pi − Zibi with attributes Di. Take the terminal nodes, j ∈ J ,
of the tree and create an indicator variable, I(Di ∈ j).
(b) Fit a linear model, pi = Zibi + I(Di ∈ j)µp + εi and extract bi from the model.
3. Once bi converges, take the final grouping j ∈ J and use it as the new product identifier
for each i.
44

At each iteration of step (2a), the tree is pruned using 10-fold cross validation at each split;
the model retains the simplest tree with cross validation error no more than one standard
error away from the tree with the minimum cross validation error.
With this method, we categorized 149,543 SKUs across 37 UMDNS codes into 6,881
RE-EM brands. For surgical staplers and drug-eluting coronary stents, which we validated
by hand, we identified 3.8 RE-EM brands per “true” stapler brand, 0.8 RE-EM brands per
“true” drug-eluting stent brand.
The patterns we document are insensitive to how we classify brands. For example, we
compare the pooled product class effects in Table 4 in the main text to two brand clas-
sification extremes in Table A1 below. The top panel reproduces the results in Table 4;
the middle panel shows the results of a granular extreme, with “brands” defined as unique
SKUs; the bottom panel shows the results of a coarse extreme, with “brands” defined as
unique vendors. The results are very similar across specifications. The results for target
hospitals are nearly identical across panels. The negative and marginally significant within-
hospital-category estimates for acquirers purchasing non-PPIs disappear in both alternative
specifications. Given that the acquirer/non-PPI results have little weight in our ultimate
takeaways, we do not dwell on this issue. Finally, the RE-EM and SKU (top and middle
panel, respectively) results for acquirers purchasing PPIs are nearly identical; the less conser-
vative vendor (bottom panel) point estimates are larger in magnitude. In sum, we consider
this comparison reassuring that our results are not driven by misclassification of brands.
45

Table A1: Sensitivity of Main Results to Product Granularity
Dependent Variable: ln(Price)uhjmy
Brand (j) is a REEM (Baseline)Non-PPIs -0.006 0.003 -0.004 -0.012**
(0.008) (0.011) (0.004) (0.005)PPIs -0.034† -0.038† 0.017† 0.012**
(0.010) (0.009) (0.006) (0.005)Brand (j) is a SKU
Non-PPIs -0.004 -0.007 0.002 -0.002(0.005) (0.008) (0.003) (0.004)
PPIs -0.037† -0.040† 0.014† 0.013†(0.010) (0.007) (0.003) (0.002)
Brand (j) is a VendorNon-PPIs -0.002 -0.019 -0.003 -0.003
(0.025) (0.027) (0.016) (0.013)PPIs -0.034† -0.035† 0.028† 0.035†
(0.012) (0.013) (0.011) (0.010)
Fixed Effects: θuhj + θjmy θuh + θjmy θuhj + θjmy θuh + θjmyTreatment: Targets Acquirers
Notes: Authors’ calculations from PriceGuide data. * p < 0.10, ** p < 0.05, † p < 0.01. Standard errors clustered atthe hospital-product level in parentheses. Coefficients estimated from pooled specifications (1) and (2). Thedependent variable ln(Price) is the logged transaction price measured at the hospital-product-month-year. All pricespecifications include product-month-year fixed effects.
46

B Medical Supply Usage and Purchasing
For physician preference technologies, usage is driven by physicians choosing which brand
to use to treat a given patient, while prices are determined in negotiation between a hos-
pital administrator and a representative of the brand’s manufacturer. Hospitals typically
rely on the services of group purchasing organizations (GPOs) to negotiate contracts for
many product categories, but GPO prices are used as a starting point for direct hospital-
manufacturer negotiations for physician preference items and capital equipment (Schneller
2009). For PPIs, there is no “search” in the conventional sense, as a given brand can only
be purchased directly from its manufacturer. For non-PPIs, a given brand may be sold by
multiple vendors.
Contracts typically specify a single price for the contract duration, often a year. In the
short run, hospitals are reimbursed a fixed amount by private or public insurers based on
the services they provide, and so supply prices come directly from the hospital’s bottom
line.60 In our conversations with industry participants, the purchasing practices via which
these contracts are negotiated vary widely across organizations. Some hospitals have large
materials management or purchasing departments with agents who specialize in negotiations.
Sometimes a large business unit, such as a catheter lab in the case of stents, will coordinate
its own purchasing separately from the rest of the hospital. Finally, hospitals vary in access
to information on the prices other hospitals pay via GPOs, hospital system membership, or
informal networks of peers.
60In a subset of contracts with private payers, hospitals are reimbursed a fixed percent of charges associatedwith a given admission. In such cases, reimbursements will increase with marginal costs.
47

C Merger Treatment Effects on Standardization
We estimated the effects of mergers on hospitals’ tendency to standardize purchasing within
categories, hypothesizing that mergers incentivize systems to consolidate purchasing across
vendors in order to achieve better discounts (Noether and May 2017). We estimate a version
of specification (1) where the dependent variable is an indicator for whether a hospital had
“standardized” purchasing; we categorize a hospital as standardized if it purchased at least
75 (or 90) percent of units in a product category from a single vendor in a given year.61 These
results are presented for each product class in Table A2. The first four panels show results
for alternative matching strategies, for the 75 percent threshold; the fifth panel limits the
sample to post-join hospital-years; the bottom panel uses the preferred matching strategy,
with the 90 percent threshold.62 The results are generally quite noisy, and are sensitive
to specification. For targets, we cannot generally rule out mergers inducing large positive
or negative changes in standardization rates. The results for acquirers are more precise,
given the larger sample: in the top panel, we document that acquirers are a statistically
significant 7 percentage points more likely to standardize non-PPI products post merger,
and a marginally significant 5 percentage points more likely to standardize PPIs post-merger.
Unlike the broad robustness of our evidence on merger-related price effects, however, these
results go away when we use alternative matching approaches, “cleaner” post-join sampling,
or a more stringent standardization threshold.63
This limited evidence of greater standardization post-merger reinforces our previous find-
ing that within-category price effects are generally similar in magnitude to within-brand price
effects: mergers do not appear to lead to efficiency gains via strategic changes in utilization.
At face value, this runs contrary to some prior literature (and conventional wisdom) suggest-
ing that a primary advantage of mergers is to allow a larger integrated firm to standardize
purchasing and extract greater discounts.
61These regressions are run at the hospital-year level and include u-specific hospital and year fixed effects.62To fix ideas, the baseline rates of “75 percent” standardization are 46 percent for non-PPIs, and 44
percent for PPIs.63Table A3 shows alternative standard error calculations for the baseline matching, 75 percent standard-
ization specification.
48

Table A2: Merger Treatment Effects – Standardization
Targets AcquirersStandardization ≡ Share(Q) > 0.75Mahalanobis, 10 Neighbors, All Data
Non-PPIs 0.016 0.070†(0.032) (0.022)
PPIs -0.042 0.050*(0.049) (0.030)
Non-Matched, All DataNon-PPIs -0.018 0.059†
(0.033) (0.022)PPIs -0.027 0.034
(0.053) (0.029)
Probit, 10 Neighbors, All DataNon-PPIs -0.003 0.042*
(0.032) (0.023)PPIs 0.026 0.057*
(0.051) (0.032)
Malanobis, 1 Neighbor, All DataNon-PPIs -0.084 0.048
(0.080) (0.036)PPIs -0.221† 0.032
(0.078) (0.044)
Mahalanobis, 10 Neighbors, Post-Join DataNon-PPIs 0.020 0.037
(0.037) (0.027)PPIs 0.053 0.002
(0.054) (0.035)
Standardization ≡ Share(Q) > 0.9Mahalanobis, 10 Neighbors, All Data
Non-PPIs 0.022 0.019(0.035) (0.016)
PPIs -0.036 0.023(0.041) (0.023)
Notes: Authors’ calculations from PriceGuide data. * p < 0.10, ** p < 0.05,† p < 0.01. Standard errors clustered at the hospital-category level inparentheses. Coefficients estimated from pooled specifications with hospitaland year fixed effects. Dependent variable is an indicator for whether thehospital bought at least Thresh% of all units in a product category from asingle vendor in a given calendar year, with Thresh ∈ {75, 90}. Specificationincludes hospital-category and category-year fixed-effects.
49

Table A3: Merger Treatment Effects on Standardization – Pooled, AlternateStandard Error Calculations
Targets AcquirersPanel A: Clustered at the Hospital X UMDNS code
Non-PPIs 0.016 0.070†(0.032) (0.022)
PPIs -0.042 0.050*(0.049) (0.030)
Panel B: Clustered at System X UMDNS CodeNon-PPIs 0.016 0.070**
(0.038) (0.031)PPIs -0.042 0.050
(0.055) (0.032)
Panel C: Clustered by Hospital X UMDNS code (Wild Bootstrap)Non-PPIs 0.016 0.070†
(-0.036, 0.071) (0.032, 0.103)PPIs -0.042 0.050*
(-0.118, 0.037) (-0.002, 0.101)
Notes: Authors’ calculations from PriceGuide data. * p < 0.10, ** p < 0.05, † p < 0.01. PanelsA-C report clustered standard errors in parentheses. Panel D reports 95% confidence intervalsgenerated from wild bootstrap clustered at the hospital-UMDNS code level (n = 1, 000) inparentheses. Dependent variable is an indicator for whether the hospital bought at least 75% of allunits in a product category from a single vendor in a given calendar year. Specification includeshospital and year fixed-effects.
50

D Matching Merging and Non-Merging Hospitals
Table A4 compares the performance of alternative matching approaches. The metric of
interest is an index of the difference in hospital characteristics Xh,τh−1 between merging and
non-merging hospitals; for a given merging hospital h, candidate matched controls are those
with transactions in [τh − 1, τh + 1] and the matching procedure is applied to characteristics
data from the pre-merger year τh − 1. We summarize performance across characteristics Kby the average standardized difference
∑k∈K
1
K
Xctrl,k − Xtreat,k
σk
where Xctrl,k is the mean of characteristic k in the matched control group, Xtreat,k is the
mean of characteristic k in the treated (merging) group, and σk is the standard deviation of
characteristic k among treated hospitals. Each UMDNS-code-specific sample of treated and
control hospitals is weighted by that UMDNS code’s total expenditure share, to mimic the
stacked regression weighting. Column (1) summarizes each matching approach by summing
the difference index across the four target/acquirer-PPI/non combinations.
We followed Schmitt (2017) and Dranove and Lindrooth (2003) to select candidate match-
ing algorithms. Following Schmitt (2017), we used M -to-1 optimal Mahalanobis matching
along the eleven characteristics dimensions at the top of each panel in Table 3, for various
values of M . Following Dranove and Lindrooth (2003), we also use Probit regressions of the
probability of merging and match M control hospitals to treated hospitals using the resulting
predicted propensity scores; in some cases, we also limit candidate controls to those whose
characteristics are all within 20 percent (a 20 percent “caliper,” in matching terminology)
of the target’s characteristics.
The results are shown in Table A4, in descending order of summary match performance.
The 10-to-1 optimal Mahalanobis algorithm had the best performance, but was comparable
to many Probit-based matches. The best matching algorithms improved upon the compari-
son without matching by a factor of nearly three standard deviations.
Table A5 shows the results of our baseline price regressions for alternative matching
methods, as well as the non-matched sample.
51

Table A4: Comparison of Matching Results
(1) (2) (3) (4) (5)Sample Composite Non-PPIs PPIs
Targets Acquirers Targets Acquirers
Mahalanobis 10 3.699 1.230 0.607 1.013 0.849Probit 15, no cal. 3.745 0.686 1.101 0.791 1.168Probit 30, 20 pct cal. 3.769 0.689 1.114 0.797 1.170Probit 15, 20 pct cal. 3.777 0.649 1.105 0.827 1.196Probit 25, 20 pct cal. 3.800 0.690 1.121 0.823 1.165Probit 5, no cal. 3.809 0.692 1.164 0.736 1.217Probit 5, 20 pct cal. 3.818 0.661 1.181 0.778 1.197Probit 10, no cal. 3.820 0.690 1.102 0.807 1.222Probit 20, 20 pct cal. 3.827 0.682 1.106 0.849 1.189Probit 30, no cal. 3.843 0.818 1.140 0.759 1.127Probit 10, 20 pct cal. 3.854 0.675 1.155 0.808 1.216Mahalanobis 15 3.856 1.204 0.619 1.049 0.984Mahalanobis 5 3.916 1.334 0.757 1.028 0.797Probit 20, no cal. 3.925 0.782 1.146 0.833 1.164Probit 25, no cal. 3.938 0.853 1.131 0.810 1.145Mahalanobis 20 4.113 1.172 0.717 1.082 1.141Probit 1, 20 pct cal. 4.271 0.746 1.046 0.982 1.497Mahalanobis 25 4.299 1.198 0.825 1.031 1.244Probit 1, no cal. 4.332 0.775 1.065 1.008 1.484Mahalanobis 30 4.467 1.147 0.938 1.063 1.319Mahalanobis 1 5.555 2.014 1.124 1.303 1.113Non-matched 10.633 3.873 1.348 4.028 1.384
Notes: Each cell presents the Euclidean distance of mean characteristics between the treatment and control group (i.e., thesum of mean differences between the treated and relevant control group, divided by the standard deviation in the treatedgroup). Each row presents statistics for a given matching approach. Columns (2)-(5) present distance values for each ofthe four treatment-class categories. Column (1) presents the sum across all characteristics and treatment categories.
52

Table A5: Merger Treatment Effects on Price – Pooled, Alternative MatchingApproaches
Targets Acquirers
Panel A: Mahalanobis, 10 NeighborsNon-PPIs -0.006 -0.004
(0.008) (0.004)PPIs -0.034† 0.017†
(0.010) (0.006)
Panel B: Non-MatchedNon-PPIs 0.006 -0.005
(0.009) (0.005)PPIs -0.022** 0.015†
(0.010) (0.005)
Panel C: Probit, 10 NeighborsNon-PPIs -0.016* -0.001
(0.009) (0.005)PPIs -0.036† 0.020†
(0.012) (0.007)
Panel D: Mahalanobis, 1 NeighborNon-PPIs 0.013 -0.009
(0.022) (0.009)PPIs -0.042 0.021*
(0.029) (0.011))Notes: Authors’ calculations from PriceGuide data. * p < 0.10, ** p < 0.05, † p < 0.01. Standarderrors clustered at the hospital-brand level in parentheses. Coefficients estimated from pooledspecifications (1). The dependent variable ln(Price) is the logged transaction price measured at thehospital-brand-month-year. Matched characteristics include number of beds, Medicare andMedicaid share of discharges, teaching status, non-profit ownership, HMO penetration, and loginputs (FTEs and technologies) and outputs (admissions) as in Dranove and Lindrooth (2003). Allprice specifications include hospital-brand and brand-month-year fixed-effects.
53
E Generalizability
The matching exercises described in Appendix D focus on selecting the best comparison
groups for our in-sample mergers to ensure internal validity. Here, we conduct multiple
exercises aimed at testing the generalizability of our findings. Table A6 shows estimates for
our main merger specification from equation (1), with sample treated hospitals re-weighted
to match the national distribution of treated hospitals on various observable characteristics.
Panel A presents our main estimates from Table 4 for reference.
Panel B of Table A6 displays the same results, where we have re-weighted the sample to
match the national distribution of merging hospital bed sizes. To put this in perspective,
Figure A1 displays the raw distribution of beds across targets and acquirers in our main
regression sample (column (4) of Table 1) and in the overall AHA survey during 2009-2015
(column (2) of Table 1). The raw distributions are somewhat different: PriceGuide hospitals
tend to be larger than average, but the mergers we observe in the PriceGuide data span the
support of those in the overall AHA. Panel C of Table A6 alternatively re-weights our sample
treated hospital to match the national distribution of targets and acquirers by teaching and
non-profit status; recall from Table 1 that the PriceGuide sample treated hospitals are more
likely than merging hospitals in the full AHA to be non-profit, and more likely to be teaching
hospitals.
Re-weighting our sample targets and acquirers as described above, we find that the
average merger, nationwide, may have a slightly smaller effect for targets’ PPI prices than
the average merger in the PriceGuide sample. However, no result is statistically different
from our main results in Panel A.
54

Table A6: Merger Treatment Effects – Pooled, Re-weighting for Generalizabil-ity
Targets Acquirers
Panel A: Baseline WeightingNon-PPIs -0.006 -0.004
(0.008) (0.004)PPIs -0.034† 0.017†
(0.010) (0.006)Panel B: Re-weighted by Bed Quintiles
Non-PPIs -0.004 -0.000(0.008) (0.004)
PPIs -0.026** 0.017†(0.011) (0.006)
Panel C: Re-weighted by Teaching X Non-Profit OwnershipNon-PPIs 0.002 -0.001
(0.009) (0.004)PPIs -0.029† 0.016†
(0.011) (0.006)
Notes: Authors’ calculations from PriceGuide data. * p < 0.10, ** p < 0.05, † p < 0.01. Standarderrors clustered at the hospital-brand level in parentheses. Coefficients estimated from pooledspecifications (1). The dependent variable ln(Price) is the logged transaction price measured atthe hospital-brand-month-year. All specifications include hospital-brand and brand-month-yearfixed-effects. Panel B: observations in each quintile of PriceGuide bed size distribution reweightedby proportion of AHA hospitals in same quintile. Panel C: observations in eachteachingXnon-profit combination in PriceGuide data reweighted by proportion of AHA hospitals insame teachingXnon-profit combination.
55

Figure A1: Distribution of Beds by Treatment Type
Notes: Authors’ calculations from PriceGuide data and AHA Annual Survey. Each panel displays a histogram forthe number of beds at each treated hospital.
56

F Geographic Proximity Results – Alternative Market
Definitions
In Section 5.4, we explored how merger treatment effects vary with geographic proximity of
the merging parties. Generally, the appropriate definition of local markets – i.e., whether two
hospitals are “close” – will depend on which underlying local mechanisms are relevant for the
application. First, if the most important “local” consideration is whether hospitals compete
locally to supply care, then we may want to focus on relatively narrow geographic markets;
e.g., Cooper et al. (2019) find that hospital merger effects on prices cease to be significant for
merging parties more than 20-30 miles apart. Second, if (as discussed in Section 3) the most
important consideration is local transmission of business processes, management, or culture
– or, similarly, greater ability of local firms to coordinate and share back-office functions
– then we do not have a strong prior on what the right threshold is, but we can borrow
thresholds from the literature. For example, Uysal et al. (2008) use 100 kilometers/60 miles.
Finally, it may matter whether merging firms face the same medical supply sales territories.
Such territories vary across supply firms and product categories, but sales representatives
generally serve multiple (or even dozens of) hospital accounts in local areas that appear to
be larger than HRRs and, similar to HRRs, vary with population and provider density.64
According a report by the consultancy ZS Associates (which focuses on pharmaceuticals and
medical products, among others), the average sales territory may cover 8,000 hospital beds,
which is about the 95th percentile of HRRs (Tousi and Kawalek 2009).
To shed further light on how in-market and out-of-market merger effects vary with mar-
ket definition, Table A7 below varies the distance threshold within which we consider two
merging parties “local.” The Table focuses on targets, as our previous results in Table 5 did
not document meaningful differences between in- and out-of-market mergers for acquirers.
The left panel compares results for different market definitions for PPIs; the right panel
compares results for non-PPIs. The first set of rows replicates our HRR-based results from
Table 5. The results for non-PPIs are broadly similar across market definitions. The re-
sults for PPIs are somewhat nuanced. For the lowest thresholds – 10 and 30 miles – the
in-market coefficient point estimate is actually smaller in magnitude than the out-of-market
point estimate, but this difference is not statistically significant. At 50 miles and above,
the PPI results start to mimic our HRR-based specifications, with larger magnitudes for
in-market mergers for targets, and this difference is statistically significant at 70 miles and
64Dartmouth researchers designed hospital referral regions to capture local markets for tertiary care suchas cardiovascular procedures and neurosurgeries. E.g., both Massachusetts and Wyoming have five HRRs,even though Wyoming is nine times as large as Massachusetts by square miles. Each HRR has at least onehospital that provides tertiary care. These are precisely the hospitals that will purchase PPIs in our data.
57

above. Thus, there are a subset of targets that are moderately close and that are relatively
more successful in negotiating PPI prices after merging, and the pattern of results depends
on whether we classify these as in-market mergers.
Given the multiplicity of mechanisms potentially at work in this setting, there is no
clear guidance on how to define markets. We consider it appropriate to classify moderately-
close hospitals as “in-market” with regard to supply markets. HRRs are convenient in that
each has at least one hospital that provides tertiary care, and such hospitals are precisely
those purchasing PPIs. They also adjust for population and provider density in a way that
medical industry sales territories (though sometimes larger) do. The fact that in-market
mergers produce slightly larger post-merger price decreases at very low distance thresholds
may suggest that local economies of scale are sometimes offset by pass-through of higher
prices in the downstream market for medical services.
Table A7: Merger Treatment Effects For Targets – Heterogeneity By MarketExposure
PPIs Non-PPIs
Ntar β SE Ntar β SE
HRRIn Market 12 -0.059† (0.018) 14 -0.025** (0.011)Out of Market 17 -0.012 (0.011) 19 0.011 (0.012)
Difference -0.047** (0.021) -0.036** (0.018)
10 Mile RadiusIn Market 8 -0.021 (0.022) 8 -0.020* (0.011)Out of Market 21 -0.038† (0.014) 25 -0.001 (0.010)
Difference 0.017 (0.030) -0.019 (0.014)
30 Mile RadiusIn Market 15 -0.029** (0.015) 16 -0.015 (0.011)Out of Market 14 -0.043† (0.013) 17 0.006 (0.014)
Difference 0.014 (0.019) -0.021 (0.020)
50 Mile RadiusIn Market 16 -0.035† (0.013) 17 -0.013 (0.011)Out of Market 13 -0.032** (0.014) 16 0.005 (0.016)
Difference -0.003 (0.018) -0.018 (0.022)
70 Mile RadiusIn Market 20 -0.048† (0.011) 22 -0.011 (0.009)Out of Market 9 0.020 (0.016) 11 0.011 (0.024)
Difference -0.068† (0.017) -0.022 (0.027)
90 Mile RadiusIn Market 21 -0.046† (0.011) 23 -0.011 (0.009)Out of Market 8 0.022 (0.016) 10 0.011 (0.028)
Difference -0.068† (0.018) -0.022 (0.031)
120 Mile RadiusIn Market 22 -0.046† (0.011) 24 -0.010 (0.009)Out of Market 7 0.024 (0.018) 9 0.012 (0.029)Difference -0.070† (0.018) -0.023 (0.032)
Notes: Authors’ calculations from PriceGuide data. * p < 0.10, ** p < 0.05, † p < 0.01. Standard errors clustered at thehospital-brand level in parentheses. Coefficients estimated from pooled specification (1). The dependent variable is the loggedtransaction price measured at the hospital-brand-month-year. A target is categorized as “In Market” if there is at least onehospital in the acquiring system in the specified market definition, and vice versa.
58

G Quantity Effects – Details
In this Appendix, we broadly consider “quantity” effects that may have implications for
welfare or for the validity of our research design.
Composition of products purchased: First, an important issue for thinking about the
welfare effects of mergers is whether they impact the composition of products purchased.
Here, we estimate the following specification:
BrandShrτ−1uh,τ+1 = βBru ∗ 1 {Treated}h + θBrug + εBruh
where BrandShrτ−1uh,τ+1 is the market share one year post-merger (y = τh + 1) of brands
in UMDNS code u that were purchased by hospital h in the year before the merger (y =
τh − 1); 1 {Treated}h is a dummy for the hospital being involved in a merger, as opposed
to being a matched control; and θBrug are UMDNS-by-match group fixed effects. Intuitively,
this specification asks whether and how merging hospitals changed the set of brands they
purchased around the time of acquisition, relative to a set of matched controls. It leverages
similar identifying variation as in Section 5.1, but the fact that BrandShrτ−1uh,τ−1 = 1 (by
definition) implies that a differences-in-differences that replaces price on the left-hand side
of specification (1) with BrandShrτ−1uhmy would essentially collapse to this cross-sectional
specification.
The results are shown in Appendix Table A8. Interestingly, we find that brand switching
is significantly less likely for merging hospitals than for matched controls, with similar results
for targets and acquirers. For context, in τ + 1, 51 percent of hospital purchases by matched
controls are accounted for by products each hospital purchased in τ − 1.
Purchase volume: Second, we examined the effect of mergers on purchase volume, moti-
vated by the logic that targets may have enjoyed price reductions due to increases in their
quantity purchased rather than changes in negotiated prices. In Appendix Figure A2 and
Appendix Table A9, we report the results of differences-in-differences specifications with
ln(Quhy) as the dependent variable for each product category, and for all categories in each
product class, respectively. The results are quite noisy, with both large positive and large
negative point estimates (which are rarely statistically significant). The summary results
mostly suggest that there is no consistent effect of mergers on volume of supplies purchased.
One exception is a finding that acquirers purchase approximately 13 percent more non-PPI
product post-merger, which is primarily driven by a large result for intraocular lenses. Impor-
tantly, comparing Figure A2 to Figure 1, we do not find evidence that savings are correlated
with quantity effects.
Sample attrition: Lastly, we investigate whether there is nonrandom attrition in our
59

Table A8: τ + 1 Market Share of Products Purchased in τ − 1
Dependent Variable: shjt|t=τ+1,j∈Jτ−1
Non-PPIsTreated 0.250† 0.207†
(0.022) (0.020)
PPIsTreated 0.242† 0.245†
(0.020) (0.015)
Fixed Effects θg θgTreatment Targets Acquirers
Notes: Table displays point estimates and standard errors from estimation of specification BrandShrτ−1uh,τ+1 on a
dummy for merging hospitals and UMDNS-by-match group fixed effects. Pooled product class-level estimates shownhere. * p < 0.10, ** p < 0.05, † p < 0.01. Standard errors, clustered at the match-group, in parentheses.
Table A9: Merger Treatment Effects on Purchase Quantity
Targets Acquirers
Dependent Variable: ln(Quhmy)Non-PPIs 0.030 0.130***
(0.061) (0.035)PPIs 0.044 0.006
(0.066) (0.036)
Notes: Authors’ calculations from PriceGuide data. Regression coefficients from pooled version ofspecification (1), replacing price as the dependent variable with ln(Q): the logged purchasequantity measured at the hospital-category-month-year level. Point estimates shown are forpost-merger year τh + 1. All specifications include category-hospital and category-month-yearfixed-effects. * p < 0.10, ** p < 0.05, † p < 0.01 with standard errors clustered at hospital level.
sample. For example, if merging hospitals are more likely to disappear from our sample after
a merger takes place, then the price treatment effects we estimate may be systematically
biased upward or downward. Here, we estimate the following specification:
InPGh,τ+1 = βInPG ∗ 1 {Treated}h + θInPGg + εInPGh
where InPGh,τ+1 is a dummy for hospital h appearing in the PriceGuide data one year
post-merger (y = τh + 1); 1 {Treated}h is a dummy for the hospital being involved in a
merger, as opposed to being a matched control; and θInPGg are match group fixed effects. We
also estimate a similar regression for InPGh,τ to investigate attrition in the merger year. In
60

a manner similar to the brand switching regressions above, this specification asks whether
merging hospitals were more likely to disappear from the PriceGuide database post-merger,
relative to a set of matched controls.65
Table A10: Evidence on Differential Attrition of Merging Hospitals
Dependent Variable: 1{In PriceGuide Data at t = X }
All Mergers in PriceGuideτh -0.011 0.027*
(0.036) (0.016)
τh + 1 -0.140** 0.042(0.063) (0.033)
Ntar/Nacq 50 114
Excluding 2014 Mergersτh -0.016 -0.009
(0.043) (0.024)
τh + 1 -0.064 0.022(0.061) (0.040)
Ntar/Nacq 36 67Fixed Effects θInPGg θInPGg
Treatment Targets Acquirers
Notes: Authors’ calculations from PriceGuide data. * p < 0.10, ** p < 0.05, † p < 0.01. Standard errors clustered at thematch-group in parentheses. The dependent variable is an indicator for whether or not the hospital remained in thePriceGuide data by t = {τ, τ + 1}. All specifications include fixed-effects for the match-group.
The top panel of Appendix Table A10 shows the results. To give a sense of magnitudes,
matched controls have an overall attrition rate of 16.5 percent across our target and acquirer
samples by τ + 1. We find that there is no differential attrition of target hospitals relative
to matched controls, and slightly less attrition of acquirers than of matched controls, in
the merger year τ . However, in the post-merger year τ + 1, there is a jump in differential
target attrition. The baseline attrition rate for target controls is 13.7 percent, indicating that
targets have a τ + 1 attrition rate of approximately 28 percent. Further investigation reveals
65The estimation sample for these regressions are all treated and matched control hospitals appearingin the PriceGuide data in τ − 1, so there are more hospitals in the regression samples than for the pricespecifications.
61

that this is primarily driven by differential post-merger attrition of targets in the last merger
year in our sample (i.e., we are missing more target data in 2015, meaning we are missing
more post-merger data for mergers taking place in 2014). The bottom panel of Appendix
Table A10 shows the same specification as in the top panel, but excluding 2014 mergers;
the target treatment effect is much smaller and no longer significant. Conversations with
our data provider indicate that data are generally submitted with a lag, so this differential
attrition may be driven by a longer delay in data submission for targets post-merger.
Such delays are problematic for our price regressions if they are correlated with price
trends; e.g., if targets that obtain large discounts upon merging no longer prioritize access
to PriceGuide. To investigate this phenomenon, Appendix Table A11 below estimates the
same regressions as in Table 4, but excluding 2014 mergers. The results are very similar
with and without 2014 mergers, with the exception that excluding 2014 mergers causes the
acquirer PPI effect to be smaller and no longer significant.
Table A11: Main Price Regressions Excluding 2014 Mergers
Dependent Variable: ln(Price)uhjmy
Non-PPIs -0.004 0.010 -0.008 -0.007(0.009) (0.014) (0.005) (0.007)
PPIs -0.032† -0.035† 0.004 0.006(0.010) (0.010) (0.008) (0.007)
Fixed Effects: θuhj + θjmy θuh + θjmy θuhj + θjmy θuh + θjmyTreatment: Targets Acquirers
Notes: Authors’ calculations from PriceGuide data. * p < 0.10, ** p < 0.05, † p < 0.01. Standard errors clustered at thehospital-brand level in parentheses. Coefficients estimated from pooled specifications (1) and (2). The dependentvariable ln(Price) is the logged transaction price measured at the hospital-brand-month-year. All price specificationsinclude brand-month-year fixed effects.
62

Figure A2: Merger Treatment Effects on Purchase Quantity
Notes: Authors’ calculations from PriceGuide data. Regression coefficients from specification (1), replacing price asthe dependent variable with ln(Q): the logged purchase quantity measured at the hospital-category-month-year level.Point estimates shown are for post-merger year τh + 1. All specifications include category-hospital andcategory-month-year fixed-effects. Bars indicate 95% confidence interval with standard errors clustered atcategory-hospital level. Left panel: Targets. Right panel: Acquirers. Circular/green markers: non-PPIs.Triangular/orange markers: PPIs.
63

H Deriving Estimated Savings from Treatment Effects
A main object of interest for this study is the estimated yearly savings a hospital might
experience given the treatment effects we observe. In order to generate these numbers, we
calculate average yearly savings for class C as:
saveC =∑u∈C
βu ∗ (spenduhy|y<τh),
where βu represents the target- or acquirer-specific treatment effect for UMDNS code u and
(spenduhy|y<τh) is the target- or acquirer-specific pre-merger average yearly spending per
hospital. We aggregate these across categories within product class C to obtain estimates
of average yearly savings for target and acquirer hospitals. Table A12 shows the details for
these estimates.
Alternatively, we could calculate estimated savings by broad product class using total
average spending across UMDNS codes and the pooled estimates from our stacked regressions
presented in Table 4. Table A13 shows the details for these estimates.
To clarify the source of the difference between the two approaches, note that Table 4
presents the treatment effect estimates from our stacked regressions, where β is estimated
by pooling all UMDNS codes in a given class and weighting observations by average an-
nual spending on each category.66 The covariance between spending and βu across product
categories generates the differences between our two methods of calculating total implied
savings.
66Results are similar if we instead simply average the category-specific coefficients in Table A12, weightingeach coefficient by average annual spending.
64
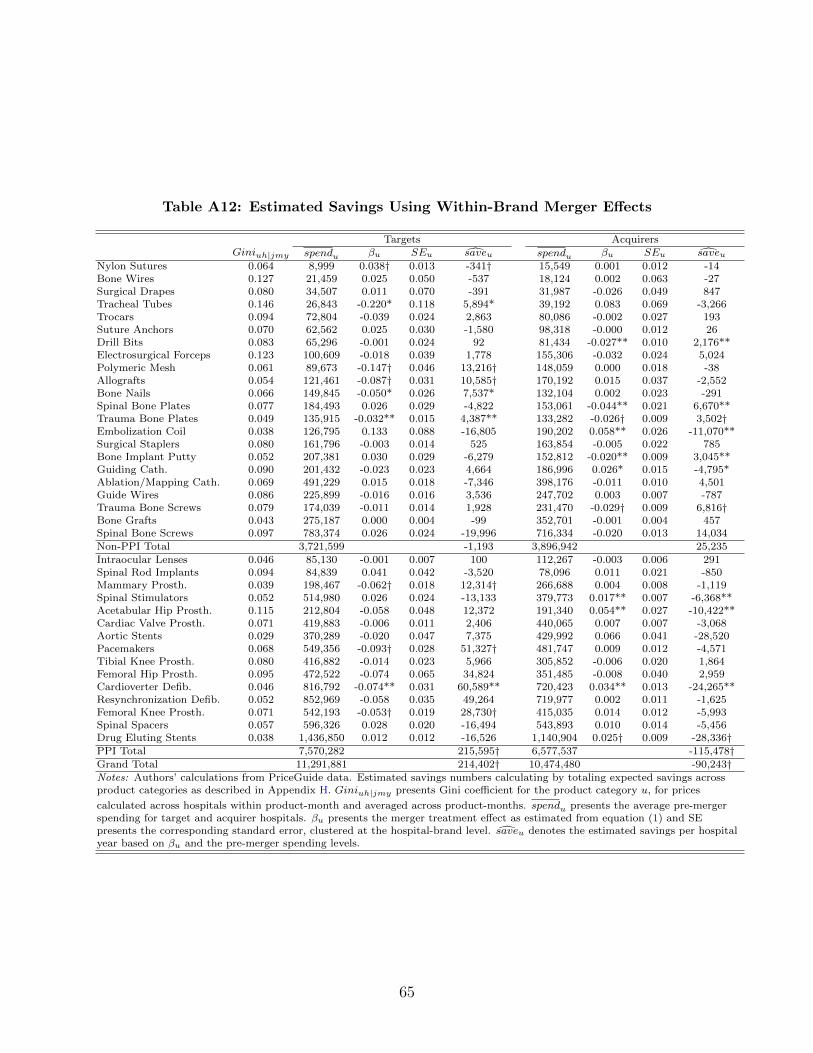
Table A12: Estimated Savings Using Within-Brand Merger Effects
Targets AcquirersGiniuh|jmy spendu βu SEu saveu spendu βu SEu saveu
Nylon Sutures 0.064 8,999 0.038† 0.013 -341† 15,549 0.001 0.012 -14Bone Wires 0.127 21,459 0.025 0.050 -537 18,124 0.002 0.063 -27Surgical Drapes 0.080 34,507 0.011 0.070 -391 31,987 -0.026 0.049 847Tracheal Tubes 0.146 26,843 -0.220* 0.118 5,894* 39,192 0.083 0.069 -3,266Trocars 0.094 72,804 -0.039 0.024 2,863 80,086 -0.002 0.027 193Suture Anchors 0.070 62,562 0.025 0.030 -1,580 98,318 -0.000 0.012 26Drill Bits 0.083 65,296 -0.001 0.024 92 81,434 -0.027** 0.010 2,176**Electrosurgical Forceps 0.123 100,609 -0.018 0.039 1,778 155,306 -0.032 0.024 5,024Polymeric Mesh 0.061 89,673 -0.147† 0.046 13,216† 148,059 0.000 0.018 -38Allografts 0.054 121,461 -0.087† 0.031 10,585† 170,192 0.015 0.037 -2,552Bone Nails 0.066 149,845 -0.050* 0.026 7,537* 132,104 0.002 0.023 -291Spinal Bone Plates 0.077 184,493 0.026 0.029 -4,822 153,061 -0.044** 0.021 6,670**Trauma Bone Plates 0.049 135,915 -0.032** 0.015 4,387** 133,282 -0.026† 0.009 3,502†Embolization Coil 0.038 126,795 0.133 0.088 -16,805 190,202 0.058** 0.026 -11,070**Surgical Staplers 0.080 161,796 -0.003 0.014 525 163,854 -0.005 0.022 785Bone Implant Putty 0.052 207,381 0.030 0.029 -6,279 152,812 -0.020** 0.009 3,045**Guiding Cath. 0.090 201,432 -0.023 0.023 4,664 186,996 0.026* 0.015 -4,795*Ablation/Mapping Cath. 0.069 491,229 0.015 0.018 -7,346 398,176 -0.011 0.010 4,501Guide Wires 0.086 225,899 -0.016 0.016 3,536 247,702 0.003 0.007 -787Trauma Bone Screws 0.079 174,039 -0.011 0.014 1,928 231,470 -0.029† 0.009 6,816†Bone Grafts 0.043 275,187 0.000 0.004 -99 352,701 -0.001 0.004 457Spinal Bone Screws 0.097 783,374 0.026 0.024 -19,996 716,334 -0.020 0.013 14,034Non-PPI Total 3,721,599 -1,193 3,896,942 25,235
Intraocular Lenses 0.046 85,130 -0.001 0.007 100 112,267 -0.003 0.006 291Spinal Rod Implants 0.094 84,839 0.041 0.042 -3,520 78,096 0.011 0.021 -850Mammary Prosth. 0.039 198,467 -0.062† 0.018 12,314† 266,688 0.004 0.008 -1,119Spinal Stimulators 0.052 514,980 0.026 0.024 -13,133 379,773 0.017** 0.007 -6,368**Acetabular Hip Prosth. 0.115 212,804 -0.058 0.048 12,372 191,340 0.054** 0.027 -10,422**Cardiac Valve Prosth. 0.071 419,883 -0.006 0.011 2,406 440,065 0.007 0.007 -3,068Aortic Stents 0.029 370,289 -0.020 0.047 7,375 429,992 0.066 0.041 -28,520Pacemakers 0.068 549,356 -0.093† 0.028 51,327† 481,747 0.009 0.012 -4,571Tibial Knee Prosth. 0.080 416,882 -0.014 0.023 5,966 305,852 -0.006 0.020 1,864Femoral Hip Prosth. 0.095 472,522 -0.074 0.065 34,824 351,485 -0.008 0.040 2,959Cardioverter Defib. 0.046 816,792 -0.074** 0.031 60,589** 720,423 0.034** 0.013 -24,265**Resynchronization Defib. 0.052 852,969 -0.058 0.035 49,264 719,977 0.002 0.011 -1,625Femoral Knee Prosth. 0.071 542,193 -0.053† 0.019 28,730† 415,035 0.014 0.012 -5,993Spinal Spacers 0.057 596,326 0.028 0.020 -16,494 543,893 0.010 0.014 -5,456Drug Eluting Stents 0.038 1,436,850 0.012 0.012 -16,526 1,140,904 0.025† 0.009 -28,336†PPI Total 7,570,282 215,595† 6,577,537 -115,478†Grand Total 11,291,881 214,402† 10,474,480 -90,243†Notes: Authors’ calculations from PriceGuide data. Estimated savings numbers calculating by totaling expected savings acrossproduct categories as described in Appendix H. Giniuh|jmy presents Gini coefficient for the product category u, for prices
calculated across hospitals within product-month and averaged across product-months. spendu presents the average pre-mergerspending for target and acquirer hospitals. βu presents the merger treatment effect as estimated from equation (1) and SEpresents the corresponding standard error, clustered at the hospital-brand level. saveu denotes the estimated savings per hospitalyear based on βu and the pre-merger spending levels.
65

Table A13: Estimated Savings Using Pooled Coefficients
Targets AcquirersGiniCh|jmy spendC βC SEC saveC spendC βC SEC saveC
Non-PPI Total 0.079 3,721,599 -0.006 0.008 23,600 3,896,942 -0.004 0.004 16,541PPI Total 0.064 7,570,282 -0.034† 0.010 260,895† 6,577,537 0.017† 0.006 -111,772†Grand Total 11,291,881 284,494† 10,474,480 -95,230**
Notes: Authors’ calculations from PriceGuide data. Estimated savings numbers calculating by totaling average yearly spendingacross product categories and applying treatment effect estimates from equation (1) as described in Appendix H. GiniCh|jmypresents Gini coefficient for product class C, for prices calculated across hospitals within product-month and averaged acrossproduct-months. spendC presents the average pre-merger spending for target and acquirer hospitals. βC presents the mergertreatment effect as estimated from equation (1) and SE presents the corresponding standard error, clustered at the hospital-brandlevel. saveC denotes the estimated savings per hospital year based on βC and the pre-merger spending levels.
66

I Additional Tables and Figures
Figure A3: Price Dispersion and Treatment Effects, Across UMDNS Cate-gories
(a) Targets (b) Acquirers
Notes: Authors’ calculations from PriceGuide data. Each point represents the estimated within-brand treatment effectfrom equation (1).
67

Figure A4: Merger Treatment Effects – Event Studies, Non-PPIs
Panel A: Targets(a) Average Prices (b) Estimated Treatment Effect
Panel B: Acquirers(c) Average Prices (d) Estimated Treatment Effect
Notes: Authors’ calculations from PriceGuide data. The left panels present the raw average price for treatedhospitals and matched controls, adjusted for the composition of products using a product-category-brandfixed-effect. The right panels present regression coefficients from pooled event study version of specifications (1),each month within one year of merger year τh. Hold-out date is December of last pre-merger year; all coefficientsrepresented relative to pre-merger year mean. Bars indicate the 95% confidence interval with standard errorsclustered by hospital-brand.
68

Figure A5: Merger Treatment Effects for Targets – Event Studies using Alter-native Timing Supports
(a) Non-PPIs, τh − 2 to τh + 1 (b) Non-PPIs, τh − 1 to τh + 2
(c) PPIs, τh − 2 to τh + 1 (d) PPIs, τh − 1 to τh + 2
Notes: Authors’ calculations from PriceGuide data. Regression coefficients from pooled event study specifications,focusing on targets. Hold-out date is December of last pre-merger year; all coefficients represented relative topre-merger year mean. Bars indicate the 95% confidence interval with standard errors clustered by hospital-brand.Circles indicate results for non-PPIs; triangles indicate results for PPIs. Left panels: the estimated series usingdata from two years prior to merger (τh − 2) through one year after (τh + 1). Right panels: estimates using datafrom one year prior to the merger (τh − 1) through two years after (τh + 2).
69

Figure A6: Merger Treatment Effects For Acquirers – Event Studies usingAlternative Timing Supports
(a) Non-PPIs, τh − 2 to τh + 1 (b) Non-PPIs, τh − 1 to τh + 2
(c) PPIs, τh − 2 to τh + 1 (d) PPIs, τh − 1 to τh + 2
Notes: Authors’ calculations from PriceGuide data. Regression coefficients from pooled event study specifications,focusing on acquirers. Hold-out date is December of last pre-merger year; all coefficients represented relative topre-merger year mean. Bars indicate the 95% confidence interval with standard errors clustered by hospital-brand.Circles indicate results for non-PPIs; triangles indicate results for PPIs. Left panels: the estimated series usingdata from two years prior to merger (τh − 2) through one year after (τh + 1). Right panels: estimates using datafrom one year prior to the merger (τh − 1) through two years after (τh + 2).
70

Table A14: Merger Treatment Effects – Pooled, Alternative Sample Restric-tions
Targets Acquirers
Panel A: Baseline sampleNon-PPIs -0.006 -0.004(Ntar = 33, Nacq = 85) (0.008) (0.004)PPIs -0.034† 0.017†(Ntar = 29, Nacq = 74) (0.010) (0.006)
Panel B: Using only post-join dataNon-PPIs -0.019** 0.006(Ntar = 23, Nacq = 47) (0.008) (0.005)PPIs -0.039† 0.022†(Ntar = 26, Nacq = 54) (0.012) (0.007)
Panel C: No additional mergers from τ − 2 to τ + 1Non-PPIs -0.006 -0.005(Ntar = 28, Nacq = 69) (0.009) (0.004)PPIs -0.025** 0.021†(Ntar = 25, Nacq = 58) (0.013) (0.006)
Notes: Authors’ calculations from PriceGuide data. * p < 0.10, ** p < 0.05, † p < 0.01. Standarderrors clustered at the hospital-brand level in parentheses. Coefficients estimated from pooledspecifications (1). The dependent variable ln(Price) is the logged transaction price measured atthe hospital-brand-month-year. All specifications include hospital-brand and brand-month-yearfixed-effects. Panel B restricts the sample to only data after which hospitals obtained access to thedatabase. Panel C restricts the sample to include only hospitals which did not experience a priormerger for at least 2 years before the current merger (τ − 2), and which did not experience asubsequent merger in τ + 1.
Figure A7: Relationship Between Vendor HHI and Treatment Effect
(a) Targets (b) Acquirers
Notes: Authors’ calculations from PriceGuide data. Each point represents the estimated within-brand treatment effectfrom equation (1).
71

Table A15: Merger Treatment Effects on Price – Pooled, Alternative Timing
Targets Acquirers
Using years τ − 1 to τ + 1, β onlyNon-PPIs -0.006 -0.004(Ntar = 33, Nacq = 85) (0.008) (0.004)PPIs -0.034† 0.017†(Ntar = 29, Nacq = 74) (0.010) (0.006)
Using years τ − 1 to τ + 1, α = βNon-PPIs -0.003 0.003(Ntar = 33, Nacq = 85) (0.006) (0.003)PPIs -0.032† 0.007*(Ntar = 29, Nacq = 74) (0.009) (0.004)
Using years τ − 2 to τ + 1, β onlyNon-PPIs -0.027** -0.011**(Ntar = 16, Nacq = 43) (0.011) (0.006)PPIs -0.055† 0.003(Ntar = 18, Nacq = 50) (0.014) (0.007)
Using years τ − 1 to τ + 2, β onlyNon-PPIs -0.006 -0.012*(Ntar = 21, Nacq = 39) (0.009) (0.007)PPIs -0.039† 0.007(Ntar = 25, Nacq = 41) (0.011) (0.008)
Notes: Authors’ calculations from PriceGuide data. * p < 0.10, ** p < 0.05, † p < 0.01. Standarderrors clustered at the hospital-brand in parentheses. Coefficients estimated from pooledspecifications (1). The dependent variable ln(Price) is the logged transaction price measured at thehospital-brand-month-year. All specifications include hospital-brand and brand-month-yearfixed-effects.
72

Table A16: Merger Treatment Effects on Price – Pooled, Alternate StandardError Calculations
Targets Acquirers
Panel A: Clustered at the Hospital X ProductNon-PPIs -0.006 -0.004
(0.008) (0.004)PPIs -0.034† 0.017†
(0.010) (0.006)
Panel B: Clustered at System X UMDNS CodeNon-PPIs -0.006 -0.004
(0.009) (0.006)PPIs -0.034† 0.017**
(0.013) (0.008)
Panel C: Clustered at Hospital X VendorNon-PPIs -0.006 -0.004
(0.010) (0.006)PPIs -0.034** 0.017**
(0.015) (0.007)
Panel D: Clustered by Hospital X Product (Wild Bootstrap)Non-PPIs -0.006 -0.004
(-0.018, 0.005) (-0.010, 0.003)PPIs -0.034† 0.017†
(-0.051, -0.020) (0.008, 0.026)
Notes: Authors’ calculations from PriceGuide data. * p < 0.10, ** p < 0.05, † p < 0.01. PanelsA-C report clustered standard errors in parentheses. Panel D reports 95% confidence intervalsgenerated from wild bootstrap clustered at the hospital-brand level (n = 1, 000) in parentheses.Coefficients estimated from pooled specifications (1). The dependent variable ln(Price) is thelogged transaction price measured at the hospital-brand-month-year. All specifications includehospital-brand and brand-month-year fixed-effects.
73
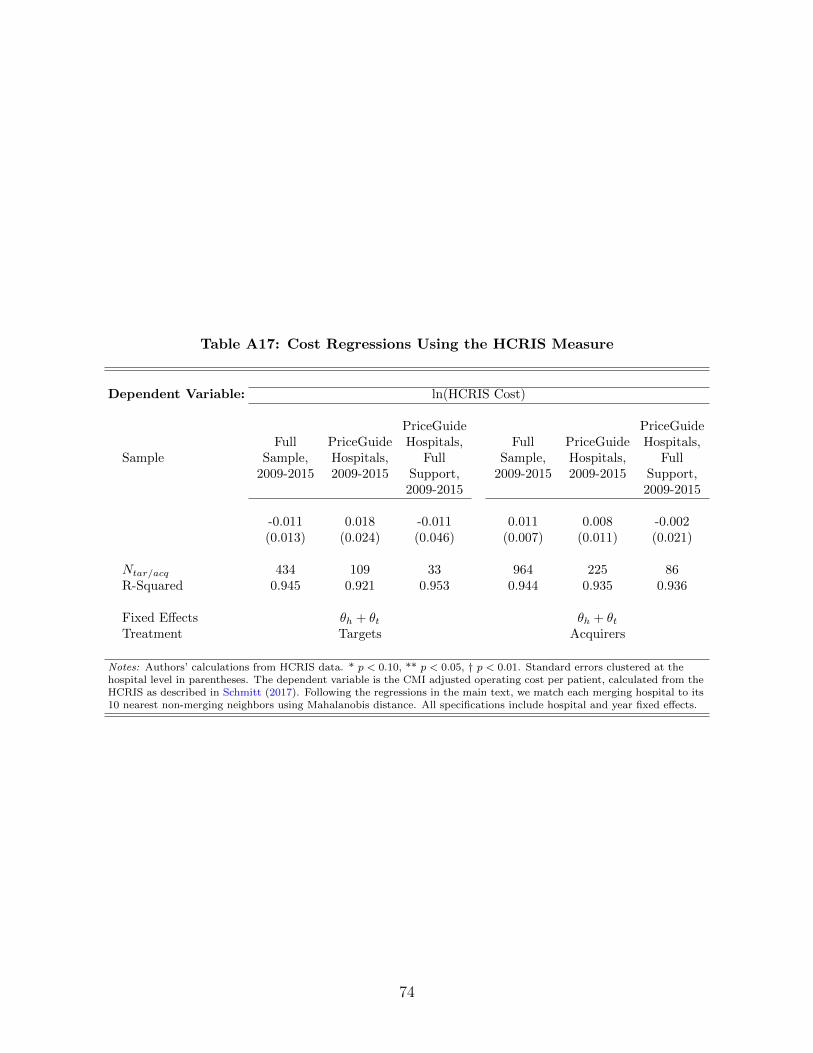
Table A17: Cost Regressions Using the HCRIS Measure
Dependent Variable: ln(HCRIS Cost)
SampleFull
Sample,2009-2015
PriceGuideHospitals,2009-2015
PriceGuideHospitals,
FullSupport,2009-2015
FullSample,
2009-2015
PriceGuideHospitals,2009-2015
PriceGuideHospitals,
FullSupport,2009-2015
-0.011 0.018 -0.011 0.011 0.008 -0.002(0.013) (0.024) (0.046) (0.007) (0.011) (0.021)
Ntar/acq 434 109 33 964 225 86R-Squared 0.945 0.921 0.953 0.944 0.935 0.936
Fixed Effects θh + θt θh + θtTreatment Targets Acquirers
Notes: Authors’ calculations from HCRIS data. * p < 0.10, ** p < 0.05, † p < 0.01. Standard errors clustered at thehospital level in parentheses. The dependent variable is the CMI adjusted operating cost per patient, calculated from theHCRIS as described in Schmitt (2017). Following the regressions in the main text, we match each merging hospital to its10 nearest non-merging neighbors using Mahalanobis distance. All specifications include hospital and year fixed effects.
74

Table A18: Merger Treatment Effects – Heterogeneity, Within Category
Targets AcquirersNtar β SE Nacq β SE
Panel A: Non-PPIsAcquirer Size
Small 13 0.005 (0.014) 26 -0.008 (0.007)Large 20 0.001 (0.016) 59 -0.014** (0.007)
Market ExposureIn HRR 14 -0.008 (0.012) 36 -0.012** (0.006)Out of HRR 19 0.012 (0.017) 49 -0.010 (0.008)
Vendor Market StructureHigh HHI 33 -0.009 (0.021) 85 -0.015** (0.006)Low HHI 33 0.012 (0.011) 85 -0.010 (0.007)
Controlling for Output PricePost-Merger 33 0.004 (0.012) 85 -0.014† (0.005)ln(Output Price) 0.009 (0.017) -0.015** (0.008)
Standardization InteractionPost-Merger 30 0.003 (0.011) 80 -0.014** (0.006)Post X Std. 0.003 (0.023) 0.012 (0.010)
Panel B: PPIsAcquirer Size
Small 12 -0.040† (0.013) 26 0.007 (0.006)Large 17 -0.036† (0.012) 48 0.018** (0.008)
Market ExposureIn HRR 12 -0.061† (0.015) 35 0.008 (0.006)Out of HRR 17 -0.017* (0.010) 39 0.022† (0.007)
Vendor Market StructureHigh HHI 29 -0.044† (0.013) 74 0.012* (0.007)Low HHI 29 -0.035† (0.011) 74 0.012* (0.007)
Controlling for Output PricePost-Merger 29 -0.037† (0.009) 74 0.011** (0.005)ln(Output Price) 0.036** (0.017) 0.006 (0.007)
Standardization InteractionPost-Merger 28 -0.048† (0.016) 65 0.007 (0.007)Post X Std. 0.023 (0.018) 0.012 (0.010)
Notes: Authors’ calculations from PriceGuide data. * p < 0.10, ** p < 0.05, † p < 0.01. Standard errors clustered at thehospital-brand level in parentheses. Coefficients estimated from pooled specification (2). The dependent variable is the loggedtransaction price measured at the hospital-brand-month-year. Small acquirers are hospital systems consisting of 1-3 hospitalspre-merger, and large acquirers are hospital systems with more than 3 hospitals. A target is categorized as “In HRR” if thereis at least one hospital in the acquiring system in the same HRR, and vice versa. A product category is classified as “High”concentration if its vendor HHI is above the median within its product class. ln(Output Price) is estimated using the HCRISas in Dafny et al. (2017). Standardization is an indicator for whether the hospital purchased at least 75% of all units in aproduct category from a single vendor in its first sample year.
75
Related Documents