mergermarket M&A league tables of financial advisers - Year End 2007 - January 02, 2008 Page 1 Contacts: Europe Nancy Costantinopoli (deal queries, submissions, etc.) [email protected] Hannah Bagshawe (PR) [email protected] Tel: +44 20 7059 6118 North America Jennifer Ruiz (deal queries, submissions, etc.) [email protected] Tel: +1 212-686-3016 Hannah Bagshawe (PR) [email protected] Tel: +44 20 7059 6118 Asia-Pacific Carrie Ho (deal queries, submissions etc) [email protected] Tel: + 852 2158 9725 Seye Im (PR) [email protected] Tel: +852 2158 9706 Table of Contents: Global League Tables and Data 2-4 European League Tables 5-13 North American Tables 14-17 Asia-Pacific League Tables 18-22 Global M&A Breakdown 23 Criteria 24 About mergermarket 25 mergermarket league tables of financial advisers to global M&A for Year End 2007 January 02, 2008

Welcome message from author
This document is posted to help you gain knowledge. Please leave a comment to let me know what you think about it! Share it to your friends and learn new things together.
Transcript
mergermarket M&A league tables of fi nancial advisers - Year End 2007 - January 02, 2008 Page 1
Contacts:
EuropeNancy Costantinopoli (deal queries, submissions, etc.)[email protected]
Hannah Bagshawe (PR)[email protected]: +44 20 7059 6118
North America Jennifer Ruiz (deal queries, submissions, etc.)[email protected]: +1 212-686-3016
Hannah Bagshawe (PR)[email protected]: +44 20 7059 6118
Asia-Pacifi cCarrie Ho (deal queries, submissions etc) [email protected] Tel: + 852 2158 9725
Seye Im (PR)[email protected]: +852 2158 9706
Table of Contents:
Global League Tables and Data 2-4European League Tables 5-13North American Tables 14-17Asia-Pacifi c League Tables 18-22Global M&A Breakdown 23Criteria 24About mergermarket 25
mergermarket league tables of fi nancial advisers to global M&A for Year End 2007
January 02, 2008
mergermarket M&A league tables of fi nancial advisers - Year End 2007 - January 02, 2008 Page 2
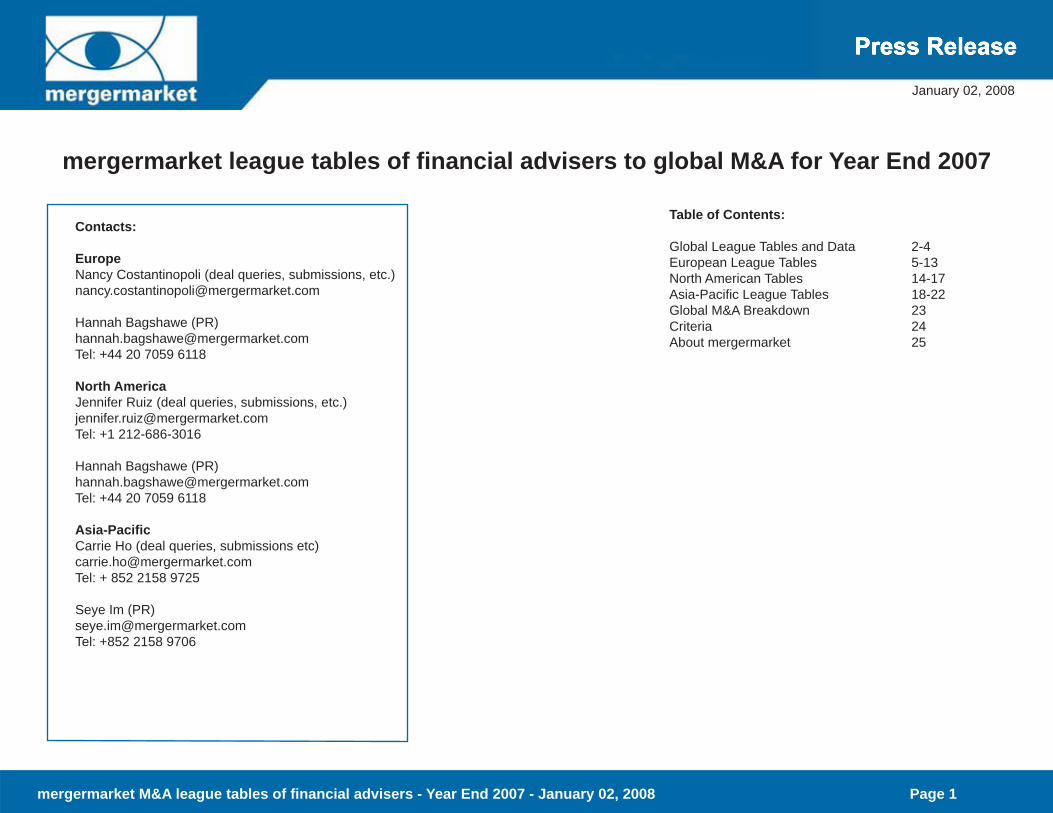
Global League Tables of Financial Advisers
League Table of Financial Advisers to Global M&A: Value League Table of Financial Advisers to Global M&A: Volume
Y/E 2006 Y/E 2007 Company NameValue
(USDm)No of Deals
1 1 Goldman Sachs 1,151,312 383
2 2 Morgan Stanley 1,016,651 283
3 3 Citigroup 976,600 386
4 4 JPMorgan 798,447 315
5 5 Merrill Lynch 774,265 292
7 6 UBS 724,297 353
9 7 Lehman Brothers 715,249 225
6 8 Credit Suisse 670,039 294
8 9 Deutsche Bank 620,428 207
11 10 Rothschild 374,868 307
10 11 Lazard 322,796 228
14 12 ABN AMRO 284,072 184
30 13 Greenhill & Co 205,993 36
13 14 Banc of America Securities 201,854 100
12 15 BNP Paribas 191,325 120
33 16 RBC Capital Markets 178,464 109
32 17 CIBC World Markets 150,203 101
34 18 Mediobanca 128,269 47
16 19 HSBC Bank 116,348 76
40 20 TD Securities 113,258 39
Y/E 2006 Y/E 2007 Company NameValue
(USDm)No of Deals
3 1 Citigroup 976,600 386
10 2 Goldman Sachs 1,151,312 383
2 3 KPMG Corp Fin 109,119 369
4 4 UBS 724,297 353
5 5 JPMorgan 798,447 315
8 6 Deloitte 87,296 310
6 7 Rothschild 374,868 307
7 8 Credit Suisse 670,039 294
12 9 Merrill Lynch 774,265 292
9 10 Morgan Stanley 1,016,651 283
1 11 PricewaterhouseCoopers Corp Fin 103,745 268
11 12 Ernst & Young 102,353 258
13 13 Lazard 322,796 228
16 14 Lehman Brothers 715,249 225
14 15 Deutsche Bank 620,428 207
15 16 ABN AMRO 284,072 184
18 17 M&A International Inc 5,779 121
21 18 BNP Paribas 191,325 120
19 19 Houlihan Lokey 54,357 114
28 20 RBC Capital Markets 178,464 109
mergermarket M&A league tables of fi nancial advisers - Year End 2007 - January 02, 2008 Page 3
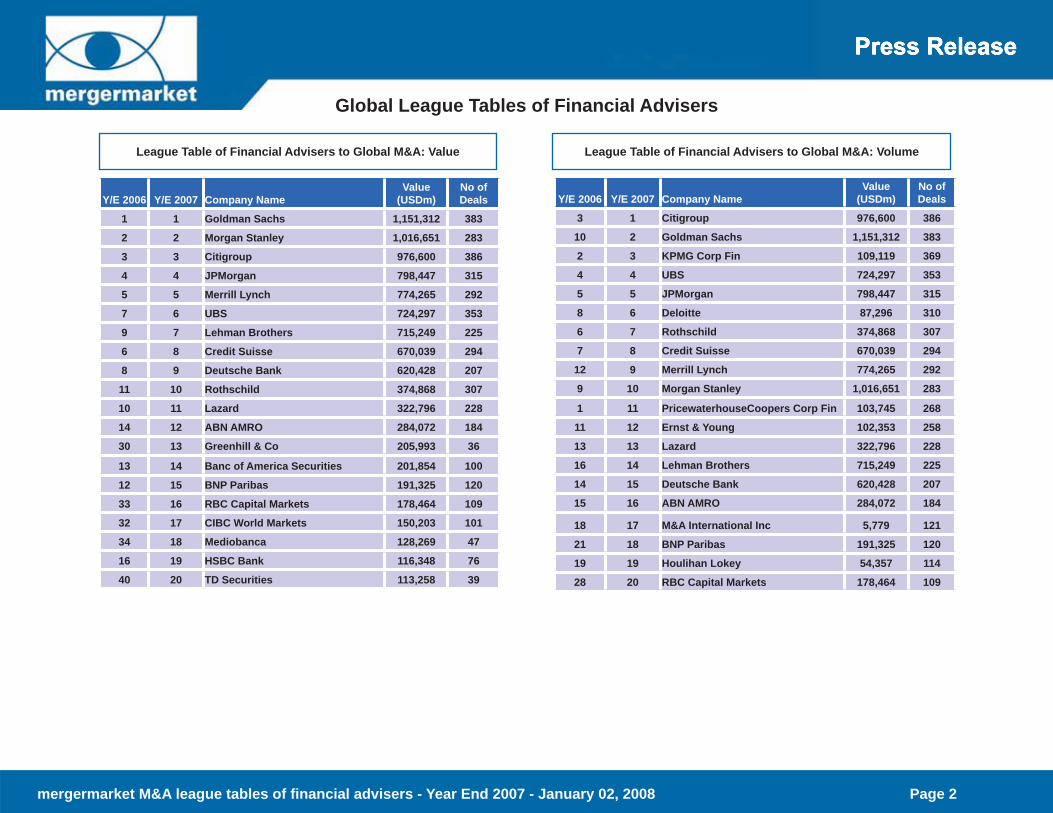
League Table of Financial Advisers to Global Buyouts: Value League Table of Financial Advisers to Global Buyouts: Volume
Global League Tables of Financial Advisers
Note: based on fi rms advising the bidder on buyout deals
Y/E 2006 Y/E 2007 Company NameValue
(USDm)No of Deals
1 1 Citigroup 285,954 54
6 2 Goldman Sachs 190,146 41
3 3 Deutsche Bank 177,215 27
10 4 Lehman Brothers 146,510 30
7 5 Morgan Stanley 136,114 31
9 6 Merrill Lynch 126,274 28
5 7 JPMorgan 123,303 28
4 8 Banc of America Securities 92,468 13
2 9 Credit Suisse 84,881 42
- 10 TD Securities 48,471 3
19 11 Royal Bank of Scotland Group 48,059 1
28 12 HSBC Bank 47,312 6
14 13 UBS 44,086 37
23 14 PricewaterhouseCoopers Corp Fin 41,155 62
22 15 Deloitte 36,383 63
12 16 Macquarie Group 32,653 21
13 17 Bear, Stearns & Co 31,279 9
41 18 UniCredit Group 30,986 7
8 19 Wachovia Corporation 23,952 9
44 20 Perella Weinberg Partners 21,912 3
Y/E 2006 Y/E 2007 Company NameValue
(USDm)No of Deals
2 1 Deloitte 36,383 63
1 2 PricewaterhouseCoopers Corp Fin 41,155 62
5 3 Citigroup 285,954 54
3 4 KPMG Corp Fin 9,437 54
4 5 Ernst & Young 9,077 46
6 6 Credit Suisse 84,881 42
16 7 Goldman Sachs 190,146 41
7 8 UBS 44,086 37
10 9 Morgan Stanley 136,114 31
11 10 Lehman Brothers 146,510 30
13 11 Merrill Lynch 126,274 28
9 12 JPMorgan 123,303 28
8 13 Rothschild 12,434 28
12 14 Deutsche Bank 177,215 27
17 15 Grant Thornton Corporate Finance 1,386 22
18 16 Macquarie Group 32,653 21
20 17 BDO Corporate Finance 953 18
15 18 Lazard 11,069 16
14 19 ABN AMRO 11,720 14
19 20 Banc of America Securities 92,468 13
mergermarket M&A league tables of fi nancial advisers - Year End 2007 - January 02, 2008 Page 4
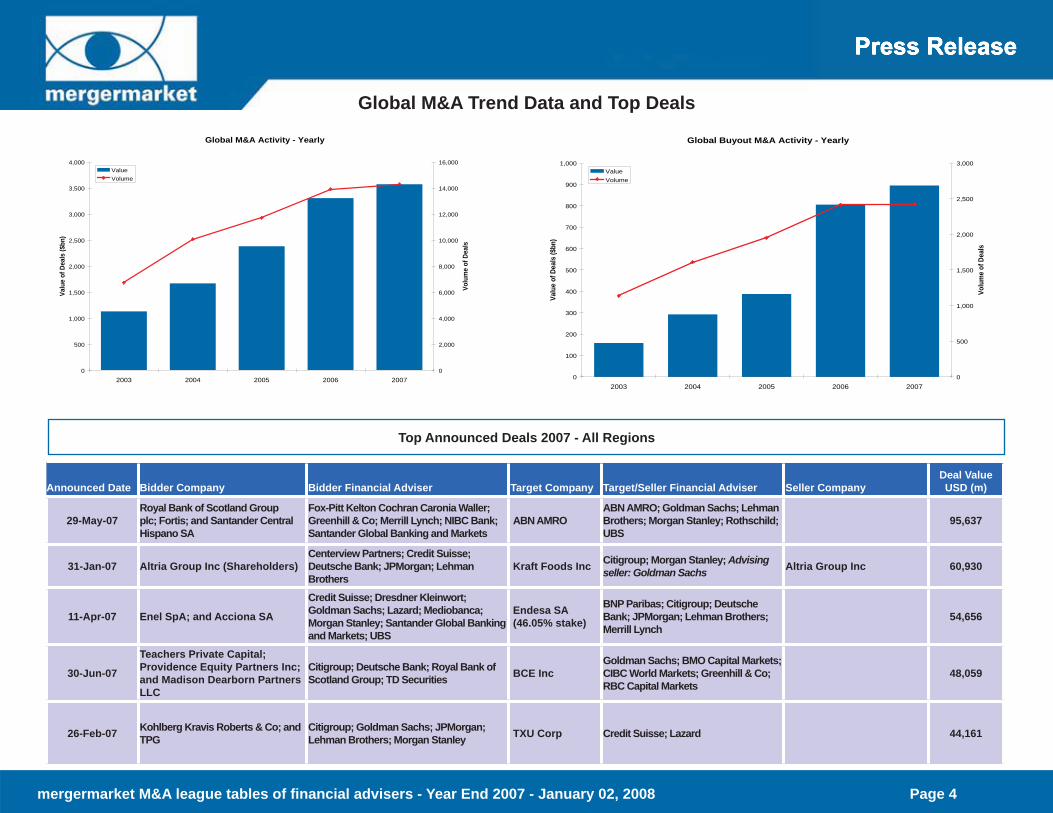
Global M&A Trend Data and Top Deals
Top Announced Deals 2007 - All Regions
Announced Date Bidder Company Bidder Financial Adviser Target Company Target/Seller Financial Adviser Seller CompanyDeal Value USD (m)
29-May-07Royal Bank of Scotland Group plc; Fortis; and Santander Central Hispano SA
Fox-Pitt Kelton Cochran Caronia Waller; Greenhill & Co; Merrill Lynch; NIBC Bank; Santander Global Banking and Markets
ABN AMROABN AMRO; Goldman Sachs; Lehman Brothers; Morgan Stanley; Rothschild; UBS
95,637
31-Jan-07 Altria Group Inc (Shareholders)Centerview Partners; Credit Suisse; Deutsche Bank; JPMorgan; Lehman Brothers
Kraft Foods Inc Citigroup; Morgan Stanley; Advising seller: Goldman Sachs Altria Group Inc 60,930
11-Apr-07 Enel SpA; and Acciona SA
Credit Suisse; Dresdner Kleinwort; Goldman Sachs; Lazard; Mediobanca; Morgan Stanley; Santander Global Banking and Markets; UBS
Endesa SA (46.05% stake)
BNP Paribas; Citigroup; Deutsche Bank; JPMorgan; Lehman Brothers; Merrill Lynch
54,656
30-Jun-07
Teachers Private Capital; Providence Equity Partners Inc; and Madison Dearborn Partners LLC
Citigroup; Deutsche Bank; Royal Bank of Scotland Group; TD Securities BCE Inc
Goldman Sachs; BMO Capital Markets; CIBC World Markets; Greenhill & Co; RBC Capital Markets
48,059
26-Feb-07 Kohlberg Kravis Roberts & Co; and TPG
Citigroup; Goldman Sachs; JPMorgan; Lehman Brothers; Morgan Stanley TXU Corp Credit Suisse; Lazard 44,161
Global Buyout M&A Activity - Yearly
0
100
200
300
400
500
600
700
800
900
1,000
2003 2004 2005 2006 2007
Valu
e of
Dea
ls ($
bn)
0
500
1,000
1,500
2,000
2,500
3,000
Volu
me
of D
eals
ValueVolume
Global M&A Activity - Yearly
0
500
1,000
1,500
2,000
2,500
3,000
3,500
4,000
2003 2004 2005 2006 2007
Valu
e of
Dea
ls ($
bn)
0
2,000
4,000
6,000
8,000
10,000
12,000
14,000
16,000
Volu
me
of D
eals
ValueVolume
mergermarket M&A league tables of fi nancial advisers - Year End 2007 - January 02, 2008 Page 5
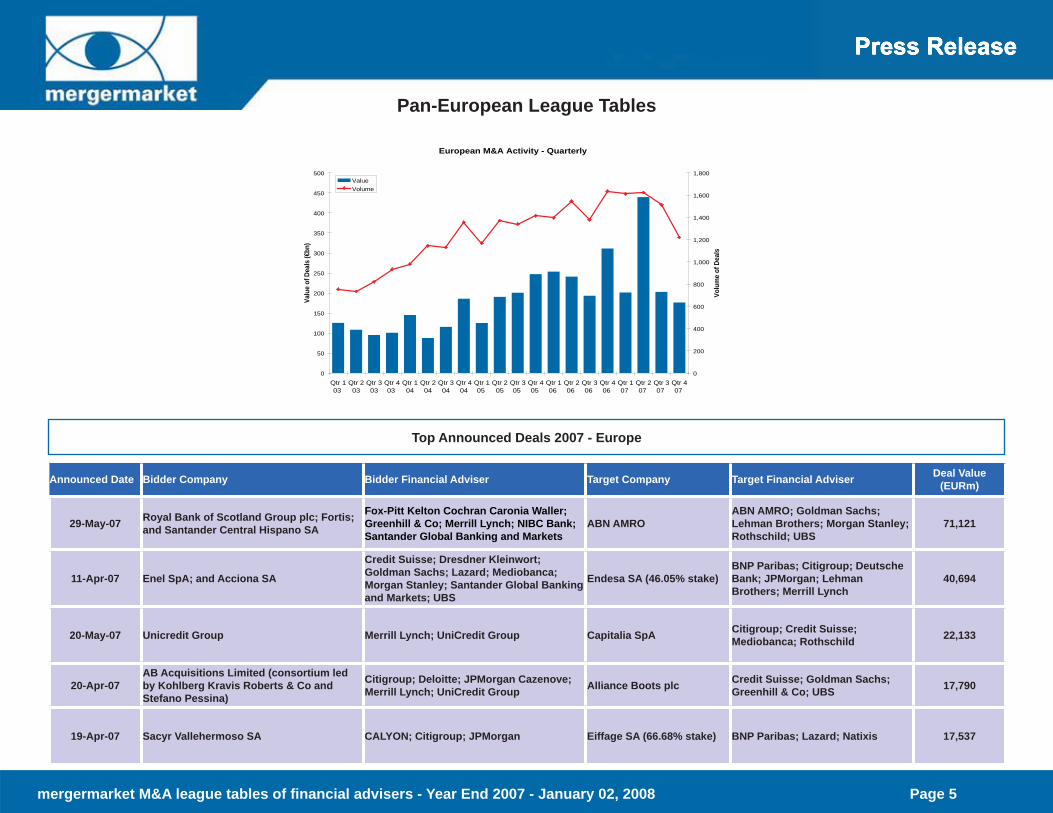
Pan-European League Tables
Top Announced Deals 2007 - Europe
Announced Date Bidder Company Bidder Financial Adviser Target Company Target Financial Adviser Deal Value (EURm)
29-May-07 Royal Bank of Scotland Group plc; Fortis; and Santander Central Hispano SA
Fox-Pitt Kelton Cochran Caronia Waller; Greenhill & Co; Merrill Lynch; NIBC Bank; Santander Global Banking and Markets
ABN AMROABN AMRO; Goldman Sachs; Lehman Brothers; Morgan Stanley; Rothschild; UBS
71,121
11-Apr-07 Enel SpA; and Acciona SA
Credit Suisse; Dresdner Kleinwort; Goldman Sachs; Lazard; Mediobanca; Morgan Stanley; Santander Global Banking and Markets; UBS
Endesa SA (46.05% stake)BNP Paribas; Citigroup; Deutsche Bank; JPMorgan; Lehman Brothers; Merrill Lynch
40,694
20-May-07 Unicredit Group Merrill Lynch; UniCredit Group Capitalia SpA Citigroup; Credit Suisse; Mediobanca; Rothschild 22,133
20-Apr-07AB Acquisitions Limited (consortium led by Kohlberg Kravis Roberts & Co and Stefano Pessina)
Citigroup; Deloitte; JPMorgan Cazenove; Merrill Lynch; UniCredit Group Alliance Boots plc Credit Suisse; Goldman Sachs;
Greenhill & Co; UBS 17,790
19-Apr-07 Sacyr Vallehermoso SA CALYON; Citigroup; JPMorgan Eiffage SA (66.68% stake) BNP Paribas; Lazard; Natixis 17,537
European M&A Activity - Quarterly
0
50
100
150
200
250
300
350
400
450
500
Qtr 103
Qtr 203
Qtr 303
Qtr 403
Qtr 104
Qtr 204
Qtr 304
Qtr 404
Qtr 105
Qtr 205
Qtr 305
Qtr 405
Qtr 106
Qtr 206
Qtr 306
Qtr 406
Qtr 107
Qtr 207
Qtr 307
Qtr 407
Valu
e of
Dea
ls (€
bn)
0
200
400
600
800
1,000
1,200
1,400
1,600
1,800
Volu
me
of D
eals
ValueVolume

mergermarket M&A league tables of fi nancial advisers - Year End 2007 - January 02, 2008 Page 6
Pan-European League Tables
League Table of Financial Advisers to European M&A: Value League Table of Financial Advisers to European M&A: Volume
Y/E 2006 Y/E 2007 Company NameValue
(EURm)No of Deals
1 1 Morgan Stanley 444,732 141
2 2 Goldman Sachs 418,328 151
5 3 UBS 384,316 180
4 4 Citigroup 381,652 149
6 5 Merrill Lynch 363,034 126
3 6 JPMorgan 302,691 135
7 7 Rothschild 261,175 258
8 8 Deutsche Bank 247,957 131
9 9 Credit Suisse 245,744 118
16 10 Lehman Brothers 241,087 78
13 11 ABN AMRO 183,741 142
10 12 BNP Paribas 133,312 90
11 13 Lazard 127,011 130
24 14 Mediobanca 94,056 47
18 15 Dresdner Kleinwort 81,590 50
25 16 Santander Global Banking and Markets 77,723 13
65 17 Perella Weinberg Partners 76,350 10
28 18 Greenhill & Co 74,949 21
70 19 RBC Capital Markets 67,199 28
31 20 Ernst & Young 64,058 200
Y/E 2006 Y/E 2007 Company NameValue
(EURm)No of Deals
1 1 KPMG Corp Fin 59,907 272
4 2 Deloitte 60,685 271
3 3 Rothschild 261,175 258
5 4 Ernst & Young 64,058 200
2 5 PricewaterhouseCoopers Corp Fin 55,592 185
9 6 UBS 384,316 180
15 7 Goldman Sachs 418,328 151
8 8 Citigroup 381,652 149
11 9 ABN AMRO 183,741 142
10 10 Morgan Stanley 444,732 141
7 11 JPMorgan 302,691 135
13 12 Deutsche Bank 247,957 131
6 13 Lazard 127,011 130
12 14 Merrill Lynch 363,034 126
14 15 Credit Suisse 245,744 118
17 16 BNP Paribas 133,312 90
18 17 M&A International Inc 2,733 84
22 18 Lehman Brothers 241,087 78
21 19 Grant Thornton Corporate Finance 7,414 66
19 20 Close Brothers Group 9,858 65
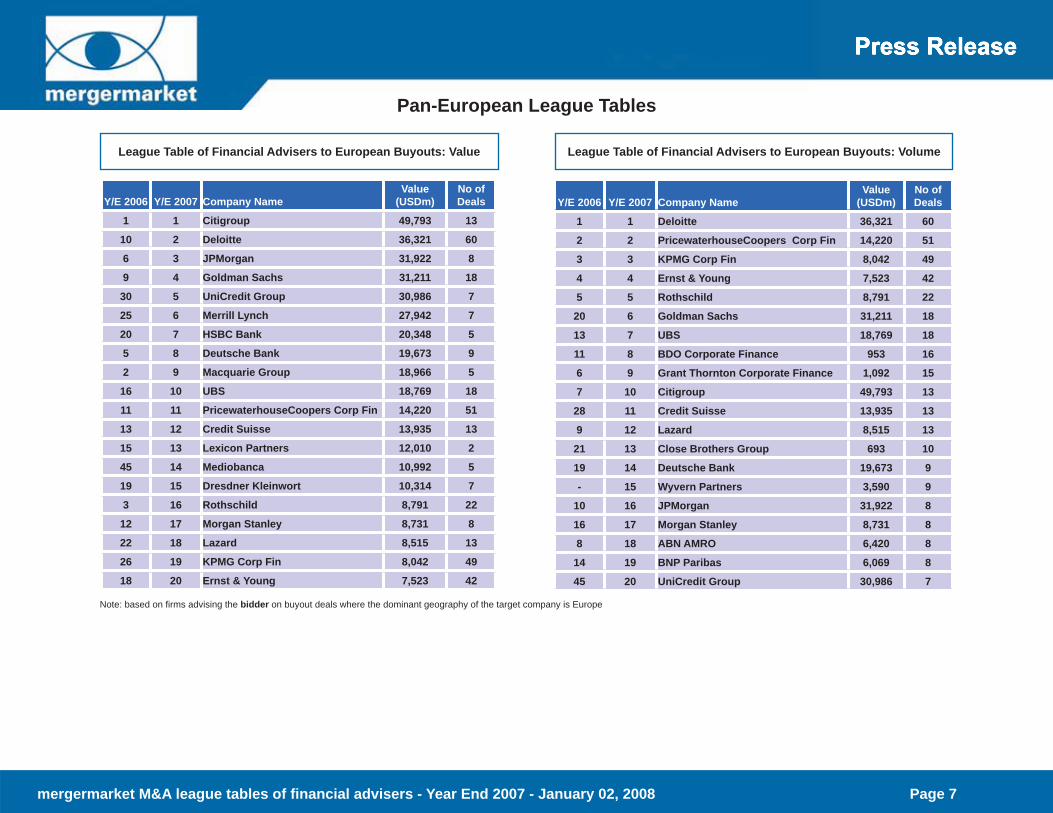
mergermarket M&A league tables of fi nancial advisers - Year End 2007 - January 02, 2008 Page 7
League Table of Financial Advisers to European Buyouts: Value League Table of Financial Advisers to European Buyouts: Volume
Pan-European League Tables
Note: based on fi rms advising the bidder on buyout deals where the dominant geography of the target company is Europe
Y/E 2006 Y/E 2007 Company NameValue
(USDm)No of Deals
1 1 Citigroup 49,793 13
10 2 Deloitte 36,321 60
6 3 JPMorgan 31,922 8
9 4 Goldman Sachs 31,211 18
30 5 UniCredit Group 30,986 7
25 6 Merrill Lynch 27,942 7
20 7 HSBC Bank 20,348 5
5 8 Deutsche Bank 19,673 9
2 9 Macquarie Group 18,966 5
16 10 UBS 18,769 18
11 11 PricewaterhouseCoopers Corp Fin 14,220 51
13 12 Credit Suisse 13,935 13
15 13 Lexicon Partners 12,010 2
45 14 Mediobanca 10,992 5
19 15 Dresdner Kleinwort 10,314 7
3 16 Rothschild 8,791 22
12 17 Morgan Stanley 8,731 8
22 18 Lazard 8,515 13
26 19 KPMG Corp Fin 8,042 49
18 20 Ernst & Young 7,523 42
Y/E 2006 Y/E 2007 Company NameValue
(USDm)No of Deals
1 1 Deloitte 36,321 60
2 2 PricewaterhouseCoopers Corp Fin 14,220 51
3 3 KPMG Corp Fin 8,042 49
4 4 Ernst & Young 7,523 42
5 5 Rothschild 8,791 22
20 6 Goldman Sachs 31,211 18
13 7 UBS 18,769 18
11 8 BDO Corporate Finance 953 16
6 9 Grant Thornton Corporate Finance 1,092 15
7 10 Citigroup 49,793 13
28 11 Credit Suisse 13,935 13
9 12 Lazard 8,515 13
21 13 Close Brothers Group 693 10
19 14 Deutsche Bank 19,673 9
- 15 Wyvern Partners 3,590 9
10 16 JPMorgan 31,922 8
16 17 Morgan Stanley 8,731 8
8 18 ABN AMRO 6,420 8
14 19 BNP Paribas 6,069 8
45 20 UniCredit Group 30,986 7
mergermarket M&A league tables of fi nancial advisers - Year End 2007 - January 02, 2008 Page 8
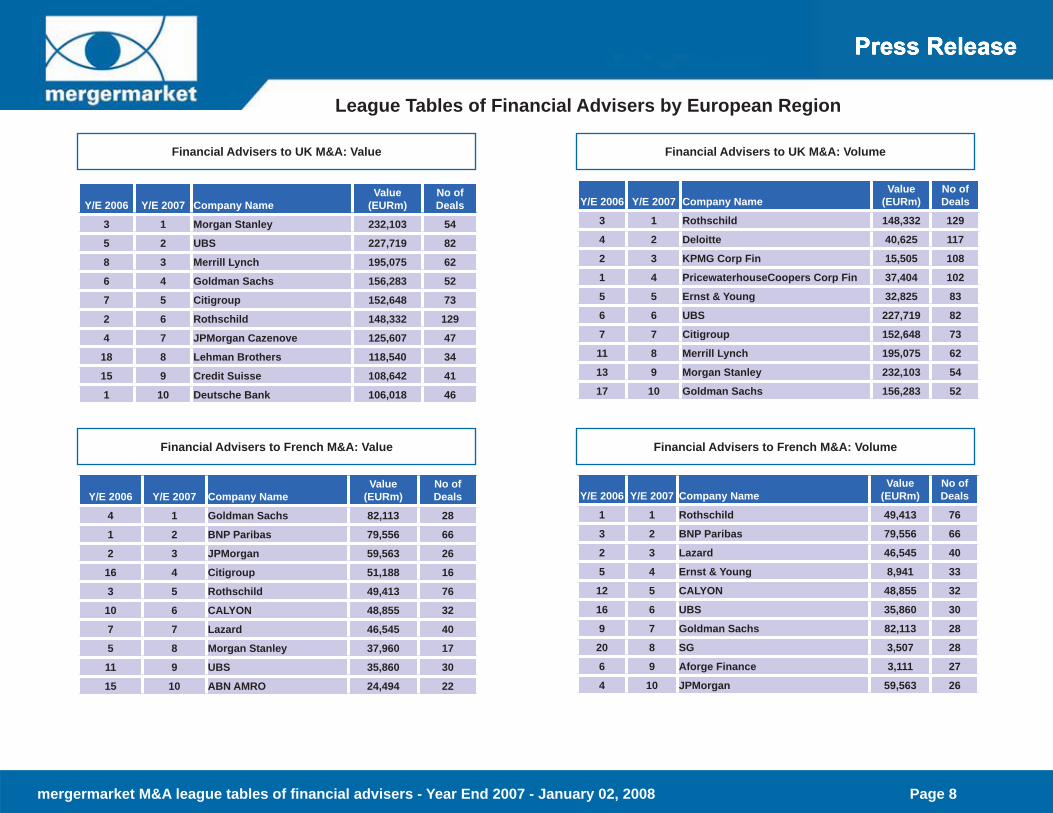
League Tables of Financial Advisers by European Region
Financial Advisers to UK M&A: Value
Financial Advisers to French M&A: Value
Financial Advisers to UK M&A: Volume
Financial Advisers to French M&A: Volume
Y/E 2006 Y/E 2007 Company NameValue
(EURm)No of Deals
3 1 Morgan Stanley 232,103 54
5 2 UBS 227,719 82
8 3 Merrill Lynch 195,075 62
6 4 Goldman Sachs 156,283 52
7 5 Citigroup 152,648 73
2 6 Rothschild 148,332 129
4 7 JPMorgan Cazenove 125,607 47
18 8 Lehman Brothers 118,540 34
15 9 Credit Suisse 108,642 41
1 10 Deutsche Bank 106,018 46
Y/E 2006 Y/E 2007 Company NameValue
(EURm)No of Deals
3 1 Rothschild 148,332 129
4 2 Deloitte 40,625 117
2 3 KPMG Corp Fin 15,505 108
1 4 PricewaterhouseCoopers Corp Fin 37,404 102
5 5 Ernst & Young 32,825 83
6 6 UBS 227,719 82
7 7 Citigroup 152,648 73
11 8 Merrill Lynch 195,075 62
13 9 Morgan Stanley 232,103 54
17 10 Goldman Sachs 156,283 52
Y/E 2006 Y/E 2007 Company NameValue
(EURm)No of Deals
4 1 Goldman Sachs 82,113 28
1 2 BNP Paribas 79,556 66
2 3 JPMorgan 59,563 26
16 4 Citigroup 51,188 16
3 5 Rothschild 49,413 76
10 6 CALYON 48,855 32
7 7 Lazard 46,545 40
5 8 Morgan Stanley 37,960 17
11 9 UBS 35,860 30
15 10 ABN AMRO 24,494 22
Y/E 2006 Y/E 2007 Company NameValue
(EURm)No of Deals
1 1 Rothschild 49,413 76
3 2 BNP Paribas 79,556 66
2 3 Lazard 46,545 40
5 4 Ernst & Young 8,941 33
12 5 CALYON 48,855 32
16 6 UBS 35,860 30
9 7 Goldman Sachs 82,113 28
20 8 SG 3,507 28
6 9 Aforge Finance 3,111 27
4 10 JPMorgan 59,563 26

mergermarket M&A league tables of fi nancial advisers - Year End 2007 - January 02, 2008 Page 9
Financial Advisers to German M&A: Value Financial Advisers to German M&A: Volume
Financial Advisers to Spanish M&A: Value Financial Advisers to Spanish M&A: Volume
League Tables of Financial Advisers by European Region
Y/E 2006 Y/E 2007 Company NameValue
(EURm)No of Deals
6 1 Goldman Sachs 70,592 29
2 2 Deutsche Bank 58,416 46
1 3 Morgan Stanley 56,556 27
8 4 UBS 44,605 33
17 5 Ernst & Young 43,901 60
14 6 Rothschild 38,190 42
3 7 Citigroup 34,911 17
5 8 JPMorgan 33,422 19
13 9 Lehman Brothers 25,931 12
12 10 Lazard 25,237 30
Y/E 2006 Y/E 2007 Company NameValue
(EURm)No of Deals
1 1 Ernst & Young 43,901 60
2 2 Deutsche Bank 58,416 46
3 3 Rothschild 38,190 42
4 4 KPMG Corp Fin 18,561 42
12 5 UBS 44,605 33
5 6 Lazard 25,237 30
22 7 Goldman Sachs 70,592 29
15 8 Morgan Stanley 56,556 27
24 9 ABN AMRO 7,048 22
9 10 Sal Oppenheim jr & Cie 6,115 20
Y/E 2006 Y/E 2007 Company NameValue
(EURm)No of Deals
2 1 Citigroup 105,625 14
9 2 JPMorgan 95,233 15
20 3 Lehman Brothers 67,792 7
1 4 Morgan Stanley 66,392 10
15 5 BNP Paribas 63,638 9
12 6 Credit Suisse 58,948 8
13 7 Merrill Lynch 58,537 6
16 8 Santander Global Banking and Markets 54,671 10
4 9 UBS 48,442 12
11 10 Goldman Sachs 45,384 10
Y/E 2006 Y/E 2007 Company NameValue
(EURm)No of Deals
16 1 Deloitte 5,247 46
1 2 KPMG Corp Fin 4,273 37
3 3 Atlas Capital Close Brothers 941 19
10 4 JPMorgan 95,233 15
12 5 Citigroup 105,625 14
28 6 ABN AMRO 7,314 13
8 7 PricewaterhouseCoopers Corp Fin 849 13
19 8 UBS 48,442 12
5 9 Socios Financieros 1,372 12
7 10 Rothschild 20,032 11
mergermarket M&A league tables of fi nancial advisers - Year End 2007 - January 02, 2008 Page 10
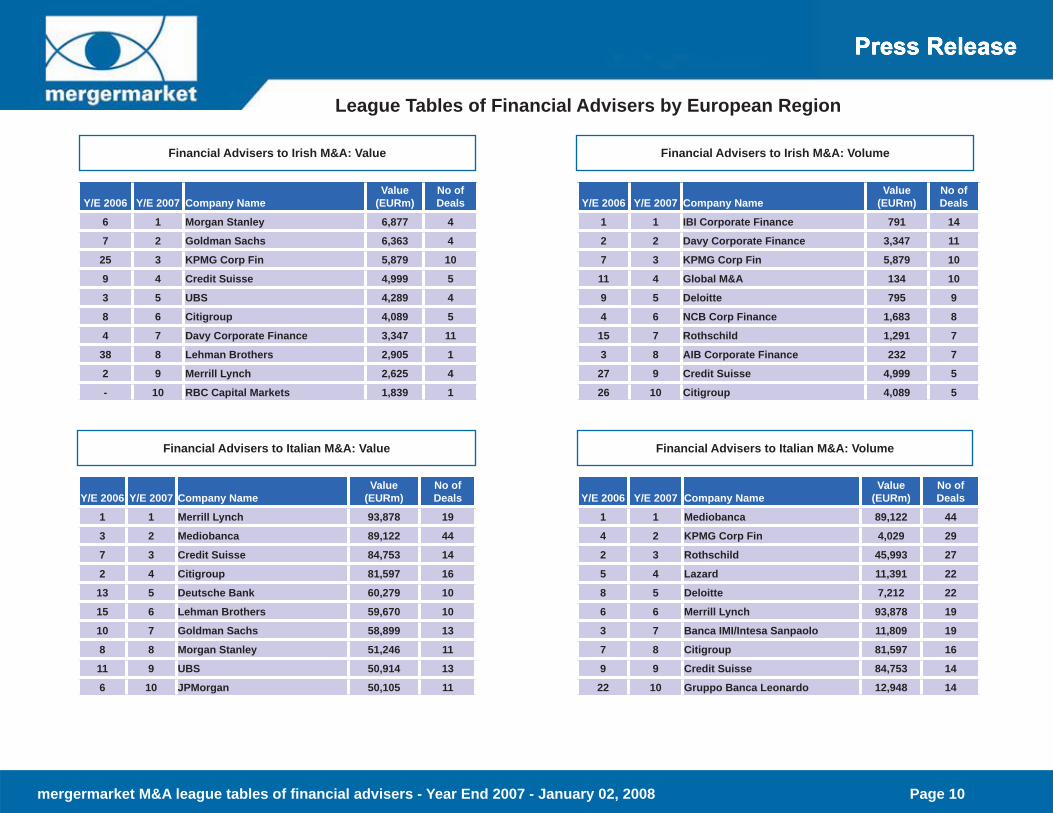
League Tables of Financial Advisers by European Region
Financial Advisers to Irish M&A: Value Financial Advisers to Irish M&A: Volume
Financial Advisers to Italian M&A: Value Financial Advisers to Italian M&A: Volume
Y/E 2006 Y/E 2007 Company NameValue
(EURm)No of Deals
6 1 Morgan Stanley 6,877 4
7 2 Goldman Sachs 6,363 4
25 3 KPMG Corp Fin 5,879 10
9 4 Credit Suisse 4,999 5
3 5 UBS 4,289 4
8 6 Citigroup 4,089 5
4 7 Davy Corporate Finance 3,347 11
38 8 Lehman Brothers 2,905 1
2 9 Merrill Lynch 2,625 4
- 10 RBC Capital Markets 1,839 1
Y/E 2006 Y/E 2007 Company NameValue
(EURm)No of Deals
1 1 IBI Corporate Finance 791 14
2 2 Davy Corporate Finance 3,347 11
7 3 KPMG Corp Fin 5,879 10
11 4 Global M&A 134 10
9 5 Deloitte 795 9
4 6 NCB Corp Finance 1,683 8
15 7 Rothschild 1,291 7
3 8 AIB Corporate Finance 232 7
27 9 Credit Suisse 4,999 5
26 10 Citigroup 4,089 5
Y/E 2006 Y/E 2007 Company NameValue
(EURm)No of Deals
1 1 Merrill Lynch 93,878 19
3 2 Mediobanca 89,122 44
7 3 Credit Suisse 84,753 14
2 4 Citigroup 81,597 16
13 5 Deutsche Bank 60,279 10
15 6 Lehman Brothers 59,670 10
10 7 Goldman Sachs 58,899 13
8 8 Morgan Stanley 51,246 11
11 9 UBS 50,914 13
6 10 JPMorgan 50,105 11
Y/E 2006 Y/E 2007 Company NameValue
(EURm)No of Deals
1 1 Mediobanca 89,122 44
4 2 KPMG Corp Fin 4,029 29
2 3 Rothschild 45,993 27
5 4 Lazard 11,391 22
8 5 Deloitte 7,212 22
6 6 Merrill Lynch 93,878 19
3 7 Banca IMI/Intesa Sanpaolo 11,809 19
7 8 Citigroup 81,597 16
9 9 Credit Suisse 84,753 14
22 10 Gruppo Banca Leonardo 12,948 14

mergermarket M&A league tables of fi nancial advisers - Year End 2007 - January 02, 2008 Page 11
Financial Advisers to Nordic M&A: Value Financial Advisers to Nordic M&A: Volume
League Tables of Financial Advisers by European Region
Financial Advisers to Swedish M&A: Value Financial Advisers to Swedish M&A: Volume
League Tables of Financial Advisers by European Region
Y/E 2006 Y/E 2007 Company NameValue
(EURm)No of Deals
3 1 Goldman Sachs 19,376 17
13 2 Merrill Lynch 13,841 12
21 3 Handelsbanken Capital Markets 13,637 23
1 4 Morgan Stanley 12,048 11
2 5 Citigroup 11,807 9
8 6 JPMorgan 11,334 12
6 7 Deutsche Bank 10,461 12
16 8 ABG Sundal Collier 9,849 17
4 9 UBS 9,808 23
7 10 SEB Enskilda 8,019 40
Y/E 2006 Y/E 2007 Company NameValue
(EURm)No of Deals
1 1 SEB Enskilda 8,019 40
4 2 Carnegie Group 4,020 31
2 3 Ernst & Young 5,495 28
5 4 Deloitte 2,045 27
6 5 KPMG Corp Fin 3,685 25
3 6 PricewaterhouseCoopers Corp Fin 4,971 24
12 7 Handelsbanken Capital Markets 13,637 23
10 8 UBS 9,808 23
15 9 Nordea Corporate Finance 1,558 20
8 10 Danske Markets Corporate Finance 850 20
Y/E 2006 Y/E 2007 Company NameValue
(EURm)No of Deals
16 1 Handelsbanken Capital Markets 11,997 19
10 2 Goldman Sachs 11,896 9
3 3 Morgan Stanley 9,357 6
5 4 UBS 6,695 17
26 5 ABG Sundal Collier 6,095 8
33 6 Greenhill & Co 6,022 2
28 7 RBC Capital Markets 6,022 1
20 8 Credit Suisse 4,669 2
- 9 HSBC Bank 4,296 4
2 10 Deutsche Bank 4,176 6
Y/E 2006 Y/E 2007 Company Name
Value (EURm)
No of Deals
1 1 SEB Enskilda 4,164 21
6 2 Handelsbanken Capital Markets 11,997 19
7 3 UBS 6,695 17
4 4 Carnegie Group 1,240 16
2 5 Ernst & Young 3,818 14
5 6 KPMG Corp Fin 1,647 14
3 7 PricewaterhouseCoopers Corp Fin 3,079 11
15 8 Lazard 1,339 11
9 9 M&A International Inc 104 11
27 10 Goldman Sachs 11,896 9
mergermarket M&A league tables of fi nancial advisers - Year End 2007 - January 02, 2008 Page 12
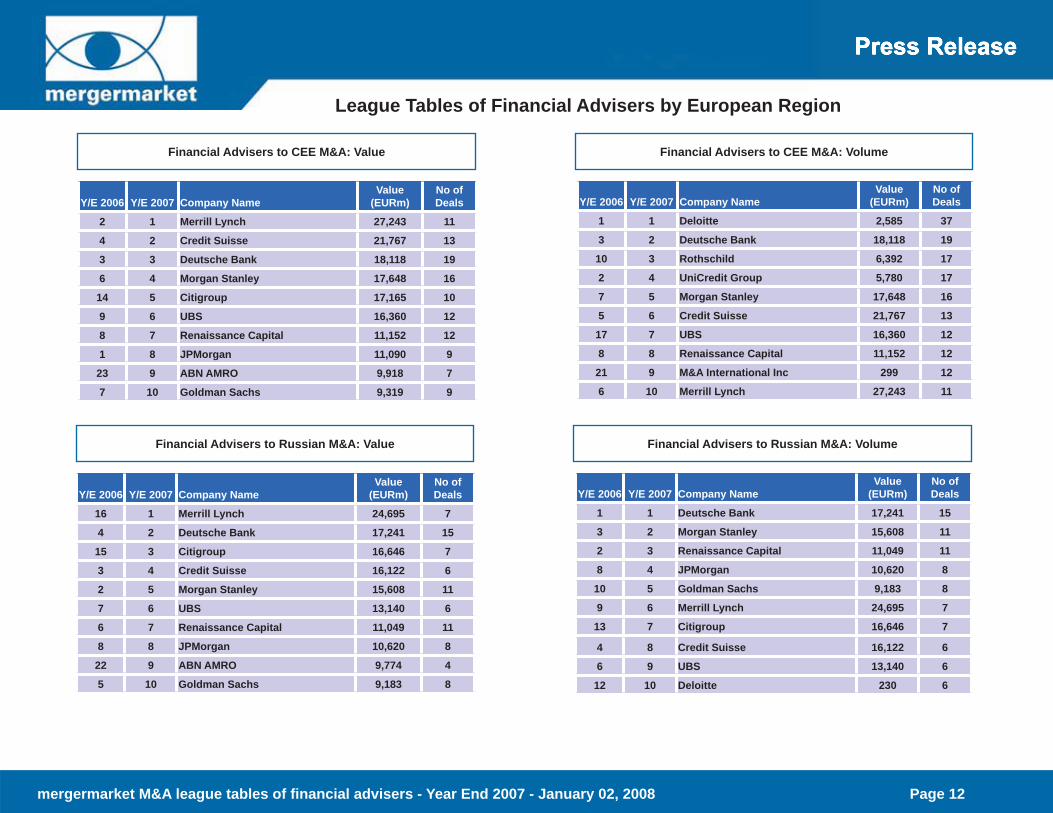
Financial Advisers to CEE M&A: Value Financial Advisers to CEE M&A: Volume
League Tables of Financial Advisers by European Region
Y/E 2006 Y/E 2007 Company NameValue
(EURm)No of Deals
2 1 Merrill Lynch 27,243 11
4 2 Credit Suisse 21,767 13
3 3 Deutsche Bank 18,118 19
6 4 Morgan Stanley 17,648 16
14 5 Citigroup 17,165 10
9 6 UBS 16,360 12
8 7 Renaissance Capital 11,152 12
1 8 JPMorgan 11,090 9
23 9 ABN AMRO 9,918 7
7 10 Goldman Sachs 9,319 9
Y/E 2006 Y/E 2007 Company NameValue
(EURm)No of Deals
1 1 Deloitte 2,585 37
3 2 Deutsche Bank 18,118 19
10 3 Rothschild 6,392 17
2 4 UniCredit Group 5,780 17
7 5 Morgan Stanley 17,648 16
5 6 Credit Suisse 21,767 13
17 7 UBS 16,360 12
8 8 Renaissance Capital 11,152 12
21 9 M&A International Inc 299 12
6 10 Merrill Lynch 27,243 11
Y/E 2006 Y/E 2007 Company NameValue
(EURm)No of Deals
1 1 Deutsche Bank 17,241 15
3 2 Morgan Stanley 15,608 11
2 3 Renaissance Capital 11,049 11
8 4 JPMorgan 10,620 8
10 5 Goldman Sachs 9,183 8
9 6 Merrill Lynch 24,695 7
13 7 Citigroup 16,646 7
4 8 Credit Suisse 16,122 6
6 9 UBS 13,140 6
12 10 Deloitte 230 6
Y/E 2006 Y/E 2007 Company NameValue
(EURm)No of Deals
16 1 Merrill Lynch 24,695 7
4 2 Deutsche Bank 17,241 15
15 3 Citigroup 16,646 7
3 4 Credit Suisse 16,122 6
2 5 Morgan Stanley 15,608 11
7 6 UBS 13,140 6
6 7 Renaissance Capital 11,049 11
8 8 JPMorgan 10,620 8
22 9 ABN AMRO 9,774 4
5 10 Goldman Sachs 9,183 8
Financial Advisers to Russian M&A: Value Financial Advisers to Russian M&A: Volume
mergermarket M&A league tables of fi nancial advisers - Year End 2007 - January 02, 2008 Page 13
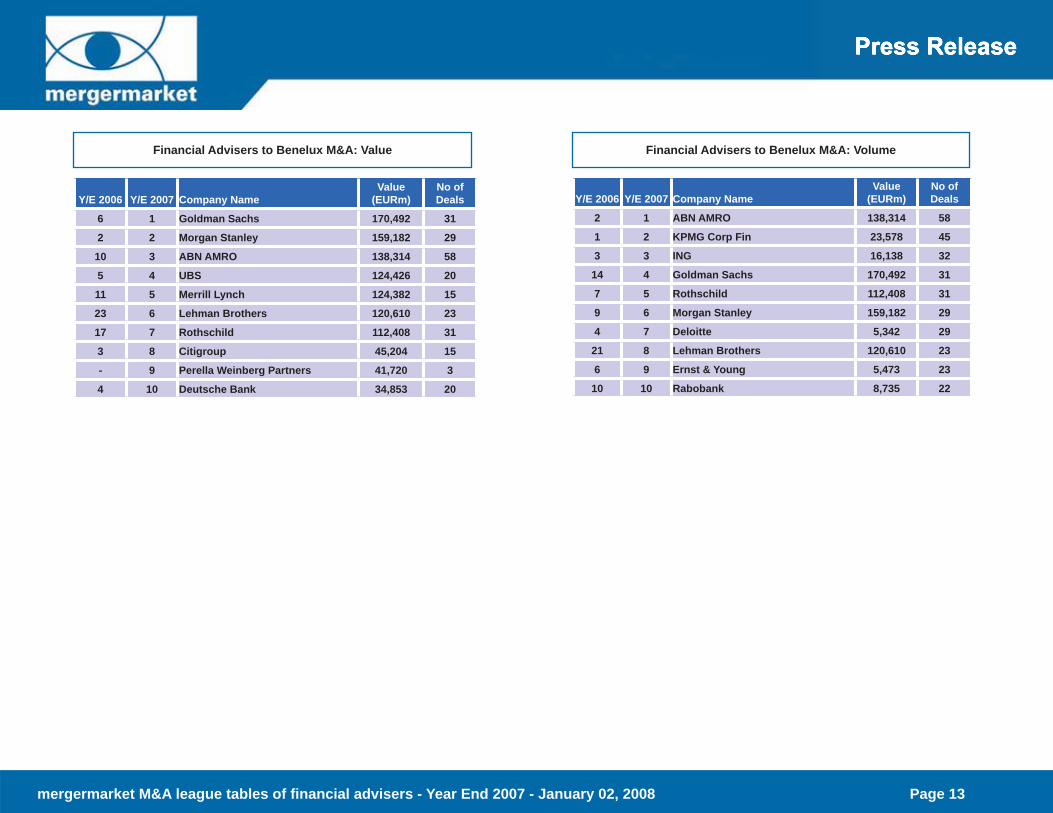
Financial Advisers to Benelux M&A: Value Financial Advisers to Benelux M&A: Volume
Y/E 2006 Y/E 2007 Company NameValue
(EURm)No of Deals
6 1 Goldman Sachs 170,492 31
2 2 Morgan Stanley 159,182 29
10 3 ABN AMRO 138,314 58
5 4 UBS 124,426 20
11 5 Merrill Lynch 124,382 15
23 6 Lehman Brothers 120,610 23
17 7 Rothschild 112,408 31
3 8 Citigroup 45,204 15
- 9 Perella Weinberg Partners 41,720 3
4 10 Deutsche Bank 34,853 20
Y/E 2006 Y/E 2007 Company NameValue
(EURm)No of Deals
2 1 ABN AMRO 138,314 58
1 2 KPMG Corp Fin 23,578 45
3 3 ING 16,138 32
14 4 Goldman Sachs 170,492 31
7 5 Rothschild 112,408 31
9 6 Morgan Stanley 159,182 29
4 7 Deloitte 5,342 29
21 8 Lehman Brothers 120,610 23
6 9 Ernst & Young 5,473 23
10 10 Rabobank 8,735 22
mergermarket M&A league tables of fi nancial advisers - Year End 2007 - January 02, 2008 Page 14
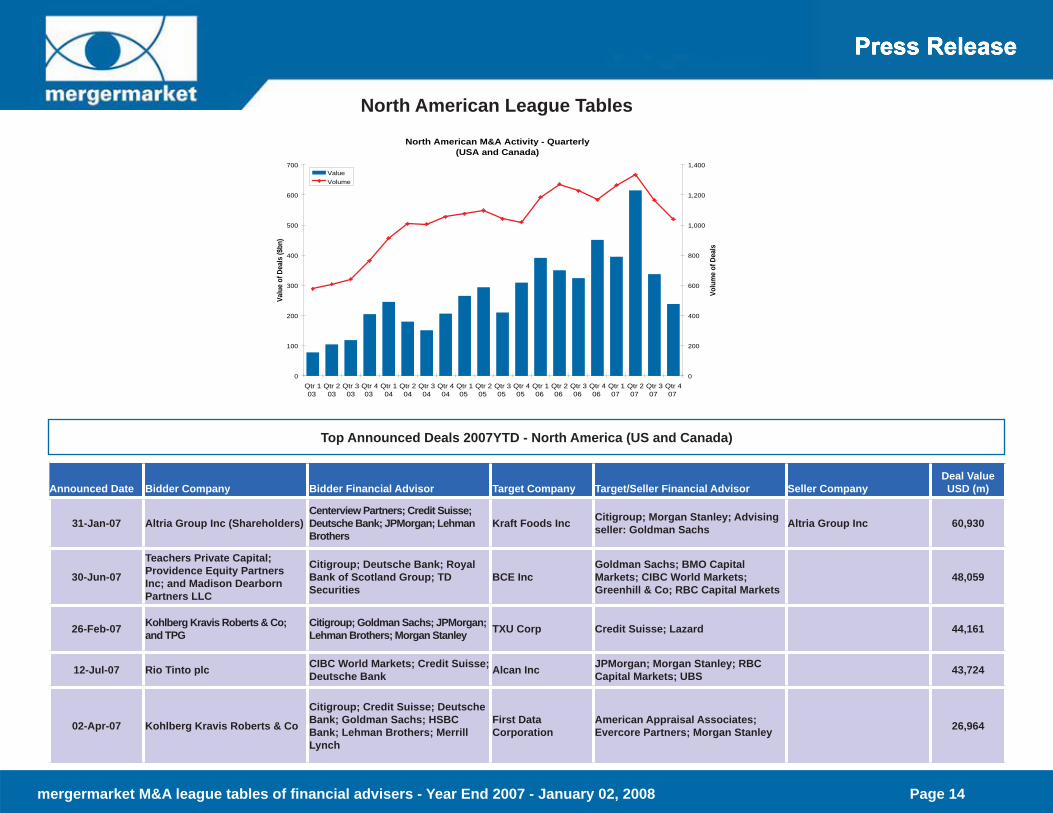
North American League Tables
Top Announced Deals 2007YTD - North America (US and Canada)
Announced Date Bidder Company Bidder Financial Advisor Target Company Target/Seller Financial Advisor Seller CompanyDeal Value USD (m)
31-Jan-07 Altria Group Inc (Shareholders)Centerview Partners; Credit Suisse; Deutsche Bank; JPMorgan; Lehman Brothers
Kraft Foods Inc Citigroup; Morgan Stanley; Advising seller: Goldman Sachs Altria Group Inc 60,930
30-Jun-07
Teachers Private Capital; Providence Equity Partners Inc; and Madison Dearborn Partners LLC
Citigroup; Deutsche Bank; Royal Bank of Scotland Group; TD Securities
BCE IncGoldman Sachs; BMO Capital Markets; CIBC World Markets; Greenhill & Co; RBC Capital Markets
48,059
26-Feb-07 Kohlberg Kravis Roberts & Co; and TPG
Citigroup; Goldman Sachs; JPMorgan; Lehman Brothers; Morgan Stanley TXU Corp Credit Suisse; Lazard 44,161
12-Jul-07 Rio Tinto plc CIBC World Markets; Credit Suisse; Deutsche Bank Alcan Inc JPMorgan; Morgan Stanley; RBC
Capital Markets; UBS 43,724
02-Apr-07 Kohlberg Kravis Roberts & Co
Citigroup; Credit Suisse; Deutsche Bank; Goldman Sachs; HSBC Bank; Lehman Brothers; Merrill Lynch
First Data Corporation
American Appraisal Associates; Evercore Partners; Morgan Stanley 26,964
North American M&A Activity - Quarterly(USA and Canada)
0
100
200
300
400
500
600
700
Qtr 103
Qtr 203
Qtr 303
Qtr 403
Qtr 104
Qtr 204
Qtr 304
Qtr 404
Qtr 105
Qtr 205
Qtr 305
Qtr 405
Qtr 106
Qtr 206
Qtr 306
Qtr 406
Qtr 107
Qtr 207
Qtr 307
Qtr 407
Valu
e of
Dea
ls ($
bn)
0
200
400
600
800
1,000
1,200
1,400
Volu
me
of D
eals
ValueVolume

mergermarket M&A league tables of fi nancial advisers - Year End 2007 - January 02, 2008 Page 15
North American League Tables
League Table of Financial Advisers to North American M&A: Value League Table of Financial Advisers to North American M&A: Volume
Y/E 2006 Y/E 2007 Company NameValue
(USDm)No of Deals
1 1 Goldman Sachs 714,717 250
2 2 Morgan Stanley 587,859 156
4 3 Citigroup 553,159 205
3 4 JPMorgan 521,689 202
7 5 Lehman Brothers 447,407 168
5 6 Credit Suisse 408,840 184
6 7 Merrill Lynch 362,843 177
10 8 Deutsche Bank 352,667 99
8 9 UBS 313,838 193
9 10 Banc of America Securities 192,065 96
20 11 RBC Capital Markets 171,343 98
11 12 Lazard 168,124 121
19 13 CIBC World Markets 149,770 97
36 14 Greenhill & Co 127,053 21
23 15 TD Securities 113,258 39
13 16 Bear, Stearns & Co 103,024 56
150 17 Perella Weinberg Partners 80,050 8
114 18 Centerview Partners 74,997 7
14 19 Wachovia Corporation 73,104 60
26 20 BMO Capital Markets 72,479 41
Y/E 2006 Y/E 2007 Company NameValue
(USDm)No of Deals
4 1 Goldman Sachs 714,717 250
3 2 Citigroup 553,159 205
1 3 JPMorgan 521,689 202
2 4 UBS 313,838 193
5 5 Credit Suisse 408,840 184
7 6 Merrill Lynch 362,843 177
10 7 Lehman Brothers 447,407 168
6 8 Morgan Stanley 587,859 156
8 9 Lazard 168,124 121
11 10 Houlihan Lokey 47,032 108
13 11 Deutsche Bank 352,667 99
16 12 RBC Capital Markets 171,343 98
15 13 CIBC World Markets 149,770 97
12 14 Banc of America Securities 192,065 96
9 15 Jefferies & Company 25,963 83
14 16 Rothschild 54,592 70
25 17 KPMG Corp Fin 21,059 68
20 18 Sandler O'Neill & Partners 54,482 61
18 19 Wachovia Corporation 73,104 60
23 20 William Blair & Company 11,356 59
mergermarket M&A league tables of fi nancial advisers - Year End 2007 - January 02, 2008 Page 16
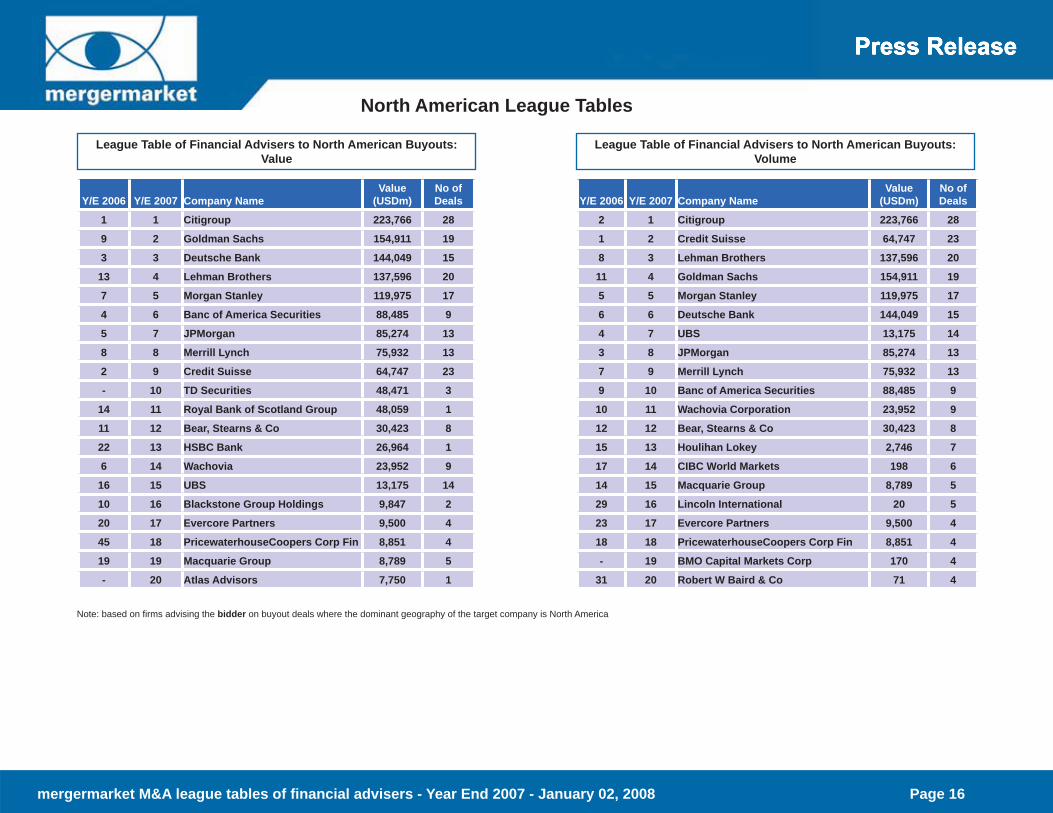
League Table of Financial Advisers to North American Buyouts: Value
League Table of Financial Advisers to North American Buyouts: Volume
North American League Tables
Note: based on fi rms advising the bidder on buyout deals where the dominant geography of the target company is North America
Y/E 2006 Y/E 2007 Company NameValue
(USDm)No of Deals
1 1 Citigroup 223,766 28
9 2 Goldman Sachs 154,911 19
3 3 Deutsche Bank 144,049 15
13 4 Lehman Brothers 137,596 20
7 5 Morgan Stanley 119,975 17
4 6 Banc of America Securities 88,485 9
5 7 JPMorgan 85,274 13
8 8 Merrill Lynch 75,932 13
2 9 Credit Suisse 64,747 23
- 10 TD Securities 48,471 3
14 11 Royal Bank of Scotland Group 48,059 1
11 12 Bear, Stearns & Co 30,423 8
22 13 HSBC Bank 26,964 1
6 14 Wachovia 23,952 9
16 15 UBS 13,175 14
10 16 Blackstone Group Holdings 9,847 2
20 17 Evercore Partners 9,500 4
45 18 PricewaterhouseCoopers Corp Fin 8,851 4
19 19 Macquarie Group 8,789 5
- 20 Atlas Advisors 7,750 1
Y/E 2006 Y/E 2007 Company NameValue
(USDm)No of Deals
2 1 Citigroup 223,766 28
1 2 Credit Suisse 64,747 23
8 3 Lehman Brothers 137,596 20
11 4 Goldman Sachs 154,911 19
5 5 Morgan Stanley 119,975 17
6 6 Deutsche Bank 144,049 15
4 7 UBS 13,175 14
3 8 JPMorgan 85,274 13
7 9 Merrill Lynch 75,932 13
9 10 Banc of America Securities 88,485 9
10 11 Wachovia Corporation 23,952 9
12 12 Bear, Stearns & Co 30,423 8
15 13 Houlihan Lokey 2,746 7
17 14 CIBC World Markets 198 6
14 15 Macquarie Group 8,789 5
29 16 Lincoln International 20 5
23 17 Evercore Partners 9,500 4
18 18 PricewaterhouseCoopers Corp Fin 8,851 4
- 19 BMO Capital Markets Corp 170 4
31 20 Robert W Baird & Co 71 4
mergermarket M&A league tables of fi nancial advisers - Year End 2007 - January 02, 2008 Page 17
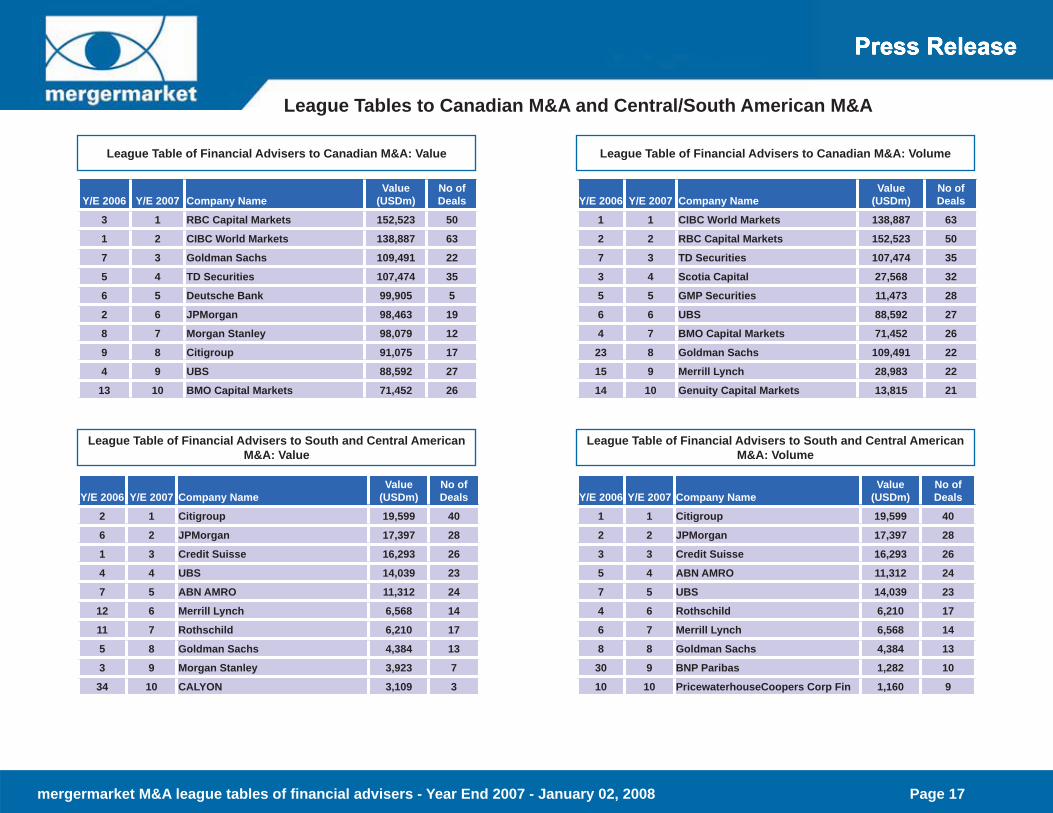
League Tables to Canadian M&A and Central/South American M&A
League Table of Financial Advisers to Canadian M&A: Value League Table of Financial Advisers to Canadian M&A: Volume
League Table of Financial Advisers to South and Central American M&A: Value
League Table of Financial Advisers to South and Central American M&A: Volume
Y/E 2006 Y/E 2007 Company NameValue
(USDm)No of Deals
2 1 Citigroup 19,599 40
6 2 JPMorgan 17,397 28
1 3 Credit Suisse 16,293 26
4 4 UBS 14,039 23
7 5 ABN AMRO 11,312 24
12 6 Merrill Lynch 6,568 14
11 7 Rothschild 6,210 17
5 8 Goldman Sachs 4,384 13
3 9 Morgan Stanley 3,923 7
34 10 CALYON 3,109 3
Y/E 2006 Y/E 2007 Company NameValue
(USDm)No of Deals
1 1 Citigroup 19,599 40
2 2 JPMorgan 17,397 28
3 3 Credit Suisse 16,293 26
5 4 ABN AMRO 11,312 24
7 5 UBS 14,039 23
4 6 Rothschild 6,210 17
6 7 Merrill Lynch 6,568 14
8 8 Goldman Sachs 4,384 13
30 9 BNP Paribas 1,282 10
10 10 PricewaterhouseCoopers Corp Fin 1,160 9
Y/E 2006 Y/E 2007 Company NameValue
(USDm)No of Deals
3 1 RBC Capital Markets 152,523 50
1 2 CIBC World Markets 138,887 63
7 3 Goldman Sachs 109,491 22
5 4 TD Securities 107,474 35
6 5 Deutsche Bank 99,905 5
2 6 JPMorgan 98,463 19
8 7 Morgan Stanley 98,079 12
9 8 Citigroup 91,075 17
4 9 UBS 88,592 27
13 10 BMO Capital Markets 71,452 26
Y/E 2006 Y/E 2007 Company NameValue
(USDm)No of Deals
1 1 CIBC World Markets 138,887 63
2 2 RBC Capital Markets 152,523 50
7 3 TD Securities 107,474 35
3 4 Scotia Capital 27,568 32
5 5 GMP Securities 11,473 28
6 6 UBS 88,592 27
4 7 BMO Capital Markets 71,452 26
23 8 Goldman Sachs 109,491 22
15 9 Merrill Lynch 28,983 22
14 10 Genuity Capital Markets 13,815 21
mergermarket M&A league tables of fi nancial advisers - Year End 2007 - January 02, 2008 Page 18
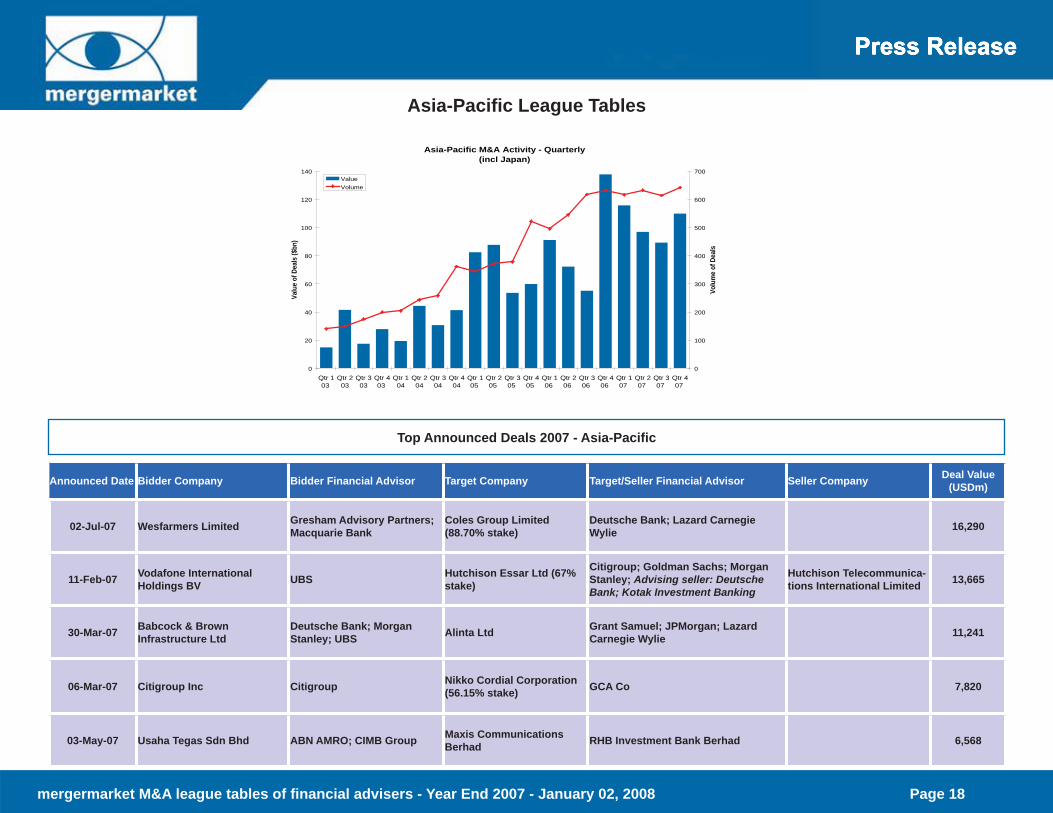
Asia-Pacifi c League Tables
Top Announced Deals 2007 - Asia-Pacifi c
Announced Date Bidder Company Bidder Financial Advisor Target Company Target/Seller Financial Advisor Seller Company Deal Value (USDm)
02-Jul-07 Wesfarmers Limited Gresham Advisory Partners; Macquarie Bank
Coles Group Limited (88.70% stake)
Deutsche Bank; Lazard Carnegie Wylie 16,290
11-Feb-07 Vodafone International Holdings BV UBS Hutchison Essar Ltd (67%
stake)
Citigroup; Goldman Sachs; Morgan Stanley; Advising seller: Deutsche Bank; Kotak Investment Banking
Hutchison Telecommunica-tions International Limited 13,665
30-Mar-07 Babcock & Brown Infrastructure Ltd
Deutsche Bank; Morgan Stanley; UBS Alinta Ltd Grant Samuel; JPMorgan; Lazard
Carnegie Wylie 11,241
06-Mar-07 Citigroup Inc Citigroup Nikko Cordial Corporation (56.15% stake) GCA Co 7,820
03-May-07 Usaha Tegas Sdn Bhd ABN AMRO; CIMB Group Maxis Communications Berhad RHB Investment Bank Berhad 6,568
Asia-Pacific M&A Activity - Quarterly(incl Japan)
0
20
40
60
80
100
120
140
Qtr 103
Qtr 203
Qtr 303
Qtr 403
Qtr 104
Qtr 204
Qtr 304
Qtr 404
Qtr 105
Qtr 205
Qtr 305
Qtr 405
Qtr 106
Qtr 206
Qtr 306
Qtr 406
Qtr 107
Qtr 207
Qtr 307
Qtr 407
Valu
e of
Dea
ls ($
bn)
0
100
200
300
400
500
600
700
Volu
me
of D
eals
ValueVolume
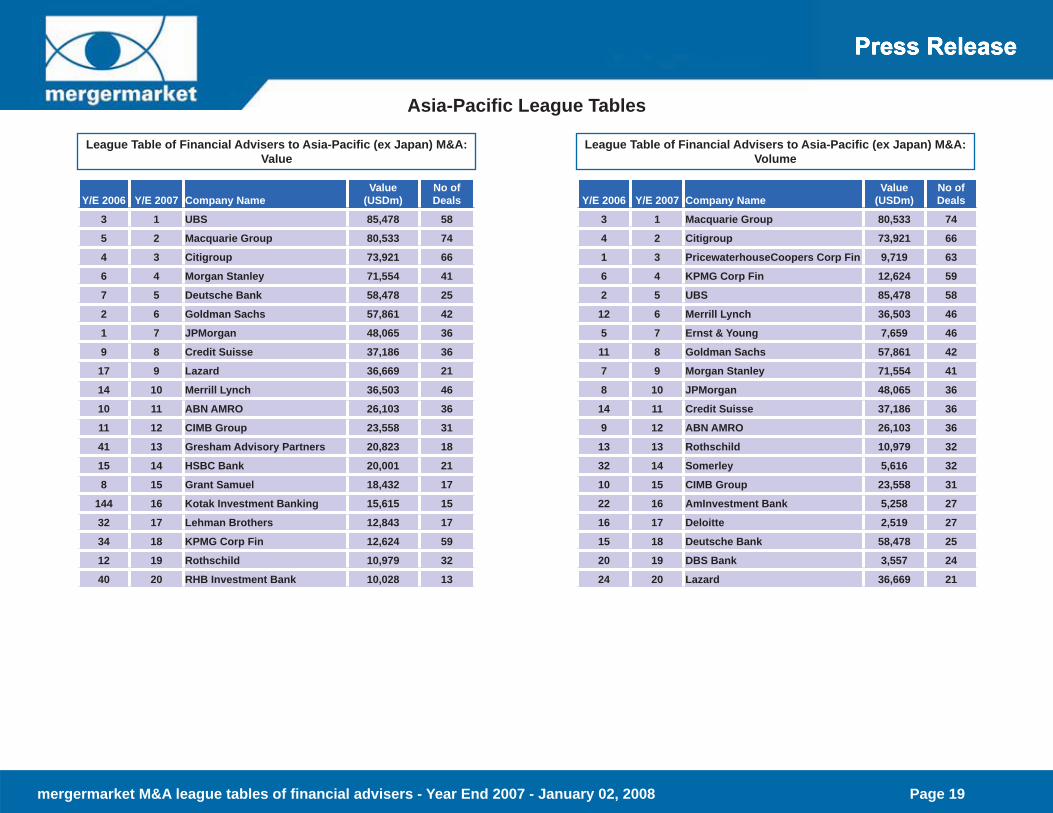
mergermarket M&A league tables of fi nancial advisers - Year End 2007 - January 02, 2008 Page 19
League Table of Financial Advisers to Asia-Pacifi c (ex Japan) M&A: Value
League Table of Financial Advisers to Asia-Pacifi c (ex Japan) M&A: Volume
Asia-Pacifi c League Tables
Y/E 2006 Y/E 2007 Company NameValue
(USDm)No of Deals
3 1 UBS 85,478 58
5 2 Macquarie Group 80,533 74
4 3 Citigroup 73,921 66
6 4 Morgan Stanley 71,554 41
7 5 Deutsche Bank 58,478 25
2 6 Goldman Sachs 57,861 42
1 7 JPMorgan 48,065 36
9 8 Credit Suisse 37,186 36
17 9 Lazard 36,669 21
14 10 Merrill Lynch 36,503 46
10 11 ABN AMRO 26,103 36
11 12 CIMB Group 23,558 31
41 13 Gresham Advisory Partners 20,823 18
15 14 HSBC Bank 20,001 21
8 15 Grant Samuel 18,432 17
144 16 Kotak Investment Banking 15,615 15
32 17 Lehman Brothers 12,843 17
34 18 KPMG Corp Fin 12,624 59
12 19 Rothschild 10,979 32
40 20 RHB Investment Bank 10,028 13
Y/E 2006 Y/E 2007 Company NameValue
(USDm)No of Deals
3 1 Macquarie Group 80,533 74
4 2 Citigroup 73,921 66
1 3 PricewaterhouseCoopers Corp Fin 9,719 63
6 4 KPMG Corp Fin 12,624 59
2 5 UBS 85,478 58
12 6 Merrill Lynch 36,503 46
5 7 Ernst & Young 7,659 46
11 8 Goldman Sachs 57,861 42
7 9 Morgan Stanley 71,554 41
8 10 JPMorgan 48,065 36
14 11 Credit Suisse 37,186 36
9 12 ABN AMRO 26,103 36
13 13 Rothschild 10,979 32
32 14 Somerley 5,616 32
10 15 CIMB Group 23,558 31
22 16 AmInvestment Bank 5,258 27
16 17 Deloitte 2,519 27
15 18 Deutsche Bank 58,478 25
20 19 DBS Bank 3,557 24
24 20 Lazard 36,669 21

mergermarket M&A league tables of fi nancial advisers - Year End 2007 - January 02, 2008 Page 20
League Table of Financial Advisers to Asia-Pacifi c (ex Japan) Buyouts: Value
League Table of Financial Advisers to Asia-Pacifi c (ex Japan) Buyouts: Volume
League Tables of Financial Advisers by Asia-Pacifi c Region
Note: based on fi rms advising the bidder on buyout deals where the dominant geography of the target company is Asia- Pacifi c (ex Japan)
Y/E 2006 Y/E 2007 Company NameValue
(USDm)No of Deals
25 1 Deutsche Bank 12,083 2
6 2 UBS 11,807 35 3 Citigroup 8,510 10
17 4 Morgan Stanley 7,112 5
9 5 Macquarie Group 4,898 11
15 6 ABN AMRO 4,663 4
3 7 Merrill Lynch 3,326 4
26 8 JPMorgan 2,734 3
1 9 Goldman Sachs 2,290 2
23 10 PricewaterhouseCoopers Corp Fin 1,808 4
- 11 Yuanta Core Pacifi c Securities Company 1,792 4
- 12 Caliburn Partnership 1,386 2
10 13 Ernst & Young 1,215 2
- 14= KTB Securities Company 1,014 1- 14= Phatra Securities Company 1,014 1
Y/E 2006 Y/E 2007 Company NameValue
(USDm)No of Deals
3 1 Macquarie Group 4,898 11
1 2 Citigroup 8,510 10
9 3 Morgan Stanley 7,112 5
8 4 ABN AMRO 4,663 4
2 5 Merrill Lynch 3,326 4
10 6 PricewaterhouseCoopers Corp Fin 1,808 4
- 7 Yuanta Core Pacifi c Securities Company 1,792 4
4 8 UBS 11,807 326 9 JPMorgan 2,734 3
7 10 Credit Suisse 916 3
24 11 Rothschild 730 3
- 12 Grant Thornton Corporate Finance 294 3
25 13 Deutsche Bank 12,083 2
6 14 Goldman Sachs 2,290 2
- 15 Caliburn Partnership 1,386 2
mergermarket M&A league tables of fi nancial advisers - Year End 2007 - January 02, 2008 Page 21
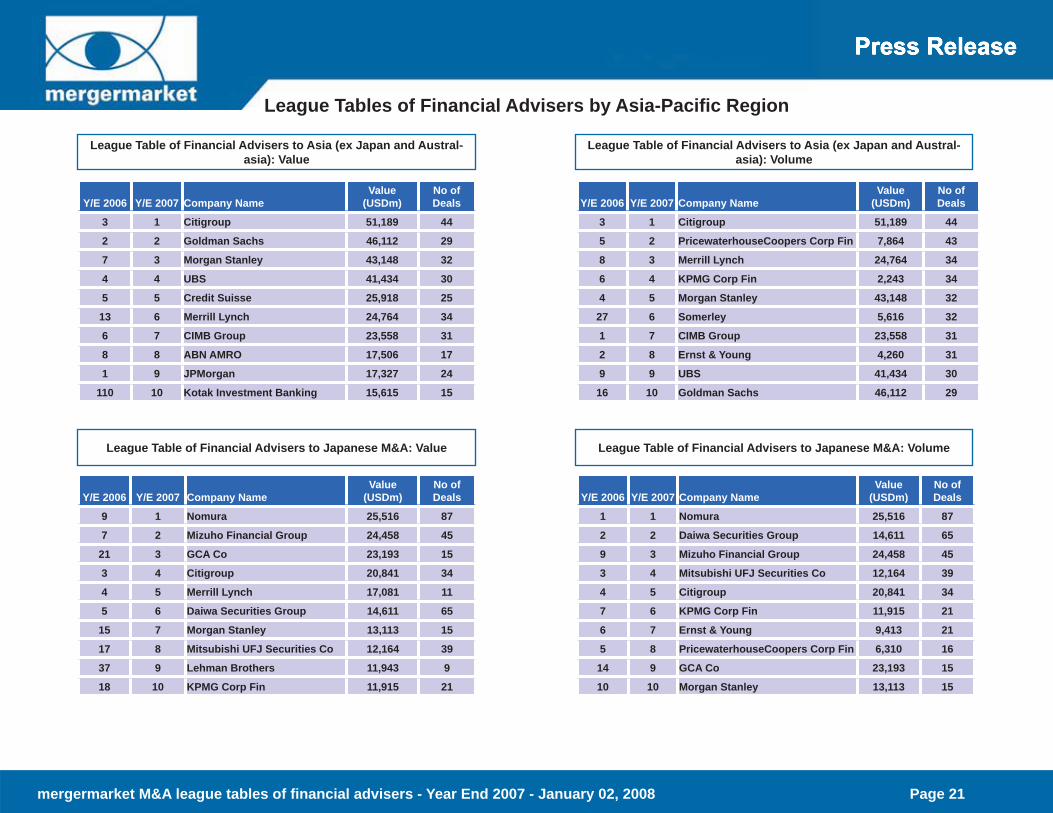
League Table of Financial Advisers to Asia (ex Japan and Austral-asia): Volume
League Tables of Financial Advisers by Asia-Pacifi c Region
League Table of Financial Advisers to Asia (ex Japan and Austral-asia): Value
League Table of Financial Advisers to Japanese M&A: VolumeLeague Table of Financial Advisers to Japanese M&A: Value
Y/E 2006 Y/E 2007 Company NameValue
(USDm)No of Deals
3 1 Citigroup 51,189 44
2 2 Goldman Sachs 46,112 29
7 3 Morgan Stanley 43,148 32
4 4 UBS 41,434 30
5 5 Credit Suisse 25,918 25
13 6 Merrill Lynch 24,764 34
6 7 CIMB Group 23,558 31
8 8 ABN AMRO 17,506 17
1 9 JPMorgan 17,327 24
110 10 Kotak Investment Banking 15,615 15
Y/E 2006 Y/E 2007 Company NameValue
(USDm)No of Deals
3 1 Citigroup 51,189 44
5 2 PricewaterhouseCoopers Corp Fin 7,864 43
8 3 Merrill Lynch 24,764 34
6 4 KPMG Corp Fin 2,243 34
4 5 Morgan Stanley 43,148 32
27 6 Somerley 5,616 32
1 7 CIMB Group 23,558 31
2 8 Ernst & Young 4,260 31
9 9 UBS 41,434 30
16 10 Goldman Sachs 46,112 29
Y/E 2006 Y/E 2007 Company NameValue
(USDm)No of Deals
9 1 Nomura 25,516 87
7 2 Mizuho Financial Group 24,458 45
21 3 GCA Co 23,193 15
3 4 Citigroup 20,841 34
4 5 Merrill Lynch 17,081 11
5 6 Daiwa Securities Group 14,611 65
15 7 Morgan Stanley 13,113 15
17 8 Mitsubishi UFJ Securities Co 12,164 39
37 9 Lehman Brothers 11,943 9
18 10 KPMG Corp Fin 11,915 21
Y/E 2006 Y/E 2007 Company NameValue
(USDm)No of Deals
1 1 Nomura 25,516 87
2 2 Daiwa Securities Group 14,611 65
9 3 Mizuho Financial Group 24,458 45
3 4 Mitsubishi UFJ Securities Co 12,164 39
4 5 Citigroup 20,841 34
7 6 KPMG Corp Fin 11,915 21
6 7 Ernst & Young 9,413 21
5 8 PricewaterhouseCoopers Corp Fin 6,310 16
14 9 GCA Co 23,193 15
10 10 Morgan Stanley 13,113 15
mergermarket M&A league tables of fi nancial advisers - Year End 2007 - January 02, 2008 Page 22
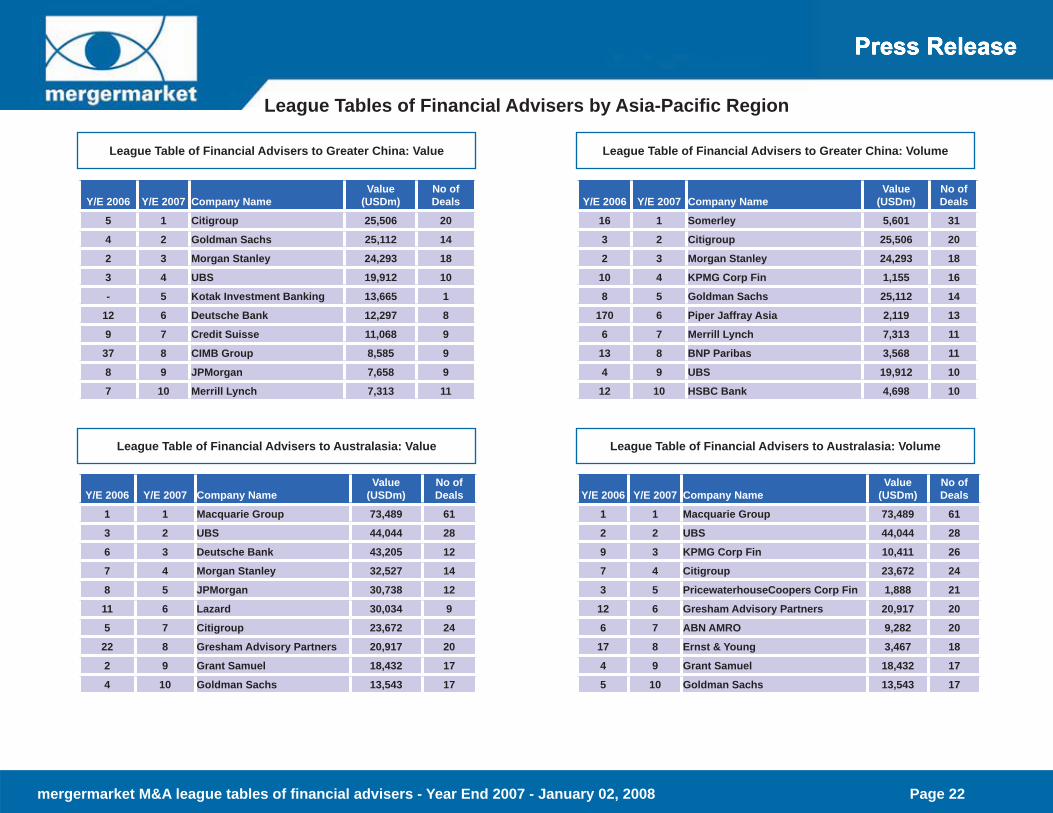
League Table of Financial Advisers to Greater China: VolumeLeague Table of Financial Advisers to Greater China: Value
League Table of Financial Advisers to Australasia: VolumeLeague Table of Financial Advisers to Australasia: Value
League Tables of Financial Advisers by Asia-Pacifi c Region
Y/E 2006 Y/E 2007 Company NameValue
(USDm)No of Deals
5 1 Citigroup 25,506 20
4 2 Goldman Sachs 25,112 14
2 3 Morgan Stanley 24,293 18
3 4 UBS 19,912 10
- 5 Kotak Investment Banking 13,665 1
12 6 Deutsche Bank 12,297 8
9 7 Credit Suisse 11,068 9
37 8 CIMB Group 8,585 9
8 9 JPMorgan 7,658 9
7 10 Merrill Lynch 7,313 11
Y/E 2006 Y/E 2007 Company NameValue
(USDm)No of Deals
16 1 Somerley 5,601 31
3 2 Citigroup 25,506 20
2 3 Morgan Stanley 24,293 18
10 4 KPMG Corp Fin 1,155 16
8 5 Goldman Sachs 25,112 14
170 6 Piper Jaffray Asia 2,119 13
6 7 Merrill Lynch 7,313 11
13 8 BNP Paribas 3,568 11
4 9 UBS 19,912 10
12 10 HSBC Bank 4,698 10
Y/E 2006 Y/E 2007 Company NameValue
(USDm)No of Deals
1 1 Macquarie Group 73,489 61
3 2 UBS 44,044 28
6 3 Deutsche Bank 43,205 12
7 4 Morgan Stanley 32,527 14
8 5 JPMorgan 30,738 12
11 6 Lazard 30,034 9
5 7 Citigroup 23,672 24
22 8 Gresham Advisory Partners 20,917 20
2 9 Grant Samuel 18,432 17
4 10 Goldman Sachs 13,543 17
Y/E 2006 Y/E 2007 Company NameValue
(USDm)No of Deals
1 1 Macquarie Group 73,489 61
2 2 UBS 44,044 28
9 3 KPMG Corp Fin 10,411 26
7 4 Citigroup 23,672 24
3 5 PricewaterhouseCoopers Corp Fin 1,888 21
12 6 Gresham Advisory Partners 20,917 20
6 7 ABN AMRO 9,282 20
17 8 Ernst & Young 3,467 18
4 9 Grant Samuel 18,432 17
5 10 Goldman Sachs 13,543 17
mergermarket M&A league tables of fi nancial advisers - Year End 2007 - January 02, 2008 Page 23
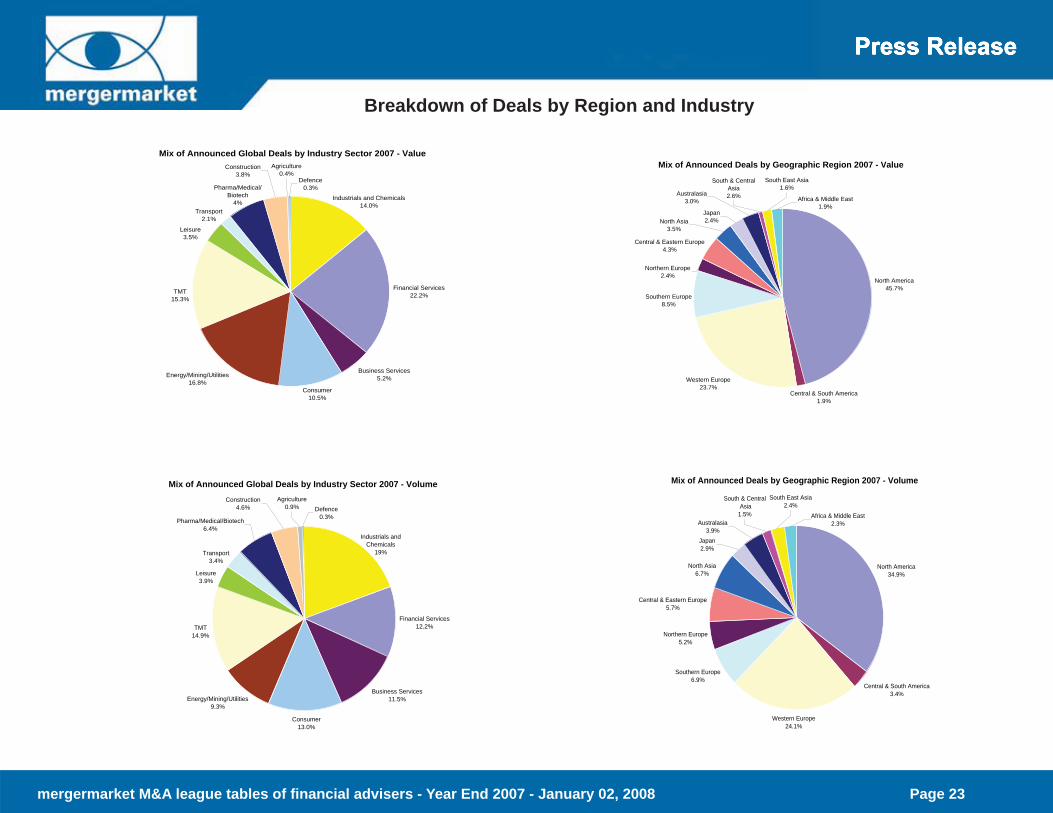
Breakdown of Deals by Region and Industry
Mix of Announced Deals by Geographic Region 2007 - Value
North America45.7%
Central & South America1.9%
Western Europe23.7%
Southern Europe8.5%
Japan2.4%
South & Central Asia2.6%
Central & Eastern Europe4.3%
Northern Europe2.4%
South East Asia1.6%
Africa & Middle East1.9%
Australasia3.0%
North Asia3.5%
Mix of Announced Deals by Geographic Region 2007 - Volume
North America34.9%
Central & South America3.4%
Western Europe24.1%
Southern Europe6.9%
Northern Europe5.2%
Central & Eastern Europe5.7%
North Asia6.7%
South East Asia2.4%
Africa & Middle East2.3%Australasia
3.9%
South & Central Asia1.5%
Japan2.9%
Mix of Announced Global Deals by Industry Sector 2007 - Value
Financial Services22.2%
Business Services5.2%Energy/Mining/Utilities
16.8%
Defence0.3%
Construction3.8%
Transport2.1%
Pharma/Medical/Biotech
4%
Leisure3.5%
Agriculture0.4%
Industrials and Chemicals14.0%
TMT15.3%
Consumer10.5%
Mix of Announced Global Deals by Industry Sector 2007 - Volume
Financial Services12.2%
Business Services11.5%
Consumer13.0%
TMT14.9%
Energy/Mining/Utilities9.3%
Industrials and Chemicals
19%
Leisure3.9%
Transport3.4%
Construction4.6% Defence
0.3%
Agriculture0.9%
Pharma/Medical/Biotech6.4%
mergermarket M&A league tables of fi nancial advisers - Year End 2007 - January 02, 2008 Page 24
Criteria
• The preliminary 2007 house league tables are based on announced transactions (where the bidder or target or parent of either is from the country or region to which the table refers), over USD 5m in the period from 1 January 2007 to 31 December 2007. Deals with undisclosed deal values are included where the target’s turn-over exceeds USD 10m. Activities excluded from the league tables include property transactions and restructur-ings where the ultimate shareholders’ interests are not changed.
• The trend graphs and pie charts are based on the dominant geography or industry of the target and include announced transactions over USD 5m in the given time period. Deals with undisclosed deal values are included where the target’s turnover exceeds USD 10m. Activities excluded from the graphs and charts include property transactions and restructurings where the ultimate shareholders’ interests are not changed.
• The top deals tables are based on announced transactions between 1 January 2007 and 31 December 2007, and refl ect the dominant geography of the target company.
Nordic: Denmark, Sweden, Finland, Norway, Faroe Islands, Greenland and IcelandBenelux: Belgium, the Netherlands and LuxembourgIberia: Portugal and SpainCEE: Armenia, Azerbaijan, Belarus, Bosnia-Herzegovina, Bulgaria, Croatia, Czech Republic, Estonia, Georgia, Hungary, Latvia, Lithuania, Macedonia, Moldova, Poland, Romania, Russia, Serbia, Slovakia, Slovenia, Ukraine
North America: USA, Canada
Greater China: China, Hong Kong, Macau, Taiwan
mergermarket M&A league tables of fi nancial advisers - Year End 2007 - January 02, 2008 Page 25
About mergermarket
mergermarket is part of The Mergermarket Group which has over 400 employees worldwide and regional head offi ces in New York, London and Hong Kong.
mergermarket is an unparalleled mergers and acquisitions (M&A) intelligence tool. In any market, the life blood of advisers is deal fl ow. mergermarket is unique in the provision of origination intelligence to the investment banking, Financial, private equity, acquisition fi nance, public relations (PR) and corporate markets.
With an unrivalled network of analysts covering M&A in North America, Europe and Asia-Pacifi c, mergermarket generates proprietary intelligence and delivers it together with daily aggregated content, on its mergermarket.com platform and by real-time email alerts to subscribers.
This wealth of intelligence, together with a series of deal databases, individual and house league tables, profi les and editorial have proven time and time again that this product can and does generate real revenues for clients. This is apparent when you see that mergermarket is used by over 1000 of the world’s foremost advisory fi rms to assist in their origination process.
Visit us at: www.mergermarket.com
Contacts:
Europe Hannah [email protected]: +44 20 7059 6118
North AmericaKarishma [email protected]: +1 212 686 6305
Asia-Pacifi cSeye [email protected] Tel: +852 2158 9706
Related Documents