Journal of Economic Behavior & Organization Vol. 41 (2000) 363–383 Merger market dynamics: insights into the behavior of target and bidder firms Lois M. Shelton (Assistant Professor) * University of Illinois Chicago, Department of Managerial Studies, (M/C 243), 601 South Morgan Street, Chicago, IL 60607-7122, USA Received 14 August 1997; accepted 31 August 1999 Abstract This study presents a framework deriving the demand and supply of target firm shares in merger, and tests it using event study methodology and regression analysis. Target and bidder behavior are not mirror images; instead bidders rank and pursue targets which either accept or reject bids. Merger cycles are motivated by bidder demand shifts, target quality is as important as strategic fit for bidders, and transaction type is confirmed as the most reliable predictor of variation in premiums. Target institutional investors raise the cost to the bidder. ©2000 Elsevier Science B.V. All rights reserved. JEL classification: D21; G34; L10 Keywords: Mergers; Firm behavior 1. Introduction How does the merger market operate over time? What motivates merger waves? How do supply and demand conditions impact target and bidder behavior? The framework presented here for analyzing these and other questions involving merger dynamics is supply and demand schedules for target firm shares. The advantage of this framework is that it enables us to analyze dynamic aspects of mergers, and to determine more carefully the role of market-wide and transaction-specific factors. Much of the previous merger research has focused on such topics as related diversification (i.e. Montgomery, 1979; Bettis, 1981; Palepu, 1985; Singh and Montgomery, 1987); what * Tel.: +1-312-413-8237. E-mail address: [email protected] (L.M. Shelton). 0167-2681/00/$ – see front matter ©2000 Elsevier Science B.V. All rights reserved. PII:S0167-2681(99)00081-5

Welcome message from author
This document is posted to help you gain knowledge. Please leave a comment to let me know what you think about it! Share it to your friends and learn new things together.
Transcript
Journal of Economic Behavior & OrganizationVol. 41 (2000) 363–383
Merger market dynamics: insights into the behavior oftarget and bidder firms
Lois M. Shelton (Assistant Professor)∗University of Illinois Chicago, Department of Managerial Studies, (M/C 243), 601 South Morgan Street,
Chicago, IL 60607-7122, USA
Received 14 August 1997; accepted 31 August 1999
Abstract
This study presents a framework deriving the demand and supply of target firm shares in merger,and tests it using event study methodology and regression analysis. Target and bidder behaviorare not mirror images; instead bidders rank and pursue targets which either accept or reject bids.Merger cycles are motivated by bidder demand shifts, target quality is as important as strategic fit forbidders, and transaction type is confirmed as the most reliable predictor of variation in premiums.Target institutional investors raise the cost to the bidder. ©2000 Elsevier Science B.V. All rightsreserved.
JEL classification:D21; G34; L10
Keywords:Mergers; Firm behavior
1. Introduction
How does the merger market operate over time? What motivates merger waves? How dosupply and demand conditions impact target and bidder behavior?
The framework presented here for analyzing these and other questions involving mergerdynamics is supply and demand schedules for target firm shares. The advantage of thisframework is that it enables us to analyze dynamic aspects of mergers, and to determinemore carefully the role of market-wide and transaction-specific factors.
Much of the previous merger research has focused on such topics as related diversification(i.e. Montgomery, 1979; Bettis, 1981; Palepu, 1985; Singh and Montgomery, 1987); what
∗ Tel.: +1-312-413-8237.E-mail address:[email protected] (L.M. Shelton).
0167-2681/00/$ – see front matter ©2000 Elsevier Science B.V. All rights reserved.PII: S0167-2681(99)00081-5
364 L.M. Shelton / J. of Economic Behavior & Org. 41 (2000) 363–383
types of relatedness matter, and how to measure them(i.e. Shelton, 1988; Chatterjee andWernerfelt, 1991; Markides and Williamson, 1994; Robins and Wiersma, 1995); and thedivision of overall gains between targets and bidders, but with little exploration of keymarket forces (i.e. Bradley et al., 1988; Lang et al., 1989; Stulz et al., 1990; Maloney et al.,1993; Smith and Kim, 1994). The literature also includes notable summary studies providingvaluable syntheses of diverse empirical studies (i.e. Jensen and Ruback, 1983; Ramanujamand Varadarajan, 1989; Hoskisson et al., 1993), or insights gleaned from multidisciplinaryor meta-analytical approaches(i.e. Lubatkin, 1983; Datta et al., 1992), but these works stillshed little light on merger market dynamics.
It is surprising that most of this previous work does not consider mergers within theoverall context of supply and demand because mergers occur in waves, indicating thatsupply and demand forces are active over time. Here, supply and demand curves for targetfirm shares are developed, and the impact of market-wide and transaction-specific effectson these curves is explored and key results of the literature are tested.
The following section examines the demand and supply forces in the merger market anddevelops testable hypotheses while the construction of the database and key variables arediscussed in Section 3. Regression models and statistical results are analyzed in Section 4and the discussion and implications are presented in Section 5.
2. Supply and demand forces in the merger market
2.1. Supply and demand curves
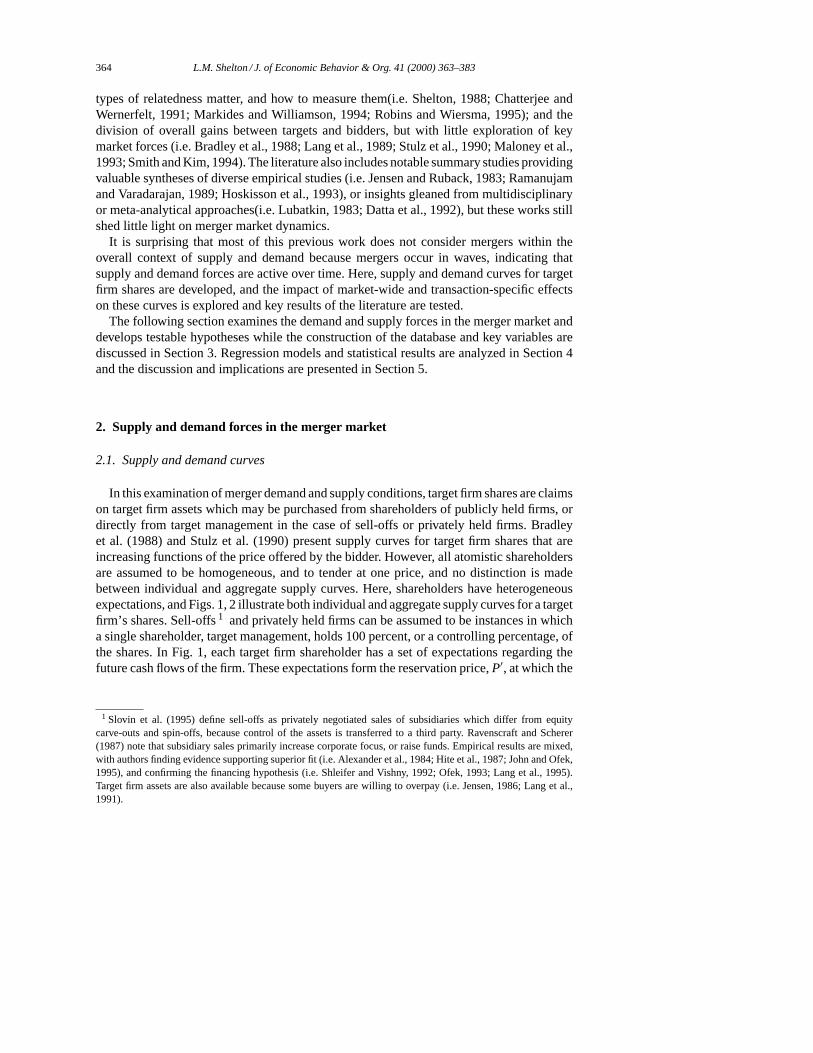
In this examination of merger demand and supply conditions, target firm shares are claimson target firm assets which may be purchased from shareholders of publicly held firms, ordirectly from target management in the case of sell-offs or privately held firms. Bradleyet al. (1988) and Stulz et al. (1990) present supply curves for target firm shares that areincreasing functions of the price offered by the bidder. However, all atomistic shareholdersare assumed to be homogeneous, and to tender at one price, and no distinction is madebetween individual and aggregate supply curves. Here, shareholders have heterogeneousexpectations, and Figs. 1, 2 illustrate both individual and aggregate supply curves for a targetfirm’s shares. Sell-offs1 and privately held firms can be assumed to be instances in whicha single shareholder, target management, holds 100 percent, or a controlling percentage, ofthe shares. In Fig. 1, each target firm shareholder has a set of expectations regarding thefuture cash flows of the firm. These expectations form the reservation price,P′, at which the
1 Slovin et al. (1995) define sell-offs as privately negotiated sales of subsidiaries which differ from equitycarve-outs and spin-offs, because control of the assets is transferred to a third party. Ravenscraft and Scherer(1987) note that subsidiary sales primarily increase corporate focus, or raise funds. Empirical results are mixed,with authors finding evidence supporting superior fit (i.e. Alexander et al., 1984; Hite et al., 1987; John and Ofek,1995), and confirming the financing hypothesis (i.e. Shleifer and Vishny, 1992; Ofek, 1993; Lang et al., 1995).Target firm assets are also available because some buyers are willing to overpay (i.e. Jensen, 1986; Lang et al.,1991).
L.M. Shelton / J. of Economic Behavior & Org. 41 (2000) 363–383 365
Fig. 1. Individual supply curve for target firm shares.
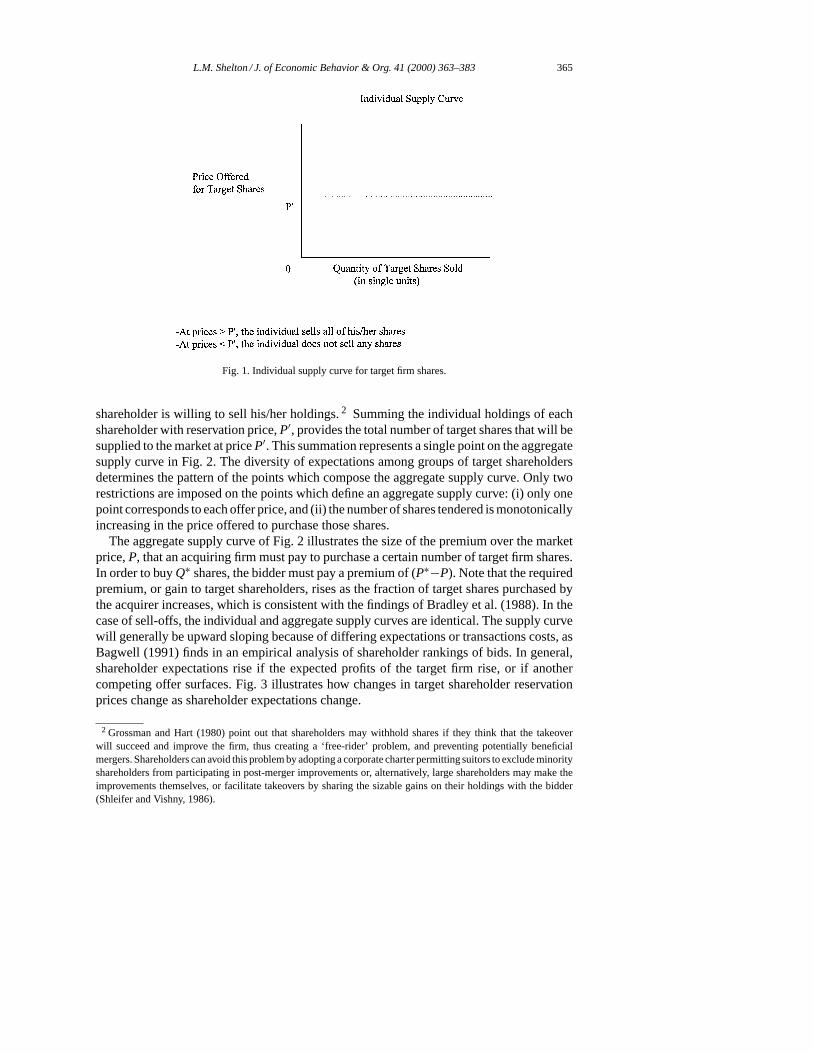
shareholder is willing to sell his/her holdings.2 Summing the individual holdings of eachshareholder with reservation price,P′, provides the total number of target shares that will besupplied to the market at priceP′. This summation represents a single point on the aggregatesupply curve in Fig. 2. The diversity of expectations among groups of target shareholdersdetermines the pattern of the points which compose the aggregate supply curve. Only tworestrictions are imposed on the points which define an aggregate supply curve: (i) only onepoint corresponds to each offer price, and (ii) the number of shares tendered is monotonicallyincreasing in the price offered to purchase those shares.
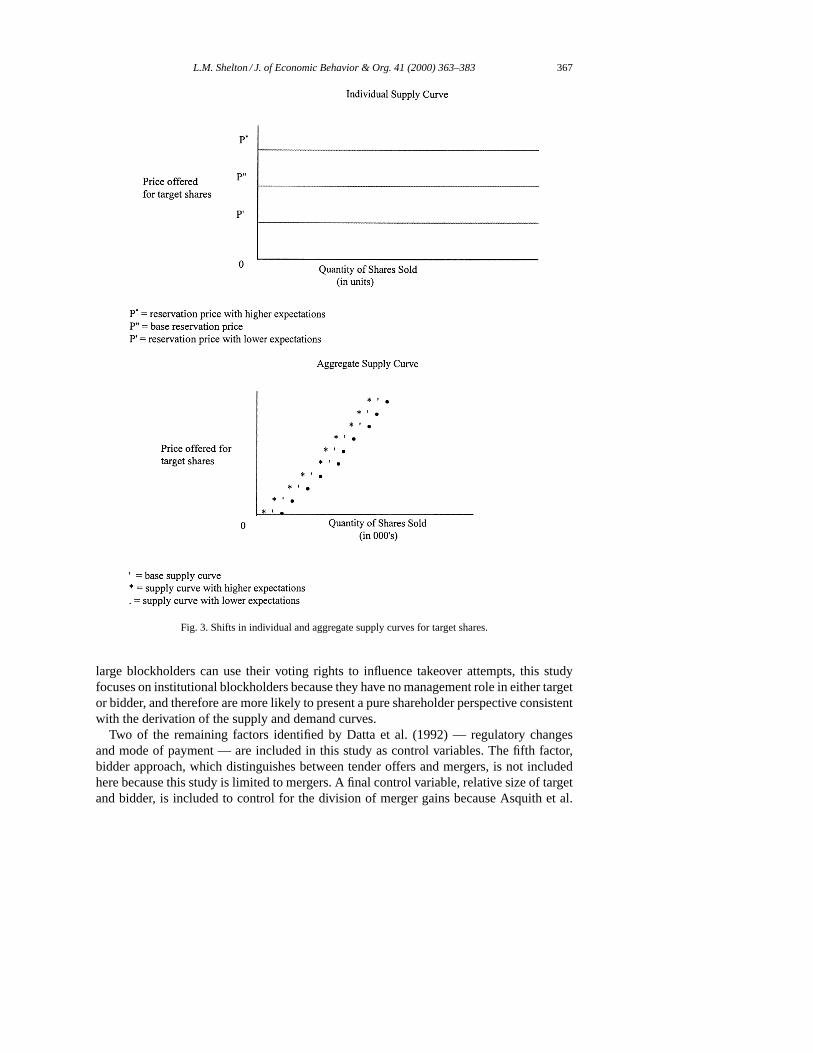
The aggregate supply curve of Fig. 2 illustrates the size of the premium over the marketprice,P, that an acquiring firm must pay to purchase a certain number of target firm shares.In order to buyQ∗ shares, the bidder must pay a premium of (P∗−P). Note that the requiredpremium, or gain to target shareholders, rises as the fraction of target shares purchased bythe acquirer increases, which is consistent with the findings of Bradley et al. (1988). In thecase of sell-offs, the individual and aggregate supply curves are identical. The supply curvewill generally be upward sloping because of differing expectations or transactions costs, asBagwell (1991) finds in an empirical analysis of shareholder rankings of bids. In general,shareholder expectations rise if the expected profits of the target firm rise, or if anothercompeting offer surfaces. Fig. 3 illustrates how changes in target shareholder reservationprices change as shareholder expectations change.
2 Grossman and Hart (1980) point out that shareholders may withhold shares if they think that the takeoverwill succeed and improve the firm, thus creating a ‘free-rider’ problem, and preventing potentially beneficialmergers. Shareholders can avoid this problem by adopting a corporate charter permitting suitors to exclude minorityshareholders from participating in post-merger improvements or, alternatively, large shareholders may make theimprovements themselves, or facilitate takeovers by sharing the sizable gains on their holdings with the bidder(Shleifer and Vishny, 1986).
366 L.M. Shelton / J. of Economic Behavior & Org. 41 (2000) 363–383
Fig. 2. Aggregate supply curve.
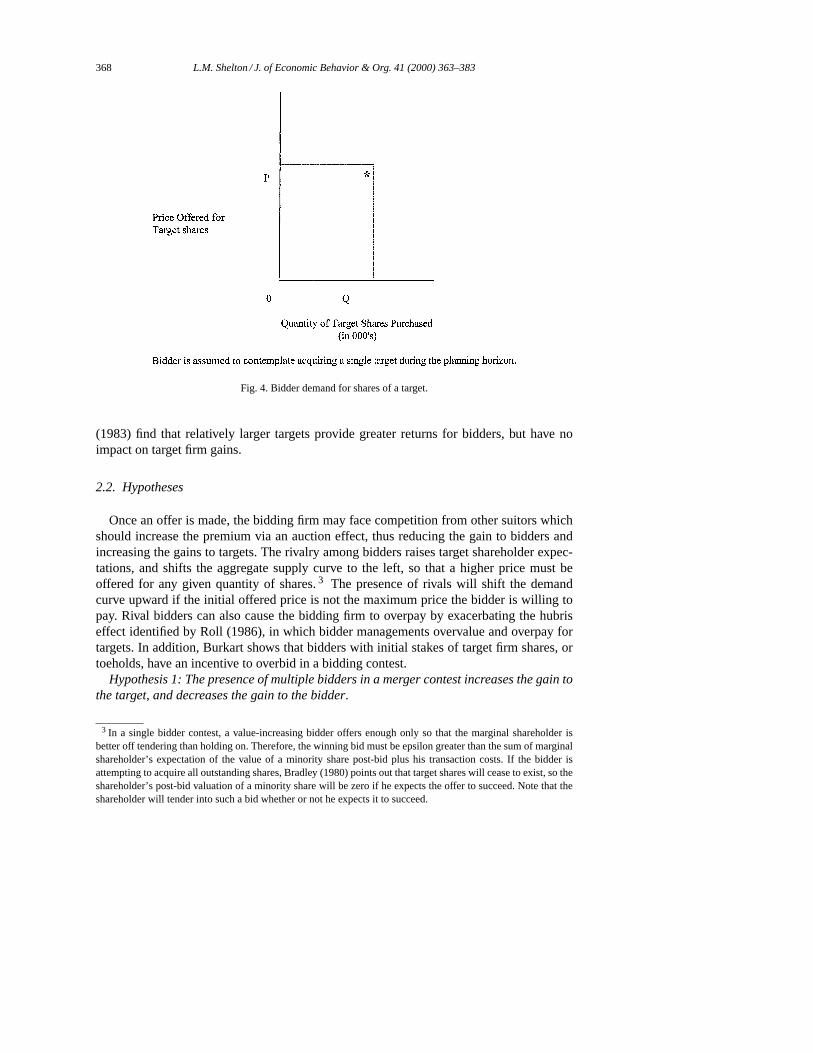
Bidder firms are assumed to consider one acquisition during a given planning period.They rank targets by the present value of expected net benefits of acquisition, and thenpursue them sequentially. The expected net benefits equal the value created by combiningthe assets of the two firms, minus the premium required to obtain control. The net benefitsoffered by alternate targets provide a ceiling on the price a bidder is willing to pay for anyone target, and thus, the offer purchase price depends on the required premium, the totalvalue created and the gains available from other targets. Since the bidder pursues only onetarget within the relevant time horizon, its demand for target shares appears as the singlepoint in the graph of Fig. 4.
Given the demand and supply curves illustrated above, a number of market-wide andtransaction-specific forces may affect these curves. Merger waves are an important market-wide effect, and several studies provide evidence of changes in the merger market over timeand the course of the merger cycle. Bhide (1990) claims that the disadvantages of diversifi-cation have increased since the importance of information asymmetries has diminished incorporate financing. The results of Morck et al. (1990) and Servaes (1996) suggest that thepenalty for diversification changed over time.
Three key transaction-specific forces noted in the literature are bidder rivalry, strategic fitand institutional blockholders. Datta et al. (1992) include bidder rivalry and strategic fit astwo of five key factors influencing shareholder wealth in their meta-analysis of 41 empiricalmerger studies. The role of institutional investors and other large blockholders, such as targetand bidder management, has been debated and investigated by a number of researchers(i.e.Shleifer and Vishny, 1986; Pound, 1988; Stulz et al., 1990 and Burkart, 1995). While all
L.M. Shelton / J. of Economic Behavior & Org. 41 (2000) 363–383 367
Fig. 3. Shifts in individual and aggregate supply curves for target shares.
large blockholders can use their voting rights to influence takeover attempts, this studyfocuses on institutional blockholders because they have no management role in either targetor bidder, and therefore are more likely to present a pure shareholder perspective consistentwith the derivation of the supply and demand curves.
Two of the remaining factors identified by Datta et al. (1992) — regulatory changesand mode of payment — are included in this study as control variables. The fifth factor,bidder approach, which distinguishes between tender offers and mergers, is not includedhere because this study is limited to mergers. A final control variable, relative size of targetand bidder, is included to control for the division of merger gains because Asquith et al.
368 L.M. Shelton / J. of Economic Behavior & Org. 41 (2000) 363–383
Fig. 4. Bidder demand for shares of a target.
(1983) find that relatively larger targets provide greater returns for bidders, but have noimpact on target firm gains.
2.2. Hypotheses
Once an offer is made, the bidding firm may face competition from other suitors whichshould increase the premium via an auction effect, thus reducing the gain to bidders andincreasing the gains to targets. The rivalry among bidders raises target shareholder expec-tations, and shifts the aggregate supply curve to the left, so that a higher price must beoffered for any given quantity of shares.3 The presence of rivals will shift the demandcurve upward if the initial offered price is not the maximum price the bidder is willing topay. Rival bidders can also cause the bidding firm to overpay by exacerbating the hubriseffect identified by Roll (1986), in which bidder managements overvalue and overpay fortargets. In addition, Burkart shows that bidders with initial stakes of target firm shares, ortoeholds, have an incentive to overbid in a bidding contest.
Hypothesis 1: The presence of multiple bidders in a merger contest increases the gain tothe target, and decreases the gain to the bidder.
3 In a single bidder contest, a value-increasing bidder offers enough only so that the marginal shareholder isbetter off tendering than holding on. Therefore, the winning bid must be epsilon greater than the sum of marginalshareholder’s expectation of the value of a minority share post-bid plus his transaction costs. If the bidder isattempting to acquire all outstanding shares, Bradley (1980) points out that target shares will cease to exist, so theshareholder’s post-bid valuation of a minority share will be zero if he expects the offer to succeed. Note that theshareholder will tender into such a bid whether or not he expects it to succeed.
L.M. Shelton / J. of Economic Behavior & Org. 41 (2000) 363–383 369
If this hypothesis is true, then a dummy variable denoting multiple bidders will be positivein a regression equation explaining target firm gains, and negative in a regression equationexplaining bidder gains.
Strategic fit impacts merger activity primarily from the demand side via the bidder firm’scalculation of the net benefits offered by various target firms. Depending on the objectives ofthe bidder firms, targets with greater strategic fit may offer greater net benefits, and thus maybe ranked more highly than those with less strategic fit. Thus, the major impact of strategicfit is on target firm rankings, and as result, bidders may have a higher demand for relatedtarget firms. Relatedness causes movement along the demand curve instead of a demandcurve shift. However, if bidders have other criteria for selecting merger partners, such asindustry ranking, financial strength or diversifying into new industries, then relatednesswould not improve the ranking of a target firm.
Hypothesis 2: Bidders acquiring related target firms will receive higher gains than biddersacquiring unrelated target firms.
This hypothesis will be confirmed if a variable measuring relatedness is positive in aregression equation explaining bidder firm gains.
Hypothesis 3: Related target firms will receive higher gains in merger than unrelatedtarget firms.
If this hypothesis is true, then the coefficients on strategic fit variables in a regressionequation explaining the gains to merger for targets should be positive indicating the paymentof higher premiums for related targets.
The price of a merger is the premium paid to the target. If merger waves result primarilyfrom demand effects, then the increase in demand during a peak would result in an upwarddemand shift that increases both merger premiums and merger quantities. This could resultfrom higher bidder valuations of target firms due to decreased risk in prosperous economicconditions, low interest rates, or trends toward industry consolidation. Merger waves basedon supply effects would result from an increased willingness to tender shares due to a de-crease in target shareholder expectations or transaction costs, and would lower the premiumpaid. The converse reasoning for both demand and supply curve shifts holds true for mergertrough periods. If both the supply and demand curves are shifting simultaneously, the priceeffect, or change in the average premium paid, is indeterminate, and depends on the relativeelasticities of the two curves. If merger peaks and troughs are caused by demand shifts,then merger premiums should rise during peaks and fall during troughs, but will move inthe opposite pattern if merger cycles result primarily from supply-side changes.
Hypothesis 4: The premium to targets increases during merger peaks and decreasesduring merger troughs.
This hypothesis is confirmed if a variable denoting the number of mergers per yearis positive in a regression equation explaining target firm gains. This finding would beconsistent with merger waves being caused by changes in bidder firm demand.
Hypothesis 5: The gain to bidders decreases during merger peaks and increases duringmerger troughs.
If this hypothesis is true, then a variable denoting the number of mergers per year willbe negative in a regression equation explaining bidder merger gains.
Given the complexity of the merger market, the demand and supply of target firm sharesmay also be affected by interactions between key forces. Some of the primary interaction
370 L.M. Shelton / J. of Economic Behavior & Org. 41 (2000) 363–383
effects include strategic fit and merger cycle, rivalry and merger cycle, and rivalry andstrategic fit. The interaction between relatedness and merger cycle will help to determinewhether the level of merger activity changes the size of the gain from strategic fit. Morck etal. (1990) found that the discount for conglomerate diversification was higher in 1980–1987than during 1975–1979, while Servaes (1996) reports that the diversification discount during1973–1976 decreased significantly from 1961 to 1970.
Hypothesis 6: Strategic fit will dampen the effect of the merger cycle by increasing thegains of bidders during merger peaks and increasing the gains of targets during mergertroughs.
If this hypothesis is true, then an interaction term between strategic fit and merger cyclewill be positive in both bidder and target firm equations.
Rivalry among bidding firms could either mitigate or enhance the impact of changes inthe merger cycle on target and bidder firm gains. Bidder rivalry would raise gains to targetsand reduce gains to the bidder in either the merger peak or trough phase, and this effectmight be particularly strong during merger peaks. An interaction term between strategic fitand rivalry would measure how rivalry impacts relatedness. The impact of increased biddercompetition for the most sought after targets could be isolated from the general gains torelated acquisitions.
Hypothesis 7: Increased bidder rivalry will lower the gain to bidders acquiring relatedtargets but will increase the gain to target shareholders.
This hypothesis will be confirmed if an interaction term between relatedness and multiplebidders is negative and positive respectively, in equations explaining bidder and target firmgains.
Hypothesis 8: Increased bidder rivalry will decrease the gain to bidders throughout themerger cycle but increase the gain to targets.
If this hypothesis is true, then an interaction term between the number of mergers andmultiple bidders will be negative in a regression equation explaining bidder firm gains, andpositive in an equation explaining target firm gains.
Large institutional blockholders of target firm shares also affect supply and demandcurves, but empirical evidence of the direction of their impact is mixed. Institutional block-holders can use their stakes to either facilitate or block the merger by attempting to eitherraise or lower target gains, and subsequently increasing or decreasing the premium required.Thus, large institutional shareholders can significantly increase or decrease aggregate supplycurve elasticity.4
Previous studies have presented two views of institutional blockholders with regard totheir participation in merger. Stulz et al. (1990) argue that since institutional investors aremotivated primarily by their low marginal capital gains tax rates, they are more likely to
4 Increases in heterogeneity of shareholder expectations decrease supply curve elasticity, while decreases inheterogeneity of expectations increase it. As differences in shareholder expectations rise, the vertical distancebetween points also increases due to a wider dispersion of reservation prices. If the number of shares held by eachshareholder remains constant, then the slope of the aggregate supply curve rises, and the curve becomes moreinelastic. If all shareholders share identical expectations, then the aggregate supply curve is perfectly elastic, andis identical to the individual supply curve in Fig. 1. The assumption that the number of shares tendered increasesmonotonically in the purchase price offered prevents a perfectly inelastic aggregate supply curve, in which a certainnumber of shares will not be sold at any price.
L.M. Shelton / J. of Economic Behavior & Org. 41 (2000) 363–383 371
tender their shares for a given premium. Their willingness to tender reduces the premiumrequired by the bidder, and therefore reduces the cost of the bidder to gain control. Ina sample of successful tender offers, Stulz et al. (1990) find that institutional ownershiphas a negative effect on target firm gains, which lends support to this view. However,Pound (1988) points out that institutional investors may have strategic alliances with targetmanagement, or conflict-of-interest problems preventing them from actively opposing anoutside takeover attempt. These issues may be strong enough to compel investors to simplysell their holdings, or even to vote with target management contrary to their fiduciaryinterests. His results from a study of proxy contests suggest that institutional owners arealigned with target management, and therefore would act to block the merger by raisingbidder firm costs. Since takeover attempts, like proxy contests, involve changes in the controlof firm assets, the tax considerations of Stulz et al. (1990), while important in a tenderoffer, are more likely to be superseded by issues involving strategic alliances with targetmanagement.
Hypothesis 9: As the percentage of a target firm’s stock held by institutional investorsincreases, the gain to target shareholders increases.
This hypothesis will be verified if a variable measuring the percentage of institutionalownership is positive in a regression equation explaining target firm gains. This would beconsistent with the findings of Pound (1988).
Hypothesis 10: As the percentage of a target firm’s stock held by institutional investorsincreases, the gain received by the bidder firm shareholders decreases.
If this hypothesis is true, then a variable denoting percentage of institutional ownershipwill be negative in a regression equation explaining bidder firm gains, which would againconfirm the findings of Pound (1988).
2.3. Control variables
Asquith et al. (1983) find that bidders gain more with larger targets, suggesting thatthe acquisition of a larger firm may provide greater opportunities to achieve economies ofscope; but, larger mergers may also be more difficult to manage. If bidders gain more fromacquiring larger targets, then a variable measuring the relative size of the target and thebidder will be positive and significant in the bidder equation. Likewise, if larger targets gainmore, then the variable will be positive and significant in the target equations.
Asquith et al. (1983); Schipper and Thompson (1983); Bradley et al. (1988), and Dattaet al. (1992) show that regulation is statistically significant in explaining merger gains tothe bidding firm. When Congress passed the Williams Act in July 1968, this regulationreduced the freedom that acquiring firms enjoyed in executing merger offers. Schipper andThompson (1983) found that the Williams Act and other regulations passed from July 1986until October 1969 reduced the gains to bidding firms. A dummy variable indicating whetherthe merger occurred before or after October 1969 should be negative in bidder equationsand positive in target equations.
According to Travlos (1987), takeover bids financed by stock exchange depress biddergains because stock exchange conveys that the bidding firm’s stock is overvalued. His resultsshow that bidders making stock exchange offers experience negative abnormal returnsregardless of the outcome of the bid. Datta et al. (1992) conclude that stock financing also
372 L.M. Shelton / J. of Economic Behavior & Org. 41 (2000) 363–383
depresses target firm gains due to the possible transfer of wealth to bondholders. Therefore,a variable indicating equity financing should be negative in target and bidder equations.
3. Method
3.1. Data
The acquisitions in this study were obtained by randomly selecting bidding firms accord-ing to the methodology of Rumelt (1974, 1978). Rumelt collected his sample by randomlyselecting 100 Fortune 500 industrial companies in 1949, 1959, and 1969 and 50 of thesecompanies in 1974. An additional random sample was taken of 100 Fortune 500 industrialcompanies in 1979 to include more mergers that occurred in the late 1970’s and early 1980’s.These randomly selected firms made 199 acquisitions during 1962–1983 that possessed thefollowing characteristics:1. both target and bidder appear on the CRSP tapes;2. sufficient line of business data is available for both target and bidder to determine the fol-
lowing information for each business unit: percentage of corporate revenue contributed,the products sold, and customers served;
3. sufficient information on institutional investor holdings is available from the S&P StockGuide.
The necessary line of business data to classify relatedness were obtained through annualreports, prospectuses and Moody’s Industrial Manual.
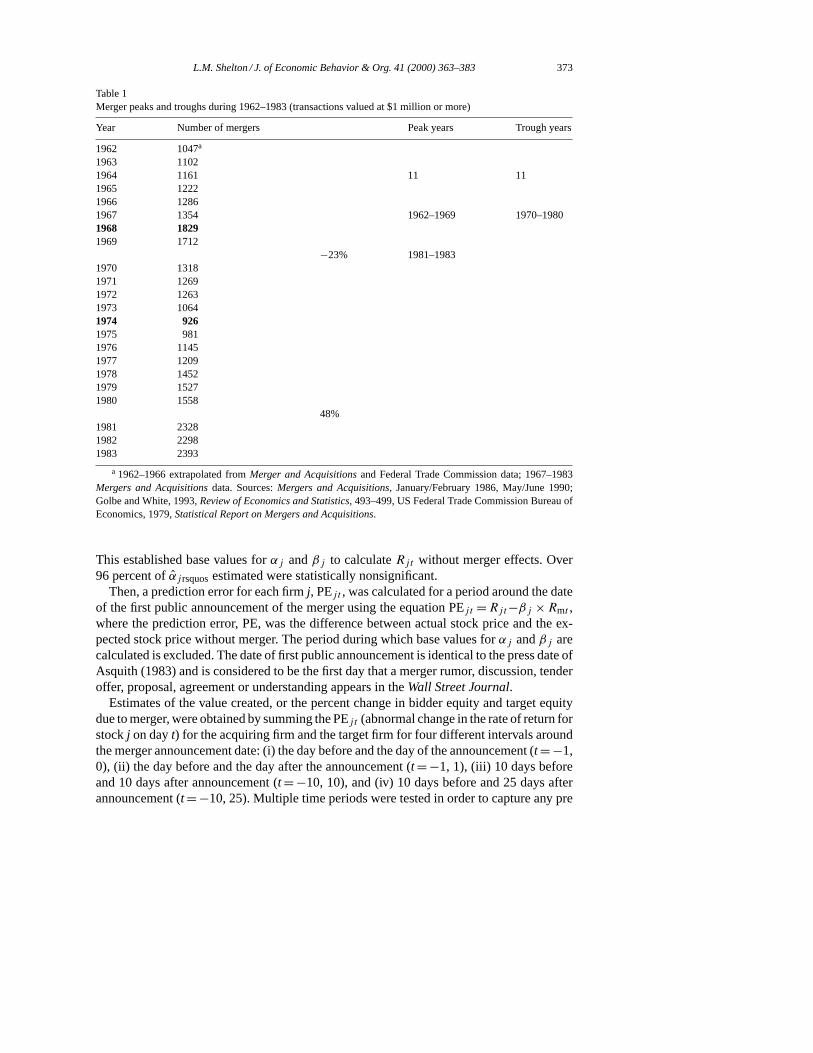
As Table 1 shows, the study time period includes 11 years of peak merger activity —1962–1969, 1981–1983, and 11 years of slow merger activity — 1970–1980. The mergerpeak and trough years identified by Golbe and White (1993) in their longitudinal study ofmerger wave activity from the late 1800’s are highlighted in boldface. A total of 46.2 percentor 92 of the mergers occurred during peak periods, and 53.8 percent occurred during troughperiods. The fairly equal distribution of the sample across peak and trough years permitseffective testing of the differences in the two types of mergers.
3.2. Dependent variables
The dependent variables, the percent change in bidder equity and the percent change intarget equity were derived using event study methodology to estimate the change in thebidder and target firm share prices due to merger. First, the expected share price withoutmerger was estimated using the market model employed by Dodd (1980):
Rjt + αj + βj × Rmt + εjt
whereRjt is rate of return on stockj over periodt, t = 1 day;Rmt is rate of return on valueweighted market portfolio over periodt; αj = E(Rjt )−βj × E(Rmt ); εjt is disturbance termof securityj in periodt, E(εjt ) = 0; βj = cov (Rjt , Rmt )/var (Rmt ).
For each merger,αj andβj were estimated for both the acquiring and acquired firms fora period of 250 trading days ending approximately 3 months before the merger press date.
L.M. Shelton / J. of Economic Behavior & Org. 41 (2000) 363–383 373
Table 1Merger peaks and troughs during 1962–1983 (transactions valued at $1 million or more)
Year Number of mergers Peak years Trough years
1962 1047a
1963 11021964 1161 11 111965 12221966 12861967 1354 1962–1969 1970–19801968 18291969 1712
−23% 1981–19831970 13181971 12691972 12631973 10641974 9261975 9811976 11451977 12091978 14521979 15271980 1558
48%1981 23281982 22981983 2393
a 1962–1966 extrapolated fromMerger and Acquisitionsand Federal Trade Commission data; 1967–1983Mergers and Acquisitionsdata. Sources:Mergers and Acquisitions, January/February 1986, May/June 1990;Golbe and White, 1993,Review of Economics and Statistics, 493–499, US Federal Trade Commission Bureau ofEconomics, 1979,Statistical Report on Mergers and Acquisitions.
This established base values forαj andβj to calculateRjt without merger effects. Over96 percent of̂αj rsquosestimated were statistically nonsignificant.
Then, a prediction error for each firmj, PEj t , was calculated for a period around the dateof the first public announcement of the merger using the equation PEj t = Rjt−βj × Rmt ,where the prediction error, PE, was the difference between actual stock price and the ex-pected stock price without merger. The period during which base values forαj andβj arecalculated is excluded. The date of first public announcement is identical to the press date ofAsquith (1983) and is considered to be the first day that a merger rumor, discussion, tenderoffer, proposal, agreement or understanding appears in theWall Street Journal.
Estimates of the value created, or the percent change in bidder equity and target equitydue to merger, were obtained by summing the PEj t (abnormal change in the rate of return forstockj on dayt) for the acquiring firm and the target firm for four different intervals aroundthe merger announcement date: (i) the day before and the day of the announcement (t = −1,0), (ii) the day before and the day after the announcement (t = −1, 1), (iii) 10 days beforeand 10 days after announcement (t = −10, 10), and (iv) 10 days before and 25 days afterannouncement (t = −10, 25). Multiple time periods were tested in order to capture any pre
374 L.M. Shelton / J. of Economic Behavior & Org. 41 (2000) 363–383
and post announcement gains. Bradley (1980) and Keown and Pinkerton (1981) show that asignificant amount of the target firm’s gain can occur before the merger announcement date.
3.3. Independent variables
Rivalry. This dummy variable equals one if more than one firm was bidding for the target,and is zero otherwise.
Strategic fit. This variable measures the percentage of related strategic fits in the merger,which were determined by pairwise comparisons of line of business data for each businessunit of the target and bidder as in Shelton (1988). The relationship between each pairof business units was classified into one of two possible strategic categories: related orunrelated. Businesses units were considered related if they met one of the following criteria:1. target and bidder business units in the same business;2. target unit enables bidder to integrate forward or backward, expand product lines or
otherwise consolidate the bidder’s market position;3. target unit enables bidder to enter new but related markets.The unrelated category is self-explanatory. If any two target and bidder businesses are
considered related using the above criteria, then the percentage of sales for each of thetwo related units together are multiplied together to yield a percentage of the combinedsales of the merger(i.e. 20 percent× 30 percent= 6 percent). The percentages of the com-bined sales for each related target — bidder business pair are then summed to yield a totalpercentage of related combined sales for the merger ranging from 0 to 100 percent. Thisprocedure provides a continuous measure of relatedness, as opposed to a simple dummyvariable.
Merger cycle. For each merger, this variable denotes the number of mergers which oc-curred during the announcement year over $1 MM/1000. High values of this variable indicatethat the merger occurred during a peak in the merger cycle, while low values indicate thatit occurred during a trough.
Merger cycle*strategic fit. The interaction between merger cycle and strategic fit is mea-sured by multiplying the percentage of related strategic fits by the number of mergers duringthe announcement year divided by 1000.
Rivalry*strategic fit. The interaction between rivalry and strategic fit is measured bymultiplying the rivalry dummy variable by the percentage of related strategic fits.
Merger cycle*rivalry. The interaction between rivalry and merger cycle is measured bymultiplying the rivalry dummy variable by the number of mergers during the announcementyear divided by 1000.
Institutional holdings. This variable measures institutional holdings divided by total com-mon stock.
Relative size. The relative size of the target was measured by dividing target firm salesby bidder firm sales.
Regulation. This dummy variable equals one if the merger occurred after October 1969when the Williams Act went into effect, and is zero otherwise.
Equity financing. This dummy variable equals one if the merger was financed by stockexchange, and is zero if the merger was financed by cash.
L.M. Shelton / J. of Economic Behavior & Org. 41 (2000) 363–383 375
4. Results
4.1. Correlation matrix and prediction errors
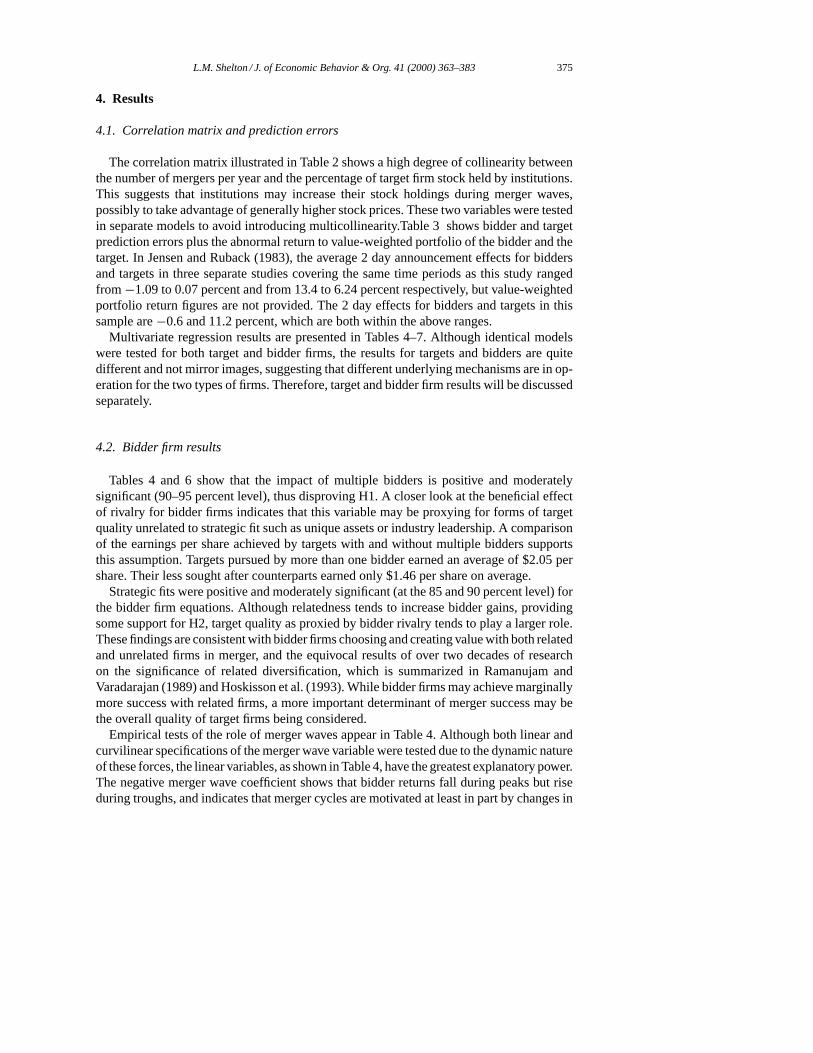
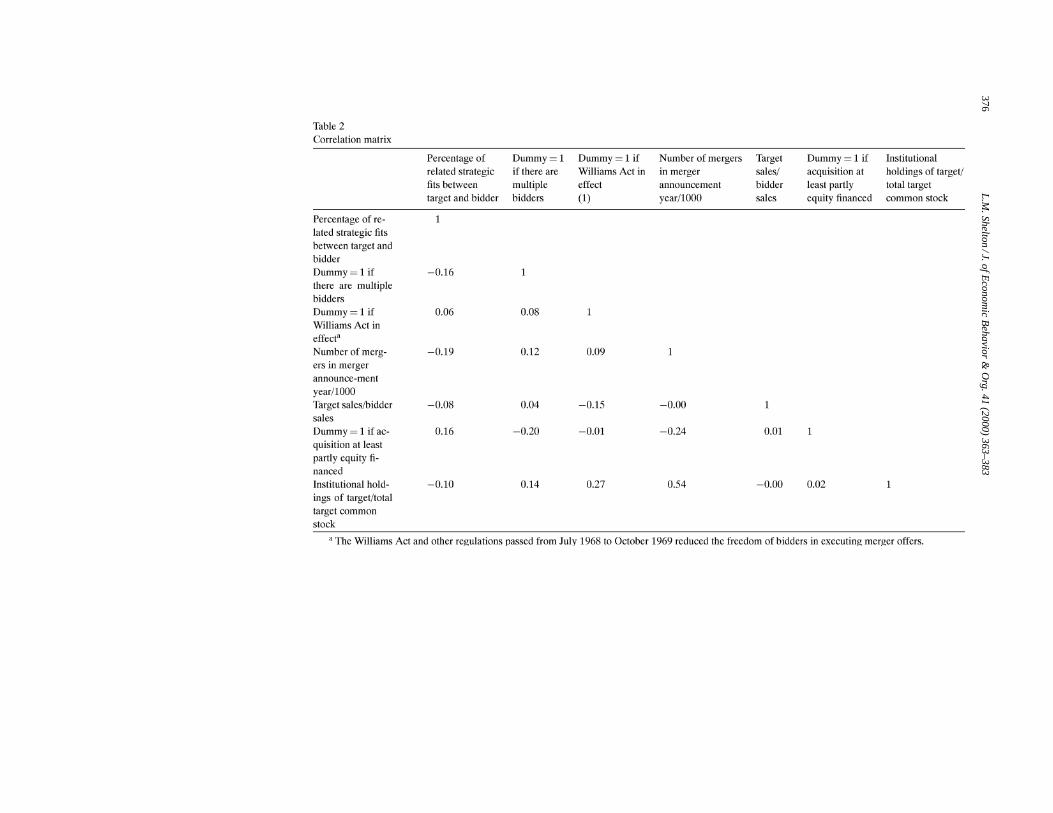
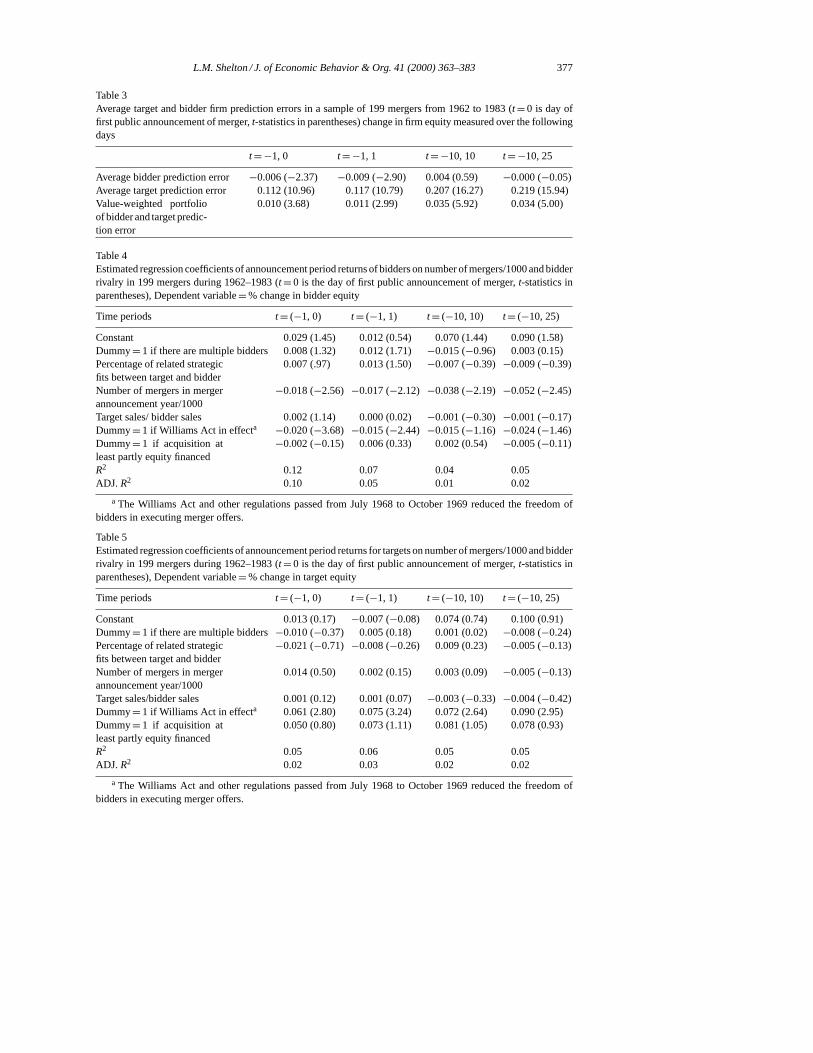
The correlation matrix illustrated in Table 2 shows a high degree of collinearity betweenthe number of mergers per year and the percentage of target firm stock held by institutions.This suggests that institutions may increase their stock holdings during merger waves,possibly to take advantage of generally higher stock prices. These two variables were testedin separate models to avoid introducing multicollinearity.Table 3 shows bidder and targetprediction errors plus the abnormal return to value-weighted portfolio of the bidder and thetarget. In Jensen and Ruback (1983), the average 2 day announcement effects for biddersand targets in three separate studies covering the same time periods as this study rangedfrom −1.09 to 0.07 percent and from 13.4 to 6.24 percent respectively, but value-weightedportfolio return figures are not provided. The 2 day effects for bidders and targets in thissample are−0.6 and 11.2 percent, which are both within the above ranges.
Multivariate regression results are presented in Tables 4–7. Although identical modelswere tested for both target and bidder firms, the results for targets and bidders are quitedifferent and not mirror images, suggesting that different underlying mechanisms are in op-eration for the two types of firms. Therefore, target and bidder firm results will be discussedseparately.
4.2. Bidder firm results
Tables 4 and 6 show that the impact of multiple bidders is positive and moderatelysignificant (90–95 percent level), thus disproving H1. A closer look at the beneficial effectof rivalry for bidder firms indicates that this variable may be proxying for forms of targetquality unrelated to strategic fit such as unique assets or industry leadership. A comparisonof the earnings per share achieved by targets with and without multiple bidders supportsthis assumption. Targets pursued by more than one bidder earned an average of $2.05 pershare. Their less sought after counterparts earned only $1.46 per share on average.
Strategic fits were positive and moderately significant (at the 85 and 90 percent level) forthe bidder firm equations. Although relatedness tends to increase bidder gains, providingsome support for H2, target quality as proxied by bidder rivalry tends to play a larger role.These findings are consistent with bidder firms choosing and creating value with both relatedand unrelated firms in merger, and the equivocal results of over two decades of researchon the significance of related diversification, which is summarized in Ramanujam andVaradarajan (1989) and Hoskisson et al. (1993). While bidder firms may achieve marginallymore success with related firms, a more important determinant of merger success may bethe overall quality of target firms being considered.
Empirical tests of the role of merger waves appear in Table 4. Although both linear andcurvilinear specifications of the merger wave variable were tested due to the dynamic natureof these forces, the linear variables, as shown in Table 4, have the greatest explanatory power.The negative merger wave coefficient shows that bidder returns fall during peaks but riseduring troughs, and indicates that merger cycles are motivated at least in part by changes in
376L
.M.S
he
lton
/J.ofE
con
om
icB
eh
avio
r&
Org.4
1(2
00
0)
36
3–
38
3
L.M. Shelton / J. of Economic Behavior & Org. 41 (2000) 363–383 377
Table 3Average target and bidder firm prediction errors in a sample of 199 mergers from 1962 to 1983 (t = 0 is day offirst public announcement of merger,t-statistics in parentheses) change in firm equity measured over the followingdays
t = −1, 0 t = −1, 1 t = −10, 10 t = −10, 25
Average bidder prediction error −0.006 (−2.37) −0.009 (−2.90) 0.004 (0.59) −0.000 (−0.05)Average target prediction error 0.112 (10.96) 0.117 (10.79) 0.207 (16.27) 0.219 (15.94)Value-weighted portfolioof bidder and target predic-tion error
0.010 (3.68) 0.011 (2.99) 0.035 (5.92) 0.034 (5.00)
Table 4Estimated regression coefficients of announcement period returns of bidders on number of mergers/1000 and bidderrivalry in 199 mergers during 1962–1983 (t = 0 is the day of first public announcement of merger,t-statistics inparentheses), Dependent variable= % change in bidder equity
Time periods t = (−1, 0) t = (−1, 1) t = (−10, 10) t = (−10, 25)
Constant 0.029 (1.45) 0.012 (0.54) 0.070 (1.44) 0.090 (1.58)Dummy= 1 if there are multiple bidders 0.008 (1.32) 0.012 (1.71)−0.015 (−0.96) 0.003 (0.15)Percentage of related strategicfits between target and bidder
0.007 (.97) 0.013 (1.50) −0.007 (−0.39) −0.009 (−0.39)
Number of mergers in mergerannouncement year/1000
−0.018 (−2.56) −0.017 (−2.12) −0.038 (−2.19) −0.052 (−2.45)
Target sales/ bidder sales 0.002 (1.14) 0.000 (0.02)−0.001 (−0.30) −0.001 (−0.17)Dummy= 1 if Williams Act in effecta −0.020 (−3.68) −0.015 (−2.44) −0.015 (−1.16) −0.024 (−1.46)Dummy= 1 if acquisition atleast partly equity financed
−0.002 (−0.15) 0.006 (0.33) 0.002 (0.54) −0.005 (−0.11)
R2 0.12 0.07 0.04 0.05ADJ. R2 0.10 0.05 0.01 0.02
a The Williams Act and other regulations passed from July 1968 to October 1969 reduced the freedom ofbidders in executing merger offers.
Table 5Estimated regression coefficients of announcement period returns for targets on number of mergers/1000 and bidderrivalry in 199 mergers during 1962–1983 (t = 0 is the day of first public announcement of merger,t-statistics inparentheses), Dependent variable= % change in target equity
Time periods t = (−1, 0) t = (−1, 1) t = (−10, 10) t = (−10, 25)
Constant 0.013 (0.17) −0.007 (−0.08) 0.074 (0.74) 0.100 (0.91)Dummy= 1 if there are multiple bidders−0.010 (−0.37) 0.005 (0.18) 0.001 (0.02) −0.008 (−0.24)Percentage of related strategicfits between target and bidder
−0.021 (−0.71) −0.008 (−0.26) 0.009 (0.23) −0.005 (−0.13)
Number of mergers in mergerannouncement year/1000
0.014 (0.50) 0.002 (0.15) 0.003 (0.09)−0.005 (−0.13)
Target sales/bidder sales 0.001 (0.12) 0.001 (0.07)−0.003 (−0.33) −0.004 (−0.42)Dummy= 1 if Williams Act in effecta 0.061 (2.80) 0.075 (3.24) 0.072 (2.64) 0.090 (2.95)Dummy= 1 if acquisition atleast partly equity financed
0.050 (0.80) 0.073 (1.11) 0.081 (1.05) 0.078 (0.93)
R2 0.05 0.06 0.05 0.05ADJ. R2 0.02 0.03 0.02 0.02
a The Williams Act and other regulations passed from July 1968 to October 1969 reduced the freedom ofbidders in executing merger offers.
378 L.M. Shelton / J. of Economic Behavior & Org. 41 (2000) 363–383
Table 6Estimated regression coefficients of announcement period returns for bidders on institutional ownership of targetand bidder rivalry in 199 mergers during 1962–1983 (t = 0 is the day of first public announcement of merger,t-statistics in parentheses), Dependent variable= % change in bidder equity
Time periods t = (−1, 0) t = (−1, 1) t = (−10, 10) t = (−10, 25)
Constant −0.003 (−0.22) −0.019 (−1.06) 0.002 (0.07) 0.001 (0.03)Dummy= 1 if there are multiple bidders 0.010 (1.60) 0.015 (1.98)−0.013 (−0.82) 0.004 (0.19)Percentage of related strategicfits between target and bidder
0.007 (1.04) 0.013 (1.54) −0.005 (−0.27) −0.003 (−0.14)
Institutional holdings of tar-get/total target common stock
−0.072 (−3.61) −0.074 (−3.21) −0.105 (−2.10) −0.080 (−1.31)
Target sales/bidder sales 0.002 (1.26) 0.000 (0.11)−0.001 (−0.24) −0.001 (−0.14)Dummy= 1 if Williams Act in effecta −0.015 (−2.86) −0.011 (−1.71) −0.010 (−0.75) −0.021 (−1.27)Dummy= 1 if acquisition atleast partly equity financed
0.009 (0.59) 0.017 (0.97) 0.023 (0.63) 0.021 (0.47)
R2 0.15 0.11 0.04 0.02ADJ. R2 0.12 0.08 0.01 −0.01
a The Williams Act and other regulations passed from July 1968 to October 1969 reduced the freedom ofbidders in executing merger offers.
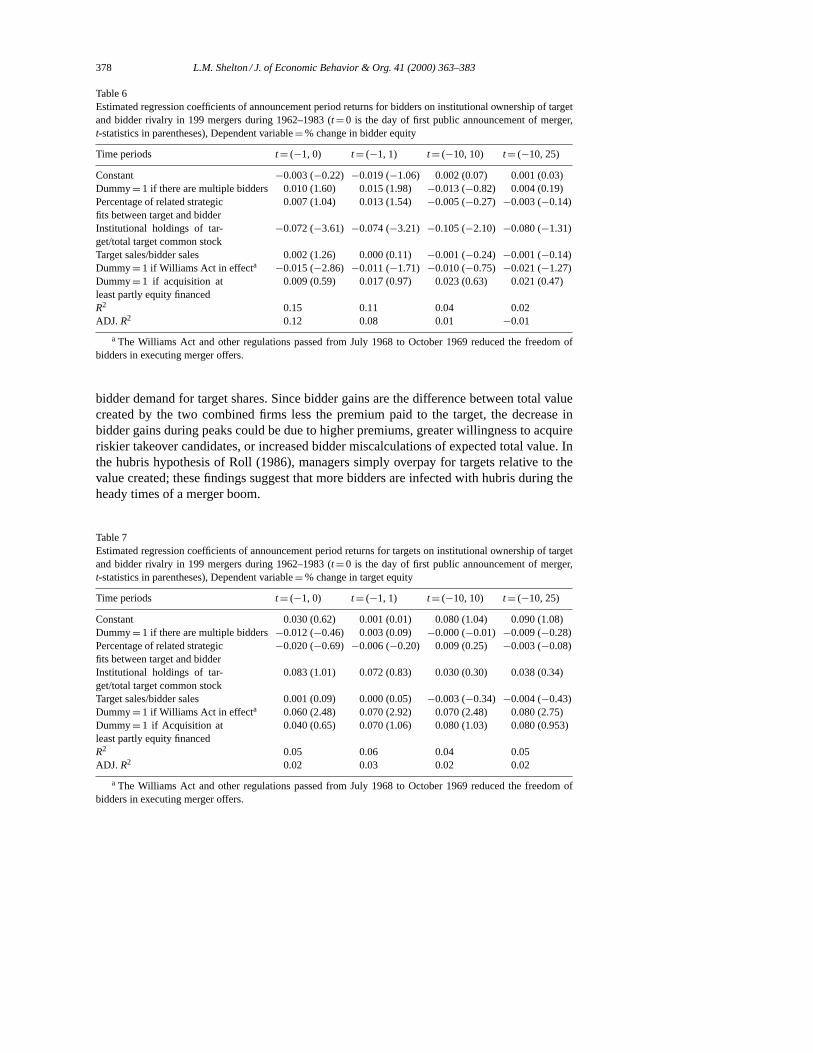
bidder demand for target shares. Since bidder gains are the difference between total valuecreated by the two combined firms less the premium paid to the target, the decrease inbidder gains during peaks could be due to higher premiums, greater willingness to acquireriskier takeover candidates, or increased bidder miscalculations of expected total value. Inthe hubris hypothesis of Roll (1986), managers simply overpay for targets relative to thevalue created; these findings suggest that more bidders are infected with hubris during theheady times of a merger boom.
Table 7Estimated regression coefficients of announcement period returns for targets on institutional ownership of targetand bidder rivalry in 199 mergers during 1962–1983 (t = 0 is the day of first public announcement of merger,t-statistics in parentheses), Dependent variable= % change in target equity
Time periods t = (−1, 0) t = (−1, 1) t = (−10, 10) t = (−10, 25)
Constant 0.030 (0.62) 0.001 (0.01) 0.080 (1.04) 0.090 (1.08)Dummy= 1 if there are multiple bidders−0.012 (−0.46) 0.003 (0.09) −0.000 (−0.01) −0.009 (−0.28)Percentage of related strategicfits between target and bidder
−0.020 (−0.69) −0.006 (−0.20) 0.009 (0.25) −0.003 (−0.08)
Institutional holdings of tar-get/total target common stock
0.083 (1.01) 0.072 (0.83) 0.030 (0.30) 0.038 (0.34)
Target sales/bidder sales 0.001 (0.09) 0.000 (0.05)−0.003 (−0.34) −0.004 (−0.43)Dummy= 1 if Williams Act in effecta 0.060 (2.48) 0.070 (2.92) 0.070 (2.48) 0.080 (2.75)Dummy= 1 if Acquisition atleast partly equity financed
0.040 (0.65) 0.070 (1.06) 0.080 (1.03) 0.080 (0.953)
R2 0.05 0.06 0.04 0.05ADJ. R2 0.02 0.03 0.02 0.02
a The Williams Act and other regulations passed from July 1968 to October 1969 reduced the freedom ofbidders in executing merger offers.
L.M. Shelton / J. of Economic Behavior & Org. 41 (2000) 363–383 379
The greater explanatory power of the linear specification suggests that changes in bidderdemand occur at a fairly even rate throughout the merger cycle. The aggregate demandcurve shifts down during merger troughs and up during merger waves, with bidder gainsvarying over the merger cycle as expected, increasing during troughs and declining duringpeaks and supporting H5.
Thet-statistics of the merger cycle interaction effect coefficients were all less than unity,and thus hypotheses H6, H7 and H8 are not supported.5 These results suggest that strategicfit, bidder rivalry and the merger cycle each impact bidder firm gains independently, insteadof acting in concert. Unlike Morck et al. (1990) and Servaes (1996), this study finds nosignificant change in the discount for diversification over the course of the merger cycle.This may be due to two reasons: (i) that a continuous measure was used here instead oftime dummies as in the other two studies, and (ii) this study covers a 21 year time period(1962–1983) as opposed to the 12 year study spans of Morck et al. (1990) (1975–1987);Servaes (1996) (1961–1970, 1973–1976).
The role of institutional investors was tested in Table 6, with institutional ownership oftarget shares being negative and highly significant in both the square root specification ofStulz et al. (1990), and the linear specification, which provided more explanatory powerhere. Accordingly, these results support H10, and the findings of Pound (1988), while con-tradicting the results of Stulz et al. (1990). This is consistent with institutional investorsallying with target management and increasing the cost to the bidder as opposed to facil-itating the merger. It is also consistent with independent institutional investors using theirvoting rights to maximize the return to their holdings.
4.3. Target firm results
The target firm results in Tables 5 and 7 indicate that merger premiums are constantexcept for changes in legislation. The dummy variable representing the passage of theWilliams act is significant and positive, which is consistent with the findings of Schipperand Thompson (1983), and Datta et al. (1992). These results are not surprising since themajority of the transactions in this sample are equity-financed mergers, and Huang andWalkling (1987); Comment and Schwert (1995); Schwert (1996) all find that the type oftransaction is the most important determinant of target firm premiums. The insignificanceof the equity financing dummy may primarily be due to lack of variation in the sample; onlyfour of the 199 mergers did not include some form of equity financing. This frequency ofstock financing is consistent with Travlos (1987), who finds that mergers tend to be financedby stock exchange, unlike tender offers which tend to be financed by cash. The importanceof regulation is also supported by Comment and Schwert (1995), who find that legislation,in the form of control share laws and business combination laws, raises merger premiumsin a study of mergers and tender offers from 1977 to 1991.
4.4. Other findings
An additional important result is that the 2 day (t = −1, 0) and 3 day (t = −1, 1) timeperiods consistently had the greatest explanatory power of the four time intervals tested
5 Results available from the author upon request.
380 L.M. Shelton / J. of Economic Behavior & Org. 41 (2000) 363–383
across all of the models. While these results are at odds with the findings of Bradley (1980),and Keown and Pinkerton (1981), they do support the results of Asquith (1983), and Jensenand Ruback (1983). One possible explanation is differences in determining announcementdates. Here, announcement dates are defined as in Asquith (1983) — the first day anydiscussion or rumor of a merger appears in theWall Street Journal, while in Keown andPinkerton (1981), firms supplied their own announcement dates. In Bradley (1980), a precisedefinition of the announcement date is not given.
Another key finding which was consistent across all models tested involved the relativesize of target and bidder. The target sales/bidder sales variable was positive, but significantonly at the 80–85 percent level for bidder equations, and nonsignificant for target firms,indicating that larger targets tend to increase the gains to bidding firms slightly, and mayhave no impact on the gains to target firms. These results are consistent with Rhoades(1987); Slusky and Caves (1991), and lend some support to the findings of Asquith et al.(1983).
5. Discussion and implications
The approach of studying both the supply and demand sides of mergers over time re-veals a dynamic market in which the ebb and flow of bidder demand for target firm sharesis key in determining the division of merger gains. During merger peaks, bidder gainsfall, suggesting that bidders are more aggressive, displaying greater tendencies to over-pay for target firms or to assume more risk in pursuing takeover projects. More reticent,risk-averse bidder behavior during merger troughs results in increases in bidder gains,while target premiums remain relatively fixed, varying primarily with changes in reg-ulation and by transaction type. The surplus received by bidders varies more than thepremium received by targets, illustrating that target and bidder behavior are not mirrorimages.
The passive role of target firm shareholders, who make a simple accept or reject decisionwhen presented with merger bids, is contrasted to the more active role of bidder man-agements, who undertake a more complex process of ranking and pursuing target firms.Confirming the view that different mechanisms are in place for targets and bidders is thefinding that despite several identical models being tested for both targets and bidders, theexplanatory power of the equations differed markedly for the two different types of firms.In fact, only one variable, regulation, supported the mirror image concept by being consis-tently significant and of opposite signs in both sets of equations. This analysis suggests thattarget shareholders are deal focused, requiring certain returns for certain types of deals, andsheds some insight as to why previous research has found that transaction type is the mostreliable indicator of changes in premium.
The behavior of institutional investors who own target firm shares leads to a decreasethe gains to bidders, and appears to be the result of several factors. As Pound (1988)suggests, they may align with target management when control of the firm is involved(i.e. proxy contests and mergers) as opposed to allying with potential suitors or focusingon tax considerations. Alternatively, institutional investors may see a merger offer as anopportunity to maximize the gain on their holdings.
L.M. Shelton / J. of Economic Behavior & Org. 41 (2000) 363–383 381
Taken together, these findings suggest that bidder firms could benefit from a contrarianstrategy, and purchase during merger troughs. Bidding contests do not necessarily result inpoor outcomes, especially if the target firm is a strong candidate and in a related industry.Conservative valuation of prospective candidates, with care to avoid any hubris, may be themost critical factor in maximizing bidder firm gains.
A number of avenues for further research have been opened up by this study. One possi-bility involves examining whether the incidence of transaction types varies with the phaseof the merger cycle. The transactions in this sample were overwhelmingly of a single type,stock-financed mergers. If the percentage of all-cash deals rises during merger peaks, thenthe average premium per transaction will also rise. In addition, target supply curve shiftscould be examined by testing variables that would plausibly affect shareholder expectationssuch as trends in target firm profitability, market share or earnings, and then interactingthese variables with number of mergers to determine if target shareholder expectations dovary with the merger cycle.
Target quality seems to more important in creating value for bidder firms that strategicrelatedness, and helps explain the very mixed results on the importance of related diversifi-cation in the strategy literature. This suggests that multiple factors are entering the bidderranking process for selecting target firms, and another direction for future research would bedetermining which factors are most critical. Montgomery (1985) finds that industry effectsand market share are significant while Rhoades (1987) finds that firm growth and marketgrowth were significant for bidder firms in his study on banks.
Additional research is also needed to determine if institutional investors are aligning withtarget management, or negotiating to get the best return on their holdings. If they are aligningwith target management, this raises the question as to whether potentially beneficial mergersare blocked, and must be considered in the context of institutional activism. An additionalavenue for further research would be examining the role of other large blockholders, suchas target and bidder management to determine how the prospect of relinquishing or gaininga management role impacts the shape of the demand and supply curves.
This study represents an initial foray into analyzing the dynamics of the merger market,and analyzing the interaction of supply and demand effects on target and bidder shareholders,and as such, it has unearthed a number of areas ripe for future research, and for additionallearning for academicians and practitioners alike.
Acknowledgements
I am especially indebted to two anonymous referees for excellent comments. Thanks alsogo to Richard Caves for suggestions on an earlier draft, and to Lawrence Officer, HoustonStokes, Kathryn Ierulli, John Binder, Tony Pagano, Chem Narayana, and Maryann Albrechtfor critical advice. I would also like to thank seminar participants in the Pure and AppliedPrice Theory Workshop at the University of Illinois Chicago. Maria Kraimer providedvaluable research assistance. I am grateful for financial support from the Dean’s Office ofthe College of Business Administration at the University of Illinois at Chicago. Any errors,of course, are my own.
382 L.M. Shelton / J. of Economic Behavior & Org. 41 (2000) 363–383
References
Alexander, G.J., Benson, G.P., Kampmeyer, J., 1984. Investigating the valuation effects of announcement ofvoluntary divestitures. Journal of Finance 39, 503–517.
Asquith, P., 1983. Merger bids, uncertainty, and stockholder returns. Journal of Financial Economics 11, 51–83.Asquith, P., Bruner, R.F., Mullins, D.W., 1983. The gains to bidding firms from merger. Journal of Financial
Economics 11, 121–139.Bagwell, L., 1991. Share repurchase and takeover deterrence. Rand Journal of Economics 22, 72–88.Bettis, R., 1981. Performance differences in related and unrelated diversified firms. Strategic Management Journal
2, 379–393.Bhide, A., 1990. Reversing corporate diversification. Journal of Applied Corporate Finance 3, 70–81.Bradley, M., 1980. Interfirm tender offers and the market for corporate control. Journal of Business 53, 345–376.Bradley, M., Desai, A., Kim, E.H., 1988. Synergistic gains from corporate acquisitions and their division between
the stockholders of target and acquiring firms. Journal of Financial Economics 21, 3–40.Burkart, M., 1995. Initial shareholdings and overbidding in takeover contests. Journal of Finance 50 (5), 1491–
1515.Chatterjee, S., Wernerfelt, B., 1991. The link between resources and type of diversification: theory and evidence.
Strategic Management Journal 12, 33–48.Comment, R., Schwert, G.W., 1995. Poison or placebo? Evidence on the deterrence and wealth effects of modern
antitakeover measures. Journal of Financial Economics 39, 3–43.Datta, D.K., Pinches, G.E., Narayanan, V.K., 1992. Factors influencing wealth creation from mergers and
acquisitions: a meta-analysis. Strategic Management Journal 13, 67–84.Dodd, P., 1980. Merger proposals, management discretion and stockholder wealth. Journal of Financial Economics
8, 105–137.Golbe, D.L., White, L.J., 1993. Catch a wave: the time series behavior of mergers. The Review of Economics and
Statistics 75, 493–499.Grossman, S.J., Hart, O.D., 1980. Takeover bids, the free-rider problem, and the theory of the corporation. Bell
Journal of Economics 11 (1), 42–64.Hite, G.L., Owers, J.E., Rogers, R.C., 1987. The market for interfirm assets sales: partial sell-offs and total
liquidations. Journal of Financial Economics 18, 229–252.Hoskisson, R.E., Hitt, M.A., Johnson, R.J., Moesel, D.D., 1993. Construct validity of an objective (entropy)
categorical measure of diversification strategy. Strategic Management Journal 14, 215–235.Huang, Y., Walkling, R.A., 1987. Target abnormal returns associated with acquisition announcements payment,
acquisition form, and managerial resistance. Journal of Financial Economics 19, 329–349.Jensen, M.C., Ruback, R.S., 1983. The market for corporate control: the scientific evidence. Journal of Financial
Economics 11, 5–49.Jensen, M.C., 1986. Agency costs of free cash flow, corporate finance, and takeovers. American Economic Review
76, 323–329.John, K., Ofek, E., 1995. Asset sales and increase in focus. Journal of Financial Economics 37, 105–126.Keown, A.J., Pinkerton, J.M., 1981. Merger announcements and insider trading activity: an empirical investigation.
Journal of Finance 36, 855–867.Lang, L., Poulsen, A., Stulz, R., 1995. Asset sales, firm performance, and the agency costs of managerial discretion.
Journal of Financial Economics 37, 3–37.Lang, L.H., Stulz, R.M., Walkling, R.A., 1989. Managerial performance, Tobin’sq, and the gains from successful
tender offers. Journal of Financial Economics 24, 137–154.Lang, L.H., Stulz, R.M., Walkling, R.A., 1991. A test of the free cash flow hypothesis: the case of bidder returns.
Journal of Financial Economics 29, 315–335.Lubatkin, M., 1983. Mergers and the performance of the acquiring firm. Academy of Management Review 8 (2),
218–225.Maloney, M.T., McCormick, R.E., Mitchell, M.L., 1993. Managerial decision making and capital structure. Journal
of Business 66, 189–217.Markides, C.C., Williamson, P.J., 1994. Related diversification, core competences and corporate performance.
Strategic Management Journal 15, 149–165.
L.M. Shelton / J. of Economic Behavior & Org. 41 (2000) 363–383 383
Montgomery, C.A., 1979. Diversification market structure and firm performance: an extension of Rumelt’s model.Unpublished doctoral dissertation, Purdue University.
Montgomery, C.A., 1985. Product market diversification and market power. Academy of Management Journal 28,784–798.
Morck, R., Shleifer, A., Vishny, R.W., 1990. Do managerial objectives drive bad acquisitions? Journal of Finance45, 31–48.
Ofek, E., 1993. Capital structure and firm response to poor performance: an empirical analysis. Journal of FinancialEconomics 34, 3–30.
Palepu, K.G., 1985. Diversification strategy, profit performance and the entropy measure. Strategic ManagementJournal 6, 239–255.
Pound, J., 1988. Proxy contests and the efficiency of shareholder oversight. Journal of Financial Economics 20,237–265.
Ramanujam, V., Varadarajan, P., 1989. Research on corporate diversification: a synthesis. Strategic ManagementJournal 10, 523–551.
Ravenscraft, D.J., Scherer, F.M., 1987. Mergers, sell-offs and economic efficiency. The Brookings Institution,washington, D.C..
Rhoades, S.A., 1987. Determinants of premiums paid in bank acquisitions. Atlantic Economic Journal 20, 20–30.Robins, J., Wiersma, M.F., 1995. A resource-based approach to the multibusiness firm: empirical analysis of
portfolio interrelationships and corporate financial performance. Strategic Management Journal 16, 277–299.Roll, R., 1986. The Hubris hypothesis of corporate takeovers. Journal of Business 59 (2), 197–216.Rumelt, R.P., 1974. Strategy, structure and economic performance. Division of Research, Graduate School of
Business Administration, Harvard University, Boston, M.A..Rumelt, R.P., 1978. Data bank on diversification strategy and corporate structure. Working paper MGL-55,
Managerial Studies Center, Graduate School of Management, University of California, Los Angeles.Schipper, K., Thompson, R., 1983. Evidence on the capitalized value of merger activity for acquiring firms. Journal
of Financial Economics 11, 85–119.Schwert, G.W., 1996. Markup pricing in mergers and acquisitions. Journal of Financial Economics 41, 153–192.Servaes, H., 1996. The value of diversification during the conglomerate merger wave. Journal of Finance 51 (4),
1201–1225.Shelton, L.M., 1988. Strategic business fits and corporate acquisition: empirical evidence. Strategic Management
Journal 9, 279–287.Shleifer, A., Vishny, R.W., 1986. Large shareholders and corporate control. Journal of Political Economy 94 (3),
461–488.Shleifer, A., Vishny, R.W., 1992. Asset liquidity and debt capacity. Journal of Finance 47, 1343–1366.Singh, H., Montgomery, C.A., 1987. Corporate acquisition strategies and economic performance. Strategic
Management Journal 8, 377–386.Slovin, M.B., Sushka, M.E., Ferraro, S.R., 1995. A comparison of the information conveyed by equity carve-outs,
spin-offs, and asset sell-offs. Journal of Financial Economics 37, 89–104.Slusky, A.R., Caves, R.E., 1991. Synergy, agency and the determinants of premia paid in mergers. The Journal of
Industrial Economics 39, 277–296.Smith, R.L., Kim, J., 1994. The combined effects of free cash flow and financial slack on bidder and target stock
returns. Journal of Business 67, 281–310.Stulz, R.M., Walkling, R.A., Song, M.H., 1990. The distribution of target ownership and the division of gains in
successful takeovers. Journal of Finance 45, 817–833.Travlos, N.G., 1987. Corporate takeover bids, methods of payment, and bidding firms stock returns. Journal of
Finance 42, 943–963.US Federal Trade Commission Bureau of Economics, 1979. Statistical Report on Mergers and Acquisition. FTC,
1981, Washington, DC.
Related Documents