Mercury Accumulation in Alpine Lakes, Colorado David Manthorne, USGS Mark Williams, CU-Boulder

Mercury Accumulation in Alpine Lakes, Colorado David Manthorne, USGS Mark Williams, CU-Boulder.
Dec 25, 2015
Welcome message from author
This document is posted to help you gain knowledge. Please leave a comment to let me know what you think about it! Share it to your friends and learn new things together.
Transcript

Mercury Accumulation in Alpine Lakes, Colorado
David Manthorne, USGS
Mark Williams, CU-Boulder

Problem Statement• Concern for mercury arose from human health
effects caused by mercury ingestion from freshwater and marine fish, in which mercury bioaccumulates
• Documented bioaccumulation of mercury in fish has occurred in many high elevation lakes in Sweden (Johansson et al., 1995)
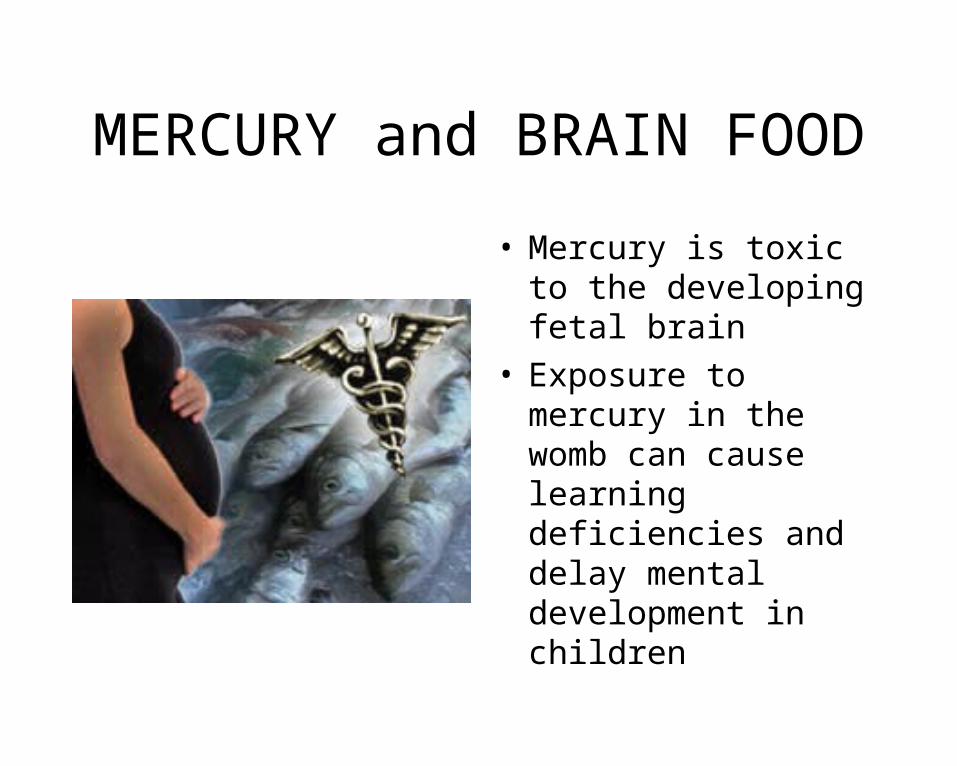
• In 1998, five water bodies in Colorado were put on the EPA section 303(d) list for impaired water bodies – Hg content in fish exceeded advisory levels of 0.5mg kg-1
MERCURY and BRAIN FOOD
• Mercury is toxic to the developing fetal brain
• Exposure to mercury in the womb can cause learning deficiencies and delay mental development in children
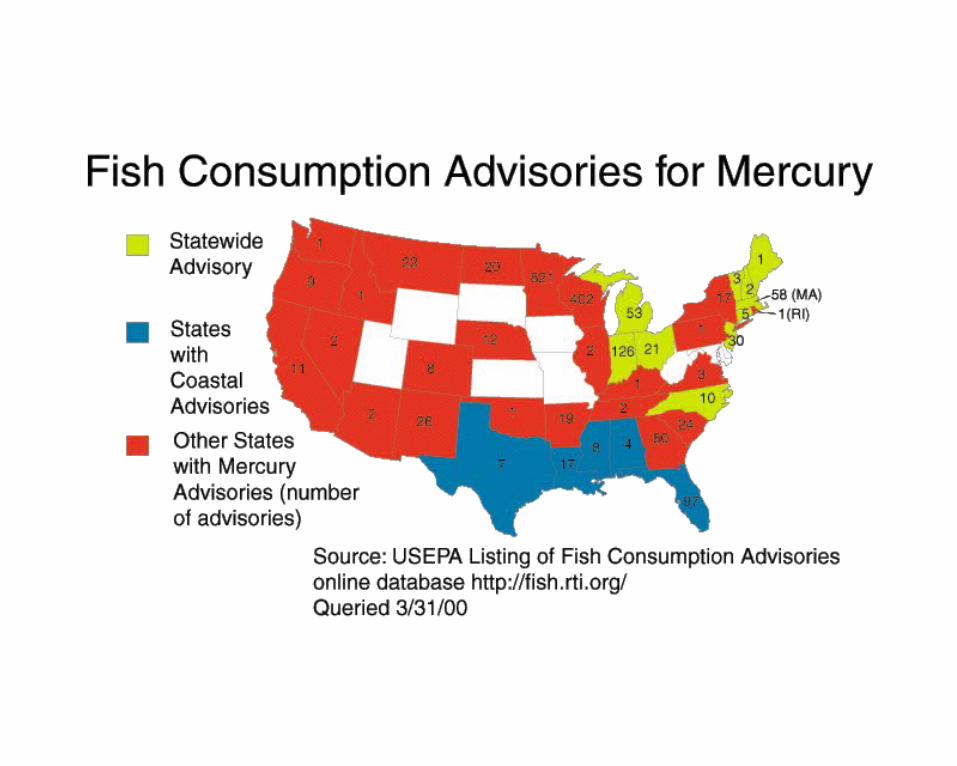
Mercury in the Environment
• In a recent EPA report to Congress (1994), they pointed to coal fired utilities as the major anthropogenic source of mercury
• It is suggested that deposition of mercury and organochlorines may increase with elevation because of cold condensation and orographic precipitation (grasshopper effect)
• This may be cause for concern in warm mid-latitude climates where water resources fall mainly in the form of snow (70%)
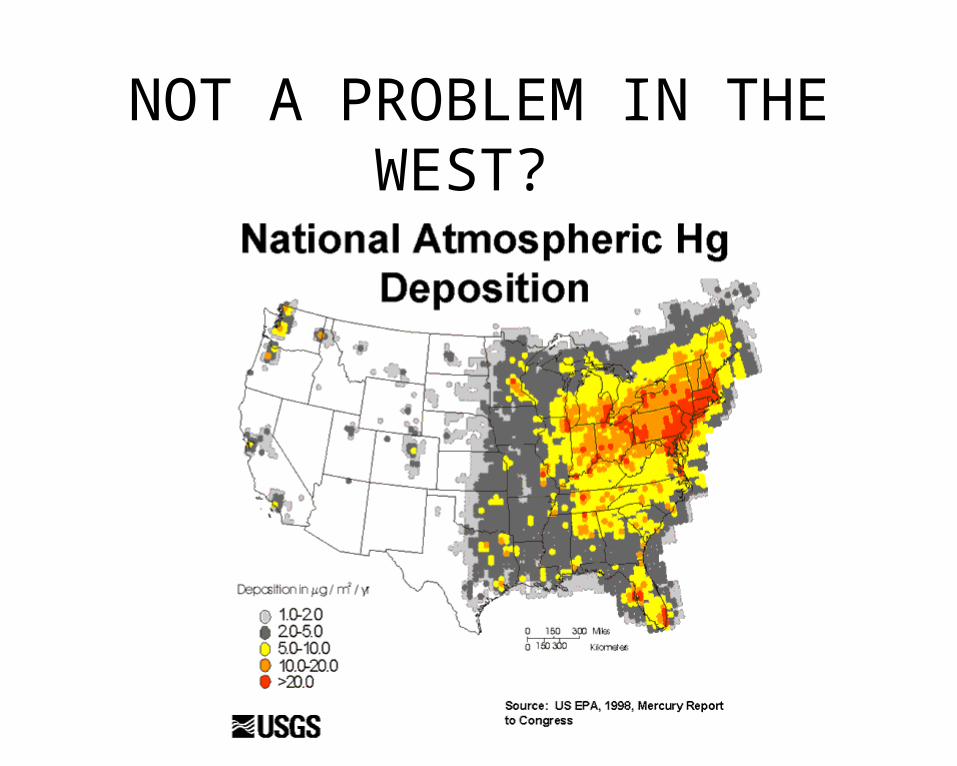
NOT A PROBLEM IN THE WEST?
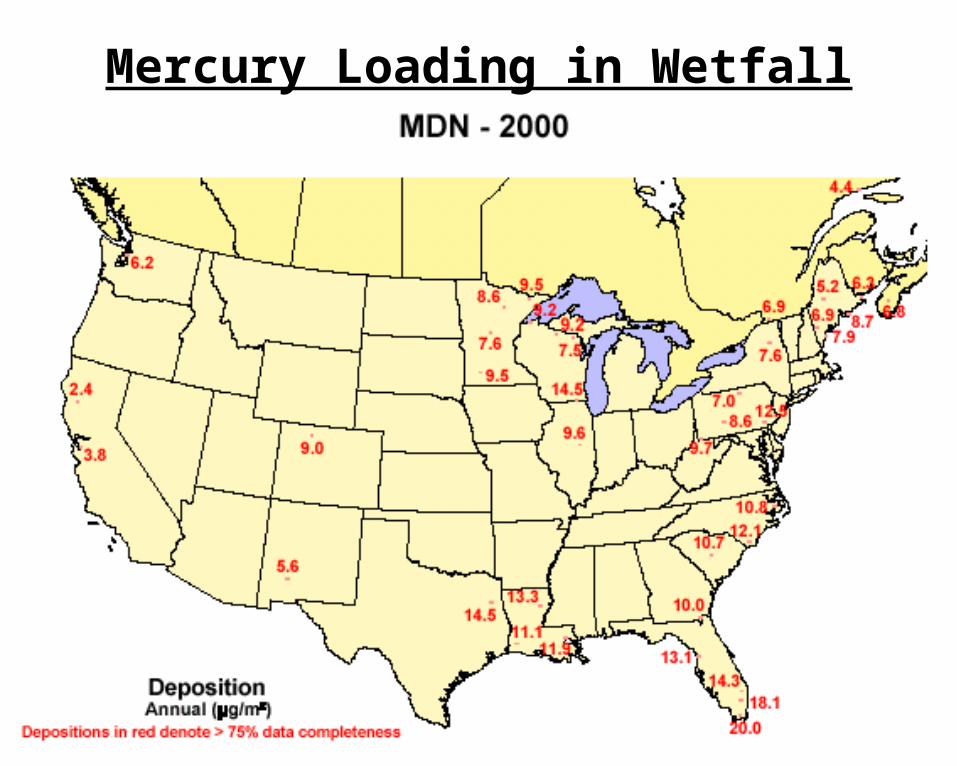
Mercury Loading in Wetfall

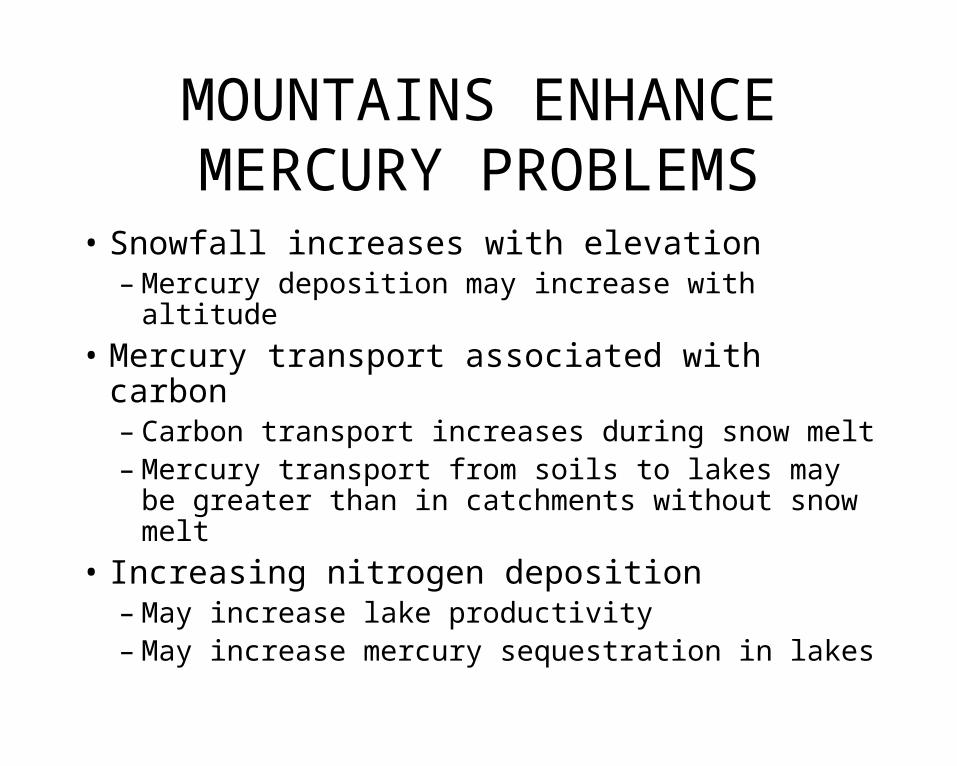
MOUNTAINS ENHANCE MERCURY PROBLEMS
• Snowfall increases with elevation– Mercury deposition may increase with altitude
• Mercury transport associated with carbon– Carbon transport increases during snow melt– Mercury transport from soils to lakes may be
greater than in catchments without snow melt
• Increasing nitrogen deposition– May increase lake productivity– May increase mercury sequestration in lakes

Study Objectives
1) To compare wet vs. freeze-dried methods2) To evaluate trends in mercury accumulation
in alpine lakes of Colorado3) Place these results in context by comparing
to other sites4) Evaluate other factors that may worsen Hg
accumulation in Colorado lakes:1) Cold-condensation2) Increasing Hg deposition with elevation3) Snow melt4) Increased carbon production from N deposition5) Fires

Colorado Lakes Cored
Black LakeGreen Lake 4, 5
Pristine Lake
Navajo Lake
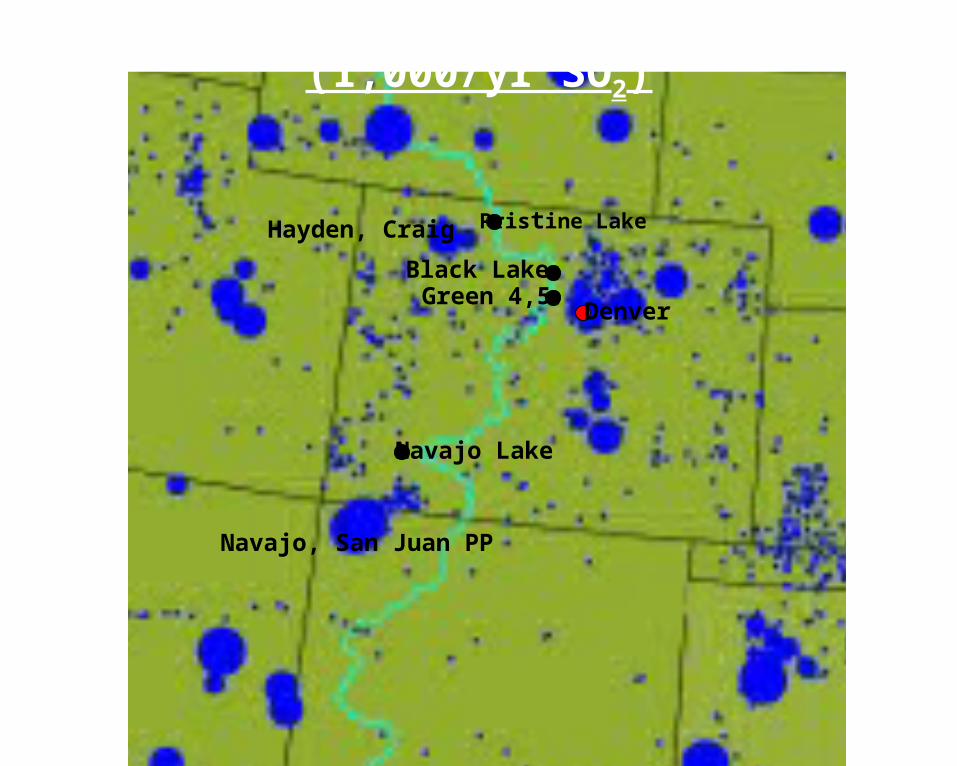
Pristine Lake
Navajo Lake
Black LakeGreen 4,5
Denver
Navajo, San Juan PP
Hayden, Craig
Sulfate/Mercury emissions (1,000/yr SO2)
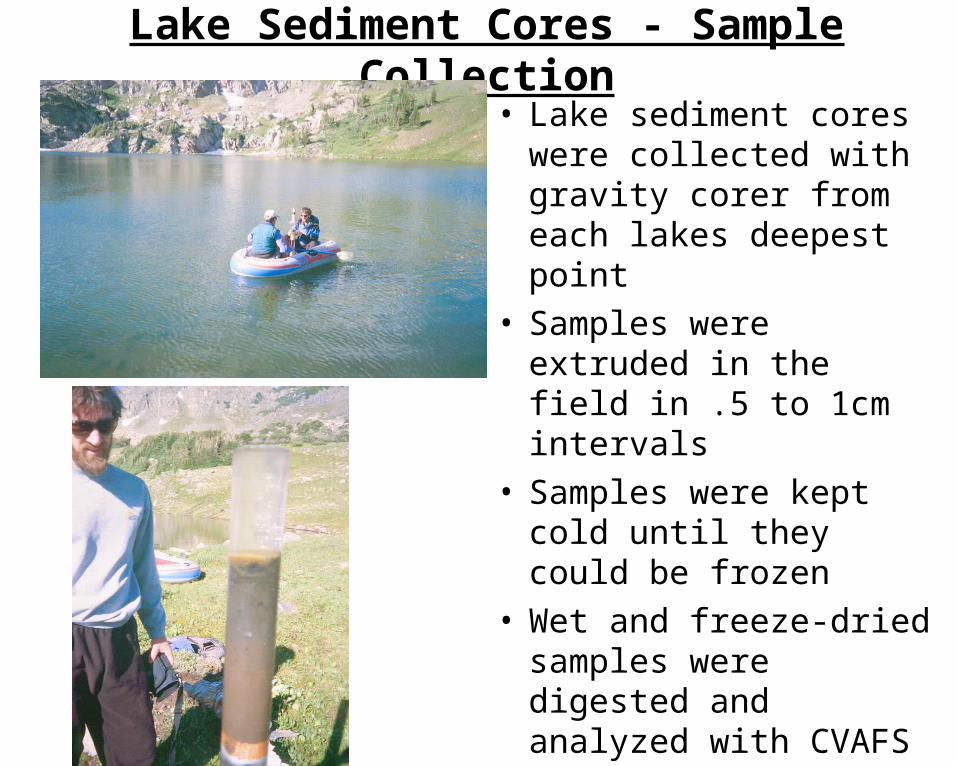
Lake Sediment Cores - Sample Collection
• Lake sediment cores were collected with gravity corer from each lakes deepest point
• Samples were extruded in the field in .5 to 1cm intervals
• Samples were kept cold until they could be frozen
• Wet and freeze-dried samples were digested and analyzed with CVAFS
Methods
• Lake sediments were dated with 210Pb activity
• Sediment mass accumulation was calculated as the dry weight per section and years each section represented
• Hg mass flux per section calculated as Hg concentration times sediment accumulation
• Hg flux ratios were calculated as surface Hg flux divided by background Hg flux
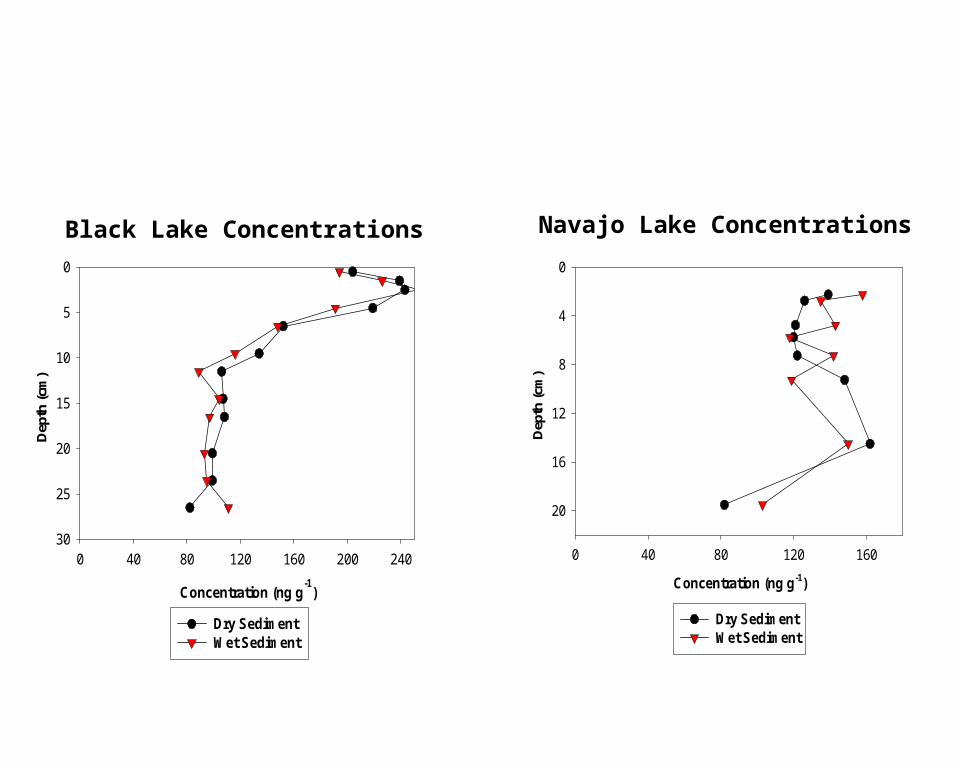
Digestion Comparison - Concentrations
Concentration (ng g-1
)
0 40 80 120 160 200 240
Dep
th (c
m)
0
5
10
15
20
25
30
Dry Sediment Wet Sediment
Black Lake Concentrations
Concentration (ng g-1)
0 40 80 120 160D
epth
(cm
)
0
4
8
12
16
20
Dry SedimentWet Sediment
Navajo Lake Concentrations

Concentration (ngg-1)
0 50 100 150 200 250
Dat
e
1500
1600
1700
1800
1900
2000
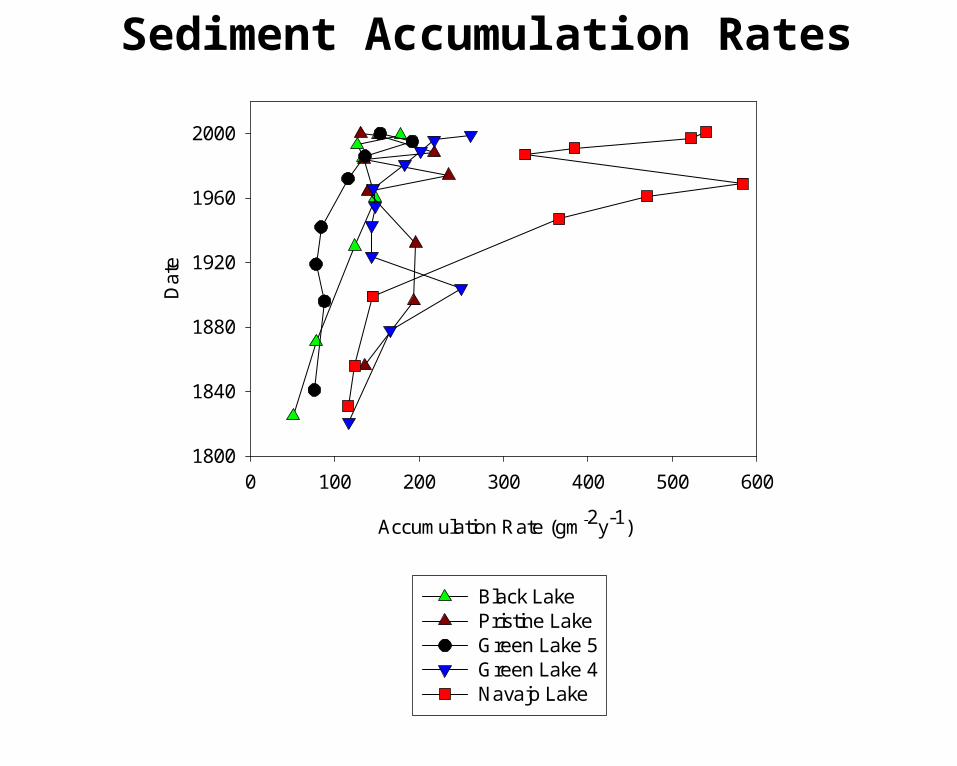
Black LakePristine LakeGreen Lake 5Green Lake 4Navajo Lake
Hg Concentrations in Sediment
Accumulation Rate (gm-2y-1)
0 100 200 300 400 500 600
Dat
e
1800
1840
1880
1920
1960
2000
Black LakePristine LakeGreen Lake 5Green Lake 4Navajo Lake
Sediment Accumulation Rates
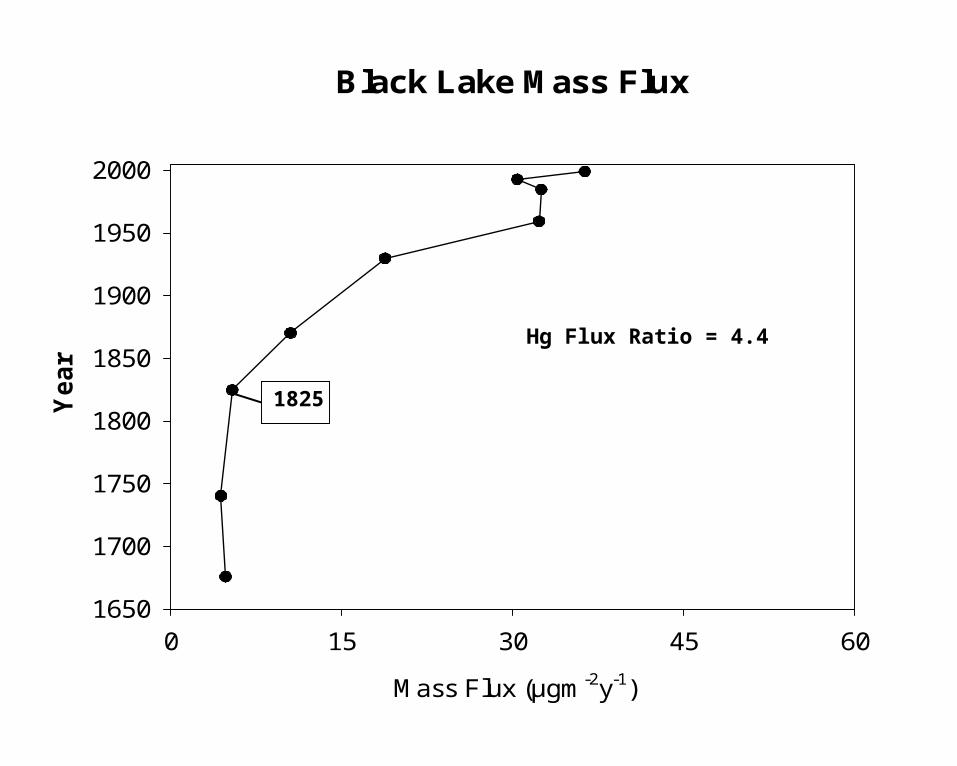
Black Lake Mass Flux
Mass Flux (µgm-2y-1)
0 15 30 45 60
Ye
ar
1650
1700
1750
1800
1850
1900
1950
2000
1825
Hg Flux Ratio = 4.4
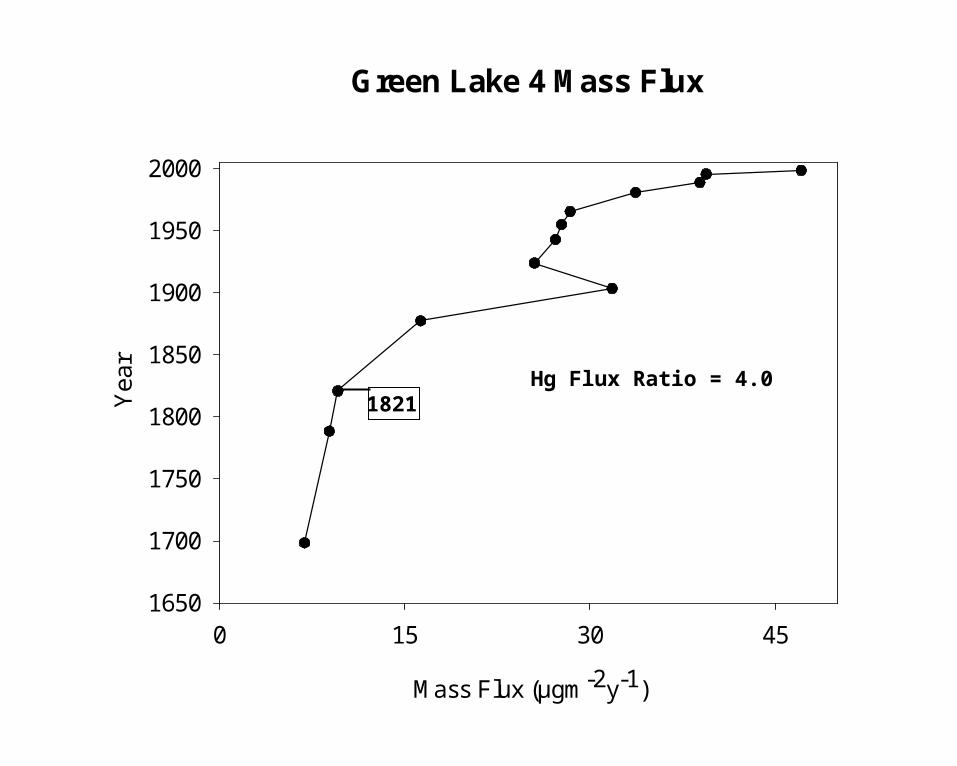
Green Lake 4 Mass Flux
Mass Flux (µgm-2y-1)
0 15 30 45
Yea
r
1650
1700
1750
1800
1850
1900
1950
2000
1821Hg Flux Ratio = 4.0
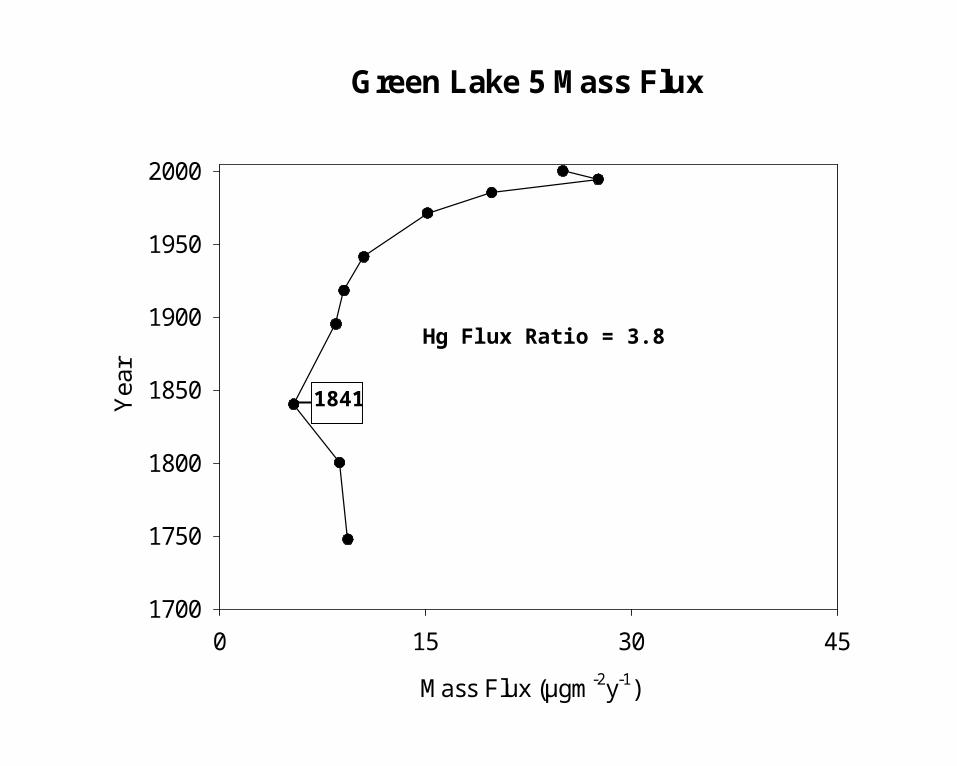
Green Lake 5 Mass Flux
Mass Flux (µgm-2y-1)
0 15 30 45
Yea
r
1700
1750
1800
1850
1900
1950
2000
1841
Hg Flux Ratio = 3.8
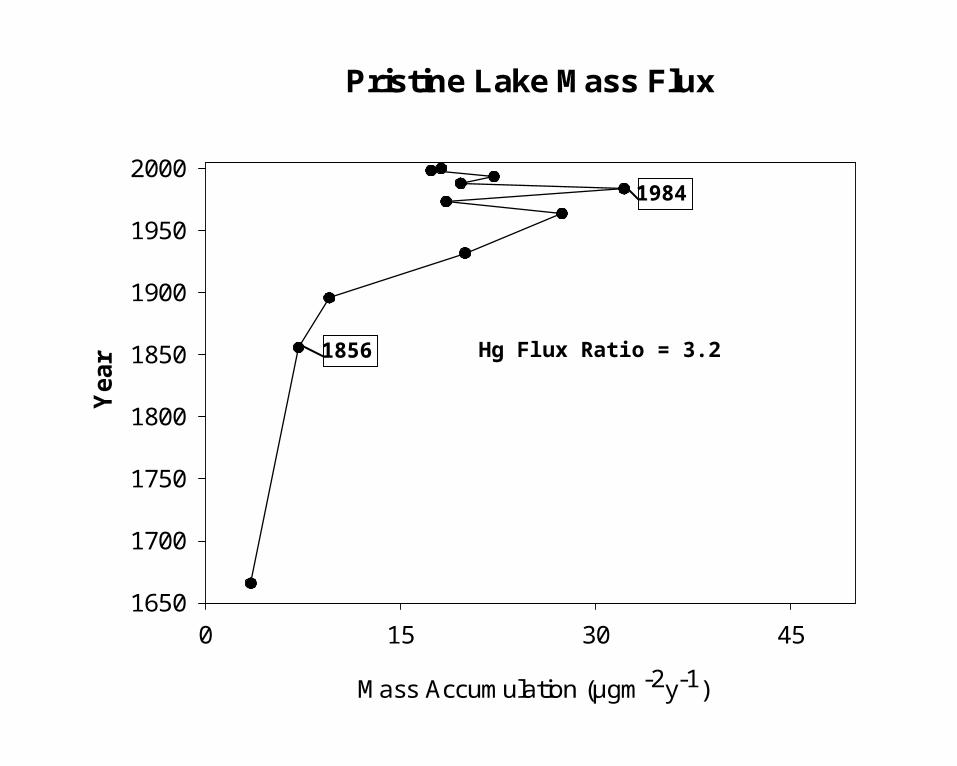
Pristine Lake Mass Flux
Mass Accumulation (µgm-2y-1)
0 15 30 45
Ye
ar
1650
1700
1750
1800
1850
1900
1950
2000
1856
1984
Hg Flux Ratio = 3.2
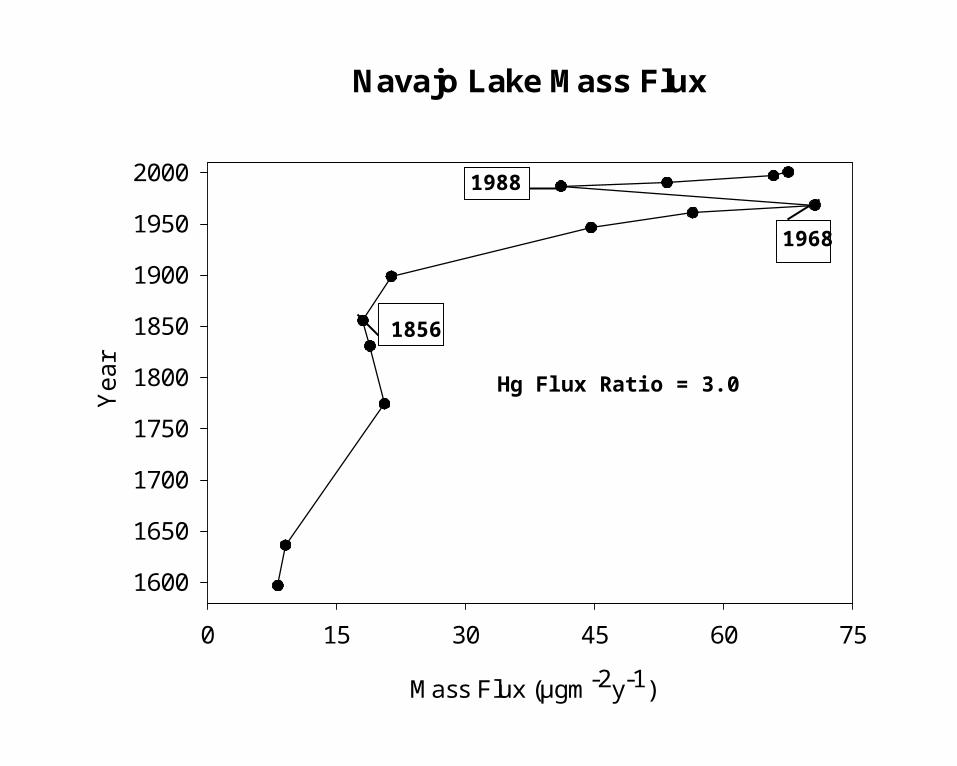
Navajo Lake Mass Flux
Mass Flux (µgm-2y-1)
0 15 30 45 60 75
Ye
ar
1600
1650
1700
1750
1800
1850
1900
1950
2000
1856
1968
1988
Hg Flux Ratio = 3.0
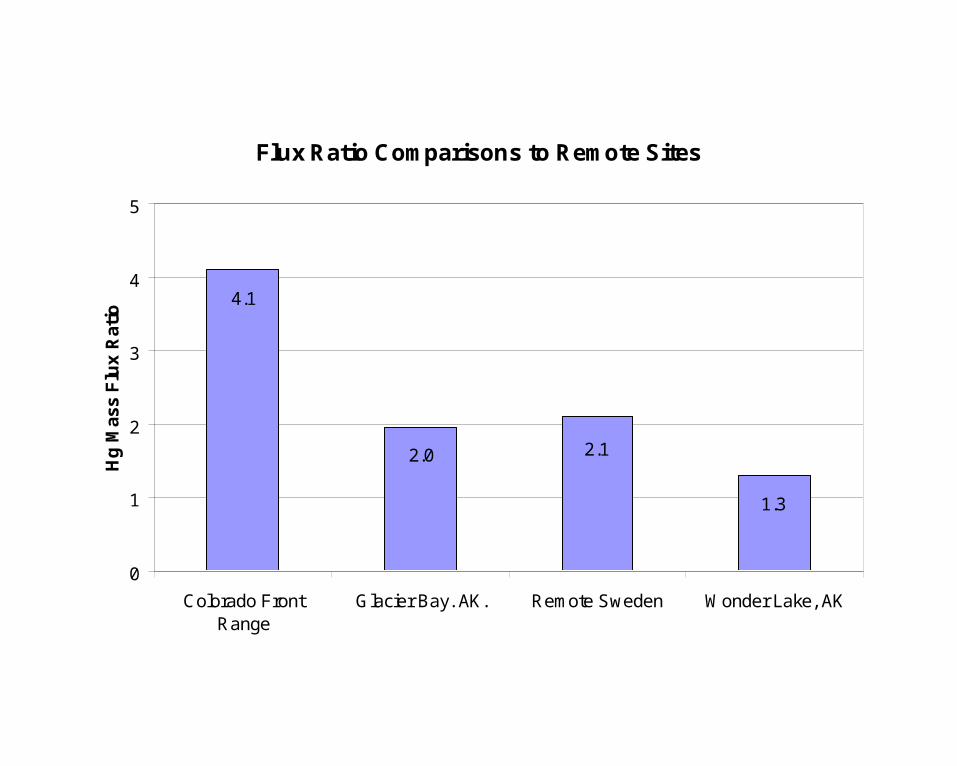
Flux Ratio Comparisons to Remote Sites
1.3
2.12.0
4.1
0
1
2
3
4
5
Colorado FrontRange
Glacier Bay. AK. Remote Sweden Wonder Lake, AK
Hg
Mas
s F
lux
Rat
io

INDUSTRIAL SITE COMPARISON
4.1
7.0
3.53.7
0
1
2
3
4
5
6
7
8
Colorado FrontRange
Northern Minn. &Wis.
Adirondacks, NY Industrial Sweden
Hg
Mas
s F
lux
Rat
ios
Year
1800 1840 1880 1920 1960 2000
% o
f S
urf
ac
e M
as
s F
lux
0
20
40
60
80
100
120
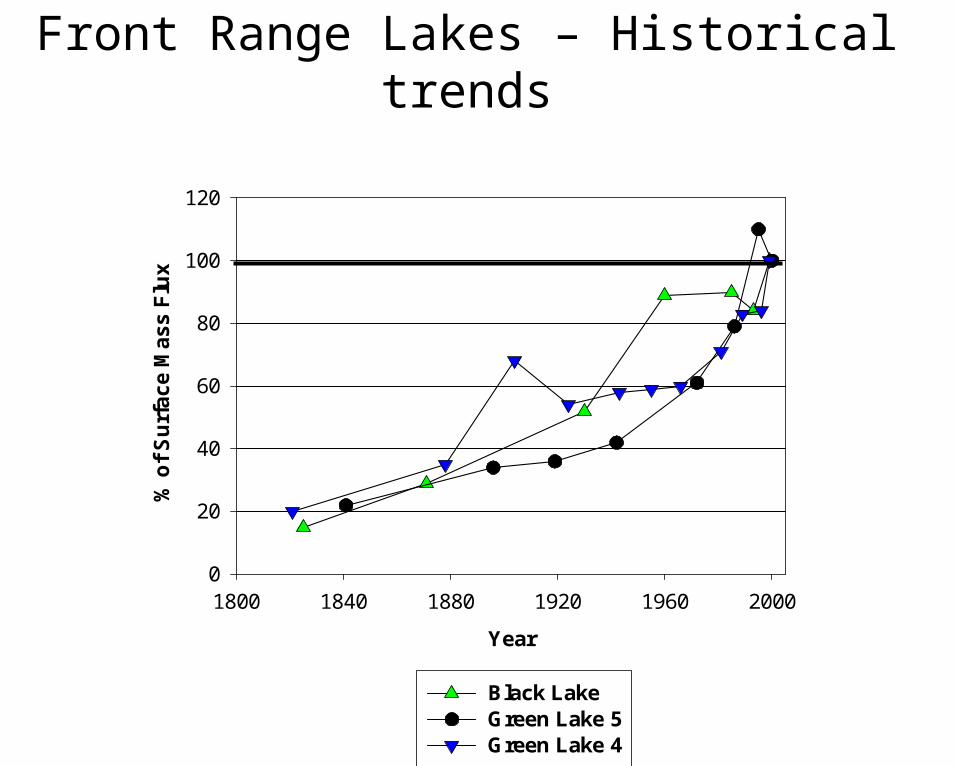
Black LakeGreen Lake 5Green Lake 4
Front Range Lakes – Historical trends

MERCURY DEPOSITION INCREASING IN FRONT
RANGE
• Highest rates of mercury accumulation in history are now
• Mercury accumulation will get worse before it gets better
• Front Range lakes and reservoirs at risk
• Brown cloud?

Year
1800 1840 1880 1920 1960 2000
% o
f S
urf
ace
Mas
s F
lux
0
25
50
75
100
125
150
175
200
Pristine LakeNavajo Lake
West Side Lakes – Recent Decline?
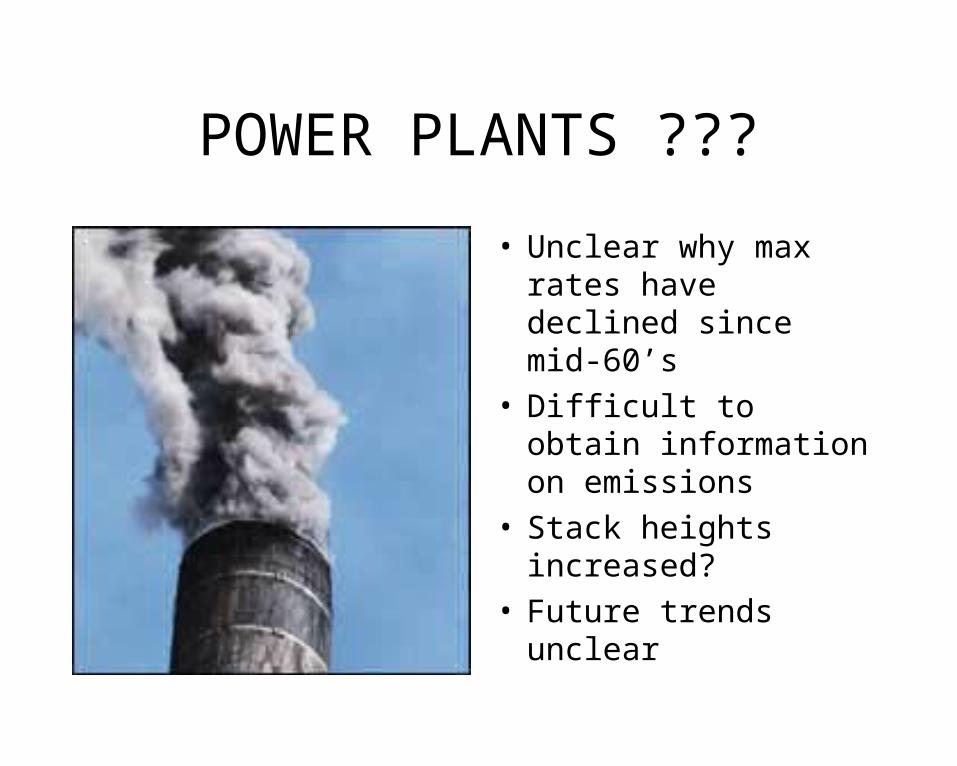
POWER PLANTS ???
• Unclear why max rates have declined since mid-60’s
• Difficult to obtain information on emissions
• Stack heights increased?
• Future trends unclear

SOUTHWEST CO: COMPROMISED DATA
• Mining activity comprised data
• USGS snow survey: highest mercury content in SW CO
• Need additional samples
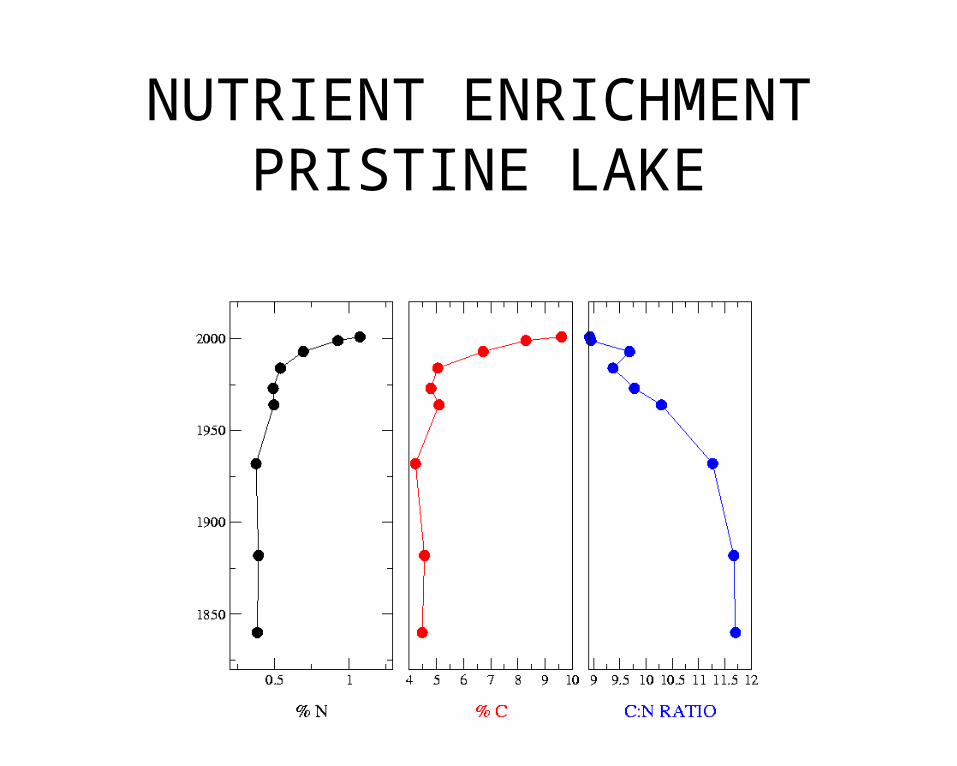
NUTRIENT ENRICHMENT PRISTINE LAKE

NUTRIENT ENRICHMENT ENHANCES Hg IN LAKES
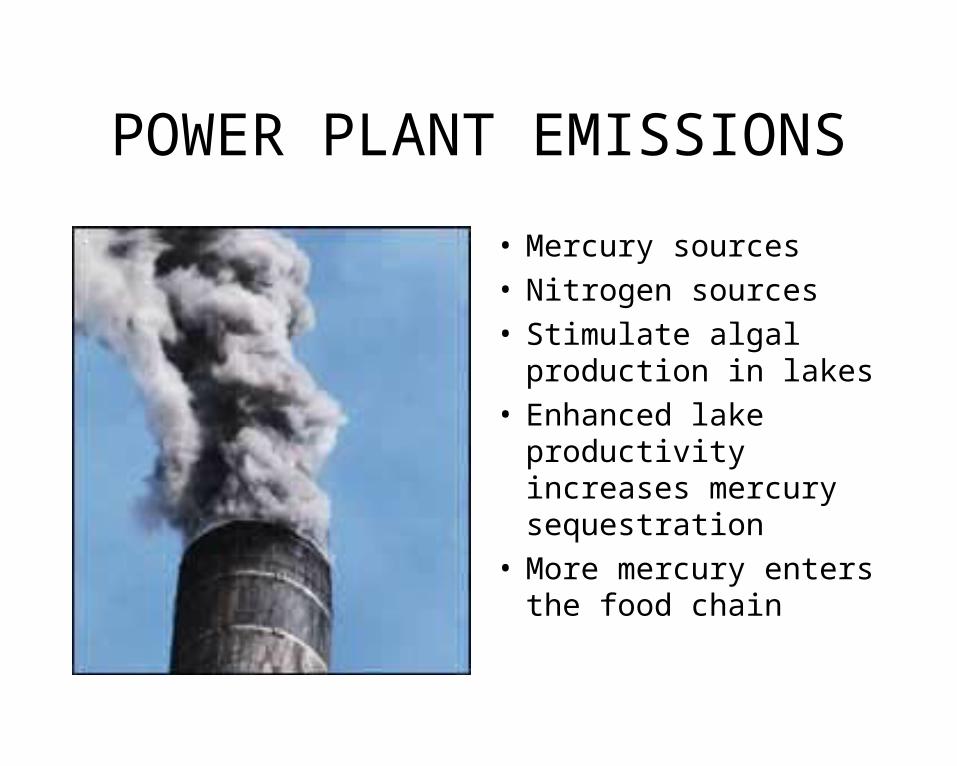
POWER PLANT EMISSIONS
• Mercury sources• Nitrogen sources• Stimulate algal
production in lakes• Enhanced lake
productivity increases mercury sequestration
• More mercury enters the food chain
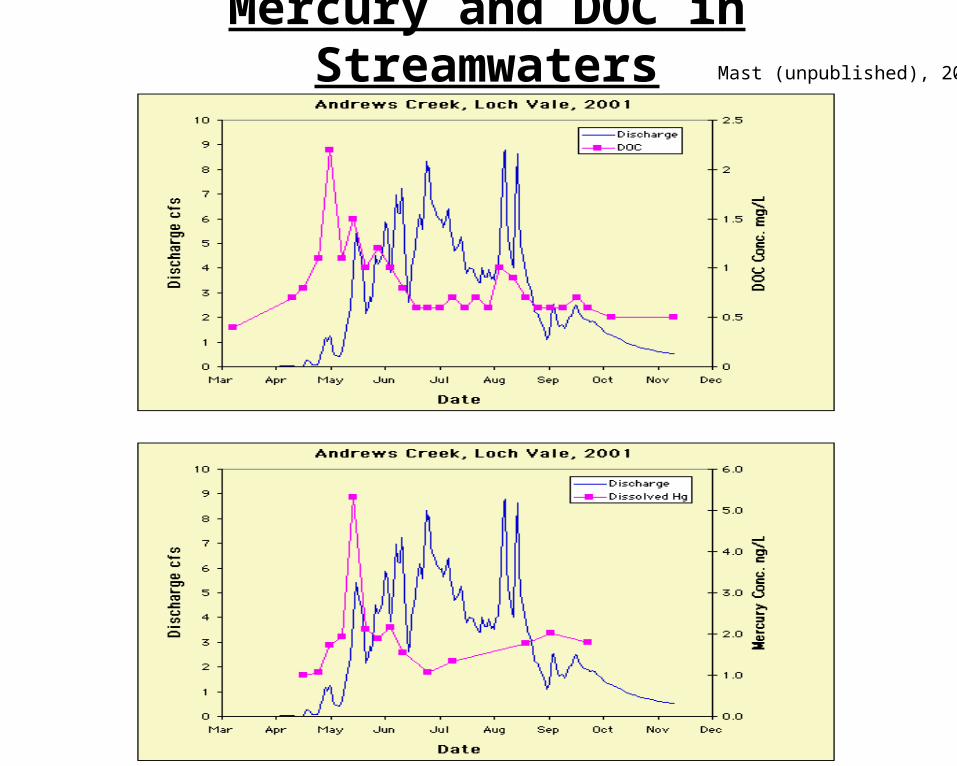
Mercury and DOC in StreamwatersMast (unpublished), 2001

CARBON and MERCURY
• TOC/DOC increases mercury transport to lakes and reservoirs
• DOC increases production of MMHg
• DOC mobility increases during snow melt
• Alpine areas at risk

MERCURY AND WILDFIRES: A SMOKING GUN?
• 95% of mercury stored in biomass volatilized
• 90% as elemental Hg• 10% with aerosols• Biomass burning may
account for 25% of global emissions
• Large increase after wildfires?
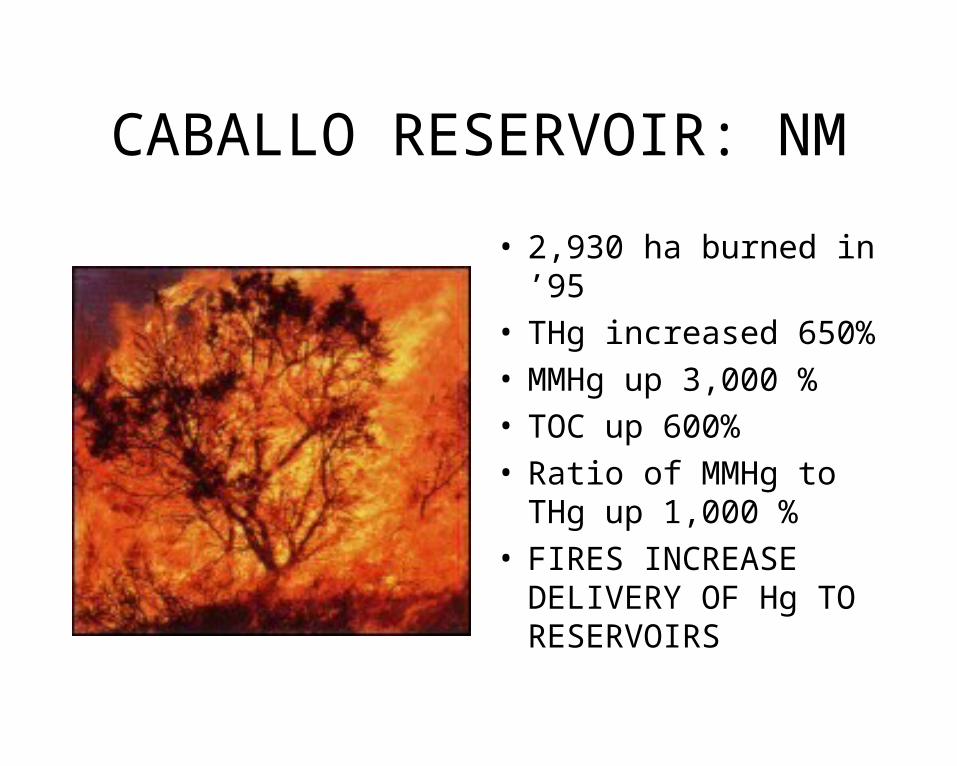
CABALLO RESERVOIR: NM
• 2,930 ha burned in ’95• THg increased 650%• MMHg up 3,000 %• TOC up 600%• Ratio of MMHg to
THg up 1,000 %• FIRES INCREASE
DELIVERY OF Hg TO RESERVOIRS
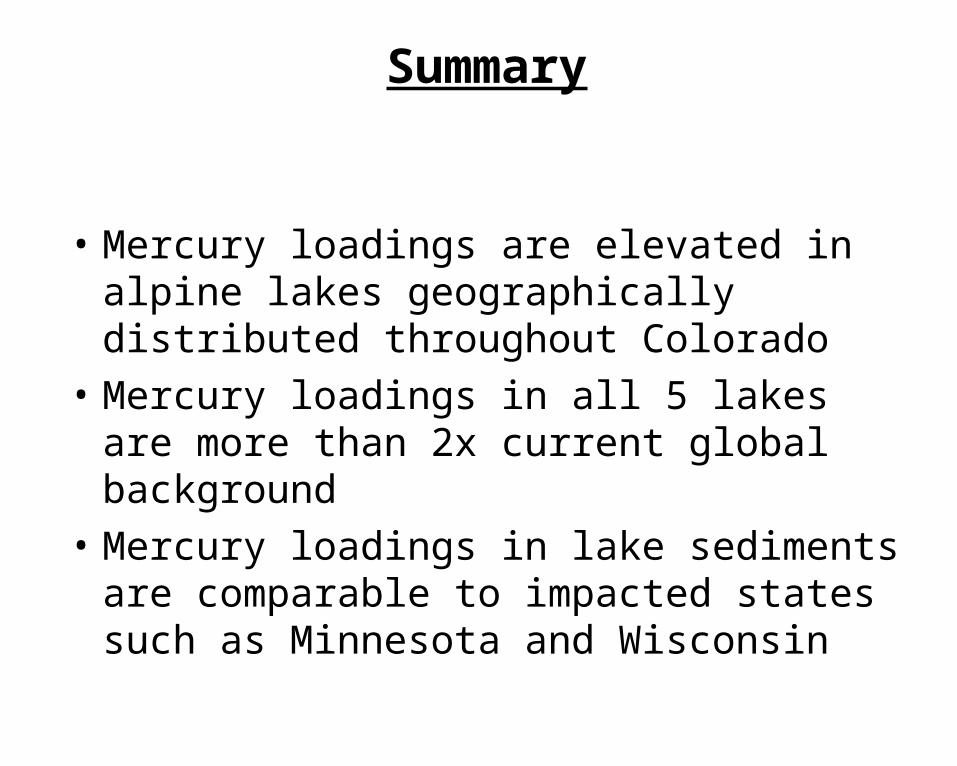
Summary
• Mercury loadings are elevated in alpine lakes geographically distributed throughout Colorado
• Mercury loadings in all 5 lakes are more than 2x current global background
• Mercury loadings in lake sediments are comparable to impacted states such as Minnesota and Wisconsin

Summary 2
• Mercury accumulation in Front Range lakes is increasing with time
• Mercury accumulation on Western Slope more difficult to evaluate
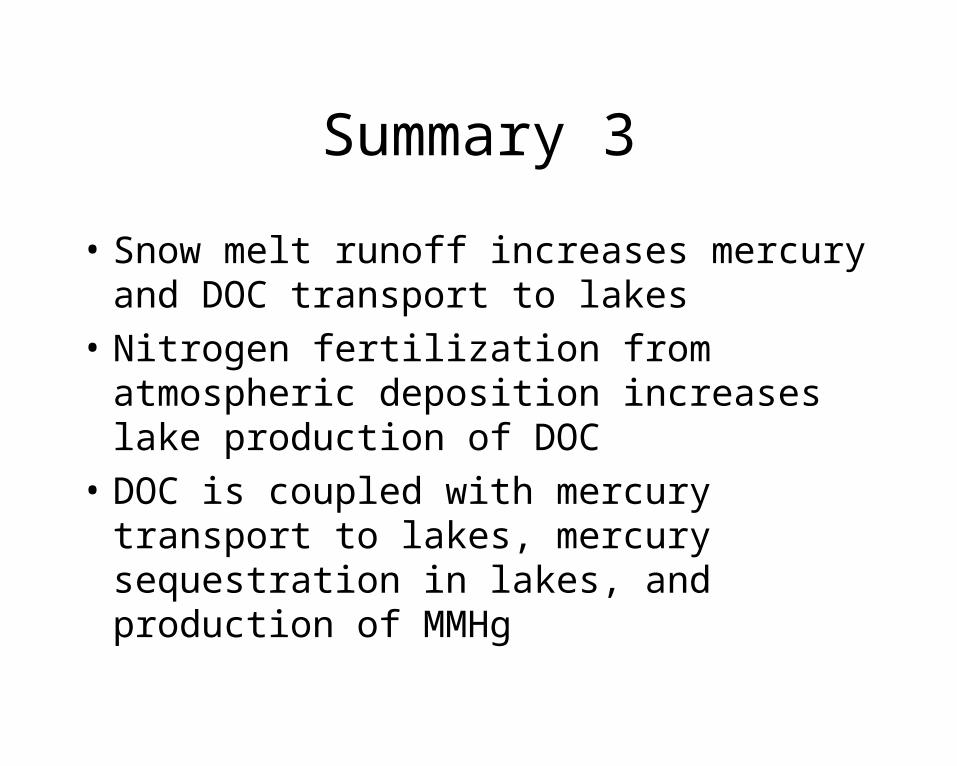
Summary 3
• Snow melt runoff increases mercury and DOC transport to lakes
• Nitrogen fertilization from atmospheric deposition increases lake production of DOC
• DOC is coupled with mercury transport to lakes, mercury sequestration in lakes, and production of MMHg
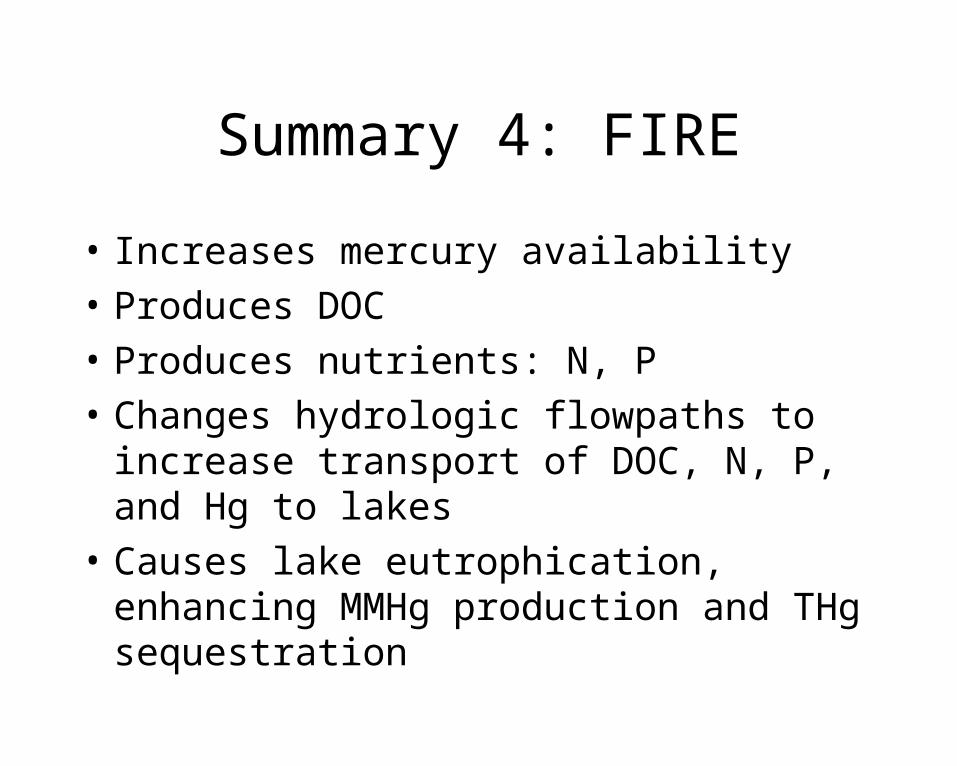
Summary 4: FIRE
• Increases mercury availability
• Produces DOC
• Produces nutrients: N, P
• Changes hydrologic flowpaths to increase transport of DOC, N, P, and Hg to lakes
• Causes lake eutrophication, enhancing MMHg production and THg sequestration
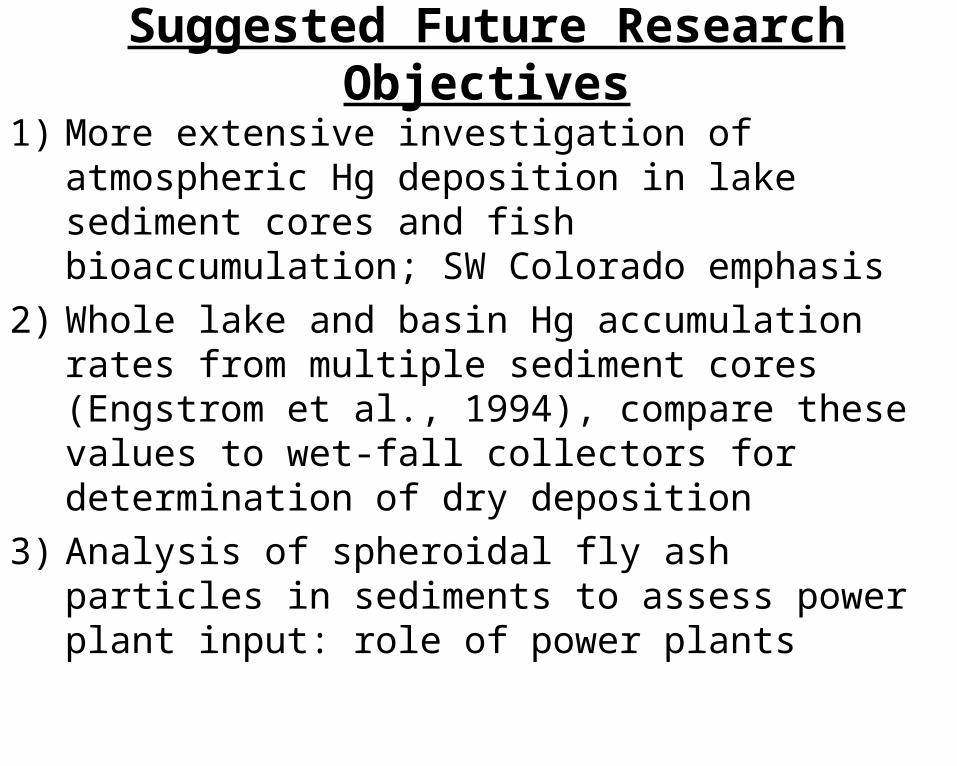
Suggested Future Research Objectives
1) More extensive investigation of atmospheric Hg deposition in lake sediment cores and fish bioaccumulation; SW Colorado emphasis
2) Whole lake and basin Hg accumulation rates from multiple sediment cores (Engstrom et al., 1994), compare these values to wet-fall collectors for determination of dry deposition
3) Analysis of spheroidal fly ash particles in sediments to assess power plant input: role of power plants

More suggestions
4) Importance of TOC versus DOC for mercury transport
5) Hg and DOC during snowmelt
6) Hg measurements in burned basins
7) Amount of MMHg vs THg
8) Atmospheric sources of Hg
Related Documents