─1─ Abstract: The study of new goods exports is drawing attentions of trade economists since the heterogeneous firms trade model by Melitz (2003) has given a theoretical backbone to the mechanism of the new goods exports. This paper analyses whether the formation of MERCOSUR has had a discernible effect on the new goods exports of Argentina. It shows a sharp increase in the number of product categories in Argentina’ s exports to Brazil, compared to other non-MERCOSUR countries. The paper finds a statistically significant positive effect of MERCOSUR on the probability of new goods exports. It also argues the role of a large-scale trade liberalisation for an expansion of new goods exports to other non-member countries, which this paper calls ‘springboard’ effect. The paper shows that Brazilian market indeed has played such a role. Key words: MERCOSUR, Export diversification JEL Classification: F14, F15 INTRODUCTION Since 1960s, especially after the Prebisch-Singer hypothesis of terms of trade deterioration, policy makers of developing countries have been aiming for export 〈研究論文〉 MERCOSUR and the Diversification of Argentina’s Exports Tadashi Ito ♦ Graduate Institute of International and Development Studies, Geneva ♦11 Avenue de la Paix, 1202 Geneva, Switzerland e-mail: [email protected] I am very grateful to the editor and two anonymous referees of this journal, whose invaluable comments have substantially improved this article.

Welcome message from author
This document is posted to help you gain knowledge. Please leave a comment to let me know what you think about it! Share it to your friends and learn new things together.
Transcript
─ 1 ─
Abstract:The study of new goods exports is drawing attentions of trade economists since the heterogeneous firms trade model by Melitz (2003) has given a theoretical backbone to the mechanism of the new goods exports. This paper analyses whether the formation of MERCOSUR has had a discernible effect on the new goods exports of Argentina. It shows a sharp increase in the number of product categories in Argentina’s exports to Brazil, compared to other non-MERCOSUR countries. The paper finds a statistically significant positive effect of MERCOSUR on the probability of new goods exports. It also argues the role of a large-scale trade liberalisation for an expansion of new goods exports to other non-member countries, which this paper calls ‘springboard’ effect. The paper shows that Brazilian market indeed has played such a role.
Key words: MERCOSUR, Export diversificationJEL Classification: F14, F15
INTRODUCTION
Since 1960s, especially after the Prebisch-Singer hypothesis of terms of trade deterioration, policy makers of developing countries have been aiming for export
〈研究論文〉
MERCOSUR and the Diversification of Argentina’s Exports
Tadashi Ito♦
Graduate Institute of International and Development Studies, Geneva
♦11 Avenue de la Paix, 1202 Geneva, Switzerland e-mail: [email protected] I am very grateful to the editor and two anonymous referees of this journal, whose invaluable comments have substantially improved this article.
MERCOSUR and the Diversification of Argentina’s Exports
─ 2 ─
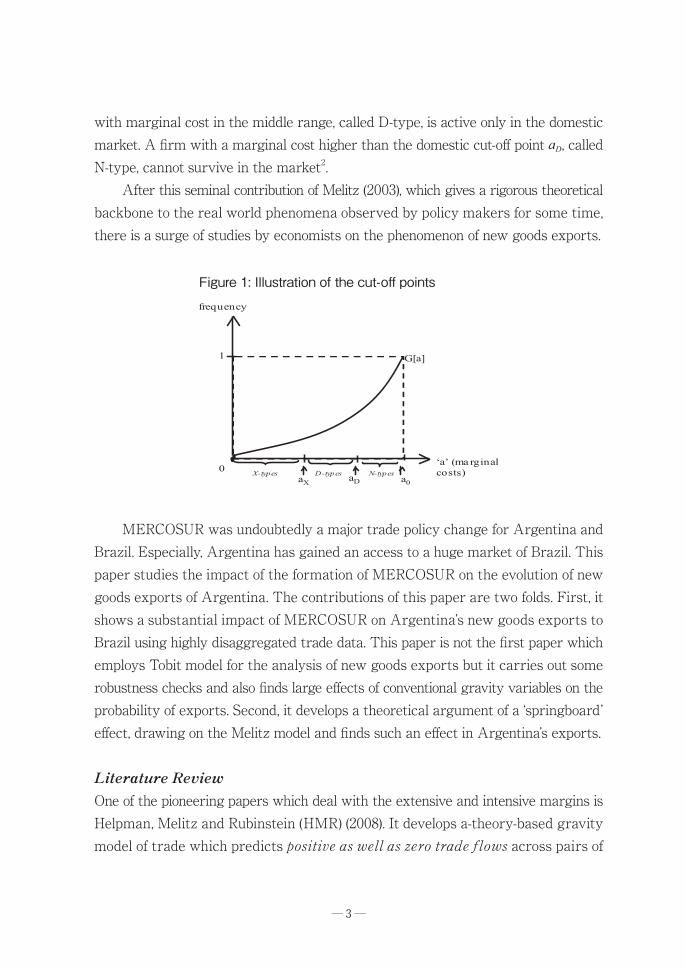
diversification. Several Asian countries, such as South Korea or Taiwan, showed examples of remarkable increases both in varieties and in volumes of their exports. Some economists show the association between the degree of export diversification and economic growth. For example, Sachs and Warner (1995), using cross-sectional data, suggests the association between low export diversification and slow growth.1 However, despite the policy makers’ quest for export diversification, trade economists did not pay much attention to the issue, mainly because the classical trade theories tell the virtue of specialisation into products in which countries have comparative advantage, not diversification. It is the theoretical breakthrough by Melitz (2003) which opened the door to a rapid increase of research on export diversification. The model is usually called in the literature as the Heterogeneous Firms Trade (HFT) model. It shows that trade barrier reductions allow non-exporting-firms due to low productivity to become exporters after the trade liberalisation. Melitz (2003) incorporates firm heterogeneity into Krugman (1980)’s model of trade under increasing returns and monopolistic competition. Firms differ in their productivity, i.e. marginal costs. They have to bear the sales related costs both in domestic and export markets respectively. Such sales related costs are assumed to be higher for export markets than for domestic markets. Then, firms which have sufficiently high productivity (low marginal costs) can absorb the export related costs and be active both in domestic and export markets. On the other hand, firms with low productivity cannot be active even in the domestic markets. Firms with productivity in the middle range serve only the domestic market because their productivity level only allows them to absorb the domestic market related sales costs. The borders among these three types of firms are determined by the two cut-off productivity (or marginal cost) conditions. After this seminal contribution of Melitz (2003), which gives a rigorous theoretical backbone to the real world phenomena observed by policy makers for some time, there is a surge of studies by economists on the phenomenon of new goods exports. Figure 1 illustrates these cut-off points. G[a] is an assumed distribution of firms’ marginal costs. The distribution is skewed: there are many low productivity (high marginal cost) firms while there is smaller number of high productivity (low marginal cost) firms. A firm with a marginal cost lower than the export cut-off point ax, called X-type, can be active in export markets (and the domestic market). Similarly, a firm
─ 3 ─
with marginal cost in the middle range, called D-type, is active only in the domestic market. A firm with a marginal cost higher than the domestic cut-off point aD, called N-type, cannot survive in the market2. After this seminal contribution of Melitz (2003), which gives a rigorous theoretical backbone to the real world phenomena observed by policy makers for some time, there is a surge of studies by economists on the phenomenon of new goods exports.
MERCOSUR was undoubtedly a major trade policy change for Argentina and Brazil. Especially, Argentina has gained an access to a huge market of Brazil. This paper studies the impact of the formation of MERCOSUR on the evolution of new goods exports of Argentina. The contributions of this paper are two folds. First, it shows a substantial impact of MERCOSUR on Argentina’s new goods exports to Brazil using highly disaggregated trade data. This paper is not the first paper which employs Tobit model for the analysis of new goods exports but it carries out some robustness checks and also finds large effects of conventional gravity variables on the probability of exports. Second, it develops a theoretical argument of a ‘springboard’ effect, drawing on the Melitz model and finds such an effect in Argentina’s exports.
Literature ReviewOne of the pioneering papers which deal with the extensive and intensive margins is Helpman, Melitz and Rubinstein (HMR) (2008). It develops a-theory-based gravity model of trade which predicts positive as well as zero trade flows across pairs of
Figure 1: Illustration of the cut-off points
MERCOSUR and the Diversification of Argentina’s Exports
─ 4 ─
countries. Using total trade value data of 158 countries in 1986, HMR shows that among 24,806 possible bilateral export relationships, only 11,146 pairs have non-zero exports. More importantly, HMR finds that the usual gravity equation variables also affect the probability of bilateral export relationship. The effect of a regional trade agreement on the evolution of the number of zeros, the question this paper addresses, is examined, for example, by Amurgo Pacheco (2006) for the case of Mediterranean countries. Using HS 6-digit data, it finds a large decrease in the number of zeros in the exports of Mediterranean countries to the EU from 1994, almost at the same timing with the Barcelona declaration, which paved the way toward free trade areas between Mediterranean countries and the EU.
Plan of paper The next section, Section 1, briefly explains MERCOSUR. Section 2 overviews the evolution of the number of exported products of Argentina. Section 3 takes a close look of the evolution of the numbers of exported products and the values of exports at Harmonised System (HS) 6-digit level. Section 4 provides econometric analyses. The final section concludes.
1. MERCOSUR
Among the several forms of Regional Trade Agreements (RTAs) including Free Trade Agreements (FTAs), Customs Unions (CUs), Common Markets (CMs) and Economic Unions (EUs), MERCOSUR (Mercado Común del Sur in Spanish, or Common Market of the South) takes the form of a CU. CUs have a Common External Tariffs (CETs) in addition to free trade within the bloc of member countries. MERCOSUR has its origin in ‘The Declaration of Iguazú’ signed in November 1985 between Argentina and Brazil. The objective of the agreement was originally political in nature. It aimed to overcome a long-standing rivalry between the two countries. The ‘Treaty of Integration, Cooperation and Development’ agreed in November 1988 explicitly raised future economic integration between the two countries as a primary objective. The ‘Act of Buenos Aires’ concluded by the two countries in June 1990 contained an agreement to launch a customs union from January 1, 1995. At the invitation of Argentina and Brazil, Paraguay and Uruguay joined the
─ 5 ─
undertaking and the four countries signed The ‘Treaty of Asunción’ in 1991, in which they agreed to gradually decrease import tariffs toward zero by January 1, 1995.
2. THE EVOLUTION OF THE NUMBER OF EXPORTED PRODUCTS
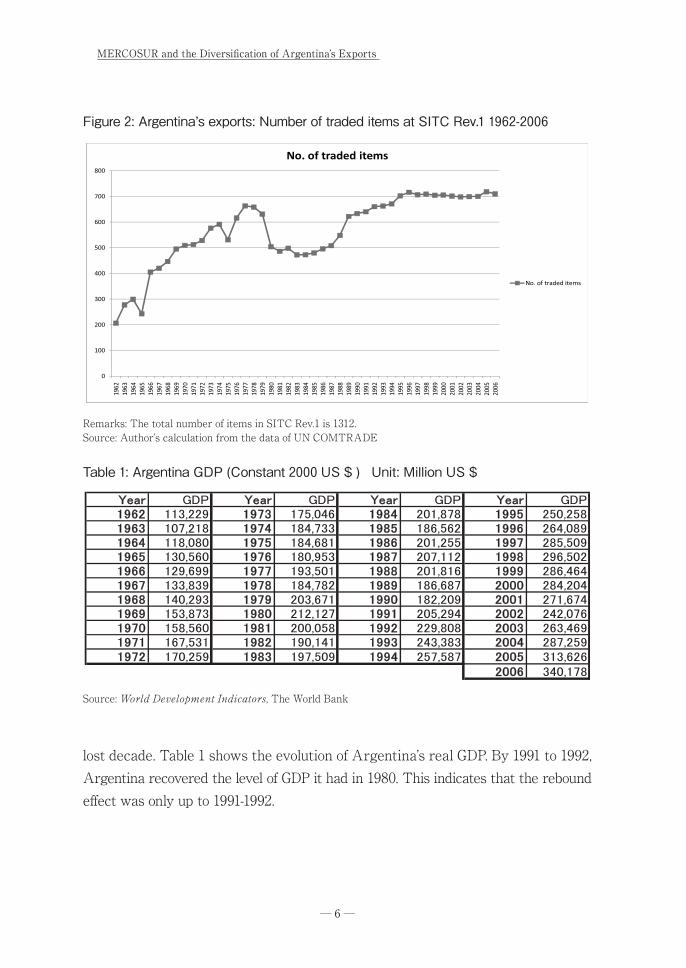
Recent studies on the exports of new goods show that there is a very large number of zeros in trade matrix. Baldwin & Harrigan (2007) says: ‘The United States imported in nearly 17,000 different 10-digit HTS categories from 228 countries, for a total of over 3.8 million potential trade flows. Over 90% of these potential trade flows are zeros. Hummels and Klenow (2005) show that 60 percent of the greater exports of larger economies in their sample of 126 countries are due to the increase of the number of exported products. New goods exports are better captured by increasingly disaggregated product classification data. Harmonized System (HS) 6-digit code is the most disaggregated export data of Argentina which can be obtained publicly. It has a little more than 5000 product lines.3 Before going into the analysis at HS 6-digit level, it may be worthwhile to see the evolution of export diversification over a long time span even at much less disaggregation level to see the overview of the evolution. I counted the number of items exported in the product code of SITC Revision 1, which gives us the longest possible time series. Figure 2 shows the tendency. In the decades of 60s and 70s, the number of traded items steadily increased. A sharp drop ensued from the end of 70s to the end of 80s. The downturn is not surprising because the country was plagued with hyper-inflations and a consequent disastrous macroeconomic instability during this period. A recovery started from the end of 1980s, and a full recovery was attained in 1992, one year after a drastic macroeconomic stability plan by the administration of Carlos Menem. The number steadily increased until 1996 and stayed at the same level toward 2006. The level of diversification in SITC Rev.1 seems to have reached the maximum in 1996. It is difficult to judge if the accelerated increase during 1992-1996 is still a rebounding effect from the lost decade of 1980s or if that is an effect of some policy changes, among others, the creation of MERCOSUR. However, the time series data of Argentina’s GDP may indicate when Argentina’s economy fully recovered from the
MERCOSUR and the Diversification of Argentina’s Exports
─ 6 ─
lost decade. Table 1 shows the evolution of Argentina’s real GDP. By 1991 to 1992, Argentina recovered the level of GDP it had in 1980. This indicates that the rebound effect was only up to 1991-1992.
Remarks: The total number of items in SITC Rev.1 is 1312. Source: Author’s calculation from the data of UN COMTRADE
Figure 2: Argentina’s exports: Number of traded items at SITC Rev.1 1962-2006
Source: World Development Indicators, The World Bank
Table 1: Argentina GDP (Constant 2000 US $ ) Unit: Million US $
─ 7 ─
3. NUMBER OF EXPORTED PRODUCTS AND EXTENSIVE MARGINS BY DESTINATION
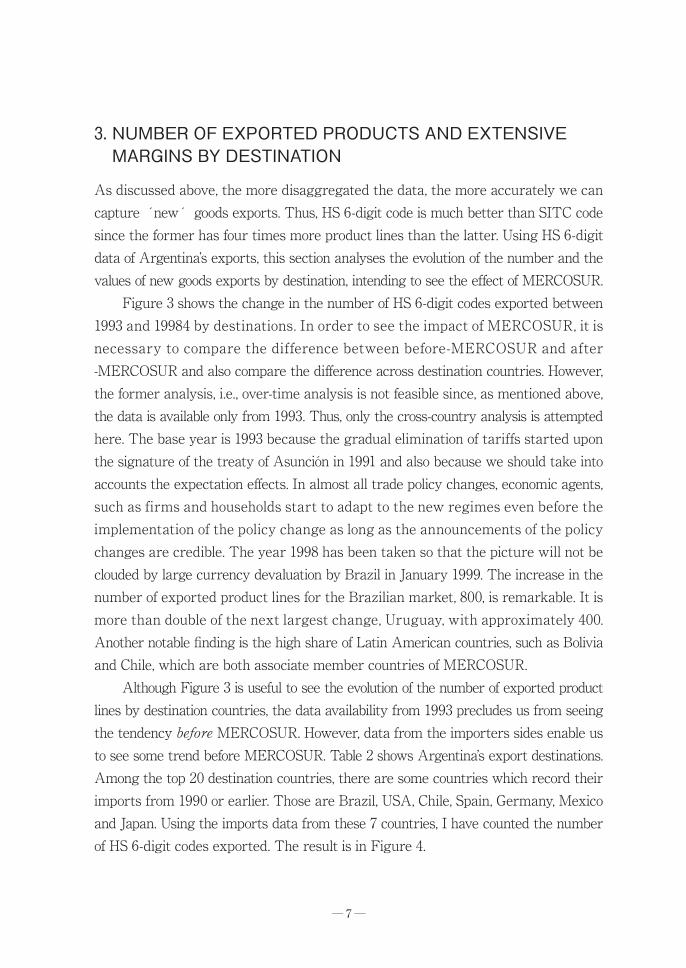
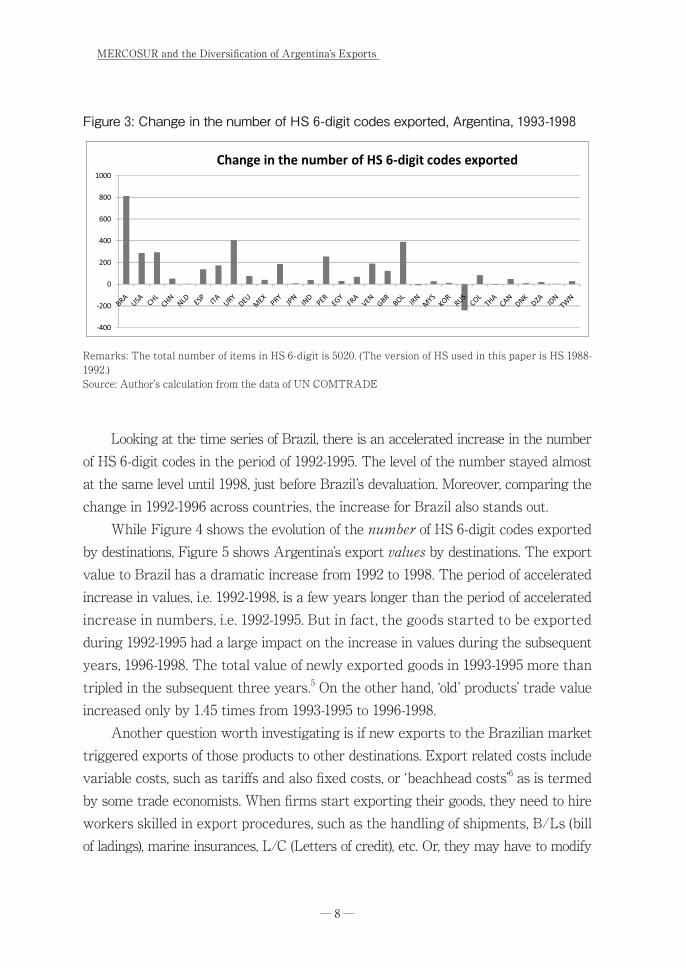
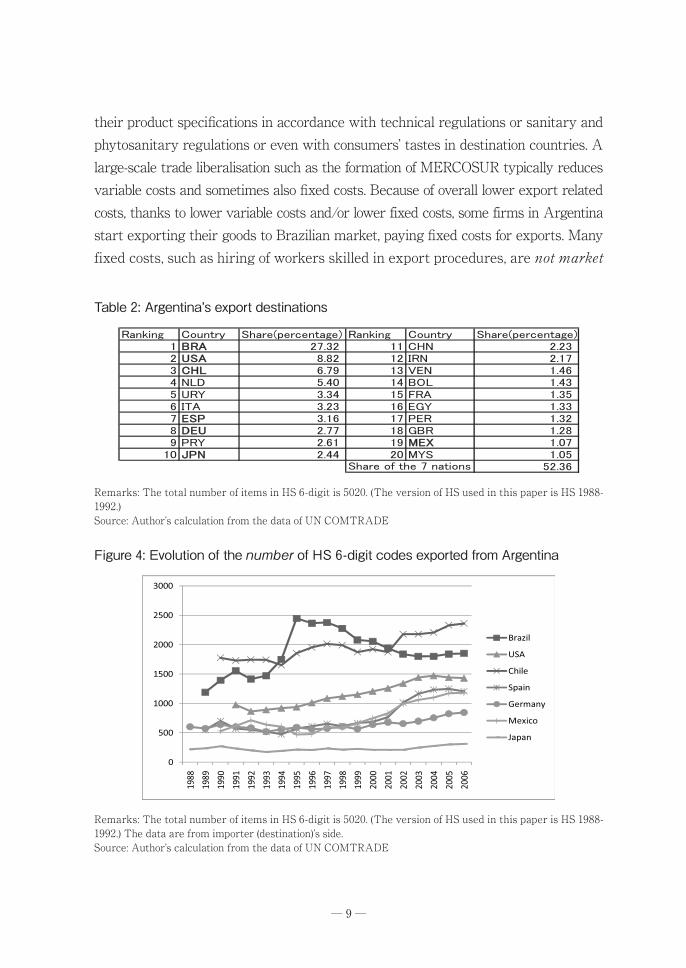
As discussed above, the more disaggregated the data, the more accurately we can capture new goods exports. Thus, HS 6-digit code is much better than SITC code since the former has four times more product lines than the latter. Using HS 6-digit data of Argentina’s exports, this section analyses the evolution of the number and the values of new goods exports by destination, intending to see the effect of MERCOSUR. Figure 3 shows the change in the number of HS 6-digit codes exported between 1993 and 19984 by destinations. In order to see the impact of MERCOSUR, it is necessary to compare the difference between before-MERCOSUR and after -MERCOSUR and also compare the difference across destination countries. However, the former analysis, i.e., over-time analysis is not feasible since, as mentioned above, the data is available only from 1993. Thus, only the cross-country analysis is attempted here. The base year is 1993 because the gradual elimination of tariffs started upon the signature of the treaty of Asunción in 1991 and also because we should take into accounts the expectation effects. In almost all trade policy changes, economic agents, such as firms and households start to adapt to the new regimes even before the implementation of the policy change as long as the announcements of the policy changes are credible. The year 1998 has been taken so that the picture will not be clouded by large currency devaluation by Brazil in January 1999. The increase in the number of exported product lines for the Brazilian market, 800, is remarkable. It is more than double of the next largest change, Uruguay, with approximately 400. Another notable finding is the high share of Latin American countries, such as Bolivia and Chile, which are both associate member countries of MERCOSUR. Although Figure 3 is useful to see the evolution of the number of exported product lines by destination countries, the data availability from 1993 precludes us from seeing the tendency before MERCOSUR. However, data from the importers sides enable us to see some trend before MERCOSUR. Table 2 shows Argentina’s export destinations. Among the top 20 destination countries, there are some countries which record their imports from 1990 or earlier. Those are Brazil, USA, Chile, Spain, Germany, Mexico and Japan. Using the imports data from these 7 countries, I have counted the number of HS 6-digit codes exported. The result is in Figure 4.
MERCOSUR and the Diversification of Argentina’s Exports
─ 8 ─
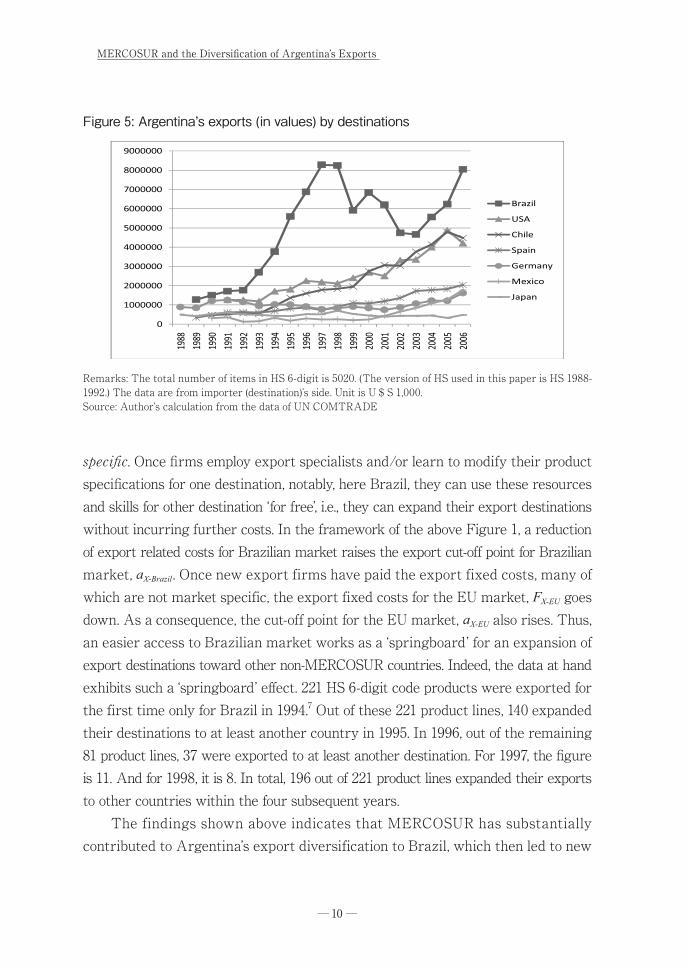
Looking at the time series of Brazil, there is an accelerated increase in the number of HS 6-digit codes in the period of 1992-1995. The level of the number stayed almost at the same level until 1998, just before Brazil’s devaluation. Moreover, comparing the change in 1992-1996 across countries, the increase for Brazil also stands out. While Figure 4 shows the evolution of the number of HS 6-digit codes exported by destinations, Figure 5 shows Argentina’s export values by destinations. The export value to Brazil has a dramatic increase from 1992 to 1998. The period of accelerated increase in values, i.e. 1992-1998, is a few years longer than the period of accelerated increase in numbers, i.e. 1992-1995. But in fact, the goods started to be exported during 1992-1995 had a large impact on the increase in values during the subsequent years, 1996-1998. The total value of newly exported goods in 1993-1995 more than tripled in the subsequent three years.5 On the other hand, ‘old’ products’ trade value increased only by 1.45 times from 1993-1995 to 1996-1998. Another question worth investigating is if new exports to the Brazilian market triggered exports of those products to other destinations. Export related costs include variable costs, such as tariffs and also fixed costs, or ‘beachhead costs’6 as is termed by some trade economists. When firms start exporting their goods, they need to hire workers skilled in export procedures, such as the handling of shipments, B/Ls (bill of ladings), marine insurances, L/C (Letters of credit), etc. Or, they may have to modify
Remarks: The total number of items in HS 6-digit is 5020. (The version of HS used in this paper is HS 1988-1992.)Source: Author’s calculation from the data of UN COMTRADE
Figure 3: Change in the number of HS 6-digit codes exported, Argentina, 1993-1998
─ 9 ─
their product specifications in accordance with technical regulations or sanitary and phytosanitary regulations or even with consumers’ tastes in destination countries. A large-scale trade liberalisation such as the formation of MERCOSUR typically reduces variable costs and sometimes also fixed costs. Because of overall lower export related costs, thanks to lower variable costs and/or lower fixed costs, some firms in Argentina start exporting their goods to Brazilian market, paying fixed costs for exports. Many fixed costs, such as hiring of workers skilled in export procedures, are not market
Table 2: Argentina’s export destinations
Remarks: The total number of items in HS 6-digit is 5020. (The version of HS used in this paper is HS 1988-1992.)Source: Author’s calculation from the data of UN COMTRADE
Figure 4: Evolution of the number of HS 6-digit codes exported from Argentina
Remarks: The total number of items in HS 6-digit is 5020. (The version of HS used in this paper is HS 1988-1992.) The data are from importer (destination)’s side.Source: Author’s calculation from the data of UN COMTRADE
MERCOSUR and the Diversification of Argentina’s Exports
─ 10 ─
specific. Once firms employ export specialists and/or learn to modify their product specifications for one destination, notably, here Brazil, they can use these resources and skills for other destination ‘for free’, i.e., they can expand their export destinations without incurring further costs. In the framework of the above Figure 1, a reduction of export related costs for Brazilian market raises the export cut-off point for Brazilian market, aX-Brazil. Once new export firms have paid the export fixed costs, many of which are not market specific, the export fixed costs for the EU market, FX-EU goes down. As a consequence, the cut-off point for the EU market, aX-EU also rises. Thus, an easier access to Brazilian market works as a ‘springboard’ for an expansion of export destinations toward other non-MERCOSUR countries. Indeed, the data at hand exhibits such a ‘springboard’ effect. 221 HS 6-digit code products were exported for the first time only for Brazil in 1994.7 Out of these 221 product lines, 140 expanded their destinations to at least another country in 1995. In 1996, out of the remaining 81 product lines, 37 were exported to at least another destination. For 1997, the figure is 11. And for 1998, it is 8. In total, 196 out of 221 product lines expanded their exports to other countries within the four subsequent years. The findings shown above indicates that MERCOSUR has substantially contributed to Argentina’s export diversification to Brazil, which then led to new
Remarks: The total number of items in HS 6-digit is 5020. (The version of HS used in this paper is HS 1988-1992.) The data are from importer (destination)’s side. Unit is U $ S 1,000.Source: Author’s calculation from the data of UN COMTRADE
Figure 5: Argentina’s exports (in values) by destinations
─ 11 ─
goods exports to other destinations.
4. ECONOMETRIC ANALYSIS
Having seen in graphs that there are some indications of the effect of MERCOSUR on Argentina’s exports to Brazil and other countries both in terms of the number of exported goods categories and in terms of total values, in this section, I estimate Tobit model on gravity equation as more rigorous tests of MERCOSUR’s effect on the evolution of the number of exported goods categories. The gravity equation is the most frequently used model of trade flow estimations.8 This formal analysis enables us to sort out the effect of MERCOSUR.
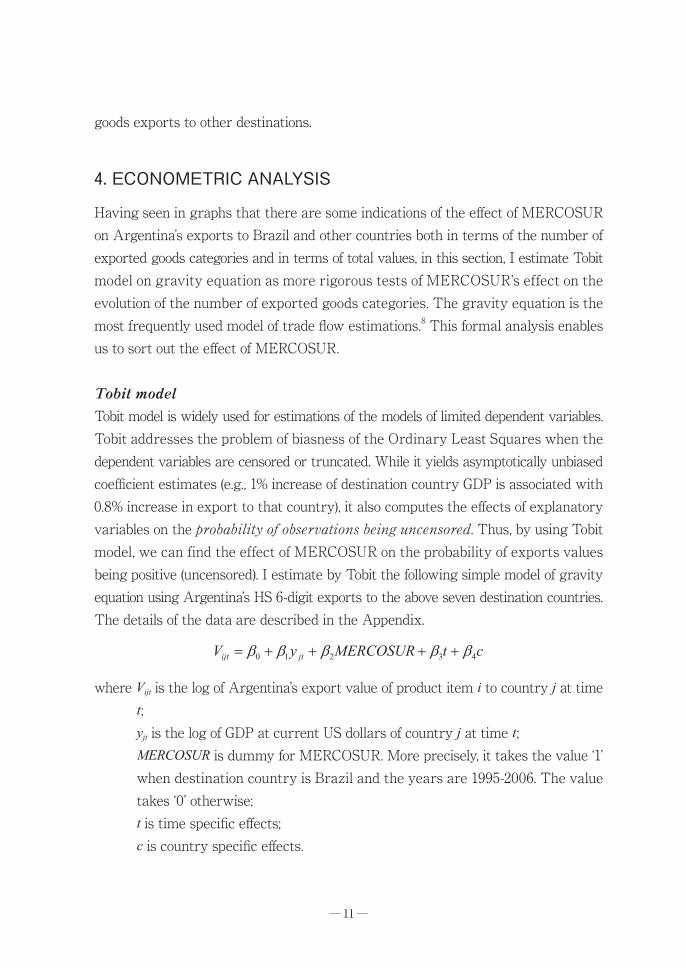
Tobit modelTobit model is widely used for estimations of the models of limited dependent variables. Tobit addresses the problem of biasness of the Ordinary Least Squares when the dependent variables are censored or truncated. While it yields asymptotically unbiased coefficient estimates (e.g., 1% increase of destination country GDP is associated with 0.8% increase in export to that country), it also computes the effects of explanatory variables on the probability of observations being uncensored. Thus, by using Tobit model, we can find the effect of MERCOSUR on the probability of exports values being positive (uncensored). I estimate by Tobit the following simple model of gravity equation using Argentina’s HS 6-digit exports to the above seven destination countries. The details of the data are described in the Appendix.
where Vijt is the log of Argentina’s export value of product item i to country j at time t;yjt is the log of GDP at current US dollars of country j at time t;MERCOSUR is dummy for MERCOSUR. More precisely, it takes the value ‘1’ when destination country is Brazil and the years are 1995-2006. The value takes ‘0’ otherwise;t is time specific effects;c is country specific effects.
MERCOSUR and the Diversification of Argentina’s Exports
─ 12 ─
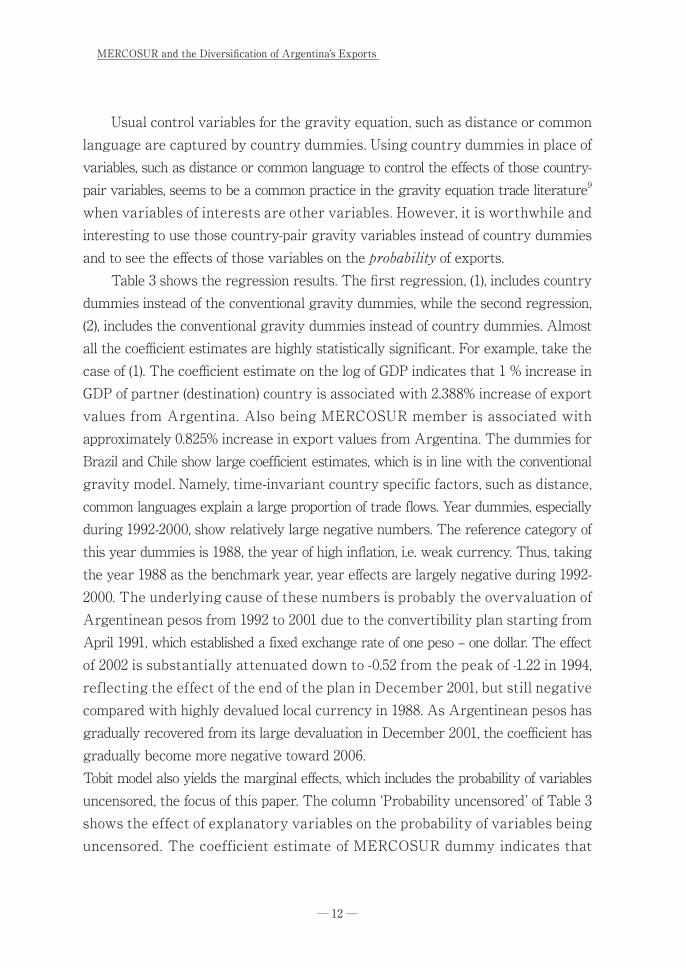
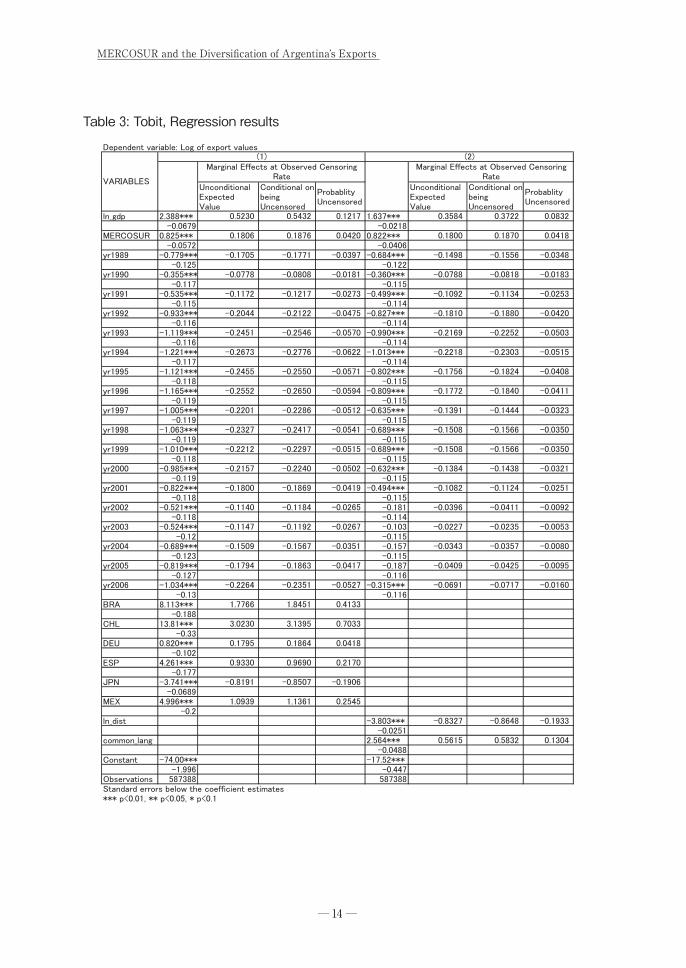
Usual control variables for the gravity equation, such as distance or common language are captured by country dummies. Using country dummies in place of variables, such as distance or common language to control the effects of those country-pair variables, seems to be a common practice in the gravity equation trade literature9 when variables of interests are other variables. However, it is worthwhile and interesting to use those country-pair gravity variables instead of country dummies and to see the effects of those variables on the probability of exports. Table 3 shows the regression results. The first regression, (1), includes country dummies instead of the conventional gravity dummies, while the second regression, (2), includes the conventional gravity dummies instead of country dummies. Almost all the coefficient estimates are highly statistically significant. For example, take the case of (1). The coefficient estimate on the log of GDP indicates that 1 % increase in GDP of partner (destination) country is associated with 2.388% increase of export values from Argentina. Also being MERCOSUR member is associated with approximately 0.825% increase in export values from Argentina. The dummies for Brazil and Chile show large coefficient estimates, which is in line with the conventional gravity model. Namely, time-invariant country specific factors, such as distance, common languages explain a large proportion of trade flows. Year dummies, especially during 1992-2000, show relatively large negative numbers. The reference category of this year dummies is 1988, the year of high inflation, i.e. weak currency. Thus, taking the year 1988 as the benchmark year, year effects are largely negative during 1992-2000. The underlying cause of these numbers is probably the overvaluation of Argentinean pesos from 1992 to 2001 due to the convertibility plan starting from April 1991, which established a fixed exchange rate of one peso – one dollar. The effect of 2002 is substantially attenuated down to -0.52 from the peak of -1.22 in 1994, reflecting the effect of the end of the plan in December 2001, but still negative compared with highly devalued local currency in 1988. As Argentinean pesos has gradually recovered from its large devaluation in December 2001, the coefficient has gradually become more negative toward 2006.Tobit model also yields the marginal effects, which includes the probability of variables uncensored, the focus of this paper. The column ‘Probability uncensored’ of Table 3 shows the effect of explanatory variables on the probability of variables being uncensored. The coefficient estimate of MERCOSUR dummy indicates that
─ 13 ─
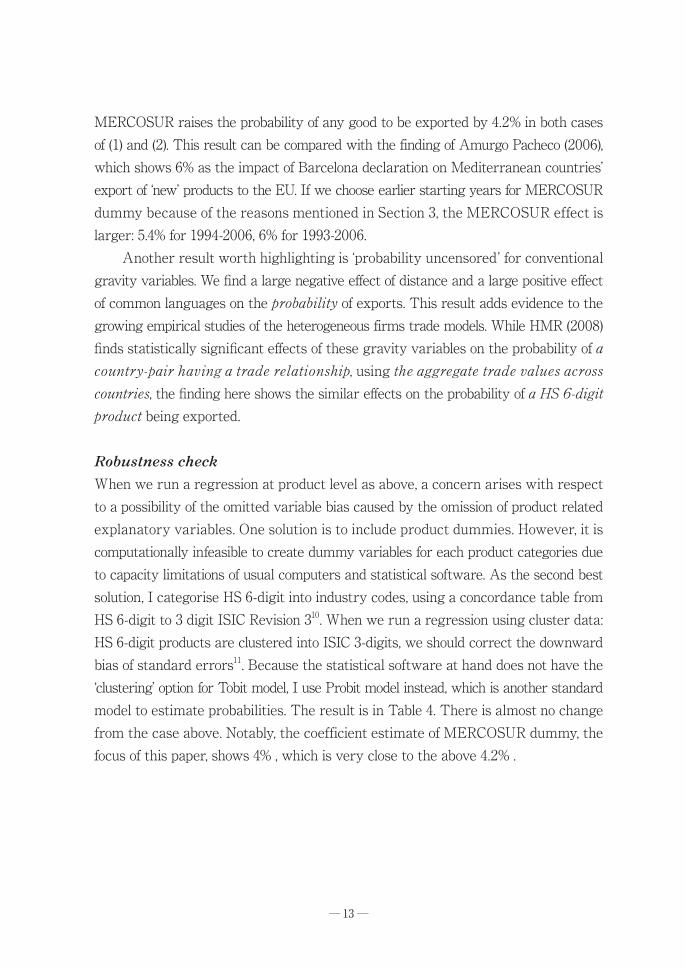
MERCOSUR raises the probability of any good to be exported by 4.2% in both cases of (1) and (2). This result can be compared with the finding of Amurgo Pacheco (2006), which shows 6% as the impact of Barcelona declaration on Mediterranean countries’ export of ‘new’ products to the EU. If we choose earlier starting years for MERCOSUR dummy because of the reasons mentioned in Section 3, the MERCOSUR effect is larger: 5.4% for 1994-2006, 6% for 1993-2006. Another result worth highlighting is ‘probability uncensored’ for conventional gravity variables. We find a large negative effect of distance and a large positive effect of common languages on the probability of exports. This result adds evidence to the growing empirical studies of the heterogeneous firms trade models. While HMR (2008) finds statistically significant effects of these gravity variables on the probability of a country-pair having a trade relationship, using the aggregate trade values across countries, the finding here shows the similar effects on the probability of a HS 6-digit product being exported.
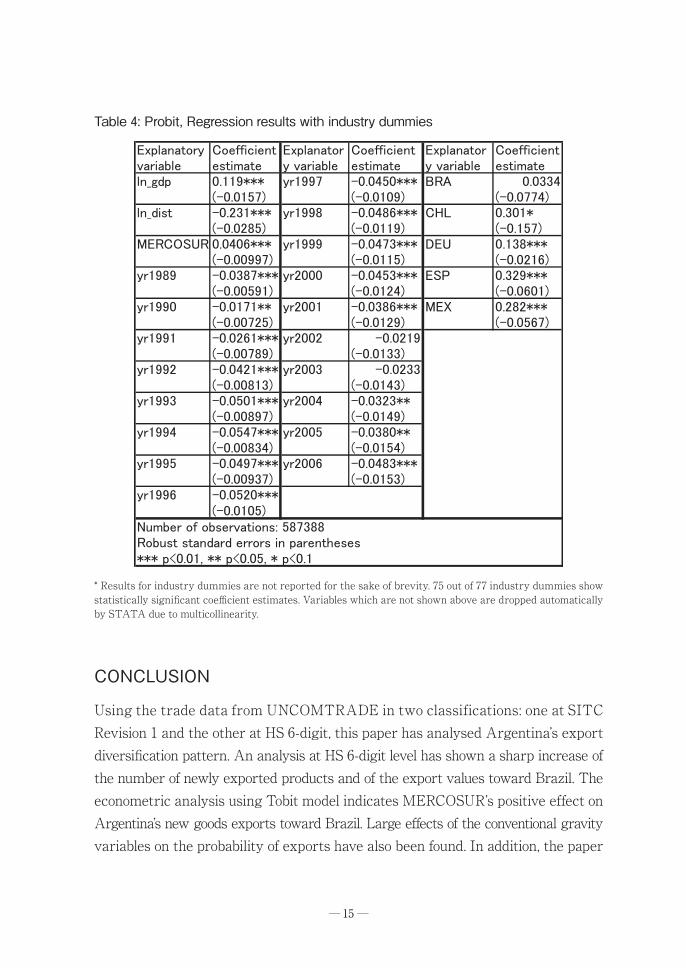
Robustness checkWhen we run a regression at product level as above, a concern arises with respect to a possibility of the omitted variable bias caused by the omission of product related explanatory variables. One solution is to include product dummies. However, it is computationally infeasible to create dummy variables for each product categories due to capacity limitations of usual computers and statistical software. As the second best solution, I categorise HS 6-digit into industry codes, using a concordance table from HS 6-digit to 3 digit ISIC Revision 310. When we run a regression using cluster data: HS 6-digit products are clustered into ISIC 3-digits, we should correct the downward bias of standard errors11. Because the statistical software at hand does not have the ‘clustering’ option for Tobit model, I use Probit model instead, which is another standard model to estimate probabilities. The result is in Table 4. There is almost no change from the case above. Notably, the coefficient estimate of MERCOSUR dummy, the focus of this paper, shows 4% , which is very close to the above 4.2% .
MERCOSUR and the Diversification of Argentina’s Exports
─ 14 ─
Table 3: Tobit, Regression results
─ 15 ─
CONCLUSION
Using the trade data from UNCOMTRADE in two classifications: one at SITC Revision 1 and the other at HS 6-digit, this paper has analysed Argentina’s export diversification pattern. An analysis at HS 6-digit level has shown a sharp increase of the number of newly exported products and of the export values toward Brazil. The econometric analysis using Tobit model indicates MERCOSUR’s positive effect on Argentina’s new goods exports toward Brazil. Large effects of the conventional gravity variables on the probability of exports have also been found. In addition, the paper
* Results for industry dummies are not reported for the sake of brevity. 75 out of 77 industry dummies show statistically significant coefficient estimates. Variables which are not shown above are dropped automatically by STATA due to multicollinearity.
Table 4: Probit, Regression results with industry dummies
MERCOSUR and the Diversification of Argentina’s Exports
─ 16 ─
has argued the role of a large-scale trade liberalisation for an expansion of new goods exports to other non-member countries, which this paper calls ‘springboard’ effect. It has shown an evidence for such an effect in Argentina’s exports.
REFERENCESAmurgo Pacheco, Alberto (2006) "Preferential Trade Liberalization and the Range of Exported Products:
The Case of the Euro-Mediterranean FTA" HEI Working Paper No.18/2006.Baldwin, Richard E. (2005) "Heterogeneous Firms and Trade: Testable and Untestable Properties of the
Melitz Model" NBER Working Paper No. W11471.Baldwin, Richard E. (2007) "Melitz made easy " Mimeo. Cadot, Olivier, Carrère Céline, and Strauss-Kahn, Vanessa (2007), "Export Diverfication: What’s behind
the Hump? " CEPR Discussion Paper No. 6590.Feenstra, Robert C. and Kee Hiau Looi (2007), "Trade Liberalisation and Export Variety: A Comparison
of Mexico and China" The World Economy Volume1, Issue1 pp5-21.Helpman, E., M. Melitz and Y. Rubinstein (2004), " Trading Partners and Trading Volumes", Quarterly
Journal of Economics Vol. 123.Hummels and Klenow (2005) "The Variety and Quality of a Nations Exports" American Economic Review,
June 2005, 704-723.Imbs, J. and Wacziarg, R. (2003) "Stages of diversification" American Economic Review, Vol. 93 No.1 pp63-
86.Klinger, Bailey and Lederman, Daniel (2004) "Discovery and Development: An empirical exploration of
‘new’ products" World Bank Policy Research Working Paper Series No. 3450.Krugman, P. (1980) "Scale Economies, Product Differentiation and the Pattern of Trade" American
Economic Review, 70, 950-959. Melitz, Marc J. (2003) "The Impact of Trade on Intra-Industry Reallocations and Aggregate Industry
Productivity", Econometrica 71:6, pp. 1695-1725.Moulton, Brent R. (1990) "An Illustration of a Pitfall in Estimating the Effects of Aggregate Variables on
Micro Units" The Review of Economics and Statistics Vol .72, No.2, pp.334-338.Sachs, Jeffery D. and Warner, Andrew (1995) "Economic Reform and the Process of Global Integration"
Brookings Papers on Economic Activity 1: 1-118.
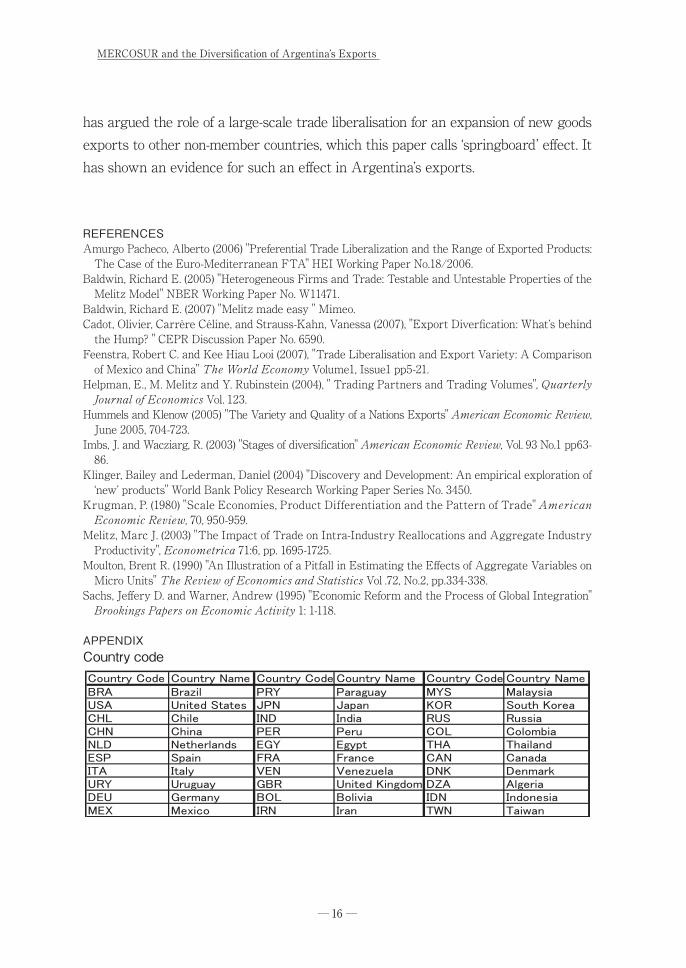
APPENDIXCountry code
─ 17 ─
The data descriptionTrade data at SITC Revision 1 and HS 6-digit are from UN COMTRADE at http://comtrade.un.org/GDP data are “GDP at current US dollars” at World Development Indicators, The World BankData of distance are from CEPII (Centre d’études prospectives et d’informations internationales) at www.cepii.frAll the non-discrete variables, such as GDP, distances are transformed into logs so that we can perform
unit-free analysis, i.e. in elasticity terms. To circumvent the problem of minus infinity when taking logs of zeros and to have zero entries for non-exported observation after taking logs, I have added one to all the export values, including zero entry, and then have taken logs. Thus, the level in absolute values are shifted up by one, but it does not affect variances and covariances.
【NOTE】 1 More recently, using diaggregated panel data, Imbs and Wacziarg (2003), Klinger and Lederman
(2004) and Cadot et al. (2007) show that poor countries tend to have lower degree of export diversification.
2 The explanation here is highly simplified to minimize the length of the discussion because the detailed rigorous explanation of the theory is beyond the scope of this paper. Interested readers may be referred to Melitz (2003), Baldwin (2005) or Baldwin (2007).
3 The exact number depends on the versions of revisions. 4 More precisely, the change in the number is calculated as the number of exported product lines in
1998 minus the number of exported product lines in 1993. 5 To be precise, 3.19 times more. 6 This term is used by Richard Baldwin, for example. It is a term used in the US Marine. When they
landed on Normandie in 1944, they needed to set up the base before starting to attack the Nazis Germany. The cost for setting up the base is called ‘beachhead costs’.
7 The year 1994 has been taken instead of 1992 because Argentina’s export data is only available from 1993 and the data for earlier years are only available from some destination country sides, as mentioned above. In order to have the data for a large number of destinations (here 30 largest destinations), I have used the data from the side of Argentina. (i.e., the reporter is Argentina.)
8 The simplest Gravity equation is Ordinary Least Square Regression on basic explanatory variables including GDP, GDP per capita, population, land area, distance, and language. These variables are assumed to predict ‘normal’ trade patterns between countries. If we add trade bloc dummies, the coefficients pick up the bloc effects. Gravity models have been employed for empirical studies in the international economics literature since the 1960s and have gained theoretical credibility from the late 1980s onwards.
9 Amurgo Pacheco (2006) uses country dummies, for example, presumably because of the reason I mentioned here.
10 In total, 77 ISIC 3-digit categories. 11 See Moulton (1990) for the details of the downward bias.
Related Documents