Merchandise Inventory Chapter 6 6-1 Copyright ©2014 Pearson Education, Inc. publishing as Prentice Hall

Merchandise Inventory Chapter 6 6-1Copyright ©2014 Pearson Education, Inc. publishing as Prentice Hall.
Dec 26, 2015
Welcome message from author
This document is posted to help you gain knowledge. Please leave a comment to let me know what you think about it! Share it to your friends and learn new things together.
Transcript

Merchandise Inventory
Chapter 6
6-1Copyright ©2014 Pearson Education, Inc. publishing as Prentice Hall
Accounting principles and
controls related to merchandise
inventory
6-2

Consistency Principle
• Businesses should use the same accounting methods and procedures from period to period.
• Consistency helps users of financial statement information to compare financial statements from one period to the next.
6-3
A change in the accounting
methods, must be reported to the investors and
creditors in the Notes to the
Financial Statements.
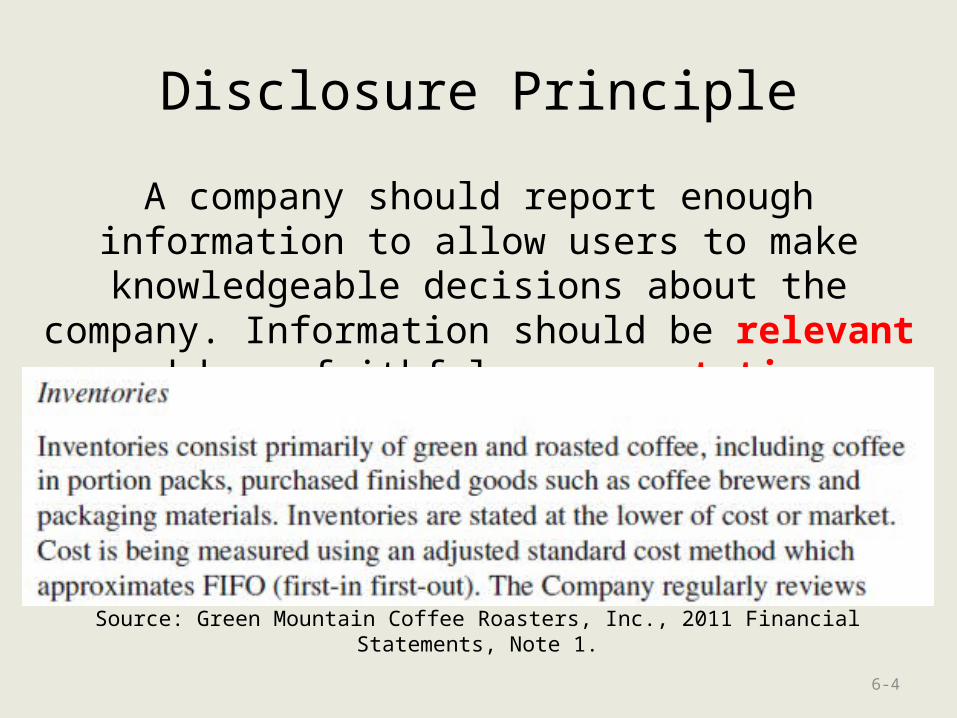
Disclosure Principle
A company should report enough information to allow users to make knowledgeable decisions about the company. Information should be relevant and have
faithful representation.
6-4
Source: Green Mountain Coffee Roasters, Inc., 2011 Financial Statements, Note 1.
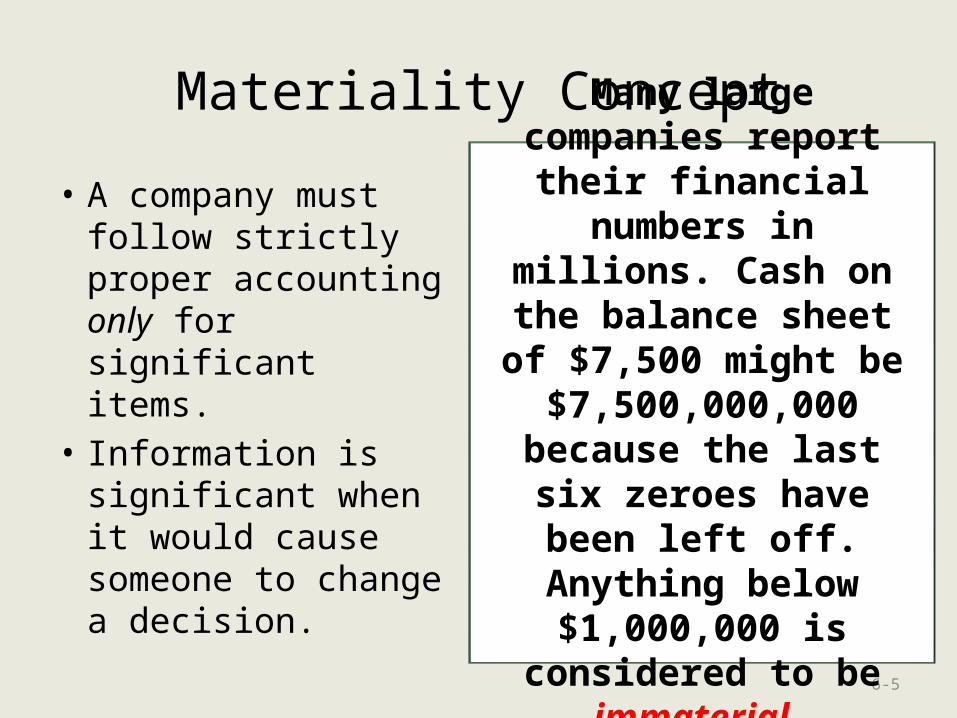
Materiality Concept
• A company must follow strictly proper accounting only for significant items.
• Information is significant when it would cause someone to change a decision.
6-5
Many large companies report their financial numbers in millions. Cash on the balance
sheet of $7,500 might be $7,500,000,000 because the last six zeroes have been left off. Anything
below $1,000,000 is considered to be immaterial.

Conservatism
• A company should report the least favorable figures in the financial statements when two or more possible options are presented.
• Goal: Never overstate assets or net income.
• Anticipate no gains• Provide for probable
losses• Conservatively report
assets and liabilities• When in doubt record an
expense instead of an asset
• Choose options that undervalue the business
6-6
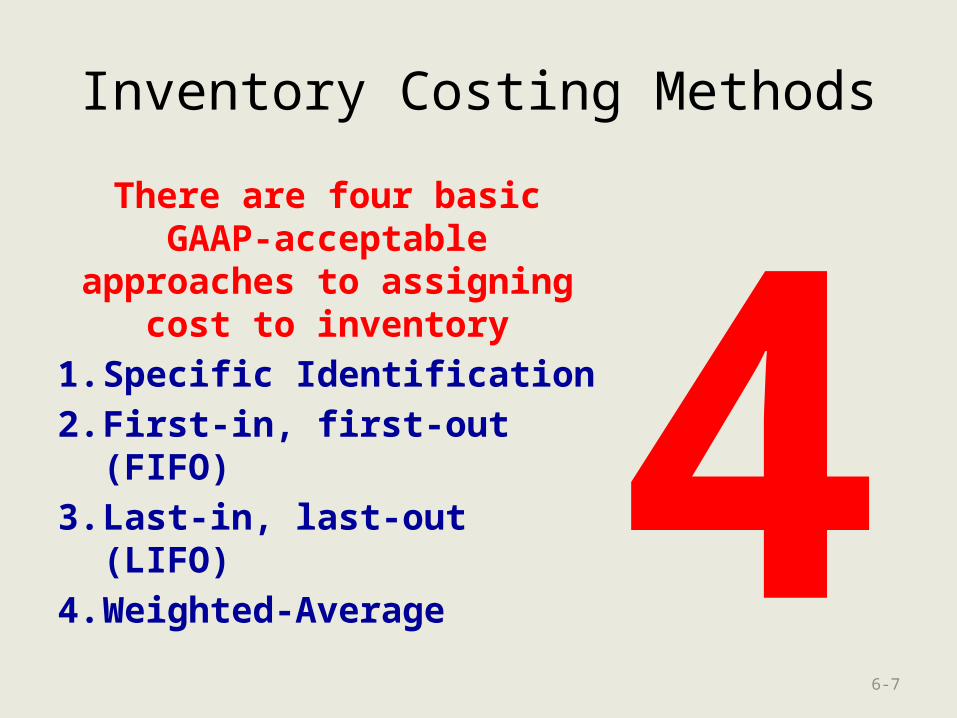
Inventory Costing Methods
There are four basic GAAP-acceptable
approaches to assigning cost to inventory
1. Specific Identification
2. First-in, first-out (FIFO)
3. Last-in, last-out (LIFO)
4. Weighted-Average
6-7
4

Perpetual Specific Identification
• Used when the specific cost for each unit of inventory can be tracked.
• As each unit is sold, its specific cost is transferred from inventory to Cost of Goods Sold.
6-8
Used for inventories that
include:AutomobilesUnique Artwork
JewelsReal Estate
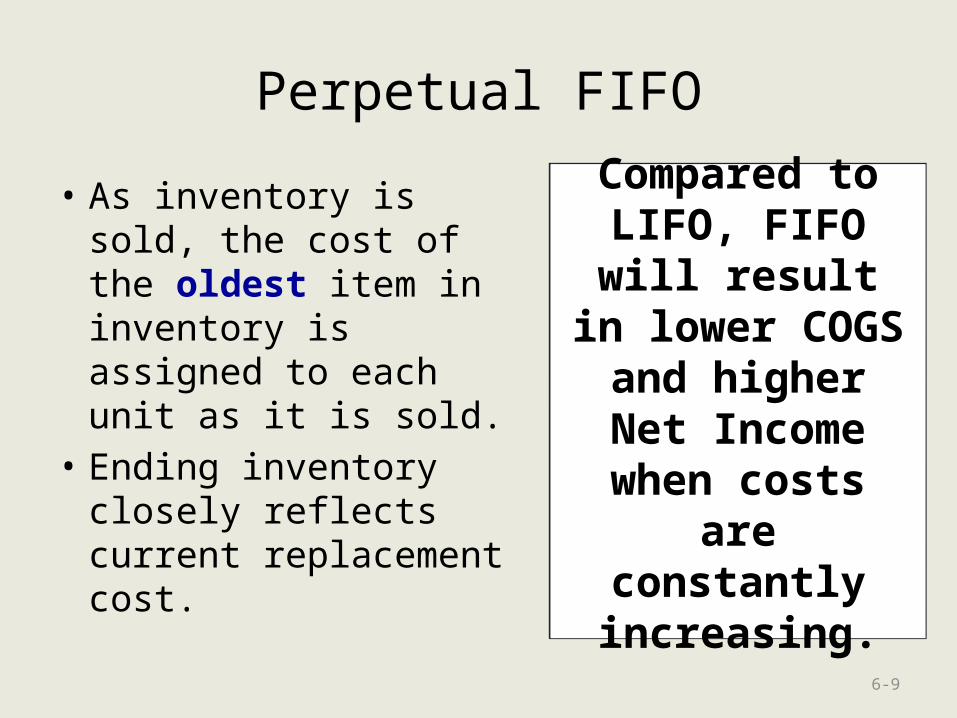
Perpetual FIFO
• As inventory is sold, the cost of the oldest item in inventory is assigned to each unit as it is sold.
• Ending inventory closely reflects current replacement cost.
6-9
Compared to LIFO, FIFO will result in lower
COGS and higher Net Income when
costs are constantly increasing.

Perpetual LIFO
• As inventory is sold, the cost of the newest item in inventory is assigned to each unit as it is sold.
• Cost of Goods Sold closely reflects current replacement cost.
6-10
Compared to FIFO, LIFO will result in higher
COGS and lower Net Income when
costs are constantly increasing.
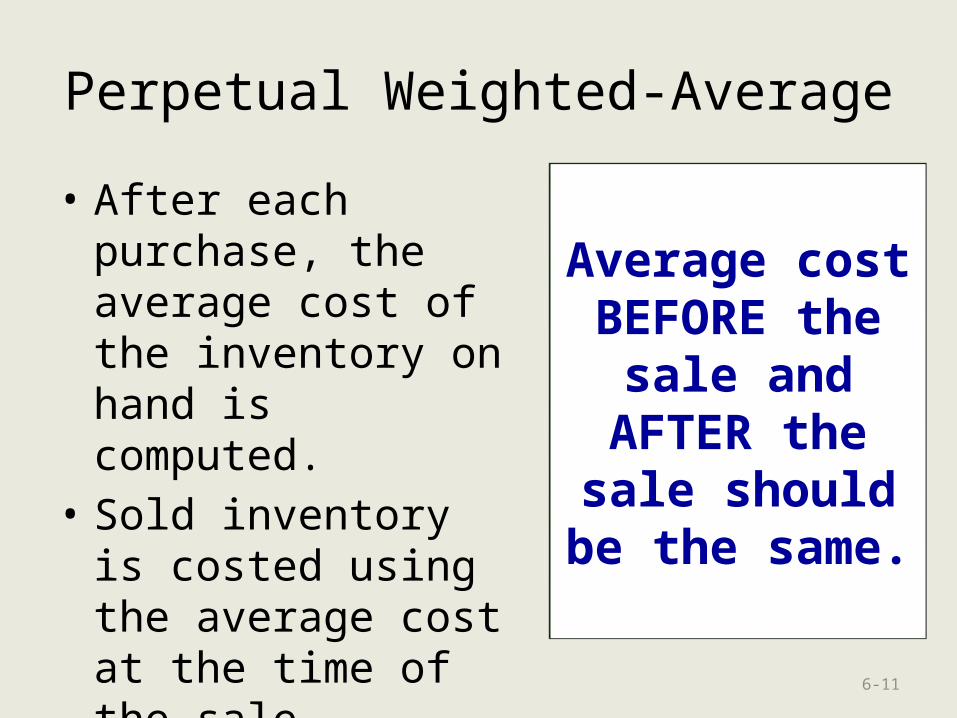
Perpetual Weighted-Average
• After each purchase, the average cost of the inventory on hand is computed.
• Sold inventory is costed using the average cost at the time of the sale.
6-11
Average cost BEFORE the
sale and AFTER the sale should be the
same.
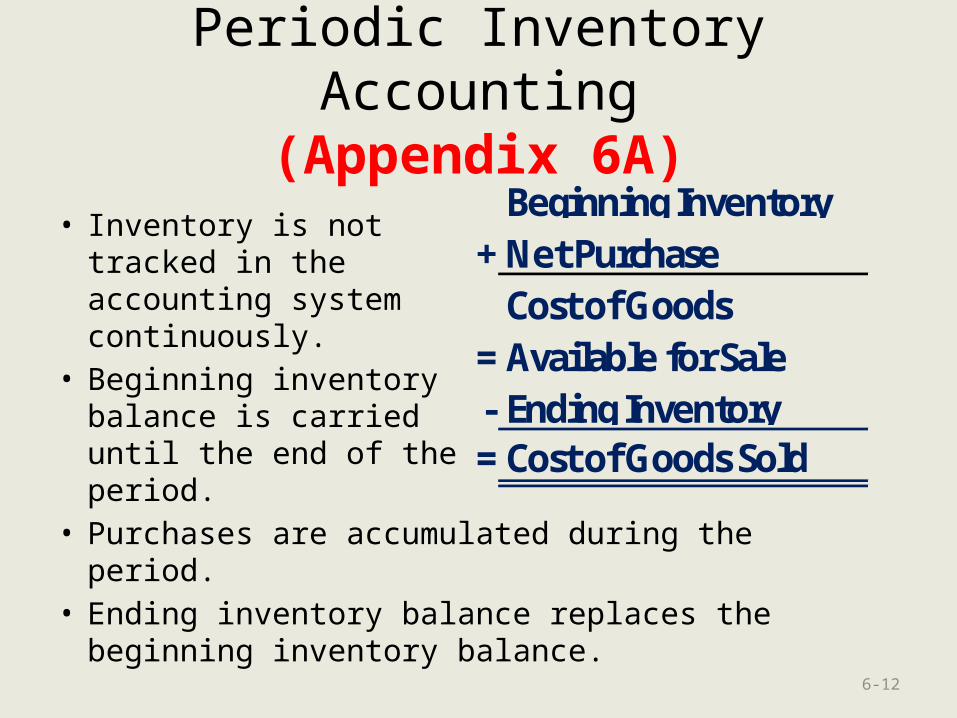
Periodic Inventory Accounting(Appendix 6A)
• Inventory is not tracked in the accounting system continuously.
• Beginning inventory balance is carried until the end of the period.
• Purchases are accumulated during the period.• Ending inventory balance replaces the beginning
inventory balance.6-12
Beginning Inventory + Net Purchase
=Cost of Goods Available for Sale
- Ending Inventory = Cost of Goods Sold
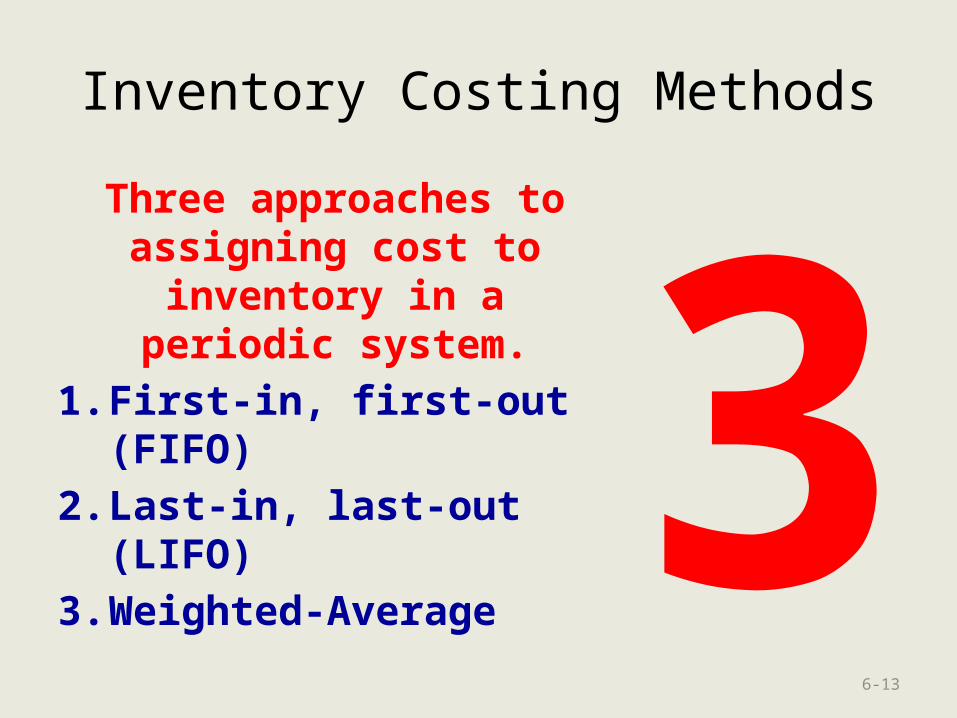
Inventory Costing Methods
Three approaches to assigning cost to inventory
in a periodic system.
1. First-in, first-out (FIFO)
2. Last-in, last-out (LIFO)
3. Weighted-Average
6-13
3

Using the information below, let’s see how we would apply a periodic system to
determine Cost of Goods Sold.
6-14
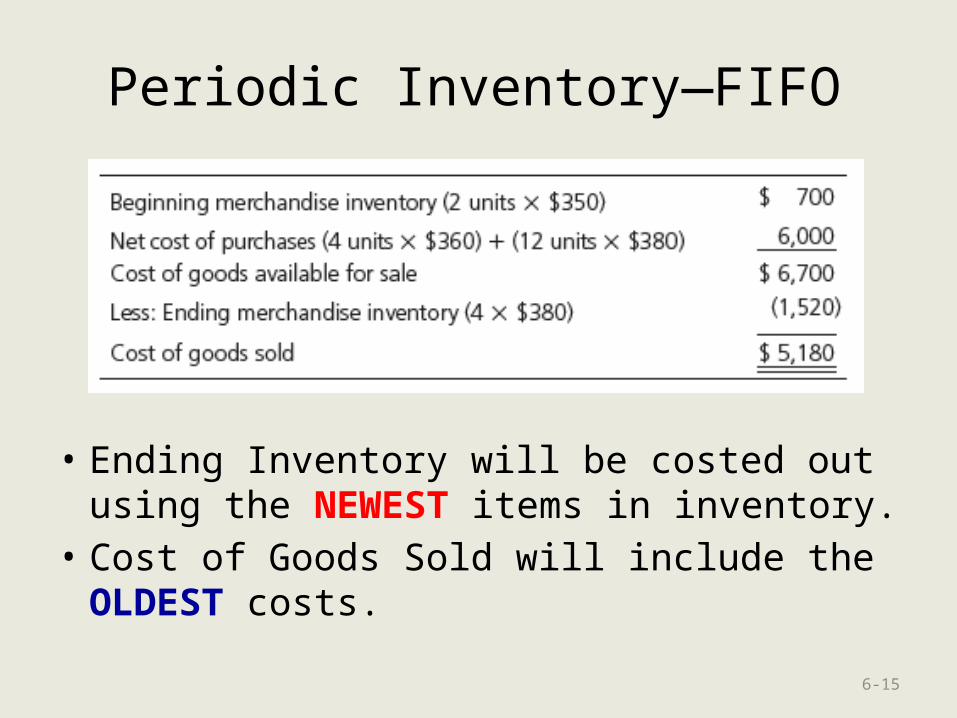
Periodic Inventory—FIFO
• Ending Inventory will be costed out using the NEWEST items in inventory.
• Cost of Goods Sold will include the OLDEST costs.
6-15
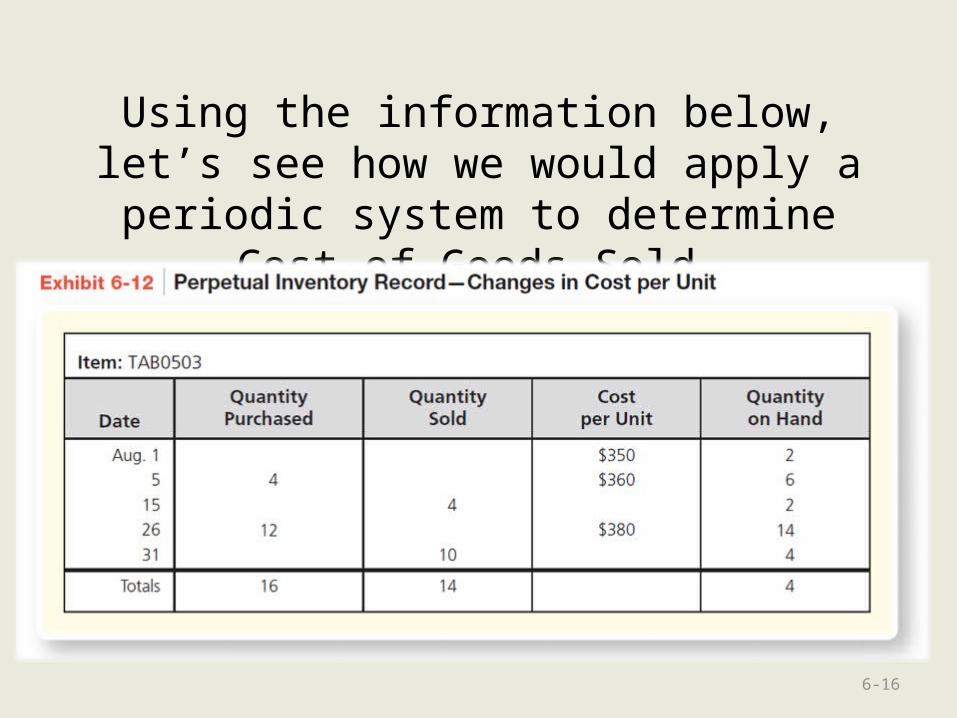
Using the information below, let’s see how we would apply a periodic system to
determine Cost of Goods Sold.
6-16

Periodic Inventory—LIFO
• Ending Inventory will be costed out using the OLDEST items in inventory.
• Cost of Goods Sold will include the NEWEST costs.
6-17

Weighted Average-CostThe average-cost per unit is assigned to cost of goods sold and to units remaining in inventory.
18
Average CostCost of Inventory Available
Number of Units Available÷ =

Periodic Inventory—Weighted Average
• Ending Inventory is costed using the AVERAGE cost of inventory.
• Cost of Goods Sold will also be costed using AVERAGE cost of inventory.
6-19
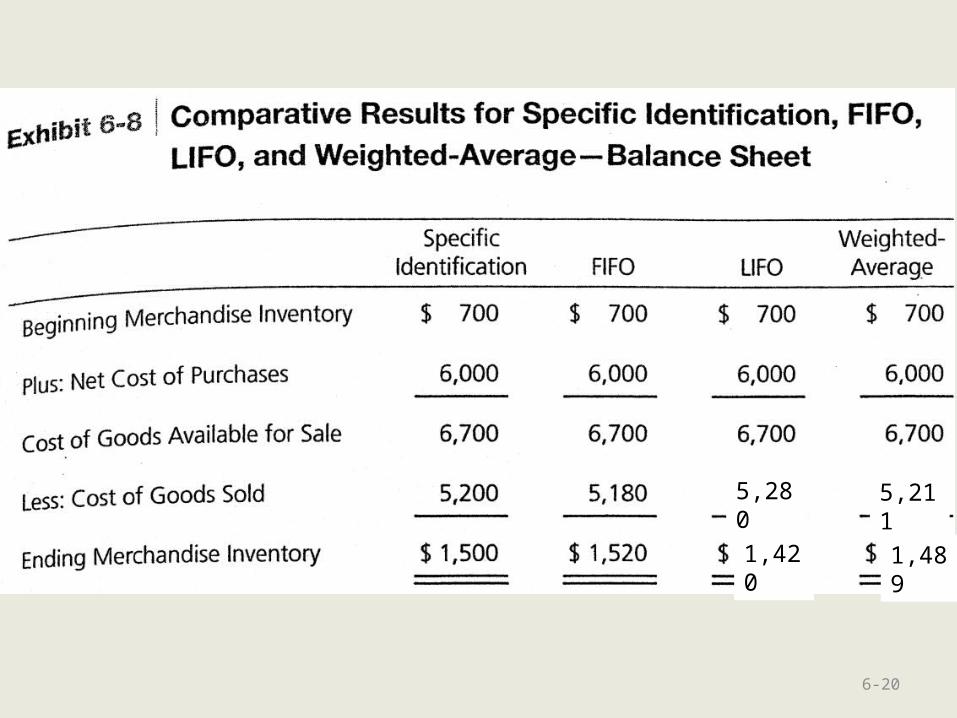
Average cost $6,700 ÷18 = $372.22
6-20
5,280
1,420
5,211
1,489

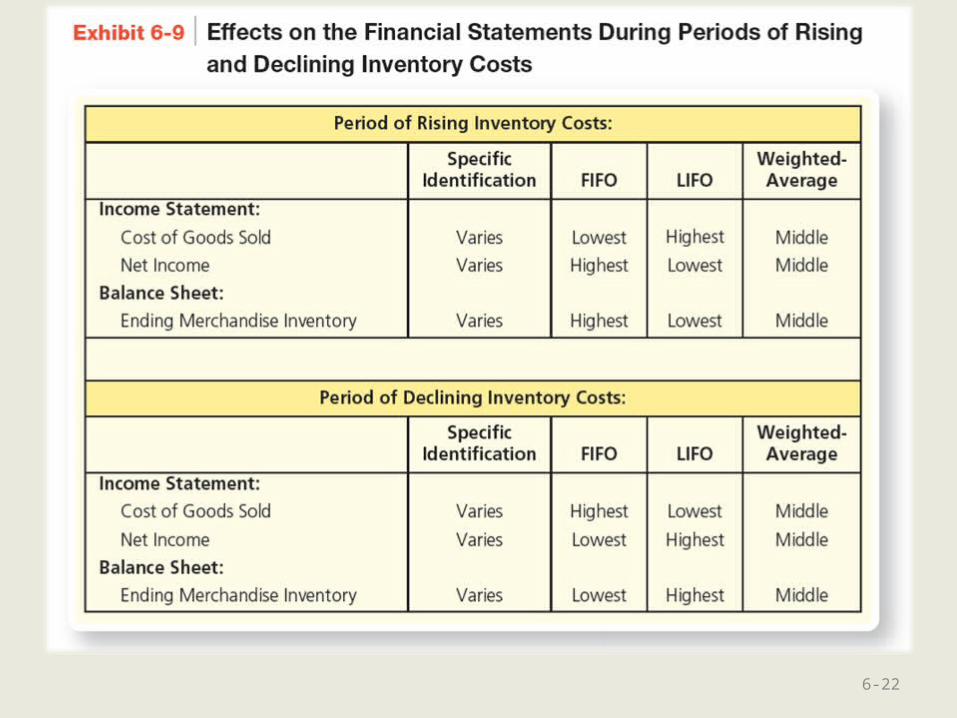
Note that FIFO results in the highest Gross Profit, while LIFO shows the highest Cost of
Goods Sold.6-21
5,280 5,211
1,720 1,789
6-22
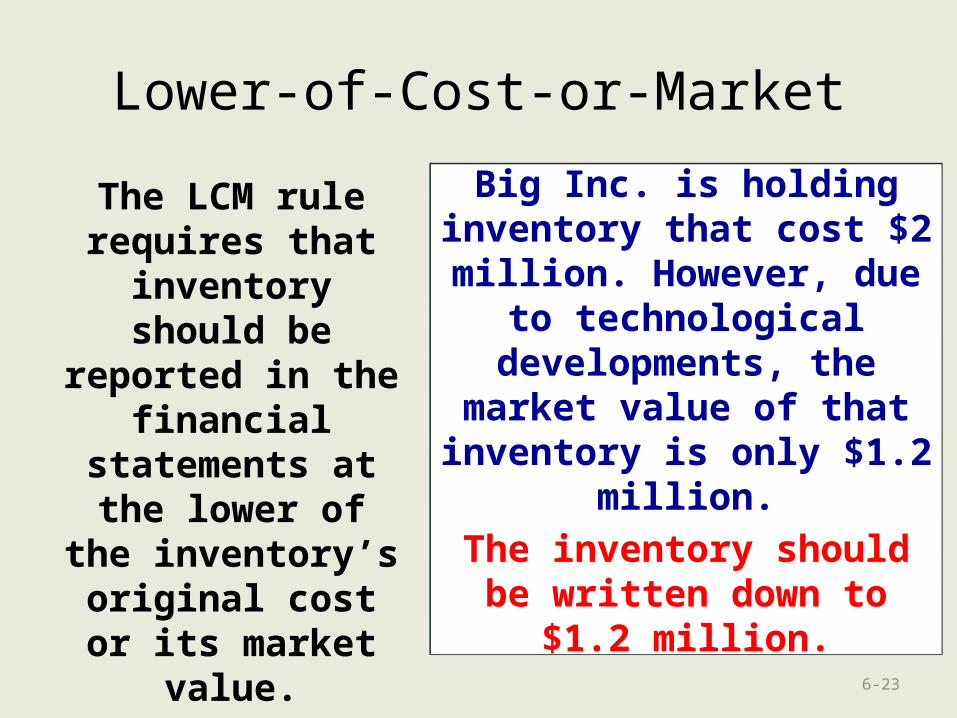
Lower-of-Cost-or-Market
The LCM rule requires that
inventory should be reported in the
financial statements at the
lower of the inventory’s original cost or its market
value.
6-23
Big Inc. is holding inventory that cost $2
million. However, due to technological
developments, the market value of that inventory is
only $1.2 million.
The inventory should be written down to $1.2
million.
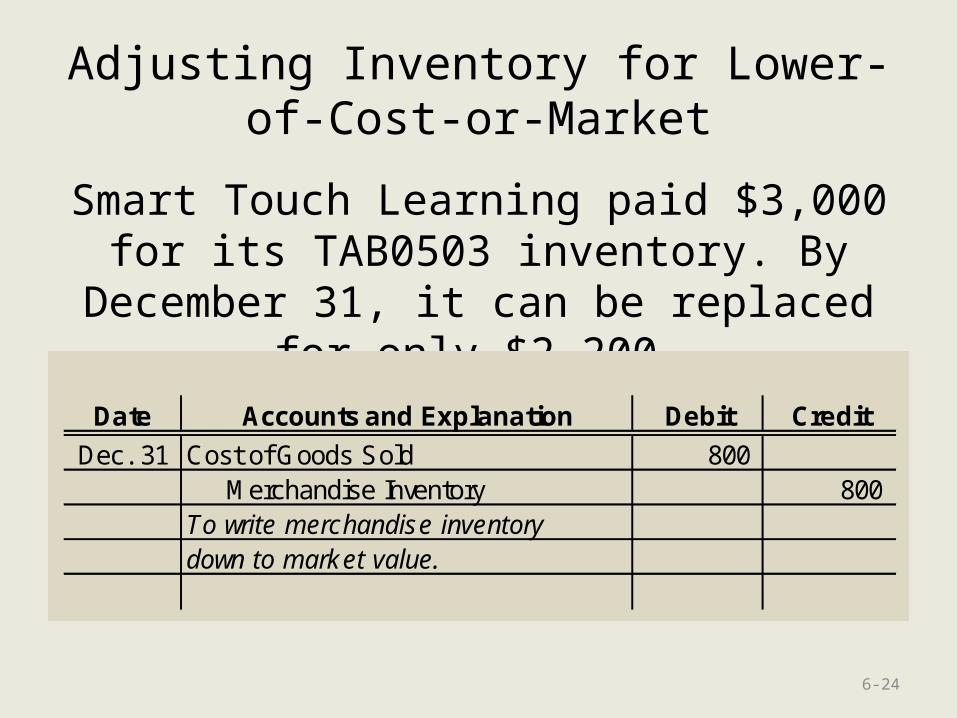
Adjusting Inventory for Lower-of-Cost-or-Market
Smart Touch Learning paid $3,000 for its TAB0503 inventory. By December 31, it can
be replaced for only $2,200.
6-24
Date Accounts and Explanation Debit Credit
Dec. 31 Cost of Goods Sold 800 Merchandise Inventory 800 To write merchandise inventorydown to market value.
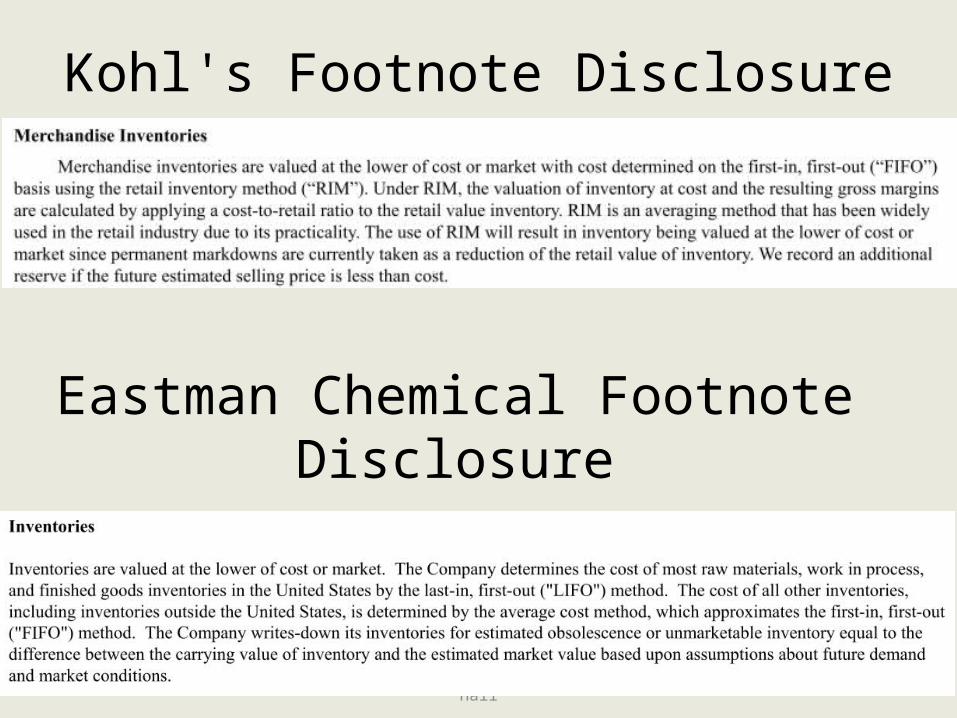
Kohl's Footnote Disclosure
6-25©2014 Pearson Education, Inc. Publishing as Prentice Hall
Eastman Chemical Footnote Disclosure
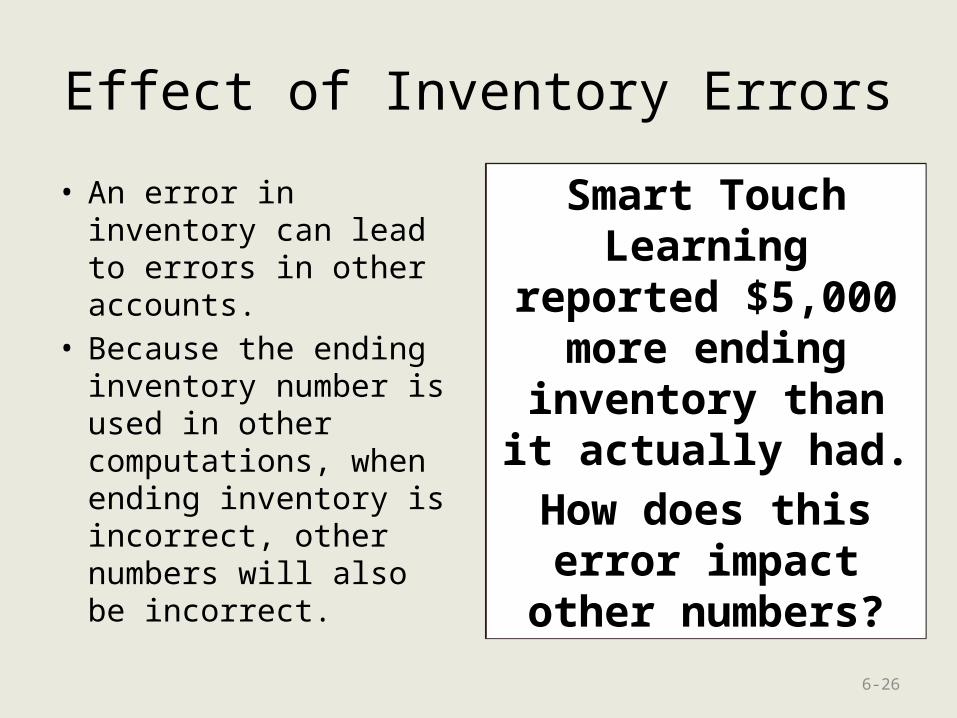
Effect of Inventory Errors
• An error in inventory can lead to errors in other accounts.
• Because the ending inventory number is used in other computations, when ending inventory is incorrect, other numbers will also be incorrect.
6-26
Smart Touch Learning reported
$5,000 more ending inventory than it
actually had.
How does this error impact other
numbers?

Effect of Inventory Errors
6-27
Ending InventoryOverstated $5,000
Sales revenue CorrectCost of Good Sold:
Beginning Inventory CorrectNet Purchases CorrectCost of Goods Available for Sale CorrectEnding Inventory ERROR: Overstated $5,000Cost of Goods Sold Understated $5,000
Gross Profit Overstated $5,000Operating Expenses CorrectNet Income Overstated $5,000

Effect of Inventory Errors
• A common fraud is for a company to intentionally overstate ending inventory, because it leads to higher Net Income.
• Sometimes ending inventory is understated.
6-28
Suppose that Smart Touch Learning
understated inventory by $1,200.
How does this error impact other
numbers?
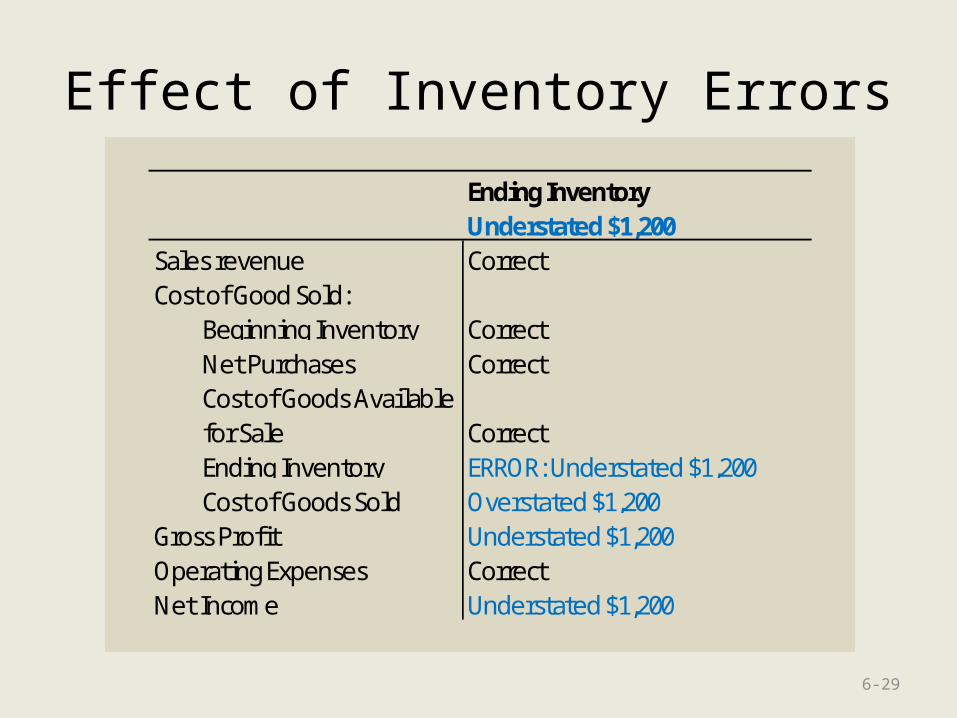
Effect of Inventory Errors
6-29
Ending InventoryUnderstated $1,200
Sales revenue CorrectCost of Good Sold:
Beginning Inventory CorrectNet Purchases CorrectCost of Goods Available for Sale CorrectEnding Inventory ERROR: Understated $1,200Cost of Goods Sold Overstated $1,200
Gross Profit Understated $1,200Operating Expenses CorrectNet Income Understated $1,200

Inventory Errors: Multiple Periods
30

Use inventory turnover and days’
sales in inventory to evaluate business
performance(liquidity)
6-31
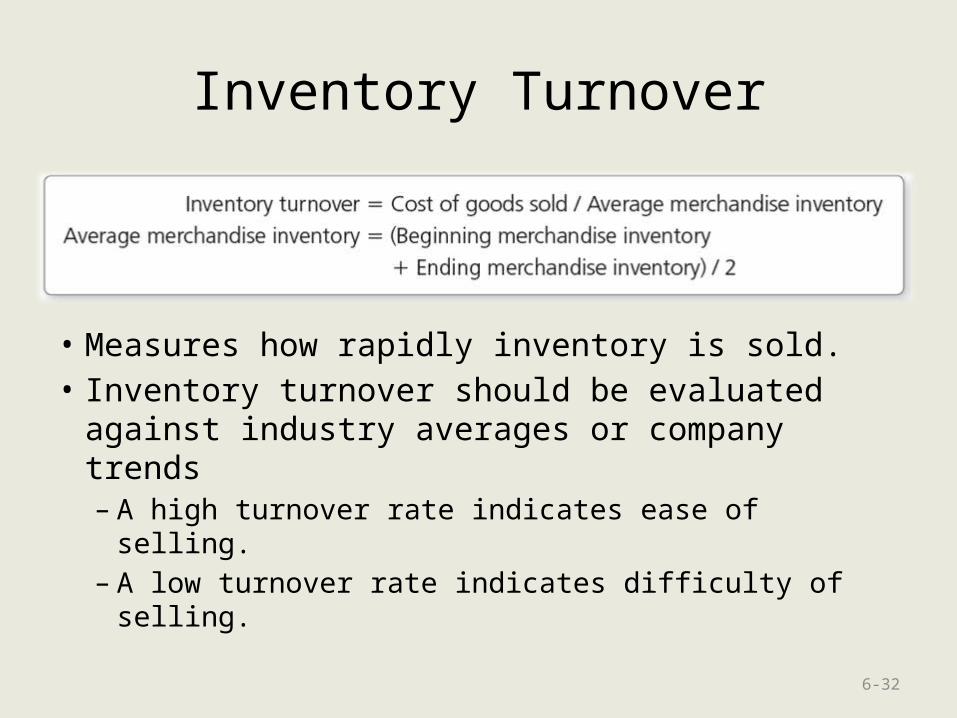
Inventory Turnover
• Measures how rapidly inventory is sold.• Inventory turnover should be evaluated
against industry averages or company trends– A high turnover rate indicates ease of selling.– A low turnover rate indicates difficulty of selling.
6-32
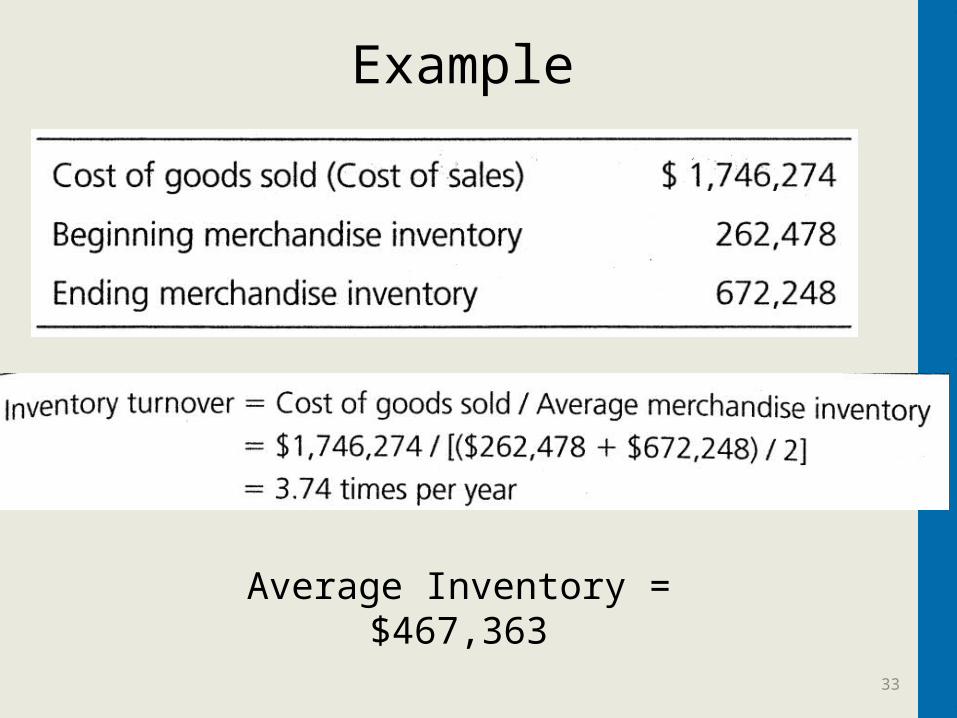
Example
33
Average Inventory = $467,363
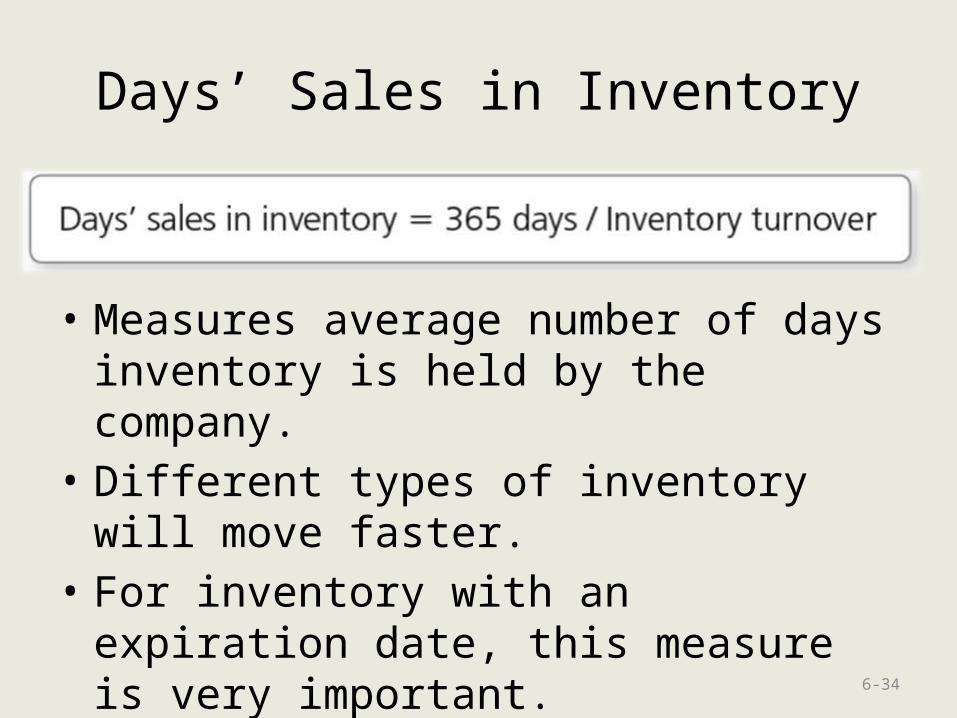
Days’ Sales in Inventory
• Measures average number of days inventory is held by the company.
• Different types of inventory will move faster.
• For inventory with an expiration date, this measure is very important.
6-34
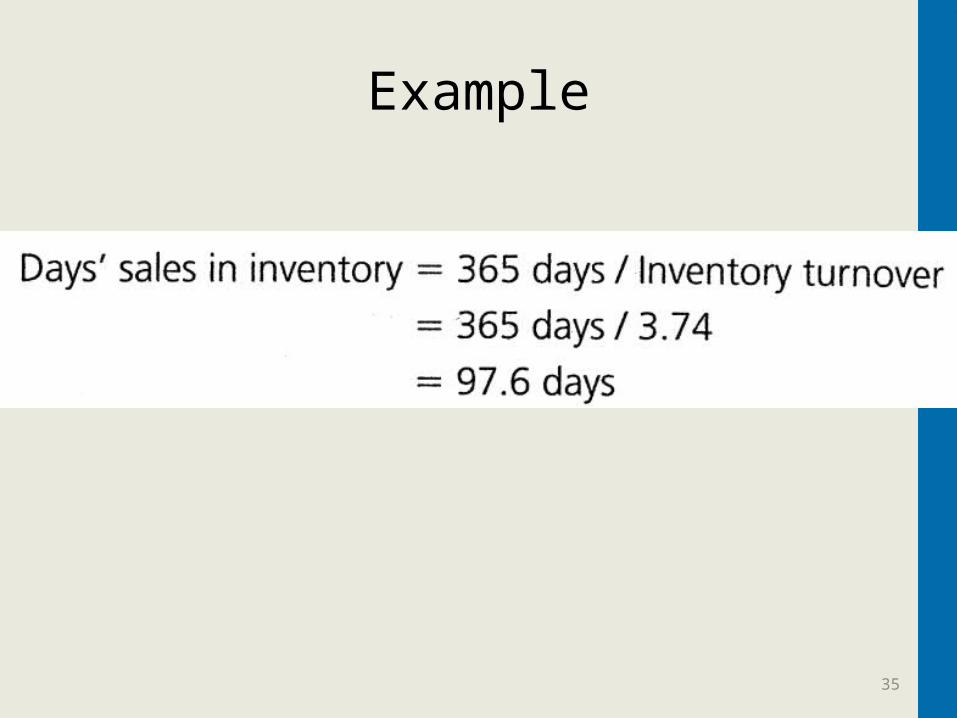
Example
35
Gross profit method and the retail method
(Appendix 6B)
6-36
Inventory Estimation methods

Gross Profit Method
• If the ending inventory cannot be counted, it can be estimated.
• Cost of Goods Sold can be estimated using Sales Revenue and the Gross Profit percent.
• Not acceptable for Financial reporting• Used for interim reporting or casualty loss
estimates 6-37
Beginning Inventory + Net Purchases
=Cost of Goods Available for Sale
- Cost of Goods Sold = Ending Inventory
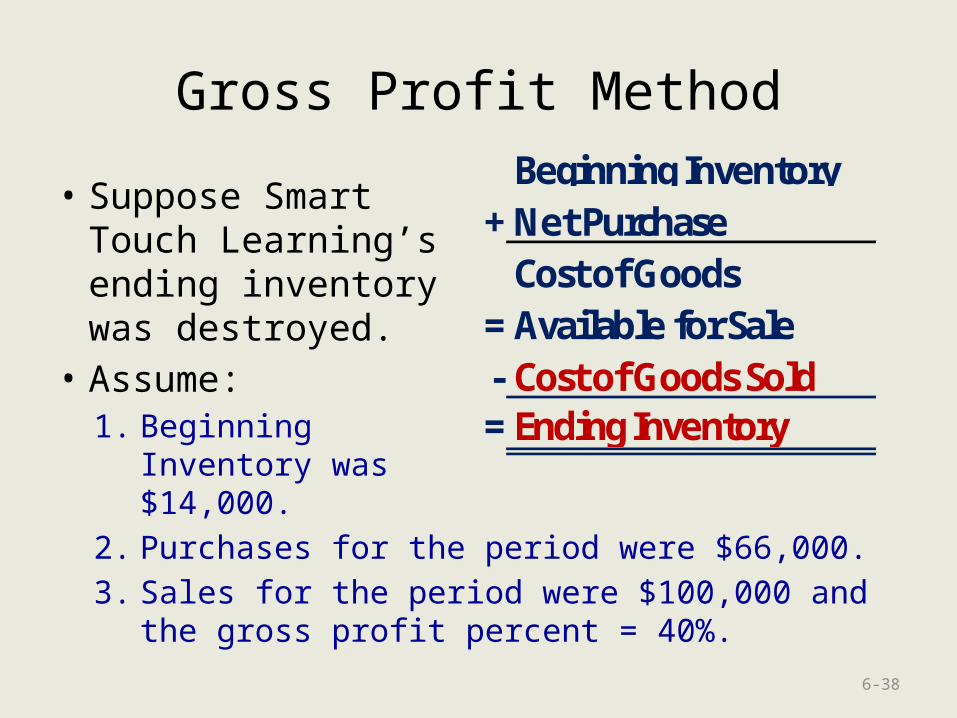
Gross Profit Method
• Suppose Smart Touch Learning’s ending inventory was destroyed.
• Assume:1. Beginning
Inventory was $14,000.
2. Purchases for the period were $66,000.
3. Sales for the period were $100,000 and the gross profit percent = 40%.
6-38
Beginning Inventory + Net Purchase
=Cost of Goods Available for Sale
- Cost of Goods Sold = Ending Inventory

Gross Profit Method
• To estimate Cost of Goods Sold, subtract the normal gross profit from sales.
• $100,000 – $40,000 = $60,000• This will allow you to estimate Ending
Inventory.
6-39
Beg. Inv. $14,000 + Purchases $66,000 = COGA $80,000 - COGS $60,000 = End. Inv. $20,000
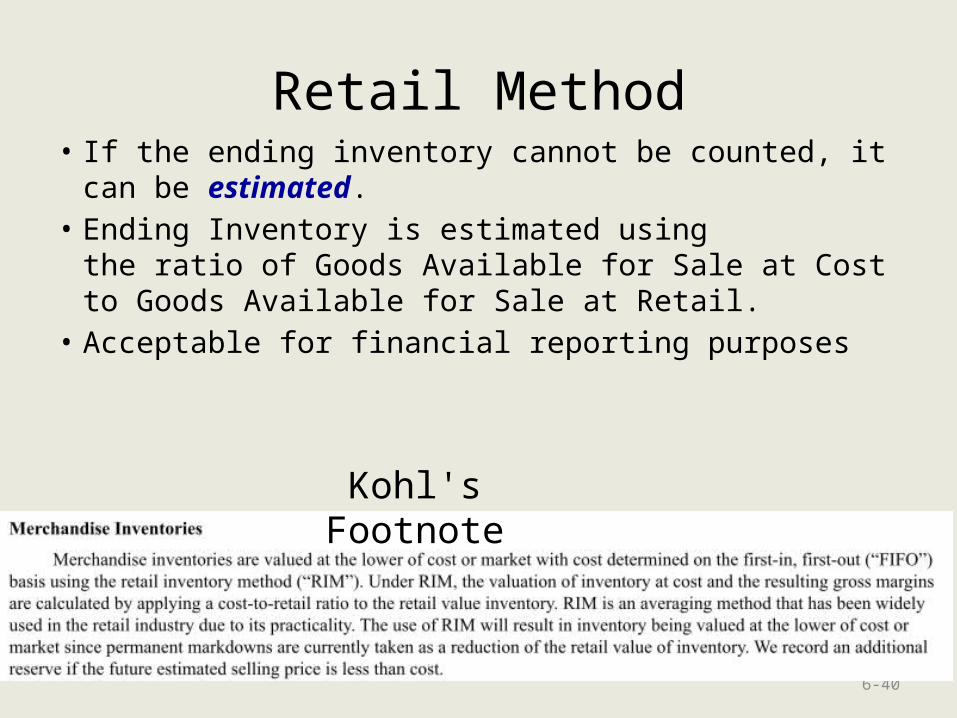
Retail Method• If the ending inventory cannot be counted, it can
be estimated.• Ending Inventory is estimated using
the ratio of Goods Available for Sale at Cost to Goods Available for Sale at Retail.
• Acceptable for financial reporting purposes
6-40
Kohl's Footnote
Related Documents