MEPA Quantitative Tools “Taking advantage of numbers for effective decision-making”

MEPA Quantitative Tools “Taking advantage of numbers for effective decision-making”
Dec 21, 2015
Welcome message from author
This document is posted to help you gain knowledge. Please leave a comment to let me know what you think about it! Share it to your friends and learn new things together.
Transcript
MEPA Quantitative Tools
“Taking advantage of numbers for effective decision-making”
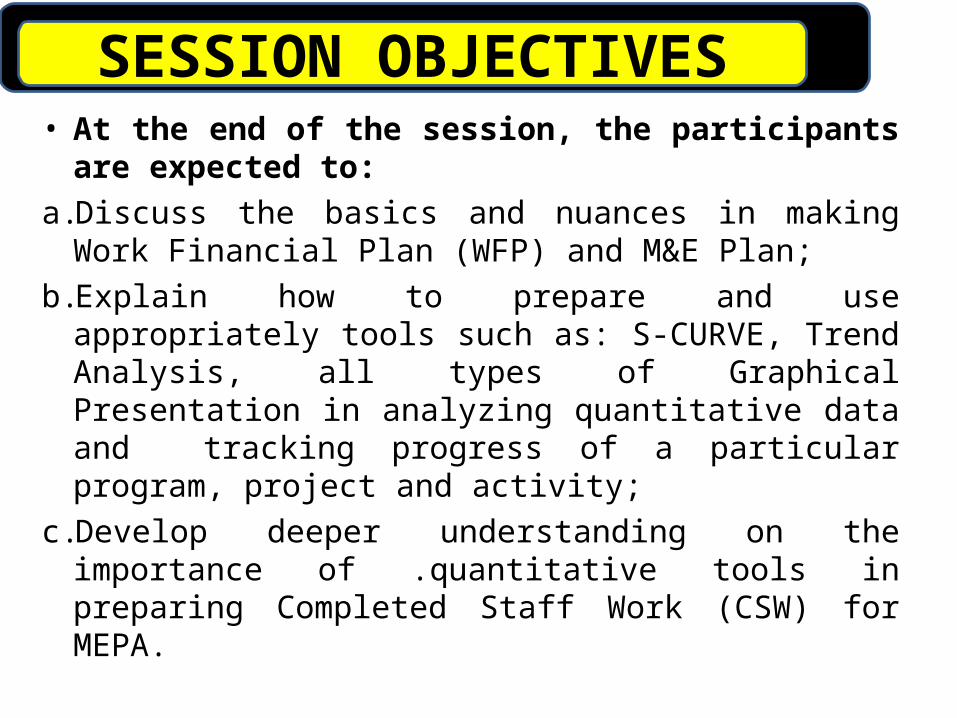
SESSION OBJECTIVES• At the end of the session, the
participants are expected to:a.Discuss the basics and nuances in making
Work Financial Plan (WFP) and M&E Plan;b.Explain how to prepare and use
appropriately tools such as: S-CURVE, Trend Analysis, all types of Graphical Presentation in analyzing quantitative data and tracking progress of a particular program, project and activity;
c.Develop deeper understanding on the importance of .quantitative tools in preparing Completed Staff Work (CSW) for MEPA.
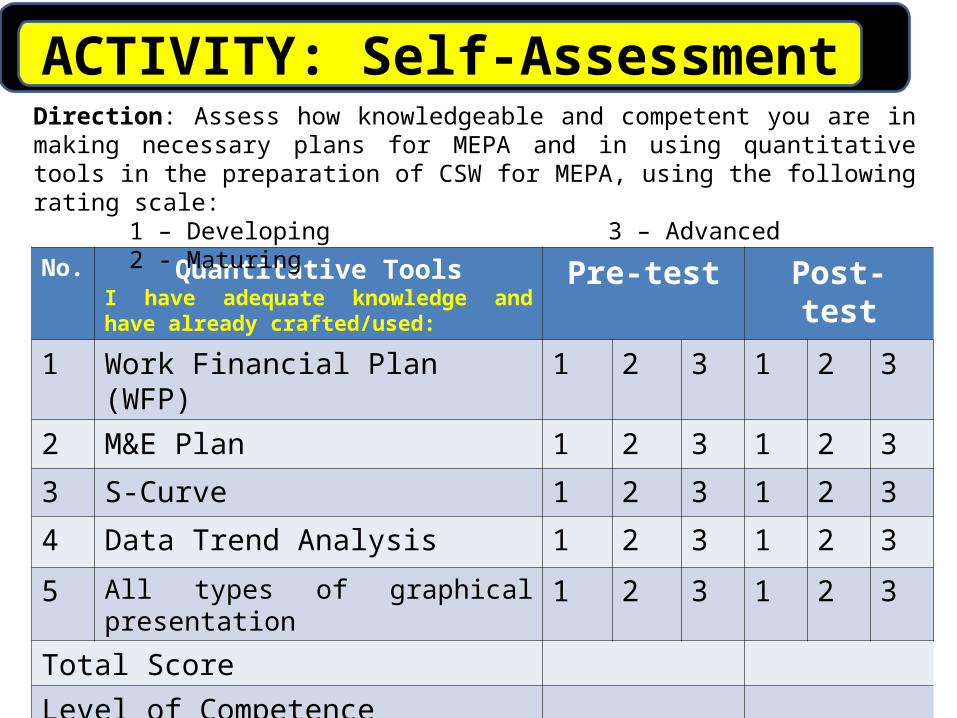
ACTIVITY: Self-Assessment
No.
Quantitative ToolsI have adequate knowledge and have already crafted/used:
Pre-test Post-test
1 Work Financial Plan (WFP) 1 2 3 1 2 3
2 M&E Plan 1 2 3 1 2 3
3 S-Curve 1 2 3 1 2 3
4 Data Trend Analysis 1 2 3 1 2 3
5 All types of graphical presentation
1 2 3 1 2 3
Total Score
Level of Competence
Direction: Assess how knowledgeable and competent you are in making necessary plans for MEPA and in using quantitative tools in the preparation of CSW for MEPA, using the following rating scale:
1 – Developing 3 – Advanced2 - Maturing
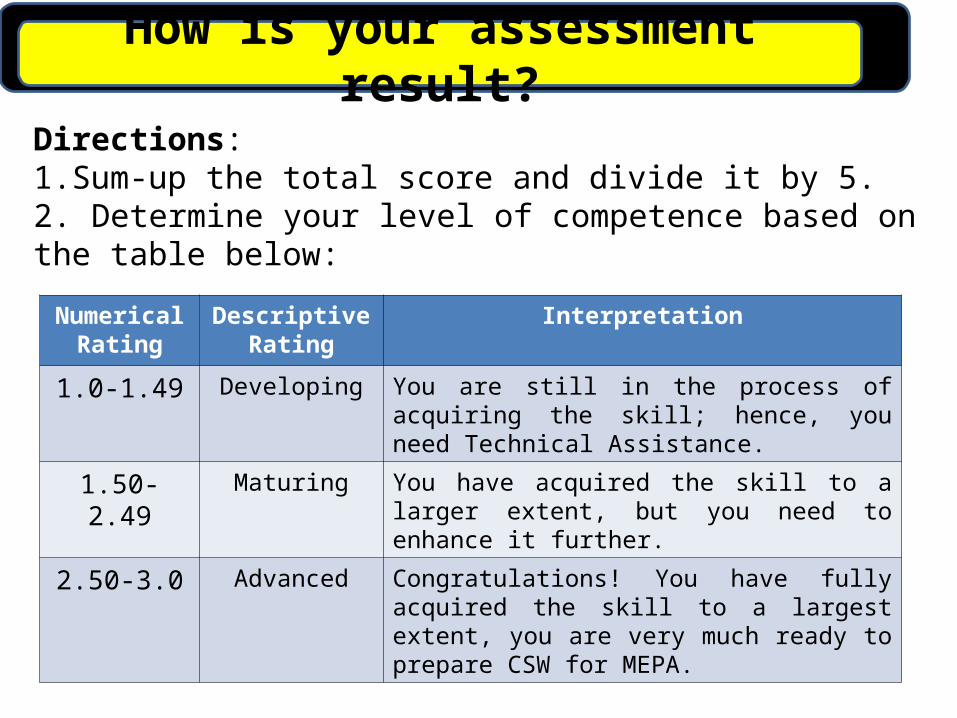
How is your assessment result?
Directions: 1.Sum-up the total score and divide it by 5.2. Determine your level of competence based on the table below:
NumericalRating
Descriptive Rating
Interpretation
1.0-1.49 Developing You are still in the process of acquiring the skill; hence, you need Technical Assistance.
1.50-2.49 Maturing You have acquired the skill to a larger extent, but you need to enhance it further.
2.50-3.0 Advanced Congratulations! You have fully acquired the skill to a largest extent, you are very much ready to prepare CSW for MEPA.
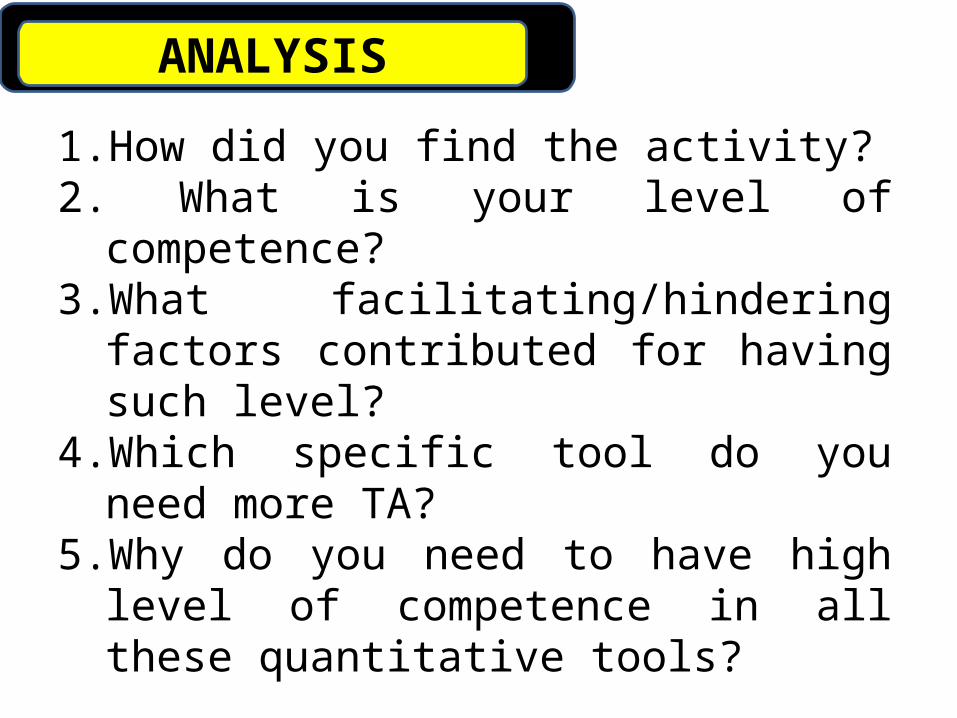
ANALYSIS
1. How did you find the activity?2. What is your level of competence?3. What facilitating/hindering factors
contributed for having such level?4. Which specific tool do you need
more TA?5. Why do you need to have high level
of competence in all these quantitative tools?
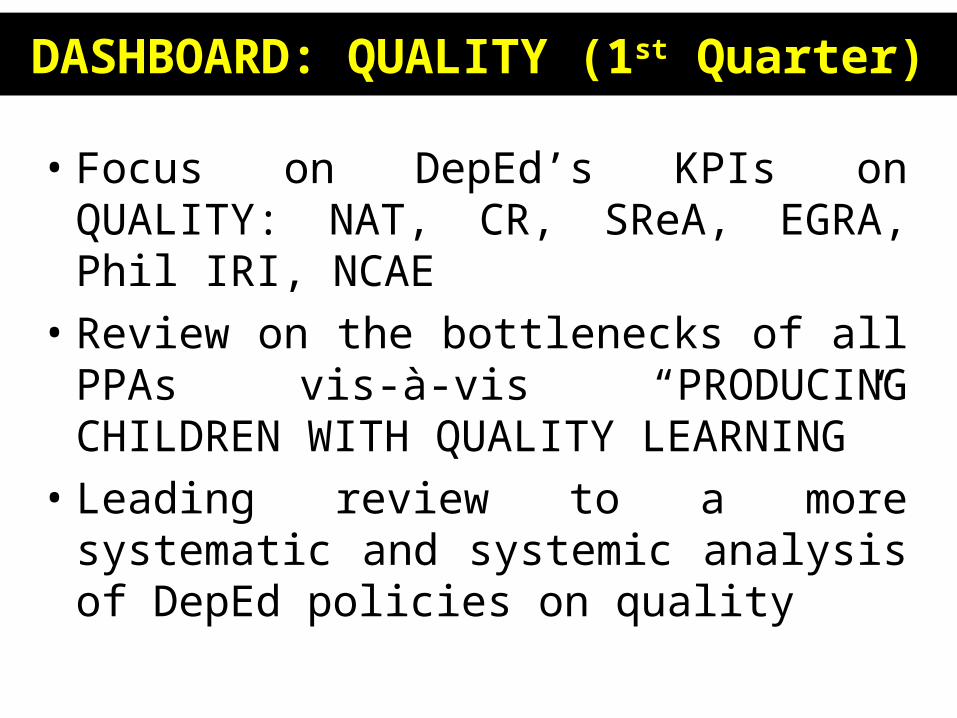
DASHBOARD: QUALITY (1st Quarter)
• Focus on DepEd’s KPIs on QUALITY: NAT, CR, SReA, EGRA, Phil IRI, NCAE
• Review on the bottlenecks of all PPAs vis-à-vis “PRODUCING CHILDREN WITH QUALITY LEARNING”
• Leading review to a more systematic and systemic analysis of DepEd policies on quality
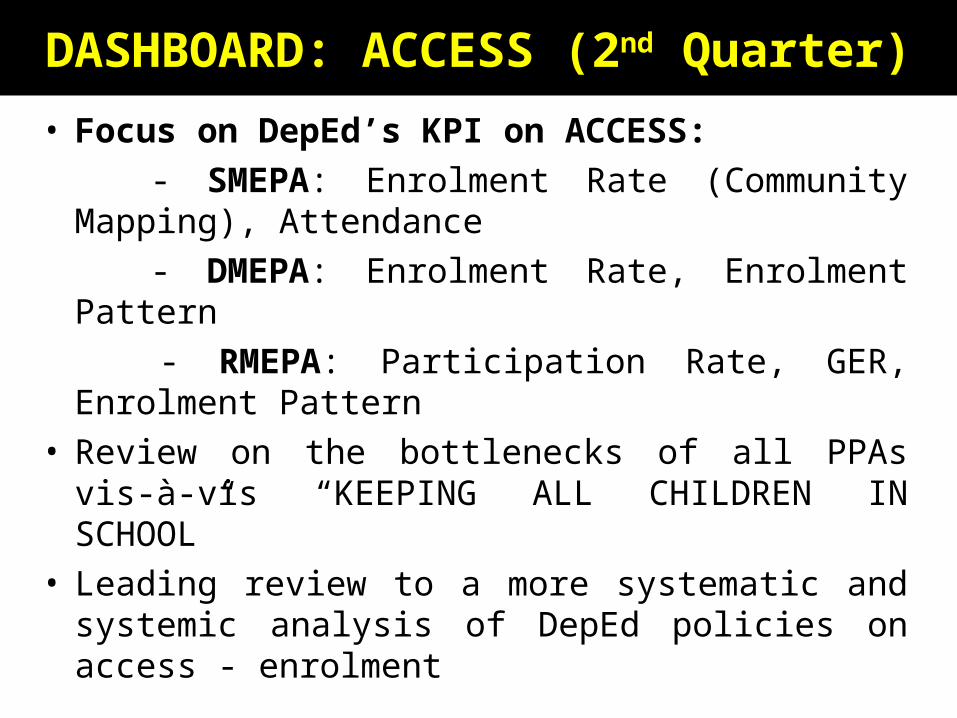
DASHBOARD: ACCESS (2nd Quarter)
• Focus on DepEd’s KPI on ACCESS: - SMEPA: Enrolment Rate (Community
Mapping), Attendance - DMEPA: Enrolment Rate, Enrolment
Pattern - RMEPA: Participation Rate, GER,
Enrolment Pattern• Review on the bottlenecks of all PPAs vis-à-
vis “KEEPING ALL CHILDREN IN SCHOOL”• Leading review to a more systematic and
systemic analysis of DepEd policies on access - enrolment
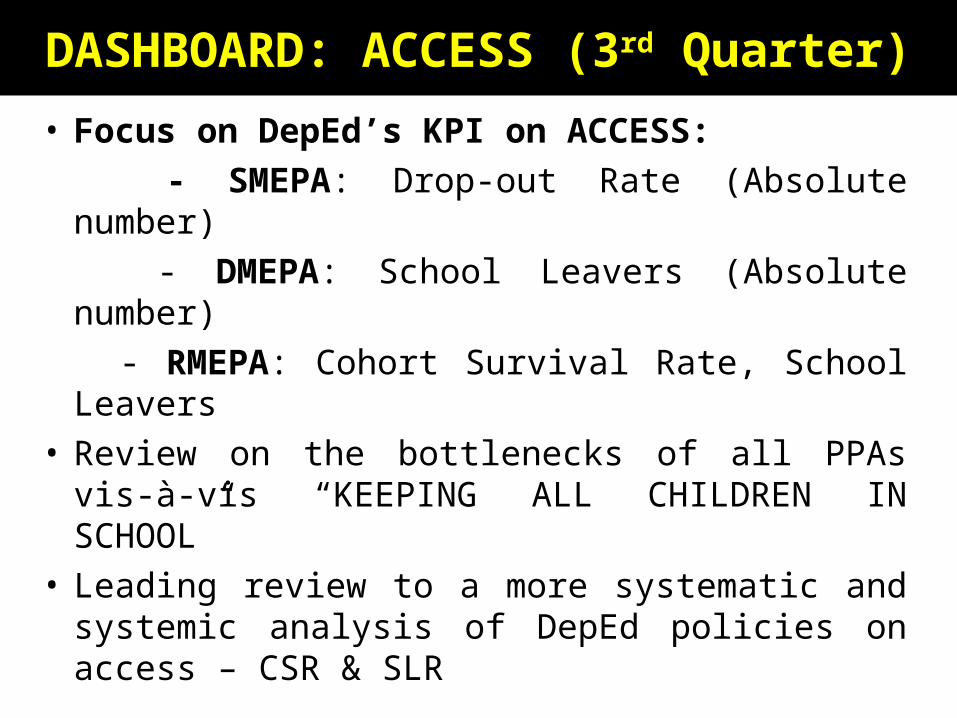
DASHBOARD: ACCESS (3rd Quarter)
• Focus on DepEd’s KPI on ACCESS: - SMEPA: Drop-out Rate (Absolute number) - DMEPA: School Leavers (Absolute number) - RMEPA: Cohort Survival Rate, School
Leavers• Review on the bottlenecks of all PPAs vis-à-
vis “KEEPING ALL CHILDREN IN SCHOOL”• Leading review to a more systematic and
systemic analysis of DepEd policies on access – CSR & SLR
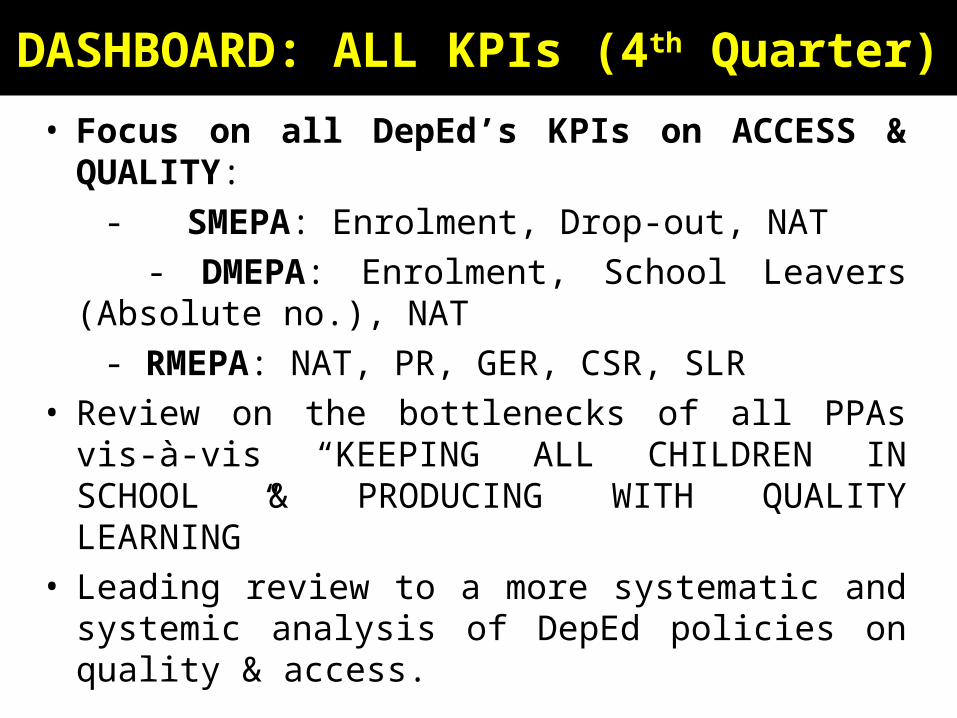
DASHBOARD: ALL KPIs (4th Quarter)
• Focus on all DepEd’s KPIs on ACCESS & QUALITY:
- SMEPA: Enrolment, Drop-out, NAT - DMEPA: Enrolment, School Leavers
(Absolute no.), NAT - RMEPA: NAT, PR, GER, CSR, SLR• Review on the bottlenecks of all PPAs vis-à-
vis “KEEPING ALL CHILDREN IN SCHOOL & PRODUCING WITH QUALITY LEARNING”
• Leading review to a more systematic and systemic analysis of DepEd policies on quality & access.
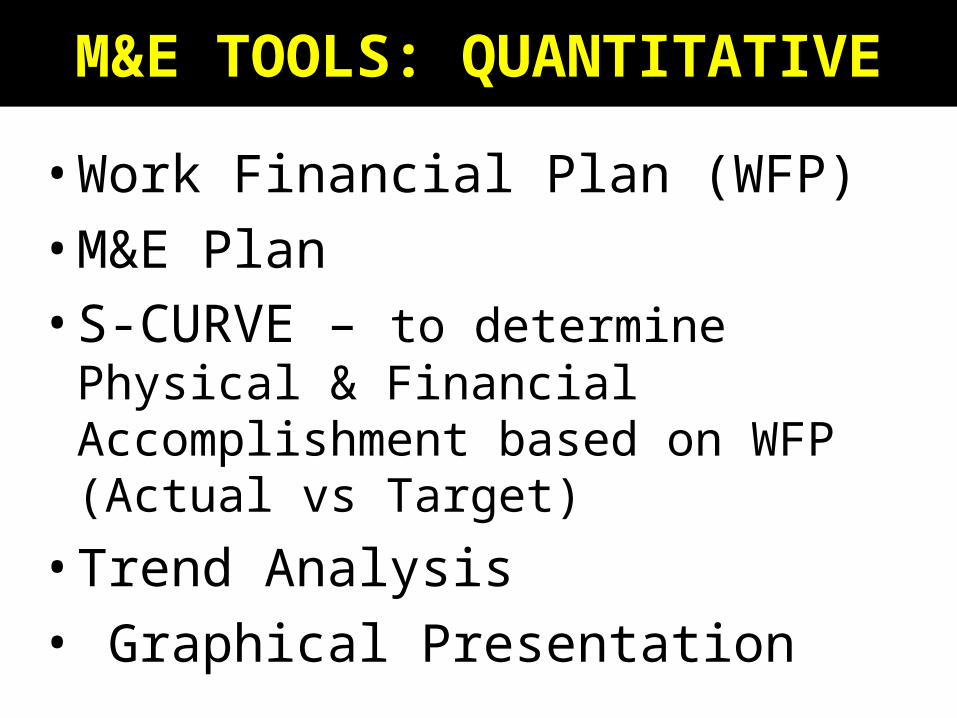
M&E TOOLS: QUANTITATIVE
• Work Financial Plan (WFP) • M&E Plan • S-CURVE – to determine Physical
& Financial Accomplishment based on WFP (Actual vs Target)
• Trend Analysis• Graphical Presentation
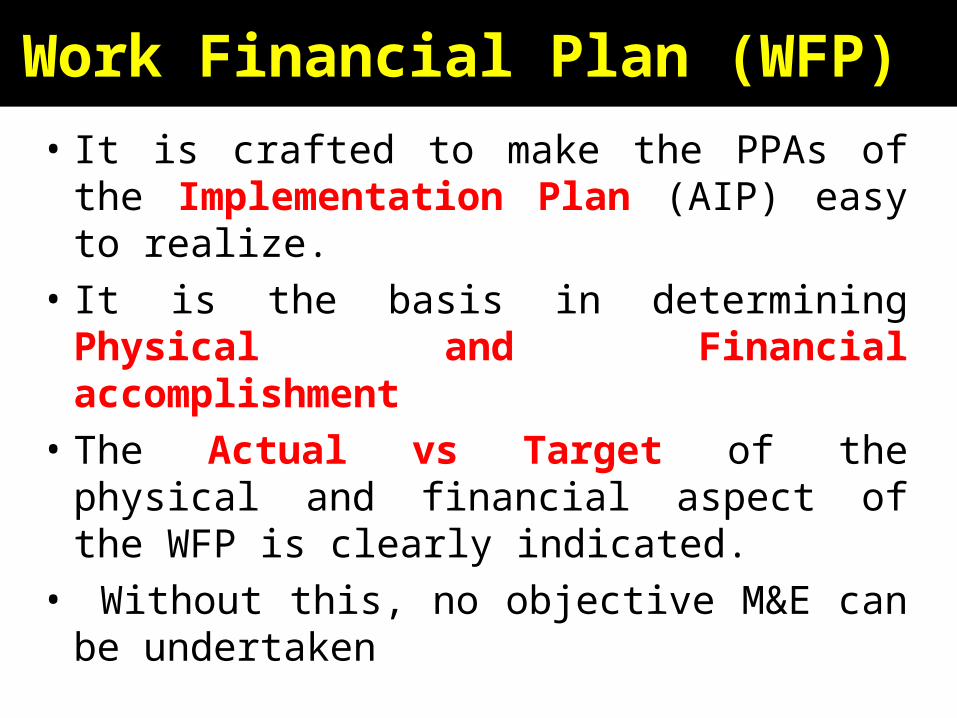
Work Financial Plan (WFP)
• It is crafted to make the PPAs of the Implementation Plan (AIP) easy to realize.
• It is the basis in determining Physical and Financial accomplishment
• The Actual vs Target of the physical and financial aspect of the WFP is clearly indicated.
• Without this, no objective M&E can be undertaken
M&E Plan
• It is based on the WFP.• The M&E Plan is based both
from the Physical and Financial Target
• The S-Curve is determined both from the Physical and Financial Target
S-CURVE
• It is the graphical presentation of the status of the implementation of the Physical and Financial Target
• It can be determined by getting the difference between Actual and Target
• This tool can provide the Physical and Financial Accomplishment of the implementation of the WFP
Trend Analysis - % of Increase/Decrease
• A Technique used to determine whether the KPIs is increasing, decreasing or fluctuating
• Percentage of Increase is used.• Through this, decision-maker can
be able to spot which KPI can be the focused of priority in terms of providing strategic directions
GRAPHICAL PRESENTATION
• Effective tool to present the trend of the KPIs for the last three or five years.• Varied types can be used: Bar
Graph, Line Graph, Picto Graph, Pie Graph• Each type of graph serves a
specific purpose
APPLICATION1. Perform any of the following:
• S-CURVE of your Physical and Financial Accomplishment
• Graph of the trend of your KPIs for the last three years
2. Make a simple analysis of your graph.
Related Documents