RESEARCH ARTICLE Mental images across the adult lifespan: a behavioural and fMRI investigation of motor execution and motor imagery L. Zapparoli • P. Invernizzi • M. Gandola • M. Verardi • M. Berlingeri • M. Sberna • A. De Santis • A. Zerbi • G. Banfi • G. Bottini • E. Paulesu Received: 12 March 2012 / Accepted: 29 October 2012 Ó Springer-Verlag Berlin Heidelberg 2012 Abstract Motor imagery (M.I.) is a mental state in which real movements are evoked without overt actions. There is some behavioural evidence that M.I. declines with ageing. The neurofunctional correlates of these changes have been investigated only in two studies, but none of the these studies has measured explicit correlations between behavioural variables and the brain response, nor the correlation of M.I. and motor execution (M.E.) of the same acts in ageing. In this paper, we report a behavioural and functional magnetic res- onance imaging (fMRI) experiment that aimed to address this issue. Twenty-four young subjects (27 ± 5.6 years) and twenty-four elderly subjects (60 ± 4.6 years) performed two block-design fMRI tasks requiring actual movement (M.E.) or the mental rehearsal (M.I.) of finger movements. Partici- pants also underwent a behavioural mental chronometry test in which the temporal correlations between M.I. and M.E. were measured. We found significant neurofunctional and behavioural differences between the elderly subjects and the young subjects during the M.E. and the M.I. tasks: for the M.E. task, the elderly subjects showed increased activation in frontal and prefrontal (pre-SMA) cortices as if M.E. had become more cognitively demanding; during the M.I. task, the elderly over-recruited occipito-temporo-parietal areas, suggesting that they may also use a visual imagery strategy. We also found between-group behavioural differences in the mental chronometry task: M.I. and M.E. were highly corre- lated in the young participants but not in the elderly partici- pants. The temporal discrepancy between M.I. and M.E. in the elderly subjects correlated with the brain regions that showed increased activation in the occipital lobe in the fMRI. The same index was correlated with the premotor regions in the younger subjects. These observations show that healthy elderly individuals have decreased or qualitatively different M.I. compared to younger subjects. Keywords Motor execution Á Motor imagery Á Ageing Á fMRI Abbreviations BOLD Blood oxygen level dependent FWE Family-wise error fMRI Functional magnetic resonance imaging M.E. Motor execution MEP Motor-evoked potentials M.I. Motor imagery This work was presented at the 30th European Workshop on Cognitive Neuropsychology (Bressanone, Italy, January 2012). L. Zapparoli and P. Invernizzi contributed equally to the authorship of this paper. L. Zapparoli Á P. Invernizzi Á M. Verardi Á M. Berlingeri Á E. Paulesu (&) Department of Psychology, University of Milano-Bicocca, Piazza dell’Ateneo Nuovo, 20126 Milan, Italy e-mail: [email protected] M. Gandola Á G. Bottini Department of Humanistic Studies, University of Pavia, Pavia, Italy M. Sberna Neuroradiology Department, Niguarda Ca’ Granda Hospital, Milan, Italy A. De Santis Á A. Zerbi Á G. Banfi Á E. Paulesu IRCCS Galeazzi, Milan, Italy A. De Santis Á G. Banfi University of Milano Statale, Milan, Italy G. Bottini Cognitive Neuropsychology Center, Niguarda Ca’ Granda Hospital, Milan, Italy 123 Exp Brain Res DOI 10.1007/s00221-012-3331-1

Welcome message from author
This document is posted to help you gain knowledge. Please leave a comment to let me know what you think about it! Share it to your friends and learn new things together.
Transcript
RESEARCH ARTICLE
Mental images across the adult lifespan: a behavioural and fMRIinvestigation of motor execution and motor imagery
L. Zapparoli • P. Invernizzi • M. Gandola • M. Verardi •
M. Berlingeri • M. Sberna • A. De Santis • A. Zerbi •
G. Banfi • G. Bottini • E. Paulesu
Received: 12 March 2012 / Accepted: 29 October 2012
� Springer-Verlag Berlin Heidelberg 2012
Abstract Motor imagery (M.I.) is a mental state in which
real movements are evoked without overt actions. There is
some behavioural evidence that M.I. declines with ageing.
The neurofunctional correlates of these changes have been
investigated only in two studies, but none of the these studies
has measured explicit correlations between behavioural
variables and the brain response, nor the correlation of M.I.
and motor execution (M.E.) of the same acts in ageing. In this
paper, we report a behavioural and functional magnetic res-
onance imaging (fMRI) experiment that aimed to address this
issue. Twenty-four young subjects (27 ± 5.6 years) and
twenty-four elderly subjects (60 ± 4.6 years) performed two
block-design fMRI tasks requiring actual movement (M.E.)
or the mental rehearsal (M.I.) of finger movements. Partici-
pants also underwent a behavioural mental chronometry test
in which the temporal correlations between M.I. and M.E.
were measured. We found significant neurofunctional and
behavioural differences between the elderly subjects and the
young subjects during the M.E. and the M.I. tasks: for the
M.E. task, the elderly subjects showed increased activation in
frontal and prefrontal (pre-SMA) cortices as if M.E. had
become more cognitively demanding; during the M.I. task,
the elderly over-recruited occipito-temporo-parietal areas,
suggesting that they may also use a visual imagery strategy.
We also found between-group behavioural differences in the
mental chronometry task: M.I. and M.E. were highly corre-
lated in the young participants but not in the elderly partici-
pants. The temporal discrepancy between M.I. and M.E. in
the elderly subjects correlated with the brain regions that
showed increased activation in the occipital lobe in the fMRI.
The same index was correlated with the premotor regions in
the younger subjects. These observations show that healthy
elderly individuals have decreased or qualitatively different
M.I. compared to younger subjects.
Keywords Motor execution � Motor imagery � Ageing �fMRI
Abbreviations
BOLD Blood oxygen level dependent
FWE Family-wise error
fMRI Functional magnetic resonance imaging
M.E. Motor execution
MEP Motor-evoked potentials
M.I. Motor imagery
This work was presented at the 30th European Workshop on
Cognitive Neuropsychology (Bressanone, Italy, January 2012).
L. Zapparoli and P. Invernizzi contributed equally to the authorship of
this paper.
L. Zapparoli � P. Invernizzi � M. Verardi � M. Berlingeri �E. Paulesu (&)
Department of Psychology, University of Milano-Bicocca,
Piazza dell’Ateneo Nuovo, 20126 Milan, Italy
e-mail: [email protected]
M. Gandola � G. Bottini
Department of Humanistic Studies, University of Pavia,
Pavia, Italy
M. Sberna
Neuroradiology Department, Niguarda Ca’ Granda Hospital,
Milan, Italy
A. De Santis � A. Zerbi � G. Banfi � E. Paulesu
IRCCS Galeazzi, Milan, Italy
A. De Santis � G. Banfi
University of Milano Statale, Milan, Italy
G. Bottini
Cognitive Neuropsychology Center, Niguarda Ca’ Granda
Hospital, Milan, Italy
123
Exp Brain Res
DOI 10.1007/s00221-012-3331-1
MRI Magnetic resonance imaging
SD Standard deviation
SMA Supplementary motor area
TMS Transcranial magnetic stimulation
rTMS Repetitive transcranial magnetic stimulation
Introduction
Motor imagery (M.I.) can be defined as a mental state in which
real movements are evoked without an overt action (Jeann-
erod and Frak 1999). The simulation theory proposed by
Jeannerod (2001) postulates a functional equivalence between
this cognitive process and the execution of real movements,
arguing that imagined actions are actually actions, except for
the fact that they are not executed. Several studies have con-
firmed the existence of neurocognitive similarities between
M.I. and motor execution (M.E.; Decety et al. 1989; Geor-
gopoulos and Massey 1987; Gerardin et al. 2000; Hanakawa
et al. 2003; Jeannerod and Frak 1999; Sirigu et al. 1996).
Interestingly, the mental simulations involved in M.I. can be
conducted without noticeable electromyographic activity
(see, for example, Personnier et al. 2010a), suggesting that
individuals are able to mentally rehearse covert actions with a
minimal outflow of motor commands to the second motor
neuron. Behavioural studies have also shown that the physical
performance and the mental performance of the same action
are generally temporally correlated (see Guillot and Collet
2005 for a review). For example, Decety et al. (1989) com-
pared the time taken by subjects to walk either physically or
mentally to targets located at different distances. They found
that subjects took the same time in the M.E. and in the M.I.
condition with a similar increase in the actual or imagined
walking time with target distance. However, they also made
the very interesting observation that the M.I. time for the
action of walking with a 25-kg weight increased to a larger
extent than the actual execution of the same action (Decety
et al. 1989). Similar observations have been replicated several
times for a variety of tasks. This difficulty effect conforms to
Fitts’ law for both executed and imagined movements (Decety
and Jeannerod 1995; Sirigu et al. 1996; Stevens 2005). These
findings suggest that M.I. and M.E. may depend on partially
overlapping neural systems, a hypothesis supported by several
functional imaging studies on overt and imagined movements.
This shared neural network includes the dorsal premotor
cortex, the supplementary motor area (SMA), the ventral
lateral premotor cortex, the cortex of the intraparietal sulcus
and the supramarginal gyrus (Decety 1996; Gerardin et al.
2000; Hanakawa et al. 2003; Jeannerod and Frak 1999; Mattay
et al. 2002; Stephan et al. 1995).
Differences between M.I. and M.E. activation patterns
have also been recorded. The posterior superior parietal
cortex (Stephan et al. 1995) and a zone anterior to the
lateral premotor cortex and to the SMA (pre-SMA) are the
cortical areas that were more active in M.I. than during
M.E. (Deiber et al. 1998; Gerardin et al. 2000; Lafleur et al.
2002). The cortical areas that were more active during
movement than during imagery were located in the motor
cortex proper, in the posterior part of the lateral premotor
cortex (Stephan et al. 1995), in the posterior part of the
SMA, in the parieto-temporal operculum and in the anterior
parietal cortex (de Lange et al. 2005).
The relevance of M.I. has been increasingly recognised
in cognitive and clinical neuroscience. M.I. tasks, com-
bined with functional imaging experiments, are used to
infer the conscious perception of environmental stimuli in
patients in apparent vegetative states in clinical environ-
ments (Owen et al. 2006), in locked-in patients (Conson
et al. 2008) or in patients with severe deficits in the outflow
of central motor commands (Lule et al. 2007). Further-
more, M.I. tasks are among the tasks used to operate
devices that utilise brain–machine interfaces (Phothisono-
thai and Nakagawa 2009). In less dramatic settings, M.I.
tasks are also used as a form of mental training by athletes
(Pascual-Leone et al. 1995; Vogt 1995; Yue and Cole
1992) or within rehabilitation programs for patients with
neurological or orthopaedic problems (Lotze and Cohen
2006). The beneficial effect of these strategies on motor
performance has been documented increasingly often over
time (Dickstein and Deutsch 2007; Mulder 2007).
Only a few studies have investigated age-related chan-
ges in M.I. skills, and as yet, only one study has docu-
mented neural correlates of these changes. Some studies
have combined transcranial magnetic stimulation (TMS)
with measurements of motor-evoked potentials (MEP) and
determined that the ability to produce corticomotor facili-
tation in association with a M.I. task is largely preserved
with ageing (Hovington and Brouwer 2010), even though
the facilitations may be less muscle selective in the elderly
(Leonard and Tremblay 2007). On the other hand, behav-
ioural experiments have shown that declining M.I. ability is
associated with normal ageing (Mulder et al. 2007; Per-
sonnier et al. 2010a; Personnier et al. 2010b; Personnier
et al. 2008; Saimpont et al. 2009; Skoura et al. 2005;
Skoura et al. 2008). For example, in implicit1 M.I. tasks,
1 M.I. tasks can be explicit or implicit: in a typical implicit M.I. task,
subjects are asked to judge whether a tool is oriented conveniently for
being grasped with the right or with the left hand; it is assumed that a
mental motor simulation process is used to solve the task. Another
example of an implicit M.I. task is the hand laterality judgement task:
subjects are asked to judge whether a picture depicts a left rather than
a right hand; once debriefed, subjects typically report to have
imagined their own hand at the orientation of the visual stimulus. On
the other hand, in actual motor tasks, like the one adopted here,
subjects are invited to mentally rehearse motor acts as if they were
performing them but avoiding overt motor production.
Exp Brain Res
123
such as tasks involving judgment of hand laterality, M.I.
durations were slower among the elderly subjects,
especially for trials involving the non-dominant hand
(Saimpont et al. 2009). Other studies reported a stronger
correlation between the real execution of movements and
M.I. in healthy young subjects compared to older ones
(Skoura et al. 2008). Notwithstanding, Malouin et al.
(2010) found that the vividness of M.I. is not affected by
ageing; they also found a change in the quality of M.I.
among the elderly subjects: with ageing there is a reduction
in the dominance of the visual M.I. that results in an
equivalence with the kinaesthetic imagery modality. The
authors suggested that this effect could be due to a decline
in visuospatial and kinesthetic working memory associated
with ageing.
This is not the only possible interpretation of the reasons
for the deterioration of M.I. with ageing; it has also been
suggested that this decline might occur because sensory
information from the periphery is not as efficiently available
to the motor system during M.I. as it is during the actual
execution of movements. This lack of sensory information
might prevent the elderly subjects from verifying whether
the imagined movements are similar to the actual ones
(Saimpont et al. 2009; Skoura et al. 2008; Zwergal et al.
2012). Finally, another possible explanation is that feed-
forward simulations of motor acts become less effective
with ageing (Personnier et al. 2008). These hypotheses will
be further addressed in the discussion section of this paper.
There is a rich body of literature documenting age-
related patterns of brain activity associated with the
changes in cognitive function that are typical of normal
ageing (Park and Reuter-Lorenz 2009). Motor functions are
no exception; neuroimaging studies have revealed that
elderly subjects exhibit different brain activation patterns
while making simple finger movements (Calautti et al.
2001; Hutchinson et al. 2002; Mattay et al. 2002), hand
movements (Ward and Frackowiak 2003) or more complex
interlimb coordination tasks (Heuninckx et al. 2005).
Only two imaging studies have addressed M.I. and
changes in ageing. One study (Nedelko et al. 2010) docu-
mented that the level of activation in the regions relevant
for the mirror system (Rizzolatti and Craighero 2004), the
ventral premotor and the inferior parietal cortex, was
preserved when elderly subjects imagined movements
previously seen in a video. Hyperactivation among the
elderly participants was interpreted as indicative of com-
pensatory activity for the age-related decline of neural
structures. On the other hand, the study by Zwergal et al.
(2012) on M.I. for walking, has been interpreted along the
lines of the hypothesis that sensory information from the
periphery is not available as efficiently in the elderly.
Neurofunctional activities increased in the vestibular cor-
tices, in the motion-sensitive visual cortices and in the
somatosensory areas. However, none of the previous
studies has measured explicit correlations between behav-
ioural variables and the brain response, nor the correlation
of M.I. and M.E. of the same acts in ageing.
The present study was designed to study the effects of
ageing on M.I. using both behavioural and fMRI mea-
surements and also to make explicit comparisons with
motor execution of the same task. The subjects completed a
finger opposition motor task and the same task performed
in a kinaesthetic M.I. modality. The tasks were conducted
separately for each hand. Moreover, to explore the corre-
lation between executed and imagined movements and to
compare those correlations across groups, subjects were
also studied using a mental chronometry paradigm outside
of the MRI scanner.
Because they have been seen in other cognitive domains
in graceful ageing (Berlingeri et al. 2010; Buckner 2004;
Grady et al. 1994), we expected to observe quantitatively
or topographically different patterns of activation (i.e., age-
specific activations) in our normal elderly subjects. When
present, these were tentatively interpreted according to the
framework of compensatory processes (see Berlingeri et al.
2010 for further discussion); they can be classified as a
successful compensatory process or as a compensatory
attempt, depending on whether the performance reaches a
juvenile-like level.
Because much is known about the functional properties
of the different cortical areas, and because we also had an
actual motor task to test the ‘‘motoric nature’’ of the M.I.
patterns observed, we expected that a careful scrutiny of
the differences in the patterns of brain activation between
the young and the elderly participants would have helped to
test some of the hypotheses that behavioural studies have
offered related to the qualitative changes in M.I. of the
elderly. To make one extreme example about one of the
possible anticipated scenarios, the complete absence of
motor/premotor activations for M.I. in the elderly might
have brought support to the hypothesis that (forward)
motor simulation becomes less possible, if not impossible,
with ageing (Personnier et al. 2008). As the reader shall
see, a relatively more complex and yet still interpretable
pattern of age-related differences emerged for both the
M.E. and the M.I. task.
Materials and methods
Participants and neuropsychological assessment
The participants included 24 young subjects (12 M/12F;
age: 27 ± 5.6 years) and 24 elderly subjects (11 M/13F;
age: 60 ± 4.6 years). All the participants were right-han-
ded; handedness was determined by using the Edinburgh
Exp Brain Res
123
Handedness Inventory (Oldfield 1971). All the participants
were in good health, with no past medical history for
neurological, psychiatric or cognitive disorders. The sub-
jects participated in the study only after the nature of the
procedure had been fully explained, and they had signed an
informed consent form in compliance with the Declaration
of Helsinki (1964).
All the young subjects were university students; the
education level was balanced across groups (elderly group:
14 ± 3.4 years; young group: 15 ± 2.2 years).
To exclude age-related cognitive deficits, the elderly
subjects also completed a neuropsychological assessment.
The neuropsychological battery included a summary index
of cognitive functioning, the Mini-Mental State Examina-
tion (Folstein et al. 1975) and a series of more specific
neuropsychological tests assessing cognitive functions:
short story recall (Spinnler and Tognoni 1987), delayed
recall of the complex Rey’s figure (Carlesimo et al. 2002),
Corsi’s block test (Orsini et al. 1987), digit span (Wechsler
1945); the Token test for language (Spinnler and Tognoni
1987), phonemic fluency (Novelli et al. 1986), semantic
fluency (Novelli et al. 1986), the Trail Making Test parts A
& B to test executive functions (Giovagnoli et al. 1996),
attentional matrices (Spinnler and Tognoni 1987) and
Raven’s Coloured Progressive Matrices to test abstract
reasoning (Raven 1984). None of the subjects had patho-
logical scores on this battery of tests.
Behavioural task
The aim of this test was to establish the M.I. skills of our
participants and to assess the impact of ageing on these
abilities. We examined the effects of normal ageing on the
temporal correspondence between overt and covert
(imagined) movements with a mental chronometry task.
The behavioural task was performed by all subjects half an
hour after the fMRI scan. There were three classes of
executed or imagined movements: the same finger oppo-
sition task2 used for the fMRI scans; a pronosupination of
the forearm, keeping the hand extended; and a fist-making
movement. Each class of movement included 8 trials for
each limb. Each trial involved a variable number of cycles
(2, 3, 4 or 5 cycles). Each trial (e.g., 4 cycles of the pro-
nosupination of the left forearm) was repeated twice so that
there were 24 trials overall for each upper limb. The entire
protocol was performed separately for each hand. The
order of the tasks and the number of cycles in each trial
were counterbalanced. Half of the subjects started with the
right upper limb. For all conditions, the subjects sat com-
fortably in front of an examination desk. For the finger
opposition task, the basic cycle involved four taps (thumb-
to-index, thumb-to-middle, thumb-to-ring and thumb-to-
little finger) with the forearm lying in a supinated position.
For the pronosupination of the forearm, each subject laid a
forearm on the desk in a half-pronated position (starting
position). For the fist-making movements, the forearm was
placed in a supinated position. The tasks were performed
while the subjects’ eyes were closed. For the M.I. tasks, the
subjects were invited to perform the same tasks performed
during the fMRI scans using a kinaesthetic imagery
modality.
Each trial was triggered by the experimenter, who gave
the ‘‘go-signal’’ to begin the execution/imagination of the
requested movement; the M.E. and M.I. durations were
measured by an electronic stopwatch; in particular, the
duration of the trial was measured from the ‘‘go-signal’’
(given by the experimenter) to the ‘‘stop-signal’’ (self-
reported by the participant). All the subjects were first
trained at the task to reach the require speed (approxi-
mately 1 Hz), by imitating the experimenter who per-
formed the movement at the required speed.
The chronometry tests were available for 36 out of 48
subjects (18 for each group).
For each subject, we calculated the mean duration of the
movements; subsequently, we examined whether the dura-
tion of the overt movements correlated with the duration of
the covert movements.
Statistical analyses of the behavioural data
The M.E. and M.I. durations for the behavioural tasks
performed outside the scanner were analysed as follows:
the differences among the groups and the tasks were first
analysed with a 2 (elderly vs young) 9 3 (finger-opposi-
tion, fist-making, pronosupination) 9 2 (M.E. vs. M.I.) 9
2 (hand) ANOVA. This analysis was followed by three 2
(group) 9 2 (M.E. vs. M.I.) 9 2 (hand) ANOVAs for each
task. A Greenhouse–Geisser correction for non-sphericity
was used when needed. Correlation analyses using the
Pearson coefficient were also performed to assess the
temporal congruence between the motor execution tasks
and the M.I. tasks.
fMRI experiment
MRI scans were performed using a 1.5 T GE Signa scanner or
with a 1.5 Siemens Avanto scanner, equipped with echo-
planar hardware for imaging. The same fMRI parameters
were used for both scanners (for both scanners: flip angle 90�,
TE = 60 ms, TR = 3,000 ms, FOV = 280 9 210 mm and
2 For the finger opposition task, there were minor differences
between the fMRI and the task performed outside the scanner (during
the behavioural task we varied the number of repetitions of the finger
tapping (from 2 to 5 cycle). These were needed in order to collect
meaningful behavioural data outside the scanner while keeping the
subjects sufficiently involved in the task.
Exp Brain Res
123
matrix = 96 9 64 for both scanners). The slice thickness
was 5 mm. All the subjects were also scanned with an MP-
RAGE high-resolution (1 9 1 9 1 mm) T1-weighted vol-
umetric scan for further visualisation of the results. To
control for any scanner effect, there was an equal number of
subjects scanned with the two scanners for each group.
The fMRI experiment consisted of one M.E. task and
one M.I. task. The participants practiced the tasks before
the beginning of the scanning session until they reached
good accuracy (for the M.E. task) and the required speed
(approximately 1 Hz). During the training session, all the
participants performed and imagined each requested
movement for two periods of 30 s each, alternating with
resting periods, to simulate the fMRI experiment. All the
subjects were able to perform the tasks flawlessly (i.e., at
an asymptotic level) after two trials at most, and there were
no differences between the groups in the time taken to learn
the exceedingly simple finger tasks. The subjects kept their
eyes closed for the entire experiment, and they were asked
to concentrate on the task and to perform the task as
accurately as possible.
The subjects performed the following tasks:3
• Cued finger opposition Subjects were asked to alternately
move the right or the left hand. The movements,
performed at a frequency of approximately 1 Hz,
involved touching the thumb to the fingers in sequence:
thumb to index, thumb to middle finger, etc. After a few
practice trials, the subjects were able to perform the
actual motor task accurately at the desired rate. The
subjects were monitored throughout the experiment for
movement precision and speed. The task was self-paced,
but the subjects were loosely cued in that they were given
verbal reminders to perform the task once every 6 s. The
performance of the tasks was alternated with resting state
scans according to a block design. During the rest
baseline control condition, the subjects were instructed to
relax and to think of nothing. As before, the subjects were
loosely cued and received a verbal reminder to remain in
a resting state once every 6 s. Each block was 30 s long
(10 scans in each period). There were 3 motor blocks and
3 rest blocks for each hand in alternating order.
• Cued M.I. of finger opposition The subjects were asked to
imagine the same movements they had performed for the
previous task. The subjects were instructed to avoid overt
motion. The design, as before, involved 30 s alternating
blocks of motor planning/imagery and rest, including the
same verbal cues. The task was self-paced, but the
subjects were loosely cued in that they were given verbal
reminders to perform the task once every 6 s. The
subjects were instructed to imagine movements from a
kinaesthetic perspective, not from a third-person point of
view, and not to count nor to assign numbers to each
finger. The subjects were carefully observed by one of the
experimenters in the scanner room who monitored for
the correct execution of the actual motor tasks and the
presence of spurious motor acts during the M.I. tasks.
The subjects were debriefed after each experimental
session (behavioural or fMRI) about their experiences.
They all confirmed that they had performed the task as
instructed, and there were only some anecdotal com-
plaints by some elderly volunteers that they had had
difficulty refraining from using a visual strategy.
fMRI data acquisition and analysis
For each condition, we collected 158 complete brain
volumes.
Pre-processing
After image reconstruction, raw data visualisation and
conversion from DICOM to the NIFTI format were per-
formed with the software MRIcron (www.mricro.com).
All subsequent data analyses were performed in MAT-
LAB 7.1 (Math Works, Natick, MA, USA), using the
software Statistical Parametric Mapping (SPM8, Wellcome
Department of Imaging Neuroscience, London, UK). First,
fMRI scans were realigned to account for any movement
during the experiment, and then they were stereotactically
normalised into the MNI-EPI fMRI template space to per-
mit group analyses of the data (Ashburner and Friston 1999;
Friston et al. 1995). At this stage, the data matrix was
interpolated to produce voxels with the dimensions
2 9 2 9 2 mm. The stereotactically normalised scans were
smoothed using a Gaussian filter of 10 9 10 9 10 mm to
improve the signal-to-noise ratio.
Statistical analyses
The BOLD signal associated with each experimental con-
dition was analysed by a convolution with a canonical
3 When determining the ideal task for the experiments inside and
outside the MRI scanner, a number of factors were taken into account,
including compatibility with the fMRI environment and the magni-
tude of the cortical representation within the motor and premotor
cortex for the body segment under investigation. We chose the finger
opposition tasks because these tasks have been widely used in
functional neuroimaging experiments (see for a review: Witt et al.
2008) and in M.I. investigations using both behavioural (see for
example Sirigu et al. 1996) and neurofunctional techniques (see for
example Guillot et al. 2009). Based on the same considerations, we
decided not to use some interesting motor behaviours, such as
pointing (Skoura et al. 2008), lifting one arm (Personnier et al. 2008),
or walking (Skoura et al. 2005), despite the potential contribution
these tasks could make to the investigation of M.I. in behavioural
experiments.
Exp Brain Res
123
hemodynamic response function (Worsley and Friston
1995). Global differences in the fMRI signal were removed
from all voxels with proportional scaling. High-pass fil-
tering (128 s) was used to remove artifactual contributions
to the fMRI signal, such as physiological noise from car-
diac and respiratory cycles. First, a fixed-effect block-
design analysis was performed for each subject to charac-
terise the BOLD response associated with each task as
opposed to rest. We created a contrast image for the effect
of M.E. and M.I. for each hand, for each subject of each
group. For example, for the motor execution task, we
created the following contrast images for both groups:
‘‘M.E. with right hand [ rest’’ and ‘‘M.E. with left hand
[ rest’’. To permit generalisation to the population level
using group-based statistical inference, the individual
contrast images generated by the fixed-effect analyses were
entered in second-level ANOVAs conforming to random
effect analyses (Holmes and Friston 1998; Penny and
Holmes 2004). We assessed the following effects:
(a) Across-group effects: regardless of the experimental
group, we first evaluated the commonalities and the
differences between the M.E. task and the M.I. task. The
commonalities were assessed as conjunction effects
(Friston et al. 1999; Worsley and Friston 2000), and the
differences were assessed as direct contrasts;
(b) Within-group effects: the same effects were then
calculated for each group separately;
(c) Between-group differences: activation patterns associ-
ated with M.I. or M.E. were compared across the groups;
(d) Correlation between behavioural indexes and fMRI
patterns: the difference between the time taken to
imagine rather than to perform a movement was used
as a predicting covariate over the fMRI patterns for
the two groups separately. This analysis included the
data from the 36 subjects from whom the post-scan
behavioural data were available.
The results of the statistical comparisons are visualised
at the uncorrected p \ 0.001 threshold. In the tables, we
indicate which statistical effect survived one of the multi-
ple comparisons corrections (family-wise error (FWE))
offered by SPM8 (Worsley et al. 1996), as complementary
information to further explain the data.4
Behavioural results
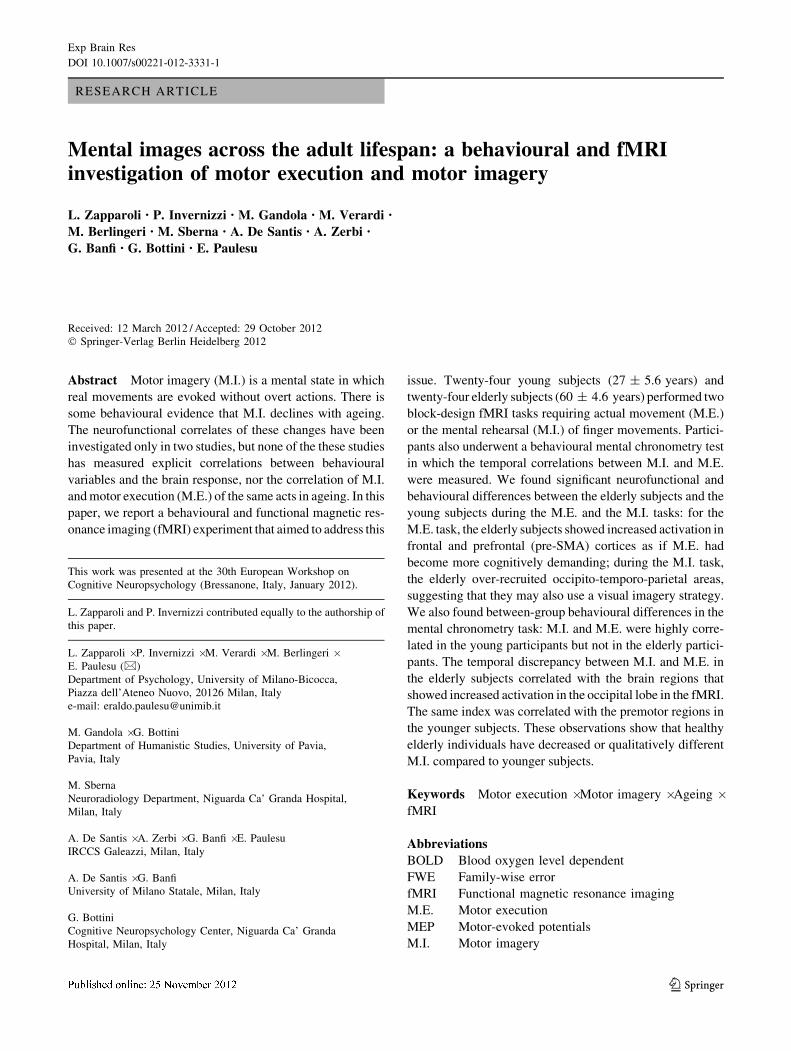
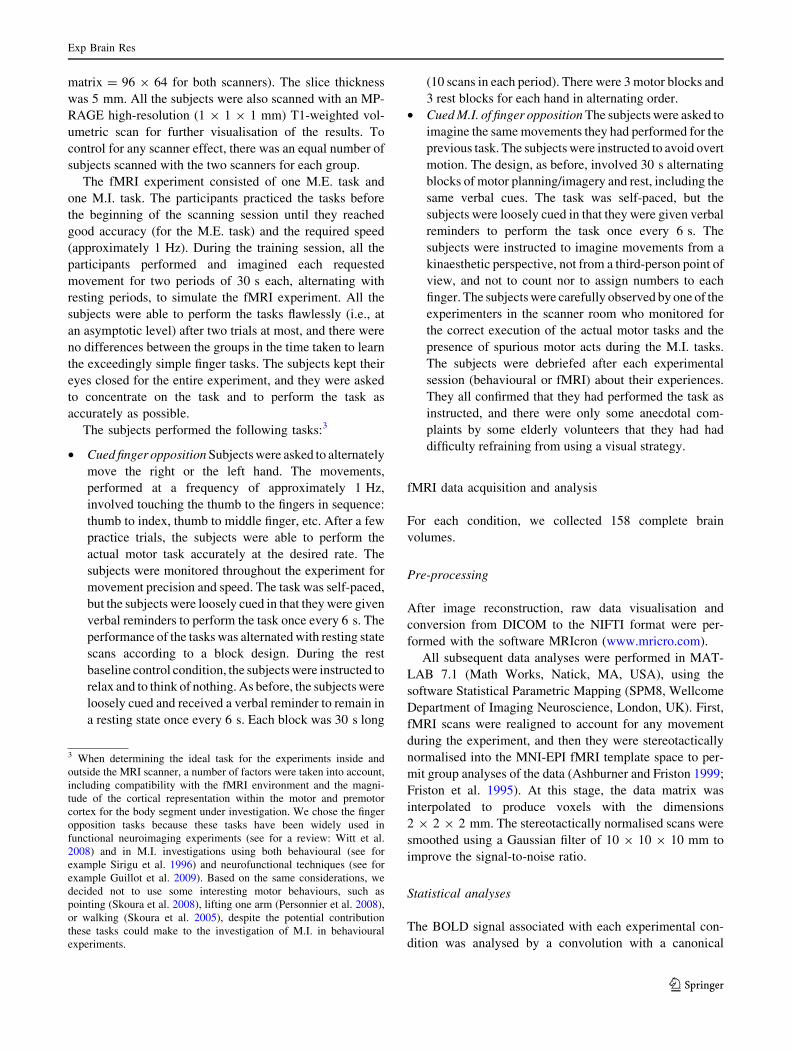
The descriptive statistics for all the tasks in each group are
presented in Table 1 and illustrated in Fig. 1. The Green-
house–Geisser corrected 3 9 2 9 2 9 2 ANOVA yielded
the following results:
Main effects
Group: F(1, 34) = 0.13; p = 0.7. Hand F(1, 34) = 0.7;
p = 0.4. Nature of the movement (finger opposition, pro-
nosupination, fist-making) F(1.2, 42.1) = 136.4; p \ 0.001,
with the longest duration for the finger tapping task. Nature
of the task (M.E., M.I.) F(1, 34) = 16.5; p \ 0.001, the
motor imagery tasks being more time-consuming.
Within-group interactions
Nature of the movement * Nature of the task: F(1.1,
37.6) = 12.8; p = 0.001; the difference between execution
Table 1 Reaction times of the behavioural tasks performed outside the fMRI scanner
Motor execution Motor imagery Motor imagery Minus Motor execution
Left hand Right hand Left hand Right hand Left hand Right hand
Finger tapping
Young subjects 5.5 (1.3) 5.5 (1.2) 6.1 (1.9) 6.1 (1.7) 0.6 (0.9) 0.6 (0.8)
Elderly subjects 5.9 (1.2) 6 (1.3) 7.1 (1.8) 7.2 (1.9) 1.2 (1.6) 1.2 (1.9)
Prono-supination
Young subjects 4 (1.1) 4.1 (1.2) 4.2 (1.5) 4.3 (1.4) 0.2 (0.6) 0.2 (0.5)
Elderly subjects 3.8 (0.6) 3.7 (0.6) 4 (0.8) 4 (0.8) 0.3 (0.6) 0.2 (0.5)
Fist-making
Young subjects 3.8 (1.4) 4 (1.5) 4.1 (1.7) 4.1 (1.7) 0.3 (0.5) 0.2 (0.5)
Elderly subjects 3.7 (0.6) 3.8 (0.7) 3.9 (0.8) 4.1 (0.8) 0.3 (0.6) 0.2 (0.6)
Average of all movements
Young subjects 4.6 (1.6) 4.7 (1.7) 5.0 (2.6) 5.0 (1.9) 0.4 (0.7) 0.4 (0.5)
Elderly subjects 4.5 (0.7) 4.6 (0.7) 4.9 (0.9) 5.0 (0.9) 0.38 (0.9) 0.4 (0.9)
4 The group by task interaction effects are called ‘‘larger activations’’
or ‘‘additional activations,’’ depending on whether the reference
group had rather than not some activations in the given area.
Exp Brain Res
123
and imagery was largest for the finger tapping task. Nature
of the movement * hand: F(1.3, 44.1) = 1.2; p \ 0.3.
Nature of the task * hand: F(1, 34) = 0.1.; p = 0.7. Nature
of the movement * nature of the task * hand: F(1.4,
47.4) = 0.5; p = 0.6.
By-group interactions
Group * Nature of the movement: F(1.2, 42.1) = 5.7;
p = 0.02; the elderly were slower, particularly in the finger
tapping task. Group * Nature of the task: F(1, 34) = 0.6;
p = 0.5. Group * hand: F(1, 34) = 0.08; p = 0.7.
Group * Nature of the movement * Nature of the task:
F(1.1, 37.6) = 3.0; p = 0.09. Group * Nature of the move-
ment * hand: F(1.3, 44.1) = 0.7; p \ 0.4. Group * Nature of
the task * hand: F(1,34) = 0.4; p \ 0.5. Group * Nature of
the movement * Nature of the task * hand: F(1.4, 47.4) =
0.8; p \ 0.4
To summarise, while there was no overall group effect,
there was a clear task effect. The finger opposition task
was the most time-consuming, given the nature of the
task, and the M.I. tasks had longer duration overall. In
addition, the finger opposition task produced the greatest
difference between imagery and execution, shown by the
significance of the Nature of the movement * Nature of
the task interaction in the 3 9 2 9 2 9 2 ANOVA. The
task-specific 2 9 2 9 2 ANOVAs showed no group
effects. Rather, they showed the presence of motor
imagery effects in all tasks. The significance of these
effects was greatest for the finger opposition task: finger
opposition F(1, 34) = 17.1; p \ 0.001; pronosupination
task F(1, 34) = 5.1; p = 0.03; fist-making task F(1, 34) =
7.4; p = 0.01. Exploration of Fig. 1 clearly shows that the
size of this effect was largest for the finger opposition task
(15 % on average for this task, 5.6 % for the pronosupination
task and 1.5 % for the fist-making task).
Group-specific intersubject variability
We also assessed whether there were differences in the
group-specific variability for the tasks by comparing the
subject-specific SDs of the two groups for each task. This
analysis showed that for the finger opposition task, there
was a trend towards greater variability for M.I. among the
elderly for both hands (right hand: one-tailed t(34) = 1.4;
p = 0.07; left hand: one-tailed t(34) = 1.3; p = 0.09). The
same analysis for M.E. showed no trends towards a dif-
ference (right hand: one-tailed t(34) = 0.9; p = 0.2; left
hand: t(34) = 0.2; p = 0.4).
The same analysis for the other tasks showed no trends
towards differences for the pronosupination task (M.I. right
hand one-tailed t(34) = 0.7, p = 0.2; M.I. left hand one-
tailed t(34) = 0.4, p = 0.3; M.E. right hand one-tailed
t(34) = 1.1, p = 0.2; M.E. left hand one-tailed t(34) = 0.2,
p = 0.4) or for the fist-making task (M.I. right hand one-
tailed t(34) = 0.3, p = 0.4; M.I. left hand one-tailed
t(34) = 0.3, p = 0.4; M.E. right hand one-tailed t(34) = 0.3,
p = 0.4; M.E. left hand one-tailed t(34) = 0.3, p = 0.4).
Fig. 1 Distribution of the M.E.
and M.I. durations for the
different movements among the
elderly subjects (red) and the
young (blue) subjects for the
motor execution and motor
imagery tasks (colour figure
online)
Exp Brain Res
123
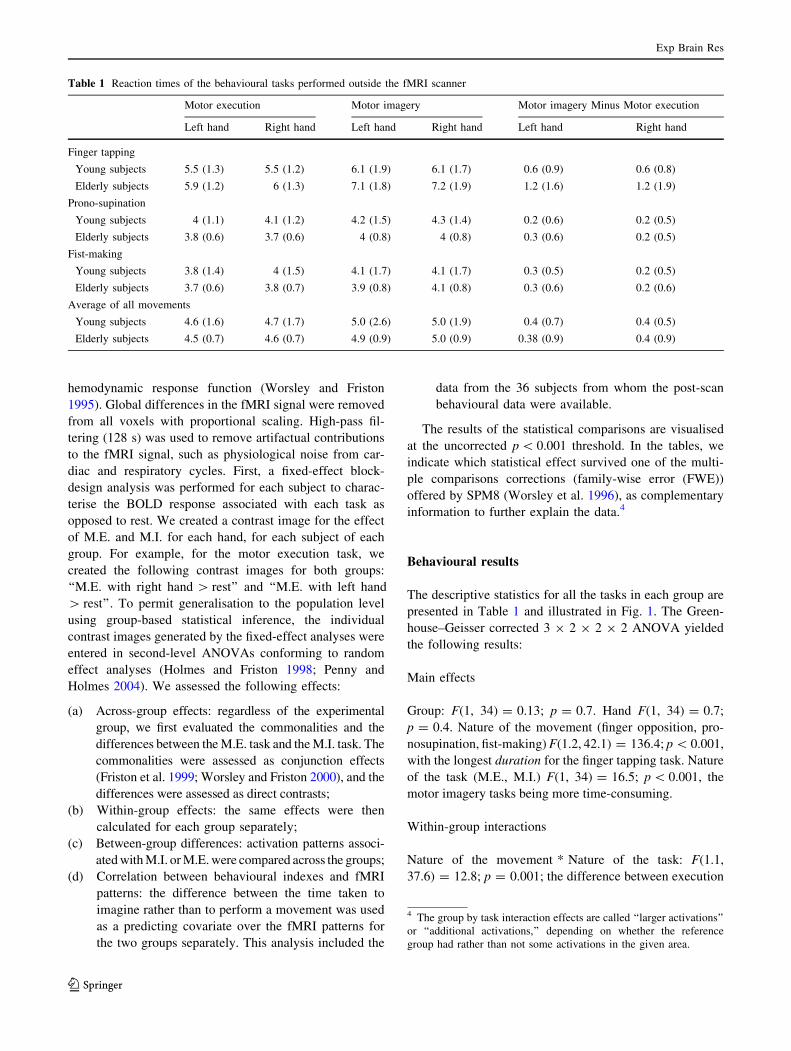
Correlations between motor execution and motor
imagery
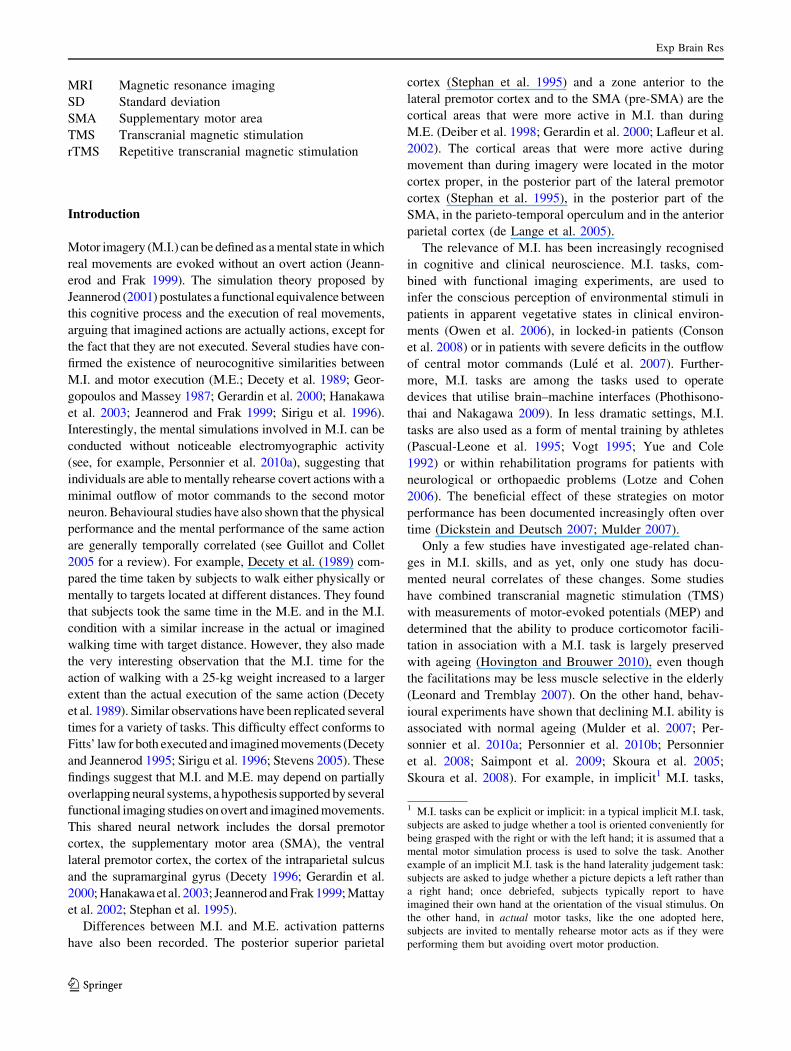
Finally, we calculated the Pearson r-coefficient between
the executed and imagined movement for each task and
each hand in each group. For the finger opposition task,
there was a strong significant correlation for the young
participants (r = 0.9 for the right hand; r = 0.9 for the left
hand; p \ 0.001 for both hands), but there was no corre-
lation for the elderly subjects (r = 0.4 for the right hand;
r = 0.5 for the left hand; p [ 0.05 for both hands). See
Fig. 2.
On the contrary, for both the pronosupination task and
the fist-making task, the temporal correlation was signifi-
cant both for the young subjects (pronosupination task:
r = 0.9 for the right hand; r = 0.9 for the left hand;
p \ 0.001 for both hands; fist-making task: r = 1 for the
right hand; r = 1 for the left hand; p \ 0.001 for both
hands) and for the elderly subjects (pronosupination task:
r = 0.7 for the right hand; r = 0.7 for the left hand;
p \ 0.05 for both hands; fist-making task: r = 0.7 for the
right hand; r = 0.6 for the left hand; p \ 0.05 for both
hands).
To summarise, for the elderly participants, the correla-
tion between executed and imagined movements is main-
tained for simple movements, while it is lost for tasks
involving greater complexity, like the finger opposition
task.
fMRI results
Having a 2 9 2 9 2 design with two within factors (M.E.
and M.I.), two sides of the body (right and left) and one
between-group factor (elderly and young subjects), there
would be many results to report. In this paper, we con-
centrate on the most relevant ones; the effects not men-
tioned are not significant at the thresholds imposed on the
statistical maps.
Brodmann areas and the coordinates of significant
cluster maxima are reported in Tables 2 and 3.
We start by describing the across-group effects. We con-
clude this results section with the by-group interaction effects.
Commonalities and differences across M.E. and M.I.
tasks
As no hand-specific effects were observed for these anal-
yses, the combined results are presented.
(a) Conjunction of M.E. and M.I. The areas of shared
activation (across groups for both tasks and hands; see
Fig. 2 Correlations between the time taken for covert and overt movements among the elderly subjects (red) and the young (blue) subjects for
both hands (colour figure online)
Exp Brain Res
123
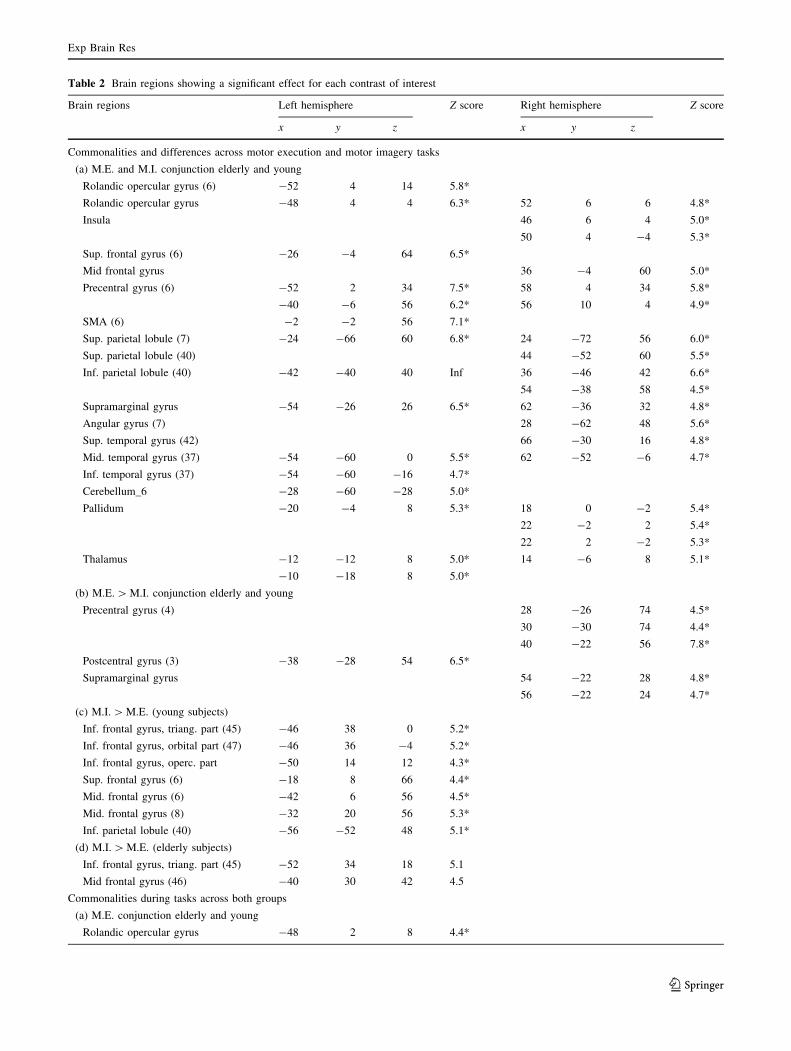
Table 2 Brain regions showing a significant effect for each contrast of interest
Brain regions Left hemisphere Z score Right hemisphere Z score
x y z x y z
Commonalities and differences across motor execution and motor imagery tasks
(a) M.E. and M.I. conjunction elderly and young
Rolandic opercular gyrus (6) -52 4 14 5.8*
Rolandic opercular gyrus -48 4 4 6.3* 52 6 6 4.8*
Insula 46 6 4 5.0*
50 4 -4 5.3*
Sup. frontal gyrus (6) -26 -4 64 6.5*
Mid frontal gyrus 36 -4 60 5.0*
Precentral gyrus (6) -52 2 34 7.5* 58 4 34 5.8*
-40 -6 56 6.2* 56 10 4 4.9*
SMA (6) -2 -2 56 7.1*
Sup. parietal lobule (7) -24 -66 60 6.8* 24 -72 56 6.0*
Sup. parietal lobule (40) 44 -52 60 5.5*
Inf. parietal lobule (40) -42 -40 40 Inf 36 -46 42 6.6*
54 -38 58 4.5*
Supramarginal gyrus -54 -26 26 6.5* 62 -36 32 4.8*
Angular gyrus (7) 28 -62 48 5.6*
Sup. temporal gyrus (42) 66 -30 16 4.8*
Mid. temporal gyrus (37) -54 -60 0 5.5* 62 -52 -6 4.7*
Inf. temporal gyrus (37) -54 -60 -16 4.7*
Cerebellum_6 -28 -60 -28 5.0*
Pallidum -20 -4 8 5.3* 18 0 -2 5.4*
22 -2 2 5.4*
22 2 -2 5.3*
Thalamus -12 -12 8 5.0* 14 -6 8 5.1*
-10 -18 8 5.0*
(b) M.E. [ M.I. conjunction elderly and young
Precentral gyrus (4) 28 -26 74 4.5*
30 -30 74 4.4*
40 -22 56 7.8*
Postcentral gyrus (3) -38 -28 54 6.5*
Supramarginal gyrus 54 -22 28 4.8*
56 -22 24 4.7*
(c) M.I. [ M.E. (young subjects)
Inf. frontal gyrus, triang. part (45) -46 38 0 5.2*
Inf. frontal gyrus, orbital part (47) -46 36 -4 5.2*
Inf. frontal gyrus, operc. part -50 14 12 4.3*
Sup. frontal gyrus (6) -18 8 66 4.4*
Mid. frontal gyrus (6) -42 6 56 4.5*
Mid. frontal gyrus (8) -32 20 56 5.3*
Inf. parietal lobule (40) -56 -52 48 5.1*
(d) M.I. [ M.E. (elderly subjects)
Inf. frontal gyrus, triang. part (45) -52 34 18 5.1
Mid frontal gyrus (46) -40 30 42 4.5
Commonalities during tasks across both groups
(a) M.E. conjunction elderly and young
Rolandic opercular gyrus -48 2 8 4.4*
Exp Brain Res
123
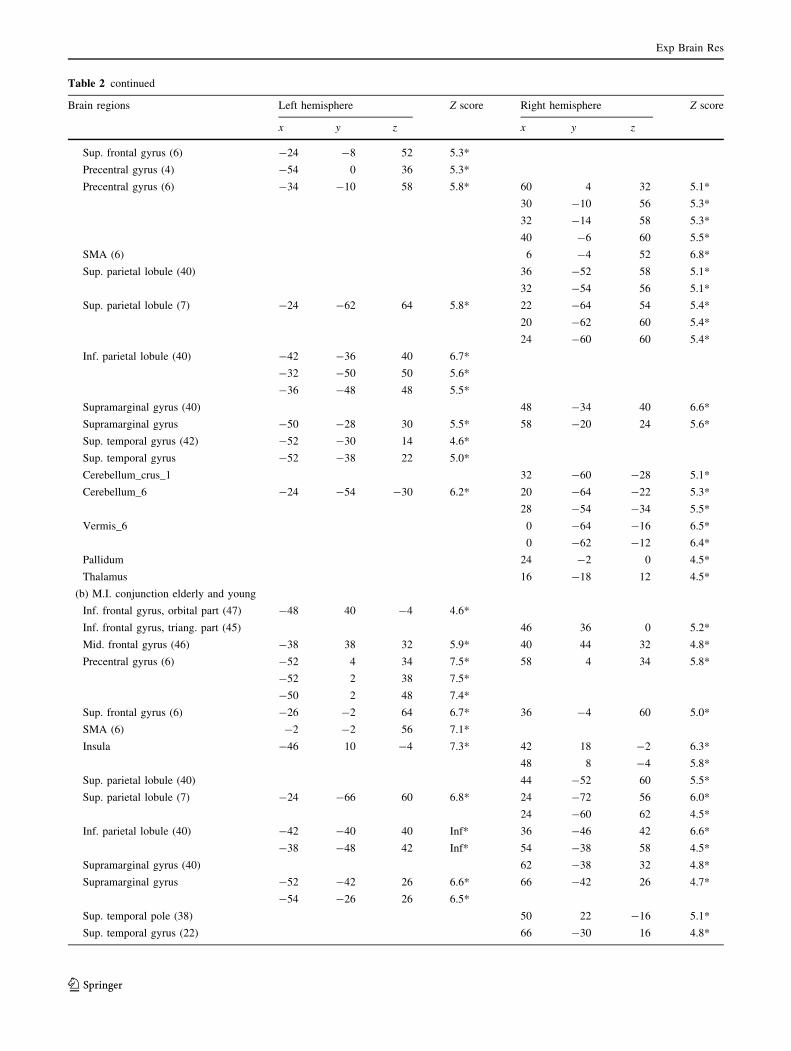
Table 2 continued
Brain regions Left hemisphere Z score Right hemisphere Z score
x y z x y z
Sup. frontal gyrus (6) -24 -8 52 5.3*
Precentral gyrus (4) -54 0 36 5.3*
Precentral gyrus (6) -34 -10 58 5.8* 60 4 32 5.1*
30 -10 56 5.3*
32 -14 58 5.3*
40 -6 60 5.5*
SMA (6) 6 -4 52 6.8*
Sup. parietal lobule (40) 36 -52 58 5.1*
32 -54 56 5.1*
Sup. parietal lobule (7) -24 -62 64 5.8* 22 -64 54 5.4*
20 -62 60 5.4*
24 -60 60 5.4*
Inf. parietal lobule (40) -42 -36 40 6.7*
-32 -50 50 5.6*
-36 -48 48 5.5*
Supramarginal gyrus (40) 48 -34 40 6.6*
Supramarginal gyrus -50 -28 30 5.5* 58 -20 24 5.6*
Sup. temporal gyrus (42) -52 -30 14 4.6*
Sup. temporal gyrus -52 -38 22 5.0*
Cerebellum_crus_1 32 -60 -28 5.1*
Cerebellum_6 -24 -54 -30 6.2* 20 -64 -22 5.3*
28 -54 -34 5.5*
Vermis_6 0 -64 -16 6.5*
0 -62 -12 6.4*
Pallidum 24 -2 0 4.5*
Thalamus 16 -18 12 4.5*
(b) M.I. conjunction elderly and young
Inf. frontal gyrus, orbital part (47) -48 40 -4 4.6*
Inf. frontal gyrus, triang. part (45) 46 36 0 5.2*
Mid. frontal gyrus (46) -38 38 32 5.9* 40 44 32 4.8*
Precentral gyrus (6) -52 4 34 7.5* 58 4 34 5.8*
-52 2 38 7.5*
-50 2 48 7.4*
Sup. frontal gyrus (6) -26 -2 64 6.7* 36 -4 60 5.0*
SMA (6) -2 -2 56 7.1*
Insula -46 10 -4 7.3* 42 18 -2 6.3*
48 8 -4 5.8*
Sup. parietal lobule (40) 44 -52 60 5.5*
Sup. parietal lobule (7) -24 -66 60 6.8* 24 -72 56 6.0*
24 -60 62 4.5*
Inf. parietal lobule (40) -42 -40 40 Inf* 36 -46 42 6.6*
-38 -48 42 Inf* 54 -38 58 4.5*
Supramarginal gyrus (40) 62 -38 32 4.8*
Supramarginal gyrus -52 -42 26 6.6* 66 -42 26 4.7*
-54 -26 26 6.5*
Sup. temporal pole (38) 50 22 -16 5.1*
Sup. temporal gyrus (22) 66 -30 16 4.8*
Exp Brain Res
123
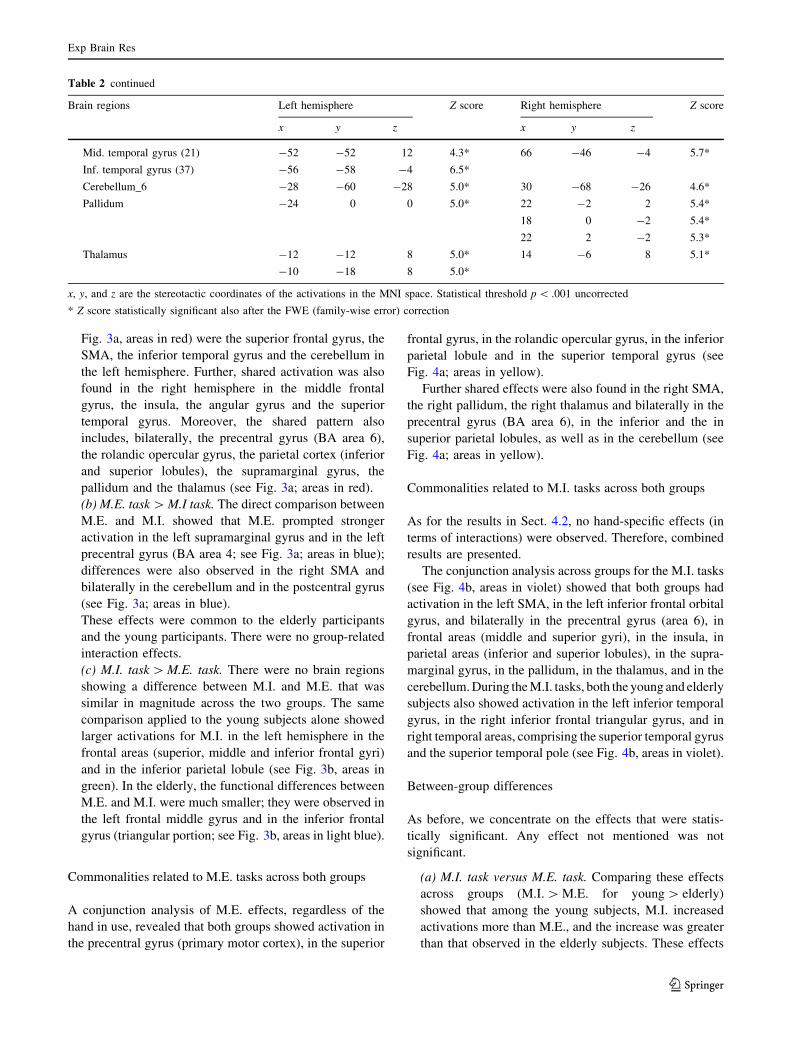
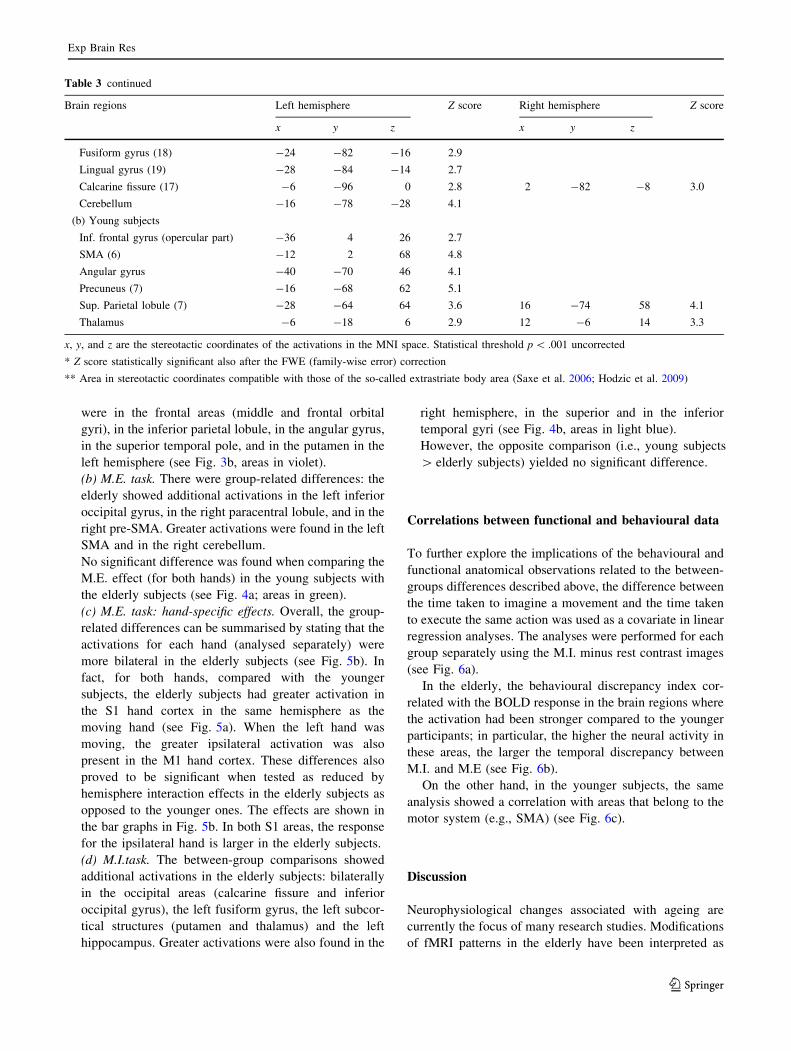
Fig. 3a, areas in red) were the superior frontal gyrus, the
SMA, the inferior temporal gyrus and the cerebellum in
the left hemisphere. Further, shared activation was also
found in the right hemisphere in the middle frontal
gyrus, the insula, the angular gyrus and the superior
temporal gyrus. Moreover, the shared pattern also
includes, bilaterally, the precentral gyrus (BA area 6),
the rolandic opercular gyrus, the parietal cortex (inferior
and superior lobules), the supramarginal gyrus, the
pallidum and the thalamus (see Fig. 3a; areas in red).
(b) M.E. task [ M.I task. The direct comparison between
M.E. and M.I. showed that M.E. prompted stronger
activation in the left supramarginal gyrus and in the left
precentral gyrus (BA area 4; see Fig. 3a; areas in blue);
differences were also observed in the right SMA and
bilaterally in the cerebellum and in the postcentral gyrus
(see Fig. 3a; areas in blue).
These effects were common to the elderly participants
and the young participants. There were no group-related
interaction effects.
(c) M.I. task [ M.E. task. There were no brain regions
showing a difference between M.I. and M.E. that was
similar in magnitude across the two groups. The same
comparison applied to the young subjects alone showed
larger activations for M.I. in the left hemisphere in the
frontal areas (superior, middle and inferior frontal gyri)
and in the inferior parietal lobule (see Fig. 3b, areas in
green). In the elderly, the functional differences between
M.E. and M.I. were much smaller; they were observed in
the left frontal middle gyrus and in the inferior frontal
gyrus (triangular portion; see Fig. 3b, areas in light blue).
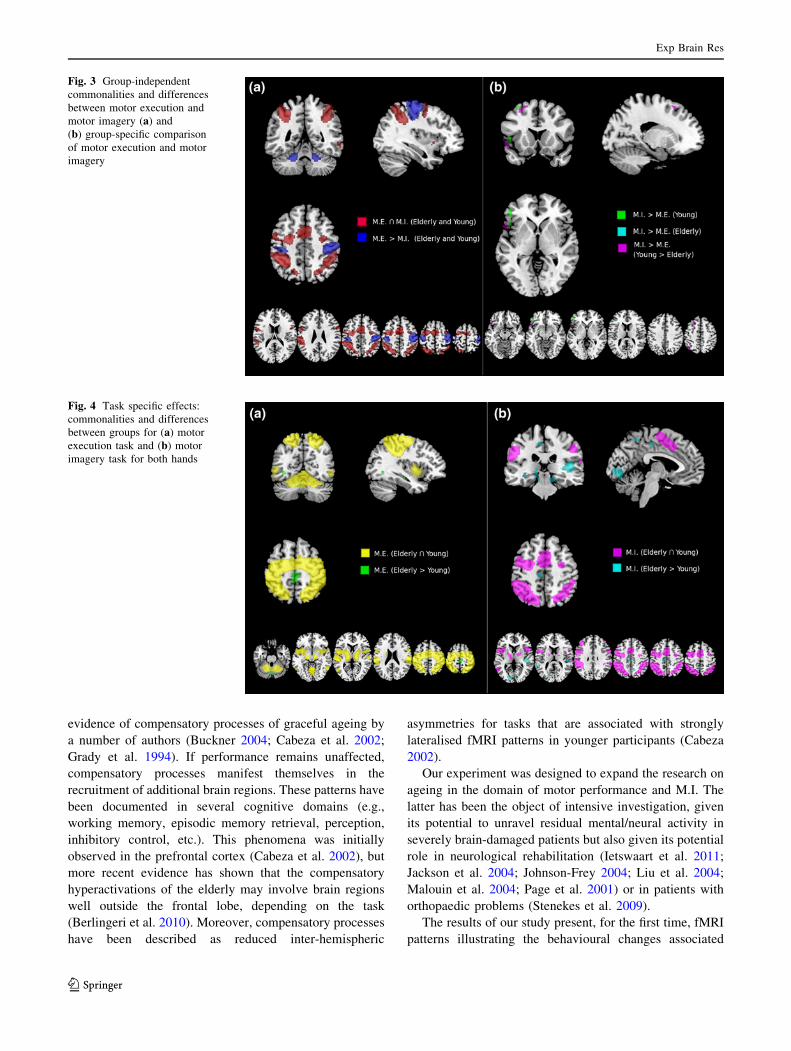
Commonalities related to M.E. tasks across both groups
A conjunction analysis of M.E. effects, regardless of the
hand in use, revealed that both groups showed activation in
the precentral gyrus (primary motor cortex), in the superior
frontal gyrus, in the rolandic opercular gyrus, in the inferior
parietal lobule and in the superior temporal gyrus (see
Fig. 4a; areas in yellow).
Further shared effects were also found in the right SMA,
the right pallidum, the right thalamus and bilaterally in the
precentral gyrus (BA area 6), in the inferior and the in
superior parietal lobules, as well as in the cerebellum (see
Fig. 4a; areas in yellow).
Commonalities related to M.I. tasks across both groups
As for the results in Sect. 4.2, no hand-specific effects (in
terms of interactions) were observed. Therefore, combined
results are presented.
The conjunction analysis across groups for the M.I. tasks
(see Fig. 4b, areas in violet) showed that both groups had
activation in the left SMA, in the left inferior frontal orbital
gyrus, and bilaterally in the precentral gyrus (area 6), in
frontal areas (middle and superior gyri), in the insula, in
parietal areas (inferior and superior lobules), in the supra-
marginal gyrus, in the pallidum, in the thalamus, and in the
cerebellum. During the M.I. tasks, both the young and elderly
subjects also showed activation in the left inferior temporal
gyrus, in the right inferior frontal triangular gyrus, and in
right temporal areas, comprising the superior temporal gyrus
and the superior temporal pole (see Fig. 4b, areas in violet).
Between-group differences
As before, we concentrate on the effects that were statis-
tically significant. Any effect not mentioned was not
significant.
(a) M.I. task versus M.E. task. Comparing these effects
across groups (M.I. [ M.E. for young [ elderly)
showed that among the young subjects, M.I. increased
activations more than M.E., and the increase was greater
than that observed in the elderly subjects. These effects
Table 2 continued
Brain regions Left hemisphere Z score Right hemisphere Z score
x y z x y z
Mid. temporal gyrus (21) -52 -52 12 4.3* 66 -46 -4 5.7*
Inf. temporal gyrus (37) -56 -58 -4 6.5*
Cerebellum_6 -28 -60 -28 5.0* 30 -68 -26 4.6*
Pallidum -24 0 0 5.0* 22 -2 2 5.4*
18 0 -2 5.4*
22 2 -2 5.3*
Thalamus -12 -12 8 5.0* 14 -6 8 5.1*
-10 -18 8 5.0*
x, y, and z are the stereotactic coordinates of the activations in the MNI space. Statistical threshold p \ .001 uncorrected
* Z score statistically significant also after the FWE (family-wise error) correction
Exp Brain Res
123
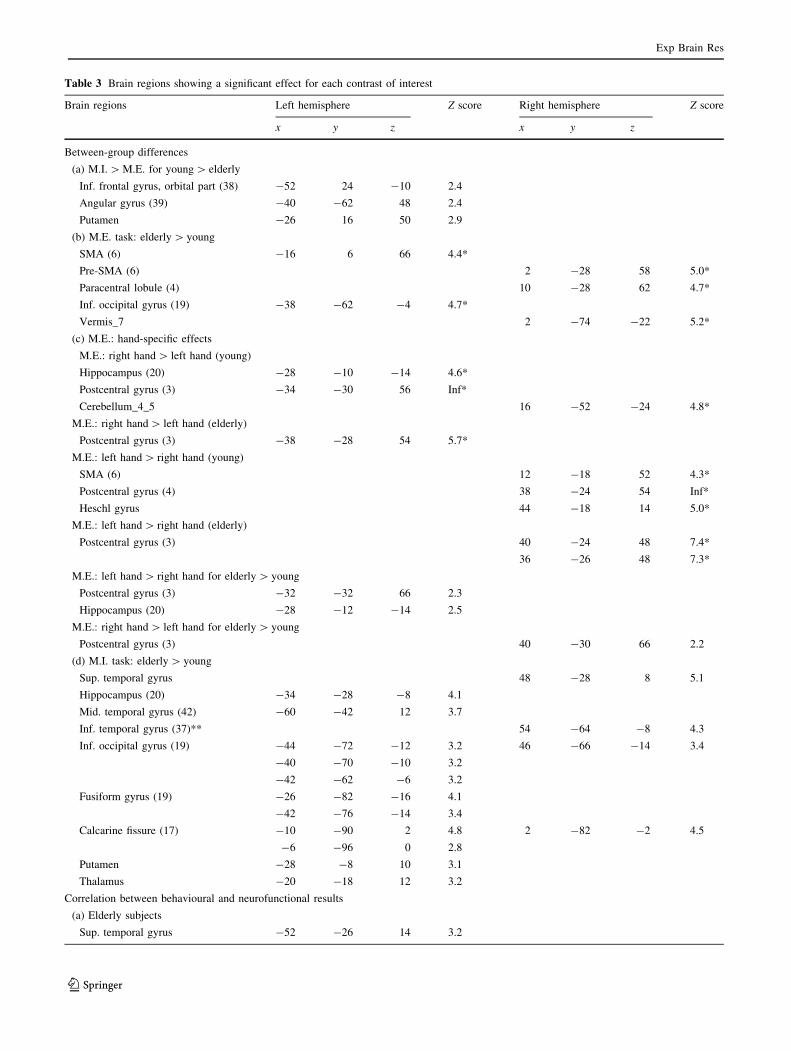
Table 3 Brain regions showing a significant effect for each contrast of interest
Brain regions Left hemisphere Z score Right hemisphere Z score
x y z x y z
Between-group differences
(a) M.I. [ M.E. for young [ elderly
Inf. frontal gyrus, orbital part (38) -52 24 -10 2.4
Angular gyrus (39) -40 -62 48 2.4
Putamen -26 16 50 2.9
(b) M.E. task: elderly [ young
SMA (6) -16 6 66 4.4*
Pre-SMA (6) 2 -28 58 5.0*
Paracentral lobule (4) 10 -28 62 4.7*
Inf. occipital gyrus (19) -38 -62 -4 4.7*
Vermis_7 2 -74 -22 5.2*
(c) M.E.: hand-specific effects
M.E.: right hand [ left hand (young)
Hippocampus (20) -28 -10 -14 4.6*
Postcentral gyrus (3) -34 -30 56 Inf*
Cerebellum_4_5 16 -52 -24 4.8*
M.E.: right hand [ left hand (elderly)
Postcentral gyrus (3) -38 -28 54 5.7*
M.E.: left hand [ right hand (young)
SMA (6) 12 -18 52 4.3*
Postcentral gyrus (4) 38 -24 54 Inf*
Heschl gyrus 44 -18 14 5.0*
M.E.: left hand [ right hand (elderly)
Postcentral gyrus (3) 40 -24 48 7.4*
36 -26 48 7.3*
M.E.: left hand [ right hand for elderly [ young
Postcentral gyrus (3) -32 -32 66 2.3
Hippocampus (20) -28 -12 -14 2.5
M.E.: right hand [ left hand for elderly [ young
Postcentral gyrus (3) 40 -30 66 2.2
(d) M.I. task: elderly [ young
Sup. temporal gyrus 48 -28 8 5.1
Hippocampus (20) -34 -28 -8 4.1
Mid. temporal gyrus (42) -60 -42 12 3.7
Inf. temporal gyrus (37)** 54 -64 -8 4.3
Inf. occipital gyrus (19) -44 -72 -12 3.2 46 -66 -14 3.4
-40 -70 -10 3.2
-42 -62 -6 3.2
Fusiform gyrus (19) -26 -82 -16 4.1
-42 -76 -14 3.4
Calcarine fissure (17) -10 -90 2 4.8 2 -82 -2 4.5
-6 -96 0 2.8
Putamen -28 -8 10 3.1
Thalamus -20 -18 12 3.2
Correlation between behavioural and neurofunctional results
(a) Elderly subjects
Sup. temporal gyrus -52 -26 14 3.2
Exp Brain Res
123
were in the frontal areas (middle and frontal orbital
gyri), in the inferior parietal lobule, in the angular gyrus,
in the superior temporal pole, and in the putamen in the
left hemisphere (see Fig. 3b, areas in violet).
(b) M.E. task. There were group-related differences: the
elderly showed additional activations in the left inferior
occipital gyrus, in the right paracentral lobule, and in the
right pre-SMA. Greater activations were found in the left
SMA and in the right cerebellum.
No significant difference was found when comparing the
M.E. effect (for both hands) in the young subjects with
the elderly subjects (see Fig. 4a; areas in green).
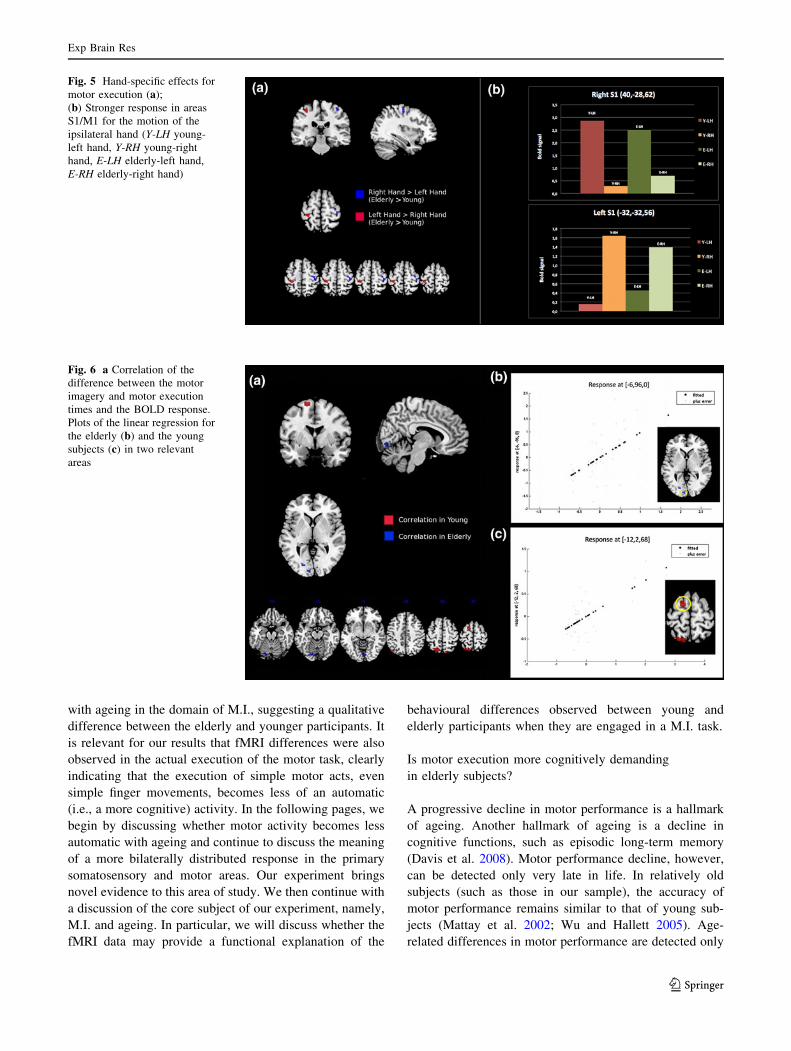
(c) M.E. task: hand-specific effects. Overall, the group-
related differences can be summarised by stating that the
activations for each hand (analysed separately) were
more bilateral in the elderly subjects (see Fig. 5b). In
fact, for both hands, compared with the younger
subjects, the elderly subjects had greater activation in
the S1 hand cortex in the same hemisphere as the
moving hand (see Fig. 5a). When the left hand was
moving, the greater ipsilateral activation was also
present in the M1 hand cortex. These differences also
proved to be significant when tested as reduced by
hemisphere interaction effects in the elderly subjects as
opposed to the younger ones. The effects are shown in
the bar graphs in Fig. 5b. In both S1 areas, the response
for the ipsilateral hand is larger in the elderly subjects.
(d) M.I.task. The between-group comparisons showed
additional activations in the elderly subjects: bilaterally
in the occipital areas (calcarine fissure and inferior
occipital gyrus), the left fusiform gyrus, the left subcor-
tical structures (putamen and thalamus) and the left
hippocampus. Greater activations were also found in the
right hemisphere, in the superior and in the inferior
temporal gyri (see Fig. 4b, areas in light blue).
However, the opposite comparison (i.e., young subjects
[ elderly subjects) yielded no significant difference.
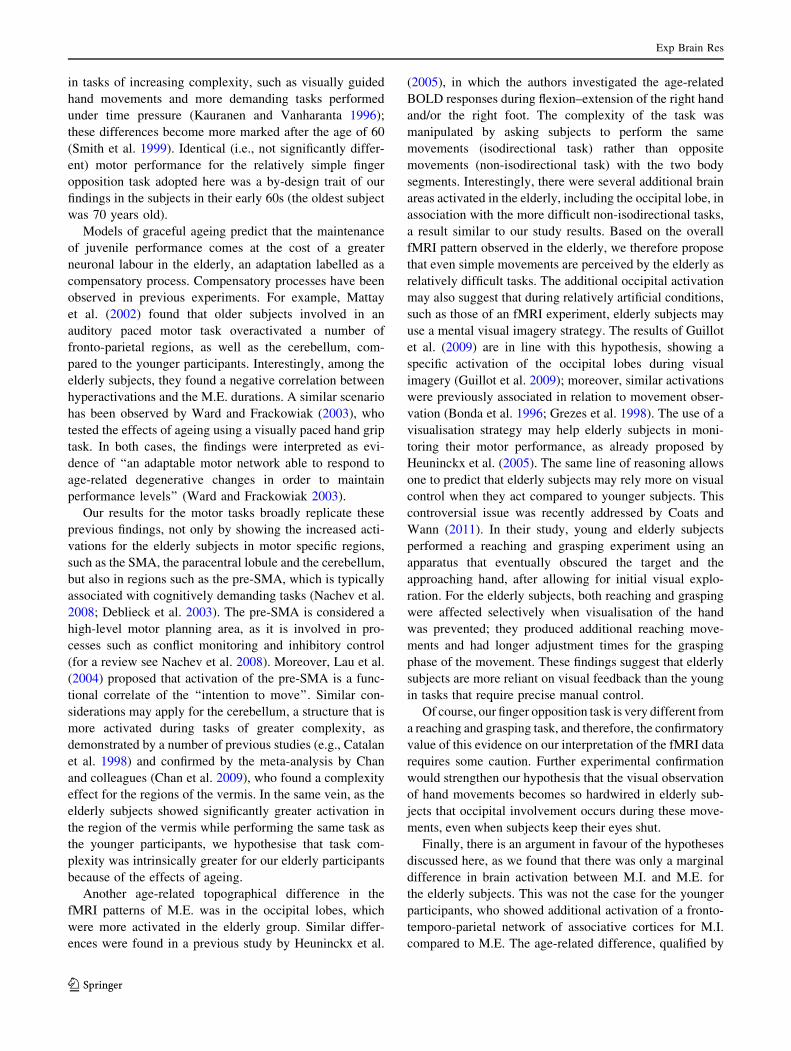
Correlations between functional and behavioural data
To further explore the implications of the behavioural and
functional anatomical observations related to the between-
groups differences described above, the difference between
the time taken to imagine a movement and the time taken
to execute the same action was used as a covariate in linear
regression analyses. The analyses were performed for each
group separately using the M.I. minus rest contrast images
(see Fig. 6a).
In the elderly, the behavioural discrepancy index cor-
related with the BOLD response in the brain regions where
the activation had been stronger compared to the younger
participants; in particular, the higher the neural activity in
these areas, the larger the temporal discrepancy between
M.I. and M.E (see Fig. 6b).
On the other hand, in the younger subjects, the same
analysis showed a correlation with areas that belong to the
motor system (e.g., SMA) (see Fig. 6c).
Discussion
Neurophysiological changes associated with ageing are
currently the focus of many research studies. Modifications
of fMRI patterns in the elderly have been interpreted as
Table 3 continued
Brain regions Left hemisphere Z score Right hemisphere Z score
x y z x y z
Fusiform gyrus (18) -24 -82 -16 2.9
Lingual gyrus (19) -28 -84 -14 2.7
Calcarine fissure (17) -6 -96 0 2.8 2 -82 -8 3.0
Cerebellum -16 -78 -28 4.1
(b) Young subjects
Inf. frontal gyrus (opercular part) -36 4 26 2.7
SMA (6) -12 2 68 4.8
Angular gyrus -40 -70 46 4.1
Precuneus (7) -16 -68 62 5.1
Sup. Parietal lobule (7) -28 -64 64 3.6 16 -74 58 4.1
Thalamus -6 -18 6 2.9 12 -6 14 3.3
x, y, and z are the stereotactic coordinates of the activations in the MNI space. Statistical threshold p \ .001 uncorrected
* Z score statistically significant also after the FWE (family-wise error) correction
** Area in stereotactic coordinates compatible with those of the so-called extrastriate body area (Saxe et al. 2006; Hodzic et al. 2009)
Exp Brain Res
123
evidence of compensatory processes of graceful ageing by
a number of authors (Buckner 2004; Cabeza et al. 2002;
Grady et al. 1994). If performance remains unaffected,
compensatory processes manifest themselves in the
recruitment of additional brain regions. These patterns have
been documented in several cognitive domains (e.g.,
working memory, episodic memory retrieval, perception,
inhibitory control, etc.). This phenomena was initially
observed in the prefrontal cortex (Cabeza et al. 2002), but
more recent evidence has shown that the compensatory
hyperactivations of the elderly may involve brain regions
well outside the frontal lobe, depending on the task
(Berlingeri et al. 2010). Moreover, compensatory processes
have been described as reduced inter-hemispheric
asymmetries for tasks that are associated with strongly
lateralised fMRI patterns in younger participants (Cabeza
2002).
Our experiment was designed to expand the research on
ageing in the domain of motor performance and M.I. The
latter has been the object of intensive investigation, given
its potential to unravel residual mental/neural activity in
severely brain-damaged patients but also given its potential
role in neurological rehabilitation (Ietswaart et al. 2011;
Jackson et al. 2004; Johnson-Frey 2004; Liu et al. 2004;
Malouin et al. 2004; Page et al. 2001) or in patients with
orthopaedic problems (Stenekes et al. 2009).
The results of our study present, for the first time, fMRI
patterns illustrating the behavioural changes associated
Fig. 3 Group-independent
commonalities and differences
between motor execution and
motor imagery (a) and
(b) group-specific comparison
of motor execution and motor
imagery
Fig. 4 Task specific effects:
commonalities and differences
between groups for (a) motor
execution task and (b) motor
imagery task for both hands
Exp Brain Res
123
with ageing in the domain of M.I., suggesting a qualitative
difference between the elderly and younger participants. It
is relevant for our results that fMRI differences were also
observed in the actual execution of the motor task, clearly
indicating that the execution of simple motor acts, even
simple finger movements, becomes less of an automatic
(i.e., a more cognitive) activity. In the following pages, we
begin by discussing whether motor activity becomes less
automatic with ageing and continue to discuss the meaning
of a more bilaterally distributed response in the primary
somatosensory and motor areas. Our experiment brings
novel evidence to this area of study. We then continue with
a discussion of the core subject of our experiment, namely,
M.I. and ageing. In particular, we will discuss whether the
fMRI data may provide a functional explanation of the
behavioural differences observed between young and
elderly participants when they are engaged in a M.I. task.
Is motor execution more cognitively demanding
in elderly subjects?
A progressive decline in motor performance is a hallmark
of ageing. Another hallmark of ageing is a decline in
cognitive functions, such as episodic long-term memory
(Davis et al. 2008). Motor performance decline, however,
can be detected only very late in life. In relatively old
subjects (such as those in our sample), the accuracy of
motor performance remains similar to that of young sub-
jects (Mattay et al. 2002; Wu and Hallett 2005). Age-
related differences in motor performance are detected only
Fig. 5 Hand-specific effects for
motor execution (a);
(b) Stronger response in areas
S1/M1 for the motion of the
ipsilateral hand (Y-LH young-
left hand, Y-RH young-right
hand, E-LH elderly-left hand,
E-RH elderly-right hand)
Fig. 6 a Correlation of the
difference between the motor
imagery and motor execution
times and the BOLD response.
Plots of the linear regression for
the elderly (b) and the young
subjects (c) in two relevant
areas
Exp Brain Res
123
in tasks of increasing complexity, such as visually guided
hand movements and more demanding tasks performed
under time pressure (Kauranen and Vanharanta 1996);
these differences become more marked after the age of 60
(Smith et al. 1999). Identical (i.e., not significantly differ-
ent) motor performance for the relatively simple finger
opposition task adopted here was a by-design trait of our
findings in the subjects in their early 60s (the oldest subject
was 70 years old).
Models of graceful ageing predict that the maintenance
of juvenile performance comes at the cost of a greater
neuronal labour in the elderly, an adaptation labelled as a
compensatory process. Compensatory processes have been
observed in previous experiments. For example, Mattay
et al. (2002) found that older subjects involved in an
auditory paced motor task overactivated a number of
fronto-parietal regions, as well as the cerebellum, com-
pared to the younger participants. Interestingly, among the
elderly subjects, they found a negative correlation between
hyperactivations and the M.E. durations. A similar scenario
has been observed by Ward and Frackowiak (2003), who
tested the effects of ageing using a visually paced hand grip
task. In both cases, the findings were interpreted as evi-
dence of ‘‘an adaptable motor network able to respond to
age-related degenerative changes in order to maintain
performance levels’’ (Ward and Frackowiak 2003).
Our results for the motor tasks broadly replicate these
previous findings, not only by showing the increased acti-
vations for the elderly subjects in motor specific regions,
such as the SMA, the paracentral lobule and the cerebellum,
but also in regions such as the pre-SMA, which is typically
associated with cognitively demanding tasks (Nachev et al.
2008; Deblieck et al. 2003). The pre-SMA is considered a
high-level motor planning area, as it is involved in pro-
cesses such as conflict monitoring and inhibitory control
(for a review see Nachev et al. 2008). Moreover, Lau et al.
(2004) proposed that activation of the pre-SMA is a func-
tional correlate of the ‘‘intention to move’’. Similar con-
siderations may apply for the cerebellum, a structure that is
more activated during tasks of greater complexity, as
demonstrated by a number of previous studies (e.g., Catalan
et al. 1998) and confirmed by the meta-analysis by Chan
and colleagues (Chan et al. 2009), who found a complexity
effect for the regions of the vermis. In the same vein, as the
elderly subjects showed significantly greater activation in
the region of the vermis while performing the same task as
the younger participants, we hypothesise that task com-
plexity was intrinsically greater for our elderly participants
because of the effects of ageing.
Another age-related topographical difference in the
fMRI patterns of M.E. was in the occipital lobes, which
were more activated in the elderly group. Similar differ-
ences were found in a previous study by Heuninckx et al.
(2005), in which the authors investigated the age-related
BOLD responses during flexion–extension of the right hand
and/or the right foot. The complexity of the task was
manipulated by asking subjects to perform the same
movements (isodirectional task) rather than opposite
movements (non-isodirectional task) with the two body
segments. Interestingly, there were several additional brain
areas activated in the elderly, including the occipital lobe, in
association with the more difficult non-isodirectional tasks,
a result similar to our study results. Based on the overall
fMRI pattern observed in the elderly, we therefore propose
that even simple movements are perceived by the elderly as
relatively difficult tasks. The additional occipital activation
may also suggest that during relatively artificial conditions,
such as those of an fMRI experiment, elderly subjects may
use a mental visual imagery strategy. The results of Guillot
et al. (2009) are in line with this hypothesis, showing a
specific activation of the occipital lobes during visual
imagery (Guillot et al. 2009); moreover, similar activations
were previously associated in relation to movement obser-
vation (Bonda et al. 1996; Grezes et al. 1998). The use of a
visualisation strategy may help elderly subjects in moni-
toring their motor performance, as already proposed by
Heuninckx et al. (2005). The same line of reasoning allows
one to predict that elderly subjects may rely more on visual
control when they act compared to younger subjects. This
controversial issue was recently addressed by Coats and
Wann (2011). In their study, young and elderly subjects
performed a reaching and grasping experiment using an
apparatus that eventually obscured the target and the
approaching hand, after allowing for initial visual explo-
ration. For the elderly subjects, both reaching and grasping
were affected selectively when visualisation of the hand
was prevented; they produced additional reaching move-
ments and had longer adjustment times for the grasping
phase of the movement. These findings suggest that elderly
subjects are more reliant on visual feedback than the young
in tasks that require precise manual control.
Of course, our finger opposition task is very different from
a reaching and grasping task, and therefore, the confirmatory
value of this evidence on our interpretation of the fMRI data
requires some caution. Further experimental confirmation
would strengthen our hypothesis that the visual observation
of hand movements becomes so hardwired in elderly sub-
jects that occipital involvement occurs during these move-
ments, even when subjects keep their eyes shut.
Finally, there is an argument in favour of the hypotheses
discussed here, as we found that there was only a marginal
difference in brain activation between M.I. and M.E. for
the elderly subjects. This was not the case for the younger
participants, who showed additional activation of a fronto-
temporo-parietal network of associative cortices for M.I.
compared to M.E. The age-related difference, qualified by
Exp Brain Res
123
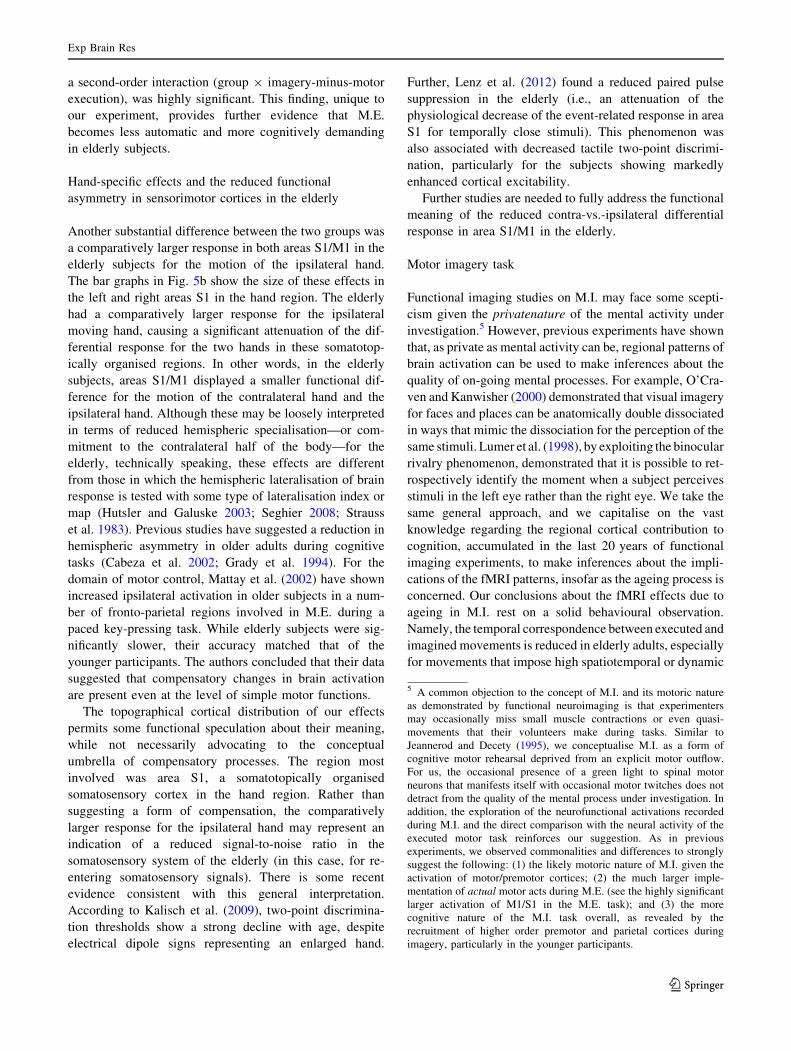
a second-order interaction (group 9 imagery-minus-motor
execution), was highly significant. This finding, unique to
our experiment, provides further evidence that M.E.
becomes less automatic and more cognitively demanding
in elderly subjects.
Hand-specific effects and the reduced functional
asymmetry in sensorimotor cortices in the elderly
Another substantial difference between the two groups was
a comparatively larger response in both areas S1/M1 in the
elderly subjects for the motion of the ipsilateral hand.
The bar graphs in Fig. 5b show the size of these effects in
the left and right areas S1 in the hand region. The elderly
had a comparatively larger response for the ipsilateral
moving hand, causing a significant attenuation of the dif-
ferential response for the two hands in these somatotop-
ically organised regions. In other words, in the elderly
subjects, areas S1/M1 displayed a smaller functional dif-
ference for the motion of the contralateral hand and the
ipsilateral hand. Although these may be loosely interpreted
in terms of reduced hemispheric specialisation—or com-
mitment to the contralateral half of the body—for the
elderly, technically speaking, these effects are different
from those in which the hemispheric lateralisation of brain
response is tested with some type of lateralisation index or
map (Hutsler and Galuske 2003; Seghier 2008; Strauss
et al. 1983). Previous studies have suggested a reduction in
hemispheric asymmetry in older adults during cognitive
tasks (Cabeza et al. 2002; Grady et al. 1994). For the
domain of motor control, Mattay et al. (2002) have shown
increased ipsilateral activation in older subjects in a num-
ber of fronto-parietal regions involved in M.E. during a
paced key-pressing task. While elderly subjects were sig-
nificantly slower, their accuracy matched that of the
younger participants. The authors concluded that their data
suggested that compensatory changes in brain activation
are present even at the level of simple motor functions.
The topographical cortical distribution of our effects
permits some functional speculation about their meaning,
while not necessarily advocating to the conceptual
umbrella of compensatory processes. The region most
involved was area S1, a somatotopically organised
somatosensory cortex in the hand region. Rather than
suggesting a form of compensation, the comparatively
larger response for the ipsilateral hand may represent an
indication of a reduced signal-to-noise ratio in the
somatosensory system of the elderly (in this case, for re-
entering somatosensory signals). There is some recent
evidence consistent with this general interpretation.
According to Kalisch et al. (2009), two-point discrimina-
tion thresholds show a strong decline with age, despite
electrical dipole signs representing an enlarged hand.
Further, Lenz et al. (2012) found a reduced paired pulse
suppression in the elderly (i.e., an attenuation of the
physiological decrease of the event-related response in area
S1 for temporally close stimuli). This phenomenon was
also associated with decreased tactile two-point discrimi-
nation, particularly for the subjects showing markedly
enhanced cortical excitability.
Further studies are needed to fully address the functional
meaning of the reduced contra-vs.-ipsilateral differential
response in area S1/M1 in the elderly.
Motor imagery task
Functional imaging studies on M.I. may face some scepti-
cism given the privatenature of the mental activity under
investigation.5 However, previous experiments have shown
that, as private as mental activity can be, regional patterns of
brain activation can be used to make inferences about the
quality of on-going mental processes. For example, O’Cra-
ven and Kanwisher (2000) demonstrated that visual imagery
for faces and places can be anatomically double dissociated
in ways that mimic the dissociation for the perception of the
same stimuli. Lumer et al. (1998), by exploiting the binocular
rivalry phenomenon, demonstrated that it is possible to ret-
rospectively identify the moment when a subject perceives
stimuli in the left eye rather than the right eye. We take the
same general approach, and we capitalise on the vast
knowledge regarding the regional cortical contribution to
cognition, accumulated in the last 20 years of functional
imaging experiments, to make inferences about the impli-
cations of the fMRI patterns, insofar as the ageing process is
concerned. Our conclusions about the fMRI effects due to
ageing in M.I. rest on a solid behavioural observation.
Namely, the temporal correspondence between executed and
imagined movements is reduced in elderly adults, especially
for movements that impose high spatiotemporal or dynamic
5 A common objection to the concept of M.I. and its motoric nature
as demonstrated by functional neuroimaging is that experimenters
may occasionally miss small muscle contractions or even quasi-
movements that their volunteers make during tasks. Similar to
Jeannerod and Decety (1995), we conceptualise M.I. as a form of
cognitive motor rehearsal deprived from an explicit motor outflow.
For us, the occasional presence of a green light to spinal motor
neurons that manifests itself with occasional motor twitches does not
detract from the quality of the mental process under investigation. In
addition, the exploration of the neurofunctional activations recorded
during M.I. and the direct comparison with the neural activity of the
executed motor task reinforces our suggestion. As in previous
experiments, we observed commonalities and differences to strongly
suggest the following: (1) the likely motoric nature of M.I. given the
activation of motor/premotor cortices; (2) the much larger imple-
mentation of actual motor acts during M.E. (see the highly significant
larger activation of M1/S1 in the M.E. task); and (3) the more
cognitive nature of the M.I. task overall, as revealed by the
recruitment of higher order premotor and parietal cortices during
imagery, particularly in the younger participants.
Exp Brain Res
123
constraints. This has previously been observed for a variety
of tasks, such as pointing (Skoura et al. 2008), lifting one arm
(Personnier et al. 2008), or even walking (Skoura et al. 2005).
All of these tasks are explicit M.I. tasks, but similar findings
are on record even for implicit M.I. tasks, such as the hand-
laterality judgement task (Saimpont et al. 2009). Our
experiment shows that the ageing effect is also present for a
finger opposition task. The functional implications of these
findings and the underlying mechanisms remain to be
established. Personnier et al. (2008) have proposed that
elderly subjects may lack the ability to ‘‘efficiently make use
of internal models of action for the generation of accurate
motor predictions’’. This proposal, based on a behavioural
experiment inspired by forward models of motor control, is
based on the degraded correlation between the durations of
executed and imagined movements, particularly when sub-
jects imagined a limb loaded with a weight. The same
experiment, however, cannot answer the question of whether
elderly subjects also make significant use of a qualitatively
different strategy when dealing with M.I. tasks. Our findings
support this possibility: we found significant neurofunctional
differences between young and elderly subjects during the
M.I. task; these differences were manifested as the hyper-
activation of the brains of older subjects, primarily in the
occipito-temporo-parietal areas.
In previous neuroimaging studies, the involvement of
the primary visual area and the extrastriate cortices (the
inferior occipital gyrus and the calcarine fissure) was
associated with visual imagery tasks (Bartolomeo 2008;
Ganis et al. 2004; Kosslyn et al. 1995); the focal rTMS
inhibition of visual cortices, starting from area V1, ham-
pers visual imagery in normal subjects (Kosslyn et al.
1999).6
Hyperactivation also occurred in the superior parietal
cortices, regions that have also been associated with the
generation of mental images (Ishai et al. 2000), spatial
mental imagery and mental navigation (Mellet et al. 1998),
even in subjects in apparent vegetative states (Owen et al.
2006). More specifically, does our experiment offer evi-
dence of a departure from a strict kinaesthetic strategy to a
complementary visual strategy in the elderly? This possi-
bility has been already considered using behavioural
investigations. Mulder et al. (2007) used a 24-item ques-
tionnaire concerning 24 actions in a cohort of 333 subjects.
The participants were invited to imagine these actions
either from a first-person perspective (kinaesthetic imagery
condition) or as if a third actor was performing the
movement (visual imagery condition). The results showed
that there was a significant difference between elderly and
young subjects in the kinaesthetic imagery condition, while
no difference emerged in the visual imagery condition.
These results suggest that there might be an age-related
shift from a motor imagery based on a first-person modality
to a motor imagery based on a third-person perspective.
The functional properties of the cortices that showed
greater activation during M.I. in the elderly are consistent
with the aforementioned psychological data, based on
introspective considerations. The primary visual cortex and
early extrastriate cortices are retinotopically organised
brain regions (Mendola et al. 1999; Sereno et al. 1994; Zeki
et al. 1991). However, the current literature on the contri-
bution of visual strategies to M.I. also makes the distinction
between a first-person and third-person perspective (see for
example Guillot et al. 2009). In the former case, the visual
mental imagery can be compared to that of someone who is
mentally observing her/his hands according to egocentri-
cally oriented coordinates; in the latter case, the visual
imagery activity may imply imagining the hand of an actor
performing a motor task according to an allocentrically
oriented (hence third person) perspective. Our data do not
allow us to make this subtle distinction. Rather, they may
suggest that both of these forms contributed to visual M.I.
in our sample of the elderly subjects. In fact, the elderly
subjects showed additional activations in cortical regions
whose stereotactic coordinates are compatible with those of
the so-called extrastriate body area (see Hodzic et al. 2009;
Saxe et al. 2006); this area has been previously associated
specifically with images of body parts presented from an
allocentric perspective (Saxe et al. 2006). On the other
hand, some of the visual cortical activations of the elderly
were in regions similar to those described by Guillot et al.
(2009), who showed the specific recruitment of the occip-
ital lobe during a visual imagery task performed from an
egocentric perspective by young participants. Our inter-
pretation of the changing strategies used by the elderly is
also reinforced by the differences in the correlations of the
6 Our interpretation of the quality of mental imagery in the elderly
relies on the distinctive fMRI patterns of the older subjects. We
consider these an explicit neural signature because of the topograph-
ical distribution in occipital cortices of well-known functional
properties. In principle, one could have used introspective descrip-
tions of the M.I. experience to document departures from kinaesthetic
imagery to visual imagery and used these departures to decipher the
fMRI patterns. However, one may argue that there is no guarantee
that introspective descriptions about the accuracy or style of the
imagery procedure would be accurate. More crucially, the combina-
tion of introspective online descriptions of the quality of the imagery
experience during fMRI would have changed the nature of our
experiment quite dramatically by turning it into a meta-cognitive
protocol about M.I., something very interesting but different from our
intended scope. On the other hand, the post hoc correlation of the
introspective descriptions with the fMRI activity would have proved
temporally inaccurate and possibly difficult to analyse statistically.
On the contrary, in our experiment, the emphasis was on explicitly
measurable variables, such as the chronometric measures during M.E.
and M.I. outside the scanner or the fMRI signal collected during
standardised procedures and the ensuing correlations between the two
sets of variables.
Exp Brain Res
123
behavioural data with the fMRI data observed for young
and elderly subjects.
In the elderly, there was a significant correlation
between the time discrepancy (calculated as M.I - M.E.)
and the occipito-parietal areas that were more strongly
activated compared to the younger participants. This rein-
forces the connection between the fMRI data and the
behavioural data.
However, the same analysis for the younger participants
revealed a correlation between the same behavioural
parameter and the activity in the supplementary motor
cortex. While the overall fMRI patterns do not represent
the ideal double anatomical dissociation of classical neu-
ropsychology,7 we interpret this finding as an indication
that younger subjects stick to a motor strategy when invited
to imagine a motor movements, even when this strategy is
time-consuming. The longer the M.I. duration, the greater
the neural labour and the greater the BOLD response in the
brain regions associated with motor control.
It is more complex, and most likely out of our reach for
the present study, to explain why elderly subjects also rely
on a complementary ‘‘visual’’8 strategy when they are
invited to mentally rehearse motor movements. Here, we
can offer some preliminary educated guesses and working
hypotheses. We know that the decreased temporal corre-
spondence between imagined and executed movements in
the elderly cannot be explained by a generalised deterio-
ration of their motor systems, as we found that the mean
duration of real movements did not significantly differ
from those of young subjects. Similar findings have been
reported for M.E. by others (e.g., Personnier et al. 2008).
Having excluded generalised motor decline as an expla-
nation, there are two competing theories. Motor rehearsal
in the elderly may decline (a) because sensory information
from the periphery is not as efficiently available to the
motor system during M.I. as it is during the actual execu-
tion of movements and might prevent the elderly subjects
from verifying whether the imagined movements are sim-
ilar to the actual ones (Saimpont et al. 2009; Skoura et al.
2008; Zwergal et al. 2012) or (b) because feed-forward
simulations of motor movements become less effective
(Personnier et al. 2008). To the best of our knowledge,
while the data collected by Personnier et al. (2008) support
the second hypothesis, there is no evidence to discount the
importance of the former. It may well be that the decreased
efficiency in proprioceptive monitoring may have a domino
effect on the fine-tuning of the motor system and its ability
to simulate motor acts, even when proprioceptive feedback
is not indispensable, such as during M.I.9 Of course, one
should expect that normal ageing will partially affect either
somatosensory feedback or feed-forward motor control, but
normal ageing is not associated with a generalised inability
to respond to incoming somatosensory signals or to make
predictions about the state of the motor system.
Our study leaves a number of outstanding issues
For example, it may be useful to complement fMRI studies
based on measurements of the evoked hemodynamic
response with a virtual lesional approach using rTMS on
the cortical sites identified by our study to causally link
certain fMRI findings with behavioural findings.
Another outstanding issue is whether mental and/or
physical training may help to make the M.I. behavioural
and functional anatomical patterns of elderly subjects more
similar to those of younger subjects. This may also have
implications for rehabilitation, an area where M.I. tech-
niques are increasingly used (Ietswaart et al. 2011; Jackson
et al. 2004; Johnson-Frey 2004; Liu et al. 2004; Malouin
et al. 2004; Page et al. 2001). Further studies are needed to
address these issues.
Acknowledgments We thank the staff of the Department of Diag-
nostic Radiology and Bioimages of IRCCS Galeazzi and the
Department of Neuroradiology of Niguarda Hospital.
References
Ashburner J, Friston K (1999) Nonlinear spatial normalization using
basis functions. Hum Brain Mapp 7(4):254–266
Bartolomeo P (2008) The neural correlates of visual mental imagery:
an ongoing debate. Cortex 44(2):107–108
Berlingeri M, Bottini G, Danelli L, Ferri F, Traficante D, Sacheli L,
Colombo N, Sberna M, Sterzi R, Scialfa G, Paulesu E (2010)
With time on our side? Task-dependent compensatory processes
in graceful aging. Exp Brain Res 205(3):307–324
Bonda E, Petrides M, Ostry D, Evans A (1996) Specific involvement
of human parietal systems and the amygdala in the perception of
biological motion. J Neurosci 16:3737–3744
Buckner RL (2004) Memory and executive function in aging and AD:
multiple factors that cause decline and reserve factors that
compensate. Neuron 44(1):195–208
Cabeza R (2002) Hemispheric asymmetry reduction in older adults:
the HAROLD model. Psychol Aging 17(1):85–100
Cabeza R, Anderson ND, Locantore JK, McIntosh AR (2002) Aging
gracefully: compensatory brain activity in high-performing older
adults. Neuroimage 17(3):1394–1402
7 We cannot claim evidence for a double functional anatomical
dissociation, as we did not find significantly greater activations in
motor-related structures in the younger subjects. Indeed, while the
elderly subjects had greater activations in the occipital cortices, they
still relied, in part, on the activity of motor cortices during M.I.8 It is worth reemphasising that the elderly also showed activation of
the premotor cortices during their M.I. task. Therefore, we suggest
that the ‘‘visual’’ mental imagery testified by the occipital additional
activation might be a complementary strategy, rather than a
completely alternative one.
9 A similar interpretation was given by Zwergal et al. (2012) in a
fMRI study on M.I. during imagined locomotion.
Exp Brain Res
123
Calautti C, Serrati C, Baron JC (2001) Effects of age on brain
activation during auditory-cued thumb-to-index opposition: a
positron emission tomography study. Stroke 32(1):139–146
Carlesimo GA, Buccione I, Fadda L, Graceffa A, Mauri M, Lorusso
S, Bevilacqua G et al (2002) Standardizzazione di due test di
memoria per uso clinico: Breve Racconto e Figura di Rey.
Nuova Riv Neurol 12:1–13
Catalan MJ, Honda M, Weeks RA, Cohen LG, Hallett M (1998) The
functional neuroanatomy of simple and complex sequential
finger movements: a PET study. Brain 121(2):253–264
Chan RC, Huang J, Di X (2009) Dexterous movement complexity and
cerebellar activation: a meta-analysis. Brain Res Rev 59(2):
316–323
Coats RO, Wann JP (2011) The reliance on visual feedback control by
older adults is highlighted in tasks requiring precise endpoint
placement and precision grip. Exp Brain Res 214(1):139–150
Conson M, Sacco S, Sara M, Pistoia F, Grossi D, Trojano L (2008)
Selective motor imagery defect in patients with locked-in
syndrome. Neuropsychologia 46(11):2622–2628
Davis SW, Dennis NA, Daselaar SM, Fleck MS, Cabeza R (2008)
Que PASA? The posterior–anterior shift in aging. Cereb Cortex
18(5):1201–1209
de Lange FP, Hagoort P, Toni I (2005) Neural topography and content
of movement representations. J Cogn Neurosci 17(1):97–112
Deblieck C, Pesenti G, Scifo P, Fazio F, Bricolo E, Lo Russo G,
Scialfa G, Cossu M, Bottini G, Paulesu E (2003) Preserved
functional competence of perilesional areas in drug-resistant
epilepsy with lesion in supplementary motor cortex: fMRI and
neuropsychological observations. Neuroimage 20(4):2225–2234
Decety J (1996) The neurophysiological basis of motor imagery.
Behav Brain Res 77(1–2):45–52
Decety J, Jeannerod M (1995) Mentally simulated movements in
virtual reality: does Fitts’s law hold in motor imagery? Behav
Brain Res 72(1–2):127–134
Decety J, Jeannerod M, Prablanc C (1989) The timing of mentally
represented actions. Behav Brain Res 34(1–2):35–42
Deiber MP, Ibanez V, Honda M, Sadato N, Raman R, Hallett M
(1998) Cerebral processes related to visuomotor imagery and
generation of simple finger movements studied with positron
emission tomography. Neuroimage 7(2):73–85. doi:10.1006/nimg.
1997.0314
Dickstein R, Deutsch JE (2007) Motor imagery in physical therapist
practice. Phys Ther 87(7):942–953
Folstein MF, Folstein SE, McHugh PR (1975) ‘‘Mini-mental state’’. A
practical method for grading the cognitive state of patients for
the clinician. J Psychiatr Res 12(3):189–198
Friston K, Ashburner J, Frith C, Poline J, Heather J, Frackowiak RSJ
(1995) Spatial registration and normalization of images. Hum
Brain Mapp 2:165–189
Friston K, Holmes A, Price C, Buchel C, Worsley K (1999)
Multisubject fMRI studies and conjunction analyses. NeuroIm-
age 10(4):385–396
Ganis G, Thompson WL, Kosslyn SM (2004) Brain areas underlying
visual mental imagery and visual perception: an fMRI study.
Brain Res Cogn Brain Res 20(2):226–241
Georgopoulos AP, Massey JT (1987) Cognitive spatial-motor
processes. 1. The making of movements at various angles from
a stimulus direction. Exp Brain Res 65(2):361–370
Gerardin E, Sirigu A, Lehericy S, Poline JB, Gaymard B, Marsault C,
Agid Y, Le Bihan D (2000) Partially overlapping neural
networks for real and imagined hand movements. Cereb Cortex
10(11):1093–1104
Giovagnoli AR, Del Pesce M, Mascheroni S, Simoncelli M, Laiacona
M, Capitani E (1996) Trail making test: normative values from
287 normal adult controls. Ital J Neurol Sci 17(4):305–309
Grady CL, Maisog JM, Horwitz B, Ungerleider LG, Mentis MJ,
Salerno JA, Pietrini P, Wagner E, Haxby JV (1994) Age-related
changes in cortical blood flow activation during visual process-
ing of faces and location. J Neurosci 14(3 Pt 2):1450–1462
Grezes J, Costes N, Decety J (1998) Top-down effect of strategy on
the perception of human biological motion: a PET investigation.
Cogn Neuropsychol 15:553–582
Guillot A, Collet C (2005) Duration of mentally simulated movement:
a review. J Mot Behav 37(1):10–20. doi:10.3200/JMBR.37.
1.10-20
Guillot A, Collet C, Nguyen VA, Malouin F, Richards C, Doyon J
(2009) Brain activity during visual versus kinesthetic imagery:
an fMRI study. Hum Brain Mapp 30(7):2157–2172
Hanakawa T, Immisch I, Toma K, Dimyan M, Van Gelderen P,
Hallett M (2003) Functional properties of brain areas associated
with motor execution and imagery. J Neurophysiol 89(2):
989–1002
Heuninckx S, Wenderoth N, Debaere F, Peeters R, Swinnen SP
(2005) Neural basis of aging: the penetration of cognition into
action control. J Neurosci 25(29):6787–6796
Hodzic A, Muckli L, Singer W, Stirn A (2009) Cortical responses to
self and others. Hum Brain Mapp 30(3):951–962. doi:10.1002/
hbm.20558
Holmes A, Friston K (1998) Generalisability, random effects and
population inference. NeuroImage 7:S754
Hovington CL, Brouwer B (2010) Guided motor imagery in healthy
adults and stroke: does strategy matter? Neurorehabil Neural
Repair 24(9):851–857
Hutchinson S, Kobayashi M, Horkan CM, Pascual-Leone A, Alex-
ander MP, Schlaug G (2002) Age-related differences in move-
ment representation. Neuroimage 17(4):1720–1728
Hutsler J, Galuske RA (2003) Hemispheric asymmetries in cerebral
cortical networks. Trends Neurosci 26(8):429–435. doi:
10.1016/S0166-2236(03)00198-X
Ietswaart M, Johnston M, Dijkerman HC, Joice S, Scott CL,
MacWalter RS, Hamilton SJ (2011) Mental practice with motor
imagery in stroke recovery: randomized controlled trial of
efficacy. Brain 134(Pt 5):1373–1386
Ishai A, Ungerleider LG, Haxby JV (2000) Distributed neural systems
for the generation of visual images. Neuron 28(3):979–990
Jackson PL, Doyon J, Richards CL, Malouin F (2004) The efficacy of
combined physical and mental practice in the learning of a foot-
sequence task after stroke: a case report. Neurorehabil Neural
Repair 18(2):106–111
Jeannerod M (2001) Neural simulation of action: a unifying
mechanism for motor cognition. Neuroimage 14(1 Pt 2):S103–
S109
Jeannerod M, Decety J (1995) Mental motor imagery: a window into
the representational stages of action. Curr Opin Neurobiol
5(6):727–732
Jeannerod M, Frak V (1999) Mental imaging of motor activity in
humans. Curr Opin Neurobiol 9(6):735–739
Johnson-Frey SH (2004) Stimulation through simulation? Motor
imagery and functional reorganization in hemiplegic stroke
patients. Brain Cogn 55(2):328–331
Kalisch T, Ragert P, Schwenkreis P, Dinse HR, Tegenthoff M (2009)
Impaired tactile acuity in old age is accompanied by enlarged
hand representations in somatosensory cortex. Cereb Cortex
19(7):1530–1538
Kauranen K, Vanharanta H (1996) Influences of aging, gender, and
handedness on motor performance of upper and lower extrem-
ities. Percept Mot Skills 82(2):515–525
Kosslyn SM, Thompson WL, Kim IJ, Alpert NM (1995) Topograph-
ical representations of mental images in primary visual cortex.
Nature 378(6556):496–498
Exp Brain Res
123
Kosslyn SM, Pascual-Leone A, Felician O, Camposano S, Keenan JP,
Thompson WL, Ganis G, Sukel KE, Alpert NM (1999) The role
of area 17 in visual imagery: convergent evidence from PET and
rTMS. Science 284(5411):167–170
Lafleur MF, Jackson PL, Malouin F, Richards CL, Evans AC, Doyon
J (2002) Motor learning produces parallel dynamic functional
changes during the execution and imagination of sequential foot
movements. Neuroimage 16(1):142–157. doi:10.1006/nimg.
2001.1048
Lau HC, Rogers RD, Haggard P, Passingham RE (2004) Attention to
intention. Science 303(5661):1208–1210
Lenz M, Tegenthoff M, Kohlhaas K, Stude P, Hoffken O, Gatica
Tossi MA, Kalisch T, Dinse HR (2012) Increased excitability of
somatosensory cortex in aged humans is associated with
impaired tactile acuity. J Neurosci 32(5):1811–1816
Leonard G, Tremblay F (2007) Corticomotor facilitation associated
with observation, imagery and imitation of hand actions: a
comparative study in young and old adults. Exp Brain Res
177(2):167–175
Liu KP, Chan CC, Lee TM, Hui-Chan CW (2004) Mental imagery for
relearning of people after brain injury. Brain Inj 18(11):
1163–1172
Lotze M, Cohen LG (2006) Volition and imagery in neurorehabil-
itation. Cogn Behav Neurol 19(3):135–140
Lule D, Diekmann V, Kassubek J, Kurt A, Birbaumer N, Ludolph
AC, Kraft E (2007) Cortical plasticity in amyotrophic lateral
sclerosis: motor imagery and function. Neurorehabil Neural
Repair 21(6):518–526
Lumer ED, Friston KJ, Rees G (1998) Neural correlates of perceptual
rivalry in the human brain. Science 280(5371):1930–1934
Malouin F, Richards CL, Doyon J, Desrosiers J, Belleville S (2004)
Training mobility tasks after stroke with combined mental and
physical practice: a feasibility study. Neurorehabil Neural Repair
18(2):66–75
Malouin F, Richards CL, Durand A (2010) Normal aging and motor
imagery vividness: implications for mental practice training in
rehabilitation. Arch Phys Med Rehabil 91(7):1122–1127
Mattay VS, Fera F, Tessitore A, Hariri AR, Das S, Callicott JH,
Weinberger DR (2002) Neurophysiological correlates of age-
related changes in human motor function. Neurology 58(4):
630–635
Mellet E, Petit L, Mazoyer B, Denis M, Tzourio N (1998) Reopening
the mental imagery debate: lessons from functional anatomy.
Neuroimage 8(2):129–139
Mendola JD, Dale AM, Fischl B, Liu AK, Tootell RB (1999) The
representation of illusory and real contours in human cortical
visual areas revealed by functional magnetic resonance imaging.
J Neurosci 19(19):8560–8572
Mulder T (2007) Motor imagery and action observation: cognitive
tools for rehabilitation. J Neural Transm 114(10):1265–1278
Mulder T, Hochstenbach JB, van Heuvelen MJ, den Otter AR (2007)
Motor imagery: the relation between age and imagery capacity.
Hum Mov Sci 26(2):203–211
Nachev P, Kennard C, Husain M (2008) Functional role of the
supplementary and pre-supplementary motor areas. Nat Rev
Neurosci 9(11):856–869
Nedelko V, Hassa T, Hamzei F, Weiller C, Binkofski F, Schoenfeld
MA, Tuscher O, Dettmers C (2010) Age-independent activation
in areas of the mirror neuron system during action observation
and action imagery. A fMRI study. Restor Neurol Neurosci
28(6):737–747
Novelli G, Papagno C, Capitani E, Laiacona M, Vallar G, Cappa SF
(1986) Three clinical tests for the assessment of verbal long-term
memory function: norms from 320 normal subjects. Arch Psicol
Neurol Psichiatr 47:278–296
O’Craven KM, Kanwisher N (2000) Mental imagery of faces and
places activates corresponding stiimulus-specific brain regions.
J Cogn Neurosci 12(6):1013–1023
Oldfield RC (1971) The assessment and analysis of handedness: the
Edinburgh inventory. Neuropsychologia 9(1):97–113
Orsini A, Grossi D, Capitani E, Laiacona M, Papagno C, Vallar G
(1987) Verbal and spatial immediate memory span: normative
data from 1355 adults and 1112 children. Ital J Neurol Sci
8(6):539–548
Owen AM, Coleman MR, Boly M, Davis MH, Laureys S, Pickard JD
(2006) Detecting awareness in the vegetative state. Science
313(5792):1402
Page SJ, Levine P, Sisto S, Johnston MV (2001) A randomized
efficacy and feasibility study of imagery in acute stroke. Clin
Rehabil 15(3):233–240
Park DC, Reuter-Lorenz P (2009) The adaptive brain: aging and
neurocognitive scaffolding. Annu Rev Psychol 60:173–196
Pascual-Leone A, Nguyet D, Cohen LG, Brasil-Neto JP, Cammarota
A, Hallett M (1995) Modulation of muscle responses evoked by
transcranial magnetic stimulation during the acquisition of new
fine motor skills. J Neurophysiol 74(3):1037–1045
Penny W, Holmes AP (2004) Random-effects analysis. In: Frac-
kowiak RJS et al. (eds) Human brain function. Elsevier, San
Diego, pp 843–850
Personnier P, Paizis C, Ballay Y, Papaxanthis C (2008) Mentally
represented motor actions in normal aging II. The influence of
the gravito-inertial context on the duration of overt and covert
arm movements. Behav Brain Res 186(2):273–283
Personnier P, Ballay Y, Papaxanthis C (2010a) Mentally represented
motor actions in normal aging: III. Electromyographic features
of imagined arm movements. Behav Brain Res 206(2):184–191
Personnier P, Kubicki A, Laroche D, Papaxanthis C (2010b)
Temporal features of imagined locomotion in normal aging.
Neurosci Lett 476(3):146–149
Phothisonothai M, Nakagawa M (2009) A classification method of
different motor imagery tasks based on fractal features for brain-
machine interface. J Integr Neurosci 8(1):95–122
Raven J (1984) CPM. Coloured Progressive Matrices. OS, Firenze
Rizzolatti G, Craighero L (2004) The mirror-neuron system. Annu
Rev Neurosci 27:169–192
Saimpont A, Pozzo T, Papaxanthis C (2009) Aging affects the mental
rotation of left and right hands. PLoS One 4(8):e6714
Saxe R, Jamal N, Powell L (2006) My body or yours? The effect of
visual perspective on cortical body representations. Cereb Cortex
16(2):178–182. doi:10.1093/cercor/bhi095
Seghier ML (2008) Laterality index in functional MRI: methodolog-
ical issues. Magn Reson Imaging 26(5):594–601. doi:10.1016/j.
mri.2007.10.010
Sereno MI, McDonald CT, Allman JM (1994) Analysis of retinotopic
maps in extrastriate cortex. Cereb Cortex 4(6):601–620
Sirigu A, Duhamel JR, Cohen L, Pillon B, Dubois B, Agid Y (1996)
The mental representation of hand movements after parietal
cortex damage. Science 273(5281):1564–1568
Skoura X, Papaxanthis C, Vinter A, Pozzo T (2005) Mentally
represented motor actions in normal aging. I. Age effects on the
temporal features of overt and covert execution of actions. Behav
Brain Res 165(2):229–239
Skoura X, Personnier P, Vinter A, Pozzo T, Papaxanthis C (2008)
Decline in motor prediction in elderly subjects: right versus left
arm differences in mentally simulated motor actions. Cortex
44(9):1271–1278
Smith CD, Umberger GH, Manning EL, Slevin JT, Wekstein DR,
Schmitt FA, Markesbery WR, Zhang Z, Gerhardt GA, Kryscio
RJ, Gash DM (1999) Critical decline in fine motor hand
movements in human aging. Neurology 53(7):1458–1461
Exp Brain Res
123
Spinnler H, Tognoni G (1987) Standardizzazione e taratura italiana di
test neuropsicologici. Masson Italia Periodici, Milano
Stenekes MW, Geertzen JH, Nicolai JP, De Jong BM, Mulder T
(2009) Effects of motor imagery on hand function during
immobilization after flexor tendon repair. Arch Phys Med
Rehabil 90(4):553–559
Stephan KM, Fink GR, Passingham RE, Silbersweig D, Ceballos-
Baumann AO, Frith CD, Frackowiak RS (1995) Functional
anatomy of the mental representation of upper extremity
movements in healthy subjects. J Neurophysiol 73(1):373–386
Stevens JA (2005) Interference effects demonstrate distinct roles for
visual and motor imagery during the mental representation of
human action. Cognition 95(3):329–350
Strauss E, Kosaka B, Wada J (1983) The neurobiological basis of
lateralized cerebral function. A review. Hum Neurobiol 2(3):
115–127
Vogt S (1995) On relations between perceiving, imagining and
performing in the learning of cyclical movement sequences. Br J
Psychol 86(Pt 2):191–216
Ward NS, Frackowiak RS (2003) Age-related changes in the neural
correlates of motor performance. Brain 126(Pt 4):873–888
Wechsler D (1945) A standardized memory scale for clinical use.
J Psychol 19:87–95
Witt ST, Laird AR, Meyerand ME (2008) Functional neuroimaging
correlates of finger-tapping task variations: an ALE meta-
analysis. Neuroimage 42(1):343–356
Worsley K, Friston K (1995) Analysis of fMRI time-series revisited—
again. NeuroImage 2:173–181
Worsley K, Friston K (2000) A test for a conjunction. Stat Probab
Lett 47:135–140
Worsley K, Marrett S, Neelin P, Vandal A, Friston K, Evans A (1996)
A unified statistical approach for determining significant voxels
in images of cerebral activation. Hum Brain Mapp 4:58–73
Wu T, Hallett M (2005) The influence of normal human ageing on
automatic movements. J Physiol 562(Pt 2):605–615
Yue G, Cole KJ (1992) Strength increases from the motor program:
comparison of training with maximal voluntary and imagined
muscle contractions. J Neurophysiol 67(5):1114–1123
Zeki S, Watson JD, Lueck CJ, Friston KJ, Kennard C, Frackowiak RS
(1991) A direct demonstration of functional specialization in
human visual cortex. J Neurosci 11(3):641–649
Zwergal A, Linn J, Xiong G, Brandt T, Strupp M, Jahn K (2012)
Aging of human supraspinal locomotor and postural control in
fMRI. Neurobiol Aging 33(6):1073–1084
Exp Brain Res
123
Related Documents