MEMORANDUM November 7, 2012 TO: Board Members FROM: Terry B. Grier, Ed.D. Superintendent of Schools SUBJECT: ADVANCED PLACEMENT (AP) REPORT: 2011–2012 CONTACT: Carla Stevens, Research and Accountability, 713-556-6700 The Department of Research and Accountability has completed the 2011–2012 Advanced Placement (AP) Report. The AP program directly supports HISD’s Strategic Direction for Core Initiative 3: Rigorous Instructional Standards and Supports. The AP Program provides high school students with the opportunity to take college-level courses and earn college credit. A possible 37 AP exams are offered in 22 subject areas, and exams are administered over a two week period each year in May. The AP grade scale ranges from 1 to 5, and a score of 3 or higher qualifies a student to earn advanced placement, college credit, or both. Some key findings are as follows: Over the past six years, the number of Advanced Placement (AP) exams taken by HISD high-school students has increased from 9,088 in 2007 to 23,227 in 2012. While the number of exams scored at a 3 or higher has increased from 4,304 in 2007 to 7,106 in 2012 at the high-school level, the percentage has decreased from 47 percent in 2007 to 31 percent in 2012. For the district as a whole in 2012, 11,543 out of 32,184, or 36% of students in grades 10-12 were enrolled in at least one AP course. Of students enrolled in an AP course, 10,573 completed at least one AP course (92%). In 2012, Hispanic and African American students represented the largest student groups in grades 10 through 12; however, far fewer than half Hispanic and African American students were enrolled in an AP course. By contrast, more than half of White and Asian American students in grades 10-12 were enrolled in at least one AP course. Eighty-nine percent of AP exams that were scored at a 3 or higher were linked to students who received an A or B in the AP course. Of the 13,354 AP course grades of either A or B, 37 percent were linked to students who scored at or above a 3 on the AP exam. For the classes of 2010 and 2011, HISD trailed Texas and the nation in the percentage of graduates who passed an AP exam with a score of 3 or higher. However, in 2011, HISD outperformed the state and the nation in the percentage of graduates who took an AP exam at some point in their high school career.

Welcome message from author
This document is posted to help you gain knowledge. Please leave a comment to let me know what you think about it! Share it to your friends and learn new things together.
Transcript

MEMORANDUM November 7, 2012 TO: Board Members FROM: Terry B. Grier, Ed.D.
Superintendent of Schools SUBJECT: ADVANCED PLACEMENT (AP) REPORT: 2011–2012 CONTACT: Carla Stevens, Research and Accountability, 713-556-6700
The Department of Research and Accountability has completed the 2011–2012 Advanced Placement (AP) Report. The AP program directly supports HISD’s Strategic Direction for Core Initiative 3: Rigorous Instructional Standards and Supports. The AP Program provides high school students with the opportunity to take college-level courses and earn college credit. A possible 37 AP exams are offered in 22 subject areas, and exams are administered over a two week period each year in May. The AP grade scale ranges from 1 to 5, and a score of 3 or higher qualifies a student to earn advanced placement, college credit, or both. Some key findings are as follows:
Over the past six years, the number of Advanced Placement (AP) exams taken by HISD high-school students has increased from 9,088 in 2007 to 23,227 in 2012.
While the number of exams scored at a 3 or higher has increased from 4,304 in 2007 to 7,106 in 2012 at the high-school level, the percentage has decreased from 47 percent in 2007 to 31 percent in 2012.
For the district as a whole in 2012, 11,543 out of 32,184, or 36% of students in grades
10-12 were enrolled in at least one AP course. Of students enrolled in an AP course,
10,573 completed at least one AP course (92%).
In 2012, Hispanic and African American students represented the largest student groups
in grades 10 through 12; however, far fewer than half Hispanic and African American
students were enrolled in an AP course. By contrast, more than half of White and Asian
American students in grades 10-12 were enrolled in at least one AP course.
Eighty-nine percent of AP exams that were scored at a 3 or higher were linked to
students who received an A or B in the AP course. Of the 13,354 AP course grades of
either A or B, 37 percent were linked to students who scored at or above a 3 on the AP
exam.
For the classes of 2010 and 2011, HISD trailed Texas and the nation in the percentage
of graduates who passed an AP exam with a score of 3 or higher. However, in 2011,
HISD outperformed the state and the nation in the percentage of graduates who took an
AP exam at some point in their high school career.

Administrative Response Houston ISD’s Advanced Placement program continues to focus on providing professional development based on the data indicated in this report as well as what teachers have indicated they need. By working directly with organizations such as College Board and Laying the Foundation, training offered for Pre-AP and AP teachers provides direct instruction on strategies that assist students. In addition, HISD has begun hosting AP Professional Learning Communities for HISD AP teachers to participate in throughout the year. Led by highly effective HISD AP teachers, this program provides participants the opportunity to share best practices and ideas for the AP classroom in 16 different AP subjects. The district’s efforts to provide teachers with specific professional development are also aligned to HISD’s AP results. The growth in HISD’s AP numbers for both participation and performance are an indication of the dedication of HISD AP teachers, administrators and students who have come to understand the importance of this program. Attached is the complete report including an analysis of districtwide results as well as for all HISD schools that had participating students. Data presented include AP course enrollment, AP course completion, and AP exam participation and performance. Results were analyzed by grade, race/ethnicity, and gender.
__TBG
Attachment cc: Superintendent’s Direct Reports
Chief School Officers School Improvement Officers Alan Summers Nefertari Mundy Estibaliz E. Arriaga High School Principals

RESEARCHE d u c a t i o n a l P r o g r a m R e p o r t
D e pa r t m e n t o f r e s e a r c h a n D a c c o u n ta b i l i t yh o u s t o n i n D e p e n D e n t s c h o o l D i s t r i c t
Advanced Placement (AP)Report 2011-2012

2012 Board of Education
Michael L. Lunceford
PRESIDENT
Anna Eastman
FIRST VICE PRESIDENT
Juliet Stipeche
SECOND VICE PRESIDENT
Rhonda Skillern-Jones
SECRETARY
Greg Meyers
ASSISTANT SECRETARY
Paula M. Harris
Lawrence Marshall
Harvin C. Moore
Manuel Rodriguez, Jr.
Terry B. Grier, Ed. D.
SUPERINTENDENT OF SCHOOLS
Carla Stevens
ASSISTANT SUPERINTENDENT
DEPARTMENT OF RESEARCH AND
ACCOUNTABILITY
Daniel Taylor
Chih-Hsun Huang, Ed.D.
RESEARCH SPECIALIST
Renmin Ye
INTERMEDIATE APPLICATIONS
DEVELOPER
Ed La Sage
RESEARCH MANAGER
Houston Independent School District
Hattie Mae White Educational Support Center
4400 West 18th Street
Houston, Texas 77092-8501
www.houstonisd.org
It is the policy of the Houston Independent School
District not to discriminate on the basis of age, color,
handicap or disability, ancestry, national origin,
marital status, race, religion, sex, veteran status, or
political affiliation in its educational or employment
programs and activities.

Advanced Placement 2011–2012
Introduction
The College Board’s Advanced Placement (AP) Program provides participating high school students
with the opportunity to take college-level courses and earn college credit, advanced placement, or both. A possible 37 examinations, covering 22 subject areas, are administered in May at participating schools. Ninety percent of colleges and universities grant credit, placement, or both to students receiving a qualifying score (usually 3 or higher on a scale of 1 to 5) on an AP exam.
Studies show that students who take AP courses and exams are more likely to succeed in college. Families may also experience financial benefits if their child receives advanced placement, college credit or both. Other benefits afforded to students include opportunities that lead to scholarships or recognition. The Siemens Awards for Advanced Placement is a scholarship with an award ranging from $2,000 to $5,000 given to two students (one male and one female) from each of the 50 states, and the AP program also offers a number of Scholar Awards to AP students who have shown outstanding achievement, which is acknowledged on any grade report that is sent to colleges the following fall. In addition, teachers involved in the AP program benefit from professional development opportunities such as workshops and Summer Institutes (College Board, AP Central, 2008g).
For the 2011–2012 school year, all courses labeled as “AP” by HISD were authorized through the College Board AP Course Audit process. This audit process will ensure that quality courses meeting “AP” requirements are being offered, and that colleges and universities have a venue to review authorized courses offered by secondary schools (College Board, AP Central, 2008f).
Administration
The Educational Testing Services (ETS) mails out the AP exams along with other exam-related materials to participating schools in April or early May. The AP exams are administered each year in May over a two-week period. Once testing is completed, all AP exams are returned to ETS.
Scoring
Each examination subject is graded on a scale of 1 (No recommendation) to 5 (Extremely well qualified). Typically, scores of 3 or above qualify a student to receive advanced placement, college credit, or both. Multiple-choice sections are scored by computer. The free-response section is typically scored using a three-step process: development of preliminary scoring standards, establishment of final scoring standards, and the reading. AP examinations may be compared from one year to another through equating (College Board, AP Central, 2004).
Methods
Data Limitations The College Board receives AP data from the Educational Testing Service (ETS). It is important to
understand that the extracts are made from a “live” database that changes from one day to the next as scoring and adjustments to individual student records progresses in the months following the examination administration. Therefore, discrepancies may exist between the three sources of data that are used for AP exam reporting purposes, namely the College Board Reports (hard copy), the AP Online Score Reports, and the College Board (electronic) data file based on the time of the data extract. AP data for prior years were extracted from the most recent, updated files available at the time of the present report, and data for the current school year were extracted from the July 30, 2012 electronic files.

HISD RESEARCH AND ACCOUNTABILITY ________________________________________________________________________________________________________
2 __________
To provide disaggregated student level demographic information, the College Board AP electronic databases were matched to the Public Education Information Management System (PEIMS) database, and the Chancery End-of-Year (EOY) data files. Since the PEIMS database reflects a snapshot taken on the last Friday in October, those students who were not present would not be included in the database. Students who were identified as enrolled in AP courses were required to be active students as of the EOY database and to have completed the course with a final semester grade or final grade in both the fall and spring semesters of a full-year course. Participants
Longitudinal test performance from 2007–2012, along with demographic information supplied by students, was reported to HISD for each participating campus by the College Board via printed reports and an electronic database. The 2012 global scores for test performance by subject were extracted from the 2012 College Board Report. These data, together with enrollment data from PEIMS and Chancery, were analyzed. State-level data, including the number of AP subject tests taken along with the percentage of scores that were 3 or above, were extracted from the 2011–2012 College Board Reports. Participation rates for juniors and seniors were calculated by dividing the number of students tested by the PEIMS snapshot of fall enrollment for the same group. Participation rates for juniors and seniors were calculated across the district and by school.
The number of students eligible to complete AP courses consists of those enrolled in both semesters of a two-semester course as per the Chancery EOY database and/or those enrolled in a one-semester course. Completion percentages are based on the number of students eligible to complete and the number completing an AP course.
Course completion was determined by counting those students who received a semester average grade of 70 or higher for both semesters of a two-semester course or receiving a 70 or higher for a one-semester course. Once this number was computed, it was divided by the total number of students who were eligible to complete an AP course.
Mean test scores by gender, race/ethnicity, and economic status for AP subjects were analyzed by comparing mean scores. To determine the percentage of students who scored 3 or above on AP subject tests by race/ethnicity, the total number of tests scoring a 3 or higher was divided by the total number of tests taken for each ethnic category. Data Collection and Analysis
The College Board reported test performance, along with demographic information supplied by the students to HISD. These data included results for all HISD schools that had participating students. These data, together with enrollment data from the Public Education Information Management System (PEIMS) database, were analyzed. Analyses were conducted using the aggregated data by grade, race/ethnicity, and gender. Results were analyzed districtwide and by campus level.

ADVANCED PLACEMENT 2011–2012 ________________________________________________________________________________________________________
__________
3
Results Districtwide Participation
The total number of exams taken by HISD students increased to 23,227 in 2012 from 21,347 in 2011, up by 9 percentage points, or 1,880 exams. The percent of exams scored at a 3 or higher was 31 percent, the same as it was in 2011. Figure 1 shows the percent of students in grades 10–12 who completed at least one AP course, the percent who took at least one AP exam, and the percent who passed at least one AP exam with a score of 3 or higher from 2008 to 2012. Percentages are based on grades 10–12 enrollment and reflect an unduplicated count of students.
2322 24
35
33
18 18
24
33
35
6 7 7
11 11
0
5
10
15
20
25
30
35
40
2007-2008 2008-2009 2009-2010 2010-2011 2011-2012
Perc
ent o
f Tot
al G
rade
10-
12 E
nrol
lmen
t
Year
Figure 1: Grade 10-12 AP Participation and Performance
Completed an AP Course Took an AP Exam Passed an AP Exam
Note: Completion of an AP course is defined as receiving a passing grade at the end of the course. • Since the 2007–2008 school year, the percentage of students in grades 10 through 12 who took at
least one AP exam has increased from a low of 18 percent in 2007–2008 to a high of 35 percent in 2011–2012, an increase of 17 percentage points.
• The percentage of HISD students in grades 10 through 12 who completed at least one AP course
has increased from 23 percent in 2007–2008 to 33 percent in 2011–2012, an increase of 10 percentage points.
• Eleven percent of HISD students enrolled in grades 10-12 passed at least one AP exam with a
score of 3 or higher in 2011–2012, up from 6 percent in the 2007–2008 school year.

HISD RESEARCH AND ACCOUNTABILITY ________________________________________________________________________________________________________
4 __________
AP Course Offerings Figure 2 shows the distribution of AP courses offered in district high schools for the 2011–2012 school year.
7 6
19
5
346
18
9
3
02468
101214161820
1 to 4 5 to 9 10 to 15 16 to 20 21+
Num
ber
of S
choo
ls
Number of AP Courses
Figure 2: Distribution of AP Course Offerings, 2010-2011 and 2011-2012
2010-2011 2011-2012
Note: Includes only campuses offering at least one AP course for the specified years. • In the 2010–2011 school year, 40 HISD high schools offered at least one AP course, and in 2011–
2012, the number of HISD high schools offering at least one AP course remained the same at 40. • Ten district campuses offered between one and nine AP courses in 2011–2012, compared to 13
campuses in 2010-2011. There was one fewer high school that offered between 10 and 15 AP courses in 2012 compared to 2011, and there was an increase in the number of campuses offering 16 to 20 AP courses, from 5 in 2010–2011 to 9 in 2011–2012.
Participation by Student Group
The number of HISD students who took an AP exam, number of exams taken, and number of exams scored 3 or higher for grades 9–12 by race/ethnicity and economic status are presented in Table 1. The number of exam takers reflects an unduplicated count of students who took an exam, and the number of exams taken is a duplicated count of exams. In other words, a given student is counted once, and all the exams that student has taken are counted as well.

ADVANCED PLACEMENT 2011–2012 ________________________________________________________________________________________________________
__________
5
Table 1: 2012 AP Exam Participation for Grades 9-12* by Student Group
Student Group
N Exam Takers
N Exams Taken
N Exams 3+
% Exams 3+
African American 2,654 4,317 581 13 American Indian 43 67 20 30 Asian American 917 2,323 1,545 67 Hispanic 7,299 12,047 2,750 23 White 1,881 3,515 1,904 54 No Response 262 376 101 27 Other 347 582 205 35 Female 7,432 12,759 3,746 29 Male 5,971 10,468 3,360 32 Econ Disadv. 8,656 14,284 2,902 20 Non-Econ. Disadv. 4,708 8,893 4,188 47 Unknown Econ. Status 39 50 16 32 Total 13,403 23,227 7,106 31 *Students with a grade level not indicated are included
• Hispanic students comprise the largest racial/ethnic group of students who took an AP exam in
grades 9-12, accounting for over half of the exam takers and the number of exams taken. Twenty-three percent of exams taken by Hispanic students were scored at 3 or higher.
• African American students represent the second largest group of AP exam takers in grades 9-12. Out of 4,317 AP exams taken, 581 (13%) of those were scored at 3 or higher.
• White students are the next largest group who took an AP exam. Out of 3,515 AP exams taken,
1,904 (54%) of those scored at 3 or higher.
• There were 917 Asian American students in grades 9-12 who took 2,323 AP exams. Out of those exams, 1,545 (67%) were scored at 3 or higher.
• Almost two-thirds of HISD students in grades 9–12 who took an AP exam are economically
disadvantaged. These students took a total of 14,284 AP exams, 2,902 (20%) of which were scored at 3 or higher.

HISD RESEARCH AND ACCOUNTABILITY ________________________________________________________________________________________________________
6 __________
AP Exams Taken
The number of AP exams taken at district high schools and the number and percent scored at 3 or higher are shown in Figure 3.
• The number of AP exams taken by high-school students increased by 1,891 (9%), from 21,336 in 2011 to 23,227 in 2012.
• Over the past six years, the number of Advanced Placement (AP) exams taken by HISD high-
school students has increased from 9,088 in 2007 to 23,227 in 2012.
• While the number of exams scored at a 3 or higher has increased from 4,304 in 2007 to 7,106 in 2012 at the high-school level, the percentage has decreased from 47 percent in 2007 to 31 percent in 2012.
District Summary by Student Group
AP course completion by student groups including race/ethnicity, gender, economic status, and LEP status were examined for 2011and 2012. The number and percent of HISD students in grades 10–12 completing AP courses are presented by student group in Table 2. This table reflects an unduplicated count of students for courses.
9,088 10,14811,594
16,556
21,33623,227
4,304 4,445 4,9156,262 6,656 7,106
0
5,000
10,000
15,000
20,000
25,000
2007 2008 2009 2010 2011 2012
Num
ber
of E
xam
s
Year
Figure 3: The Number of AP Exams Taken and Scoring at a 3 or Higher at the High School Level, 2007–2012
Exams Taken Exams Scored 3 or Higher
47% 44% 42%38% 31% 31%

ADVANCED PLACEMENT 2011–2012 ________________________________________________________________________________________________________
__________
7
Table 2: 2011 and 2012 District Summary of AP Course Enrollment and Completion by Demographic Group, Grades 10–12 (Unduplicated Count)
2012
Student Group Total Gr 10-12 Enroll.
AP Course Enrollment Total Percent
AP Course Completion Total Percent
African American 8,972 2,638 29.4 2,421 91.8 American Indian 97 29 29.9 27 93.1 Asian American 1,290 792 61.4 776 98.0 Hispanic 18,444 6,282 34.1 5,629 89.6 Pac. Is./HI 71 29 40.8 27 93.1 White 3,062 1,646 53.8 1,574 95.6 2 or More 223 127 57.0 119 93.7 Other 25 Econ. Disadv. 23,063 7,488 32.5 6,728 89.9 Non-Eco. Disadv. 9,121 4,055 44.5 3,845 94.8 LEP 2,111 179 8.5 155 86.6 Non-LEP 30,048 11,364 37.8 10,418 91.7 No LEP Info. 25 Female 16,119 6,400 39.7 5,960 93.1 Male 16,065 5,143 32.0 4,613 89.7 Total 32,184 11,543 35.9 10,573 91.6
2011
Student Group Total Gr 10-12 Enroll.
AP Course Enrollment Total Percent
AP Course Completion Total Percent
African American 9,041 2,596 28.7 2,460 94.8 American Indian 94 27 28.7 26 96.3 Asian American 1,198 767 64.0 757 98.7 Hispanic 17,287 5,250 30.4 4,781 91.1 Pac. Is./HI 116 46 39.7 45 97.8 White 3,011 1,596 53.0 1,549 97.1 2 or More 202 107 53.0 102 95.3 Other 154 1 0.6 0 0.0 Econ. Disadv. 22,058 6,450 29.2 5,945 92.2 Non-Eco. Disadv. 9,045 3,940 43.6 3,775 95.8 LEP 1,766 49 2.8 45 91.8 Non-LEP 29,337 10,341 35.2 9,675 93.6 Female 15,827 5,787 36.6 5,476 94.6 Male 15,276 4,603 30.1 4,244 92.2 Total 31,103 10,390 33.4 9,720 93.6
• For the district as a whole in 2012, 11,543 out of 32,184, or 36% of students in grades 10-12 were enrolled in at least one AP course. Of students enrolled in an AP course, 10,573 completed at least one AP course (92%).
• In 2012, Hispanic and African American students represented the largest student groups in grades 10 through 12; however, far fewer than half Hispanic and African American students were enrolled in an AP course. By contrast, more than half of White and Asian American students in grades 10-12 were enrolled in at least one AP course.
• Each ethnic student group in 2012 showed high completion rates for completing at least one AP course, ranging from 90% for Hispanics to 98% for Asian American students.

HISD RESEARCH AND ACCOUNTABILITY ________________________________________________________________________________________________________
8 __________
Figures 4-10 show districtwide AP exam scores by AP course grade for all courses/exams, grouped into subjects. These figures show all AP exams that were taken only by students who received a grade in the AP course. Appendix A provides the list of AP courses that comprise the subjects in the figures.
1830
852 780 8771108
4093
16141105
782313
2160
579268 121 24
2003
358 137 44 1
750105 28 3 2
0500
10001500200025003000350040004500
1 2 3 4 5 1 2 3 4 5 1 2 3 4 5 1 2 3 4 5 1 2 3 4 5
A B C D F
Num
ber
of A
P E
xam
s
Figure 4: HISD Frequency Distribution for All AP Subjects, AP Exam Score by AP Final Course Grade, 2011-2012
53
1813
2933
51
1016 13
3
16
3 3 3 0
14
1 2 0 05 5
0 0 00
10
20
30
40
50
60
1 2 3 4 5 1 2 3 4 5 1 2 3 4 5 1 2 3 4 5 1 2 3 4 5
A B C D F
Num
ber o
f AP
Exa
ms
Figure 5: HISD Frequency Distribution for Art and Music Exams, AP Exam Score by AP Final Course Grade, 2011-2012
281 239 194 159 155
761
533
318
15645
457
19162 29 3
401
10520 7 0
169
31 6 0 10
100200300400500600700800
1 2 3 4 5 1 2 3 4 5 1 2 3 4 5 1 2 3 4 5 1 2 3 4 5
A B C D F
Num
ber
of A
P E
xam
s
Figure 6: HISD Frequency Distribution for English Exams, AP Exam Score by AP Final Course Grade, 2011-2012

ADVANCED PLACEMENT 2011–2012 ________________________________________________________________________________________________________
__________
9
49
26
68
100 94
6754
6986
40 3728
18 183
2916 18
100
189 3 0 1
0
20
40
60
80
100
120
1 2 3 4 5 1 2 3 4 5 1 2 3 4 5 1 2 3 4 5 1 2 3 4 5
A B C D F
Num
ber
of A
P E
xam
sFigure 7: HISD Frequency Distribution for Foreign Language Exams, AP Exam
Score by AP Final Course Grade, 2011-2012
108
2766 83
213241
49
110 12488
155
2556
22 9
208
29 26 10 0
66
7 3 1 00
50
100
150
200
250
300
1 2 3 4 5 1 2 3 4 5 1 2 3 4 5 1 2 3 4 5 1 2 3 4 5
A B C D F
Num
ber
of A
P E
xam
s
Figure 8: HISD Frequency Distribution for Math Exams, AP Exam Score by AP Final Course Grade, 2011-2012
293
54 60102
178
550
86 121 12470
290
43 27 22 2
249
21 18 6 070
6 5 1 00
100
200
300
400
500
600
1 2 3 4 5 1 2 3 4 5 1 2 3 4 5 1 2 3 4 5 1 2 3 4 5
A B C D F
Num
ber
of A
P Ex
ams
Figure 9: HISD Frequency Distribution for Science Exams, AP Exam Score by AP Final Course Grade, 2011-2012

HISD RESEARCH AND ACCOUNTABILITY ________________________________________________________________________________________________________
10 __________
1046
488379 404 435
2423
882471 279
67
1205
289 102 27 7
1102
186 53 11 1422
47 11 1 00
500
1000
1500
2000
2500
3000
1 2 3 4 5 1 2 3 4 5 1 2 3 4 5 1 2 3 4 5 1 2 3 4 5
A B C D F
Num
ber
of A
P E
xam
sFigure 10: HISD Frequency Distribution for Social Studies Exams, AP Exam
Score by AP Final Course Grade, 2011-2012
• With the exception of foreign language and math AP exams, each AP final course letter grade had
the highest number of AP exams scored at a 1.
• Eighty-nine percent of AP exams that were scored at a 3 or higher were linked to students who received an A or B in the AP course. Of the 13,354 AP course grades of either A or B, 37 percent were linked to students who scored at or above a 3 on the AP exam.
Comparison with State and Nation
Participation and performance for the district, state, and nation are presented in Figure 11. The College Board provides data for graduating classes for the state and nation in its annual AP Report to the Nation, which is released in January of each year.
2934
1412
3033
16 17
2830
17 18
0
5
10
15
20
25
30
35
40
Class of 2010 Class of 2011 Class of 2010 Class of 2011
Took An AP Exam Passed An AP Exam
Perc
ent o
f Gra
duat
ing
Cla
ss
Figure 11: Percent of Graduates Who Took and Passed an AP Exam, Classes of 2010 an d 2011
HISD Texas Nation
Note: Source for 2010 and 2011 state and national data: AP Report to the Nation, 7th and 8th editions, the College Board. Source for 2010 HISD data, College Board hard copy data report; 2011 HISD data derived from August 23, 2011 AP electronic file and 2010-2011 PEIMS Graduates file (2011 Fall submission).

ADVANCED PLACEMENT 2011–2012 ________________________________________________________________________________________________________
__________
11
• For the classes of 2010 and 2011, HISD trailed Texas and the nation in the percentage of
graduates who passed an AP exam with a score of 3 or higher. However, in 2011, HISD outperformed the state and the nation in the percentage of graduates who took an AP exam at some point in their high school career.
• The percentage of HISD graduates who took an AP exam increased by five percentage points
(29% - 34%) from 2010 to 2011, exceeding both the state and national increases. The percentage of graduates who passed an AP exam decreased 2 percentage points (from 14% to 12%) over the same time period, whereas the state and nation both increased by 1 percentage point.
31 31
45 4857 59
010203040506070
2010-2011 2011-2012
Perc
ent
Figure 12: Percent of AP Exams Scored 3 or Higher, 2011 and 2012
HISD Texas Nation
• The percent of HISD AP exams scored at 3 or higher remained the same from 2011 to 2012 while the percentages of AP exams scored at 3 or higher for the state and the nation both increased over the same time period (see Figure 12).

HISD RESEARCH AND ACCOUNTABILITY ________________________________________________________________________________________________________
12 __________
Student AP Course and Exam Participation and Performance by Campus Figure 13 shows the percent of exams scored at 3 or higher in grades 9-12 for each campus in 2011
and 2012. All AP exams are represented in this figure, regardless of whether the student was enrolled in the AP course. Appendix B also presents the number of students taking AP exams in grades 9-12, the number of exams taken for each of these high schools, and the number and percent scoring a 3 or higher for 2011 and 2012.
0
8
5
46
14
9
5
5
0
6
0
28
13
86
21
0
18
26
62
79
15
0
9
1
43
10
14
18
2
0
0
9
39
25
89
21
0
19
36
66
82
21
0 10 20 30 40 50 60 70 80 90 100
Kashmere
Jordan
Jones
HSPVA
HSLECJ
Houston M/S/T
Hou. Acad. Int’l
Furr
Energ. STEM W
Energ. STEM
Empowerment
Eastwood
East Early
DeBakey
Davis
CLC
Chavez
Challenge
Carnegie
Bellaire**
Austin
Percent
Figure 13: Percent of Exams Scored at 3 or Higher, Grades 9-12, 2011 and 2012
2012
2011

ADVANCED PLACEMENT 2011–2012 ________________________________________________________________________________________________________
__________
13
57
45
31
0
2
1
2
42
14
20
18
4
10
3
16
17
55
7
22
6
21
15
59
48
31
1
0
3
4
45
13
11
17
2
13
13
6
16
10
8
24
7
10
14
0 10 20 30 40 50 60 70 80 90 100
Nation
Texas
HISD
Young Women’s
Yates
Worthing
Wheatley
Westside
Westbury
Washington
Waltrip
Sterling
Sharpstown Int’l
Sharpstown
Scarborough
Reagan
North EC HS
Mt. Carmel
Milby
Madison
Lee
Lamar**
Percent
Figure 13 con't: Percent of Exams Scored at 3 or Higher, Grades 9-12, 2011 and 2012
2012
2011
**Bellaire and Lamar high schools offer the International Baccalaureate Program.
• Of the 40 HISD campuses that tested students on AP exams in both 2011 and 2012, 21 or 53% increased the percent of exams that scored a 3 or higher.

HISD RESEARCH AND ACCOUNTABILITY ________________________________________________________________________________________________________
14 __________
Figure 14 shows the percent of courses completed by HISD students in grades 9-12 who were enrolled in AP courses. The percent of AP exams scored at a 3 or higher in Figure 14 represents the number of exams out of the number of students who were both enrolled in the AP course and took the AP exam. All AP exams in this figure are linked to students who took the corresponding AP course.
Appendix C shows the number of courses taken and completed by HISD students in grades 9-12 as well as the number of exams these students enrolled in the AP courses took and the number and percent of these exams that scored 3 or higher. In this table, only students who took an AP course and took the AP exam are shown.
100
93
99
100
95
93
91
88
100
88
76
89
99
98
90
80
91
81
95
99
83
0
1
1
43
10
13
8
2
0
0
2
31
7
89
8
0
16
25
66
81
12
0 10 20 30 40 50 60 70 80 90 100
Kashmere
Jordan
Jones
HSPVA
HSLECJ
Houston M/S/T
Hou. Acad. Int’l
Furr
Energ. STEM W
Energ. STEM
Empowerment
Eastwood
East Early
DeBakey
Davis
CLC
Chavez
Challenge
Carnegie
Bellaire**
Austin
Percent
Figure 14: Percent of Exams Scored at 3 or Higher and Percent of Courses Completed, Grades 9-
12, 2012
% Exams Scored 3+% Courses Completed

ADVANCED PLACEMENT 2011–2012 ________________________________________________________________________________________________________
__________
15
93
69
95
95
93
97
89
84
93
89
97
91
88
96
85
96
91
91
92
90
28
1
0
3
0
42
10
8
11
2
9
9
3
16
11
6
15
4
7
13
0 10 20 30 40 50 60 70 80 90 100
HISD
Young Women’s
Yates
Worthing
Wheatley
Westside
Westbury
Washington
Waltrip
Sterling
Sharpstown Int’l
Sharpstown
Scarborough
Reagan
North Houston EC
Mt. Carmel
Milby
Madison
Lee
Lamar**
Percent
Figure 14 con't: Percent of Exams Scored at 3 or Higher and Percent of Courses Completed,
Grades 9-12, 2012
% Exams Scored 3+% Courses Completed
**Bellaire and Lamar high schools offer the International Baccalaureate Program.
• HISD students in grades 9-12 completed 18,565 out of 19,968 courses taken (93%) where
they also took the AP exam. Of the 19,968 courses taken, 5,593 (28%) of the AP exams were scored at a 3 or higher.
• Out of the 40 schools that offered AP courses in the 2012 school year, 27 (68%) had at least 90% of the courses successfully completed by students.

HISD RESEARCH AND ACCOUNTABILITY ________________________________________________________________________________________________________
16 __________
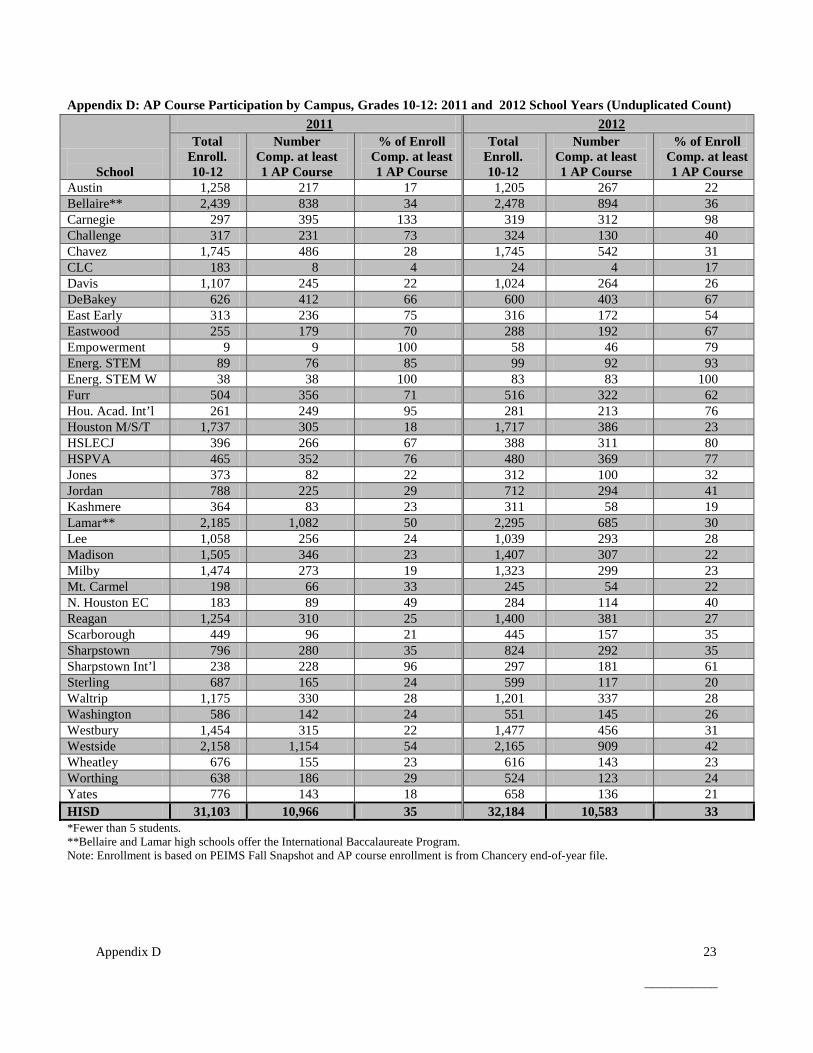
Figure 15 and Appendix D present the percent of students who completed at least one AP course. Appendix D also shows the grade 10–12 enrollment on each campus and the number and percent of students in grades 10–12 completing at least one AP course for 2011 and 2012. Very few AP courses are available for students in grade 9, but ninth grade is usually the largest grade level at comprehensive high schools. Thus, basing percentages of AP courses and exams taken on enrollment that includes 9th graders does not truly reflect the rates of participation. Data for Figure 15 and Appendix D are unduplicated; though a student may take more than one AP course, he is only counted once. Percentages are based on AP courses taken by students in grades 10–12.
29
22
76
67
18
95
71
100
85
100
70
75
66
22
4
28
73
133
34
17
41
32
77
80
23
76
62
100
93
79
67
54
67
26
17
31
40
98
36
22
0 20 40 60 80 100 120 140
Jordan
Jones
HSPVA
HSLECJ
Houston M/S/T
Hou. Acad. Int’l
Furr
Energ. STEM W
Energ. STEM
Empowerment
Eastwood
East Early
DeBakey
Davis
CLC
Chavez
Challenge
Carnegie
Bellaire**
Austin
Percent
Figure 15: Percent of Students Enrolled who Completed at Least 1 AP Course, Grades 10-12,
2011 and 2012
2012
2011
ADVANCED PLACEMENT 2011–2012 ________________________________________________________________________________________________________
__________
17
35
18
29
23
54
22
24
28
24
96
35
21
25
49
33
19
23
24
50
23
33
21
24
23
42
31
26
28
20
61
35
35
27
40
22
23
22
28
30
19
0 10 20 30 40 50 60 70 80 90 100
HISD
Yates
Worthing
Wheatley
Westside
Westbury
Washington
Waltrip
Sterling
Sharpstown Int’l
Sharpstown
Scarborough
Reagan
N. Houston EC
Mt. Carmel
Milby
Madison
Lee
Lamar**
Kashmere
Percent
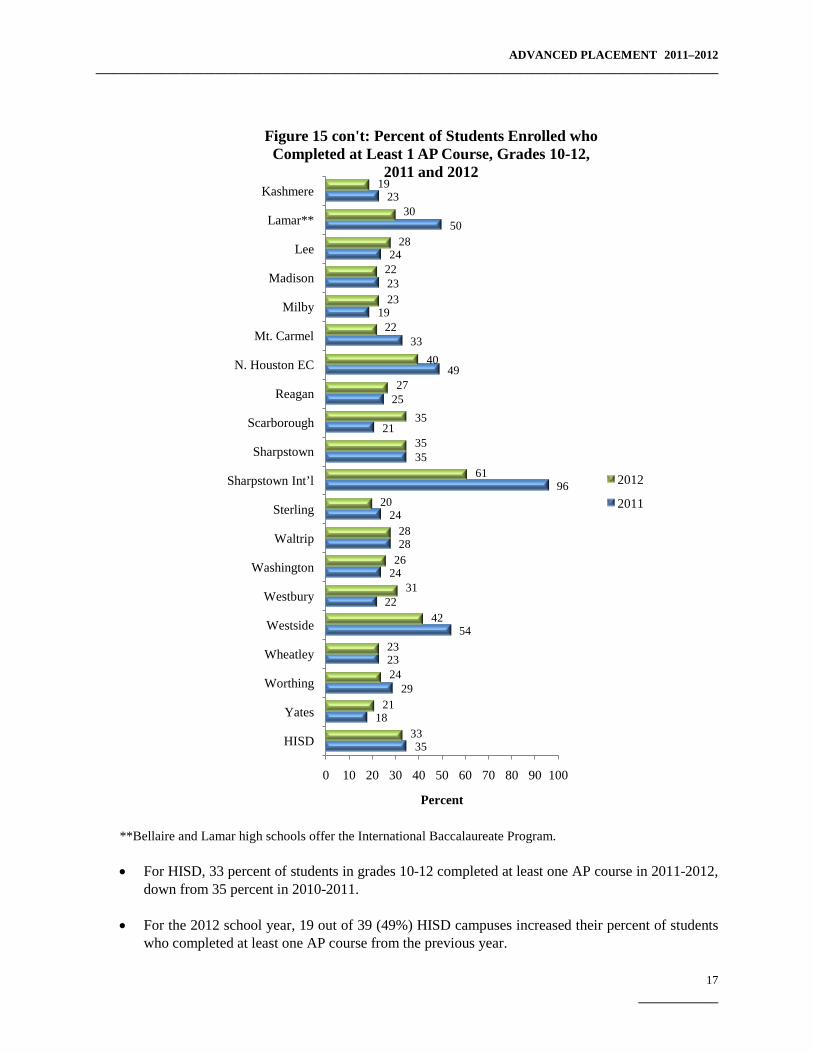
Figure 15 con't: Percent of Students Enrolled who Completed at Least 1 AP Course, Grades 10-12,
2011 and 2012
2012
2011
**Bellaire and Lamar high schools offer the International Baccalaureate Program.
• For HISD, 33 percent of students in grades 10-12 completed at least one AP course in 2011-2012,
down from 35 percent in 2010-2011.
• For the 2012 school year, 19 out of 39 (49%) HISD campuses increased their percent of students who completed at least one AP course from the previous year.

HISD RESEARCH AND ACCOUNTABILITY ________________________________________________________________________________________________________
18 __________
Campus Participation and Performance by Exam
Analysis of districtwide participation focused on the number of students taking any of the possible 37 AP exams offered by the College Board. Results from 2011–2012 are presented in Appendix E. Additionally, the number of students taking each exam and the percent scoring a 3 or higher are presented for each exam.
AP Exam Participation and Performance by Campus
Advanced Placement Course enrollment and exam data are presented by campus in Appendix F. Data analyzed are duplicated by exam and included the grade 10–12 enrollment on each campus, the number of AP courses offered, and the number and percent of AP courses completed (passed), and the number and percent of AP exams taken and scored at 3 or higher.
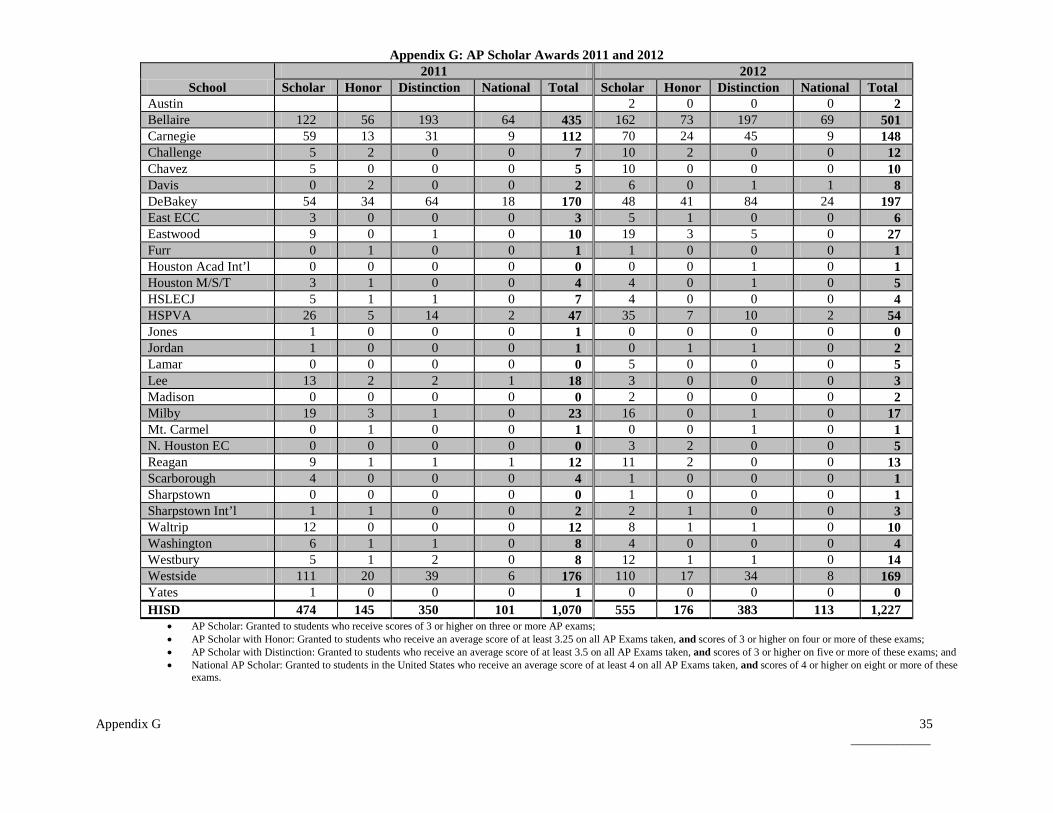
AP Scholar Awards
The AP Program offers several AP Scholar Awards to recognize high school students who have demonstrated college-level achievement through AP courses and exams. This achievement is acknowledged on any score report that is sent to colleges the following fall. Notifications about AP Scholar Awards are sent to students and schools in October of each year. The following awards are provided to the students groups described for each award according to the College Board:
• AP Scholar: Granted to students who receive scores of 3 or higher on three or more AP exams; • AP Scholar with Honor: Granted to students who receive an average score of at least 3.25 on all
AP Exams taken, and scores of 3 or higher on four or more of these exams; • AP Scholar with Distinction: Granted to students who receive an average score of at least 3.5 on
all AP Exams taken, and scores of 3 or higher on five or more of these exams; and • National AP Scholar: Granted to students in the United States who receive an average score of at
least 4 on all AP Exams taken, and scores of 4 or higher on eight or more of these exams. AP Scholar Awards earned by HISD students for 2011 and 2012 are presented by campus and districtwide in Appendix G. The number of AP Scholar Awards presented to HISD students increased 15% from 1,070 in 2011 to 1,227 in 2012.
“Emerging Scholars” 8th and 9th Grade Participation and Performance
Though Advanced Placement courses and exams are usually taken by high school upperclassmen, increasingly, students in middle school and ninth grade are beginning to take advantage of the opportunity to earn college credits early in their academic careers. The most common courses and exams taken by middle school students and high school underclassmen tend to be Human Geography, typically a ninth-grade course, and foreign language courses and exams, especially for students for whom English is a second language. Increasingly, eighth and ninth graders in HISD are participating in Advanced Placement programs. Table 3 presents AP course and exam participation and performance for students in grades 8–9. Counts presented in Table 3 are duplicated.

ADVANCED PLACEMENT 2011–2012 ________________________________________________________________________________________________________
__________
19
Table 3: 2012 8th and 9th Grade AP Participation and Performance – Duplicated Count 2012
Grade
N Enrolled AP Course
N Complete AP Course
% Complete AP Course
N Taking AP Exam
% Comp. Taking AP
Exam
N Score 3+ on AP
Exam
% Score 3+ on AP
Exam 8 273 263 96 317 121 211 67 9 1,720 1,391 81 1,969 142 501 25
Total 1,993 1,654 83 2,286 138 712 31
2011
Grade
N Enrolled AP Course
N Complete AP Course
% Complete AP Course
N Taking AP Exam
% Comp. Taking AP
Exam
N Score 3+ on AP
Exam
% Score 3+ on AP
Exam 8 299 293 98 299 102 196 66 9 1,428 1,248 87 1,868 150 458 25
Total 1,727 1,541 89 2,165 140 654 30 Course and exam data are not linked.
• In 2012, 1,993 district eighth and ninth graders enrolled in an AP course, compared to 1,727
district eighth and ninth graders enrolled in an AP course in 2011. In 2012, 1,654 (83%) of those students completed the course, compared to 1,541 (89%) in 2011.
• A combined total of 2,286 HISD eighth and ninth graders took AP exams in 2012, compared to 2,165 in 2011. In 2012, 31 percent of those exams were scored at a 3 or higher, up one percentage point from 2011.
Conclusion
The purpose of this report was to provide an examination of the participation and performance of
HISD students on Advanced Placement exams and courses. The investigation was also designed to supply a comparison of current year AP results with the results from the previous year. The results from this report indicated that student participation on AP exams in the district increased from the previous year. In addition, enrollment in AP courses also increased in 2011–2012 from the previous school year. Though the percentage of students scoring a 3 or higher decreased slightly over the same time period and has decreased steadily over the past ten years, it is important to note that many more students are performing at this high level today. Notably, in 2001, 57 percent of just 3,769 or 2,148 AP exams taken by HISD students were scored at 3 or higher, and in 2012, 31 percent of 23,227 or 7,200 exams scored at this level, reflecting 5,052 more exams. Many more HISD students are being exposed to Advanced Placement courses and to the opportunity to earn college credit.

Appendix A: HISD AP Exam Subjects
20 Appendix A __________
Science Biology Chemistry Environmental Science Physics B Physics C: Mechanics Psychology Math Calculus AB Calculus BC Computer Science Statistics Foreign Language Chinese Language and Culture French Language German Language Latin: Vergil Spanish Language Spanish Literature Social Studies Comparative Government and Politics European History Human Geography Macroeconomics Microeconomics United States Government and Politics United States History World History Art/Music Art History Music Theory Studio Art: 2-D Design Portfolio Studio Art: 3-D Design Portfolio Studio Art: Drawing Portfolio English English Language and Composition English Literature and Composition
Appendix B 21
___________
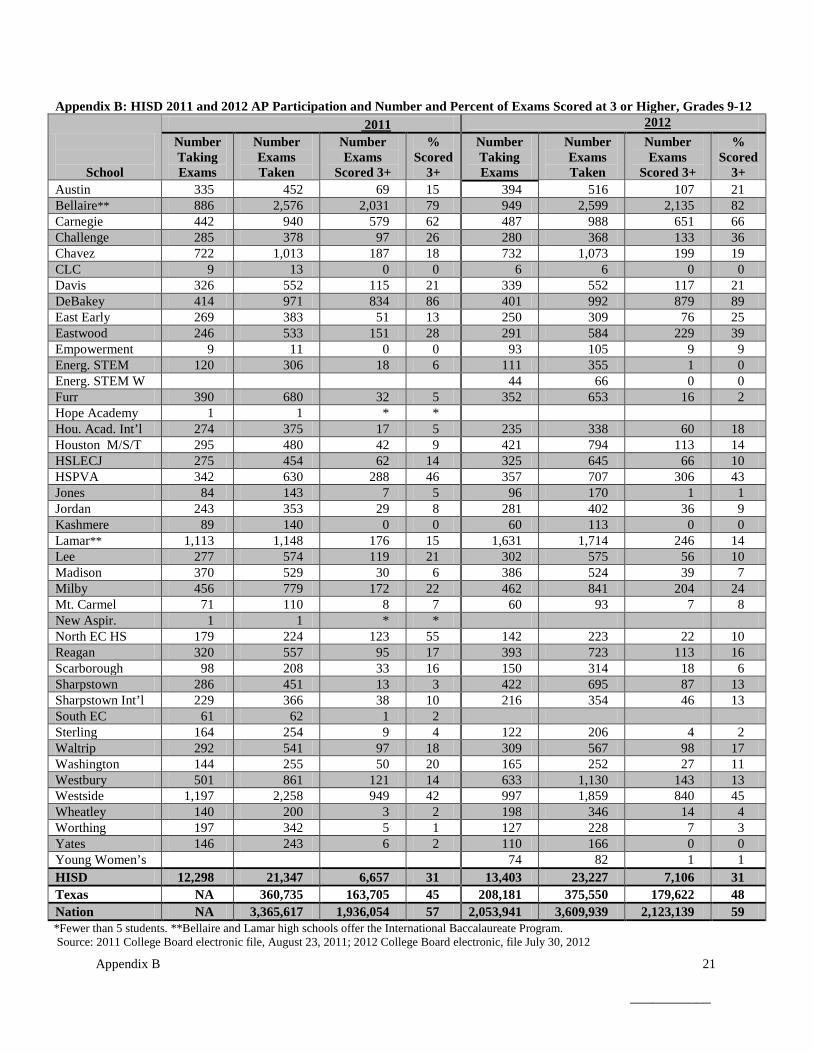
Appendix B: HISD 2011 and 2012 AP Participation and Number and Percent of Exams Scored at 3 or Higher, Grades 9-12
School
2011 2012 Number
Taking Exams
Number Exams Taken
Number Exams
Scored 3+
% Scored
3+
Number Taking Exams
Number Exams Taken
Number Exams
Scored 3+
% Scored
3+ Austin 335 452 69 15 394 516 107 21 Bellaire** 886 2,576 2,031 79 949 2,599 2,135 82 Carnegie 442 940 579 62 487 988 651 66 Challenge 285 378 97 26 280 368 133 36 Chavez 722 1,013 187 18 732 1,073 199 19 CLC 9 13 0 0 6 6 0 0 Davis 326 552 115 21 339 552 117 21 DeBakey 414 971 834 86 401 992 879 89 East Early 269 383 51 13 250 309 76 25 Eastwood 246 533 151 28 291 584 229 39 Empowerment 9 11 0 0 93 105 9 9 Energ. STEM 120 306 18 6 111 355 1 0 Energ. STEM W 44 66 0 0 Furr 390 680 32 5 352 653 16 2 Hope Academy 1 1 * * Hou. Acad. Int’l 274 375 17 5 235 338 60 18 Houston M/S/T 295 480 42 9 421 794 113 14 HSLECJ 275 454 62 14 325 645 66 10 HSPVA 342 630 288 46 357 707 306 43 Jones 84 143 7 5 96 170 1 1 Jordan 243 353 29 8 281 402 36 9 Kashmere 89 140 0 0 60 113 0 0 Lamar** 1,113 1,148 176 15 1,631 1,714 246 14 Lee 277 574 119 21 302 575 56 10 Madison 370 529 30 6 386 524 39 7 Milby 456 779 172 22 462 841 204 24 Mt. Carmel 71 110 8 7 60 93 7 8 New Aspir. 1 1 * * North EC HS 179 224 123 55 142 223 22 10 Reagan 320 557 95 17 393 723 113 16 Scarborough 98 208 33 16 150 314 18 6 Sharpstown 286 451 13 3 422 695 87 13 Sharpstown Int’l 229 366 38 10 216 354 46 13 South EC 61 62 1 2 Sterling 164 254 9 4 122 206 4 2 Waltrip 292 541 97 18 309 567 98 17 Washington 144 255 50 20 165 252 27 11 Westbury 501 861 121 14 633 1,130 143 13 Westside 1,197 2,258 949 42 997 1,859 840 45 Wheatley 140 200 3 2 198 346 14 4 Worthing 197 342 5 1 127 228 7 3 Yates 146 243 6 2 110 166 0 0 Young Women’s 74 82 1 1 HISD 12,298 21,347 6,657 31 13,403 23,227 7,106 31 Texas NA 360,735 163,705 45 208,181 375,550 179,622 48 Nation NA 3,365,617 1,936,054 57 2,053,941 3,609,939 2,123,139 59 *Fewer than 5 students. **Bellaire and Lamar high schools offer the International Baccalaureate Program. Source: 2011 College Board electronic file, August 23, 2011; 2012 College Board electronic, file July 30, 2012

22 Appendix C ___________
Appendix C: HISD 2012 AP Course and Exam Performance by Students who Both Enrolled in an AP Course and Took the AP Exam, by School: Grades 9-12
School
Number Courses Enrolled
Number Courses
Completed
% Courses
Completed
Number Exams Taken
Number Exams
Scored 3+
% Exams Scored
3+ Austin 367 306 83 367 43 12 Bellaire** 2,142 2,117 99 2,142 1,743 81 Carnegie 967 917 95 967 636 66 Challenge 274 222 81 274 69 25 Chavez 873 795 91 873 136 16 CLC 5 4 80 5 0 0 Davis 429 386 90 429 33 8 DeBakey 983 962 98 983 871 89 East Early 197 194 99 197 13 7 Eastwood 469 419 89 469 146 31 Empowerment 96 73 76 96 2 2 Energ. STEM 251 222 88 251 1 0 Energ. STEM W 51 51 100 51 0 0 Furr 606 531 88 606 14 2 Hou. Acad. Int’l 278 253 91 278 22 8 Houston M/S/T 745 694 93 745 100 13 HSLECJ 631 596 95 631 64 10 HSPVA 700 697 100 700 303 43 Jones 163 162 99 163 1 1 Jordan 348 322 93 348 5 1 Kashmere 105 105 100 105 0 0 Lamar** 1,364 1,221 90 1,364 175 13 Lee 515 471 92 515 34 7 Madison 428 390 91 428 18 4 Milby 664 606 91 664 97 15 Mt. Carmel 83 80 96 83 5 6 North Houston EC 150 127 85 150 16 11 Reagan 660 631 96 660 107 16 Scarborough 292 258 88 292 8 3 Sharpstown 564 514 91 564 49 9 Sharpstown Int’l* 318 307 97 303 26 9 Sterling 189 169 89 189 3 2 Waltrip 510 473 93 510 54 11 Washington 234 197 84 234 19 8 Westbury 973 867 89 973 99 10 Westside 1,619 1,562 97 1,619 674 42 Wheatley 292 272 93 292 0 0 Worthing 206 196 95 206 6 3 Yates 154 146 95 154 0 0 Young Women’s 73 50 69 73 1 1 HISD 19,968 18,565 93 19,953 5,593 28 Note: AP courses and exams are linked in this table; all students who took an AP course also took the AP exam. *Fifteen students at Sharpstown International HS took two independent AP courses and took the corresponding AP exam, giving Sharpstown International 15 more courses enrolled than exams taken. **Bellaire and Lamar high schools offer the International Baccalaureate Program.
Appendix D 23 ___________
Appendix D: AP Course Participation by Campus, Grades 10-12: 2011 and 2012 School Years (Unduplicated Count)
School
2011 2012 Total
Enroll. 10-12
Number Comp. at least 1 AP Course
% of Enroll Comp. at least 1 AP Course
Total Enroll. 10-12
Number Comp. at least 1 AP Course
% of Enroll Comp. at least 1 AP Course
Austin 1,258 217 17 1,205 267 22 Bellaire** 2,439 838 34 2,478 894 36 Carnegie 297 395 133 319 312 98 Challenge 317 231 73 324 130 40 Chavez 1,745 486 28 1,745 542 31 CLC 183 8 4 24 4 17 Davis 1,107 245 22 1,024 264 26 DeBakey 626 412 66 600 403 67 East Early 313 236 75 316 172 54 Eastwood 255 179 70 288 192 67 Empowerment 9 9 100 58 46 79 Energ. STEM 89 76 85 99 92 93 Energ. STEM W 38 38 100 83 83 100 Furr 504 356 71 516 322 62 Hou. Acad. Int’l 261 249 95 281 213 76 Houston M/S/T 1,737 305 18 1,717 386 23 HSLECJ 396 266 67 388 311 80 HSPVA 465 352 76 480 369 77 Jones 373 82 22 312 100 32 Jordan 788 225 29 712 294 41 Kashmere 364 83 23 311 58 19 Lamar** 2,185 1,082 50 2,295 685 30 Lee 1,058 256 24 1,039 293 28 Madison 1,505 346 23 1,407 307 22 Milby 1,474 273 19 1,323 299 23 Mt. Carmel 198 66 33 245 54 22 N. Houston EC 183 89 49 284 114 40 Reagan 1,254 310 25 1,400 381 27 Scarborough 449 96 21 445 157 35 Sharpstown 796 280 35 824 292 35 Sharpstown Int’l 238 228 96 297 181 61 Sterling 687 165 24 599 117 20 Waltrip 1,175 330 28 1,201 337 28 Washington 586 142 24 551 145 26 Westbury 1,454 315 22 1,477 456 31 Westside 2,158 1,154 54 2,165 909 42 Wheatley 676 155 23 616 143 23 Worthing 638 186 29 524 123 24 Yates 776 143 18 658 136 21 HISD 31,103 10,966 35 32,184 10,583 33 *Fewer than 5 students. **Bellaire and Lamar high schools offer the International Baccalaureate Program. Note: Enrollment is based on PEIMS Fall Snapshot and AP course enrollment is from Chancery end-of-year file.

Austin HS
Bellaire HS
Carnegie Vanguard H
S
Challenge H
S
Chavez H
S
CLC
HS/D
eVry Academy
Davis H
S
DeBakey H
S
East Early College H
S
Eastwood Academ
y
Em
powerm
ent College Prep. H
S
Energized for E-S
TEM Southeast H
S
Energized for E-STE
M W
est HS
Furr HS
High S
chool LECJ
High School PVA
Houston Academ
y for Int'l Studies
Houston M
ath/Sci./Tech. Center
Jones HS
Jordan HS
Kashmere H
S
Lamar H
S
Lee HS
Madison H
S
Milby H
S
Mount C
armel Academ
y
North H
ouston Early College H
S
Reagan H
S
Scarborough H
S
Sharpstown H
SAP Exam Title
N Scoring
3 or Higher
N Exams Taken
Appendix E: Advanced Placement (AP) Report for 2011-12AP Exam Results of High School Students (9th thru 12th Grades and Grade Level Not Indicated) by Exam and by Campus
Reported as Number of Students Who Scored 3 or Higher Versus Number of Exams Taken (to be continued)
% Scoring3 or Higher
Additional Schools A
ppended A
fter Cam
pus Totals
15 019 17Art History 20
2759183 32.2
1019
011
145
*3
74.1 78.9 52.6 0.0 2.2 * 0.0
4 * * * 510 4 4 3 5Art: Studio Art-2-D Design Portfolio 9
93256 57.1 *
2*3
*2
40.0 100.0 * * * * * * 100.0
Art: Studio Art-3-D Design Portfolio *1 *
1 * * *23 3 3 4Art: Studio Art-Drawing Portfolio *
11350 26.0 *
337
*2
4.3 * * * 42.9 * * *
0 19 0 0 3 1 0 0 2 0 05 30 24 23 17 20 13 10 54 6 16Biology 82
99266739 36.0 110
135313
037
031
1625
011
119
013
0.0 82.8 63.3 0.0 0.0 81.5 17.6 23.1 5.0 0.0 0.0 64.0 0.0 0.0 0.0 3.7 0.0 5.3 0.0 0.0
1 15 2 2 3 0 0 * 11 7 0 025 17 28 34 13 18 10 3 49 26 8 6Calculus AB 58
72349876 39.8
150174
713
023
011
1541
223
2964
09
*3
723
522
4.0 80.6 88.2 7.1 5.9 86.2 23.1 53.8 0.0 0.0 0.0 36.6 0.0 8.7 * 45.3 22.4 0.0 26.9 * 0.0 30.4 0.0 22.7
5 * * *5 1 4 1Calculus BC 92
99187214 87.4
4242
812
92.9 100.0 * 100.0 * 66.7 *
8 0 * 0 1 0 0 0 *10 16 3 14 17 9 26 19 3Chemistry 42
53128436 29.4
4855
029
026
014
06
79.2 80.0 0.0 87.3 * 0.0 0.0 0.0 5.9 0.0 0.0 0.0 0.0 * 0.0
HISD Research and Accountability Appendix E-1
Data from the College Board AP datafile (July 30, 2012)
ELASAGE
Typewritten Text
ELASAGE
Typewritten Text
24 __________
ELASAGE
Typewritten Text
ELASAGE
Typewritten Text
ELASAGE
Typewritten Text
ELASAGE
Typewritten Text
ELASAGE
Typewritten Text
ELASAGE
Typewritten Text
ELASAGE
Typewritten Text
ELASAGE
Typewritten Text
ELASAGE
Typewritten Text
ELASAGE
Typewritten Text
ELASAGE
Typewritten Text
ELASAGE
Typewritten Text

Austin HS
Bellaire HS
Carnegie Vanguard H
S
Challenge H
S
Chavez H
S
CLC
HS/D
eVry Academy
Davis H
S
DeBakey H
S
East Early College H
S
Eastwood Academ
y
Em
powerm
ent College Prep. H
S
Energized for E-S
TEM Southeast H
S
Energized for E-STE
M W
est HS
Furr HS
High S
chool LECJ
High School PVA
Houston Academ
y for Int'l Studies
Houston M
ath/Sci./Tech. Center
Jones HS
Jordan HS
Kashmere H
S
Lamar H
S
Lee HS
Madison H
S
Milby H
S
Mount C
armel Academ
y
North H
ouston Early College H
S
Reagan H
S
Scarborough H
S
Sharpstown H
SAP Exam Title
N Scoring
3 or Higher
N Exams Taken
Appendix E: Advanced Placement (AP) Report for 2011-12AP Exam Results of High School Students (9th thru 12th Grades and Grade Level Not Indicated) by Exam and by Campus
Reported as Number of Students Who Scored 3 or Higher Versus Number of Exams Taken (to be continued)
% Scoring3 or Higher
Additional Schools A
ppended A
fter Cam
pus Totals
Chinese Language & Culture 2324
3641 87.8
*1
*4
95.8 * *
12 * 013 1 9Computer Science A 30
7447151 31.1 *
1147
40.5 92.3 * * 0.0 2.1
Computer Science AB
0 9 0 0 4 0 0 0 7 026 12 27 16 72 32 16 41 82 20Economics: Macroeconomics 229
2753471245 27.9 53
67383
1146
017
066
062
0.0 83.3 75.0 0.0 0.0 79.1 5.6 3.6 23.9 0.0 0.0 0.0 0.0 8.5 0.0 0.0 0.0
33 071 15Economics: Microeconomics 48
5082201 40.8 0
40
96.0 46.5 0.0 0.0
11 91 28 12 3 * 0 10 0 0 0 6 4 8 136 116 122 94 63 3 14 83 26 13 18 82 102 73 52English Language & Composition 233
2647992968 26.9
926
06
8183
1373
063
282
6995
3103
196
60284
370
426
1273
289
30.6 88.3 78.4 34.6 23.0 0.0 12.8 97.6 4.8 17.8 * 0.0 0.0 2.4 12.0 72.6 0.0 2.9 0.0 1.0 0.0 21.1 7.3 4.3 3.9 15.4 11.0 16.4 1.9 2.2
3 59 8 4 1 4 0 0 4 8 0 329 83 86 73 81 27 28 11 102 87 5 28English Literature & Composition 151
1745001887 26.5
2341
5759
434
128
6583
7135
173
030
225
742
060
10.3 86.8 71.1 56.1 9.3 5.5 96.6 11.8 3.6 1.2 78.3 14.8 5.2 0.0 1.4 0.0 3.9 0.0 9.2 8.0 0.0 16.7 10.7 0.0
0 9 0 3 0 0 0 8 06 11 19 41 18 43 7 29 15Environmental Science 56
77132574 23.0
335
012
014
360
*2
217
0.0 72.7 81.8 0.0 7.3 8.6 0.0 0.0 0.0 0.0 5.0 0.0 * 27.6 11.8 0.0
HISD Research and Accountability Appendix E-2
Data from the College Board AP datafile (July 30, 2012)
ELASAGE
Typewritten Text
25
ELASAGE
Typewritten Text
ELASAGE
Typewritten Text
ELASAGE
Typewritten Text
__________

Austin HS
Bellaire HS
Carnegie Vanguard H
S
Challenge H
S
Chavez H
S
CLC
HS/D
eVry Academy
Davis H
S
DeBakey H
S
East Early College H
S
Eastwood Academ
y
Em
powerm
ent College Prep. H
S
Energized for E-S
TEM Southeast H
S
Energized for E-STE
M W
est HS
Furr HS
High S
chool LECJ
High School PVA
Houston Academ
y for Int'l Studies
Houston M
ath/Sci./Tech. Center
Jones HS
Jordan HS
Kashmere H
S
Lamar H
S
Lee HS
Madison H
S
Milby H
S
Mount C
armel Academ
y
North H
ouston Early College H
S
Reagan H
S
Scarborough H
S
Sharpstown H
SAP Exam Title
N Scoring
3 or Higher
N Exams Taken
Appendix E: Advanced Placement (AP) Report for 2011-12AP Exam Results of High School Students (9th thru 12th Grades and Grade Level Not Indicated) by Exam and by Campus
Reported as Number of Students Who Scored 3 or Higher Versus Number of Exams Taken (to be continued)
% Scoring3 or Higher
Additional Schools A
ppended A
fter Cam
pus Totals
1 88 8European History 7
736102 35.3
413
05
12.5 100.0100.0 30.8 0.0
* *4 1French Language & Culture 13
142327 85.2
92.9 * *
French Literature
German Language & Culture 1212
1415 93.3
100.0
Government & Politics: Comparative *1
217 11.8
*
0 29 0 1 4 0 0 0 0 028 78 39 28 67 32 15 46 102 25Government & Politics: United States 180
2553481900 18.3
5364
131
045
063
487
6103
010
16182
089
014
343
063
0.0 70.6 37.2 0.0 3.6 82.8 3.2 0.0 0.0 6.0 4.6 5.8 0.0 0.0 0.0 8.8 0.0 0.0 0.0 0.0 7.0 0.0 0.0
118 0 2 1 0174 35 14 25 33Human Geography 21
233171594 19.9
32121
1238
011
348
*4
77628
041
317
035
91.3 67.8 26.4 31.6 0.0 0.0 6.3 * 12.3 0.0 14.3 4.0 17.6 0.0 0.0
Italian Language & Culture 2122
2122 95.5
95.5
HISD Research and Accountability Appendix E-3
Data from the College Board AP datafile (July 30, 2012)
ELASAGE
Typewritten Text
26
ELASAGE
Typewritten Text
_________

Austin HS
Bellaire HS
Carnegie Vanguard H
S
Challenge H
S
Chavez H
S
CLC
HS/D
eVry Academy
Davis H
S
DeBakey H
S
East Early College H
S
Eastwood Academ
y
Em
powerm
ent College Prep. H
S
Energized for E-S
TEM Southeast H
S
Energized for E-STE
M W
est HS
Furr HS
High S
chool LECJ
High School PVA
Houston Academ
y for Int'l Studies
Houston M
ath/Sci./Tech. Center
Jones HS
Jordan HS
Kashmere H
S
Lamar H
S
Lee HS
Madison H
S
Milby H
S
Mount C
armel Academ
y
North H
ouston Early College H
S
Reagan H
S
Scarborough H
S
Sharpstown H
SAP Exam Title
N Scoring
3 or Higher
N Exams Taken
Appendix E: Advanced Placement (AP) Report for 2011-12AP Exam Results of High School Students (9th thru 12th Grades and Grade Level Not Indicated) by Exam and by Campus
Reported as Number of Students Who Scored 3 or Higher Versus Number of Exams Taken (to be continued)
% Scoring3 or Higher
Additional Schools A
ppended A
fter Cam
pus Totals
Japanese Language & Culture *3
66 100.0
*
Latin: Literature
Latin: Vergil *4
310 30.0
*
0 011 14Music Theory 8
935116 30.2 0
152424
*3
012
*4
88.9 0.0 100.0 0.0 * 0.0 0.0 *
0 0 * 0 1 1 1 018 60 1 21 23 16 29 8Physics B 44
52129485 26.6 40
43022
1111
019
010
160
421
0.0 84.6 0.0 * 93.0 0.0 0.0 100.0 0.0 0.0 4.3 6.3 3.4 1.7 0.0 19.0
611Physics C: Electricity & Magnetism 9
122644 59.1
*1
75.0 54.5 *
911Physics C: Mechanics 11
123954 72.2
*2
91.7 81.8 *
* * 1 0 3 01 2 7 16 19 16Psychology 136
157233547 42.6
4547
043
055
117
09
*1
86.6 * 95.7 * 0.0 0.0 14.3 5.9 0.0 0.0 15.8 * 0.0
HISD Research and Accountability Appendix E-4
Data from the College Board AP datafile (July 30, 2012)
ELASAGE
Typewritten Text
27
ELASAGE
Typewritten Text
ELASAGE
Typewritten Text
_________

Austin HS
Bellaire HS
Carnegie Vanguard H
S
Challenge H
S
Chavez H
S
CLC
HS/D
eVry Academy
Davis H
S
DeBakey H
S
East Early College H
S
Eastwood Academ
y
Em
powerm
ent College Prep. H
S
Energized for E-S
TEM Southeast H
S
Energized for E-STE
M W
est HS
Furr HS
High S
chool LECJ
High School PVA
Houston Academ
y for Int'l Studies
Houston M
ath/Sci./Tech. Center
Jones HS
Jordan HS
Kashmere H
S
Lamar H
S
Lee HS
Madison H
S
Milby H
S
Mount C
armel Academ
y
North H
ouston Early College H
S
Reagan H
S
Scarborough H
S
Sharpstown H
SAP Exam Title
N Scoring
3 or Higher
N Exams Taken
Appendix E: Advanced Placement (AP) Report for 2011-12AP Exam Results of High School Students (9th thru 12th Grades and Grade Level Not Indicated) by Exam and by Campus
Reported as Number of Students Who Scored 3 or Higher Versus Number of Exams Taken (to be continued)
% Scoring3 or Higher
Additional Schools A
ppended A
fter Cam
pus Totals
73 15 135 78 61 6 28 47 * 26 138 6 5139 20 270 106 93 8 40 62 1 35 207 8 11Spanish Language 80
9514082432 57.9
5566
2831
103140
1084
717
71121
2950
*1
34103
4549
61140
52.5 84.2 75.0 83.3 50.0 73.6 90.3 65.6 73.6 75.0 11.9 70.0 41.2 75.8 58.7 * 58.0 * 74.3 33.0 66.7 75.0 91.8 45.5 43.6
7 * 18 4 1 7 1 610 2 18 7 10 9 6 18Spanish Literature 14
2190161 55.9 5
6*2
620
70.0 66.7 * 100.0 57.1 10.0 83.3 77.8 * 16.7 33.3 30.0
1 35 1 0 0 0 17 57 18 9 27 8 9Statistics 115
133249532 46.8 33
362036
*4
*1
123
218
450
1223
14.3 86.5 61.4 5.6 91.7 0.0 55.6 * * 0.0 4.3 11.1 0.0 11.1 8.0 52.2
4 57 4 8 0 6 1 0 0 2 7 4 026 116 142 57 14 89 43 15 17 81 28 67 33United States History 225
2675452327 23.4 72
751772
129
090
4596
367
157
283
025
1174
284
15.4 84.3 49.1 2.8 14.0 96.0 23.6 3.4 0.0 0.0 6.7 46.9 2.3 4.5 0.0 1.8 0.0 2.5 2.4 25.0 0.0 6.0 14.9 0.0 2.4
1 88 4 5 2 1 0 5 7 0 0 2 13 * 0120 115 219 78 56 19 24 111 102 23 16 27 48 2 22World History 161
2026053214 18.8 14
1146377
2555
023
073
47144
267
062
54498
056
797
173
0.8 79.7 76.5 12.3 1.8 6.4 81.8 3.6 45.5 5.3 0.0 0.0 0.0 4.5 32.6 6.9 3.0 0.0 0.0 0.0 10.8 7.4 0.0 27.1 * 7.2 0.0 1.4
651
20.7 65.9 18.5 21.2 24.6 8.6 0.0 10.2 17.8 0.6 0.0 9.7 24.3 9.9 5.7
516 988 1073 552 309 105 66 645 338 170 113 575 841 223 31421351072599
199 117 76 9 07106 6623227
60 130.6 0TOTAL 56 204 22
82.1
18133368
36.1
06
0.0
879992
88.6
229584
39.2
1355
0.3
16653
2.5
306707
43.3
113794
14.2
36402
9.0
2461714
14.4
39524
7.4
793
7.5
113723
15.6
87695
12.5
HISD Research and Accountability Appendix E-5
Data from the College Board AP datafile (July 30, 2012)
ELASAGE
Typewritten Text
28 _________

Sharpstown International School
Sterling HS
Waltrip H
S
Washington H
S
Westbury H
S
Westside H
S
Wheatley H
S
Worthing H
S
Yates HS
Young Wom
en's College Prep.AP Exam Title
N Scoring
3 or Higher
N Exams Taken
Appendix E: Advanced Placement (AP) Report for 2011-12AP Exam Results of High School Students (9th thru 12th Grades and Grade Level Not Indicated) by Exam and by Campus
Reported as Number of Students Who Scored 3 or Higher Versus Number of Exams Taken (continued)
% Scoring3 or Higher
End of ParticipatingH
igh Schools
0 * *8 2 3Art History 59
183 32.2215
99
05
0.0 13.3 100.0 * 0.0 *
Art: Studio Art-2-D Design Portfolio 3256 57.1 9
14
64.3
Art: Studio Art-3-D Design Portfolio *1 * *
1
*
*2Art: Studio Art-Drawing Portfolio 13
50 26.0 *2
* *
3 0 0 0 028 17 21 14 11Biology 266
739 36.0 *4
2643
10.7 0.0 * 0.0 60.5 0.0 0.0
3 7 0 0 *8 23 21 20 3Calculus AB 0
22349876 39.8
515
1933
016
37.5 0.0 30.4 33.3 0.0 57.6 0.0 0.0 *
Calculus BC 187214 87.4
3950
78.0
0 0 0 *15 10 6 2Chemistry 0
27128436 29.4
27
2745
024
0.0 0.0 0.0 28.6 0.0 60.0 0.0 *
HISD Research and Accountability Appendix E-6
Data from the College Board AP datafile (July 30, 2012)
ELASAGE
Typewritten Text
ELASAGE
Typewritten Text
29
ELASAGE
Typewritten Text
_________

Sharpstown International School
Sterling HS
Waltrip H
S
Washington H
S
Westbury H
S
Westside H
S
Wheatley H
S
Worthing H
S
Yates HS
Young Wom
en's College Prep.AP Exam Title
N Scoring
3 or Higher
N Exams Taken
Appendix E: Advanced Placement (AP) Report for 2011-12AP Exam Results of High School Students (9th thru 12th Grades and Grade Level Not Indicated) by Exam and by Campus
Reported as Number of Students Who Scored 3 or Higher Versus Number of Exams Taken (continued)
% Scoring3 or Higher
End of ParticipatingH
igh Schools
* *4 2Chinese Language & Culture 36
41 87.866
* * 100.0
Computer Science A 47151 31.1 4
6
66.7
Computer Science AB
3 4 2 015 37 107 16Economics: Macroeconomics 0
93471245 27.9 0
112290
20.0 0.0 10.8 0.0 1.9 24.4 0.0
0 05 18Economics: Microeconomics 82
201 40.8 *2
0.0 * 0.0
2 9 8 0 022 97 148 50 19English Language & Composition 0
277992968 26.9
634
107208
033
9.1 0.0 9.3 17.6 5.4 51.4 0.0 0.0 0.0
3 12 4 1 014 77 79 55 29English Literature & Composition 0
195001887 26.5
216
66148
026
21.4 0.0 15.6 12.5 5.1 44.6 1.8 0.0 0.0
0 2 0 016 19 28 6Environmental Science 0
25132574 23.0
4674
0.0 0.0 10.5 62.2 0.0 0.0
HISD Research and Accountability Appendix E-7
Data from the College Board AP datafile (July 30, 2012)
ELASAGE
Typewritten Text
30 ________

Sharpstown International School
Sterling HS
Waltrip H
S
Washington H
S
Westbury H
S
Westside H
S
Wheatley H
S
Worthing H
S
Yates HS
Young Wom
en's College Prep.AP Exam Title
N Scoring
3 or Higher
N Exams Taken
Appendix E: Advanced Placement (AP) Report for 2011-12AP Exam Results of High School Students (9th thru 12th Grades and Grade Level Not Indicated) by Exam and by Campus
Reported as Number of Students Who Scored 3 or Higher Versus Number of Exams Taken (continued)
% Scoring3 or Higher
End of ParticipatingH
igh Schools
* 123 46European History 36
102 35.3*4
08
* 26.1 * 0.0
*2French Language & Culture 23
27 85.2 66
* 100.0
French Literature
German Language & Culture 1415 93.3 *
3
*
116Government & Politics: Comparative 2
17 11.8
6.3
1 1 2 0 012 37 91 29 16Government & Politics: United States 0
113481900 18.3
216
45164
015
8.3 0.0 2.7 12.5 2.2 27.4 0.0 0.0 0.0
6 1 050 16 31Human Geography 317
1594 19.9057
40119
174
12.0 0.0 6.3 33.6 0.0 1.4
Italian Language & Culture 2122 95.5
HISD Research and Accountability Appendix E-8
Data from the College Board AP datafile (July 30, 2012)
ELASAGE
Typewritten Text
31
ELASAGE
Typewritten Text
_________

Sharpstown International School
Sterling HS
Waltrip H
S
Washington H
S
Westbury H
S
Westside H
S
Wheatley H
S
Worthing H
S
Yates HS
Young Wom
en's College Prep.AP Exam Title
N Scoring
3 or Higher
N Exams Taken
Appendix E: Advanced Placement (AP) Report for 2011-12AP Exam Results of High School Students (9th thru 12th Grades and Grade Level Not Indicated) by Exam and by Campus
Reported as Number of Students Who Scored 3 or Higher Versus Number of Exams Taken (continued)
% Scoring3 or Higher
End of ParticipatingH
igh Schools
13 41 77 13 028 46 223 31 14Spanish Language 4
1014082432 57.9
67
106152
524
46.4 40.0 89.1 85.7 34.5 69.7 41.9 20.8 0.0
* 31 11Spanish Literature 90
161 55.9 1420
* 27.3 70.0
2 9 1 0 *11 29 12 8 1Statistics 249
532 46.8 1212
18.2 31.0 8.3 100.0 0.0 *
0 7 3 0 049 77 110 34 14United States History 0
225452327 23.4 0
3062226
118
0.0 0.0 9.1 0.0 2.7 27.4 0.0 5.6 0.0
2 5 9 0 042 90 141 23 29World History 0
196053214 18.8 1
3983293
115
4.8 0.0 5.6 2.6 6.4 28.3 0.0 6.7 0.0
98
13.0 17.3 12.7 4.0 0.0
354 567 1130 346 166446
206143 14 07106
23227 30.6TOTAL
1.9
27252
10.7
8401859
45.2
7228
3.1
182
1.2
HISD Research and Accountability Appendix E-10
Data from the College Board AP datafile (July 30, 2012)
ELASAGE
Typewritten Text
32 ________

Sharpstown International School
Sterling HS
Waltrip H
S
Washington H
S
Westbury H
S
Westside H
S
Wheatley H
S
Worthing H
S
Yates HS
Young Wom
en's College Prep.AP Exam Title
N Scoring
3 or Higher
N Exams Taken
Appendix E: Advanced Placement (AP) Report for 2011-12AP Exam Results of High School Students (9th thru 12th Grades and Grade Level Not Indicated) by Exam and by Campus
Reported as Number of Students Who Scored 3 or Higher Versus Number of Exams Taken (continued)
% Scoring3 or Higher
End of ParticipatingH
igh Schools
13 41 77 13 028 46 223 31 14Spanish Language 4
1014082432 57.9
67
106152
524
46.4 40.0 89.1 85.7 34.5 69.7 41.9 20.8 0.0
* 31 11Spanish Literature 90
161 55.9 1420
* 27.3 70.0
2 9 1 0 *11 29 12 8 1Statistics 249
532 46.8 1212
18.2 31.0 8.3 100.0 0.0 *
0 7 3 0 049 77 110 34 14United States History 0
225452327 23.4 0
3062226
118
0.0 0.0 9.1 0.0 2.7 27.4 0.0 5.6 0.0
2 5 9 0 042 90 141 23 29World History 0
196053214 18.8 1
3983293
115
4.8 0.0 5.6 2.6 6.4 28.3 0.0 6.7 0.0
98
13.0 17.3 12.7 4.0 0.0
354 567 1130 346 166446
206143 14 07106
23227 30.6TOTAL
1.9
27252
10.7
8401859
45.2
7228
3.1
182
1.2
HISD Research and Accountability Appendix E-10
Data from the College Board AP datafile (July 30, 2012)
ELASAGE
Typewritten Text
33
ELASAGE
Typewritten Text
________
ELASAGE
Typewritten Text

34 Appendix F __________
Appendix F: 2012 AP Course and Exam Data by Campus, Grades 9–12 (Duplicated Count)
School
Grade 10-12
Enroll.
AP Courses Offered
AP Course Enroll.
N Comp. AP
Course
% Comp. AP
Course (of AP
Enroll.) N Exams
Taken N Exams Score 3+
Rate of Exams Taken (by AP Comp.)
Rate of Exams
3+ (of AP Comp.)
Austin 1,205 15 439 350 79.7 516 107 147.4 30.6 Bellaire† 2,478 22 2,320 2,272 97.9 2,599 2,135 114.4 94.0 Carnegie 319 23 1,006 946 94.0 988 651 104.4 68.8 Challenge 324 3 276 223 80.8 368 133 165.0 59.6 Chavez 1,745 16 973 875 89.9 1,073 199 122.6 22.7 CLC 24 2 8 4 50.0 6 0 150.0 0.0 Davis 1,024 13 545 476 87.3 552 117 116.0 24.6 DeBakey 600 14 1,044 1,007 96.5 992 879 98.5 87.3 East Early Col. 316 8 206 203 98.5 309 76 152.2 37.4 Eastwood 288 16 486 434 89.3 584 229 134.6 52.8 Empowerment 58 6 103 76 73.8 105 9 138.2 11.8 E-STEM C 99 10 324 284 87.7 355 1 125.0 0.4 E-STEM W 83 4 136 136 100.0 66 0 48.5 0.0 Furr 516 17 948 781 82.4 653 16 83.6 2.0 Houston Acad Int’l 281 10 322 291 90.4 338 60 116.2 20.6 Houston M/S/T 1,717 14 831 767 92.3 794 113 103.5 14.7 HSLECJ 388 12 669 631 94.3 645 66 102.2 10.5 HSPVA 480 11 732 729 99.6 707 306 97.0 42.0 Jones 312 10 194 186 95.9 170 1 91.4 0.5 Jordan 712 13 488 450 92.2 402 36 89.3 8.0 Kashmere 311 8 111 110 99.1 113 0 102.7 0.0 Lamar† 2,295 5 1,640 1,477 90.1 1,714 246 116.0 16.7 Lee 1,039 17 610 548 89.8 575 56 104.9 10.2 Madison 1,407 14 645 556 86.2 524 39 94.2 7.0 Milby 1,323 15 725 653 90.1 841 204 128.8 31.2 Mt. Carmel 245 5 85 81 95.3 93 7 114.8 8.6 N. Houston EC 284 7 187 154 82.4 223 22 144.8 14.3 Reagan 1,400 19 823 777 94.4 723 113 93.1 14.5 Scarborough 445 15 417 357 85.6 314 18 88.0 5.0 Sharpstown 824 14 607 546 90.0 695 87 127.3 15.9 Sharpstown Int’l 297 16 441 396 89.8 354 46 89.4 11.6 Sterling 599 12 243 206 84.8 206 4 100.0 1.9 Waltrip 1,201 16 688 604 87.8 567 98 93.9 16.2 Washington 551 12 430 315 73.3 252 27 80.0 8.6 Westbury 1,477 19 1,077 933 86.6 1,130 143 121.1 15.3 Westside 2,165 29 2,063 1,942 94.1 1,859 840 95.7 43.3 Wheatley 616 13 348 316 90.8 346 14 109.5 4.4 Worthing 524 13 249 232 93.2 228 7 98.3 3.0 Yates 658 16 236 213 90.3 166 0 77.9 0.0 Young Women’s 0 1 77 51 66.2 82 1 160.8 2.0 HISD 32,184 23,752 21,588 90.9 23,227 7,106 107.6 32.9 Note: Exam and course counts presented are duplicated counts. A student may take more than one AP exam or course. †
Bellaire and Lamar high schools offer the International Baccalaureate (IB) Program.
Appendix G 35 ____________
Appendix G: AP Scholar Awards 2011 and 2012
School 2011 2012
Scholar Honor Distinction National Total Scholar Honor Distinction National Total Austin 2 0 0 0 2 Bellaire 122 56 193 64 435 162 73 197 69 501 Carnegie 59 13 31 9 112 70 24 45 9 148 Challenge 5 2 0 0 7 10 2 0 0 12 Chavez 5 0 0 0 5 10 0 0 0 10 Davis 0 2 0 0 2 6 0 1 1 8 DeBakey 54 34 64 18 170 48 41 84 24 197 East ECC 3 0 0 0 3 5 1 0 0 6 Eastwood 9 0 1 0 10 19 3 5 0 27 Furr 0 1 0 0 1 1 0 0 0 1 Houston Acad Int’l 0 0 0 0 0 0 0 1 0 1 Houston M/S/T 3 1 0 0 4 4 0 1 0 5 HSLECJ 5 1 1 0 7 4 0 0 0 4 HSPVA 26 5 14 2 47 35 7 10 2 54 Jones 1 0 0 0 1 0 0 0 0 0 Jordan 1 0 0 0 1 0 1 1 0 2 Lamar 0 0 0 0 0 5 0 0 0 5 Lee 13 2 2 1 18 3 0 0 0 3 Madison 0 0 0 0 0 2 0 0 0 2 Milby 19 3 1 0 23 16 0 1 0 17 Mt. Carmel 0 1 0 0 1 0 0 1 0 1 N. Houston EC 0 0 0 0 0 3 2 0 0 5 Reagan 9 1 1 1 12 11 2 0 0 13 Scarborough 4 0 0 0 4 1 0 0 0 1 Sharpstown 0 0 0 0 0 1 0 0 0 1 Sharpstown Int’l 1 1 0 0 2 2 1 0 0 3 Waltrip 12 0 0 0 12 8 1 1 0 10 Washington 6 1 1 0 8 4 0 0 0 4 Westbury 5 1 2 0 8 12 1 1 0 14 Westside 111 20 39 6 176 110 17 34 8 169 Yates 1 0 0 0 1 0 0 0 0 0 HISD 474 145 350 101 1,070 555 176 383 113 1,227
• AP Scholar: Granted to students who receive scores of 3 or higher on three or more AP exams; • AP Scholar with Honor: Granted to students who receive an average score of at least 3.25 on all AP Exams taken, and scores of 3 or higher on four or more of these exams; • AP Scholar with Distinction: Granted to students who receive an average score of at least 3.5 on all AP Exams taken, and scores of 3 or higher on five or more of these exams; and • National AP Scholar: Granted to students in the United States who receive an average score of at least 4 on all AP Exams taken, and scores of 4 or higher on eight or more of these
exams.
Related Documents