University of Arkansas, Fayetteville University of Arkansas, Fayetteville ScholarWorks@UARK ScholarWorks@UARK Graduate Theses and Dissertations 8-2017 Membranes for Food and Bioproduct Processing Membranes for Food and Bioproduct Processing Alexandru Marius Avram University of Arkansas, Fayetteville Follow this and additional works at: https://scholarworks.uark.edu/etd Part of the Biochemistry Commons, Food Processing Commons, Membrane Science Commons, and the Polymer and Organic Materials Commons Citation Citation Avram, A. M. (2017). Membranes for Food and Bioproduct Processing. Graduate Theses and Dissertations Retrieved from https://scholarworks.uark.edu/etd/2375 This Dissertation is brought to you for free and open access by ScholarWorks@UARK. It has been accepted for inclusion in Graduate Theses and Dissertations by an authorized administrator of ScholarWorks@UARK. For more information, please contact [email protected].

Welcome message from author
This document is posted to help you gain knowledge. Please leave a comment to let me know what you think about it! Share it to your friends and learn new things together.
Transcript
University of Arkansas, Fayetteville University of Arkansas, Fayetteville
ScholarWorks@UARK ScholarWorks@UARK
Graduate Theses and Dissertations
8-2017
Membranes for Food and Bioproduct Processing Membranes for Food and Bioproduct Processing
Alexandru Marius Avram University of Arkansas, Fayetteville
Follow this and additional works at: https://scholarworks.uark.edu/etd
Part of the Biochemistry Commons, Food Processing Commons, Membrane Science Commons, and
the Polymer and Organic Materials Commons
Citation Citation Avram, A. M. (2017). Membranes for Food and Bioproduct Processing. Graduate Theses and Dissertations Retrieved from https://scholarworks.uark.edu/etd/2375
This Dissertation is brought to you for free and open access by ScholarWorks@UARK. It has been accepted for inclusion in Graduate Theses and Dissertations by an authorized administrator of ScholarWorks@UARK. For more information, please contact [email protected].
Membranes for Food and Bioproduct Processing
A dissertation submitted in partial fulfillment of the requirements for the degree of
Doctor of Philosophy in Engineering with a Concentration in Chemical Engineering
by
Alexandru M. Avram Technische Hochschule Mittelhessen
Diplom Ingenieur (FH), 2012
August 2017 University of Arkansas
This dissertation is approved for recommendation to the Graduate Council. ____________________________________ Dr. Ranil Wickramasinghe Dissertation Director ____________________________________ ____________________________________ Dr. Michael D. Ackerson Dr. Ed Clausen Committee Member Committee Member ____________________________________ ____________________________________ Dr. Peter Czermak Dr. Xianghong Qian Committee Member Committee Member

Abstract
Modified membranes for process intensification in biomass hydrolysis
Production of biofuels and chemicals from lignocellulosic biomass is one of the leading candidates
for replacement of petroleum based fuels and chemicals. However, conversion of lignocellulosic
biomass into fuels and chemicals is not cost effective compared to the production of fuels and
chemicals from crude oil reserves. Some novel and economically feasible approaches involve the
use of ionic liquids as solvents or co-solvents, since these show improved solvation capability of
cellulose over simple aqueous systems. Membranes offer unique opportunities for process
intensification which involves fractionation of the resulting biomass hydrolysate leading to a more
efficient and cheaper operation.
This research attempts to develop membranes that would usher the economics of the biochemical
conversion of lignocellulosic biomass into fuels and chemicals by recycling the expensive ionic
liquid. The overall aim of this work is the development of novel membranes with unique surface
properties that enable the selective separation of non-reacted cellulose and hydrolysis sugars from
ionic liquids.
Nanofiltration separation for application in food product engineering
With the advent of the modern, well-informed consumer who has high expectations from the
nutritional value of consumed food products, novel approaches are being developed to produce
nutrient-enhanced foods and drinks. As a response to the consumer needs, different techniques to
recover, concentrate and retain as much as possible of bioactive compounds are being investigated.
Membrane technology has the advantage of selective fractionation of food products (e.g. salt
removal, removal of bitter-tasting compounds or removal of sugar for sweet taste adjustment),
volume reduction, and product recovery at mild conditions. In this work, we use nanofiltration in
dead-end and crossflow mode to concentrate polyphenols from blueberry pomace. Blueberry

pomace is an overlooked waste product form the juice pressing of blueberries that contains high
amounts of health-beneficial antioxidants. We aim at developing a simple, yet efficient membrane
process that reduces the amount of water and thus concentrates the amount of polyphenols in the
retentate.

©2017 by Alexandru M. Avram All Rights Reserved

Acknowledgements
Hereby I would like to include my sincere gratitude towards Dr. Ranil Wickramasinghe, my main
PhD thesis adviser. In German we would call him Doktorvater (= doctorate dad) and I am very
grateful that he took me under his protective wing and advised me in times of great despair. I
specifically appreciated him for allowing me to address him by his fist name and also for the speed
at which he responded to emails 365/365 and 366/366 (2016 was a leap year). Some students
estimate his response speed at 0.99 x c.
A warm “Thank you!” to all of my committee members. Dr. Clausen, with such a full plate, thank
you for spontaneously accepting to join the gang.
A large number of “Thank you!”s are forwarded to the University of Arkansas and to the Chemical
Engineering Department who opened their doors to me and provided me with the tools and
environment to grow into a better scientist. My work and extracurricular activities have often been
featured in the local Newswire. That gave me pride and excellent motivation to continue the pursuit
of my education. Hereby, I would also like to mention and acknowledge Amanda Cantu, Amber
Hutchinson, Tammy Lutz-Rechtin, Dr. Bob Beitle and Dr. Jerry Havens.
It is not possible to convey in words my gratitude to thank my mother and step father for supporting
me through the PhD. Mama, mulţumesc din toată inima ca ai avut rabdare cu mine, ca m-ai crescut
excelent şi nu ai pierdut increderea in mine! Burkhard, vielen Dank dass du mich stets unterstützt
hast und dass du ein sehr guter und ehrlicher Elternteil und Freund warst!

Dedication
I dedicate these words of encouragement to all struggling graduate students.
“Knowledge, when appropriated genuinely and passionately, is both empowering and humbling.
It will allow you to roughly grasp the pulse of the entire human kind, as it currently stands.”
- Alex Avram, November 13 2016
(This is an article that I wrote and published as U of A online blogger for ISS.)
Between now and then, I don’t want you to be afraid of change. Change is exciting, you get to
close a life chapter and begin another. On your own terms. If the latter did not end with And they
lived happily ever after, this is your chance to re-write the ending.
Between now and then, I want you to know that you were crafted perfectly flawless. You were
given everything necessary to become brave and capable. Your mind is inquisitive and locked
inside are countless skills. It is up to you to unlock your potential and be the best that you can
possibly be.
Between now and then, I want you to believe in your power of judgement. Always judge and
analyze your next move before attempting it. Make intellectually informed decisions and stick with
them. Saying what you mean and meaning what you say goes a long way.
Between now and then, I want you to be daring. If something sounds too risky and if the thought
of it gives you shivers and a fuzzy feeling in your stomach, it’s probably worth pursuing.

Between now and then, I don’t want you to have blind faith and follow the herd. I want you to be
inquisitive and train a scientific sense of discovering and explaining the unknown. Answering the
Why? and How? is both challenging and endlessly rewarding. Henley would tell you that “you are
the captain of your soul and the master your fate”. There is truth in that poetic verse, because fate
is not given, but self-made. Purposely put yourself in front of opportunity, recognize it and seize
it when you want it. Don’t wait for the odds to fall in your favor, instead re-arrange the odds so
that they fall, neatly, in your favor.
Between now and then, I want you to trust in your capacity to conquer your fears and defeat your
weaknesses. You are self-made and you deserve to become the best that you can be. You are your
biggest hero.
Between now and then, I want you to know that things will always get better. You will be thrown
in the midst of heavy storms and your strength will be trialed in unsurmountable situations. You
will be knocked down and you will fall on your knees. But remember, that in spite of all, things
will simply. Always. Get better. Because even the heaviest of storms eventually comes to a still-
stand. And when the gloomy clouds start wondering away, that instant is your moment to take a
deep breath in – go ahead! Take a deep breath in! – then rise up stronger and build a better storm
shelter.

Table of contents
1. INTRODUCTION................................................................................................................. 1
1.1. THE CASE OF DWINDLING FOSSIL FUELS AND THE CONCEPT OF BIOREFINERY ................... 1
1.2. LIGNOCELLULOSIC BIOMASS HYDROLYSIS ..................................................................... 10
1.2.1. Enzymatic decomposition of cellulose ........................................................................ 15
1.2.2. Chemical decomposition of cellulose .......................................................................... 16
1.3. IONIC LIQUIDS ................................................................................................................ 18
1.3.1. Mode of cellulose dissolution by ionic liquids ............................................................ 20
1.3.2. Cellulose hydrolysis with ionic liquids ....................................................................... 21
1.3.3. Separation techniques for biomass hydrolysis applications ....................................... 23
1.3.4. Quantitative measurements ......................................................................................... 27
1.4. MEMBRANE SEPARATIONS ............................................................................................. 28
1.4.1. Membrane separation and classification .................................................................... 28
1.4.2. Market relevance of membrane technology ................................................................ 30
1.4.3. Nanofiltration .............................................................................................................. 32
1.4.4. Fouling of nanofiltration membranes ......................................................................... 34
1.4.5. Membrane reactors ..................................................................................................... 36
REFERENCES .............................................................................................................................. 43
2. NANOFILTRATION MEMBRANES FOR IONIC LIQUID RECOVERY ................ 53
2.1. INTRODUCTION.................................................................................................................... 53
2.2. EXPERIMENTAL ................................................................................................................... 57
Materials ............................................................................................................................... 57
Membrane modification via interfacial polymerization (IP) ................................................ 57

Surface Characterization ...................................................................................................... 58
Rejection experiments ........................................................................................................... 59
2.3. RESULTS AND DISCUSSION .................................................................................................. 62
IP membranes ....................................................................................................................... 62
Surface analysis .................................................................................................................... 65
2.4. CONCLUSION ....................................................................................................................... 72
ACKNOWLEDGEMENTS ............................................................................................................... 73
REFERENCES .............................................................................................................................. 73
3. POLYELECTROLYTE MULTILAYER MODIFIED NANOFILTRATION
MEMBRANES FOR THE RECOVERY OF IONIC LIQUID FROM DILUTE AQUEOUS
SOLUTIONS ............................................................................................................................... 76
3.1. INTRODUCTION.................................................................................................................... 76
3.2. EXPERIMENTAL ................................................................................................................... 78
Materials ............................................................................................................................... 78
Static layer-by-layer deposition of PEMs ............................................................................. 79
Membrane characterization .................................................................................................. 80
Rejection analysis ................................................................................................................. 82
3.3. RESULTS AND DISCUSSIONS ................................................................................................. 83
ATR-FTIR analysis................................................................................................................ 83
Contact angle measurement .................................................................................................. 84
AFM imaging ........................................................................................................................ 85
SEM imaging ......................................................................................................................... 87
Zeta potential measurement .................................................................................................. 88

Rejection and permeance ...................................................................................................... 89
Selectivity of ionic liquid over monomeric sugar ................................................................. 93
Comparative study ................................................................................................................ 95
3.4. CONCLUSION ....................................................................................................................... 98
ACKNOWLEDGEMENTS ............................................................................................................... 99
REFERENCES .............................................................................................................................. 99
SUPPORTING INFORMATION ...................................................................................................... 105
4. CONCENTRATION OF POLYPHENOLS FROM BLUEBERRY POMACE
EXTRACT USING NANOFILTRATION ............................................................................. 111
4.1. INTRODUCTION.................................................................................................................. 111
4.2. MATERIALS AND METHODS .............................................................................................. 114
Pressurized hot water extraction ........................................................................................ 114
Dead-end filtration.............................................................................................................. 115
Crossflow filtration ............................................................................................................. 116
Total polyphenol analysis ................................................................................................... 117
Membrane cleaning and fouling index ............................................................................... 119
4.3. RESULTS AND DISCUSSION ................................................................................................ 120
Total polyphenols and sugar retention ............................................................................... 120
Dead-end filtration.............................................................................................................. 121
Crossflow filtration ............................................................................................................. 127
Membrane reconditioning ................................................................................................... 129
4.4. CONCLUSION ..................................................................................................................... 132
ACKNOWLEDGEMENTS ............................................................................................................. 133
REFERENCES ............................................................................................................................ 134
Supplemental Information ................................................................................................... 137
5. CONCLUSION AND FUTURE OUTLOOK ................................................................. 143
List of Figures
Figure 1-1: US production and consumption of natural gas (above) and petroleum products
(bellow) that include liquid fuels from 1950 through 2015. With permission from EIA. .............. 2
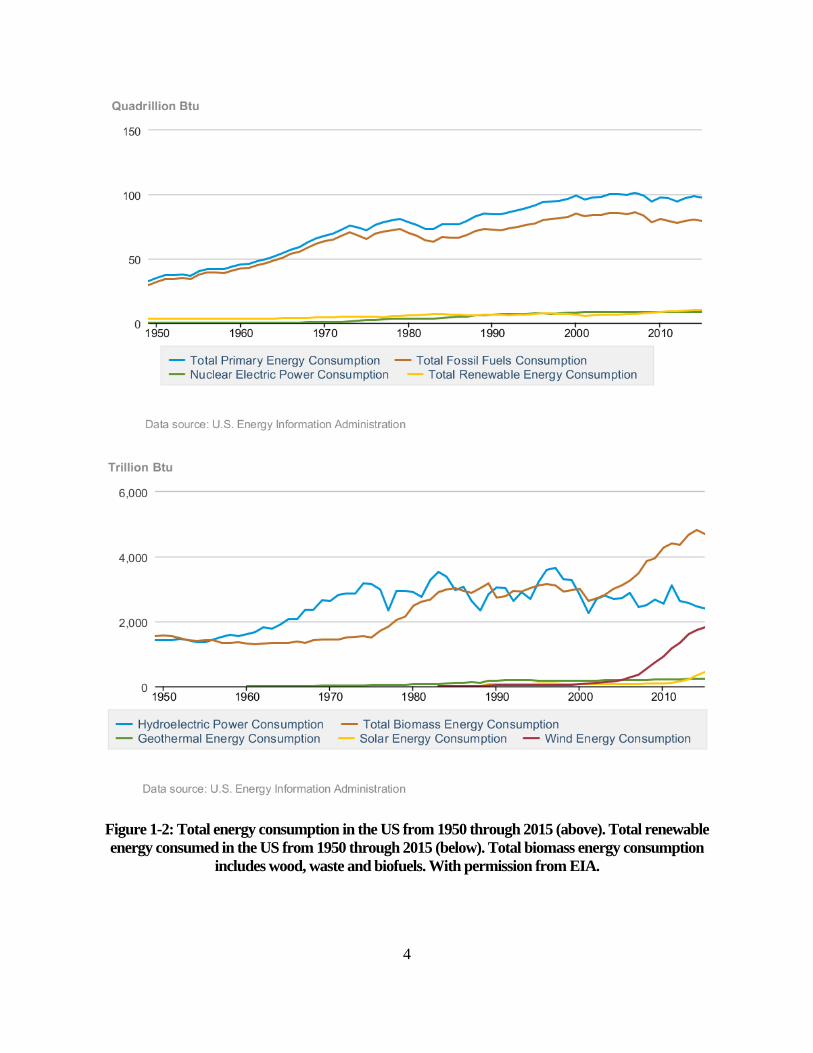
Figure 1-2: Total energy consumption in the US from 1950 through 2015 (above). Total renewable
energy consumed in the US from 1950 through 2015 (below). Total biomass energy consumption
includes wood, waste and biofuels. With permission from EIA. .................................................... 4
Figure 1-3: Biorefinery and potential green products. .................................................................... 7
Figure 1-4: Envisioned catalytic membrane reactor system with the modified membrane unit
operations for biomass catalysis and ionic liquid recycling. The pressure line is added to control
membrane permeability. ............................................................................................................... 10
Figure 1-5: Drawing showing schematic structure of plant cell wall with lignocellulosic
components. .................................................................................................................................. 12
Figure 1-6: Lignin building blocks: oumaryl alcohol (I), coniferyl alcohol (II) and sinapyl alcohol
(III). ............................................................................................................................................... 13
Figure 1-7: Example of one type of hemicellulose (arabinoxylan) with β-(1-4)-glycosidic and α-
(1-3)-glycosidic bonds emphasized. ............................................................................................. 14
Figure 1-8: Cellulose molecule structure showing intra- and intermolecular weak hydrogen bonds
and the covalent C1-C4 glycosidic bond. ..................................................................................... 15
Figure 1-9: Reaction pathways for cellulose acid hydrolysis. n is typically 400-1000 monomers.
Adapted from Dr. L.T. Fan12. With permission from SpringerLink. ............................................ 17
Figure 1-10: Examples of cations and anions used as ILs in biomass dissolution and hydrolysis.
....................................................................................................................................................... 19
Figure 1-11: Membrane classification with typical working pressure, pore size and rejected
species. .......................................................................................................................................... 28
Figure 1-12: Representation of membrane separation by size-exclusion. The feed side contains
molecules of different sizes and these can permeate the membrane through channels called pores.
....................................................................................................................................................... 29
Figure 1-13: Fouling schematic showing the formation of boundary layer at membrane surface.
....................................................................................................................................................... 34
Figure 1-14: Two approaches in membrane reactors: the extractor membrane (above) and the
distributor membrane (below) 121,122. ............................................................................................ 38
Figure 1-15: Membrane reactor scheme. Reprinted from Liu et al. 126, copyright (2005), with
permission from Elsevier. ............................................................................................................. 40
Figure 1-16: Continuous enzymatic membrane reactor. The reactor consists of a stirred tank reactor
coupled to a ceramic membrane, which prevented the sorption of the pollutant and allowed the
recovery and recycling of the biocatalyst. Reprinted from Arca-Ramos et al. 127, copyright (2015),
with permission from SpringerLink. ............................................................................................. 41
Figure 2-1: Reaction scheme for interfacial polymerization with expected products; 3-
aminophenylboronic acid (BA) and piperazine (PIP) are in aqueous solution while trimesoyl
chloride (TMC) is in hexane. ........................................................................................................ 58
Figure 2-2: Variation of permeance and rejection of cellobiose, glucose EmimOAc and BmimCl
as a function of polymerization time for modified 50 kDa PES membranes. Modification
conditions were: 1.0 and 0.1 wt % PIP and BA respectively in the aqueous phase, reaction

temperature 25°C. Insets show AFM surface analysis of selected membranes with roughness 9.4
and 38.6 nm from left to right, respectively. All AFM imaging scale resolution at 0-5 µm. ....... 64
Figure 2-3: FTIR spectra for 30 kDa base and modified membranes. Modification conditions were:
1.0 and 0.5 wt % PIP and BA respectively in the aqueous phase, reaction temperature -4 °C,
polymerization times of 1, 15 and 25 min. ................................................................................... 66
Figure 2-4: Variation of permeance and rejection of cellobiose, and BmimCl as a function of BA
concentration for modified 30 kDa modified PES membranes. Modification conditions were: 1.0
wt % PIP in the aqueous phase, reaction temperature was -4 °C for a reaction time of 15 min.
Insets show AFM surface analysis of membranes modified with 0.1 and 1.0 wt % BA with
roughness 31.0 and 46.6 nm from left to right, respectively. All AFM imaging scale resolution at
0-5 µm. .......................................................................................................................................... 68
Figure 2-5: Variation of permeance and rejection of cellobiose, and BmimCl as a function of Et3N
concentration for unmodified and modified 30 kDa PES membranes. The Et3N concentration was
chosen such that the ratio of BA:Et3N was 1:1.5. Modification conditions were: 1.0 wt % PIP in
the aqueous phase reaction temperature was -4 °C for a reaction time of 5 min. ......................... 70
Figure 3-1: Static LBL deposition of PEM on a base membrane. First, one layer is formed after
contacting with the polycation solution (or polyanion for alumina), then the membrane is rinsed
before dipping into the second solution of oppositely charged polyion to form one bilayer. The
alumina membranes were capped with PSS to be comparable to PES. The process is repeated for
the desired bilayer number (δ). ..................................................................................................... 80
Figure 3-2: FTIR analysis of PEMs modified with 10, 16 and 18 PAH/PSS bilayers on PES base
membrane. ..................................................................................................................................... 84

Figure 3-3: Contact angle measurements performed with deionized water droplet solution and
recorded after 3 seconds. Values for the modified membranes represent the average of four
measurements taken at three distinct locations on the membrane surface. Insets show droplet
formation for the two distinct base membranes. ........................................................................... 85
Figure 3-4: AFM images at 1 µm x 1 µm resolution in two dimensional and three dimensional
(3D) display. (A; A-3D) unmodified alumina oxide, roughness 3.8 nm. (B; B-3D) unmodified PES,
roughness 3.6 nm. (C; C-3D) (PSS/PAH)8PSS on alumina oxide, roughness 11.9 nm. (D; D-3D)
(PAH/PSS)16 on PES, roughness 5.7 nm. These membranes were not used for rejection analysis
but they were previously equilibrated with deionized water until constant permeance. .............. 86
Figure 3-5: Cross-sectional SEM images of alumina oxide and PES. A1.: unmodified 0.2 µm
alumina oxide (magnification: 2000x); A2.: (PSS/PAH)8PSS (magnification: 2000x and 8000x
inset); P1.: unmodified 50 kDa PES (magnification: 400x and 2000x inset); P2.: (PAH/PSS)9
(magnification: 500x and 2000x inset). ........................................................................................ 88
Figure 3-6: Zeta potential measurements of unmodified base membranes (black lines) and of the
modified PEM membranes (colored lines). Lines connecting data markers are for guidance only.
Relative error from 3 repeated measurements was ±5.5%. .......................................................... 89
Figure 3-7: Permeance (bars) and solute rejection (lines with markers) as a function of
(PSS/PAH)nPSS bilayer number using alumina oxide disc as base membrane. Lines are there to
guide the eye. Relative error for the rejection data was between ±3.2% and ±5.8% from triplicates.
....................................................................................................................................................... 90
Figure 3-8: Permeance (bars) and solute rejection (lines with markers) as a function of (PAH/PSS)n
bilayer number using PES as base membrane. Lines are there to guide the eye. Relative error for
the rejection data was between ±1.7% and ±5.3% from triplicates. ............................................. 92

Figure 4-1: Accelerated Solvent Extraction system. The pomace is loaded in the extraction cell,
water is pumped through the system, and polyphenols are recovered as aqueous solution in the
collection vessels. ....................................................................................................................... 115
Figure 4-2: Process flow of experimental setup for nanofiltration in crossflow mode. A: Feed
stirred vessel; B: Piston pump; C: Permeate collection and balance; D: Crossflow cell; E: Pressure
regulator and F: gas supply. ........................................................................................................ 117
Figure 4-3: Effect of stirring speed on permeance. Data reflects the feed permeance after a constant
volume for both membranes was collected in permeate. ............................................................ 123
Figure 4-4: Permeance with non-prefiltered and filtered blueberry pomace extract, 200 rpm. .. 124
Figure 4-5: Filtration at extended times. Stirring speed 200 rpm. .............................................. 126
Figure 4-6: Crossflow filtration with 0.22 µm prefiltered feed, 200 rpm, performed at a crossflow
rate of 57 mL/min and 3 bar transmembrane pressure. .............................................................. 128
Figure 4-7: Recovery of permeance for membranes used in dead-end mode using 0.22 µm
prefiltered feed at 200 rpm. Data is shown in duplicates for each membrane and water was used as
testing feed. 100% relative permeance was 14.1 and 5.4 L m-2 h-1 bar-1 for NF270 and NF245,
respectively. ................................................................................................................................ 131
Figure 4-8: Recovery of permeance for membranes used in crossflow mode using 0.22 µm
prefiltered feed at 200 rpm. Water was used as feed and all other parameters were constant.
Washing steps are shown in chronological order. For NF270 100% relative permeance corresponds
to 13.2 L m-2 h-1 bar-1 and for NF245 100% relative permeance corresponds to 4.6 L m-2 h-1 bar-1.
..................................................................................................................................................... 132
List of Tables
Table 1-1: Typical composition of lignocellulosic raw materials. ............................................... 11
Table 1-2: Commercial pricing list of ionic liquids commonly used with biomass hydrolysis. .. 18
Table 1-3: Molecular weights of sugar monomers released during acid biomass hydrolysis and of
ionic liquids commonly used with biomass dissolution. .............................................................. 24
Table 1-4: Advantages of inorganic membranes with respect to organic membranes. ................ 37
Table 2-1: Summary of membrane modification conditions and feed streams tested. ................. 60
Table 2-2: Molecular weight of solutes. ....................................................................................... 62
Table 2-3: Variation of rejection with PIP concentration for modified 50 kDa base PES membranes
for aqueous feed streams containing single component sugars and ionic liquids. Modification
conditions were: 0.1 wt %. BA in the aqueous phase, reaction temperature were 25°C for a reaction
time of 15 min. .............................................................................................................................. 63
Table 2-4: Variation of rejection with BA concentration for modified 30 kDa base PES membranes
for aqueous feed streams containing single component sugars and ionic liquids. Modification
conditions were: 1.0 wt % PIP in the aqueous phase reaction temperature was -4 °C for a reaction
time of 15 min. .............................................................................................................................. 67
Table 2-5: Variation of rejection in the presence of Et3N. The Et3N concentration was chosen
such that the ratio of BA:Et3N was 1:1.5. Results are for modified 30 kDa base PES membranes
for aqueous feed streams containing single component sugars and ionic liquids. Modification
conditions were: 1.0 wt % PIP in the aqueous phase reaction temperature was -4 °C for a reaction
time of 5 min. ................................................................................................................................ 69

Table 2-6: Selectivity for BmimCl versus glucose or cellobiose for modified base 30 kDa PES
membranes. Modification conditions were: aqueous phase 1.0, 0.1, 0.115 wt% PIP, BA Et3N
respectively in the aqueous phase, reaction temperature -4 °C for a reaction time of 8 min. ...... 71
Table 3-1: Selection of base membranes, type and amount of deposited polyelectrolytes. ......... 79
Table 3-2: Feed compound concentration in the three model feeds and their analytical properties.
....................................................................................................................................................... 83
Table 3-3: Effect of feed pH and sampling time on compounds rejection with (PSS/PAH)9PSS
deposited on 0.2 µm alumina discs. .............................................................................................. 91
Table 3-4: Summary of selected modified nanofiltration membranes with selectivity and
permeance. .................................................................................................................................... 94
Table 3-5: Comparison of this work with other similar published work on ionic liquid recycling.
Comments explain some advantages (+) and disadvantages (-). .................................................. 97
Table 4-1: HPLC analysis results for ASE extract and for retentate and permeate fractions after
rejection in dead-end mode. ........................................................................................................ 121
Table 4-2: Volume reduction and concentration factor for dead-end filtration at extended times.
..................................................................................................................................................... 127
Table 4-3: Volume reduction and concentration factor for crossflow filtration. ........................ 128
Table 4-4: Dynamic fouling index at constant permeate volume over active membrane area ratio
(V/A). .......................................................................................................................................... 130
Table 4-5: Unit operations and the recommended best procedure to assist with observed issues.
..................................................................................................................................................... 133

List of published papers
Alexandru M. Avram, Pejman Ahmadiannamini, Xianghong Qian, S. Ranil
Wickramasinghe – “Nanofiltration Membranes for Ionic Liquid Recovery”. Separation and
Purification Technology. Accepted for publication April 03 2017 (Chapter 2).
http://dx.doi.org/10.1080/01496395.2017.1316289
Alexandru M. Avram, Pejman Ahmadiannamini, Anh Vu, Xianghong Qian, Arijit Sengupta,
S. Ranil Wickramasinghe – “Polyelectrolyte Multilayer Modified Nanofiltration Membranes for
the Recovery of Ionic Liquid from Dilute Aqueous Solutions”. Journal of Applied Polymer
Science. Revision 1 of manuscript was submitted on April 19 2017 (Chapter 3).
Alexandru M. Avram, Pauline Morin, Cindi Brownmiller, Arijit Sengupta, Luke R. Howard,
S. Ranil Wickramasinghe – “Concentration of Polyphenols from Blueberry Pomace Extract
using Nanofiltration” Food and Bioproducts Processing. Manuscript was submitted on April 30
2017 (Chapter 4).
1
1. Introduction
1.1. The case of dwindling fossil fuels and the concept of biorefinery
Since its incipient exploitation that started in the 19th century, crude oil or petroleum has been the
most significant fossil-derived hydrocarbon source used for the production of liquid fuels on a
global scale. Petroleum reservoirs were formed from the thermogenic and microbial
decomposition of organic matter, known as kerogen that occurred over the last millions of years.
When the surrounding temperature of kerogen is increased to about 80°C oil is produced1 and with
temperatures exceeding 140°C natural gas is produced2. These two types of hydrocarbons coexist
and accumulate in porous, permeable rock and move upward in order of decreasing density, owing
to faults, fractures and higher permeable strata until prevented by an impermeable barrier3. Thus,
the crude oil and natural gas reservoirs form. After their discovery, various extraction methods
were intensively developed. Worth mentioning is the technology to crack the crude hydrocarbons
into constituent smaller chain aromatics, branched and unbranched polymers, that has quickly
emerged and matured into today’s probably most relevant chemical engineering endeavor. The
fractioned crude delivers commercial liquid fuels such as gasoline, diesel or kerosene and
humanity has become irrefutably dependent on a constant high-volume delivery of these fuels to
the end consumer and to all major industries.
The downside of this extraordinary process that led to the creation of high-energy packed chemical
polymers is that currently (and according to the author’s subjective knowledge) it cannot be re-
created at a similar time and volume scale. Humanity is therefore plagued with an insatiable thirst
for the “black gold” that is a dwindling resource. To put the US consumption and production of
fossil fuels into perspective, Figure 1-1 shows data from 1950 until 20154.

2
Figure 1-1: US production and consumption of natural gas (above) and petroleum products (bellow) that include liquid fuels from 1950 through 2015. With permission from EIA.
From 1950 and until 2015 the residential and industrial consumption of natural gas and petroleum
products, such as liquid fuels, have seen a continuous increase that closely followed the increase

3
in population growth, standard of living and technological advances in the US. With the advent of
the development of fracking technology that drills horizontally into oil wells and, thus reaches
more into the reservoirs, the production of fossils fuels has seen a surge in the recent decade. And
so, the consumption of fossil fuels is expected to continue its growth trend over the next decades.
However, a few limiting factors exist. Fossil fuels are a non-renewable source of energy and their
combustion is also releasing tremendous amounts of greenhouse gas (GHG) emissions into the
atmosphere which have been linked to the increase in the global annual average temperatures5.
The latter has been a source of worry for scientists worldwide as it is at the culprit of global climate
change with adverse effects on humanity.
Figure 1-2 (above) shows total energy usage from 1950 to present in the US partitioned into fossil-
fuel derived, nuclear and using renewable resources as raw material. Figure 1-2 (bellow) shows
how much of total renewables are derived from hydro, geothermal, solar, wind and biomass. It is
worth noticing how biomass accounts for the most relevant portion of total. In addition to that,
solar, wind and biomass have all seen a surge in their consumption in the modern decade as
Americans became more interested in these types and thus the market demand increased. As a
point of reference, the average American household consumed 90 million British thermal units
(Btu) in 2009, based on Residential Energy Consumption Survey (RECS) data6.
4
Figure 1-2: Total energy consumption in the US from 1950 through 2015 (above). Total renewable energy consumed in the US from 1950 through 2015 (below). Total biomass energy consumption
includes wood, waste and biofuels. With permission from EIA.

5
While depletion of fossil fuels has been foreseen imminent in the following decades7, humanity is
faced with the daunting task of establishing industrial processes using renewable feedstocks which
are economically feasible and have output volumes comparable with those of the mammoth-sized
petroleum industry. One concept developed that could potentially supply humanity with
sustainable renewable energy and that could mitigate the increasing release of GHG is the
integrated biorefinery. According to the National Renewable Energy Laboratory a biorefinery is
defined as a “facility that integrates biomass conversion processes and equipment to produce fuels,
power, and chemicals from biomass”. The integrated biorefinery is any processing facility that
converts biomass into value-added products that are either completely new or can replace fossil-
fuel derived ones. It may involve any of the following types of integration8:
• process integration: follows a holistic approach for the design and operation, in that mass,
energy and property are regarded as one unit
• infrastructure integration: allows for biorefinery products to access the existing
infrastructure. For example, biofuels can use petroleum refinery pipelines or bio-methane
can be directly injected into natural gas pipelines
• product integration: exploits the common characteristics of products from biorefinery with
those from a petroleum refinery. For example, bio-ethanol can be blended into gasoline or
bio-diesel into petrodiesel
• feedstock supply-chain integration: allows for timely coordination of the plant life-cycle
with the production activities

6
• policy and environmental integration: with a tremendous potential for product pathways,
adjacent bio-refineries can have connected feedstock and product streams and thus,
facilitate the reduction of greenhouse gases as required by environmental regulations.
Second generation feedstocks are of specific interest with the biorefinery processes. These include
forestry residues, oils, energy crops, agricultural waste and other non-edible plant material. These
feedstocks are interesting to the biorefinery concept since they do not employ edible material and
can thus have less of a detrimental long-term impact on food prices9. It follows that the biorefinery
concept has the potential of becoming a promising sustainable alternative to the well-established
petroleum refinery industry, since it uses renewable plant material to produce liquid fuels, gas fuels
and commodity polymers that are compatible with current transport and polymer infrastructure.
At the heart of bio-refinery technology is the ability to convert cellulosic feedstocks into its
building blocks, which can then be further processed into useful end-user products such as bio-
fuels, bio-polymers and bio-solvents (Figure 1-3).

7
Figure 1-3: Biorefinery and potential green products. According to Wooley et al10 the common process to derive bio-fuels from raw lignocellulosic
biomass is comprised of five main steps: feedstock handling, pretreatment and detoxification,
saccharification, fermentation, product separation and purification. Each step, in turn, is performed
from a multitude of unit operations. The pretreatment is usually operated with dilute inorganic
aqueous solutions, while the saccharification unit operation is mainly operated with the use of
enzymes11 – this is often referred to as the biochemical platform. After the pretreatment step, the
hydrolysate must be treated to remove unwanted lignin and to adjust pH and temperature for the
next step. The saccharificaiton of unreacted hemicellulose and cellulose is then performed via
catalyzed hydrolysis. This is because cellulosic material is extremely recalcitrant to
depolymerization reactions, mainly due to its crystalline structure12. For example, cellulose
conversion requires a three-step pretreatment and hydrolysis process in order to convert the tightly

8
packed crystalline matrix of the cellulose biopolymer into simple sugars13. Once the sugars have
been released into the reaction broth, the products must be separated. This unit operation is usually
comprised of centrifugation, filtration and membrane separation process that detoxify and prepare
the reaction product for the fermentation step. Afterwards, the cleaned product stream can be
converted by diverse microorganisms into a multitude of bio-products, as discussed previously.
Dilute-acid pretreatment, including hydrolysis of hemicellulose, and cellulase enzymes comprise
a significant percentage of the cost of cellulosic ethanol production, and build the rationale for the
development of cheaper, more efficient strategies14. Currently, along with the use of enzymes
pretreatment with dilute sulfuric acid is one of the dominant technologies to hydrolyze
hemicellulosic biomass, relocate lignin and expose cellulose15 for conversion of biomass to
monomer sugars. A mixture of cellulase enzymes is thereafter used to break down cellulose
synergistically. The major downside associated with this technology are slow reaction rates,
incomplete hydrolysis of cellulose and the degradation of monomer sugars during pretreatment16.
Furthermore, the cost of the enzymes has been an inhibitory factor for the commercialization of
biomass conversion technology16.
Membrane technology has seen tremendous growth in many important applications pertaining to
the research and development in the energy and bio-energy industrial sectors. Membrane
separations are usually classified based on their pore size and molecular weight cut-off in
microfiltration, ultrafiltration, nanofiltration and reverse osmosis. Main advantages of membrane
separations is that they offer tremendous variation of separation of species based on their nominal
molecular size, 3-dimensional conformation and physical properties, such as charge and polarity.
With careful choice of a base membrane and consequent chemical modification additional
optimization can be accessed for increased selectivity of species that are otherwise complicated or

9
impossible to separate by alternative separation techniques (liquid-liquid extraction, precipitation,
centrifugation, etc.). More on the membrane separations topic will be discussed in more detail in
chapter 1.4.
Here, we propose the development of modified membranes that are to be designed and optimized
for the integration as separate unit operations into a complete catalytic membrane reactor system
capable of continuous biomass hydrolysis with by-product formation control and solvent
recycling. In Figure 1-4 an envisioned membrane reactor system is shown. This is a holistic
approach to cellulosic biomass hydrolysis, reaction stream detoxifying and solvent recycling. At
the core of this approach are the two membrane separations.
The first (catalysis) is a modified membrane by another colleague with dual separation and
catalysis properties17. By attaching two polymers with poli(ionic liquid) and poli(styrene
sulfonate) functional groups on the surface, these catalytic membranes can be used instead of
enzymes to perform catalyzed biomass hydrolysis. In addition to that and with careful
experimental design, the thermal degradation of monomeric sugars into furfurals and 5-
hydroxymethylfurfural can be overcome. The latter has the potential to mitigate the need of
detoxifying the product stream prior to the fermentation step. The author’s main evolvement with
this membrane is to design the experimental setup to test its performance.

10
Product
Feed
P
Retentate flow II.
Feed
flow Permeate flow I.
Make-up flow
Retentate flow I.
Permeate flow II.N2
tank
Stirred vessel
Catalysis
IL recycling
Figure 1-4: Envisioned catalytic membrane reactor system with the modified membrane unit operations for biomass catalysis and ionic liquid recycling. The pressure line is added to control
membrane permeability. The second (IL recycling) is a modified membrane via polyelectrolyte multilayer deposition or via
interfacial polymerization with the purpose of recycling non-conventional biomass hydrolysis
solvents, such as ionic liquids (ILs). These membranes constitute the main focus of this work.
More on the topic of membrane modification, ILs as biomass hydrolysis solvents, their physical
properties and their use instead of aqueous systems will be expanded in the subsequent chapter.
1.2. Lignocellulosic biomass hydrolysis
Biomass is the most abundant renewable raw material, with an estimated global regrowth of
1.1 x 10¹¹ tons per annum18. Lignocellulosic biomass materials are formed from three main bio-
polymers: lignin, hemicelluloses and cellulose19. Depending on plant species and part of the plant
(stems, leaves, fruit shells, etc) the average major constituents are lignin (25 wt %), hemicellulose
11
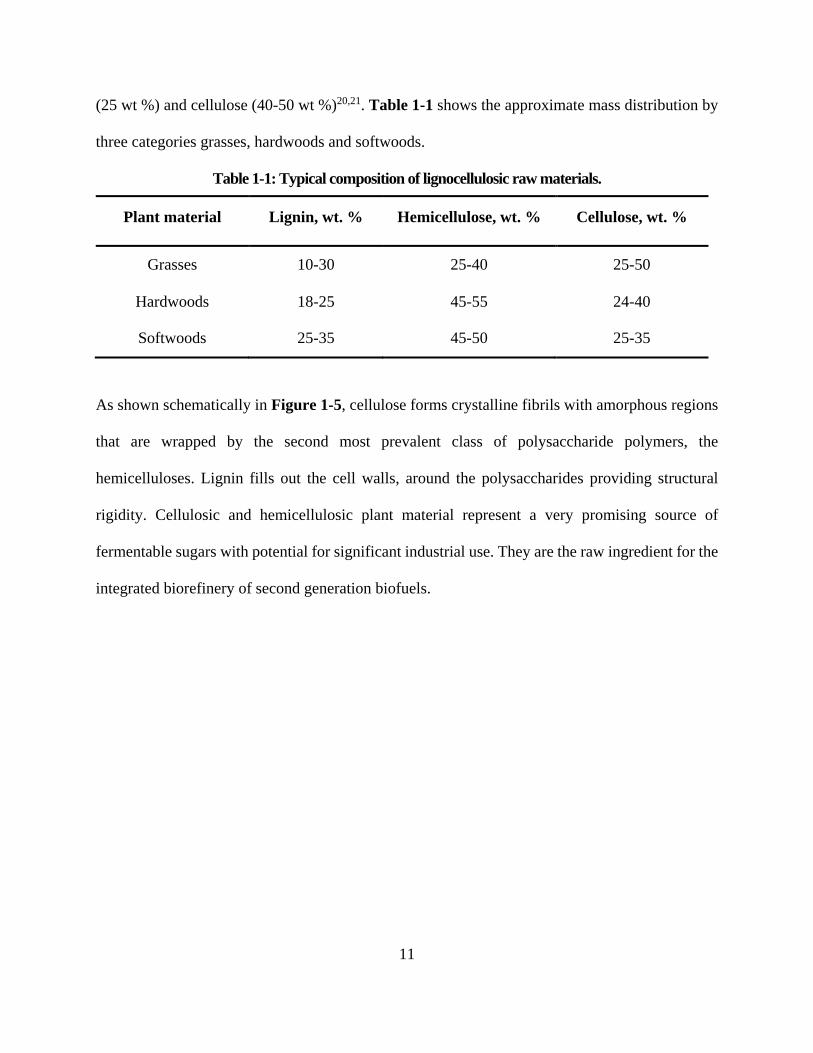
(25 wt %) and cellulose (40-50 wt %)20,21. Table 1-1 shows the approximate mass distribution by
three categories grasses, hardwoods and softwoods.
Table 1-1: Typical composition of lignocellulosic raw materials.
Plant material Lignin, wt. % Hemicellulose, wt. % Cellulose, wt. %
Grasses 10-30 25-40 25-50
Hardwoods 18-25 45-55 24-40
Softwoods 25-35 45-50 25-35
As shown schematically in Figure 1-5, cellulose forms crystalline fibrils with amorphous regions
that are wrapped by the second most prevalent class of polysaccharide polymers, the
hemicelluloses. Lignin fills out the cell walls, around the polysaccharides providing structural
rigidity. Cellulosic and hemicellulosic plant material represent a very promising source of
fermentable sugars with potential for significant industrial use. They are the raw ingredient for the
integrated biorefinery of second generation biofuels.

12
Figure 1-5: Drawing showing schematic structure of plant cell wall with lignocellulosic components. Lignin is a three-dimensional, asymmetrical biopolymer consisting of phenyl units. In plant cells,
it fills out the cell walls which contain primarily linear polysaccharidic membranes providing
structural rigidity to the cell. Lignin can be found in the cells of vascular plants, ferns and club
mosses, but less so in algae and microorganisms22. Just like hemicellulose, it is found in the middle
lamella, the secondary wall and the primary wall of the voids of cellulose microfibrils. It functions
as a connection between the cells and stabilizes the cell walls of the xylem tissue. Lignin is linked
to cellulose or hemicellulose via hydrogen bonds and covalently by ligno-cellulose and lignin-
polysaccharide complexes, respectively23,24. The primary building monomers of lignin are the
coumaryl alcohols, coniferyl alcohols and sinapyl alcohols (Figure 1-6). These are linked
asymmetrically through C-C and ether bonds giving rise to the three-dimensional structure of
lignin. Interestingly, most of the linkages in the lignin molecule cannot be hydrolyzed 22. In nature,
13
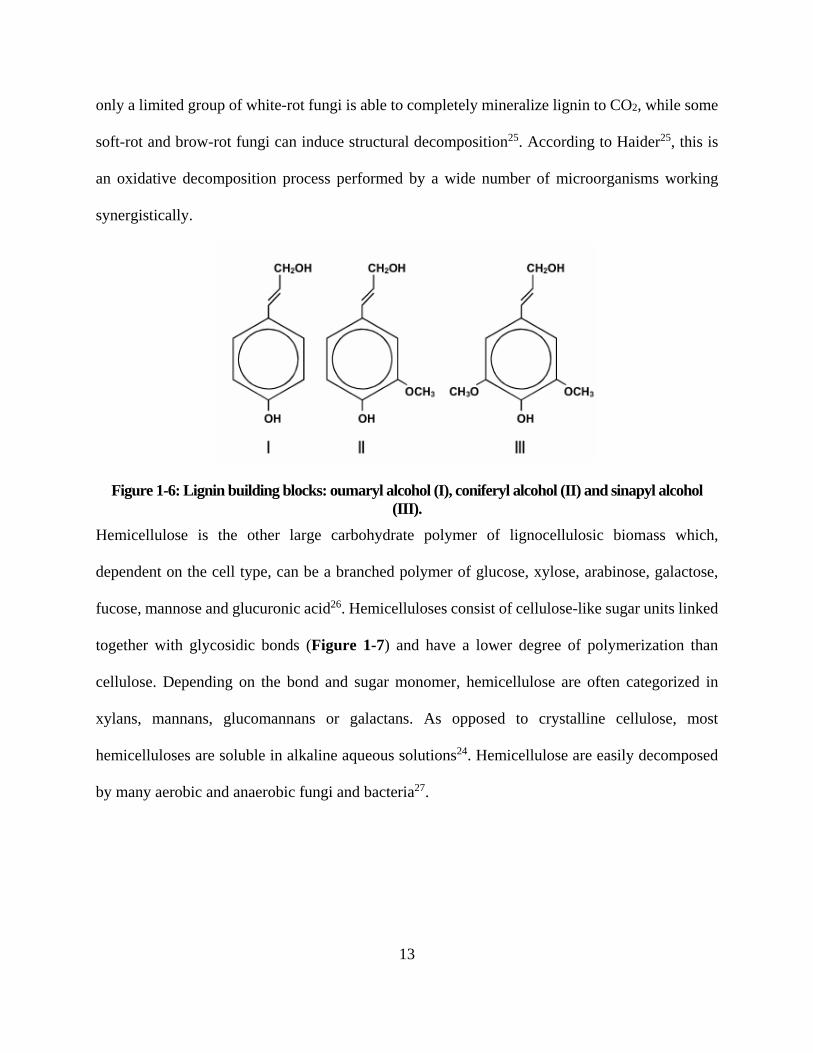
only a limited group of white-rot fungi is able to completely mineralize lignin to CO2, while some
soft-rot and brow-rot fungi can induce structural decomposition25. According to Haider25, this is
an oxidative decomposition process performed by a wide number of microorganisms working
synergistically.
Figure 1-6: Lignin building blocks: oumaryl alcohol (I), coniferyl alcohol (II) and sinapyl alcohol (III).
Hemicellulose is the other large carbohydrate polymer of lignocellulosic biomass which,
dependent on the cell type, can be a branched polymer of glucose, xylose, arabinose, galactose,
fucose, mannose and glucuronic acid26. Hemicelluloses consist of cellulose-like sugar units linked
together with glycosidic bonds (Figure 1-7) and have a lower degree of polymerization than
cellulose. Depending on the bond and sugar monomer, hemicellulose are often categorized in
xylans, mannans, glucomannans or galactans. As opposed to crystalline cellulose, most
hemicelluloses are soluble in alkaline aqueous solutions24. Hemicellulose are easily decomposed
by many aerobic and anaerobic fungi and bacteria27.

14
Figure 1-7: Example of one type of hemicellulose (arabinoxylan) with β-(1-4)-glycosidic and α-(1-3)-glycosidic bonds emphasized.
Cellulose is the most abundant lignocellulosic polymer, as it comprises the main structural
compartments of the cell walls of lower and higher genus of plants. Cellulose is also the main
component of the cell walls of algae and fungi, but it is rarely found in bacteria28. It is a long linear
polymer with glucose units >10,000 that are covalently linked by β-(1-4)-glycosidic bonds29. The
homogenous alignment of the hydroxyl groups on the cellulose polymer leads to the formation of
thick network of H-bridges (Figure 1-8) and thus to a fibrillary structure with crystalline
properties. Some sections of the cellulose molecule are estimated (~15%) to be amorphous12. In
nature, under aerobic conditions, cellulose decomposes slowly under the action of microorganisms
such as fungi and eubacteria25. Some families of bacteria can also decompose cellulose slowly to
low molecular acids under anaerobic conditions22.
15
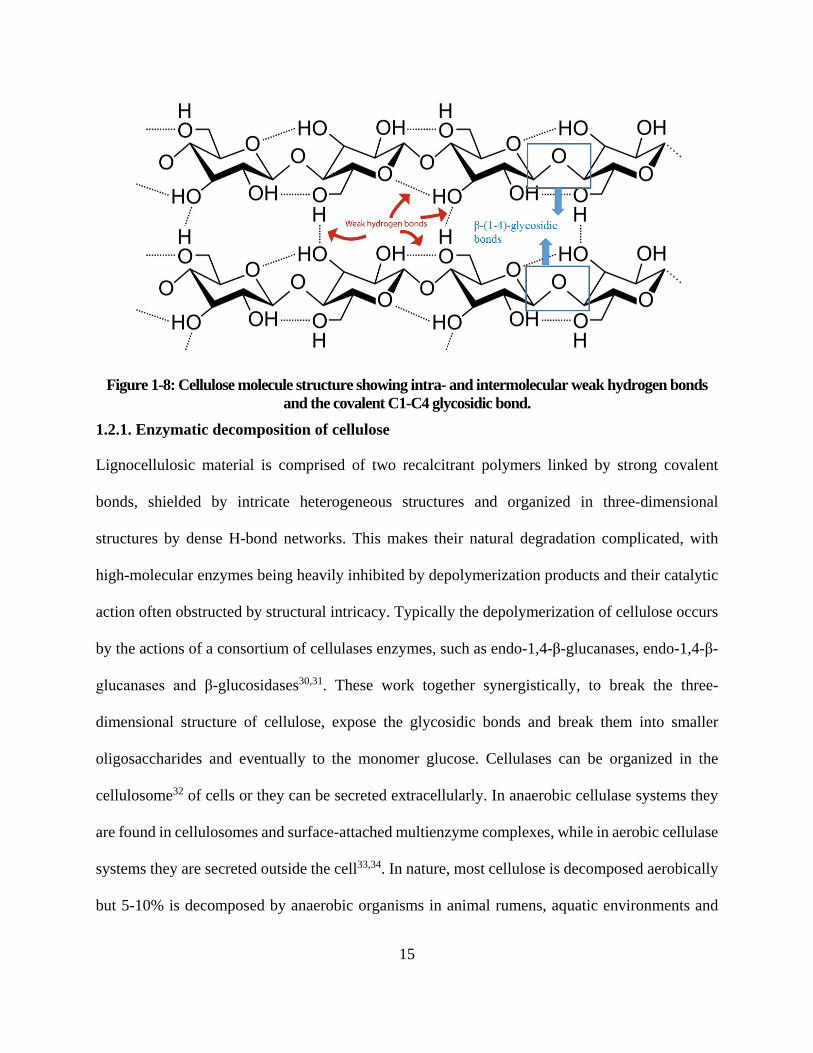
Figure 1-8: Cellulose molecule structure showing intra- and intermolecular weak hydrogen bonds and the covalent C1-C4 glycosidic bond.
1.2.1. Enzymatic decomposition of cellulose
Lignocellulosic material is comprised of two recalcitrant polymers linked by strong covalent
bonds, shielded by intricate heterogeneous structures and organized in three-dimensional
structures by dense H-bond networks. This makes their natural degradation complicated, with
high-molecular enzymes being heavily inhibited by depolymerization products and their catalytic
action often obstructed by structural intricacy. Typically the depolymerization of cellulose occurs
by the actions of a consortium of cellulases enzymes, such as endo-1,4-β-glucanases, endo-1,4-β-
glucanases and β-glucosidases30,31. These work together synergistically, to break the three-
dimensional structure of cellulose, expose the glycosidic bonds and break them into smaller
oligosaccharides and eventually to the monomer glucose. Cellulases can be organized in the
cellulosome32 of cells or they can be secreted extracellularly. In anaerobic cellulase systems they
are found in cellulosomes and surface-attached multienzyme complexes, while in aerobic cellulase
systems they are secreted outside the cell33,34. In nature, most cellulose is decomposed aerobically
but 5-10% is decomposed by anaerobic organisms in animal rumens, aquatic environments and
16
soils. As with other enzymes the reaction mechanism is comprised of a substrate-binding site and
a catalytic center performing the bond cleavage35.
1.2.2. Chemical decomposition of cellulose
The cellulose polymer can be broken into polysaccharides, oligosaccharide and further into di- and
monomers in the presence of a strong acid by addition of a water molecule per broken bond (acid
hydrolysis). The latter breaks the covalent glycosidic bond leaving a potential aldehyde group
possessing reducing power36. Hydrolysis of the cellulose molecule can occur only after the
crystalline structure (H-bonds) of cellulose is destroyed from swelling in concentrated acid37,38.
Fan12 proposed the following simplified mechanism:
𝐶𝐶𝐶𝐶𝐶𝐶𝐶𝐶𝐶𝐶𝐶𝐶𝐶𝐶𝐶𝐶𝐶𝐶𝑆𝑆𝑆𝑆𝑆𝑆𝑆𝑆1�⎯⎯� 𝐴𝐴𝐴𝐴𝐴𝐴𝐴𝐴 𝐴𝐴𝐶𝐶𝑐𝑐𝑐𝑐𝐶𝐶𝐶𝐶𝑐𝑐
𝑆𝑆𝑆𝑆𝑆𝑆𝑆𝑆 2�⎯⎯� 𝑂𝑂𝐶𝐶𝐴𝐴𝑂𝑂𝐶𝐶𝐶𝐶𝑂𝑂𝐴𝐴𝐴𝐴ℎ𝑂𝑂𝑎𝑎𝐴𝐴𝐴𝐴𝐶𝐶𝐶𝐶
𝑆𝑆𝑆𝑆𝑆𝑆𝑆𝑆 3�⎯⎯� 𝐺𝐺𝐶𝐶𝐶𝐶𝐴𝐴𝐶𝐶𝐶𝐶𝐶𝐶
The choice of acid and its concentration significantly affects the kinetics and course of cellulose
hydrolysis. In 40% hydrochloric acid, cellulose degrades only to smaller oligosaccharides at
around 30°C12. The same smaller glucose polymers are hydrolyzed to glucose via a first-order
mechanism only at higher temperatures39. The reaction pathway of acid hydrolysis of cellulose to
glucose is widely accepted40-44 to proceed from the protonation of glycoside oxygen. This is shown
schematically in Figure 1-9. In the first step, an intermediate complex between glycosidic oxygen
and a donated proton is rapidly formed followed by the slow (reaction determining step) splitting
of glycosidic bonds induced by the addition of a water molecule. The carbonium cation that was
formed in the previous step has two cleavage possibilities, depending on the protonation site, as
seen in Figure 1-9. If the glycosidic oxygen is protonated, the reaction follows path P-I, if the
carboxylic oxygen is protonated then it follows path P-II. Other reaction paths have been
discussed45 but are less widely accepted12.
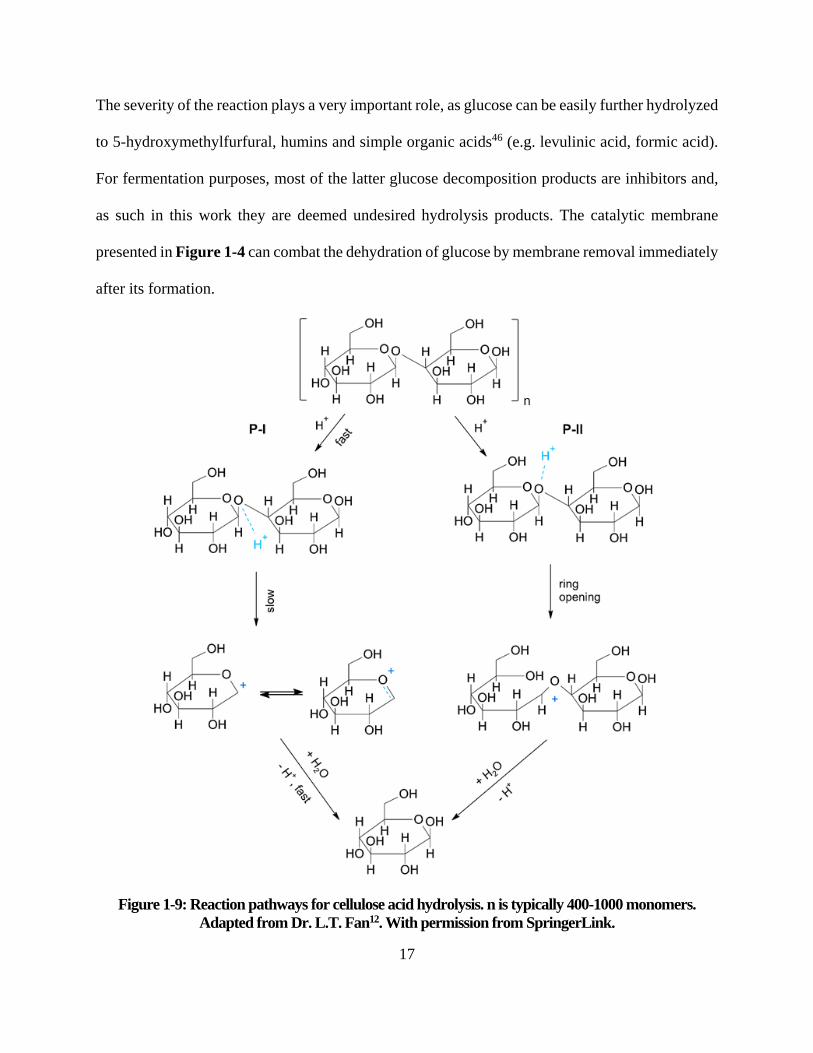
17
The severity of the reaction plays a very important role, as glucose can be easily further hydrolyzed
to 5-hydroxymethylfurfural, humins and simple organic acids46 (e.g. levulinic acid, formic acid).
For fermentation purposes, most of the latter glucose decomposition products are inhibitors and,
as such in this work they are deemed undesired hydrolysis products. The catalytic membrane
presented in Figure 1-4 can combat the dehydration of glucose by membrane removal immediately
after its formation.
Figure 1-9: Reaction pathways for cellulose acid hydrolysis. n is typically 400-1000 monomers. Adapted from Dr. L.T. Fan12. With permission from SpringerLink.

18
1.3. Ionic liquids
In this work we are using ionic liquids (ILs) as reaction solvents for biomass hydrolysis47-49. The
colleague modifying the catalytic membranes has been conducting promising experimental work17
with the ILs shown in Table 1-2 and we have used their reaction hydrolysates as well as model
feeds to test the separation performance of our IL recycling membranes, as described previously
in Figure 1-4.
Table 1-2: Commercial pricing list of ionic liquids commonly used with biomass hydrolysis.
As eloquently rationalized by Seddon51, to describe all types of ionic liquids, that are estimated at
an astounding number of 1012 theoretical possible combinations52, as merely “molten salts” is “as
archaic as describing a car as a horseless carriage”. What he was trying to emphasize is the very
wide palette of physico-chemical properties different ionic liquids can possess and their immense
potential as novel solvents. However, in the context of lignocellulosic biomass treatment, ionic
liquids are commonly defined simply as salts that are found in liquid form at around or below
100°C. The low melting point range of the ILs is important, mostly because it can mitigate
solvolysis of the biomass components. In 1934, Gaenacher53 first recognized the dissolution
Ionic liquid MW, Da Solubility of cellulose50, wt.% Market price, $/kg
C2mimOAc 170.21 ~ 20 1,015
C4mimOAc 198.26 ~ 19 881
C2mimBr 191.07 ~ 2 3,420
C4mimBr 219.12 ~ 25 1,982
C2mimCl 146.62 ~ 14 419
C4mimCl 174.67 ~ 10 340

19
property of N-ethylpyridinium chloride with cellulose, but it did not caught the attention of the
scientific public since it only worked in the presence of nitrogen-containing bases and at relatively
high temperature of 118°C. Later, in 2002, the extensive works of Rogers et al and Swatloski et
al54,55 tested the feasibility of imidazolium ionic liquids for the dissolution of cellulose. Their
successful experimental work drove the interest in these novel solvents further as many other
combinations of cations and anions emerged (see Figure 1-10 for some examples). Then, a new
trend was born. Some examples of ILs application are as biomass solvents56-58, for the preparation
of cellulose fibers and films59-61 or to make cellulose composite materials62,63 as well as many other
lignocelluosic biomass handling and reaction processes.
Figure 1-10: Examples of cations and anions used as ILs in biomass dissolution and hydrolysis. ILs are excellent cellulose solvents with low vapor pressure, low toxicity, low melting points and
high mass loadings (up to 39 wt %) 57,64. The chemistry of dissolution is a subject of much debate
in the literature, especially aggravated by the misleading data and understanding of dissolution
versus decomposition. According to Wang et al50 whose group wrote an excellent review on the
subject, there seems to be much consensus on the properties of the anions, while the effects of
cations still remain mostly controversial.

20
1.3.1. Mode of cellulose dissolution by ionic liquids
Anions that are powerful hydrogen bond acceptor are more efficient in solubilizing cellulose. Low-
basicity anions such as dicyanamides are better at dissolving simple monomeric sugars65 and not
very efficient at dissolving cellulose66. ILs containing non-coordinating anions such as BF4- or PF6-
are unable to dissolve cellulose67. The degree of cellulose polymerization, the process of
purification and inherent structural modifications make it complicated to estimate exactly which
anions will perform better but according to Wang et al50 the capabilities of the following anions
decrease in the following order: OAc- > Cl- > HCOO- > DCA- = NTf2- and have to be in an excess
of at least 1.5-2.5 anion:free hydroxyl groups67. Overall, it seems that the anion’s most important
role is its size and the ability to penetrate the cellulose three-dimensional structure and disrupt the
dense H-bond network keeping the crystalline structure strong.
Cations have a more controversial role in cellulose dissolving but they seem to be largely
accountable for the structural resilience of ILs, as some are susceptible to decomposition when
used in reactions systems with high severity68. Ionic liquids containing imidazolium, pyridinium,
ammonium and phosphonium cations have been more widely adopted for biomass work and most
of the understanding underlying the dissolving of cellulose stems from experimental work with
these. Wang et al50 and Tadesse et al18 suggest that a lot more work needs to be done with other
molecular species for more conclusive remarks to be formed. However, the effect of cations can
be summarized with the fact that aromatic cations seem to work best. This is believed to be the
case due to their ability to shield anion/cellulose polymer complexes, due the fact that aromatics
are more easily polarized because of their delocalized charge that forms weaker cation/anions
electrostatic bonds53,69. As with the anions, the carbon chain length of cations seems to have an
effect on the cellulose dissolving with decreasing power as the chain length increases70.

21
Furthermore, the presence of oxygen atoms in the side chains of cations is believed to interfere
with efficient hydrogen bonding of the anion to the cellulose molecule65.
1.3.2. Cellulose hydrolysis with ionic liquids
Ideally, the dissolution and depolymerization of lignocellulosic biomass can be combined into one
unit operation. That is, biomass containing all three macropolymers that has been only mildly
pretreated, for example by comminution or other physically disruptive method, can be fed into a
process that releases monomeric sugars and somehow separates the lignin as well. There are many
hurdles still needed to be addressed before this ideal can be realized. For example, while there are
ionic liquids out there that can be used to selectively cleave the covalent bonds holding the lignin
and then precipitate it, there is still a need to harvest the monomeric sugars before they degrade.
Biocatalyst are usually susceptible to inhibition even from minute amounts of ionic liquids, so an
additional step of cleaning the reactants is necessary. Water is needed for the hydrolysis reaction,
but adding it in concentrations higher than 20% w/w tends to reduce biomass solubility and even
precipitates the reactants. Recycling of the expensive ionic liquids is still very complicated and
thus a major cost drawback. Therefore much more complicated, online controlled reaction systems
and intricate strategies need to be developed before economically feasible large scale dissolution
and depolymerization systems can breach the bench scale. There are several studies that have
investigated the feasibility of the aforementioned strategies and we present a few here.
Under mild reaction conditions (~140°C, 1 atm, ~24h) and without an added acid catalyst,
cellulosic raw material dissolved in certain ionic liquids can be almost fully depolymerized (97%
total reducing sugar yield) into its water-soluble building blocks46. Zhang et al46 performed
experimental and computational work with ionic liquid-water mixtures as solvents for cellulose
dissolution and hydrolysis. Interestingly, they observed a catalytic effect of the solvent mixture

22
with surprisingly high total reducing sugars yields (>90%) at diverse amounts of added water,
temperature (90-140°C) and reaction times (1-24h). From computational data they attribute the
catalytic effect of the solvent mixture due to a markedly increase in the water dissociation constant
(Kw). The enhance in the dissociation constant and thus the increase in H+ ions is due to the
autoionization of water molecules in proximity to the IL. This property mimics that of subcritical
water (340°C, 27.5 MPa71) but under much milder conditions and, if honed intensively, is
considered to be of significant value when used for biomass hydrolysis.
By combining a solid catalyst with ionic liquid/water reaction media, Rinaldi et al72 researched
the hydrolysis of commercial α-Cellulose in 1-butyl-3-methylimidazolium chloride. They added
macroreticulated acid resins (commercial name Amberlyst 15DRY) and minute amounts of water
and were able to reach a 30% glucose yield after 3h. Qian et al73 developed a novel solid polymeric
acid catalyst for use with 1-butyl-3-methylimidazolium chloride/water and 1-ethyl-3-
methylimidazolium chloride/water solvents for fast (~6h) α-Cellulose depolymerization at 130°C.
Poly(vinyl imidazolium chloride) and poly(styrene sulfonate) chains have been grown from the
surface of commercial inorganic membranes and so dual-functioning membranes were produced.
Using atom transfer radical polymerization (ATRP) and UV-initiated polymerization they grew
the chains in different lengths and crosslinking degrees. The poly(vinyl imidazolium chloride) or
poly(ionic liquid) chains act to solubilize the biomass reaction feed in the proximity of the acid
poly(styrene sulfonate) chains.
The research group conducted hydrolysis reactions with the two ILs and measured total reducing
sugars yields after 2-24h reaction times at 130-140°C. They found an optimized total reducing
sugar yield of 97.4% for 6 hours reaction time using a ceramic membrane modified at UV initiator
immobilization time of 15 min and 24h ATRP grafting time.

23
Deliberate in situ hydrolysis of dissolved lignocellulose with ionic liquids and added strong acids
catalyst is still a subject of interesting academic small scale studies74. A successful
commercialization attempt is under way by the start-up Hyrax Energy75. One of their concepts
involves the hydrolysis of hemicellulose and cellulose in monomers and oligomers using strong
water soluble acids, such as sulfuric acid. Since the biomass is completely solubilized in the ionic
liquid, there is no regeneration step required and the enzymatic saccharification step is not
required. This method when compared to the biocatalysis of biomass has the advantage of being
faster. There are other similar studies of in situ hydrolysis of pure cellulose76-78 typically done with
imidazolium ionic liquids and catalytic amounts of strong acids. The consensus is that only the use
of acids with pKa’s < 1.0 results in hydrolysis with appreciable glucose yields76. Binder and
Raines77 added water in increments and observed 70-80% and 10% yields of glucose and 5-
hydroxymethyl furfural, respectively. Zhang et al79 added N-methylpyrrolidinone (NMP) to the
reaction mixture and obtained 69% total reducing sugars and 39% glucose yield at only 70°C. The
addition of the co-solvent NMP is a modification of the previous strategies presented and it role is
to accelerate dissolution substantially.
Even though the combination of dissolution and hydrolysis in “one-pot” reactions has tremendous
potential for the biorefinery concept, it still suffers of many road-blocking drawbacks. From a
processing perspective, the separation of sugars from IL and the recycling of the IL is still an
issue74 that needs to be further improved before large scale economically feasible setups can be
advanced.
1.3.3. Separation techniques for biomass hydrolysis applications
For the realization of a fully integrated and economically feasible biorefinery - the integrated
biorefinery concept was defined in a previous chapter - there are several important unit operations

24
that require continuous improvement and optimization. Depending on the reaction system used,
the main classes of compounds that are present in the reaction broth after the hydrolysis reaction
can be categorized into: unreacted biomass, short chain soluble hydrolysis products (e.g.
cellobiose), monomeric hydrolysis products (glucose, fructose, xylose, etc), degradation products
(HMF, furfurals, humins, organic acids), catalyst (enzyme, solid acid catalyst or soluble acid
catalyst) and solvents (ionic liquid, water, other organic solvents). In the previous chapter, methods
and strategies that aim at combining both dissolution and depolymerization have been presented.
One of the major drawbacks with those is the problematic separation of ionic liquid and monomeric
sugars that are released during acid hydrolysis. Many of the ionic liquids that have excellent
properties for biomass dissolution and hydrolysis have molecular weights similar to the sugar
monomers (Table 1-3).
Table 1-3: Molecular weights of sugar monomers released during acid biomass hydrolysis and of ionic liquids commonly used with biomass dissolution.
Chemical species MW, Da
Ionic liquids
C2mimOAc 170.21
C4mimOAc 198.26
C2mimBr 191.07
C4mimBr 219.12
C2mimCl 146.62
C4mimCl 174.67
Hydrolysis sugars
Glucose 180.16
Fructose 180.16
Xylose 150.13
Cellobiose 342.30

25
For this reason, separation techniques that make use of molecular size differences, such membrane
separation by size-exclusion, are unusable if high selectivity is desired. There are many articles on
the use of anti-solvents to precipitate lignin or cellulose in dissolution systems or unreacted
cellulose in hydrolysis systems80-83 but it should be clear that that principle does not work when
wanting to selectively recover the ionic liquid from monomeric sugars. While lignin or cellulose
can be precipitated with the simple addition of water or other organic solvents such as ethanol or
acetone that competes for H-bonding, this cannot be accomplished with glucose or xylose, or any
simple sugar for that manner. Here, we review some examples that deal with ionic liquid recovery
from biomass hydrolysates. Rinaldi et al72 precipitated the unreacted cellulose oligomers by water
addition and then ran the hydrolysate through a neutral alumina column to remove the acid content.
Water content was reduced by vacuum distillation, taking advantage of the low vapor pressure
properties of the 1-butyl-3-methylimidazolium chloride. No attempt was made to recover the
glucose and other small molecules, which the authors expect to accumulate over the course of
repeated cycles recycling. They propose the stopping of reaction at the cellooligomer stage to
counteract the latter and report an estimated 91% recycling efficiency of IL. Wei et al84 reused
[C4C1im]Cl 7 times in the process of legume straw fractionation with ionic liquid water mixtures.
The recycling procedure was simply removal of water and they observed an increase of recovered
pulp after the 4th cycle. Mai et al85 used ion exclusion chromatography to recycle
[C2C1im][MeCO2] from non-volatile sugars. Francisco et al86 researched the adsorption of glucose
onto zeolites from ionic liquid hydrolysates and their subsequent desorption in water. Shill et al87
present an alternative procedure of recycling ILs and reconditioning them for multiple use. ILs
have the property of forming a biphasic system when combined with an aqueous solution
containing an kosmotropic anion, such as sulfate, phosphate or carbonate. The binodal curves for

26
these mixtures have been fitted to the Merchuk equations and reported previously88. The recovery
of the IL phase in these mixtures depends on the concentration of the salt and its position in the
Hofmeister series. In order of decreasing recovery these are K3PO4>K2HPO4>K2CO3 87. The
recovery of [Amim]Cl was reported to be 96.8%88 and over 95% for [Emim]Ac and [Bmim]Ac72.
Hazarika et al89 used a commercial nanofiltration membrane and attempted to recover small
concentrations (0.01 – 0.03 mM) of 1-n-butyl-3-methylpyridinium tetrafluoroborate from model
water/IL mixtures. They reported a rejection of 98.4% without further detail on reuse of IL.
As discussed previously, ILs have been shown to accelerate the saccharification process when
combined with small amounts of water73. Furthermore, in combination with the solid acid
membrane catalyst discussed earlier they form a re-usable reaction environment when compared
to cellulose enzyme cocktails. However, the cost of the aforementioned solvents is inhibitory to
the development of large scale processes (see price / kg of IL in Table 1-2) and this builds the
rationale for the development of novel membranes that are capable of selective separation of
reaction products from the expensive solvents. This is a novel and challenging endeavor as
classical size separation is rendered complicated if not impossible due to the similar molecular
weight of both sugar monomers and ILs, which are in the range of 150 – 200 Da. With careful
tuning of the selective layer chemistry we attempt to tweak on other properties such as surface
charge and hydrophobicity to attain a mediated selective separation of the charged IL molecules.
Details about the chemistry of modification and the separation efficiency of the modified
membranes will be discussed later in the subsequent chapters.

27
1.3.4. Quantitative measurements
Ionic liquids
Ionic liquids have been reported to show peculiar properties when mixed with water in high
quantities. For example, Liu et al90 show a plot of four different ILs (including BmimCl) where
the specific conductivity in mS/cm follows a bell shaped curve increasing from below 1 M aqueous
solution, reaching to a maximum at 2 M and then decreasing again towards 7 M.
We wanted to make sure that we are conducting rejection experiments in the linear region and so
we prepared calibration curves with BmimCl, EmimCl and EmimOAc and observed the ensuing
trend. Throughout the analyzed range we did not observe the bell shaped character. We also
prepared mixtures of ILs and hydrolysis sugars (glucose, xylose, fructose and cellobiose) to test
interference with the sugar analysis method and also did not observe any peculiarity in the
calibration curves. The ionic liquid concentration was quantified using a handheld conductivity
meter from VWR (Symphony SP70C, Houston, TX) equipped with a 2-electrode conductivity cell
of epoxy/platinum and a nominal cell constant of 1.0 cm-1 (Thermo Scientific, Beverly, MA).
Hydrolysis sugars
High-performance liquid chromatography (HPLC) can be successfully used in the quantitative
determination of small molecular weight sugars that are representative for biomass hydrolysates.
In this work we have used two different HPLC columns with customized analysis protocols to
establish calibrations curves for the following sugars: Cellobiose, Glucose, Xylose and Fructose.
For the determination of sugars from IL solutions, we have used the colorimetric 3,5-
dinitrosalycyclic acid (DNS) method. Both HPLC and DNS methods are described in the materials
and method section of chapter 2.

28
1.4. Membrane separations
1.4.1. Membrane separation and classification
Membranes are versatile separation tools that can be found in all chemical, biochemical,
pharmaceutical and environmental industrial branches. When the molecular weight-cut off
between a desired molecule and the contaminating molecules (e.g. cell debris from a fermentation
broth) is large enough, membranes can easily be employed to separate the previous from the latter.
Depending on their pore size, membrane can be generally classified into microfiltration (<10 µm),
ultrafiltration (<0.1 µm), nanofiltration (<0.01 µm) and reverse osmosis (<0.001 µm). This is
schematically summarized in Figure 1-11. Each class of membrane has found countless
applications in relevant industries.
Figure 1-11: Membrane classification with typical working pressure, pore size and rejected species.

29
For example, microfiltration membranes are often used as a first step in polishing a desired protein.
In more complicated cases, the surface of the membrane can be tuned in such a way to alter or add
additional properties to the base membrane. For example, membrane surface charge can be
changed (positive to negative or vice-versa) with the deposition of polyelectrolytes or, as another
example, catalytic end groups can be grafted on the surface.
One can think of a membrane as an interface, which materializes as a thin barrier layer controlling
the mass transfer exchange between two phases. The two phases are usually referred to as feed and
permeate, with the latter containing the feed solvent with less or nearly none of the rejected
compounds (Figure 1-12). The mass transfer is controlled not only by the external forces and the
fluid properties but also by the characteristics of the film material, e.g. the membrane.
Figure 1-12: Representation of membrane separation by size-exclusion. The feed side contains molecules of different sizes and these can permeate the membrane through channels called pores.
30
By changing the surface chemistry and morphology of a base membrane, new or improved
performance properties such as increased resistance to fouling, higher permeability and selectivity
as well as higher rejections can be obtained. From conducting such modifications to base
membranes, modified membranes could then serve not only as a separating tool but also as a
catalyst or adsorber, thus saving time and resource in real-time reaction processes. Multi-
functional modified membranes have, therefore, the potential to combine multiple unit operations.
By integrating them in the design of chemical or bio-chemical reactors, new avenues are created
for economically more feasible reaction processes.
1.4.2. Market relevance of membrane technology
The global market for membranes and membrane modules sales in 1998 was approximately $4.4
billion, including gas and liquid separation processes92. The US share was at least 40% and 29%
were shared by Europe and the Middle East93. With an estimated net annual growth rate (CAGR)
of 6.6%, the membrane sales surpassed $5 billion in the US alone at the beginning of 2005. In
1998 hemodialysis had the largest consumer market followed by microfiltration, ultrafiltration and
reverse-osmosis, respectively. About 50% of the reverse-osmosis market was monopolized by
Dow/FilmTec and Hydranautics/Nitto products. Current other large manufacturers are DuPont,
Osmonics, Pall and Millipore.
Currently, the global market for all membrane separations is expected to grow at a CAGR of 9.47%
and is projected to reach a value of 32.14 billion by 202094. Ceramic membranes is the membrane
segment projected to grow at a CAGR of 11.96% between 2015 and 2020 due to their outstanding
performance under harsh parameters and their less likeliness to foul. However, their fast market
expansion is limited by their high cost of manufacture. Other membrane types such as ion-
exchange and carbon membranes have a cumulated CAGR of 12.05%. The latter types are

31
especially growing in interest for battery and energy applications. Nanofiltration technology is
amongst the separation technology with the highest CAGR of 12.55%. Due to the trend in political
incentives, their main applications are in water and waste water treatment. In all the membrane
separation classes, novel modified membranes are expected to emerge for very specific
applications and gain on the global market with their versatility.
Membranes have become essential, well-established technologies for water desalination, waste-
water treatment, energy generation, bio-pharmaceutical production, food packaging as well as
other industrially significant products. When compared to industrially produced membranes,
modified membranes are usually tailor-made for very specific applications and, in this report, we
will focus mainly on catalytic membranes for membrane reactors. For example, enzymes can be
covalently attached to ceramic membranes using glutaraldehyde and a previously adsorbed
polymer (e.g. gelatin) giving rise to a series of advantages. The immobilized enzyme will provide
catalytic function while the membrane will remove the necessity of subsequent catalyst separation
and recovery. Polymers with functional groups, such as acidic sulfonate groups, can be grown or
attached on the surface of base membranes for a similar dual function. A more unique and possibly
less exploited modification technique is that of pore-filled membranes with diverse chemical or
bio-chemical catalysts. For this procedure, the larger porous side of a membrane is filled with
catalytic material and then inserted “upside-down” in the membrane holder, that is, with the feed
entering through the lager porous size.
Membranes can also be classified according to their nature, geometry and separation regime.
Specifically, they can be classified into organic, inorganic and hybrids of the latter two. The choice
of membrane type to be used in membrane reactors depends on parameters such as the productivity,

32
separation selectivity, membrane life time, mechanical and chemical integrity at the operating
conditions, and process costs.
When membranes are incorporated in reactors, the resulting setup is often referred to as membrane
reactor. This setup adds tremendous potential to membrane technology due to the possibility of
online control, automatization and unit operation combination.
1.4.3. Nanofiltration
The separation limits of nanofiltration membranes is often expressed with the molecular weight
cut-off (MWCO) value. This represents the molecular size in Dalton (Da) units of an idealized
molecule which the membrane can reject to 90% or higher. The MWCO of commercially available
nanofiltration membranes lies in the range of 200 – 1000 Da, between the ultrafiltration and reverse
osmosis ranges (Figure 1-11). Mass transfer in nanofiltration is based on two mechanisms: sieving
and charge effects95,96. Diffusive transport of uncharged molecules remains pressure independent
but concentration dependent, while convective transport increases with pressure97,98. Typical
pressures for nanofiltration applications are above 5 bar99, but these can vary a lot with different
systems. Major applications of nanofiltration include the fractionation of salts100,
oligosaccharides101, small sugars102 and other molecules, in water treatment103-105 as well as for
rejections in organic solutions99. For example Mahdi et al.102 attempted to modify nanofiltration
membranes from depositing polyelectrolytes on the surface of poly(ethersulfone) and they attained
increased selectivity for disaccharide versus monosaccharides. Zhang et al.106 used interfacial
polymerization from combining the usual trimesoyl chloride with a natural material (tannic acid)
to fabricate novel composite material membranes that showed good permeability and increased
anti-fouling properties. Yung et al.107 incorporated ionic liquids in the aqueous phase of interfacial
polymerization and developed nanofiltration membranes with comparably better rejection and flux

33
than commercial NF-270 and NF-90 from Dow Filmtec. More recently, a paper published in
Science108 advanced the applications of modified nanofiltration membranes by developing very
smooth or crumpled sub-10 nm selective interfacial polymerization layers with excellent
permeability towards organic solvents.
Due to their versatility when considering the design of membrane (or membrane reactor) systems,
nanofiltration technology has found many application in the food sciences as well109,110. Notable
applications are in the volume reduction, selective separation, desalination and fractionation of
plant juices and extracts and in the dairy industry for post-processing of dairy products. For
example the concentration of health-beneficial polyphenols from fruit juices has seen recent
development. Versari et al.111 used nanofiltration membranes to concentrate grape juice and to
increase the sugar content in the concentrate for wine production. Cassano et al.112 used
nanofiltration membranes with molecular weight cut-off in the range 200-1000 Da to recover
bioactive compounds from artichoke brines.
In this work we use commercially available ultrafiltration membranes and proceed by modifying
their selective layer for nanofiltration applications. The surface chemistry is modified via layer by
layer polyelectrolyte deposition or from growing polyamide thin layers. The chemical
modifications allow for control and tweaking of mass transfer properties and thus of rejection and
permeability. The two modifications procedures will be treated in more details in chapters 2 and
3. In chapter 4 we use two commercially available nanofiltration membranes to optimize the
concentration of polyphenols from blueberry pomace and then build a custom crossflow membrane
system to test its feasibility in the continuous volume reduction of blueberry extract.

34
1.4.4. Fouling of nanofiltration membranes
Membrane separation technology offers many advantages for diverse industrial applications, many
of them pertaining to downstream unit operations. These advantages include no phase changes
(with the exception of some membrane separations, such as pervaporation), simpler scale up than
other similar methods, relatively low energy consumption, often simple experimental/mechanical
setup, low maintenance costs and less space requirement113. However, most membrane process are
plagued by concentration polarization and subsequent fouling and cake formation which decrease
flux, can affect rejection and also shorten membrane life. As such, membrane fouling is one of the
important economic challenges for industrial processes114. Membrane fouling can be defined as
the process that leads to loss of performance of a membrane due to deposition of dissolved or
suspended molecules on its active surface, at its pore openings or inside the pores115. Depending
on how much of the initial performance in terms of permeance can be recovered from simply
washing with water, the severity of membrane fouling can be classified in: (i) reversible fouling;
(ii) irreversible fouling.
Figure 1-13: Fouling schematic showing the formation of boundary layer at membrane surface.

35
In Figure 1-13 a schematic shows what happens during rejection of compounds from a feed
containing compounds of different molecular sizes. During concentration polarization (CP),
compounds found on the feed side start to agglomerate near the surface of the selective layer and
form the CP boundary layer. The boundary layer thickness can be used to quantify the extent of
concentration polarization. Schäfer et al116 summarized what are the most important effects that
could increase membrane fouling in nanofiltration or reverse osmosis separations:
(i) chemical reaction of solutes with membrane material
(ii) adsorption of low molecular mass compounds at the membrane polymer
(iii) irreversible gel formation of solutes
(iv) bacterial growth
(v) deposition of dispersed fine or colloidal matter
(vi) precipitation of substances that have exceed solubility threshold.
In nanofiltration, the separation process is driven by pressure and the mass transfer proceeds by
convective and diffusive transfer. For salt separations, additional electrostatic interactions play an
important role in concentration polarization and thus affect membrane performance. E.g. a Donnan
effect stemming from the membrane surface charge can lead to a difference in rejection according
to ion charge interactions 117. In any case, membrane fouling can be a complex phenomenon and
any or all of the aforementioned mechanism can work together to decrease membrane
performance. Therefore, recovery methods have to be developed to decrease the negative effects
of fouling and recover the membrane performance. Typical recovery methods include washing
with water, sonicate, wash with other solvents such as ethanol, methanol, mild acids or mild bases
or thermal treatments118.

36
1.4.5. Membrane reactors
The modified membranes of this work, as depicted in Figure 1-4, were designed and optimized as
part of the intention to be implemented in a membrane reactor setup. In this subchapter we describe
the membrane reactor and then provide the reader with several literature reviewed examples of
such setups which inspired the writer to develop his ideas.
According to IUPAC, the definition of a membrane reactor is a system capable of concomitantly
performing a chemical (or bio-chemical) reaction and a membrane-based separation, all within the
same physical device. As such, the membrane not only plays the role of a separator, but can also
take a role in the reaction itself (catalytic membrane). Both organic and inorganic membranes can
be successfully employed in the design of membrane reactors. The table below summarizes some
of the advantages and disadvantages of inorganic membranes with respect to polymeric
membranes.

37
Table 1-4: Advantages of inorganic membranes with respect to organic membranes.
Advantages Disadvantages
Long-term stability at high temperatures High capital cost
Resistance to harsh environments (e.g. pH) Embrittlement phenomenon
Resistance to high pressure drops Low membrane surface per module volume
Inertness to microbiological degradation Difficulty of achieving high selectivities in large microporous membranes
Easier to clean after fouling Not many manufactures available
Easier catalytic activation Difficult membrane to design module sealing at high temperatures
Inorganic membranes are usually more costly than polymeric membranes. However, they possess
advantages such as resistance towards solvents, high mechanical stability and elevated resistance
at high operating temperatures. Therefore, in some cases, although the capital costs of ceramic
membranes are higher than those of polymeric membranes, their prolonged operational lifetime
can balance out the initial costs119,120. On the other hand, polymeric membranes are more
affordable and their surface chemistry is often easier to modify and tune according to application
requirements.
Membrane reactors can be designed with several main operating configurations. These can be seen
below in Figure 1-14.
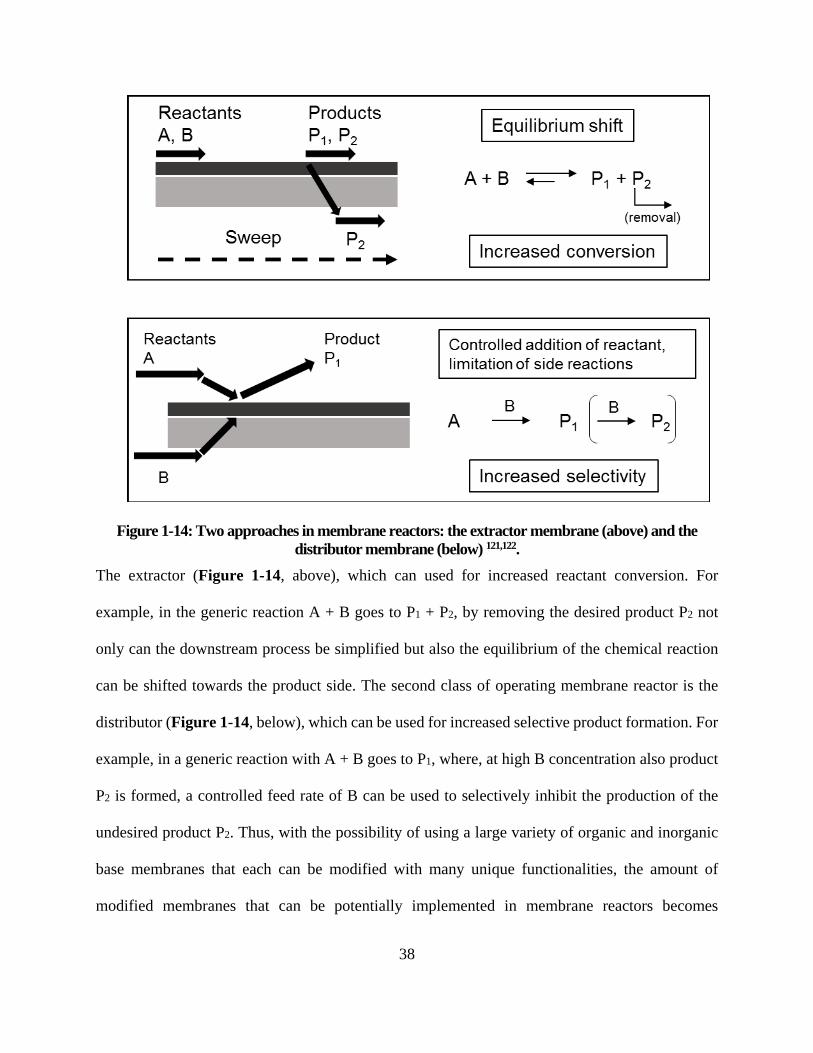
38
Figure 1-14: Two approaches in membrane reactors: the extractor membrane (above) and the distributor membrane (below) 121,122.
The extractor (Figure 1-14, above), which can used for increased reactant conversion. For
example, in the generic reaction A + B goes to P1 + P2, by removing the desired product P2 not
only can the downstream process be simplified but also the equilibrium of the chemical reaction
can be shifted towards the product side. The second class of operating membrane reactor is the
distributor (Figure 1-14, below), which can be used for increased selective product formation. For
example, in a generic reaction with A + B goes to P1, where, at high B concentration also product
P2 is formed, a controlled feed rate of B can be used to selectively inhibit the production of the
undesired product P2. Thus, with the possibility of using a large variety of organic and inorganic
base membranes that each can be modified with many unique functionalities, the amount of
modified membranes that can be potentially implemented in membrane reactors becomes

39
considerably vast. Most of the other configurations, that tend to be even more application-specific,
are usually designs derived thereafter. Some examples are the:
• catalytic membrane reactor,
• packed bed membrane reactor,
• catalytic nonperm-selective membrane reactor,
• nonperm-selective membrane reactor and the
• reactant-selective packed bed reactor.
A first example for a specific application are modified membranes for fuel cell applications. A fuel
cell is an electrochemical device that converts chemical energy directly into electrical energy.
While the most common membranes used are Nafion® or modified versions of it, some
advancements have been made using others base materials. E.g. Gohil et al123 developed novel
pore-filled polylectrolyte membranes using etched polycarbonate as base membrane that were
filled with poly(vinyl alcohol). The poly(vinyl alcohol) deposited inside the porous materials was
stabilized by crosslinking the filling material matrix with glutaraldehyde. The scientists tested their
novel materials in cathodic microbial fuel cells by assessing the deposited amount of filling
material and its correlation to their peak power density measured in mW/cm2. They found that the
performance is highly dependent upon physico-chemical properties such as water uptake, proton
conductivity and gel content and concluded that the water and hydronium anions inside the pores
act a proton transfer medium making them ideal for microbial fuel cells applications.
Another team of scientists124 developed an active, selective and durable water-gas shift catalytic
membrane for use in membrane reactors. The authors screened the most promising combination
of Rhodium/Lanthanium/Platinum/Silicon catalyst and compared this to the more common
Chromium/Iron catalyst to produce ultrapure hydrogen (<10 ppm of CO). The Fe-Cr are the most
often used catalysts in fuel cell membrane reactors where they are employed in the industrial

40
purification of hydrogen, which is to be used to produce ammonia and other petrochemical
products125. This type of catalysts were shown to be very selective under steady-state operation.
However, Liu et al126 have shown that the stability of Fe-Cr catalysts is adversely affected by often
stop-start operation modes and chromium toxicity is also another downside. After screening
different parameters and catalyst recipes, the researchers concluded that the Pt(0.6)/La2O3(27)SiO2
combination resulted in the most active, non-methane forming and the most stable under the water-
gas-shift reaction conditions catalytic membrane.
Figure 1-15: Membrane reactor scheme. Reprinted from Liu et al. 126, copyright (2005), with permission from Elsevier.
Previously discussed examples of applications were modifications of polymer membranes.
However, and more often now, inorganic membranes, such as ceramic membranes, are attracting
the attention of scientific research. In a current article, Arca-Ramos et al127 looked that the potential
of a ceramic membrane reactor for the laccase-catalyzed removal of bisphenol-A from secondary
effluents. Endocrine disrupting compounds, which are found in communal waste waters, have been
suspected to alter the functions of the endocrine system and, thus, cause adverse health effects in
living organisms or their offspring128. Natural and artificial endocrine disrupters are released into
the environment through sewage systems, because conventional wastewater treatment plants can
only partially degrade the hormone compounds. One viable solution is through the use of bio-

41
chemical treatment with enzymes, such as laccase. Laccase are promising catalysts, because they
only require O2 as final electron acceptor in order to catalyze the oxidative degradation of the
endocrine disrupters into products that lack the associated hormone-mimicking activity129. The
main goal of the researcher team was to develop a catalytic membrane reactor for continuous
removal of a hydrophobic micropollutant, contained in a model wastewater feed. Nearly complete
removal of bisphenol A (95%) was achieved under the investigated parameters.
Figure 1-16: Continuous enzymatic membrane reactor. The reactor consists of a stirred tank reactor coupled to a ceramic membrane, which prevented the sorption of the pollutant and allowed the
recovery and recycling of the biocatalyst. Reprinted from Arca-Ramos et al. 127, copyright (2015), with permission from SpringerLink.
Xu et al130 designed a monolithic catalyst for biodiesel production in a fixed-bed membrane
reactor. The research group deposited Ca-Mg-Al hydrotalcite as a second carrier on the inert
honeycomb ceramic surface of a base membrane and then loaded KF on the support as an active
component. Then then KF/Ca-Mg-Al hydroalcite/honeycomb ceramic monolithic catalyst was
packed in a membrane reactor system for the production of biodiesel from the transesterification
of soybean oil and methanol. The monolithic catalyst was evenly embedded in the ceramic

42
membrane, the shape of the honeycomb-like base membrane can be seen in the figure inset. For
the chemical reaction, soybean oil and methanol were added into the feedstock vessel in a molar
ratio of 1:24, where the reactants were well mixed. The reactant mixture was then pumped into the
membrane reactor and the unreacted methanol was recycled back in the feed loop. Biodiesel yield
up to 91.7% were obtained and the catalyst showed a reasonable stability, according to the authors.
As stated before, when it comes to a process that includes the combination of a reaction or
conversion with separation, membranes have mainly found application in a sequential mode, with
the reaction part followed by the separation part. The integration of both reaction and separation
in the same physical unit has then been defined as a membrane reactor. The general advantages of
membrane reactors as compared to sequential reaction-separation systems are: higher reaction
rates, lower energy requirement, possibility of heat integration and reduced secondary product
formation. With these advantages in mind, compact process equipment that can be operated with
a high degree of flexibility has been envisioned and developed131. Furthermore, because of the
capacity to reduce undesired reaction product formation and because of the more efficient use of
energy, the development of membrane reactors has paved the way to more sustainable processes
for the future132,133.
Disadvantages of catalytic membrane reactors remain the fact the industry is still not ripe in this
area and as many hurdles are overcome new issues are being discovered134. The amount of catalyst
and its stability on the membrane support are key concerns that need to be addressed135. Scaling
up the modification chemistry from lab scale to industrial scale will impose great difficulties as
will the design of adequate membrane casings.

43
References
1. Tissot BP, Welte DH. Petroleum formation and occurrence. 2nd ed. Berlin: Springer-Verlag; 1984.
2. Stainforth J. New insights into reservoir filling and mixing processes in understanding petroleum reservoirs: Toward an integrated reservoir engineering and geochemical approach. London: Special Publications Geological Society; 2004.
3. Letcher TM. Future energy - improved, sustainable and clean options for our planet. . 2008.
4. EIA. Energy information administration. https://www.eia.gov. Updated 2016. Accessed 11/08, 2016.
5. Global Climate Change. Exploring the environment. http://ete.cet.edu/gcc/?/globaltemp_ghgandtemp/. Updated 2017. Accessed 03/23, 2017.
6. EIA. Residential energy consumption survey. https://www.eia.gov/consumption/residential/. Updated 2015. Accessed 11/11, 2016.
7. Rhodes CJ. The oil question: Nature and prognosis. Sci Prog. 2008;91(Pt 4):317-375.
8. Stuart P, El-Halwagi M. Integrated biorefineries. design, analysis and optimization. Boca Raton, FL: CRC Press; 2013.
9. NYTimes. Corn ethanol increases tacos price. http://www.nytimes.com/2007/01/19/world/americas/19tortillas.html. Updated 2007. Accessed 12/08, 2106.
10. Wooley R, Ruth M, Sheehan J, Ibsen K, Majdeski H, Galvez A. Lignocellulosic biomass to ethanol process design and economics utilizing co-current dilute acid prehydrolysis and enzymatic hydrolysis current and futuristic scenarios. . 1999.
11. Huang HJ, Ramaswamy S, Tschirner UW, Ramarao BV. A review of separation technologies in current and future biorefineries. Separation and Purification Technology. 2008;62(1):1-21.
12. L.T. Fan MG,Y.H.Lee. Cellulose hydrolysis. Springer; 1987.
13. Demirbas MF. Biorefineries for biofuel upgrading: A critical review. Appl Energy. 2009;86:S151-S161.
14. Vertes AA, Qureshi N, Yukawa H, Blaschek HP, eds. Biomass to biofuels: Strategies for global industries. 1st ed. Wiley; 2010.

44
15. Pandey A, Larroche C, Ricke S, Dussap C, Gnansounou E, eds. Biofuels: Alternative feedstocks and conversion processes. 1st ed. Academic Press; 2011.
16. National Renewable Energy Laboratory. Evaluation of pretreatments of biomass for enzymatic hydrolysis of cellulose. . 2012;1249196981.
17. Qian X, Lei J, Vu A, Sun X, Wickramasinghe SR. Novel polymeric solid acid catalysts for cellulose hydrolysis. Abstracts of papers of the American Chemical Society. 2014:247.
18. Tadesse H, Luque R. Advances on biomass pretreatment using ionic liquids: An overview. Energy & Environmental Science. 2011;4(10):3913-3929.
19. Higuchi T. Biochemistry and molecular biology of wood. Springer Series in Wood Science ed. Syracuse NY: Springer; 1997.
20. Chum HL. The electrochemistry of biomass and derived materials. American Chemical Society; 1985.
21. Saravanan V, Waijers DA, Ziari M, Noordermeer MA. Recovery of 1-butanol from aqueous solutions using zeolite ZSM-5 with a high si/al ratio; suitability of a column process for industrial applications. Biochem Eng J. 2010;49(1):33-39.
22. Kogel-Knabner I. The macromolecular organic composition of plant and microbial residues as inputs to soil organic matter. Soil Biol Biochem. 2002;34(2):139-162.
23. Fengel D, Wegener G. Wood: Chemistry, ultrastructure, reactions. Kassel: Verlag Kassel; 2003.
24. Sjostrom E. Wood chemistry: Fundamentals and applications. Second Edition ed. San Diego: Academic Press; 1993.
25. Haider K. Problems related to the humification processes in soils of the temeperature climate. Vol. 7 ed. New York: Soil Biochemistry.
26. CARPITA N, GIBEAUT D. Structural models of primary-cell walls in flowering plants - consistency of molecular-structure with the physical-properties of the walls during growth. Plant J. 1993;3(1):1-30.
27. Swift MJ. Decomposition in terrestrial ecosystems. Studies in ecology ed. Blackwell; 1979.
28. De Leeuw JW, Largeau C. A review of macromolecular organic compounds that comprise living organisms and their role in kerogen, coal and petroleum formation. Organic Geochemistry ed. New York: Plenum Press; 1993.

45
29. Perez J, Munoz-Dorado J, de la Rubia R, Martinez J. Biodegradation and biological treatments of cellulose, hemicellulose and lignin. Int Microbiol. 2002;5:53-63.
30. Hatakka A. Biodegradation of lignin. Lignin, humic substances and coal ed. New York: Wiley-WCH; 2001.
31. Leonowicz A, Matuszewska A, Luterek J, et al. Biodegradation of lignin by white rot fungi. Fungal Genet Biol. 1999;27(2-3):175-185.
32. Mathews SL, Pawlak J, Grunden AM. Bacterial biodegradation and bioconversion of industrial lignocellulosic streams. Appl Microbiol Biotechnol. 2015;99(7):2939-2954.
33. Fontes CMGA, Gilbert HJ. Cellulosomes: Highly efficient nanomachines designed to designed to deconstruct plant cell wall complex carbohydrates. Annu Rev Biochem. 2010;79:655-681.
34. Pason P, Kyu K, Ratanakhanokchai K. Paenibacillus curdlanolyticus strain B-6 xylanolytic-cellulolytic enzyme system that degrades insoluble polysaccharides. Appl Environ Microbiol. 2006;72(4):2483-2490.
35. BEGUIN P, AUBERT J. The biological degradation of cellulose. FEMS Microbiol Rev. 1994;13(1):25-58.
36. Wenzl H. The chemical technology of wood. 111 5th Avenue, New York, New York: Academy Press, Inc.; 1970.
37. Goto K, Sakai Y, Kamiyama Y, Kobayashi T. The rate of cellulose hydrolysis by a small amount of concentrated sulfuric acid. Agr Biol Chem. 1971;35(1):111-114.
38. WHALLEY E. Pressure effect and mechanism in acid catalysis .1. Transactions of the Faraday Society. 1959;55(5):798-808.
39. Goldstein I. Organic chemicals from biomass. Florida: CRC Press; 1981.
40. BERINGER F, SANDS S. The synthesis, acidity and decarboxylation of substituted mesitoic acids. J Am Chem Soc. 1953;75(14):3319-3322.
41. BUNTON C, LEWIS T, LLEWELLYN D, VERNON C. Mechanisms of reactions in the sugar series .1. the acid-catalysed hydrolysis of alpha-methyl and beta-methyl and alpha-phenyl and beta-phenyl D-glucopyranosides. Journal of the Chemical Society. 1955:4419-4423.
42. Freudenberg K, Blomqvist G. Die hydrolyse der cellulose und ihrer oligosaccharide. Chem Institut d. Universitaet Heidelberg. 1935;68:2070.

46
43. Hammett L, Paul M. The relation between the rates of some acid catalyzed reactions and the acidity function, H0. JACS. 1934;56:830.
44. NEVELL T, UPTON W. Hydrolysis of cotton cellulose by hydrochloric-acid in benzene. Carbohydr Res. 1976;49(JUL):163-174.
45. Szetli J. Saurehydrolyse glycosidischer bindungen. Leipzig: VEB; 1975.
46. Zhang Y, Du H, Qian X, Chen EY-. Ionic liquid-water mixtures: Enhanced K-w for efficient cellulosic biomass conversion. Energy Fuels. 2010;24:2410-2417.
47. Amarasekara AS, Owereh OS. Hydrolysis and decomposition of cellulose in bronsted acidic ionic liquids under mild conditions. Ind Eng Chem Res. 2009;48(22):10152-10155.
48. Li C, Zhao ZK. Efficient acid-catalyzed hydrolysis of cellulose in ionic liquid. Advanced Synthesis & Catalysis. 2007;349(11-12):1847-1850.
49. Li C, Wang Q, Zhao ZK. Acid in ionic liquid: An efficient system for hydrolysis of lignocellulose. Green Chem. 2008;10(2):177-182.
50. Wang H, Gurau G, Rogers RD. Ionic liquid processing of cellulose. Chem Soc Rev. 2012;41(4):1519-1537.
51. Seddon K. Ionic liquids for clean technology. J Chem Technol Biotechnol. 1997;68(4):351-356.
52. Ramnial T, Ino D, Clyburne J. Phosphonium ionic liquids as reaction media for strong bases. Chem Commun. 2005(3):325-327.
53. Graenacher C, inventor1934.
54. Rogers R, Seddon K. Ionic liquids - solvents of the future? Science. 2003;302(5646):792-793.
55. Holbrey J, Swatloski R, Reichert W, et al. Getting started with ionic liquids: An experience-based tutorial. Abstr Pap Am Chem Soc. 2003;226:U620-U620.
56. Liu Q, Zhang Z, Zhang F. Progress in biocatalytic reactions in ionic liquids. Prog Chem. 2005;17(6):1060-1066.
57. Heinze T, Schwikal K, Barthel S. Ionic liquids as reaction medium in cellulose functionalization. Macromol Biosci. 2005;5(6):520-525.
58. Mazza M, Catana D, Vaca-Garcia C, Cecutti C. Influence of water on the dissolution of cellulose in selected ionic liquids. Cellulose. 2009;16(2):207-215.
47
59. Bagheri M, Rodriguez H, Swatloski RP, Spear SK, Daly DT, Rogers RD. Ionic liquid-based preparation of cellulose-dendrimer films as solid supports for enzyme immobilization. Biomacromolecules. 2008;9(1):381-387.
60. Quan S, Kang S, Chin I. Characterization of cellulose fibers electrospun using ionic liquid. Cellulose. 2010;17(2):223-230.
61. Turner M, Spear S, Holbrey J, Rogers R. Production of bioactive cellulose films reconstituted from ionic liquids. Biomacromolecules. 2004;5(4):1379-1384.
62. Sun N, Swatloski RP, Maxim ML, et al. CELL 285-cellulose composite fibers prepared from ionic liquid-based solution. Abstr Pap Am Chem Soc. 2008;235.
63. Rahatekar SS, Rasheed A, Jain R, et al. Solution spinning of cellulose carbon nanotube composites using room temperature ionic liquids. Polymer. 2009;50(19):4577-4583.
64. El Seoud OA, Koschella A, Fidale LC, Dorn S, Heinze T. Applications of ionic liquids in carbohydrate chemistry: A window of opportunities. Biomacromolecules. 2007;8(9):2629-2647.
65. Zhao H, Baker GA, Song Z, Olubajo O, Crittle T, Peters D. Designing enzyme-compatible ionic liquids that can dissolve carbohydrates. Green Chem. 2008;10(6):696-705.
66. Xu A, Wang J, Wang H. Effects of anionic structure and lithium salts addition on the dissolution of cellulose in 1-butyl-3-methylimidazolium-based ionic liquid solvent systems. Green Chem. 2010;12(2):268-275.
67. Swatloski R, Spear S, Holbrey J, Rogers R. Ionic liquids: New solvents for non-derivitized cellulose dissolution. Abstr Pap Am Chem Soc. 2002;224:U622-U622.
68. Nieto de Castro CA. Thermophysical properties of ionic liquids: Do we know how to measure them accurately? J Mol Liq. 2010;156(1):10-17.
69. Fernandes AM, Rocha MAA, Freire MG, Marrucho IM, Coutinho JAP, Santos LMNBF. Evaluation of cation-anion interaction strength in ionic liquids. J Phys Chem B. 2011;115(14):4033-4041.
70. Erdmenger T, Haensch C, Hoogenboom R, Schubert US. Ionic liquids and their application in cellulose chemistry. Abstr Pap Am Chem Soc. 2007;233.
71. Srokol Z, Bouche A, van Estrik A, Strik R, Maschmeyer T, Peters J. Hydrothermal upgrading of biomass to biofuel; studies on some monosaccharide model compounds. Carbohydr Res. 2004;339(10):1717-1726.
72. Rinaldi R, Meine N, vom Stein J, Palkovits R, Schueth F. Which controls the depolymerization of cellulose in ionic liquids: The solid acid catalyst or cellulose? ChemSusChem. 2010;3(2):266-276.

48
73. Qian XH, Lei J, Wickramasinghe SR. Novel polymeric solid acid catalysts for cellulose hydrolysis. Rsc Advances. 2013;3(46):24280-24287.
74. Brandt A, Grasvik J, Hallett JP, Welton T. Deconstruction of lignocellulosic biomass with ionic liquids. Green Chem. 2013;15(3):550-583.
75. Hyraxenergy. http://hyraxenergy.com/. Updated 2016. Accessed 12/06, 2016.
76. Vanoye L, Fanselow M, Holbrey JD, Atkins MP, Seddon KR. Kinetic model for the hydrolysis of lignocellulosic biomass in the ionic liquid, 1-ethyl-3-methyl-imidazolium chloride. Green Chem. 2009;11(3):390-396.
77. Binder JB, Raines RT. Fermentable sugars by chemical hydrolysis of biomass. Proc Natl Acad Sci U S A. 2010;107(10):4516-4521.
78. Binder JB, Blank JJ, Cefali AV, Raines RT. Synthesis of furfural from xylose and xylan. ChemSusChem. 2010;3(11):1268-1272.
79. Liu L, Zhang Y, Zhang L, et al. Highly specific revelation of rat serum glycopeptidome by boronic acid-functionalized mesoporous silica. Anal Chim Acta. 2012;753:64-72.
80. Fort DA, Remsing RC, Swatloski RP, Moyna P, Moyna G, Rogers RD. Can ionic liquids dissolve wood? processing and analysis of lignocellulosic materials with 1-n-butyl-3-methylimidazolium chloride. Green Chem. 2007;9(1):63-69.
81. Sun N, Rahman M, Qin Y, Maxim ML, Rodriguez H, Rogers RD. Complete dissolution and partial delignification of wood in the ionic liquid 1-ethyl-3-methylimidazolium acetate. Green Chem. 2009;11(5):646-655.
82. Viell J, Marquardt W. Disintegration and dissolution kinetics of wood chips in ionic liquids. Holzforschung. 2011;65(4):519-525.
83. Dibble DC, Li C, Sun L, et al. A facile method for the recovery of ionic liquid and lignin from biomass pretreatment. Green Chem. 2011;13(11):3255-3264.
84. Wei L, Li K, Ma Y, Hou X. Dissolving lignocellulosic biomass in a 1-butyl-3-methylimidazolium chloride-water mixture. Ind Crop Prod. 2012;37(1):227-234.
85. Ngoc Lan Mai, Nam Trung Nguyen, Kim J, Park H, Lee S, Koo Y. Recovery of ionic liquid and sugars from hydrolyzed biomass using ion exclusion simulated moving bed chromatography. J Chromatogr A. 2012;1227:67-72.
86. Francisco M, Mlinar AN, Yoo B, Bell AT, Prausnitz JM. Recovery of glucose from an aqueous ionic liquid by adsorption onto a zeolite-based solid. Chem Eng J. 2011;172(1):184-190.
49
87. Shill K, Padmanabhan S, Xin Q, Prausnitz JM, Clark DS, Blanch HW. Ionic liquid pretreatment of cellulosic biomass: Enzymatic hydrolysis and ionic liquid recycle. Biotechnol Bioeng. 2011;108(3):511-520.
88. Deng Y, Chen J, Zhang D. Phase diagram data for several salt plus salt aqueous biphasic systems at 298.15 K. J Chem Eng Data. 2007;52(4):1332-1335.
89. Swatloski R, Spear S, Holbrey J, Rogers R. Dissolution of cellose with ionic liquids. J Am Chem Soc. 2002;124(18):4974-4975.
90. Liu W, Cheng L, Zhang Y, Wang H, Yu M. The physical properties of aqueous solution of room-temperature ionic liquids based on imidazolium: Database and evaluation. J Mol Liq. 2008;140(1-3):68-72.
91. Intechopen. Membrane classification. http://www.intechopen.com/source/html/37613/media/image11.png. Accessed 12/05, 2016.
92. Paul R, Yampolskii Y. Polymeric gas-separation membranes. CRC Press; 1994.
93. Katoh M, Inone M, Hashimoto T, Furono N. Hydrocarbon vapor recovery with membrane technology. . 1993.
94. MarketsandMarkets. Projection of market value for membrane separations. https://www.marketsandmarkets.com/. Accessed 09/15, 2016.
95. Goulas A, Grandison A, Rastall R. Fractionation of oligosaccharides by nanofiltration. J Sci Food Agric. 2003;83(7):675-680.
96. Goulas A, Kapasakalidis P, Sinclair H, Rastall R, Grandison A. Purification of oligosaccharides by nanofiltration. J Membr Sci. 2002;209(1):321-335.
97. RAUTENBACH R, GROSCHL A. Separation potential of nanofiltration membranes. Desalination. 1990;77(1-3):73-84.
98. ERIKSSON P. Nanofiltration extends the range of membrane filtration. Environ Prog. 1988;7(1):58-62.
99. Vandezande P, Gevers LEM, Vankelecom IFJ. Solvent resistant nanofiltration: Separating on a molecular level. Chem Soc Rev. 2008;37(2):365-405.
100. Xu Y, Lebrun RE. Comparison of nanofiltration properties of two membranes using electrolyte and non-electrolyte solutes. Desalination. 1999;122(1):95-105. doi: http://dx.doi.org/10.1016/S0011-9164(99)00031-4.
101. Bowen W, Mukhtar H. Characterisation and prediction of separation performance of nanofiltration membranes. J Membr Sci. 1996;112(2):263-274.
50
102. Malmali M, Wickramasinghe SR, Tang J, Cong H. Sugar fractionation using surface-modified nanofiltration membranes. Separation and Purification Technology. 2016;166:187-195.
103. Nyström M, Kaipia L, Luque S. Fouling and retention of nanofiltration membranes. J Membr Sci. 1995;98(3):249-262. doi: http://dx.doi.org/10.1016/0376-7388(94)00196-6.
104. Archer A, Mendes A, Boaventura R. Separation of an anionic surfactant by nanofiltration. Environ Sci Technol. 1999;33(16):2758-2764.
105. Hagmeyer G, Gimbel R. Modelling the rejection of nanofiltration membranes using zeta potential measurements. Sep Purif Technol. 1999;15(1):19-30.
106. Zhang Y, Su Y, Peng J, et al. Composite nanofiltration membranes prepared by interfacial polymerization with natural material tannic acid and trimesoyl chloride. J Membr Sci. 2013;429:235-242.
107. Yung L, Ma H, Wang X, et al. Fabrication of thin-film nanofibrous composite membranes by interfacial polymerization using ionic liquids as additives. J Membr Sci. 2010;365(1–2):52-58.
108. Karan S, Jiang Z, Livingston AG. Sub-10 nm polyamide nanofilms with ultrafast solvent transport for molecular separation. Science. 2015;348(6241):1347-1351.
109. Jiao B, Cassano A, Drioli E. Recent advances on membrane processes for the concentration of fruit juices: A review. J Food Eng. 2004;63(3):303-324.
110. Cassano A, Drioli E, Galaverna G, Marchelli R, Di Silvestro G, Cagnasso P. Clarification and concentration of citrus and carrot juices by integrated membrane processes. J Food Eng. 2003;57(2):153-163.
111. Versari A, Ferrarini R, Parpinello G, Galassi S. Concentration of grape must by nanofiltration membranes. Food Bioprod Process. 2003;81(C3):275-278.
112. Cassano A, Cabri W, Mombelli G, Peterlongo F, Giorno L. Recovery of bioactive compounds from artichoke brines by nanofiltration. Food Bioprod Process. 2016;98:257-265.
113. Kang G, Cao Y. Application and modification of poly(vinylidene fluoride) (PVDF) membranes - A review. J Membr Sci. 2014;463:145-165.
114. Tomer N, Mondal S, Wandera D, Wickramasinghe SR, Husson SM. Modification of nanofiltration membranes by surface-initiated atom transfer radical polymerization for produced water filtration. Sep Sci Technol. 2009;44(14):3346-3368.
115. Koros W, Ma Y, Shimidzu T. Terminology for membranes and membrane processes (reprinted from pure & appl chem, vol 68, pg 1479-1489, 1996). J Membr Sci. 1996;120(2):149-159.

51
116. Schafer A, Andristos N, Karabelas A, Hoek E, Schneider R, Nystrom M. Fouling in nanofiltration. In: Nanofiltration - principles and applications. Elsevier; 2004:169-239.
117. Levenstein R, Hasson D, Semiat R. Utilization of the donnan effect for improving electrolyte separation with nanofiltration membranes. J Membr Sci. 1996;116(1):77-92.
118. Mondal S. Polymeric membranes for produced water treatment: An overview of fouling behavior and its control. Reviews in Chemical Engineering. 2016;32(6):611-628.
119. Liu P, Ciora R, Tsotsis T, Sahimi M. Development of a CO2 affinity ceramic membrane. Abstr Pap Am Chem Soc. 2003;225:U855-U855.
120. Ciora R, Fayyaz B, Liu P, et al. Preparation and reactive applications of nanoporous silicon carbide membranes. Chem Eng Sci. 2004;59(22-23):4957-4965.
121. Meng L, Kanezashi M, Tsuru T. Catalytic membrane reactors for SO3 decomposition in Iodine–Sulfur thermochemical cycle: A simulation study. Int J Hydrogen Energy. 2015;40(37):12687-12696.
122. Rios GM, Belleville M, Paolucci-Jeanjean D. Membrane engineering in biotechnology: Quo vamus? Trends Biotechnol. 2007;25(6):242-246.
123. Gohil JM, Karamanev DG. Novel pore-filled polyelectrolyte composite membranes for cathodic microbial fuel cell application. J Power Sources. 2013;243:603-610.
124. Lombardo EA, Cornaglia C, Munera J. Development of an active, selective and durable water-gas shift catalyst for use in membrane reactors. Catal Today. 2016;259:165-176.
125. Babita K, Sridhar S, Raghavan KV. Membrane reactors for fuel cell quality hydrogen through WGSR - review of their status, challenges and opportunities. Int J Hydrogen Energy. 2011;36(11):6671-6688.
126. Liu X, Ruettinger W, Xu X, Farrauto R. Deactivation of pt/CeO2 water-gas shift catalysts due to shutdown/startup modes for fuel cell applications. Appl Catal B-Environ. 2005;56(1-2):69-75.
127. Arca-Ramos A, Eibes G, Feijoo G, Lema JM, Moreira MT. Potentiality of a ceramic membrane reactor for the laccase-catalyzed removal of bisphenol A from secondary effluents. Appl Microbiol Biotechnol. 2015;99(21):9299-9308.
128. European C. Community strategy for endocrine disrupters. . 2007.
129. Cabana H, Jones JP, Agathos SN. Elimination of endocrine disrupting chemicals using white rot fungi and their lignin modifying enzymes: A review. Eng Life Sci. 2007;7(5):429-456.
52
130. Xu W, Gao L, Xiao G. Biodiesel production optimization using monolithic catalyst in a fixed-bed membrane reactor. Fuel. 2015;159:484-490.
131. Dixon A. Modeling and simulation of heterogeneous catalytic processes, volume 45. 40th ed. Academic Press; 1999.
132. Saracco G, Neomagus H, Versteeg G, van Swaaij W. High-temperature membrane reactors: Potential and problems. Chem Eng Sci. 1999;54(13-14):1997-2017.
133. SARACCO G, VELDSINK J, VERSTEEG G, VANSWAAIJ W. Catalytic combustion of propane in a membrane reactor with separate feed of reactant .1. operation in absence of trans-membrane pressure-gradients. Chem Eng Sci. 1995;50(12):2005-2015.
134. TSOTSIS T, CHAMPAGNIE A, VASILEIADIS S, ZIAKA Z, MINET R. The enhancement of reaction yield through the use of high-temperature membrane reactors. Sep Sci Technol. 1993;28(1-3):397-422.
135. Malmali M, Stickel J, Wickramasinghe SR. Investigation of a submerged membrane reactor for continuous biomass hydrolysis. Food Bioprod Process. 2015;96:189-197.

53
2. Nanofiltration membranes for ionic liquid recovery*
* This chapter is adapted from a published paper by: Alexandru M. Avram, Pejman
Ahmadiannamini, Xianghong Qian, S. Ranil Wickramasinghe. Separation and Purification
Technology. Published April.03.2017. http://dx.doi.org/10.1080/01496395.2017.1316289
* All experiments were conducted by Mr Alexandru Avram with some assistance from Dr Pejman
Ahmadiannamini. Prof Qian guided the experimental work and Prof Wickramasinghe helped with
editing the manuscript.
Abstract
Nanofiltration membranes have been developed by interfacial polymerization using base PES
ultrafiltration membranes. By varying the concentration of the reactive monomers present as well
as the reaction conditions, the structure of the polymerized barrier layer has been modified. Here
the ability to concentrate low molecular weight sugars while allowing dissolved ionic liquids in
aqueous solution to be recovered in the permeate has been investigated for application in biomass
hydrolysis. The results obtained here indicate that the selectivity for 1-butyl-3-
methylimidazoliumchloride (BmimCl) over glucose can be as high as 36.6. The membrane
permeance was 2.31 L m-2 h-1 bar-1.
2.1. Introduction
Ionic liquids are molten salts at room temperature which are non-volatile and therefore have no
measurable vapor pressure.1 Today they find applications as electrolytes in batteries, lubricants in
bearings and as green solvents.2,3 Numerous studies indicate that ionic liquids could be an
emerging solvent for pretreatment of lignocellulosic biomass.4-6 Due to the very high recalcitrance
of lignocellulosic biomass, deconstruction of the biomass is essential prior to fermentation. The
deconstruction step typically known as pretreatment, involves a number of objectives: breakdown

54
of the carbohydrate-lignin complex, disruption of the cellulose crystallinity and hydrolysis of
hemicellulose.7-10
Most pretreatment processes have disadvantages. Dilute acid pretreatment produces furfural and
acetic acid which are inhibitory to the microorganisms used during fermentation.11 Alkali
pretreatment leads to the formation of xylo-oligomers which are inhibitory to the enzymes used
for saccharification.12 Biological methods tend to be slow and mechanical methods involve high
energy and equipment costs.
Ionic liquids provide an alternative method of biomass deconstruction. They act by dissolving the
biomass which allows for much better access of the enzymes used for hydrolysis of cellulose.
Further, ionic liquids have been shown to reduce the crystallinity of the cellulose leading to higher
glucose yields during enzymatic saccharification.13
Depending on the chemical structure of the anion and cation pair, ionic liquids differ considerably
in physico-chemical properties such as hydrophobicity, charge, molecular weight and viscosity.14
Tadesse et al. published an extensive list of ionic liquids with applications in biomass
deconstruction.15 The key mechanism for biomass solubilization is the ability of the ionic liquid to
break the dense hydrogen bonding network that holds together the crystalline structure of
recalcitrant bio-polymers.
Unfortunately, the high cost of ionic liquids means that efficient recovery and recycle of the ionic
liquid is essential for an economically viable process. Here, we investigate the feasibility of
developing nanofiltration membranes for ionic liquid recovery. Though initially developed for
water softening applications, today nanofiltration is finding applications in numerous areas where
separation of dissolved solutes in the size range 150 to 1000 Da is required.16

55
Few studies have considered nanofiltration for ionic liquid recovery. Han et al. consider the use of
nanofiltration to recover ionic liquids from ionic liquid mediated Suzuki coupling reactions.17
Krockel and Kragel investigated the recovery of nonvolatile products from solutions containing
ionic liquids while Gan et al. investigated filtration of ionic liquid mixtures containing methanol,
ethanol and water.18,19 Their focus however was on the rheological properties of ionic liquid
mixtures rather than recovery of ionic liquids.
Ables et al. have considered the use of commercially available nanofiltration membranes for
purification of ionic liquids in biorefining applications.20 Using model feed solutions consisting of
ionic liquids and water, the efficiency of concentrating the ionic liquid in the retentate was
investigated. These investigators concluded that the osmotic pressure differences between the feed
and permeate acted against the separation of ionic liquid from ionic liquid/water mixtures limiting
the maximum concentration of ionic liquid that could be obtained. Rejection of sugars dissolved
in the ionic liquid was also investigated. The rejection of sugars was strongly membrane
dependent.
In a more recent study, Ables et al. have investigated the use of membrane processes for recovery
of glucose from an enzymatic hydrolysis process using ionic liquid pretreated cellulose.13 Three
membrane based unit operations were considered: ultrafiltration for enzyme and cellulose recovery
(in the retentate), nanofiltration for cellobiose and ionic liquid recovery in the retentate and
electrodialysis for removal of ionic liquid from the glucose. They indicate that the major cost of
the process is the ionic liquid. Compared to the current selling price of glucose the proposed
process is not economical.
These previous studies indicate the challenges involved in recovering ionic liquid from ionic
liquid/water/sugar mixtures. Recovery of the ionic liquid will be necessary if the unique properties

56
of ionic liquids for deconstructing lignocellulosic biomass and reducing the crystallinity of
cellulose are to be leveraged in future biorefineries. Here, we have created nanofiltration
membranes with different barrier properties in order to investigate the feasibility of recovering
ionic liquids. Our aim is to maximize the ionic liquid recovered in the permeate while obtaining
as high a rejection of dissolved sugars as possible. Using base ultrafiltration membranes as a
support structure, we have used interfacial polymerization (IP) to create a dense polyamide layer.
Interfacial polycondensation has been widely used to grow a thin polyamide skin layer on a porous
substrate.21 Karan et al. have indicated that careful control of the interfacial polymerization process
can lead to high rejection and high flux nanofiltration membranes for molecular separations.22
Common reactive monomers are diamines such as piperazine (PIP), m-phenylenediamine (MDP)
and p-phenylemediamine (PPD) and acid chloride monomers such as trimesoyl chloride (TMC),
isophthaloyl chloride (IPC) and 5-isocyanato-isophthaloyl chloride (ICIC).23 Here we focus on
the reaction of TMC with PIP which has been shown to lead to successful commercial thin film
composite polyamide nanofiltration membranes.
Recent publications highlight the ability to tune the performance of these nanofiltration
membranes by inclusion of novel monomers as well as inorganic additives.24,25 Here we have
incorporated 3-aminophenylboronic acid (BA) in the IP layer to control the sugar selectivity and
permeance of the membrane. Studies with boronic acid have shown that the steric conformation
of the hydroxyl group connected to the boron can act as an on/off switch for forming bonds with
the hydroxyl groups on sugars.26-29 Evidence shows that the growth of the skin layer is located on
the organic solvent side of the interface.21,23 Thus by including BA in the aqueous phase, we aim
to impede the passage of sugars while enhancing the passage of ionic liquids. Membrane
performance has been determined using model feed streams consisting of (1) aqueous sugar

57
solutions, (2) aqueous ionic liquid solutions and (3) three component sugar, water and ionic liquid
mixtures.
2.2. Experimental
Materials
The following chemicals were obtained from Sigma Aldrich (St. Louis, MO): triethylamine (Et3N,
99% purity), 1-butyl-3-methylimidazoliumchloride (BmimCl, 98% purity), 1-ethyl-3-
methylimidazolium acetate (EmimOAc, 90% purity), D-(+)-glucose, D-(+)-xylose, D-(-)-fructose.
1,3,5-benzenetricarbonyl chloride (trimesoyl chloride, TMC, 98% purity) was obtained from Alfa
Aesar (Heysham, England); 3-aminophenylboronic acid monohydrate (BA, 98% purity) from AK
Scientific (Union City, NJ), anhydrous piperazine (PIP) from Tokyo Chemical Industry (Portland,
OR), and D-(+)-cellobiose from MP Biomedicals (Solon, OH). Hexane (HPLC grade),
hydrochloric acid (37% v/v) and 30 and 50 kDa ultrafiltration membranes were purchased from
EMD Millipore (Billerica, MA). All aqueous solutions were prepared with deionized water at 18.0
MΩ·cm produced with Thermo Scientific, model Smart2Pure 12 UV/UF (Waltham, MA).
Membrane modification via interfacial polymerization (IP)
Ultrafiltration membranes (30 and 50 kDa) were washed overnight in DI water. The membranes
were then immersed in an aqueous solution containing PIP at concentrations varying from 0.1 to
1.5 wt % under continuous stirring for 4 hours. The BA concentration in the solution varied from
0.05 to 1.0 wt %. Next, the wet membranes were hung vertically for 5 minutes to let excess
solution drip off the surface. The remaining droplets were wiped off with a clean teflon O-ring.
The wet membranes were then placed in a custom-made teflon holder to only expose the barrier
surface (feed side) of the membrane to an organic phase consisting of hexane containing 0.15 wt
% TMC for various times. The polymerization time is the time for which the hexane solution was

58
in contact with the membrane filled with aqueous solution. The polymerization was conducted at
either 25°C or -4°C. The polymerization was stopped when the organic solution was removed and
the remaining organic droplets were evaporated in the fume hood for approximately 5 minutes.
For some membranes Et3N was added to the organic phase in the ratio 1:1.5wt %. BA:Et3N.
Finally, the modified membranes were annealed at 50°C for 30 minutes and washed with deionized
water three times before storing in DI water at room temperature. Figure 2-1 gives the overall
reaction scheme.
Figure 2-1: Reaction scheme for interfacial polymerization with expected products; 3-aminophenylboronic acid (BA) and piperazine (PIP) are in aqueous solution while trimesoyl chloride (TMC) is in hexane. Surface Characterization
Cl
O
ClO
Cl
O
NH
NH
B
NH2
OHOH
O
O
O O
O
O
N N
B
NH
OH OHB
NH
OH OH
+ +
+ ClH
M.W.136.94 g/mol
M.W.86.14 g/mol
M.W.265.48 g/mol
n
n

59
Attenuated total reflectance Fourier transform infrared (ATR-FTIR) spectroscopy (Shimadzu, IR
Affinity-1, Kyoto, Japan) was used to analyze membrane surface chemistry after modification.
The instrument was equipped with a deuterated L-alanine doped triglycine sulfate (DLaTGS)
detector with a resolution of 0.5-16 cm-1, a germanium-coated potassium beam splitter with an
incidence angle of 45° and a Pike Technologies (Madison, WI) zinc selenide ATR prism. Prior to
surface analysis, the membranes were rinsed with DI water. They were then placed in a 100 mL
beaker containing 70 mL DI water for 2 hours with slow stirring. The samples were dried in a
vacuum oven for at least 30 minutes before analysis. Spectra were collected at room temperature
over a scanning range 600–3000 cm-1 with a resolution of 8.0 cm-1 and with 50 scans per sample.
Spectral analysis was performed using IR solution software (Shimadzu IR solution v1.60).
Atomic force microscopy (AFM) was performed in order to study the topography of modified and
unmodified membranes. A Dimension icon with ScanAsyst sample chamber (Bruker, Camarillo,
CA) was used. Membranes were air dried and analyzed in tapping mode with a silicon tip on a
nitride lever. The images 5 m x 5 m (512 x 512 pixel) were recorded at a scanning rate of 1
Hz. A Bruker ScanAsyst air silicone tip on a nitride lever with a spring constant of 0.4 N/m
(cantilever details: width = 25 µm, length = 115 µm, thickness = 650 nm) was used.
Rejection experiments
Permeance and rejection data were obtained for modified membranes in dead end filtration tests
using a stirred stainless steel pressure vessel (Sterlitech HP4750, Kent, WA). Pressurized nitrogen
(Airgas, Springdale, AR) was used to pump the feed through the various modified membranes,
while the feed was mixed using a stirrer plate (Chemglass Optichem, Vineland, NJ). The permeate
was collected in a beaker placed on a balance (Mettler Toledo PL602-S, Columbus, OH) connected

60
to a computer. Table 2-1 summarizes the membrane modification conditions and model feed
streams that were investigated.
Table 2-1: Summary of membrane modification conditions and feed streams tested.
Base membrane 30 and 50 kDa PES ultrafiltration membranes
Polymerization conditions Aqueous phase DI water containing 0.1 to 1.5 wt % PIP, 0
to 1.0 wt % BA
Organic phase: Hexane containing 0.15 wt % TMC, if
Et3N added, BA: Et3N was 1:1.5 wt %
Reaction conditions: 25°C or -4°C, polymerization times
1-25 min, annealing at 50°C for 30 min
Single component feed
streams model feed streams
DI water containing cellobiose, glucose, xylose, fructose,
20 mM solution; EmimOAc, BmimCl, 115 mM solution
Multicomponent model feed
streams
2% glucose and 1% BmimCl: 10% glucose and 10%
BmimCl; 5% glucose and 10% BmimCl; 5% Cellobiose
and 10% BmimCl
Though all experiments were conducted in dead end mode, a region of pseudo steady state
operation could be established. The first 7 mL of permeate were discarded to ensure any transient
effects during start up were eliminated. The next 9 mL of permeate were then used to determine
rejection of dissolved solutes. This represents a reduction in volume of the original 200 mL feed
solution from 3.5 to 8%. Pseudo steady state operation is observed as the change in feed conditions
is very small during this period. Additional experiments suggest that pseudo steady state operation
is maintained till about 25% of the original feed volume is removed in the permeate. Feed
pressures were in the range 690 – 1725 kPa.

61
Samples from the permeate side were taken and analyzed as follows. For single component feed
streams consisting of cellobiose, glucose, xylose and fructose in DI water the sugar concentration
was determined using HPLC 1200 series (Agilent Technologies, Palo Alto, CA) equipped with a
Hi-Plex Ca (Duo) column (Agilent, 300 x 6.5 mm length x I.D, 8 µm pore size), injection volume:
5 µL, mobile phase: deionized water, flow rate: 0.6 mL/minute, column temperature: 80°C, RID
detector temperature: 45°C, run time: 30 minutes.
For multicomponent feed streams consisting of sugars and IL in DI water, the colorimetric 3,5-
dinitrosalicyclic acid (DNS) method was employed in order to determine the concentration of total
reducing sugars (TRS) at 540 nm.30 The ionic liquid concentration was quantified using a hand
held conductivity meter Symphony SP70C (VWR, Batavia, IL) equipped with a 2-electrode
conductivity cell of epoxy/platinum and a nominal cell constant of 1.0 cm-1 (Thermo Scientific,
Beverly, MA). Rejection of sugars and ionic liquids as well as selectivity of the membrane were
calculated using the following relationships:
𝑅𝑅𝑖𝑖 = �1 − 𝑐𝑐𝑖𝑖𝑖𝑖𝑐𝑐𝑖𝑖𝑖𝑖� × 100% (1)
𝑆𝑆𝑖𝑖/𝑗𝑗 = (100 − 𝑅𝑅𝑖𝑖)/�100 − 𝑅𝑅𝑗𝑗� (2)
where cip and cif are solute concentration of a given component in the permeate and feed,
respectively, Si/j is selectivity of component i with respect to j. For each run, the first 7 mL of
permeate were discarded and the next 9 mL of permeate used to determine cip and cif which
represented a period of pseudo steady state operation. The permeance of pure water was calculated
using the following relationship:
𝑃𝑃 = 𝑉𝑉𝐴𝐴∙𝑆𝑆∙∆𝑃𝑃
(3)

62
where t is the time to collect volume V of permeate, A is membrane area, and P is applied
pressure.
All results were obtained in triplicate. Error bars or error ranges indicate the variation observed
over the three readings.
2.3. Results and discussion
IP membranes
Unlike PIP, BA contains only one reactive amine group (Figure 2-1). Thus, incorporation of BA
will lead to a termination event while incorporation of PIP can lead to further reaction via the
second amine group. Consequently, the permeability of the IP layer will be modified by inclusion
of BA. The initial focus was to determine the effect of changing the concentration of PIP and BA
in order to maximize passage of ionic liquid and rejection of sugars. Table 2-2 indicates that any
separation between ionic liquid and the sugars investigated here, cannot be based on size exclusion
alone as the molecular weights of the various species are very close to each other. Thus,
preferential interactions between the ILs and sugars and the membrane will be critical.
Table 2-2: Molecular weight of solutes.
Compound MW, g/mol
Cellobiose 342.3
Glucose 180.2
Xylose 150.1
Fructose 180.2
EmimOAc 170.2
BmimCl 174.7

63
Table 2-3 gives the effect of varying PIP concentration on rejection of individual sugars and ILs
in aqueous solution. We see an increase in rejection with increasing PIP concentration until about
1.0 wt %, after which the rejection starts to decrease, probably due to a too high molar ratio
PIP:BA:TMC, resulting in an increased amount of reaction by-products and/or heterogeneous
cross-linking. The results indicate that by optimizing the components in the aqueous phase within
the membrane pores during interfacial polymerization, one can adjust the rejection of IL versus
sugars.
Table 2-3: Variation of rejection with PIP concentration for modified 50 kDa base PES membranes for aqueous feed streams containing single component sugars and ionic liquids. Modification conditions were: 0.1 wt %. BA in the aqueous phase, reaction temperature were 25°C for a reaction time of 15 min.
[PIP], wt % Rejection, %
Cellobiose Glucose Xylose Fructose EmimOAc BmimCl
0.1 2.6 ± 0.1 1.4 ± 0.0 1.1 ± 0.0 1.3 ± 0.0 2.6 ± 0.2 2.1 ± 0.1
0.3 7.3 ± 0.1 2.7 ± 0.1 1.5 ± 0.0 1.3 ± 0.0 5.0 ± 0.3 5.5 ± 0.3
0.5 68.8 ± 1.4 65.2 ± 1.1 56.0 ± 1.1 65.3 ± 0.7 61.0 ± 3.7 52.6 ± 3.2
0.6 67.1 ± 1.3 60.6 ± 0.9 45.5 ± 0.9 60.7 ± 0.6 64.1 ± 3.8 60.4 ± 3.6
0.8 71.9 ± 1.4 67.2 ± 1.1 53.5 ± 1.1 66.9 ± 0.7 77.1 ± 4.6 63.5 ± 3.8
1.0 96.4 ± 1.9 94.7 ± 1.8 89.3 ± 1.8 94.7 ± 0.9 74.3 ± 4.5 79.4 ± 4.8
1.3 82.9 ± 1.7 80.6 ± 1.5 76.1 ± 1.5 81.3 ± 0.8 79.7 ± 4.8 79.0 ± 4.7
1.5 60.2 ± 1.2 60.5 ± 1.1 56.0 ± 1.1 59.1 ± 0.6 56.4 ± 3.4 52.8 ± 3.2
Table 2-3 indicates that generally rejection of cellobiose is the highest while xylose is the lowest
for all membranes. Further, rejection of glucose and fructose is similar. Table 2-3 indicates that
these trends are expected based on differences in molecular weight between the sugars. However,
though the molecular weight of the ionic liquids is greater than xylose, their rejection is generally

64
less than xylose. The results highlight the fact that when the molecular weight of the dissolved
solutes is similar (i.e. same order of magnitude), interactions between the solutes and the
membrane will have a significant influence on the observed rejection.31 Since 1.0 wt % PIP gave
the highest sugar rejection the effect of polymerization time was investigated using 1.0 wt % PIP.
Figure 2-2 gives the results for the rejection and permeance of feed streams containing cellobiose,
glucose, EmimOAc and BmimCl in aqueous solution.
Figure 2-2: Variation of permeance and rejection of cellobiose, glucose EmimOAc and BmimCl as a function of polymerization time for modified 50 kDa PES membranes. Modification conditions were: 1.0 and 0.1 wt % PIP and BA respectively in the aqueous phase, reaction temperature 25°C. Insets show AFM surface analysis of selected membranes with roughness 9.4 and 38.6 nm from left to right, respectively. All AFM imaging scale resolution at 0-5 µm. As observed in Table 2-3, rejection for fructose is very similar to glucose and the rejection of
xylose is always the lowest of the sugars tested in this work. We focus on glucose as it is the most

65
abundant sugar in lignocellulosic biomass and of most commercial relevance. When the
polymerization time increases, permeance decreases and rejection increases as is expected due to
a thicker IP layer that is formed. The AFM images indicate that with longer polymerization times
the membrane becomes rougher probably due to uneven rates of polymerization. As indicated by
Mulder the polymerization is strongly affected by diffusion of the reactants through the growing
polymerized barrier layer.32 In addition Karan et al. indicate that heat generated during the
polymerization reaction can lead to local temperature variations that lead to different rates of
reaction and hence increased surface roughness.22 The results suggest that the optimal
polymerization time will depend on a trade-off between higher rejection and lower permeance. As
can be seen for polymerization times less than 5 min the rejection of sugars is low, whereas for
polymerization times greater than 15 min the permeance is low.
Additional experiments with 30 kDa PES membranes indicated that there is little difference in
performance when a base 30 or 50 kDa PES membrane is used. However, due to the tighter pore
structure of the barrier layer of the 30 kDa membrane, it is likely the IP layer formed on top of the
barrier layer of the 30 kDa membrane will be more robust. Consequently, all further experiments
were conducted using 30 kDa PES membranes. In order to minimize the effect of local
temperature variation due to the heat generated during the interfacial polymerization reaction, the
reaction temperature was lowered to -4 °C, and the reaction time was set at 15 min
Surface analysis
In order to verify that BA was being incorporated into the IP layer ATR-FTIR analysis of the
membrane was conducted. Figure 2-3 is an example. Spectra are shown for the base PES
membrane as well as membranes modified for reaction times of 1, 15 and 25 min.

66
Figure 2-3: FTIR spectra for 30 kDa base and modified membranes. Modification conditions were: 1.0 and 0.5 wt % PIP and BA respectively in the aqueous phase, reaction temperature -4 °C, polymerization times of 1, 15 and 25 min. We observe two peaks that stand out from the base membrane in the regions 890–960 cm-1 and
960–995 cm-1. These correspond to the BOH deformation vibration and the BO stretching
vibration, respectively and confirm the incorporation of BA in the barrier layer.33,34 As is expected
the BA peak increases as polymerization time increases.
Table 2-4 gives the effect on rejection and permeance of varying the BA concentration for a PIP
concentration of 1.0 wt % of individual sugars and ILs in aqueous solution. The general trends
are the same as in Table 3; cellobiose rejection is the highest, xylose the lowest while glucose and
fructose rejection is intermediate and similar. It can be seen that lower BA concentrations give
better rejection, peaking at an optimum between 0.1 – 0.2 wt % BA with 97% cellobiose and 78%
BmimCl rejection. Increasing the amount of boronic acid in the aqueous phase can act as a
polymerization termination step due to a variety of reasons. BA has three functional groups, two
diols and an amine group. However only the amine group can take part in the polycondensation

67
Table 2-4: Variation of rejection with BA concentration for modified 30 kDa base PES membranes for aqueous feed streams containing single component sugars and ionic liquids. Modification conditions were: 1.0 wt % PIP in the aqueous phase reaction temperature was -4 °C for a reaction time of 15 min.
[BA], wt % Rejection, %
Cellobiose Glucose Xylose Fructose EmimOAc BmimCl
0.05 92.0 ± 1.8 90.8 ± 0.9 86.7 ± 1.7 90.9 ± 1.0 75.0 ± 4.5 67.2 ± 4.0
0.1 96.4 ± 1.9 94.7 ± 0.9 89.3 ± 1.8 94.7 ± 1.0 74.3 ± 4.5 79.4 ± 4.8
0.2 96.6 ± 1.9 91.5 ± 0.9 80.5 ± 1.6 91.2 ± 0.8 74.0 ± 4.4 77.6 ± 4.7
0.5 89.2 ± 1.8 85.2 ± 0.9 77.9 ± 1.6 84.7 ± 0.7 65.5 ± 3.9 65.7 ± 3.9
1.0 27.1 ± 0.5 26.1 ± 0.3 24.7 ± 0.5 25.8 ± 0.6 28.3 ± 1.7 28.4 ± 1.7
reaction and thus act as a competitive compound with PIP. Having a larger molecular size, BA is
expected to give a looser polymer network and, therefore, produce membranes with a larger
nominal molecular weight cut-off and rougher surfaces. The data in Table 2-4 suggest that BA
concentrations of between 0.1 and 0.2 wt % could be used to tune sugar and ionic liquid rejection.
Figure 2-4 gives the variation of rejection and permeance of cellobiose and BmimCl as a function
of BA concentration. As observed in Table 2-3, Table 2-4, and Figure 2-2 rejection of EmimOAc
and BminCl is often similar. As BmimCl is preferred for pretreatment we focus on BmimCl.

68
Figure 2-4: Variation of permeance and rejection of cellobiose, and BmimCl as a function of BA concentration for modified 30 kDa modified PES membranes. Modification conditions were: 1.0 wt % PIP in the aqueous phase, reaction temperature was -4 °C for a reaction time of 15 min. Insets show AFM surface analysis of membranes modified with 0.1 and 1.0 wt % BA with roughness 31.0 and 46.6 nm from left to right, respectively. All AFM imaging scale resolution at 0-5 µm. Though not shown, as indicated in Table 2-4, glucose rejection is always less than cellobiose. The
AFM images indicate that increasing the BA concentration leads to increased roughness, as
expected. As can be seen, addition of small amounts of BA does not affect the membrane
permeance. However addition of more than 0.5 wt % BA leads to an increase in permeance and
decrease in rejection. This is probably due to the increases in the amount of chain termination due
to reduced crosslink density which results in a more open structure. This result suggests that
addition of small amounts of reactive monomeric species like BA could be used to tune membrane
performance.

69
As indicated in Figure 2-1, the reaction proceeds with the formation of hydrochloric acid as a by-
product, acting as an inhibitor to skin layer formation.21 Thus increasing the pH of the reaction at
higher BA concentration might induce a similar inhibiting effect. Consequently the effect of
adding Et3N to the aqueous phase was investigated. Table 2-5 and Figure 2-5 show the effect of
adding Et3N as a proton acceptor. Indeed, we are able to see similar rejection performance at
threefold shorter polymerization times, while obtaining better permeance. The Et3N concentration
was chosen such that the ratio of BA: Et3N was 1: 1.5. However the polymerization time was
only 5 min.
Table 2-5: Variation of rejection in the presence of Et3N. The Et3N concentration was chosen such that the ratio of BA:Et3N was 1:1.5. Results are for modified 30 kDa base PES membranes for aqueous feed streams containing single component sugars and ionic liquids. Modification conditions were: 1.0 wt % PIP in the aqueous phase reaction temperature was -4 °C for a reaction time of 5 min.
[BA], wt % Rejection, %
Cellobiose Glucose Xylose Fructose EmimOAc BmimCl
0.05 98.5 ± 2.0 96.0 ± 1.0 85.0 ± 1.7 95.5 ± 1.0 81.2 ± 4.9 79.8 ± 4.8
0.1 99.1 ± 2.0 94.8 ± 0.9 83.3 ± 1.7 96.3 ± 1.0 78.3 ± 4.7 72.1 ± 4.3
0.2 82.3 ± 1.6 76.4 ± 0.8 67.2 ± 1.3 76.4 ± 0.8 53.8 ± 3.2 52.4 ± 3.1
0.5 82.0 ± 1.6 71.2 ± 0.7 59.1 ± 1.2 71.2 ± 0.7 34.0 ± 2.0 41.9 ± 2.5
1.0 66.6 ± 1.3 58.6 ± 0.6 50.9 ± 1.0 59.7 ± 0.6 27.1 ± 1.6 25.2 ± 1.5
While our results indicate that increasing polymerization time or BA concentration led to increased
roughness, there is no direct link between the roughness of the polymerized layer and membrane
performance. Karan et al. indicate that the roughness of the polymerized barrier layer can have a
significant effect on permeance for sub 10 nm polyamide nanofilms.22 The films we have grown
here are an order of magnitude or more thicker than 10 nm as suggested by the fact that IR

70
spectroscopy can detect the presence of BA (see Figure 2-3). However it is likely that if much
thinner yet robust films could be polymerized on UF membrane supports, much higher
permeabilities could be obtained with similar rejection properties.
Figure 2-5: Variation of permeance and rejection of cellobiose, and BmimCl as a function of Et3N concentration for unmodified and modified 30 kDa PES membranes. The Et3N concentration was chosen such that the ratio of BA:Et3N was 1:1.5. Modification conditions were: 1.0 wt % PIP in the aqueous phase reaction temperature was -4 °C for a reaction time of 5 min. Based on our results, the modification conditions that maximized cellobiose and glucose rejection,
minimized BmimCl rejection and maximized permeate flux were as follows: aqueous phase, 1.0
wt% PIP, 0.1 wt % BA and 0.115 wt % Et3N, reaction temperature at -4 °C for 8 min. A number
of membranes were modified using these conditions and tested using the mixed feed streams listed
in Table 2-6. As can be seen selectivities varying from 6-37 for BmimCl over glucose were
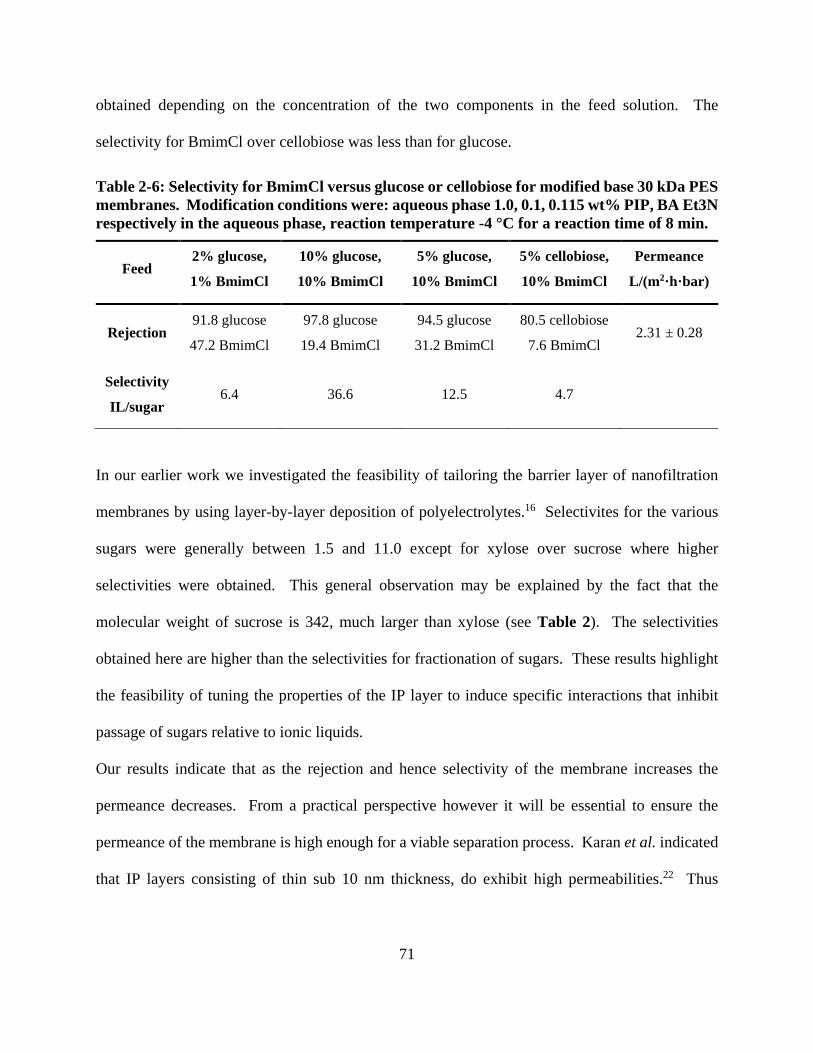
71
obtained depending on the concentration of the two components in the feed solution. The
selectivity for BmimCl over cellobiose was less than for glucose.
Table 2-6: Selectivity for BmimCl versus glucose or cellobiose for modified base 30 kDa PES membranes. Modification conditions were: aqueous phase 1.0, 0.1, 0.115 wt% PIP, BA Et3N respectively in the aqueous phase, reaction temperature -4 °C for a reaction time of 8 min.
Feed 2% glucose,
1% BmimCl
10% glucose,
10% BmimCl
5% glucose,
10% BmimCl
5% cellobiose,
10% BmimCl
Permeance
L/(m2·h·bar)
Rejection 91.8 glucose
47.2 BmimCl
97.8 glucose
19.4 BmimCl
94.5 glucose
31.2 BmimCl
80.5 cellobiose
7.6 BmimCl 2.31 ± 0.28
Selectivity
IL/sugar 6.4 36.6 12.5 4.7
In our earlier work we investigated the feasibility of tailoring the barrier layer of nanofiltration
membranes by using layer-by-layer deposition of polyelectrolytes.16 Selectivites for the various
sugars were generally between 1.5 and 11.0 except for xylose over sucrose where higher
selectivities were obtained. This general observation may be explained by the fact that the
molecular weight of sucrose is 342, much larger than xylose (see Table 2). The selectivities
obtained here are higher than the selectivities for fractionation of sugars. These results highlight
the feasibility of tuning the properties of the IP layer to induce specific interactions that inhibit
passage of sugars relative to ionic liquids.
Our results indicate that as the rejection and hence selectivity of the membrane increases the
permeance decreases. From a practical perspective however it will be essential to ensure the
permeance of the membrane is high enough for a viable separation process. Karan et al. indicated
that IP layers consisting of thin sub 10 nm thickness, do exhibit high permeabilities.22 Thus

72
development of sophisticated polymerization methods to carefully control the thickness and three
dimensional structure of the IP layer will be essential.
The results in Table 2-6 indicate that the concentration of the solute species will affect the
selectivity of specific solutes in real feed streams. Further as indicated by Ables et al. the
maximum concentration of ionic liquid that can be obtained will be limited by the osmotic pressure
differences between the feed and permeate.20 While concentration of the rejected sugars will be
beneficial in the subsequent fermentation step, the toxicity of the ionic liquid to the
microorganisms used during fermentation will dictate the maximum allowable concentration of
residual ionic liquid in the hydrolysate prior to fermentation. It is likely that the feasibility of using
ionic liquids for pretreatment will depend on the development of an economically viable multistep
process for ionic liquid recovery and recycle. Development of novel high performance
nanofiltration membranes could be a part of such a process.
2.4. Conclusion
Nanofiltration could find applications in the conversion of lignocellulosic biomass into chemicals
and fuels. Here the ability of concentrate low molecular weight sugars while recovering dissolved
ionic liquids in the permeate has been explored. Given the advantages of ionic liquids for
pretreatment of biomass as well as their high cost, effective separation process for recovery and
recycle of the ionic liquid will be essential. Given the similarity in molecular weight between
ionic liquids of relevance for pretreatment and low molecular weight sugars such as glucose, sized
based separations alone will be ineffective. However, for nanofiltration membranes, both size and
interactions between solute species and the IP layer determine the selectivity of these membranes.
Our results indicate that careful control of the thickness and structure of the IP layer will be
essential to maximize rejection of sugars, recovery of ionic liquids in the permeate and the

73
permeance of the membrane. In addition to development of appropriate membranes integration of
a nanofiltration step in the entire process must be considered as it will determine the viability of
nanofiltration for ionic liquid recovery.
Acknowledgements
Financial support from the National Science Foundation CBET 1264896 is gratefully
acknowledged.
References
1. Elgharbawy AA, Alam MZ, Moniruzzaman M, Goto M. Ionic liquid pretreatment as emerging approaches for enhanced enzymatic hydrolysis of lignocellulosic biomass. Biochem Eng J. 2016;109:252-267.
2. Shobukawa H, Tokuda H, Susan MAH, Watanabe M. Ion transport properties of lithium ionic liquids and their ion gels. Electrochim Acta. 2005;50(19):3872-3877.
3. Ye CF, Liu WM, Chen YX, Yu LG. Room-temperature ionic liquids: A novel versatile lubricant. Chemical Communications. 2001(21):2244-2245.
4. Gross AS, Bell AT, Chu JW. Entropy of cellulose dissolution in water and in the ionic liquid 1-butyl-3-methylimidazolim chloride. Physical Chemistry Chemical Physics. 2012;14(23):8425-8430.
5. Li C, Zhao ZK. Efficient acid-catalyzed hydrolysis of cellulose in ionic liquid. Advanced Synthesis & Catalysis. 2007;349(11-12):1847-1850.
6. Li C, Wang Q, Zhao ZK. Acid in ionic liquid: An efficient system for hydrolysis of lignocellulose. Green Chem. 2008;10(2):177-182.
7. Raj T, Gaur R, Dixit P, et al. Ionic liquid pretreatment of biomass for sugars production: Driving factors with a plausible mechanism for higher enzymatic digestibility. Carbohydr Polym. 2016;149:369-381.
8. Samayam IP, Hanson BL, Langan P, Schall CA. Ionic-liquid induced changes in cellulose structure associated with enhanced biomass hydrolysis. Biomacromolecules. 2011;12(8):3091-3098.

74
9. Vandenbossche V, Brault J, Vilarem G, et al. A new lignocellulosic biomass deconstruction process combining thermo-mechano chemical action and bio-catalytic enzymatic hydrolysis in a twin-screw extruder. Industrial Crops and Products. 2014;55:258-266.
10. Grzenia DL, Schell DJ, Wickramasinghe SR. Membrane extraction for detoxification of biomass hydrolysates. Bioresour Technol. 2012;111:248-254.
11. Jonsson LJ, Martin C. Pretreatment of lignocellulose: Formation of inhibitory by-products and strategies for minimizing their effects. Bioresour Technol. 2016;199:103-112.
12. Qing Q, Yang B, Wyman CE. Xylooligomers are strong inhibitors of cellulose hydrolysis by enzymes. Bioresour Technol. 2010;101(24):9624-9630.
13. Abels C, Thimm K, Wulfhorst H, Spiess AC, Wessling M. Membrane-based recovery of glucose from enzymatic hydrolysis of ionic liquid pretreated cellulose. Bioresour Technol. 2013;149:58-64.
14. Zavrel M, Bross D, Funke M, Buchs J, Spiess AC. High-throughput screening for ionic liquids dissolving (ligno-)cellulose. Bioresour Technol. 2009;100(9):2580-2587.
15. Tadesse H, Luque R. Advances on biomass pretreatment using ionic liquids: An overview. Energy & Environmental Science. 2011;4(10):3913-3929.
16. Malmali M, Stickel JJ, Wickramasinghe SR. Sugar concentration and detoxification of clarified biomass hydrolysate by nanofiltration. Separation and Purification Technology. 2014;132:655-665.
17. Han S, Wong HT, Livingston AG. Application of organic solvent nanofiltration to separation of ionic liquids and products from ionic liquid mediated reactions. Chemical Engineering Research & Design. 2005;83(A3):309-316.
18. Krockel J, Kragl U. Nanofiltration for the separation of nonvolatile products from solutions containing ionic liquids. Chem Eng Technol. 2003;26(11):1166-1168.
19. Gan Q, Xue ML, Rooney D. A study of fluid properties and microfiltration characteristics of room temperature ionic liquids C-10-min NTf2 and N-8881 NTf2 and their polar solvent mixtures. Separation and Purification Technology. 2006;51(2):185-192.
20. Abels C, Redepenning C, Moll A, Melin T, Wessling M. Simple purification of ionic liquid solvents by nanofiltration in biorefining of lignocellulosic substrates. J Membr Sci. 2012;405:1-10.
21. Morgan P. Condensation polymers: By interfacial and solution methods, (polymer reviews). Interscience Publishers; 1965.

75
22. Karan S, Jiang Z, Livingston AG. Sub-10 nm polyamide nanofilms with ultrafast solvent transport for molecular separation. Science. 2015;348(6241):1347-1351.
23. Lau WJ, Ismail AF, Misdan N, Kassim MA. A recent progress in thin film composite membrane: A review. Desalination. 2012;287:190-199.
24. Ismail AF, Padaki M, Hilal N, Matsuura T, Lau WJ. Thin film composite membrane - recent development and future potential. Desalination. 2015;356:140-148.
25. Lau WJ, Gray S, Matsuura T, Emadzadeh D, Chen JP, Ismail AF. A review on polyamide thin film nanocomposite (TFN) membranes: History, applications, challenges and approaches. Water Res. 2015;80:306-324.
26. Zhao Y, Shantz DF. Phenylboronic acid functionalized SBA-15 for sugar capture. Langmuir. 2011;27(23):14554-14562.
27. Liu L, Zhang Y, Zhang L, et al. Highly specific revelation of rat serum glycopeptidome by boronic acid-functionalized mesoporous silica. Anal Chim Acta. 2012;753:64-72.
28. Mehling T, Zewuhn A, Ingram T, Smirnova I. Recovery of sugars from aqueous solution by micellar enhanced ultrafiltration. Separation and Purification Technology. 2012;96:132-138.
29. Duggan PJ. Fructose-permeable liquid membranes containing boronic acid carriers. Aust J Chem. 2004;57(4):291-299.
30. Miller GL. Use of dinitrosalicylic acid reagent for determination of reducing sugar. Anal Chem. 1959;31(3):426-428.
31. Himstedt HH, Du H, Marshall KM, Wickramasinghe SR, Qian X. pH responsive nanofiltration membranes for sugar separations. Ind Eng Chem Res. 2013;52(26):9259-9269.
32. Mulder J. Basic principles of membrane technology. 2nd ed. Springer; 1996.
33. Faniran JA, Shurvell HF. Infrared spectra of phenylboronic acid (normal and deuterated) and diphenyl phenylboronate. Can.J.Chem. 1968;46(12):2089-&.
34. Moraes IR, Kalbac M, Dmitriev E, Dunsch L. Charging of self-doped poly(anilineboronic acid) films studied by in situ ESR/UV/vis/NIR spectroelectrochemistry and ex situ FTIR spectroscopy. Chemphyschem. 2011;12(16):2920-2924.

76
3. Polyelectrolyte multilayer modified nanofiltration membranes for the recovery of ionic
liquid from dilute aqueous solutions*
* This chapter is based on a submitted manuscript: Alexandru M. Avram, Pejman
Ahmadiannamini, Anh Vu, Xianghong Qian, Arijit Sengupta, S. Ranil Wickramasinghe. Journal
of Applied Polymer Science. Revision 1 was submitted on April.19.2017.
* All experiments were conducted by Mr Alexandru Avram with some assistance from Dr Pejman
Ahmadiannamini. Prof Qian guided the experimental work. Prof Wickramasinghe and Dr
Sengupta helped with analyzing the results and editing the manuscript.
Abstract
The feasibility of nanofiltration membranes fabricated by static polyelectrolyte layer-by-layer
deposition of poly(styrene sulfonate) and poly(allylamine hydrochloride) on poly(ethersulfone)
ultra- and alumina microfiltration membranes for the recovery of ionic liquid from low molecular
weight sugar was investigated. The surface properties of these modified membranes were
correlated with their performances. The selectivity for 1-butyl-3-methylimidazolium chloride over
cellobiose and glucose was found to be as high as 50.5/2.3 for modified alumina and 32.3/3.5 for
modified polyethersulfone with optimized number of bilayers. The values for membrane
permeance were 4.8 and 2.5 L m-1 h2 bar-1, respectively. For low depositions, the separation
mechanism was predominantly governed by size-exclusion. For higher depositions, the enhanced
negative zeta potential of modified membranes suggested preferred dominating electrostatic
interactions, resulting in high selectivity of ionic liquids over low molecular weight sugars. At
very high depositions, the molecular weight cut-off of the membrane becomes constricting for
size-exclusion effect.
3.1. Introduction
Increasing energy consumption for economic and social development coupled with environmental
challenges posed by dwindling fossil-based energy sources have led to extensive activities on the
research of renewable biofuels1,2. In comparison to fossil fuels, biofuels have the advantages of
being renewable, nontoxic, and biodegradable and have a much lower risk of contaminating the
environment3,4. First generation biofuels, produced directly from food corps, are controversial due
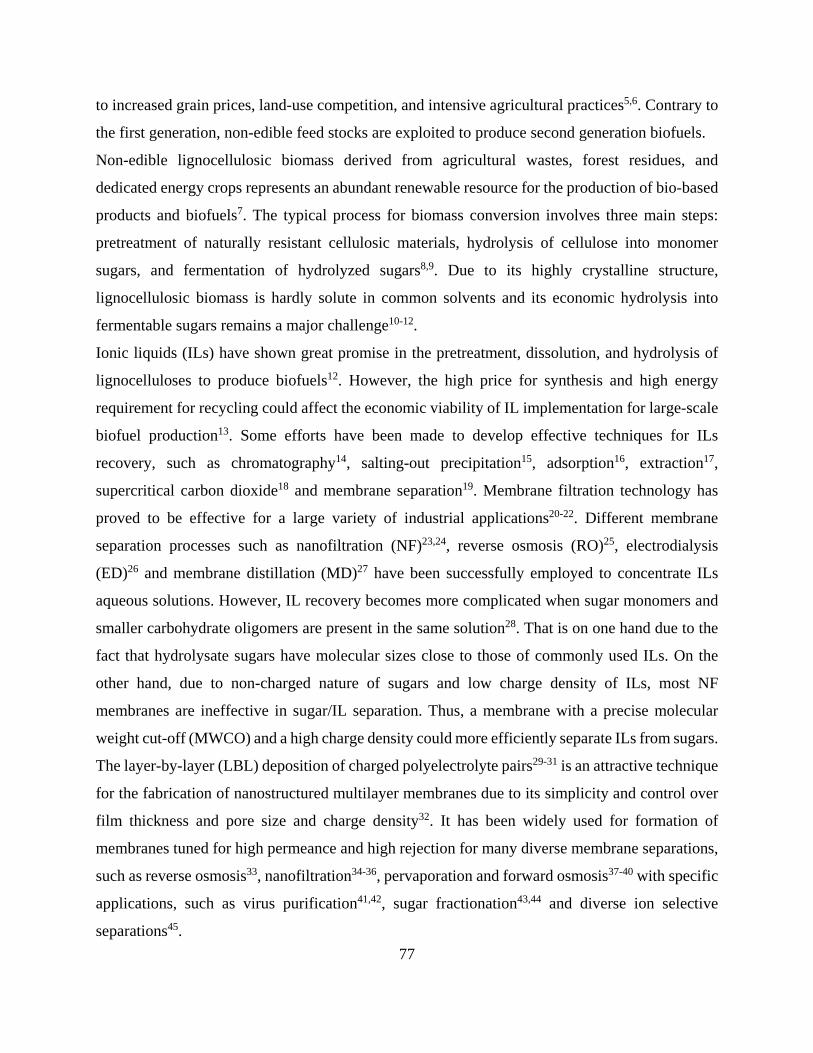
77
to increased grain prices, land-use competition, and intensive agricultural practices5,6. Contrary to
the first generation, non-edible feed stocks are exploited to produce second generation biofuels.
Non-edible lignocellulosic biomass derived from agricultural wastes, forest residues, and
dedicated energy crops represents an abundant renewable resource for the production of bio-based
products and biofuels7. The typical process for biomass conversion involves three main steps:
pretreatment of naturally resistant cellulosic materials, hydrolysis of cellulose into monomer
sugars, and fermentation of hydrolyzed sugars8,9. Due to its highly crystalline structure,
lignocellulosic biomass is hardly solute in common solvents and its economic hydrolysis into
fermentable sugars remains a major challenge10-12.
Ionic liquids (ILs) have shown great promise in the pretreatment, dissolution, and hydrolysis of
lignocelluloses to produce biofuels12. However, the high price for synthesis and high energy
requirement for recycling could affect the economic viability of IL implementation for large-scale
biofuel production13. Some efforts have been made to develop effective techniques for ILs
recovery, such as chromatography14, salting-out precipitation15, adsorption16, extraction17,
supercritical carbon dioxide18 and membrane separation19. Membrane filtration technology has
proved to be effective for a large variety of industrial applications20-22. Different membrane
separation processes such as nanofiltration (NF)23,24, reverse osmosis (RO)25, electrodialysis
(ED)26 and membrane distillation (MD)27 have been successfully employed to concentrate ILs
aqueous solutions. However, IL recovery becomes more complicated when sugar monomers and
smaller carbohydrate oligomers are present in the same solution28. That is on one hand due to the
fact that hydrolysate sugars have molecular sizes close to those of commonly used ILs. On the
other hand, due to non-charged nature of sugars and low charge density of ILs, most NF
membranes are ineffective in sugar/IL separation. Thus, a membrane with a precise molecular
weight cut-off (MWCO) and a high charge density could more efficiently separate ILs from sugars.
The layer-by-layer (LBL) deposition of charged polyelectrolyte pairs29-31 is an attractive technique
for the fabrication of nanostructured multilayer membranes due to its simplicity and control over
film thickness and pore size and charge density32. It has been widely used for formation of
membranes tuned for high permeance and high rejection for many diverse membrane separations,
such as reverse osmosis33, nanofiltration34-36, pervaporation and forward osmosis37-40 with specific
applications, such as virus purification41,42, sugar fractionation43,44 and diverse ion selective
separations45.
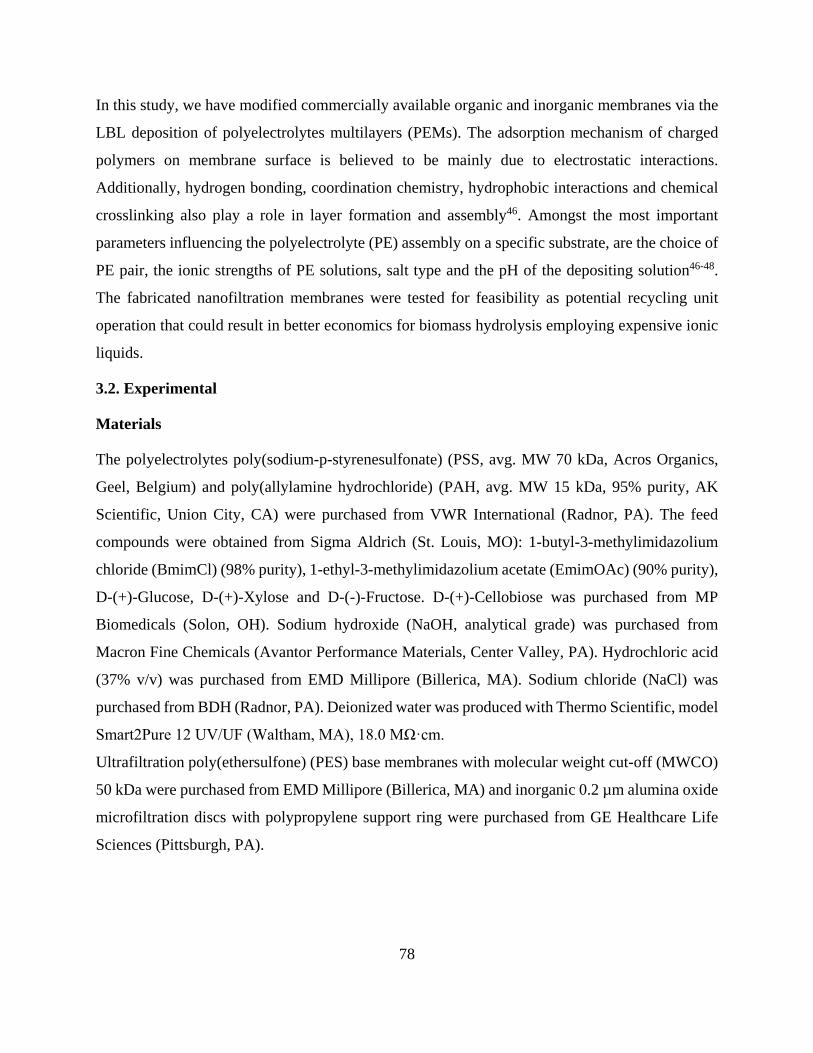
78
In this study, we have modified commercially available organic and inorganic membranes via the
LBL deposition of polyelectrolytes multilayers (PEMs). The adsorption mechanism of charged
polymers on membrane surface is believed to be mainly due to electrostatic interactions.
Additionally, hydrogen bonding, coordination chemistry, hydrophobic interactions and chemical
crosslinking also play a role in layer formation and assembly46. Amongst the most important
parameters influencing the polyelectrolyte (PE) assembly on a specific substrate, are the choice of
PE pair, the ionic strengths of PE solutions, salt type and the pH of the depositing solution46-48.
The fabricated nanofiltration membranes were tested for feasibility as potential recycling unit
operation that could result in better economics for biomass hydrolysis employing expensive ionic
liquids.
3.2. Experimental
Materials
The polyelectrolytes poly(sodium-p-styrenesulfonate) (PSS, avg. MW 70 kDa, Acros Organics,
Geel, Belgium) and poly(allylamine hydrochloride) (PAH, avg. MW 15 kDa, 95% purity, AK
Scientific, Union City, CA) were purchased from VWR International (Radnor, PA). The feed
compounds were obtained from Sigma Aldrich (St. Louis, MO): 1-butyl-3-methylimidazolium
chloride (BmimCl) (98% purity), 1-ethyl-3-methylimidazolium acetate (EmimOAc) (90% purity),
D-(+)-Glucose, D-(+)-Xylose and D-(-)-Fructose. D-(+)-Cellobiose was purchased from MP
Biomedicals (Solon, OH). Sodium hydroxide (NaOH, analytical grade) was purchased from
Macron Fine Chemicals (Avantor Performance Materials, Center Valley, PA). Hydrochloric acid
(37% v/v) was purchased from EMD Millipore (Billerica, MA). Sodium chloride (NaCl) was
purchased from BDH (Radnor, PA). Deionized water was produced with Thermo Scientific, model
Smart2Pure 12 UV/UF (Waltham, MA), 18.0 MΩ·cm.
Ultrafiltration poly(ethersulfone) (PES) base membranes with molecular weight cut-off (MWCO)
50 kDa were purchased from EMD Millipore (Billerica, MA) and inorganic 0.2 µm alumina oxide
microfiltration discs with polypropylene support ring were purchased from GE Healthcare Life
Sciences (Pittsburgh, PA).

79
Static layer-by-layer deposition of PEMs
The PEMs were deposited on a selection of base membranes using the polyelectrolytes pair (20
mM with respect to the monomer) shown in Table 3-1. All PE solutions were 0.5 or 1.0 M NaCl
solutions. For the PE deposition on alumina base membranes the pH was adjusted to 6.5 for PSS
and 3.0 for PAH. The PES base membranes were pretreated with 0.5 M NaOH at 45°C for 30 min
before PE deposition and the pH was not adjusted. The pretreatment of the PES with NaOH was
part of cleaning procedure. Several literatures are available on use of NaOH as cleaning solution
in different kinds of membranes including PES membrane49-52. For both base membranes, the top
layer of PSS was deposited from 1.0 M NaCl.
Table 3-1: Selection of base membranes, type and amount of deposited polyelectrolytes.
Polyelectrolyte Membrane
Name (anion -, cation +) MW,
kDa Selective layer
MWCO
or pore
size
Deposited
bilayers
poly(styrene sulfonate), - 70 alumina oxide 0.2 µm (PSS/PAH)nPSS
poly(allylamine
hydrochloride), + 15 poly(ethersulfone) 50 kDa (PAH/PSS)n
The base membranes were soaked in deionized water for 24 hours to remove preservatives and
wetting additives before PEMs were deposited successively (Figure 3-1).
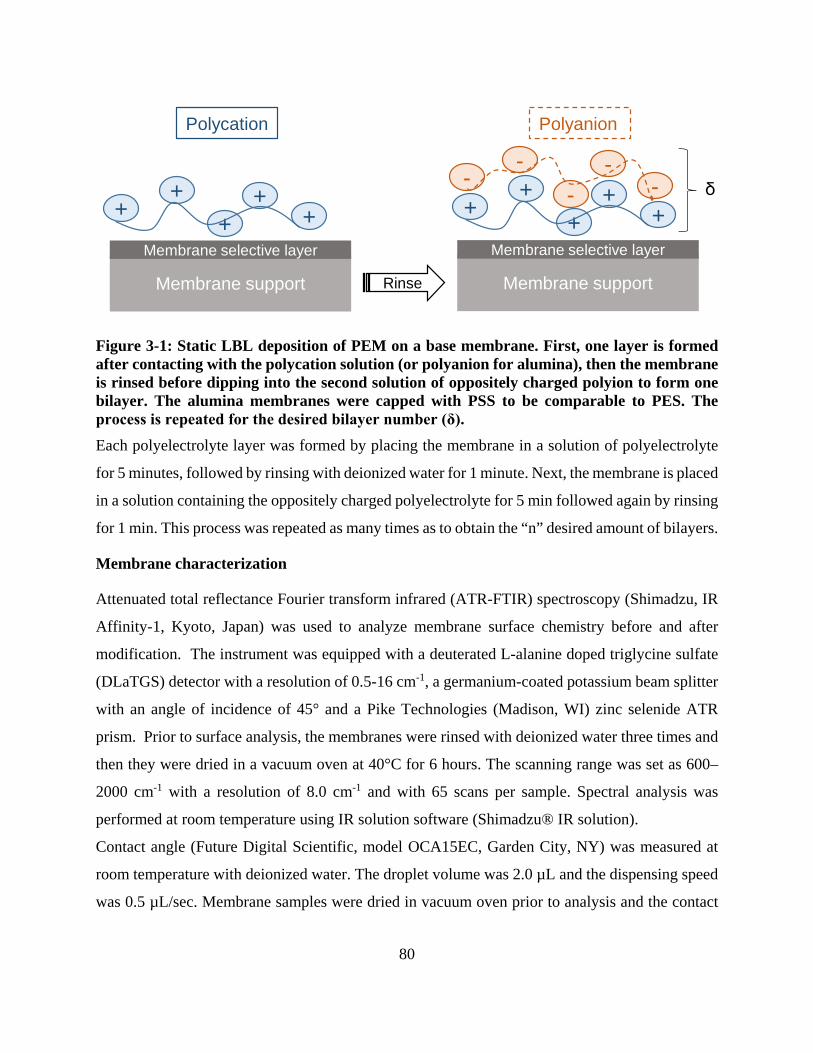
80
Figure 3-1: Static LBL deposition of PEM on a base membrane. First, one layer is formed after contacting with the polycation solution (or polyanion for alumina), then the membrane is rinsed before dipping into the second solution of oppositely charged polyion to form one bilayer. The alumina membranes were capped with PSS to be comparable to PES. The process is repeated for the desired bilayer number (δ). Each polyelectrolyte layer was formed by placing the membrane in a solution of polyelectrolyte
for 5 minutes, followed by rinsing with deionized water for 1 minute. Next, the membrane is placed
in a solution containing the oppositely charged polyelectrolyte for 5 min followed again by rinsing
for 1 min. This process was repeated as many times as to obtain the “n” desired amount of bilayers.
Membrane characterization
Attenuated total reflectance Fourier transform infrared (ATR-FTIR) spectroscopy (Shimadzu, IR
Affinity-1, Kyoto, Japan) was used to analyze membrane surface chemistry before and after
modification. The instrument was equipped with a deuterated L-alanine doped triglycine sulfate
(DLaTGS) detector with a resolution of 0.5-16 cm-1, a germanium-coated potassium beam splitter
with an angle of incidence of 45° and a Pike Technologies (Madison, WI) zinc selenide ATR
prism. Prior to surface analysis, the membranes were rinsed with deionized water three times and
then they were dried in a vacuum oven at 40°C for 6 hours. The scanning range was set as 600–
2000 cm-1 with a resolution of 8.0 cm-1 and with 65 scans per sample. Spectral analysis was
performed at room temperature using IR solution software (Shimadzu® IR solution).
Contact angle (Future Digital Scientific, model OCA15EC, Garden City, NY) was measured at
room temperature with deionized water. The droplet volume was 2.0 µL and the dispensing speed
was 0.5 µL/sec. Membrane samples were dried in vacuum oven prior to analysis and the contact
Membrane support
Membrane selective layer
Membrane support
Membrane selective layer
+-+
++
+
---+
++
++
-
Rinse
Polycation Polyanion
δ

81
angle was captured after 3 seconds from droplet release and then measured using the circle fitting
method. Each measurement was repeated 4 times.
Atomic force microscopy (AFM) was used in order to study the surface topography changes due
to modification. The AFM uses a Bruker ScanAsyst (Camarillo, CA) air silicone tip on a nitride
lever with a spring constant of 0.4 N/m (cantilever details: width = 25 µm, length = 115 µm,
thickness = 650 nm) and is connected to a Dimension icon with ScanAsyst sample chamber
(Bruker, Camarillo, CA). The images were developed at a scanning rate of 1 Hz with a resolution
of 1 µm x 1 µm. Prior to analysis, the membranes were tested for permeance with deionized water
and then air dried before being analyzed in tapping mode. The roughness from AFM data was
calculated according to the following equation:
𝑅𝑅𝑎𝑎 = 1𝑁𝑁∙ ∑ �𝑍𝑍𝑗𝑗�𝑁𝑁
𝑗𝑗=1 (1)
where N is number of points within the box cursor and Z is peak-to-valley difference in height
values. Each roughness value represents the average from 3 different surface locations.
Scanning electron microscopy (SEM) was used to characterize the cross-sectional morphology of
the modified membranes. The images were analyzed using a FEI Nova Nanolab 200 Duo-Beam
Workstation (Hilsboro, OR). Samples of the membranes were soaked in ethanol/water mixtures,
washed with deionized water and then broken in liquid nitrogen (VWR, Batavia, IL). Prior to
analysis, the samples were spotted with 10 nm layer of gold and then scanned using a 15 kV
electron beam.
Zeta potential (Beckman Coulter Delsa NanoHC, Brea, CA) was equipped with a flat surface cell.
Dry samples from the vacuum oven were immersed in the zeta potential analysis solution before
placing them in the flat surface cell. Analysis was performed using a conductive solution of 10
mM NaCl and 1:300 diluted standard solutions for flat surface cell in triplicates.
1.1. Membrane Filtration
The performance of the PEMs was tested using three model feeds: (1) a mixture of four sugars, (2)
EmimOAc and (3) BmimCl. Filtration experiments were conducted in dead-end mode (Figure
S1). A stirred pressure vessel from Sterlitech (HP4750, Kent, WA) was filled with 200 mL feed
and placed on a stirred magnetic plate (Chemglass Optichem, Vineland, NJ). The model feeds

82
comprised of 30 mM each cellobiose, glucose, fructose and xylose, 115 mM EmimOAc or 115
mM BmimCl. Pressurized nitrogen (Airgas, industrial grade, Fayetteville, AR) was used to pump
the feed through the various modified membranes at pressures between 3-17 bar. The permeate
was collected in a beaker placed on a balance (Mettler Toledo PL602-S, Columbus, OH) and the
data was recorded automatically on a computer. Since ionic liquid is used as solvent for hydrolysis
of biomass, the sugar concentration is expected to be low compared to the ionic liquid. Based on
this argument and also from the convenience of quantification, the concentrations of sugar and
ionic liquids were chosen for the present investigation.
Rejection analysis
Prior to sample analysis, the modified PEMs were first equilibrated by filtering deionized water
until the permeance would remain constant. Thereafter, the feed solution was loaded into the
pressure vessel and samples taken from the permeate side. The concentrations of cellobiose,
glucose, xylose and fructose were determined using high performance liquid chromatography
(HPLC) 1200 series (Agilent Technologies, Palo Alto, CA) equipped with a Hi-Plex Ca (Duo)
column (Agilent, 300 x 6.5 mm length x internal diameter, 8 µm pore size), injection volume: 5
µL, mobile phase: deionized water, flow rate: 0.6 mL/minutes, column temperature: 80°C,
refractive index detector detector temperature: 45°C, run time: 30 minutes. The concentrations of
ionic liquid were quantified using a handheld conductivity meter Symphony SP70C (VWR,
Batavia, IL) equipped with a 2-electrode conductivity cell of epoxy/platinum and a nominal cell
constant of 1.0 cm-1 (Thermo Scientific, Beverly, MA). Table 3-2 summarizes the analytical
properties of the different feed compounds.
The rejection of sugars and ionic liquids and the selectivity of the membrane were determined
using the flowing equations:
𝑅𝑅𝑖𝑖 = �1 − 𝑐𝑐𝑖𝑖𝑖𝑖𝑐𝑐𝑖𝑖𝑖𝑖� × 100% (2)
𝑆𝑆𝑖𝑖,𝑗𝑗 = (100 − 𝑅𝑅𝑖𝑖)/�100 − 𝑅𝑅𝑗𝑗� (3)
Where, cip and cif are solute concentration of the ith component in permeate and feed, respectively.
Si,j is the selectivity of ith component over jth component.

83
Membrane water permeance was calculated from:
𝑃𝑃 = 𝑉𝑉/(𝐴𝐴 ∙ 𝛥𝛥𝛥𝛥 ∙ 𝑐𝑐) (4)
where V is the volume of permeated water, Δt is the time of permeation, A is membrane area, and
p is applied pressure.
Table 3-2: Feed compound concentration in the three model feeds and their analytical properties.
Mixed feed
sugars,
30 mM
MW,
g/mol
Retention
time on
HPLC, min
Single feed ILs,
115 mM
MW,
g/mol
Conductivity,
mS/cm
Cellobiose 342.3 6.7 ± 0.01 EmimOAc 170.2 6.93 ± 0.35
Glucose 180.2 8.2 ± 0.01 BmimCl 174.7 9.51 ± 0.67
Xylose 150.1 8.9 ± 0.01
Fructose 180.2 9.6 ± 0.03
3.3. Results and discussions
ATR-FTIR analysis
FTIR data was collected for the base PES membrane and the modified membranes with deposited
bilayers of PAH/PSS. The results are shown in Figure 3-2. Spectral data shows a decrease in the
typical absorption peaks of the PES backbone for 1153 cm-1 (asymmetric vibration of -SO2), 1323
cm-1 (symmetric vibration of -SO2), 1489 cm-1 (aromatic ring stretch of C=C) and 1578 cm-1
(aromatic C-H stretch) as a function of increasing deposited bilayers. The peak at 1011 cm-1
corresponds to the in plane skeleton vibration of benzene ring as suggested by Mahdi et al.53 They
have reported the growth of this peak only on deposition of bilayers of polyelectrolytes which were
having benzene moieties. The conformation of the most stable structure of the base membrane
might lead to the out of plane geometry of the phenyl ring showing no peak at that position for
them. On the contrary, we have observed the same peak even for the base membrane itself,
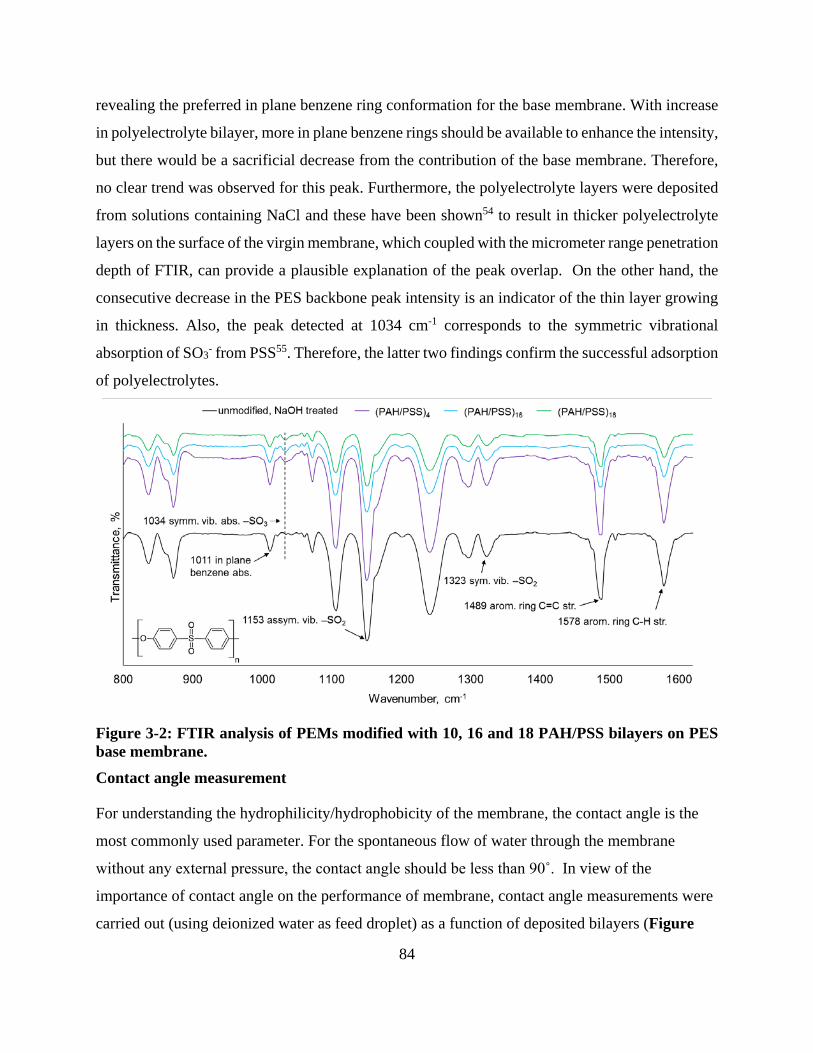
84
revealing the preferred in plane benzene ring conformation for the base membrane. With increase
in polyelectrolyte bilayer, more in plane benzene rings should be available to enhance the intensity,
but there would be a sacrificial decrease from the contribution of the base membrane. Therefore,
no clear trend was observed for this peak. Furthermore, the polyelectrolyte layers were deposited
from solutions containing NaCl and these have been shown54 to result in thicker polyelectrolyte
layers on the surface of the virgin membrane, which coupled with the micrometer range penetration
depth of FTIR, can provide a plausible explanation of the peak overlap. On the other hand, the
consecutive decrease in the PES backbone peak intensity is an indicator of the thin layer growing
in thickness. Also, the peak detected at 1034 cm-1 corresponds to the symmetric vibrational
absorption of SO3- from PSS55. Therefore, the latter two findings confirm the successful adsorption
of polyelectrolytes.
Figure 3-2: FTIR analysis of PEMs modified with 10, 16 and 18 PAH/PSS bilayers on PES base membrane. Contact angle measurement
For understanding the hydrophilicity/hydrophobicity of the membrane, the contact angle is the
most commonly used parameter. For the spontaneous flow of water through the membrane
without any external pressure, the contact angle should be less than 90˚. In view of the
importance of contact angle on the performance of membrane, contact angle measurements were
carried out (using deionized water as feed droplet) as a function of deposited bilayers (Figure
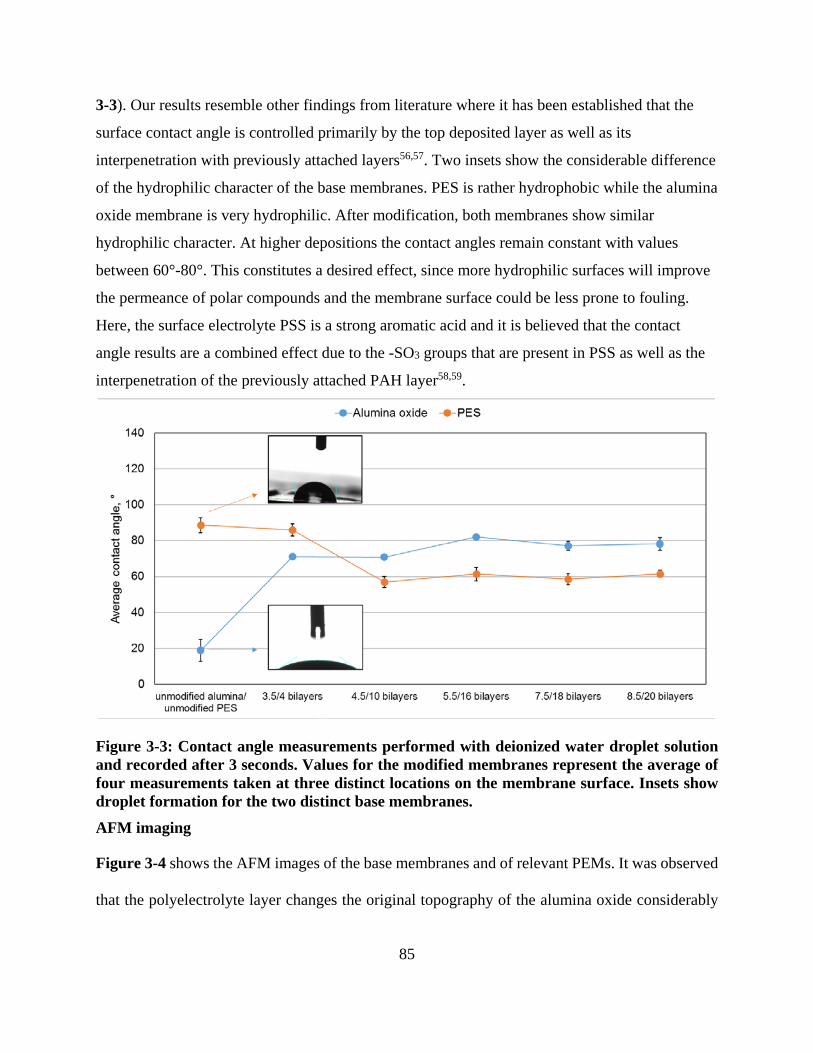
85
3-3). Our results resemble other findings from literature where it has been established that the
surface contact angle is controlled primarily by the top deposited layer as well as its
interpenetration with previously attached layers56,57. Two insets show the considerable difference
of the hydrophilic character of the base membranes. PES is rather hydrophobic while the alumina
oxide membrane is very hydrophilic. After modification, both membranes show similar
hydrophilic character. At higher depositions the contact angles remain constant with values
between 60°-80°. This constitutes a desired effect, since more hydrophilic surfaces will improve
the permeance of polar compounds and the membrane surface could be less prone to fouling.
Here, the surface electrolyte PSS is a strong aromatic acid and it is believed that the contact
angle results are a combined effect due to the -SO3 groups that are present in PSS as well as the
interpenetration of the previously attached PAH layer58,59.
Figure 3-3: Contact angle measurements performed with deionized water droplet solution and recorded after 3 seconds. Values for the modified membranes represent the average of four measurements taken at three distinct locations on the membrane surface. Insets show droplet formation for the two distinct base membranes. AFM imaging
Figure 3-4 shows the AFM images of the base membranes and of relevant PEMs. It was observed
that the polyelectrolyte layer changes the original topography of the alumina oxide considerably
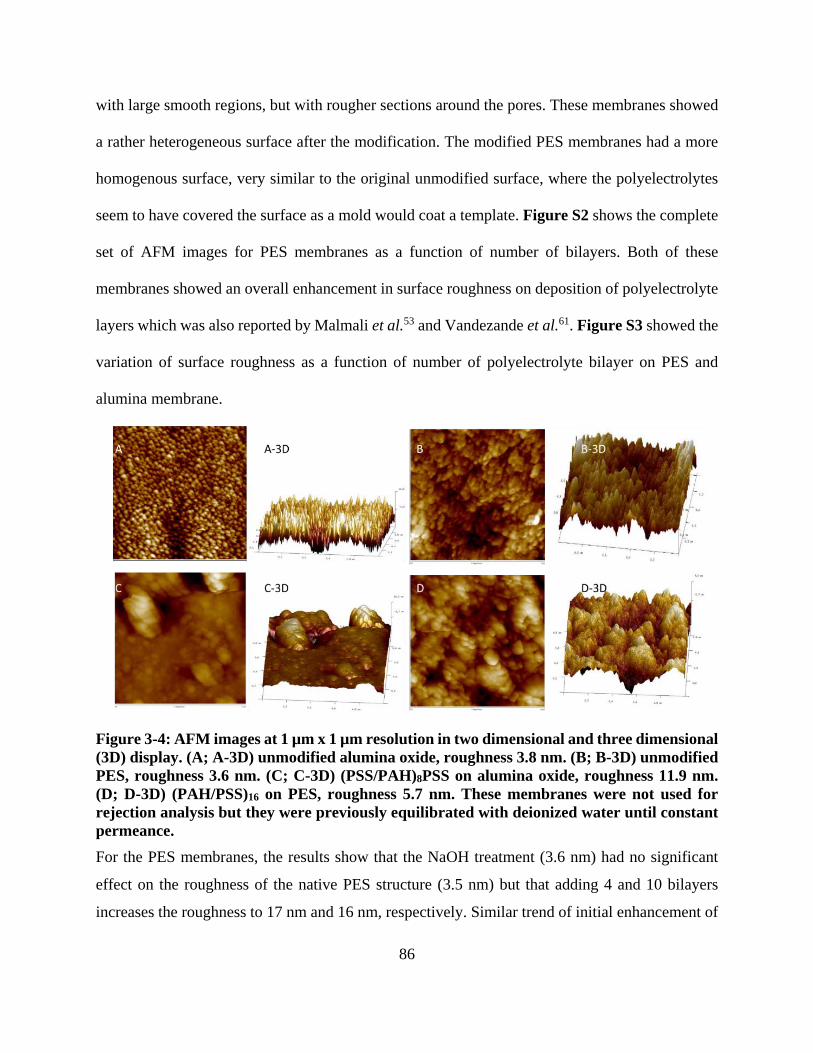
86
with large smooth regions, but with rougher sections around the pores. These membranes showed
a rather heterogeneous surface after the modification. The modified PES membranes had a more
homogenous surface, very similar to the original unmodified surface, where the polyelectrolytes
seem to have covered the surface as a mold would coat a template. Figure S2 shows the complete
set of AFM images for PES membranes as a function of number of bilayers. Both of these
membranes showed an overall enhancement in surface roughness on deposition of polyelectrolyte
layers which was also reported by Malmali et al.53 and Vandezande et al.61. Figure S3 showed the
variation of surface roughness as a function of number of polyelectrolyte bilayer on PES and
alumina membrane.
Figure 3-4: AFM images at 1 µm x 1 µm resolution in two dimensional and three dimensional (3D) display. (A; A-3D) unmodified alumina oxide, roughness 3.8 nm. (B; B-3D) unmodified PES, roughness 3.6 nm. (C; C-3D) (PSS/PAH)8PSS on alumina oxide, roughness 11.9 nm. (D; D-3D) (PAH/PSS)16 on PES, roughness 5.7 nm. These membranes were not used for rejection analysis but they were previously equilibrated with deionized water until constant permeance. For the PES membranes, the results show that the NaOH treatment (3.6 nm) had no significant
effect on the roughness of the native PES structure (3.5 nm) but that adding 4 and 10 bilayers
increases the roughness to 17 nm and 16 nm, respectively. Similar trend of initial enhancement of

87
surface roughness was also reported in the literature on deposition of PSS and
poly(diallyldimethylammonium) chloride (PDADMAC) on 5 and 50 kDa PES membrane
followed by a slight decrease53. This was attributed to the deposition of first layer at the entrance
or inside the membrane pores which led to partial coverage of the membrane surface and then
fulfilled on subsequent deposition of bilayers. When more than 10 bilayers were adsorbed on the
surface, the roughness decreased considerably. This could be an effect of PE chain rearrangement
and collapsing to a more rigid and condensed topography at higher bilayer numbers. A similar
rearrangement has been observed by Yin et al.60 when vibrational forces were applied. This
research group reported a denser and more uniform membrane with smooth surface that led to
better overall performance. Here, it is believed that the pressure applied during permeance tests
prior to AFM analysis induced a similar reassembly and compaction of the PE bilayers.
SEM imaging
SEM images were taken of cross-sections of unmodified and modified alumina oxide and PES
membranes (Figure 3-5). For unmodified alumina oxide, a very symmetric pore distribution can
been seen. The base surface of the modified membrane has been covered in a similar manner as
observed with AFM analysis and it can been seen that large, irregular PEMs have attached by
protruding through the large pores. For unmodified PES, a very asymmetric membrane support
can be observed along with a smooth selective layer. The base surface of the modified membrane
was covered with PEMs as seen from the increase in overall thickness. A clear distinguishing
between morphology of selective layer and of deposited PEMs was complicated, hence also
corroborating the findings with AFM that the polyelectrolytes covered the PES membrane like a
mold.
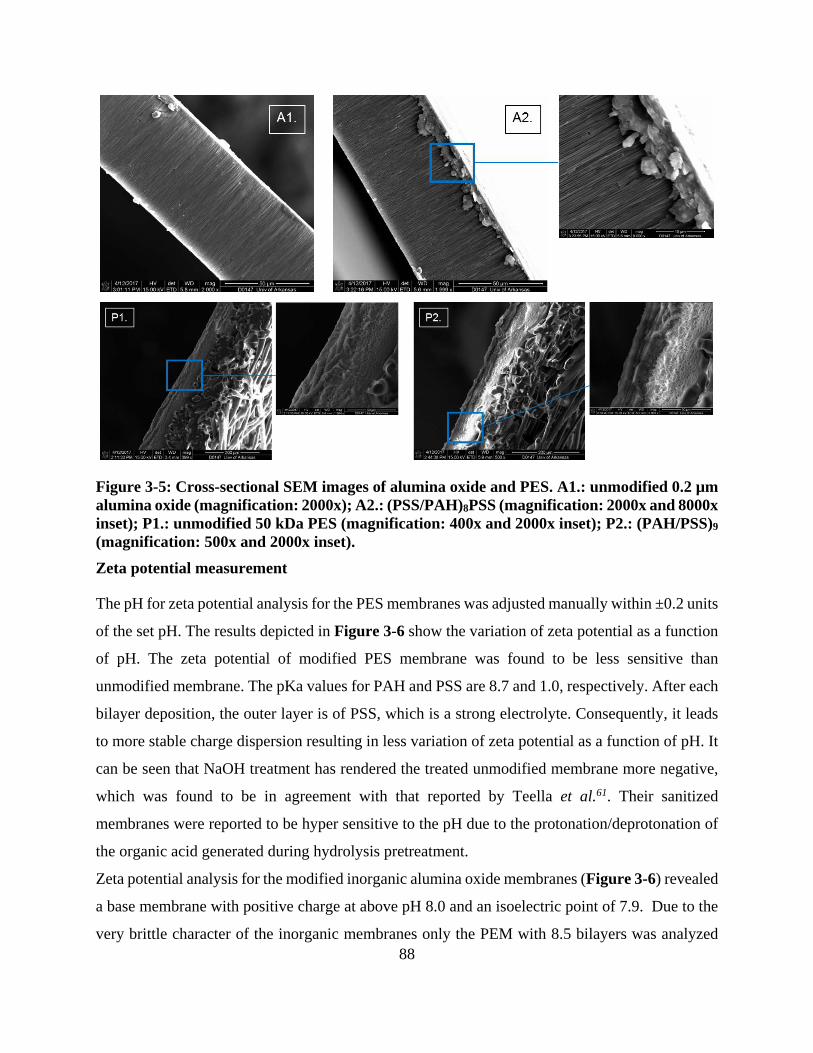
88
Figure 3-5: Cross-sectional SEM images of alumina oxide and PES. A1.: unmodified 0.2 µm alumina oxide (magnification: 2000x); A2.: (PSS/PAH)8PSS (magnification: 2000x and 8000x inset); P1.: unmodified 50 kDa PES (magnification: 400x and 2000x inset); P2.: (PAH/PSS)9 (magnification: 500x and 2000x inset). Zeta potential measurement
The pH for zeta potential analysis for the PES membranes was adjusted manually within ±0.2 units
of the set pH. The results depicted in Figure 3-6 show the variation of zeta potential as a function
of pH. The zeta potential of modified PES membrane was found to be less sensitive than
unmodified membrane. The pKa values for PAH and PSS are 8.7 and 1.0, respectively. After each
bilayer deposition, the outer layer is of PSS, which is a strong electrolyte. Consequently, it leads
to more stable charge dispersion resulting in less variation of zeta potential as a function of pH. It
can be seen that NaOH treatment has rendered the treated unmodified membrane more negative,
which was found to be in agreement with that reported by Teella et al.61. Their sanitized
membranes were reported to be hyper sensitive to the pH due to the protonation/deprotonation of
the organic acid generated during hydrolysis pretreatment.
Zeta potential analysis for the modified inorganic alumina oxide membranes (Figure 3-6) revealed
a base membrane with positive charge at above pH 8.0 and an isoelectric point of 7.9. Due to the
very brittle character of the inorganic membranes only the PEM with 8.5 bilayers was analyzed

89
and the zeta potential was found to be positive above pH 5.0 and negative beyond that. The
isoelectric point was registered at pH 5.8 with a zeta potential between +5 and -5 mV.
Figure 3-6: Zeta potential measurements of unmodified base membranes (black lines) and of the modified PEM membranes (colored lines). Lines connecting data markers are for guidance only. Relative error from 3 repeated measurements was ±5.5%. Rejection and permeance
Figure 3-7 shows the performance of modified alumina oxide base membranes with bilayers of
(PSS/PAH)nPSS that were tested for sugar and ionic liquid rejection. It is very interesting how, at
lower deposited bilayers, the rejection for sugars and ILs is very similar, driven most probably to
a large extent by size-exclusion. Whereas, at above 5.5 bilayers a departure from the previous trend
is noticed and a selectivity becomes evident. It can be seen that, by increasing the bilayer number,
the rejection for all sugar species also increases until it started to plateau around (PSS/PAH)7PSS
with almost complete (>99%) rejection of cellobiose. For the two ionic liquids, a proportional

90
increase in rejection with the increase in bilayer number is also observed until 7.5 bilayers were a
temporary plateau is observed until the rejection increases again at 9.5 bilayers. In this manner,
the deposition of polyelectrolyte layers allowed for identifying of an optimum amount of bilayers
with respect to the selectivity between sugars and ionic liquids. It is believed that, at intermediate
bilayers, the molecular interactions (e.g. electrostatic and hydrophilic) between feed solutes and
modified surface chemistry play a more prevalent role into the rejection process in addition to just
the MWCO.
While increasing the number of PE layers, the thickness of the selective layer also increases
imposing a higher mass transfer resistance and an inherent decrease in membrane permeance. This
translates into decreasing water permeance from about 12 to 4 L m-2 h-1 bar-1 from 3.5 to 9.5
bilayers, respectively.
Figure 3-7: Permeance (bars) and solute rejection (lines with markers) as a function of (PSS/PAH)nPSS bilayer number using alumina oxide disc as base membrane. Lines are there to guide the eye. Relative error for the rejection data was between ±3.2% and ±5.8% from triplicates. PEMs have been previously shown62 to exhibit a response to pH changes through their amphoteric
properties. E.g. permeance and rejection could change as the polyelectrolyte functional groups
change their protonation state63. This could have an impact on the rejection of charged species,
such as the ILs discussed here. As seen in the zeta potential analysis, the only modified

91
nanofiltration membranes that showed a charge conversion of positive to negative were those using
alumina oxide as base membrane. Therefore, the rejection of species for these membranes was
tested at different pH. Data in Table 3-3 was collected with the usual feed solutions at pH 3.0, 5.6
and 8.0 and then sampled at three different time intervals. The rejections in Table 3-3 were stable
despite the different pH values. They also showed excellent stability as a function of time pointing
at a very good membrane robustness. As discussed previously in the zeta potential section, the
polyelectrolyte layers deposited on alumina oxide membranes had a low positive character from
pH 3 – 5 and then a low negative character from pH 6 – 8. This surface charge trait is induced by
the capping layer PSS, which is a strong aromatic polyacid64. The latter is expected to give a more
stable charge dispersion, which could have made the modified membrane charge properties less
susceptible to variation as a function of pH. Data shown in Table 3-3 bolsters this assumption, as
no significant change in rejection properties while changing the pH of the feed could be seen.
Table 3-3: Effect of feed pH and sampling time on compounds rejection with (PSS/PAH)9PSS deposited on 0.2 µm alumina discs.
Time,
min
Rejection, %
Cellobiose Glucose Xylose Fructose EmimOAc BmimCl
pH 3.0
25 99.5 ± 4.5 88.2 ± 4.8 78.5 ± 5.0 87.3 ± 3.9 85.2 ± 2.0 83.5 ± 1.8
50 99.6 ± 4.5 87.9 ± 4.7 77.8 ± 4.9 87.5 ± 3.9 86.0 ± 2.0 85.3 ± 1.8
75 99.5 ± 4.5 87.9 ± 4.7 79.1 ± 5.0 86.8 ± 3.9 89.9 ± 2.1 81.0 ± 1.7
unadjusted pH (~5.6)
25 99.3 ± 4.5 90.3 ± 4.9 80.9 ± 5.1 90.3 ± 4.0 84.7 ± 2.1 87.7 ± 1.8
50 99.4 ± 4.5 89.6 ± 4.8 80.2 ± 5.1 88.7 ± 3.9 84.5 ± 2.0 85.7 ± 1.8
75 99.5 ± 4.5 88.9 ± 4.8 80.9 ± 5.1 87.9 ± 3.9 83.9 ± 2.0 83.9 ±1.8
pH 8.0
25 99.5 ± 4.5 90.9 ± 4.9 81.5 ± 5.2 90.8 ± 4.0 83.7 ± 2.1 86.6 ± 1.8
50 99.5 ± 4.5 90.0 ± 4.9 88.7 ± 5.6 89.5 ± 4.0 82.8 ± 2.0 84.1 ± 1.7
75 99.5 ± 4.5 89.7 ± 4.8 84.3 ± 5.3 88.9 ± 4.0 84.5 ± 2.0 84.9 ± 1.8

92
As seen in Figure 3-8, we could optimize the polyelectrolyte layer deposition on PES membranes
to give almost 99% cellobiose rejection and 58% BmimCl rejection at 16 bilayers. The water
permeance follows a similar decreasing trend as observed with the modified alumina oxide
membranes. It starts at about 8 L m-2 h-1 bar-1 for (PAH/PSS)4 and then levels at around 2 L m-2 h-
1 bar-1 from 14 through 20 bilayers.
It is interesting to see how depositing more bilayers on the PES membranes incurs a plateau in the
IL rejection instead of continuously increasing as seen in Figure 3-7 for the alumina oxide
membranes. This could be explained according to the three-zone model theory in which zone I
(close to substrate) and III (close to film surface) are formed after several are deposited65.
Deposition of more layers is proposed to result in the further growth of bulk zone (also core zone
or zone II) only, thus decreasing membrane permeances but without considerably affecting
rejection65.
Figure 3-8: Permeance (bars) and solute rejection (lines with markers) as a function of (PAH/PSS)n bilayer number using PES as base membrane. Lines are there to guide the eye. Relative error for the rejection data was between ±1.7% and ±5.3% from triplicates.

93
Selectivity of ionic liquid over monomeric sugar
Based on the size exclusion principle, the separation of these sugars and the ionic liquids, e.g.
BmimCl and EmimOAc is challenging as seen from Table 3-2. The deposition-induced modified
surface properties (increase in hydrophilicity, more negative value of zeta potential) were utilized
here to achieve the effective separation of ionic liquid from monomeric sugars based on the latter
property enhancement. There are several important observations that can be concluded from data
in Table 3-4. At 3.5 and 4 bilayers, the modified NF membranes show very low selectivity with
no significant difference between the charged ionic liquid BmimCl and the uncharged sugars
cellobiose and glucose. The rejection at this regime is expected to be mostly due to size-exclusion
due to the insufficient coverage of polyelectrolyte layers as suggested by literature44,53. As more
PE bilayers are deposited, the molecular interactions between solutes and the membrane active
layer increase so that the alumina oxide (PSS/PAH)7PSS already shows a vastly improved
selectivity BmimCl/Cellobiose versus Glucose/Cellobiose. The latter two solute pairs have very
similar molecular weight ratios and this finding serves as proof that rejection at this regime is
governed by additional preferential molecular interactions with the PE selective layer. The charged
deposited polyelectrolytes seem to interact favorably with the charged IL molecule and allow for
its easier passage than e.g. for glucose. Increasing the bilayer number even further starts to decrease
the selectivity towards BmimCl. However, BmimCl/Cellobiose selectivity is still considerably
better than Glucose/Cellobiose, which is believed to be driven by additional favorable interactions
of the BmimCl cation with the increased negative membrane surface, as shown in zeta potential
analysis (Figure 3-6). When adding more bilayers, the selective layer thickness increases and the
solutes are thus forced to pass through tighter pores of more intertwined PE networks. As a result,
the selectivity decreases from 2.3 at (PSS/PAH)8PSS bilayers to 1.2 at (PSS/PAH)9PSS bilayers
in the case of the inorganic PEMs. The same effect is seen with the organic PEMs where the
selectivity also decreases from 3.5 at 16 bilayers to 2.5 at 20 bilayers. Therefore, an optimization
can be achieved and its effect can be described using three rejection regimes that build up with
increasing bilayer number. In all of the identified separation regimes, the primary basis for the
rejection process is still size-exclusion. This can especially be seen for the PES membranes in the
rejection of uncharged sugars. There the rejection followed the trend: Cellobiose > Glucose ~
Fructose > Xylose, according with the molecular weight of the molecule. However, BmimCl and

94
EmimOAc, although larger in molecular size than the smallest sugar (Xylose) always showed
lower rejection. Therefore, it is believed that selectivity of species can be controlled via additional
interactions with the deposited polyelectrolyte layers. E.g. the electrostatic interactions of the
deposited polyelectrolyte layers with the ionic liquid can be utilized as an additional factor to
enhance the selectivity (along with the size exclusion) in the present case.
In the first regime, rejection is governed to a larger extent by size-exclusion, whereas in the second
and third regime the selectivity is to some extent controlled by superficial and stronger molecular
interactions (e.g. electrostatic interactions). The optimum, as given by a BmimCl/Cellobiose
selectivity of 50.5 for (PSS/PAH)7PSS on alumina oxide and 32.3 for (PAH/PSS)16 on PES was
found in the second regime. PEMs fabricated on alumina oxide membranes showed better
permeance due to a lower number of bilayers required to reach similar rejection. It is believed that
during LBL deposition the PEs diffused and deposited inside the pores of these base membranes.
This phenomena has been previously observed by Bruening et al.37 and is reflected in our findings
by a lower amount of bilayers required to reach similar rejection performance when compared to
the PES base membranes, where LBL deposition has presumably occurred mainly on the
membrane surface. Furthermore, SEM analysis showed protrusion of PEMs inside the alumina
oxide pores (Figure 3-5).
Table 3-4: Summary of selected modified nanofiltration membranes with selectivity and permeance.
Base Membrane
Bilayers Permeance, L/(m2·h·bar)
α, MW ratio
BmimCl/ Cellobiose,
1.95
BmimCl/ Glucose,
1.03
Glucose/ Cellobiose,
1.90
Alumina oxide
(0.2 µM)
3.5x 12.08 ± 0.75 1.4 1.1 1.3
7.5x 5.08 ± 0.32 27.1 1.8 14.9
8.5x 4.78 ± 0.30 50.5 2.3 21.6
9.5x 4.11 ± 0.26 29.4 1.2 24.2
PES (50 kDa)
4x 8.22 ± 0.51 1.0 1.0 1.0
16x 2.51 ± 0.16 32.3 3.5 9.3
18x 2.47 ± 0.15 22.1 3.1 7.1
20x 2.34 ± 0.15 22.3 2.5 8.8

95
Anti-fouling property is one of the vital properties for the nanofiltration membrane. Therefore, the
reusability and resistance of the modified membranes were investigated. In Figure S4 it can be
seen that the relative water permeance after dipping the modified membrane in 200 mM BmimCl
and in 1.5 M NaCl for 24 hours showed no detrimental change. Then, in Figure S5 the rejection
of sugars and of ionic liquid was carried out in three consecutive cycles and changes in the relative
rejection was monitored after each cycle. These studies revealed that only insignificant changes in
relative permeance and relative rejection occurred so that the modified membranes (alumina oxide
and PES) are considered to be reusable and resistant for the present application.
Comparative study
The recyclability of ionic liquids via membrane technology and several other methods was
previously critically studied by various groups18,25,66,67. The most prominent limitation of
membrane-driven processes for IL recycling is the osmotic pressure. In order to purify an ionic
liquid to >90% wt. very high operational pressures would be required and these often exceed the
maximum operational pressure for nanofiltration. In Table 3-5 some previous work has been
summarized, while emphasizing some advantages and disadvantages. For example, Haerens et
al.25 achieved very high rejections with a similar process as in the present work, but their main
limitation was the osmotic pressure. Instead of focusing on complete recovery of IL in the
retentate, like many researchers in this areas commonly do, here we have optimized membranes
for purification of ILs in dilute aqueous permeates. E.g. we are taking advantage of the low
molecular weight and charge property of the ILs to facilitate their permeation through fabricated
nanofiltration membranes while retaining as much of the contaminants as possible. In essence, we
are optimizing a pre-recycling step since the ILs will always contain water, which acts as a
transporter solvent. A very promising technique with excellent selectivity for biomass compounds
was developed by Binder et al. 66. Using ion-exchange chromatography, the researchers were able
to recover up to 95% pure IL. However, chromatography suffers from several experimental

96
limitations that could make scale-up unfeasible, especially when considering the complicated
chromatography system and its potential use with high volumes of biomass hydrolysate. With our
system, dilute streams that are mostly free of other contaminants are produced and this opens the
avenue for developing automated systems capable of dealing with high volumes of filtrate,
possibly in continuous mode (e.g. crossflow filtration).
The main aim of Shill et al.17 was to study the ionic liquid pretreatment of cellulose biomass
followed by enzymatic hydrolysis and the recycling of ionic liquid. As mentioned in Table 3-5,
although ~ 95% ionic liquid can be recycled, it is expected to be contaminated with potassium salts
and lignin. No further investigation on the purity of the ionic liquid was reported. While discussing
the challenges for recycling ionic liquids by pressure driven membrane process, Haerens et al.25
reported that the recycled product would be maximum 30% ionic liquid in water. The recycled
ionic liquid was not subjected to any kind of purity check except water content. Based on their
investigation, osmotic pressure is the limiting factor for removal of water from the ionic liquid
fraction. Wu et al.18 in their investigation on the phase behavior of ternary systems composed of
ionic liquid, saccharides and water, found out that their optimized liquid-liquid extraction
technique resulted in highly pure ionic liquid with less than 1% of water content and with no
sugars, which has been confirmed experimentally. The authors also quoted that the recovery of
ionic liquid was not satisfactory (maximum up to 74% depending on the nature of the sugar
molecules). Binder et al.66 optimized an ion-exchange based separation technique for ionic liquid
from sugar with a recovery of more than 95%. Although the further analysis on the purity of the
sugar was not carried out, the ion-exchange chromatographic technique was assumed to produce
purified ionic liquid. The present work investigated the potential of a membrane based separation
to selectively allow for ionic liquid permeance while rejecting as much as possible of typical

97
biomass hydrolysis sugars. This separation strategy has the advantage that the ionic liquid does
not accumulate and concentrate in the retentate, thus circumventing the inherent limitation by high
osmotic pressure, as quoted by Haerens et al.25. The purity of the recycled ionic liquid in this work
depends on the rejection of sugar species and can be evaluated from the selectivity value in Table
3-4. The higher the selectivity, the less sugar impurities would permeate along with the recovered
ionic liquid.
Table 3-5: Comparison of this work with other similar published work on ionic liquid recycling. Comments explain some advantages (+) and disadvantages (-).
IL recycle method
Feed solution Results Comments Reference
Modified polyelectrolyte nanofiltration membranes
Model feeds comprised of 30 mM monosaccharides, 115 mM BmimCl and 115 mM EmimOAc
Clean permeate stream containing mostly IL liquid in water with less than ppm level monosaccharide impurities
(+) circumvents inherent pressure limitation due to osmotic pressure (+) one step produces a permeate stream that contains mostly IL (+) simple to perform and scale-up feasible (-) IL is very diluted and other steps are required to remove large amounts of water
this work
Nanofiltration, reverse osmosis for IL concentration followed by pervaporation for water removal
BmimBF4 (MW 226.0 Da), Bmim2SO4 (MW 236.3 Da) in water with 5% v/v ethylene glycol
82% rejection with Desal DVA 032; 95% rejection with Desal DVA 00; maximum 30% v/v recovery from initial feed
(+) scale-up feasibility (-) rejection limited by osmotic pressure (-) water removal via pervaporation limited by reduced flow due to low water content on feed side
Haerens et al.25
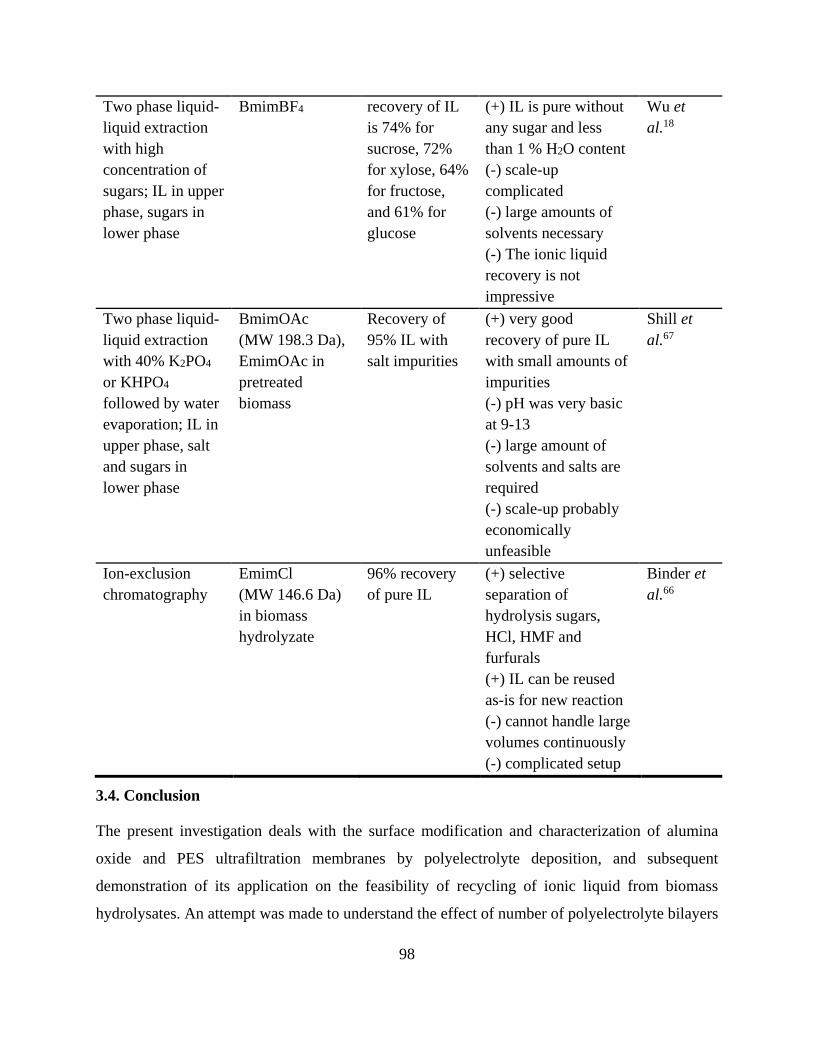
98
3.4. Conclusion
The present investigation deals with the surface modification and characterization of alumina
oxide and PES ultrafiltration membranes by polyelectrolyte deposition, and subsequent
demonstration of its application on the feasibility of recycling of ionic liquid from biomass
hydrolysates. An attempt was made to understand the effect of number of polyelectrolyte bilayers
Two phase liquid-liquid extraction with high concentration of sugars; IL in upper phase, sugars in lower phase
BmimBF4 recovery of IL is 74% for sucrose, 72% for xylose, 64% for fructose, and 61% for glucose
(+) IL is pure without any sugar and less than 1 % H2O content (-) scale-up complicated (-) large amounts of solvents necessary (-) The ionic liquid recovery is not impressive
Wu et al.18
Two phase liquid-liquid extraction with 40% K2PO4 or KHPO4 followed by water evaporation; IL in upper phase, salt and sugars in lower phase
BmimOAc (MW 198.3 Da), EmimOAc in pretreated biomass
Recovery of 95% IL with salt impurities
(+) very good recovery of pure IL with small amounts of impurities (-) pH was very basic at 9-13 (-) large amount of solvents and salts are required (-) scale-up probably economically unfeasible
Shill et al.67
Ion-exclusion chromatography
EmimCl (MW 146.6 Da) in biomass hydrolyzate
96% recovery of pure IL
(+) selective separation of hydrolysis sugars, HCl, HMF and furfurals (+) IL can be reused as-is for new reaction (-) cannot handle large volumes continuously (-) complicated setup
Binder et al.66

99
on the surface properties of the membrane and its consequent membrane performance. AFM
imaging, contact angle measurement and zeta potential analysis were used to analyze the surface
properties and morphology of the modified membranes which were found to be directly linked
with water permeance and selectivity performance. Alumina oxide membranes showed
heterogeneous deposition of PEs with large smooth areas and then rougher areas around the large
microfiltration pores. The former is believed to be beneficial for increased permeance, while the
latter could trigger a mediated transfer of charged species and thus an increase in selectivity for
ionic liquids. An optimized nanofiltration membrane was obtained at (PSS/PAH)8PSS showing
BmimCl/Cellobiose selectivity above 50. Additionally, the fabricated membranes showed
excellent stability in the pH range of 3.0 through 8.0 at extended separation times. PES membranes
showed a more homogenous deposition of PEs that seem to mimic the original structure of the
base membranes. Coupled with increased negative charge as a function of deposited bilayers this
allowed for better transfer of the charged species while retaining the non-charged species on size-
exclusion basis. An optimized nanofiltration membrane was obtained at (PAH/PSS)16 showing
BmimCl/Cellobiose selectivity above 30.
Acknowledgements
Financial support from the National Science Foundation CBET 1264896 is gratefully
acknowledged.
The authors greatly appreciate the use of the Arkansas Materials Characterization Facility for the
SEM studies.
References
1. Verardi A, De Bari I, Ricca E, Calabrò V. Hydrolysis of lignocellulosic biomass: Current status of processes and technologies and future perspectives. In: Pinheiro-Lima MA, Policastro-Natalense AP, eds. Bioethanol. InTech; 2012:95.
2. Abels C, Carstensen F, Wessling M. Membrane processes in biorefinery applications. J Membr Sci. 2013;444:285-317.
3. Wang W, Turner TL, Stikeleather LF, Roberts WL. Exploration of process parameters for continuous hydrolysis of canola oil, camelina oil and algal oil. Chemical Engineering and Processing: Process Intensification. 2012;57–58:51-58.
4. Fairley P. Introduction: Next generation biofuels. . 2011:S2.
100
5. Malmali M, Stickel J, Wickramasinghe SR. Investigation of a submerged membrane reactor for continuous biomass hydrolysis. Food Bioprod Process. 2015;96:189-197.
6. Brennan TCR, Datta S, Blanch HW, Simmons BA, Holmes BM. Recovery of sugars from ionic liquid biomass liquor by solvent extraction. BioEnergy Res. 2010;3(2):123-133.
7. Lozano P, Bernal B, Jara AG, Belleville M. Enzymatic membrane reactor for full saccharification of ionic liquid-pretreated microcrystalline cellulose. Bioresour Technol. 2014;151:159-165.
8. Zhu S. Use of ionic liquids for the efficient utilization of lignocellulosic materials. J Chem Technol Biotechnol. 2008;83(6):777-779.
9. Rinaldi R, Palkovits R, Schueth F. Depolymerization of cellulose using solid catalysts in ionic liquids. Angew Chem -Int Edit. 2008;47(42):8047-8050.
10. Maki-Arvela P, Anugwom I, Virtanen P, Sjoholm R, Mikkola JP. Dissolution of lignocellulosic materials and its constituents using ionic liquids-A review. Ind Crop Prod. 2010;32(3):175-201.
11. Bokinsky G, Peralta-Yahya PP, George A, et al. Synthesis of three advanced biofuels from ionic liquid-pretreated switchgrass using engineered escherichia coli. Proc Natl Acad Sci U S A. 2011;108(50):19949-19954.
12. Liu C, Wang F, Stiles AR, Guo C. Ionic liquids for biofuel production: Opportunities and challenges. Appl Energy. 2012;92:406-414.
13. Baral NR, Shah A. Techno-economic analysis of cellulose dissolving ionic liquid pretreatment of lignocellulosic biomass for fermentable sugars production. Biofuels Bioprod Biorefining. 2016;10(1):70-88.
14. Feng D, Li L, Yang F, et al. Separation of ionic liquid [mmim][DMP] and glucose from enzymatic hydrolysis mixture of cellulose using alumina column chromatography. Appl Microbiol Biotechnol. 2011;91(2):399-405.
15. Carneiro AP, Rodríguez O, Macedo EA. Separation of carbohydrates and sugar alcohols from ionic liquids using antisolvents. Separation and Purification Technology. 2014;132:496-504.
16. Francisco M, Mlinar AN, Yoo B, Bell AT, Prausnitz JM. Recovery of glucose from an aqueous ionic liquid by adsorption onto a zeolite-based solid. Chem Eng J. 2011;172(1):184-190.
17. Shill K, Padmanabhan S, Xin Q, Prausnitz JM, Clark DS, Blanch HW. Ionic liquid pretreatment of cellulosic biomass: Enzymatic hydrolysis and ionic liquid recycle. Biotechnol Bioeng. 2011;108(3):511-520.

101
18. Wu B, Liu W, Zhang Y, Wang H. Do we understand the recyclability of ionic liquids? Chemistry – A European Journal. 2009;15(8):1804-1810.
19. Mai NL, Ahn K, Koo Y. Methods for recovery of ionic liquids—A review. Process Biochemistry. 2014;49(5):872-881.
20. Malmali M, Wickramasinghe SR, Tang J, Cong H. Sugar fractionation using surface-modified nanofiltration membranes. Separation and Purification Technology. 2016;166:187-195.
21. He Y, Bagley DM, Leung KT, Liss SN, Liao B. Recent advances in membrane technologies for biorefining and bioenergy production. Biotechnol Adv. 2012;30(4):817-858.
22. Weschenfelder SE, Fonseca MJC, Borges CP, Campos JC. Application of ceramic membranes for water management in offshore oil production platforms: Process design and economics. Separation and Purification Technology. 2016;171:214-220.
23. Abels C, Redepenning C, Moll A, Melin T, Wessling M. Simple purification of ionic liquid solvents by nanofiltration in biorefining of lignocellulosic substrates. J Membr Sci. 2012;405:1-10.
24. Hazarika S, Dutta NN, Rao PG. Dissolution of lignocellulose in ionic liquids and its recovery by nanofiltration membrane. Separation and Purification Technology. 2012;97:123-129.
25. Haerens K, Van Deuren S, Matthijs E, Van der Bruggen B. Challenges for recycling ionic liquids by using pressure driven membrane processes. Green Chem. 2010;12(12):2182-2188.
26. Trinh LTP, Lee YJ, Lee J, Bae H, Lee H. Recovery of an ionic liquid [BMIM]cl from a hydrolysate of lignocellulosic biomass using electrodialysis. Separation and Purification Technology. 2013;120:86-91.
27. Wu H, Shen F, Wang J, et al. Separation and concentration of ionic liquid aqueous solution by vacuum membrane distillation. J Membr Sci. 2016;518:216-228.
28. Abels C, Thimm K, Wulfhorst H, Spiess AC, Wessling M. Membrane-based recovery of glucose from enzymatic hydrolysis of ionic liquid pretreated cellulose. Bioresour Technol. 2013;149:58-64.
29. Decher G. Fuzzy nanoassemblies: Toward layered polymeric multicomposites. Science. 1997;277(5330):1232-1237.
30. Decher G, Hong JD, Schmitt J. Buildup of ultrathin multilayer films by a self-assembly process .3. consecutively alternating adsorption of anionic and cationic polyelectrolytes on charged surfaces. Thin Solid Films. 1992;210(1-2):831-835.
31. Iler RK. Multilayers of colloidal particles. J Colloid Interface Sci. 1966;21(6):569-&.

102
32. Castleberry SA, Li W, Deng D, Mayner S, Hammond PT. Capillary flow layer-by-layer: A microfluidic platform for the high-throughput assembly and screening of nano layered film libraries. ACS Nano. 2014;8(7):6580-6589.
33. Ishigami T, Amano K, Fujii A, et al. Fouling reduction of reverse osmosis membrane by surface modification via layer-by-layer assembly. Separation and Purification Technology. 2012;99:1-7.
34. Ahmadiannamini P, Li X, Goyens W, Joseph N, Meesschaert B, Vankelecom IFJ. Multilayered polyelectrolyte complex based solvent resistant nanofiltration membranes prepared from weak polyacids. J Membr Sci. 2012;394:98-106.
35. Li X, Goyens W, Ahmadiannamini P, Vanderlinden W, De Feyter S, Vankelecom I. Morphology and performance of solvent-resistant nanofiltration membranes based on multilayered polyelectrolytes: Study of preparation conditions. J Membr Sci. 2010;358(1-2):150-157.
36. Ahmadiannamini P, Li X, Goyens W, Meesschaert B, Vankelecom IFJ. Multilayered PEC nanofiltration membranes based on SPEEK/PDDA for anion separation. J Membr Sci. 2010;360(1-2):250-258.
37. Harris JJ, Stair JL, Bruening ML. Layered polyelectrolyte films as selective, ultrathin barriers for anion transport. Chemistry of Materials. 2000;12(7):1941-1946.
38. Abdu S, Marti-Caatayud M, Wong JE, Garcia-Gabaldon M, Wessling M. Layer-by-layer modification of cation exchange membranes controls ion selectivity and water splitting. Acs Applied Materials & Interfaces. 2014;6(3):1843-1854.
39. Lu O, Malaisamy R, Bruening ML. Multilayer polyelectrolyte films as nanofiltration membranes for separating monovalent and divalent cations. J Membr Sci. 2008;310(1-2):76-84.
40. Seong Uk H, Lu O, Bruening ML. Recovery of phosphate using multilayer polyelectrolyte nanofiltration membranes. J Membr Sci. 2009;327(1-2):2-5.
41. Shi H, Xagoraraki I, Parent KN, Bruening ML, Tarabara VV. Elution is a critical step for recovering human adenovirus 40 from tap water and surface water by cross-flow ultrafiltration. Appl Environ Microbiol. 2016;82(16):4982-4993.
42. Pasco EV, Shi H, Xagoraraki I, et al. Polyelectrolyte multilayers as anti-adhesive membrane coatings for virus concentration and recovery. J Membr Sci. 2014;469:140-150.
43. Malmali M, Wickramasinghe SR, Tang J, Cong H. Sugar fractionation using surface-modified nanofiltration membranes. Separation and Purification Technology. 2016;166:187-195.
103
44. Malaisamy R, Bruening M. High-flux nanofiltration membranes prepared by adsorption of multilayer polyelectrolyte membranes on polymeric supports. Langmuir. 2005;21(23):10587-10592.
45. Stanton B, Harris J, Miller M, Bruening M. Ultrathin, multilayered polyelectrolyte films as nanofiltration membranes. Langmuir. 2003;19(17):7038-7042.
46. Dubas ST, Schlenoff JB. Factors controlling the growth of polyelectrolyte multilayers. Macromolecules. 1999;32(24):8153-8160.
47. Joseph N, Ahmadiannamini P, Hoogenboom R, Vankelecom IFJ. Layer-by-layer preparation of polyelectrolyte multilayer membranes for separation. Polymer Chemistry. 2014;5(6):1817-1831.
48. Miller MD, Bruening ML. Controlling the nanofiltration properties of multilayer polyelectrolyte membranes through variation of film composition. Langmuir. 2004;20(26):11545-11551.
49. Ang WS, Yip NY, Tiraferri A, Elimelech M. Chemical cleaning of RO membranes fouled by wastewater effluent: Achieving higher efficiency with dual-step cleaning. J Membr Sci. 2011;382(1–2):100-106.
50. Vaisanen P, Bird M, Nystrom M. Treatment of UF membranes with simple and formulated cleaning agents. Food Bioprod Process. 2002;80(C2):98-108.
51. Mohammadi T, Madaeni S, Moghadam M. Investigation of membrane fouling. Desalination. 2003;153(1-3):155-160.
52. Mohammadi T. Chemical cleaning of a polyamide membrane. Desalination. 2001;139(1-3):381-381.
53. Malmali M, Wickramasinghe SR, Tang J, Cong H. Sugar fractionation using surface-modified nanofiltration membranes. Separation and Purification Technology. 2016;166:187-195.
54. Li X, Goyens W, Ahmadiannamini P, Vanderlinden W, De Feyter S, Vankelecom I. Morphology and performance of solvent-resistant nanofiltration membranes based on multilayered polyelectrolytes: Study of preparation conditions. J Membr Sci. 2010;358(1-2):150-157.
55. SU B, Wang T, Wang Z, Gao X, Gao C. Preparation and performance of dynamic layer-by-layer PDADMAC/PSS nanofiltration membrane. J Membr Sci. 2012;423–424:324-331.
56. Shiratori S, Rubner M. pH-dependent thickness behavior of sequentially adsorbed layers of weak polyelectrolytes. Macromolecules. 2000;33(11):4213-4219.

104
57. Yoo D, Shiratori S, Rubner M. Controlling bilayer composition and surface wettability of sequentially adsorbed multilayers of weak polyelectrolytes. Macromolecules. 1998;31(13):4309-4318.
58. Ishigami T, Amano K, Fujii A, et al. Fouling reduction of reverse osmosis membrane by surface modification via layer-by-layer assembly. Separation and Purification Technology. 2012;99:1-7.
59. Elzbieciak M, Kolasinska M, Warszynski P. Characteristics of polyelectrolyte multilayers: The effect of polyion charge on thickness and wetting properties. Colloid Surf A-Physicochem Eng Asp. 2008;321(1-3):258-261.
60. Yin M, Qian J, An Q, Zhao Q, Gui Z, Li J. Polyelectrolyte layer-by-layer self-assembly at vibration condition and the pervaporation performance of assembly multilayer films in dehydration of isopropanol. J Membr Sci. 2010;358(1–2):43-50.
61. Teella A, Zydney AL, Zhou H, Olsen C, Robinson C. Effects of chemical sanitization using NaOH on the properties of polysulfone and polyethersulfone ultrafiltration membranes. Biotechnol Prog. 2015;31(1):90-96.
62. Seong Uk H, Lu O, Bruening ML. Recovery of phosphate using multilayer polyelectrolyte nanofiltration membranes. J Membr Sci. 2009;327(1-2):2-5.
63. Cranford SW, Ortiz C, Buehler MJ. Mechanomutable properties of a PAA/PAH polyelectrolyte complex: Rate dependence and ionization effects on tunable adhesion strength. Soft Matter. 2010;6(17):4175-4188.
64. Dubas ST, Schlenoff JB. Factors controlling the growth of polyelectrolyte multilayers. Macromolecules. 1999;32(24):8153-8160.
65. Ladam G, Schaad P, Voegel JC, Schaaf P, Decher G, Cuisinier F. In situ determination of the structural properties of initially deposited polyelectrolyte multilayers. Langmuir. 2000;16(3):1249-1255.
66. Binder JB, Raines RT. Fermentable sugars by chemical hydrolysis of biomass. Proc Natl Acad Sci U S A. 2010;107(10):4516-4521.
67. Shill K, Padmanabhan S, Xin Q, Prausnitz JM, Clark DS, Blanch HW. Ionic liquid pretreatment of cellulosic biomass: Enzymatic hydrolysis and ionic liquid recycle. Biotechnol Bioeng. 2011;108(3):511-520.

105
Supporting information
Figure S1: Dead-end filtration setup for measuring of permeance and rejection of modified membranes.
P
Pressure supply
Feed Vessel
Stirrer plate Balance
Permeate Vessel
Data acquisition
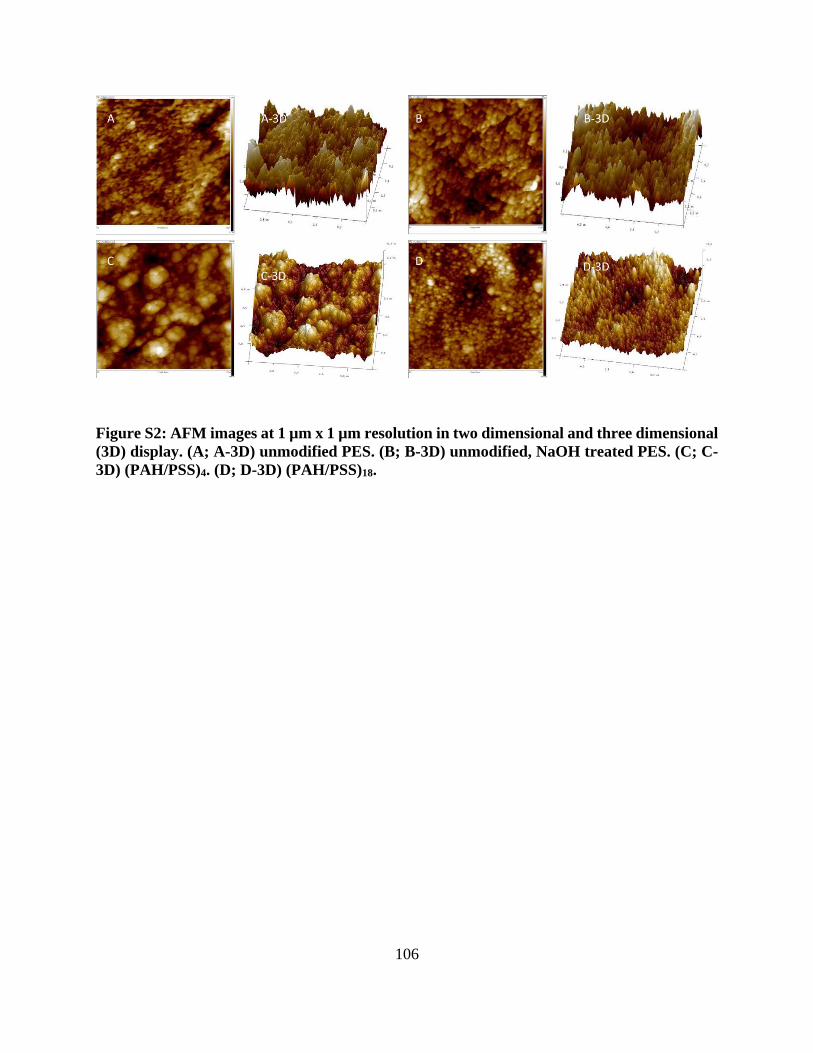
106
Figure S2: AFM images at 1 µm x 1 µm resolution in two dimensional and three dimensional (3D) display. (A; A-3D) unmodified PES. (B; B-3D) unmodified, NaOH treated PES. (C; C-3D) (PAH/PSS)4. (D; D-3D) (PAH/PSS)18.
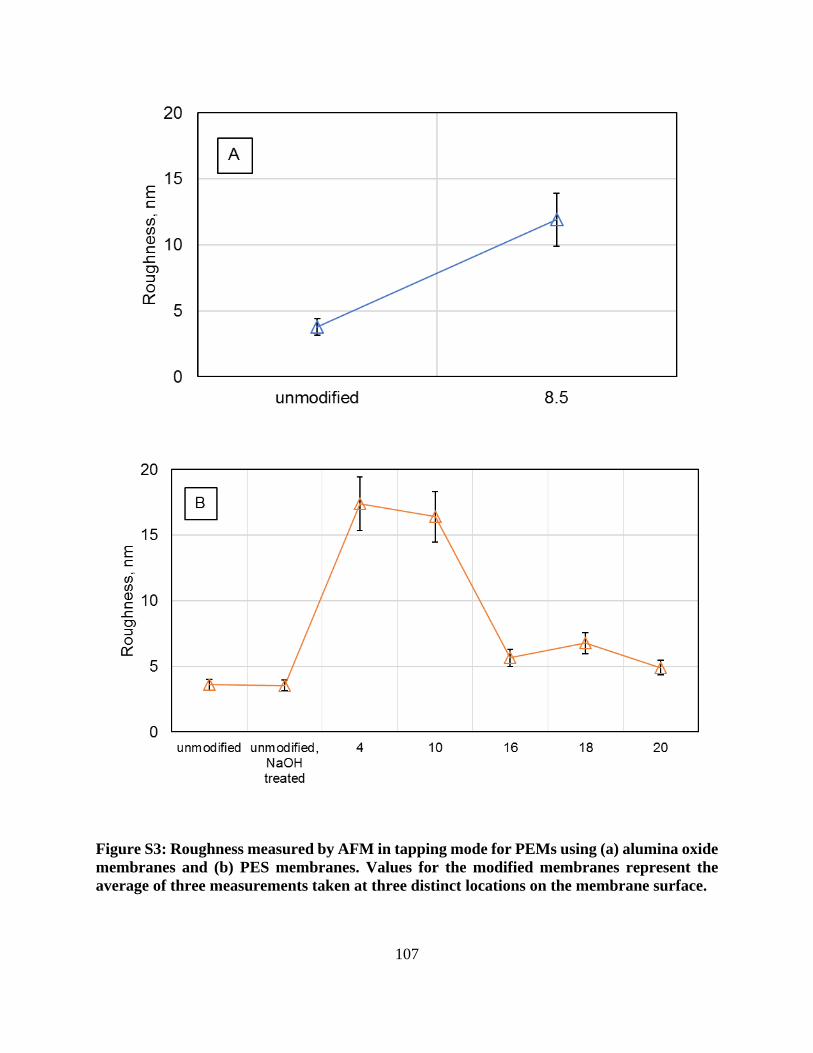
107
Figure S3: Roughness measured by AFM in tapping mode for PEMs using (a) alumina oxide membranes and (b) PES membranes. Values for the modified membranes represent the average of three measurements taken at three distinct locations on the membrane surface.

108

109
Figure S4: The changes of permeance of the modified alumina (A1-2) and PES membranes (P1-2) in presence of concentrated ionic liquid and NaCl.
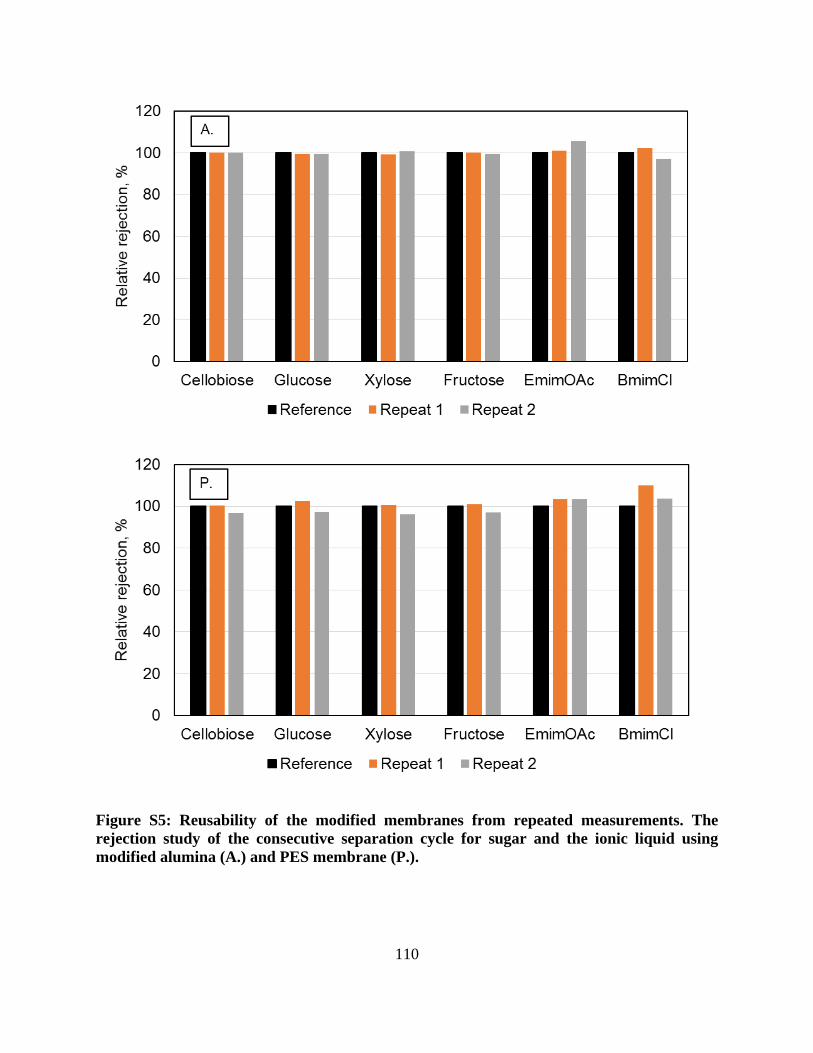
110
Figure S5: Reusability of the modified membranes from repeated measurements. The rejection study of the consecutive separation cycle for sugar and the ionic liquid using modified alumina (A.) and PES membrane (P.).

111
4. Concentration of polyphenols from blueberry pomace extract using nanofiltration*
* This chapter is based on a submitted manuscript: Alexandru M. Avram, Pauline Morin, Cindi
Brownmiller, Arijit Sengupta, Luke R. Howard, S. Ranil Wickramasinghe. Food and Bioproducts
Processing. Manuscript was submitted to journal on April.30.2017.
* All experiments were conducted by Mr Alexandru Avram with some assistance from Ms Pauline
Morin. Ms Cindi Brownmiller helped prepare feed streams for membrane testing and conducted
HPLC analysis. Profs Wickramasinghe and Howard guided the experimental work. Together with
Dr Sengupta, they helped with analyzing the results and editing the manuscript.
Abstract
Polyphenols extracted from blueberry (Vaccinium corymbosum) pomace were concentrated using
nanofiltration. Crossflow filtration was shown to be a feasible method for concentrating the
polyphenols present in dilute aqueous solutions. High-performance liquid chromatography was
employed for the determination of total anthocyanins, total flavonols and chlorogenic acid in the
hot water extract. Both nanofiltration membranes (NF245 and NF270) showed complete rejection
of phenolic compounds at good permeances, whereas crossflow mode of filtration was found to
reduce membrane fouling considerably. Furthermore, a suitable protocol was developed for clean-
in-place of the used membranes. After repeated filtrations followed by the cleaning protocol, the
rejection performance was preserved unaltered and the relative permeance was recovered up to
73% for NF245 membrane and more than 99% for NF270 membrane.
4.1. Introduction
Blueberries (Vaccinium corymbosum L.) contain large amounts of polyphenols 1. It has been
suggested that consumption of blueberries can help suppress inflammation 2,3, display anti-cancer
properties 4, improve human gut microbiome 5, reduce the risk of coronary heart disease 6,7 and

112
scavenge oxidative radicals 8. Most of these benefits are attributed to the high content of
monomeric and polymeric anthocyanins, a class of polyphenols. These belong to a wide variety of
arabinosides, galactosides and glucosides of cyanidin, delphinidin, malvidin, peonidin and
petunidin 9 possessing orange-red, purple and blue plant pigments that have significant importance
in the food industry as they determine color, taste and health benefits of marketed products.
For commercial purposes, an ample amount of the blueberries is processed either into juice or juice
concentrate and then the remaining solid residue (pomace) is generally treated as a waste product.
The skins of blueberry fruits contain most of anthocyanins by weight 10 so that, depending on the
complexity of the juice extraction method, the pomace is left with a substantial amount of valuable
polyphenolics. Therefore, there is an incentive to further process the blueberry pomace and extract
those remaining polyphenolics for applications as natural colorants, encapsulated supplements or
added nutraceuticals 11,12.
Most of the pomace extraction methods lead to dilute aqueous juice fractions and processing them
into concentrates facilitates storage and transportation. Particularly, volume reduction and
separation techniques are highly employed to produce juice concentrates and fractionate the dilute
extracts. Multiple techniques have been developed aiming at the production of stable, nutrient-rich
concentrated streams 13. Freeze concentration (cryoconcentration) 14, osmotic distillation 15,
membrane filtration 16-18 and other multi-stage evaporation techniques are commonly reported in
the literature 15,19,20. Anthocyanins are labile compounds that have been shown to easily degrade
and lose biological activity under severe processing parameters such as high temperatures, UV
radiation and cross reaction with other processing chemicals 21. Therefore, a careful consideration
has to be given to the choice of processing techniques which should not only be economically
feasible but also limit the deactivation and loss of the bioactive compounds.
113
Membrane technology could be a promising technology for recovery of these fragile biologically
active compounds. Here, we focus on nanofiltration, a pressure-driven membrane process. There
has been a growing interest in pressure-driven membrane unit operations for concentration of
polyphenols from dilute aqueous fractions and several membrane systems have been reviewed by
Jiao et al. 18. For example Diaz-Reinoso et al. 16 have coupled ultrafiltration and nanofiltration
membranes to concentrate and subsequently fractionate the sugars out of grape pomace extracts.
Ferrarini et al. 17 tested the performance of nanofiltration and reverse osmosis membranes to
concentrate grape juice as an alternative to pervaporation and cryoconcentration. More recently,
Popovic et al. 22 used nanofiltration to concentrate aromatic compounds, phenolic acids and
flavonols from chokeberry juice. Cassano et al. 23 tested five nanofiltration membranes with
MWCO between 200-1000 Da for the fractionation of artichoke brines and the recovery of
bioactive compounds. With the advent of recent progress on the separation, purification and
fractionation of dilute juice extracts, membrane separations are gaining interest. Among these,
multi-step crossflow pressure-driven membrane steps show promising results with increased
process efficiency by reducing membrane fouling and cake formation 19. Moreover, recent
advances in nanofiltration suggest that it may be ideally suited for recovery of food-grade small
organic species in aqueous solutions 24-27. In this work, the performance of two commercially
available nanofiltration membranes with MWCO 100-300 Da were evaluated for concentration of
anthocyanins, flavonols and chlorogenic acid. Furthermore, we have developed a cleaning
procedure with clean-in-place potential to investigate the reconditioning of used membrane as a
step forward to develop a simple, economically feasible method of concentrating the blueberry
extracts.

114
4.2. Materials and Methods
Blueberry (Vaccinium corymbosum L.) pomace was obtained by processing of non-clarified juice,
which was carried out in accordance with the protocol described by 28. NF245 and NF270
polyamide thin-film composite nanofiltration membranes with nominal molecular weight cut-off
of 200-400 Da were obtained in form of flat sheets from Filmtec™ (Dow, Minneapolis, MN). Prior
to insertion in the dead-end filtration vessel, the membranes were cut by hand and then soaked in
deionized water for at least 24 hours. The active separation areas were 14.6 cm2 for dead-end setup
and 42.0 cm2 for crossflow setup. Disposable filters (0.22 µm and 0.45 µm) were purchased from
GE Healthcare Life Sciences (Whatman®, Pittsburgh, PA) and used to prefilter large particles.
Sodium hydroxide (analytical grade) was purchased from Macron Fine Chemicals (Avantor
Performance Materials, Center Valley, PA). Hydrochloric acid (37% v/v) was purchased from
EMD Millipore (Billerica, MA). Deionized water was produced with Thermo Scientific, model
Smart2Pure 12 UV/UF (Waltham, MA), 18.0 MΩ·cm.
Pressurized hot water extraction
Frozen blueberry pomace was allowed to thaw to 21oC prior to extraction. A Dionex model 200
accelerated solvent extractor (ASE) system interfaced with a solvent controller (Dionex Corp.,
Sunnyvale, CA) was used to extract anthocyanins from blueberry pomace (Figure 4-1). Samples
(0.5 g) were loaded into 22 mL stainless steel extraction cells with a cellulose paper filter inserted
at the bottom of the cells. The ASE extraction was carried out using water as solvent; 68 bar
pressure, 120oC temperature, five extraction cycles, 70% flush volume, 90 sec nitrogen purge time
(no static time and no preheat time). For each extraction cycle it took approximately 5-6 min for
the water to heat to 120oC for a total run time of 25-30 min.

115
Figure 4-1: Accelerated Solvent Extraction system. The pomace is loaded in the extraction cell, water is pumped through the system, and polyphenols are recovered as aqueous solution in the collection vessels. Approximately 22 mL of extract from each extraction cycle was pooled after passing through a
large microporous sieve. Pressurized hot water extracts were stored at -20oC prior to total
anthocyanin analysis and nanofiltration testing.
Non-prefiltered or prefiltered (0.22 µm and 0.45 µm) blueberry pomace hot water extracts are
collectively described here as feed solution. The extract concentration was found to naturally vary
in the range 85-125 mg/L.
Dead-end filtration
A starting volume of 200 mL feed was loaded in a stainless steel pressure vessel (Sterlitech, Kent,
WA), which was continuously stirred on a magnetic stirrer plate (OptiChem, Vineland, NJ). The
feed side was pressurized with nitrogen at pressures between 10-17 bar. The flow through the
membrane was quantified by collecting the solution on an electronic balance (Mettler Toledo
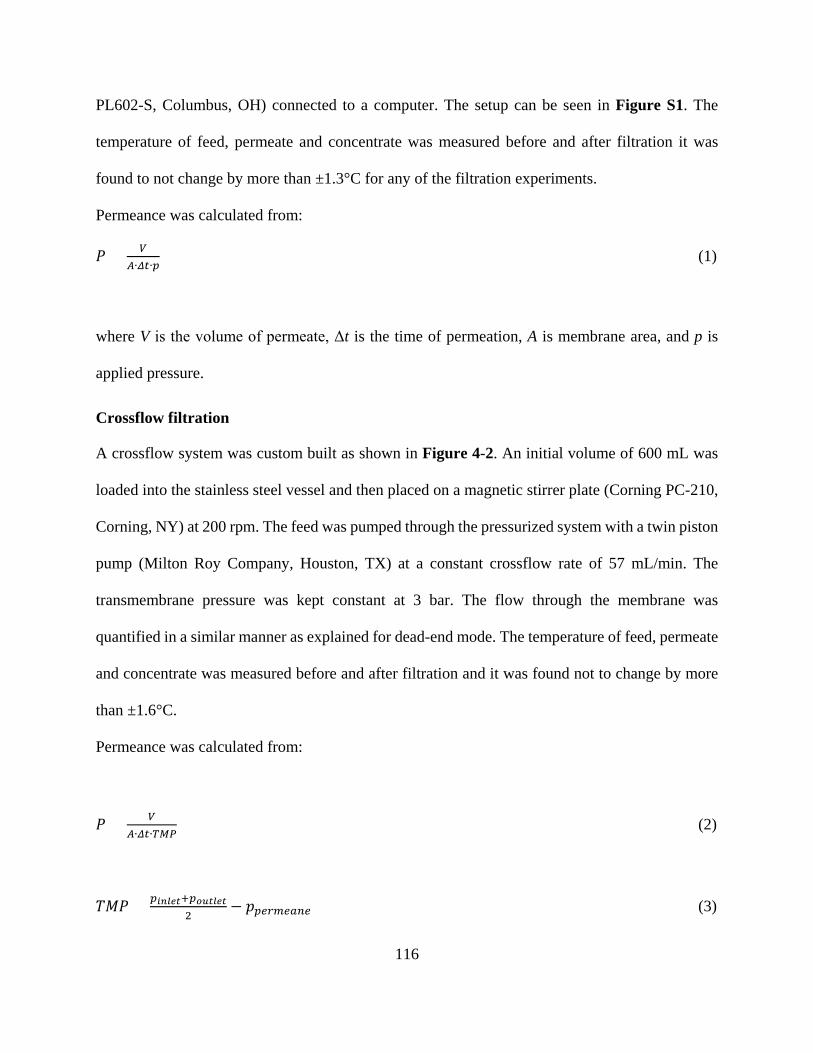
116
PL602-S, Columbus, OH) connected to a computer. The setup can be seen in Figure S1. The
temperature of feed, permeate and concentrate was measured before and after filtration it was
found to not change by more than ±1.3°C for any of the filtration experiments.
Permeance was calculated from:
𝑃𝑃 = 𝑉𝑉𝐴𝐴∙𝛥𝛥𝑆𝑆∙𝑆𝑆
(1)
where V is the volume of permeate, Δt is the time of permeation, A is membrane area, and p is
applied pressure.
Crossflow filtration
A crossflow system was custom built as shown in Figure 4-2. An initial volume of 600 mL was
loaded into the stainless steel vessel and then placed on a magnetic stirrer plate (Corning PC-210,
Corning, NY) at 200 rpm. The feed was pumped through the pressurized system with a twin piston
pump (Milton Roy Company, Houston, TX) at a constant crossflow rate of 57 mL/min. The
transmembrane pressure was kept constant at 3 bar. The flow through the membrane was
quantified in a similar manner as explained for dead-end mode. The temperature of feed, permeate
and concentrate was measured before and after filtration and it was found not to change by more
than ±1.6°C.
Permeance was calculated from:
𝑃𝑃 = 𝑉𝑉𝐴𝐴∙𝛥𝛥𝑆𝑆∙𝑇𝑇𝑇𝑇𝑃𝑃
(2)
𝑇𝑇𝑇𝑇𝑃𝑃 = 𝑆𝑆𝑖𝑖𝑖𝑖𝑖𝑖𝑖𝑖𝑖𝑖+𝑆𝑆𝑜𝑜𝑜𝑜𝑖𝑖𝑖𝑖𝑖𝑖𝑖𝑖2
− 𝑐𝑐𝑆𝑆𝑆𝑆𝑝𝑝𝑝𝑝𝑆𝑆𝑎𝑎𝑝𝑝𝑆𝑆 (3)

117
where V is the volume of permeate, Δt is the time of permeation, A is membrane area, and TMP is
the transmembrane pressure calculated from the pressures read at inlet, outlet and permeate (0 bar).
Figure 4-2: Process flow of experimental setup for nanofiltration in crossflow mode. A: Feed stirred vessel; B: Piston pump; C: Permeate collection and balance; D: Crossflow cell; E: Pressure regulator and F: gas supply. Total polyphenol analysis
Blueberry ASE extracts were screened for the determination of total anthocyanins and total
flavonols content using a method adapted from Cho et al. 29 on HPLC (Waters Corp, Milford, MA)
equipped with a 4.6 mm x 250 mm Symmetry® C18 (Waters Corp, Milford, MA). Mobile phase
(linear gradient) was comprised of (A) 5% formic acid and (B) 2% - 60% methanol at 1 mL/min.
Flavonols were detected at 360 nm and anthocyanins were detected at 510 nm. Total anthocyanins
(ACY) were determined as the sum of delphinidin, cyaniding, petunidin, penidin and malvidin

118
glycoside equivalents. Total flavonols (FLA) were detected as the sum of myricetin and quercetin
equivalents. Total chlorogenic acid (CLA) were quantified using an authentic method 29. Total
polyphenols, flavonols and chlorogenic acid are referred here cumulatively as total polyphenols.
For rejection analysis, samples from feed, retentate and permeate were evaluated for total
monomeric anthocyanin content by the pH differential assay using a Hewlett Packard Model
8452A Diode Array Spectrophotometer (Palo Alto, CA) 30. For each sample, two dilutions were
prepared: one with 0.5 mL of sample and 4.5 mL of pH 1.0 buffer; the other one with 0.5 mL of
sample and 4.5 mL of pH 4.5 buffer. Then, after 1 hour in the dark, the optical density (OD) was
measured at 510 and 700 nm wavelength against a deionized water blank. The absorbance was
calculated using:
𝐴𝐴 = [𝑂𝑂𝑂𝑂510 − 𝑂𝑂𝑂𝑂700]𝑆𝑆𝑝𝑝1.0 − [𝑂𝑂𝑂𝑂510 − 𝑂𝑂𝑂𝑂700]𝑆𝑆𝑝𝑝4.5 (4)
where A = absorbance, OD = optical density at specified λ wavelength (nm).
Total monomeric anthocyanin pigment concentration (c in mg/L), expressed as malvidin-3-
glucoside equivalents was calculated using:
𝐴𝐴 = A ∙ MW ∙ DF ∙ 1000𝑆𝑆 ∙ d
(5)
where MW = molecular weight for malvidin-3-glucoside (493.2 g/mol), DF = dilution factor
(1:10), ε = molar extinction coefficient for malvidin-3-glucoside (28,000), d = optical path length
(1 cm).

119
Sugars concentrations were analyzed using a previously developed assay on HPLC (1200 series
(Agilent Technologies, Palo Alto, CA) equipped with a Hi-Plex Ca (Duo) column (Agilent, 300 x
6.5 mm length x internal diameter, 8 µm pore size), injection volume: 5 µL, mobile phase:
deionized water, flow rate: 0.6 mL/minutes, column temperature: 80°C, refractive index detector
detector temperature: 45°C, run time: 30 minutes.
Rejection of total polyphenols and sugars was calculated from:
𝑅𝑅𝑖𝑖 = �1 − 𝑐𝑐𝑖𝑖𝑖𝑖𝑐𝑐𝑖𝑖𝑖𝑖� ∙ 100% (6)
where cip and cif are solute concentration in permeate and feed, respectively.
Membrane cleaning and fouling index
Used membranes were cleaned with the following protocol: (1) soak in deionized and stirred gently
for 24 hrs; (2) soak in 0.2% wt HCl for 30 min and then clean-in-place for 1 hr with deionized
water; (3) soak in 0.1% wt NaOH for 30 min and then clean-in-place for 1 hr with deionized water.
The performance of the reconditioned membranes was then tested for analyzing the recovery of
initial permeance and rejection. Additionally, the following relationship was used to quantify the
dynamic fouling index:
𝐹𝐹𝐹𝐹 = �1 − 𝑃𝑃(𝑉𝑉/𝐴𝐴)
𝑃𝑃𝑖𝑖𝑖𝑖𝑖𝑖𝑖𝑖𝑖𝑖𝑖𝑖𝑖𝑖� ∙ 100 (7)
where P(V/A) is permeance at a constant permeate volume over membrane active area ratio and
Pinitial is the initial permeance.

120
4.3. Results and Discussion
Total polyphenols and sugar retention
The HPLC data for total anthocyanins, flavonols and chlorogenic acid in the ASE extract, retentate
and permeate were summarized in Table 4-1. The study revealed that the highest amount of
polyphenols was due to total anthocyanins (with over 82% wt.), while the highest amount of
sugarswas due to fructose (with over 70% wt.) in the feed (ASE extract). The HPLC
chromatograms of total polyphenols 16 anthocyanins and 7 flavonols were identified. can be seen
in Figure S2. The most prevalent ACYs were malvidin-3-galactoside (15% wt, 493 M+),
delphinidin-3-galactoside (14% wt, 465 M+) and malvidin-3-glucoside (13% wt, 493 M+). The
most prevalent FLA were quercetin-3-galactoside (37% wt, 463 M+), quercetin-3-glucoside (16%
wt, 463 M+) and quercetin-3-acetylrhamnoside (11% wt, 489 M+). Chlorogenic acid represented
only 6% of total polyphenols and has a relative molecular ion weight of 353 M-. Both NF270 and
NF245 exhibited complete retention of total polyphenols, total chlorogenic acid and sucrose. Only
small amounts of glucose and fructose were found in the permeate fractions so that the rejections
were higher than 97%. The rejection of sugars is in good agreement with the work of Malmali et
al., 2014 who used NF270 for rejection of sugars from biomass hydrolysates 31.

121
Table 4-1: HPLC analysis results for ASE extract and for retentate and permeate fractions after rejection in dead-end mode.
Sample Total
ACYb)
Total
FLAb) CLAb) Sucrosec) Glucosec) Fructosec)
ASE extract (feed) 61.0 7.9 4.7 0.05 0.60 1.54
NF270 retentatea) 73.9 9.9 6.1 0.07 0.72 2.12
NF270 permeate n.d.d) n.d. n.d. n.d. 0.01 0.02
NF245 retentatea) 84.7 10.7 6.6 0.09 1.14 2.39
NF245 permeate n.d. n.d. n.d. n.d. 0.01 0.02
a) dead-end filtration; b) mg / 100 mL; c) mg / mL; d) n.d. – not detected.
Dead-end filtration
The concentration of polyphenols from blueberry pomace extract was tested using two
commercially available nanofiltration membranes and then optimized experimentally based on (1)
mixing speed, (2) prefiltration and (3) filtration time. Due to their low molecular weight cut-off,
both membranes showed complete rejection of polyphenols regardless of the experimental
parameter (Table S1). Membrane performance based on permeance using pomace extract was
tested at 0 rpm, 200 rpm and 400 rpm while holding the filtration volume constant. As seen in
Figure 4-3 the permeance changes drastically as a function of mixing speed; especially when no
stirring is applied the permeance reaches unfeasible slow values. This parameter was investigated
as part of finding optimum experimental parameters that would decrease fouling and disrupt cake
formation – effects inherent to batch separation processes in the juice industry 32. Because the
pomace extract is passed through a sieving filter (1 micron) after the ASE extraction there should
be no solids present in the feed. Thus, it is expected that the main phenomena leading to an

122
exacerbated decrease in permeance are typical concentration polarization and pore blocking
(membrane properties) as factors of polyphenols agglomeration, adsorption and precipitation (feed
composition properties). For example Heinonen et al. have identified polyphenols agglomeration
and precipitation during the concentration process of polyphenols from purple potatoes 33.
At 400 rpm, mechanical mixing has been found to increase the starting permeance 6.8 times
(NF270) and 2.1 times (NF245) over as compared to no stirring condition, while at 200 rpm it was
4.0 times (NF270) and 2.0 times (NF245) higher. The appearance of the used membranes showed
a dark purple coloration for the non-stirred experiments, while the other membranes remained just
slightly tainted when stirring was applied. This leads to hypothesize that fouling due to polyphenol
agglomeration or adsorption can be efficiently disrupted if mechanical stirring is applied. The
rejection of total polyphenols was complete and independent of stirring speed.

123
Figure 4-3: Effect of stirring speed on permeance. Data reflects the feed permeance after a constant volume for both membranes was collected in permeate.
Prefiltration with 0.45 µm and 0.22 µm filters was used as a simple pre-treatment method to assess
the effect on membrane permeance (Figure 4-4). Measuring the polyphenol concentration before
and after each prefiltration step, we observed a 15% wt. decrease after the feed was passed through
0.45 µm and then an additional 10% wt. decrease after passing through 0.22 µm. The majority of
the polyphenols have molecular weights significantly smaller than the pore size of the prefilters so
that it is believed that the retained polyphenols were agglomerated large particles 9. This was an
important observation for designing the experimental setup in crossflow mode and will be
discussed in the next section. No polyphenols could be detected in the permeate of any of the
prefiltered series so that the rejection was complete.

124
Figure 4-4: Permeance with non-prefiltered and filtered blueberry pomace extract, 200
rpm.

125
The nanofiltration membranes were next tested at extended filtration times until the maximum
amount of feed volume could be removed. As permitted by the dead-end setup, a minimum of 20%
v/v of initial feed should remain in the pressure vessel to not disrupt mixing. This analysis allowed
to compare the performance of the two membranes in terms permeance, rejection, anti-fouling
properties, and also to investigate degradation of polyphenols at longer reactor residence time. In
Table 4-2 it can be recognized that NF270 showed better performance than NF245. NF270
required approximately 19 hours to remove 80% of the initial volume and the polyphenols content
was concentrated by a factor of 4.6. In the same amount of time NF245 reduced the volume by
60% and concentrated the polyphenols by a factor of 2.2. It required almost 30 hours to reduce the
feed volume to the same performance as with NF270 but the flux started to decrease considerably
after 21 hours, due to increased fouling (Figure 4-5). The temperature of the feed and retentate
was monitored at the start and at the end of each filtration and it was found to not change by more
than ±1.0°C. Both membranes showed complete rejection of polyphenols and during analysis no
polyphenol degradation was detected. However, both NF270 and NF245 showed adsorbed
polyphenols on their surfaces, as observed from the dark purple color of the used membranes. This
could be an effect of particle agglomeration and polyphenol adsorption as seen previously in
unstirred systems.

126
Figure 4-5: Filtration at extended times. Stirring speed 200 rpm.

127
Table 4-2: Volume reduction and concentration factor for dead-end filtration at extended times.
Membrane, filtration time Feed volume, mL
Volume reduction, % v/v
Concentration factor
NF270, 19 hrs 250 80 4.59 NF245, 19 hrs 250 60 2.19 NF245, 29 hrs 250 78 3.14
Crossflow filtration
Previously, the filtration performance in dead-end mode was tested under different experimental
parameters and those findings were determinant in the design of the crossflow setup shown in
Figure 4-2. The setup was constructed to keep the feed continuously stirred and the crossflow rate
was set at a maximum flowrate of 57 mL/min. Then, the feed was passed through a 0.22 µm
prefilter to remove larger aggregated particles. Total polyphenols were rejected completely (Table
S2) and no polyphenol degradation was observed during analysis. The permeance was
considerably higher with NF270, which started at 3.5 L m-2 h-1 bar-1 and then reached
approximately 2.0 L m-2 h-1 bar-1 after 3 hours of filtration. For NF245 the permeance started at
1.5 L m-2 h-1 bar-1 and then decreased to 0.6 L m-2 h-1 bar-1 after the same filtration time.

128
Figure 4-6: Crossflow filtration with 0.22 µm prefiltered feed, 200 rpm, performed at a crossflow rate of 57 mL/min and 3 bar transmembrane pressure.
After 3 hours of filtration time with NF270, 15% v/v of total volume were removed and the
polyphenol concentration factor was 1.24. With NF245 approximately 7% v/v were removed and
the polyphenol concentration factor was 1.11.
Table 4-3: Volume reduction and concentration factor for crossflow filtration.
Membrane, filtration time
Feed volume, mL
Volume reduction, %
v/v
Concentration factor
NF270, 3 hrs 600 15.1 1.24
NF245, 3 hrs 600 7.3 1.11

129
Membrane reconditioning
Membrane fouling is a serious drawback for membrane separations as it leads to reduced flow
through the membrane 34. Fouling happens as the concentration polarization film in the vicinity of
the membrane selective layer becomes more pronounced due to effects such as adsorption,
compound agglomeration and precipitation as well as pore blockage 35. Here, several experimental
strategies have been employed to attempt to disrupt or minimize the effects leading to
concentration polarization. Membrane selective area of NF270 and NF245 are constructed with
polyamide networks containing aromatic moieties and these structures have non-beneficial surface
affinity towards the rejected polyphenols, possibly leading to enhanced adsorption of polyphenols
33. Regardless of the mode of operation or nanofiltration membrane, fouling was observed on all
membranes used in this work to some extent. This was visible from staining coloration and it is
quantified using the dynamic fouling index (Equation 7). In Table 4-4 the dynamic fouling index
is used to quantify the extent of membrane fouling for NF270 and NF245. Comparing the dynamic
fouling index at a constant ratio of permeate volume versus membrane active area, it can be seen
that NF270 showed better anti-fouling behavior than NF245 in dead-end and in crossflow mode.
Furthermore, crossflow filtration was more successful at reducing fouling for the NF270. In the
case of NF245, the MWCO of the membrane is smaller so that soluble compounds with small
molecular weight, such as monomeric sugars could get stuck easier in the aromatic polyamide
network of the membrane selective layer leading to pore blockage.
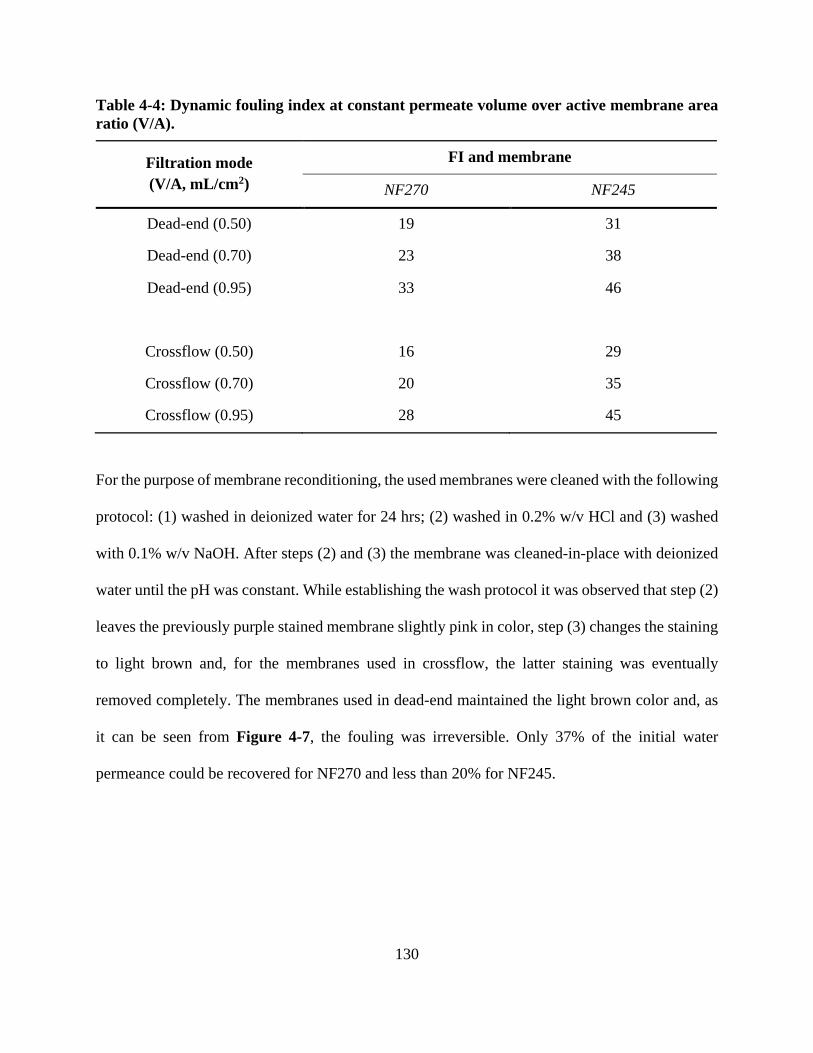
130
Table 4-4: Dynamic fouling index at constant permeate volume over active membrane area ratio (V/A).
Filtration mode (V/A, mL/cm2)
FI and membrane
NF270 NF245
Dead-end (0.50) 19 31
Dead-end (0.70) 23 38
Dead-end (0.95) 33 46
Crossflow (0.50) 16 29
Crossflow (0.70) 20 35
Crossflow (0.95) 28 45
For the purpose of membrane reconditioning, the used membranes were cleaned with the following
protocol: (1) washed in deionized water for 24 hrs; (2) washed in 0.2% w/v HCl and (3) washed
with 0.1% w/v NaOH. After steps (2) and (3) the membrane was cleaned-in-place with deionized
water until the pH was constant. While establishing the wash protocol it was observed that step (2)
leaves the previously purple stained membrane slightly pink in color, step (3) changes the staining
to light brown and, for the membranes used in crossflow, the latter staining was eventually
removed completely. The membranes used in dead-end maintained the light brown color and, as
it can be seen from Figure 4-7, the fouling was irreversible. Only 37% of the initial water
permeance could be recovered for NF270 and less than 20% for NF245.
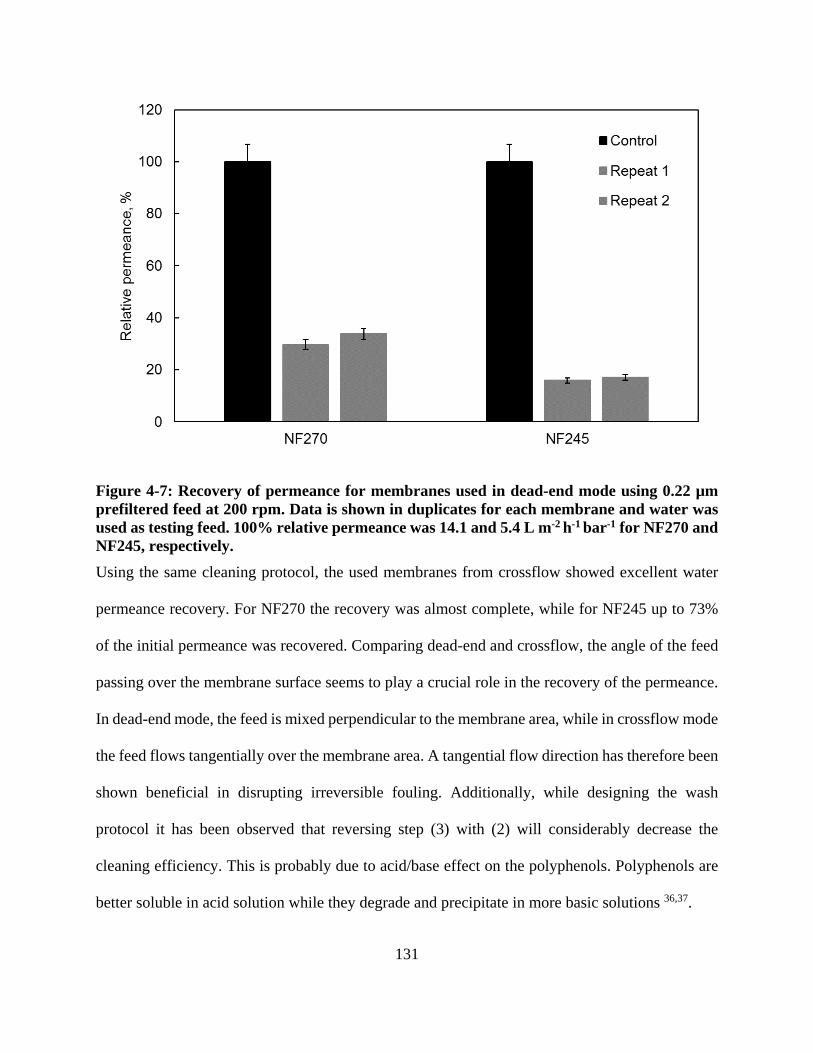
131
Figure 4-7: Recovery of permeance for membranes used in dead-end mode using 0.22 µm prefiltered feed at 200 rpm. Data is shown in duplicates for each membrane and water was used as testing feed. 100% relative permeance was 14.1 and 5.4 L m-2 h-1 bar-1 for NF270 and NF245, respectively. Using the same cleaning protocol, the used membranes from crossflow showed excellent water
permeance recovery. For NF270 the recovery was almost complete, while for NF245 up to 73%
of the initial permeance was recovered. Comparing dead-end and crossflow, the angle of the feed
passing over the membrane surface seems to play a crucial role in the recovery of the permeance.
In dead-end mode, the feed is mixed perpendicular to the membrane area, while in crossflow mode
the feed flows tangentially over the membrane area. A tangential flow direction has therefore been
shown beneficial in disrupting irreversible fouling. Additionally, while designing the wash
protocol it has been observed that reversing step (3) with (2) will considerably decrease the
cleaning efficiency. This is probably due to acid/base effect on the polyphenols. Polyphenols are
better soluble in acid solution while they degrade and precipitate in more basic solutions 36,37.

132
Figure 4-8: Recovery of permeance for membranes used in crossflow mode using 0.22 µm prefiltered feed at 200 rpm. Water was used as feed and all other parameters were constant. Washing steps are shown in chronological order. For NF270 100% relative permeance corresponds to 13.2 L m-2 h-1 bar-1 and for NF245 100% relative permeance corresponds to 4.6 L m-2 h-1 bar-1. 4.4. Conclusion
Nanofiltration technology was used in dead-end and in crossflow mode to concentrate polyphenol
content from blueberry pomace. The most prevalent polyphenols were identified as total
anthocyanins, total flavonols and chlorogenic acid. The sugar content analyzed using HPLC
revealed that fructose was the predominant monosugar. Both nanofiltration membranes showed
complete rejection of total anthocyanins, total flavonols, chlorogenic acid, sucrose and more than
95% rejection for glucose and fructose. The rejection performance was unaffected by the
experimental parameter of the filtration mode. In dead-end mode 80% of water volume was

133
removed in 19 hours using NF270, while only 60% of water volume was removed with NF245.
Stirring was found crucial for obtaining good permeances and crossflow mode was found to
improve membrane fouling considerably. The membrane reconditioning protocol delivered almost
complete recovery of water permeance for NF270 used in crossflow mode and up to 73% recovery
for NF245.
Based on our experimental work, we recommend the following best operation procedures for
polyphenol concentration using nanofiltration membranes:
Table 4-5: Unit operations and the recommended best procedure to assist with observed issues.
Unit operation Recommended best procedure blueberry extract is preserved best frozen but polyphenols tend to precipitate at low temperatures
warm up to room temperature under continuous stirring before separation
prefiltration if prefiltration is used as pretreatment method, use a stirred device if possible to help break particle aggregation
membrane fouling
membranes used in dead-end seem to foul irreversibly compared to those used in crossflow crossflow, although a more complicated setup is a better option for reducing fouling
clean-in-place
membranes used in crossflow can be reconditioned to almost complete permeance if acid wash is used first followed by base wash
Acknowledgements
The help of Jerry W. King from Food Sciences Department at University of Arkansas, Fayetteville,
AR is greatly acknowledged.
134
References
1. Kraujalytė V, Venskutonis PR, Pukalskas A, Česonienė L, Daubaras R. Antioxidant properties, phenolic composition and potentiometric sensor array evaluation of commercial and new blueberry (vaccinium corymbosum) and bog blueberry (vaccinium uliginosum) genotypes. Food Chem. 2015;188:583-590.
2. Torri E, Lemos M, Caliari V, Kassuya CAL, Bastos JK, Andrade SF. Anti-inflammatory and antinociceptive properties of blueberry extract (vaccinium corymbosum). J Pharm Pharmacol. 2007;59(4):591-596.
3. Youdim K, McDonald J, Kalt W, Joseph J. Potential role of dietary flavonoids in reducing microvascular endothelium vulnerability to oxidative and inflammatory insults. J Nutr Biochem. 2002;13(5):282-288.
4. Katsube N, Iwashita K, Tsushida T, Yamaki K, Kobori M. Induction of apoptosis in cancer cells by bilberry (vaccinium myrtillus) and the anthocyanins. J Agric Food Chem. 2003;51(1):68-75.
5. Vendrame S, Guglielmetti S, Riso P, Arioli S, Klimis-Zacas D, Porrini M. Six-week consumption of a wild blueberry powder drink increases bifidobacteria in the human gut. J Agric Food Chem. 2011;59(24):12815-12820.
6. de Lange DW, Verhoef S, Gorter G, Kraaijenhagen RJ, van de Wiel A, Akkerman JN. Polyphenolic grape extract inhibits platelet activation through PECAM-1: An explanation for the french paradox. Alcoholism-Clinical and Experimental Research. 2007;31(8):1308-1314.
7. Opie LH, Lecour S. The red wine hypothesis: From concepts to protective signalling molecules. Eur Heart J. 2007;28(14):1683-1693.
8. Giovanelli G, Buratti S. Comparison of polyphenolic composition and antioxidant activity of wild italian blueberries and some cultivated varieties. Food Chem. 2009;112(4):903-908.
9. Ancillotti C, Ciofi L, Rossini D, et al. Liquid chromatographic/electrospray ionization quadrupole/time of flight tandem mass spectrometric study of polyphenolic composition of different vaccinium berry species and their comparative evaluation. Analytical and Bioanalytical Chemistry. 2017;409(5):1347-1368.
10. Lee J, Durst R, Wrolstad R. Impact of juice processing on blueberry anthocyanins and polyphenolics: Comparison of two pretreatments. J Food Sci. 2002;67(5):1660-1667.
11. Lee J, Wrolstad R. Extraction of anthocyanins and polyphenolics from blueberry-processing waste. J Food Sci. 2004;69(7):C564-C573.

135
12. Galanakis CM. Emerging technologies for the production of nutraceuticals from agricultural by-products: A viewpoint of opportunities and challenges. Food Bioprod Process. 2013;91(4):575-579.
13. Kalt W. Effects of production and processing factors on major fruit and vegetable antioxidants. J Food Sci. 2005;70(1):R11-R19.
14. Versari A, Ferrarini R, Parpinello G, Galassi S. Concentration of grape must by nanofiltration membranes. Food Bioprod Process. 2003;81(C3):275-278.
15. Cassano A, Drioli E, Galaverna G, Marchelli R, Di Silvestro G, Cagnasso P. Clarification and concentration of citrus and carrot juices by integrated membrane processes. J Food Eng. 2003;57(2):153-163.
16. Diaz-Reinoso B, Moure A, Dominguez H, Carlos Parajo J. Ultra- and nanofiltration of aqueous extracts from distilled fermented grape pomace. J Food Eng. 2009;91(4):587-593.
17. Ferrarini R, Versari A, Galassi S. A preliminary comparison between nanofiltration and reverse osmosis membranes for grape juice treatment. J Food Eng. 2001;50(2):113-116.
18. Jiao B, Cassano A, Drioli E. Recent advances on membrane processes for the concentration of fruit juices: A review. J Food Eng. 2004;63(3):303-324.
19. Vladisavljevic GT, Vukosavljevic P, Veljovic MS. Clarification of red raspberry juice using microfiltration with gas backwashing: A viable strategy to maximize permeate flux and minimize a loss of anthocyanins. Food Bioprod Process. 2013;91(C4):473-480.
20. Fazaeli M, Emam-Djomeh Z, Kalbasi Ashtari A, Omid M. Effect of spray drying conditions and feed composition on the physical properties of black mulberry juice powder. Food Bioprod Process. 2012;90(4):667-675.
21. Zhao Y, Wu X, Yu L, Chen P. Retention of polyphenols in blueberries (vaccinium corymbosum) after different cooking methods, using UHPLC–DAD–MS based metabolomics. Journal of Food Composition and Analysis. 2017;56:55-66.
22. Popovic K, Pozderovic A, Jakobek L, Rukavina J, Pichler A. Concentration of chokeberry (aronia melanocarpa) juice by nanofiltration. Journal of Food and Nutrition Research. 2016;55(2):159-170.
23. Cassano A, Cabri W, Mombelli G, Peterlongo F, Giorno L. Recovery of bioactive compounds from artichoke brines by nanofiltration. Food Bioprod Process. 2016;98:257-265.
24. Yadav JSS, Yan S, Ajila CM, Bezawada J, Tyagi RD, Surampalli RY. Food-grade single-cell protein production, characterization and ultrafiltration recovery of residual fermented whey proteins from whey. Food Bioprod Process. 2016;99:156-165.

136
25. Balyan U, Sarkar B. Integrated membrane process for purification and concentration of aqueous syzygium cumini (L.) seed extract. Food Bioprod Process. 2016;98:29-43.
26. Cordova A, Astudillo C, Giorno L, et al. Nanofiltration potential for the purification of highly concentrated enzymatically produced oligosaccharides. Food Bioprod Process. 2016;98:50-61.
27. Conidi C, Cassano A. Recovery of phenolic compounds from bergamot juice by nanofiltration membranes. Desalination and Water Treatment. 2015;56(13):3510-3518.
28. Brownmiller C, Howard LR, Prior RL. Processing and storage effects on monomeric anthocyanins, percent polymeric color, and antioxidant capacity of processed blueberry products. J Food Sci. 2008;73(5):H72-H79.
29. Cho M, Howard L, Prior R, Clark J. Flavonoid glycosides and antioxidant capacity of varous blackberry, blueberry and red grape genotypes determined by high-performance liquid chromatography/mass spectrometry. J Sci Food Agric. 2004;84(13):1771-1782.
30. Giusti M, Rodriguez-Saona L, Wrolstad R. Molar absorptivity and color characteristics of acylated and non-acylated pelargonidin-based anthocyanins. J Agric Food Chem. 1999;47(11):4631-4637.
31. Malmali M, Stickel JJ, Wickramasinghe SR. Sugar concentration and detoxification of clarified biomass hydrolysate by nanofiltration. Separation and Purification Technology. 2014;132:655-665.
32. Mondor M, Girard B, Moresoli C. Modeling flux behavior for membrane filtration of apple juice. Food Res Int. 2000;33(7):539-548.
33. Heinonen J, Farahmandazad H, Vuorinen A, Kallio H, Yang B, Sainio T. Extraction and purification of anthocyanins from purple-fleshed potato. Food Bioprod Process. 2016;99:136-146.
34. Mattaraj S, Jarusutthirak C, Charoensuk C, Jiraratananon R. A combined pore blockage, osmotic pressure, and cake filtration model for crossflow nanofiltration of natural organic matter and inorganic salts. Desalination. 2011;274(1-3):182-191.
35. Shirazi S, Lin C, Chen D. Inorganic fouling of pressure-driven membrane processes - A critical review. Desalination. 2010;250(1):236-248.
36. Castañeda-Ovando A, Pacheco-Hernández MdL, Páez-Hernández ME, Rodríguez JA, Galán-Vidal CA. Chemical studies of anthocyanins: A review. Food Chem. 2009;113(4):859-871.
37. Reque PM, Steffens RS, Jablonski A, Flores SH, Rios AdO, de Jong EV. Cold storage of blueberry (vaccinium spp.) fruits and juice: Anthocyanin stability and antioxidant activity. Journal of Food Composition and Analysis. 2014;33(1):111-116.

137
Supplemental Information
Dead-end filtration
Figure S1: Process experimental setup for nanofiltration in dead-end mode.

138
Dead-end - Rejection
Table S1: Rejection of polyphenols and anthocyanins at different experimental parameters in dead-end filtration mode.
Filtration parameter Total polyphenol rejectiona)
NF270 NF245
Stirring speed, rpm 0 100% 100% 200 100% 100% 400 100% 100% Pre-filtration none 100% 100% 0.22 µm 100% 100% 0.45 µm 100% 100% Filtration time 1 hr 100% 100% 19 hrs 100% 100% 29 hrs n.a. 100%
a) as sum of total anthocyanins, total flavonols and chlorogenic acid.

139
HPLC analysis of ASE extract

140
Figure S2: HPLC analysis of anthocyanins. A. 510 nm, ASE extract; B. 510 nm, permeate after nanofiltration in dead-end mode with NF270; C. 360 nm, ASE extract and D. 360 nm, permeate after nanofiltration in dead-end mode with NF270. Numbered peaks are identified below. * - not identified peak. Peak identification using standards as follows:
Figure S2, A. (510 nm):
1. delphinidin-3-galactoside
2. delphinidin-3-glucoside
3. cyanidin-3-galactoside
4. delphinidin-3-arabinoside
5. cyanidin-3-glucoside
6. petunidin-3-galactoside
7. cyanidin-3-arabinoside
8. petunidin-3-glucoside
9. peonidin-3-galactoside
10. petunidin-3-arabinoside
11. malvidin-3-galactoside
12. malvidin-3-glucoside

141
13. peonidin-3-arabinoside
14. malvidin-3-arabinoside
15. delphinidin-3-acetylglucoside
16. cyanidin-3-acetylglucoside
Figure S2, C. (360 nm):
1. chlorogenic acid
2. myricetin-3-galactoside/glucoside
3. myricetin-3-rhamnoside
4. quercetin-3-galactoside
5. quercetin-3-glucoside
6. quercetin-3-rutinoside
7. quercetin-3-acetlyrhamnoside
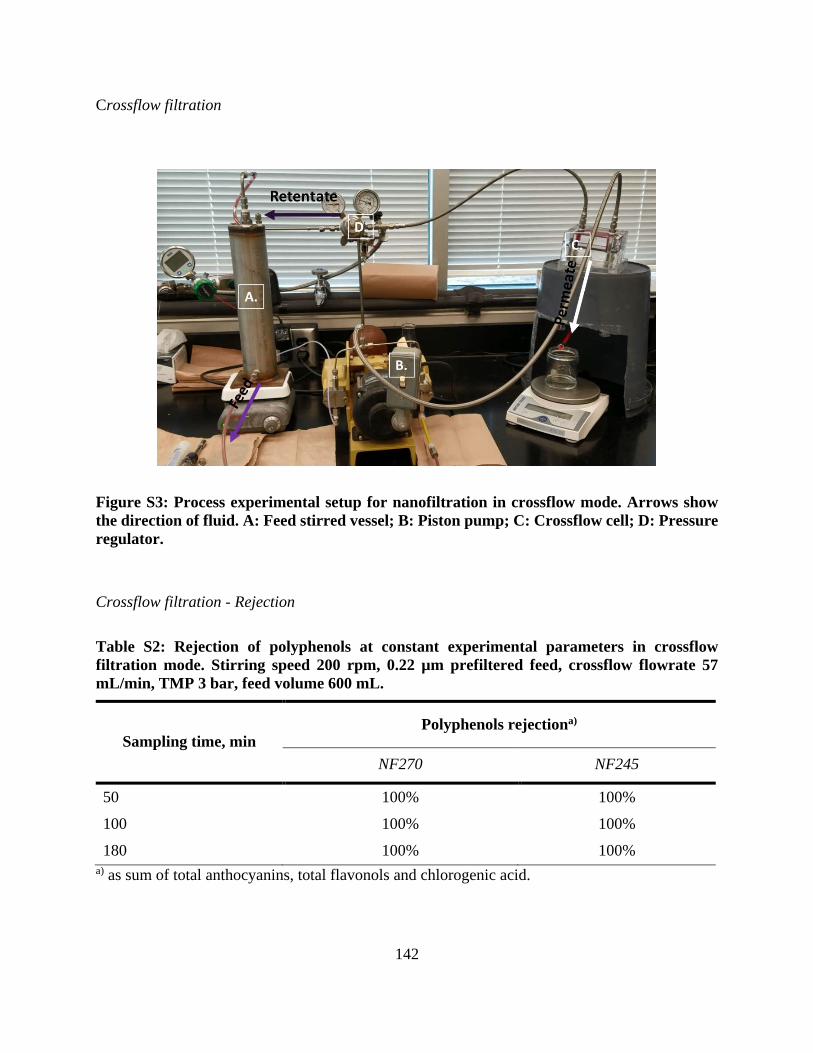
142
Crossflow filtration
Figure S3: Process experimental setup for nanofiltration in crossflow mode. Arrows show the direction of fluid. A: Feed stirred vessel; B: Piston pump; C: Crossflow cell; D: Pressure regulator.
Crossflow filtration - Rejection
Table S2: Rejection of polyphenols at constant experimental parameters in crossflow filtration mode. Stirring speed 200 rpm, 0.22 µm prefiltered feed, crossflow flowrate 57 mL/min, TMP 3 bar, feed volume 600 mL.
Sampling time, min Polyphenols rejectiona)
NF270 NF245
50 100% 100%
100 100% 100%
180 100% 100% a) as sum of total anthocyanins, total flavonols and chlorogenic acid.

143
5. Conclusion and future outlook
Nanofiltration is a very promising separation technology that has the potential to deliver
completely new technologies or advance already existing ones. In this work have developed novel
chemistry to modify poly(ethersulfone) membrane via interfacial polymerization for use in the
recycling of expensive ionic liquids. This is especially relevant, since ionic liquids and low
molecular weight sugars, such as glucose, are cumbersome to separate by size-exclusion only. Our
results indicate that careful control of the thickness and structure of the interfacial polymerization
layer will be essential to maximize rejection of sugars, recovery of ionic liquids in the permeate
and the permeability of the membrane. In addition to development of appropriate membranes,
integration of a nanofiltration step in the entire process must be considered as it will determine the
viability of nanofiltration for ionic liquid recovery.
The second membrane modification dealt with deposition of charged polyelectrolytes on the
surface of alumina oxide and poly(ethersulfone) ultrafiltration membranes. We demonstrated their
application on the feasibility of recycling of ionic liquid from biomass hydrolysates. An attempt
was made to understand the effect of number of polyelectrolyte bilayers on the surface properties
of the membrane and its consequent membrane performance. Atomic force microscopy imaging,
contact angle measurement and zeta potential analysis were used to analyze the surface properties
and morphology of the modified membranes, which were found to be directly linked with water
permeance and selectivity performance. Alumina oxide membranes showed heterogeneous
deposition of polyelectrolyte layers with large smooth areas and then rougher areas around the
large microfiltration pores. The former is believed to be beneficial for increased permeance, while
the latter could trigger a mediated transfer of charged species and thus an increase in selectivity
for ionic liquids. Poly(ethersulfone) membranes showed a more homogenous deposition of

144
polyelectrolytes, which seem to mimic the original structure of the base membranes. Coupled with
increased negative charge as a function of deposited bilayers this allowed for better transfer of the
charged species while retaining the non-charged species on size-exclusion basis.
For the third part of this work, nanofiltration technology was tested in dead-end and crossflow
mode to investigate the feasibility of reducing water volume and thus concentrating health
beneficial polyphenolic compounds from blueberry (Vaccinium corymbosum) pomace extracts.
The pomace represents an underused raw material that is usually discarded in the food
manufacturing industry after the juice was extracted. However, the skins of the blueberry fruit
contain the most polyphenols by mass and their extraction and concentration could deliver an
interesting market product as e.g. anti-oxidant enhanced drinks and foods. The separation
techniques were optimized based on stirrer speed, prefiltration step and feed temperature. Both
NF245 and NF270 showed complete rejection of phenolic compounds at good permeances. A
clean-in-place protocol was developed for cleaning the used membranes after filtration and an
excellent relative permeance was obtained for the NF270 membrane.
As future work, it would be interesting to investigate if interfacial polymerization and
polyelectrolyte deposition could be combined and optimized to fabricate membranes with even
better selectivity for the recycling of ionic liquids and with even better permeabilities. Since
interfacial polymerization allows for easy addition of reactive monomers, it would be interesting
to test other boronic acids that could be used to tune the selective layer towards complete rejection
of sugars (and thus increased selectivity and recycling of ionic liquids).
For the recovery and concentration of polyphenols from blueberry pomace, it would be worthwhile
developing a larger scale system and investigate the economic feasibility as well as bioactivity of

145
concentrated polyphenols. Since the polyphenols have shown to adhere to membrane surface,
fouling studies and optimization based on reducing membrane fouling could be of interest.
Related Documents