iJ;il ELSEVIER Journal of Membrane Science 121 (1996) 83-93 journal of MEMBRANE SCIENCE Membrane distillation: theory and experiments Paz Godino, Luis Pefia, Juan I. Mengual * Department of Applied Physics 1, University Complutense of Madrid, 28040 Madrid, Spain Received 23 February 1996; revised 21 May 1996; accepted 22 May 1996 Abstract A theoretical approach is presented that describes membrane distillation processes due to the simultaneous action (in a proactive or in a counteractive way) of temperature and concentration differences through porous hydrophobic membranes. The model developed emphasizes the importance of the boundary layers, shows the existence of a coupling term between the two thermodynamic forces acting on the system, and permits the definition and characterization of the so-called steady states. In order to check the model, two membranes have been studied in different experimental conditions. The influence of some relevant parameters, such as solution concentration, stirring rate, mean temperature and temperature difference has been considered and the theoretical predictions of the model have been applied to the obtained results. The accordance may be considered good. Keywords: Membrane distillation; Porous hydrophobic membrane 1. Introduction The existence of temperature-driven transport of water through porous hydrophobic partitions has been known since the late 1960s. The process was called "thermal membrane distillation" and consists of a mass flux, in vapor phase, through the membrane pores [1-7]. The transport mechanism may be de- scribed as follows: the membrane material is water repellent, so liquid water cannot enter the pores unless a hydrostatic pressure, exceeding the so-called "liquid entry pressure of water (LEPw)", is applied [4,8]. In the absence of such a pressure difference, a liquid-vapor interface is formed on either side of the * Corresponding author. membrane pores. In these conditions, if a bulk tem- perature difference is maintained through the mem- brane, a water vapor pressure difference is created between both interfaces; evaporation takes place at the hot interface and, after vapor is transported through the pores, condensation takes place at the cold interface. Later on, in the 1980s, it was observed that the same membranes could be used in a different isothermal process termed "osmotic distillation" [9,10]. In this case, the membrane separates two aqueous solutions of some non-volatile component, the solute concentrations at both sides of the mem- brane being different. The presence of the non-vola- tile component reduces the water vapor pressure, at the corresponding interface, in different quantifies. Consequently, a water vapor pressure difference be- tween both sides of the membrane pores appears and 0376-7388//96//$15.00 Copyright © 1996 Elsevier Science B.V. All rights reserved. Pll S0376-73 88(96)00162-7

Welcome message from author
This document is posted to help you gain knowledge. Please leave a comment to let me know what you think about it! Share it to your friends and learn new things together.
Transcript

iJ;il E L S E V I E R Journal of Membrane Science 121 (1996) 83-93
j ourna l of MEMBRANE
SCIENCE
Membrane distillation: theory and experiments
Paz Godino, Luis Pefia, Juan I. Mengual * Department of Applied Physics 1, University Complutense of Madrid, 28040 Madrid, Spain
Received 23 February 1996; revised 21 May 1996; accepted 22 May 1996
Abstract
A theoretical approach is presented that describes membrane distillation processes due to the simultaneous action (in a proactive or in a counteractive way) of temperature and concentration differences through porous hydrophobic membranes. The model developed emphasizes the importance of the boundary layers, shows the existence of a coupling term between the two thermodynamic forces acting on the system, and permits the definition and characterization of the so-called steady states. In order to check the model, two membranes have been studied in different experimental conditions. The influence of some relevant parameters, such as solution concentration, stirring rate, mean temperature and temperature difference has been considered and the theoretical predictions of the model have been applied to the obtained results. The accordance may be considered good.
Keywords: Membrane distillation; Porous hydrophobic membrane
1. Introduction
The existence of temperature-driven transport of water through porous hydrophobic partitions has been known since the late 1960s. The process was called " thermal membrane dist i l lat ion" and consists of a mass flux, in vapor phase, through the membrane pores [1-7]. The transport mechanism may be de- scribed as follows: the membrane material is water repellent, so liquid water cannot enter the pores unless a hydrostatic pressure, exceeding the so-called " l iqu id entry pressure of water (LEPw)", is applied [4,8]. In the absence of such a pressure difference, a l iqu id -vapor interface is formed on either side of the
* Corresponding author.
membrane pores. In these conditions, if a bulk tem- perature difference is maintained through the mem- brane, a water vapor pressure difference is created between both interfaces; evaporation takes place at the hot interface and, after vapor is transported through the pores, condensation takes place at the cold interface.
Later on, in the 1980s, it was observed that the same membranes could be used in a different isothermal process termed "osmot ic dist i l lat ion" [9,10]. In this case, the membrane separates two aqueous solutions of some non-volatile component, the solute concentrations at both sides of the mem- brane being different. The presence of the non-vola- tile component reduces the water vapor pressure, at the corresponding interface, in different quantifies. Consequently, a water vapor pressure difference be- tween both sides of the membrane pores appears and
0376-7388//96//$15.00 Copyright © 1996 Elsevier Science B.V. All rights reserved. Pll S0376-73 88(96)00162-7
84 P. Godino et al. / Journal of Membrane Science 121 (1996) 83-93
a water vapor flux takes place as in the case of the thermal membrane distillation.
Theoretical approaches to the above described phenomena have been developed separately [1-10]. It is worth noticing that the driving force is, in both cases, a water vapor pressure difference. Conse- quently, the distinction between "thermal membrane distillation" and "osmotic distillation" is rather arti- ficial although the physical origin of the pressure difference is not the same. In the present paper a model is proposed that considers the membrane dis- tillation as an operation in which the pressure differ- ence is due, in the most general case, to the simulta- neous action of temperature and concentration differ- ences, acting in a proactive or in a counteractive way. In the counteractive case, a steady state may be achieved. The model developed emphasizes the im- portance of the boundary layers on the fluxes. In addition, the formulations for the thermal membrane distillation and the osmotic distillation may be ob- tained as particular cases of the model.
In order to test the validity of the model, some series of experiments have been carried out with two membranes and pure water and aqueous solutions of sodium chloride. The influence on the volume fluxes of some significant parameters, such as solution concentration, stirring rate and temperature, has been obtained. Finally, the experimental results have been compared with the theoretical predictions and the accordance may be considered good.
2. T h e o r e t i c a l a p p r o a c h
The system to be studied consists of a porous hydrophobic membrane which is held between two well-stirred liquid phases. One of the phases is pure water while the other may be pure water or an aqueous solution of a non-volatile component. The stirring rate (the same for both phases), the solute concentration, and the temperature may be varied independently. It should be pointed out that the experimental arrangement we are considering, in which the liquid phases are in direct contact with both sides of the membrane, is termed "direct con- tact membrane distillation".
If differences in temperature and/or concentra- tion are maintained, a water vapor flux takes place
through the membrane. This flux may be explained in the framework of different transport models: the Knudsen model, the Poiseuille model, the transition Knudsen-Poiseuille models and the diffusive model. The correct choice of the most adequate model re- quires some knowledge of the membrane morphol- ogy, including porosity, tortuosity, pore radius, etc. This problem has been extensively discussed in [6,11]. In any case, all the models suggest that the volume flux per unit surface area of the membrane, J, may be written as a function of the transmembrane water vapor pressure difference, A p:
J=AAP (1)
where A is the net membrane distillation coefficient, which may depend on mean temperature (through mean vapor pressure, vapor viscosity, etc.), mem- brane structure, etc.
The water vapor pressure at each interface, P, depends on the absolute temperature, T, and the solute concentration, c. This dependence may be expressed, in a good approximation, by means of the value corresponding to pure water, Pe(T), and the water activity, a(c,T):
P(c , r ) = a(c,T). P" (T)
where the upper index " O " means pure water. As is well known, the relation between the vapor pres- sure of pure water and the absolute temperature may be described very accurately by an exponential de- pendence of the form:
P " (T) ~ exp - - ~ (3)
where L is the heat of vaporization of water and R is the gas constant.
Let T 1 and T 2 be the temperatures at the corre- sponding liquid-vapor interfaces, AT the transmem- brane temperature difference, and T the mean tem- perature. In this case, T 1 = T + AT~2 and T 2 = T - AT/2. Let Aa and a be the transmembrane activity difference and the mean activity, respectively. In what follows, it will be assumed that:
AT LAT Aa - << l and << 1 (4)
2T 2RT 2 4~
In the range of temperatures we are considering, these inequalities seem to be fairly reasonable. Nev-

P. Godino et al. / Journal of Membrane Science 121 (1996) 83-93 85
ertheless, their validity will be checked later in the discussion of the experimental results. If one devel- ops the corresponding series expansion and considers the above approximations, the transmembrane pres- sure difference may be split into two terms:
Ap - P,(c , ,T,) - P2( c2,T2)
L = P e ( ~ ' ) A a + p e ( 7 " ) 8 - ~ - ~ A T (5)
In the same way, the volume flux, J, may be written [by using Eqs. (1) and (5)] as an addition of the two corresponding terms. When temperature and concentration differences are present, there are three possibilities: (a) the two forces act in a proactive way; (b) the forces are counteractive to each other (the "osmotic" contribution being the greatest); and, finally, (c) the forces act in a counteractive way (the "thermal" contribution being the greatest). In what follows, the "osmotic" contribution to the flux will be considered always positive.
Eqs. (1) and (5) are valid, in principle, but cannot be used in their present forms, due to the existence of boundary layers that adjoin the membrane at both sides. As a consequence, the transmembrane temper- ature difference, AT, is always smaller than the one existing between the well stirred bulk phases, AT b. The phenomenon is called "temperature polariza- tion", and masks the real magnitude of the non-iso- thermal effects. In the same way, the phenomenon of "concentration polarization" exists, which gives rise to a difference between the solute concentration at the interface membrane-unstirred layer, c m, and in the well-stirred bulk phase, c b.
In what follows, the influence of the boundary layers on the fluxes will be developed in such a way that three contributions to the flux will be obtained: the first, which is proportional to the bulk tempera- ture difference; the second, which is proportional to the bulk concentration difference; and the third that depends on the product of both forces.
The contribution of the boundary layers to the decrease of the thermal effects has been studied by using the "temperature polarization coefficient, ~-". This coefficient is defined as: r - A T / A T ~ and rep- resents the fraction of the externally applied thermal driving force that contributes to the mass transfer [6,12]. In order to quantify its value, the heat transfer in steady state, through the composite system (mem-
brane plus boundary layers) is considered and a relationship among z and various membrane and solution properties, such as the thickness and the effective thermal conductivity of the membrane, the film heat transfer coefficient of the layers, etc., is reached. It is worth noticing that the concept of temperature polarization coefficient was initially pro- posed in papers dealing with pure water [6,8]. The effect of a non-volatile solute is to reduce the water vapor pressure, to alter the fluid dynamics through density and viscosity, and to influence the heat trans- fer through thermal conductivity and heat capacity. This problem has been considered elsewhere [13-15]. As a matter of fact, in [14], Vel~zquez and Mengual showed that the coefficient ~- is strongly dependent on the stirring rate, but is practically independent on the solution concentration, for systems similar to the ones considered in the present paper.
On the other hand, the contribution of a boundary layer to the isothermal concentration-driven mass transfer has been studied in [10]. In the most general non-isothermal case, a similar reasoning may be developed. In fact, the product p e ( T ) A a = A P " represents roughly the "osmotic" part of the trans- membrane pressure difference in Eq. (5). In a first order approximation, the contribution of the bound- ary layer may be expressed by means of the follow- ing relationship between the value AP °, and the value corresponding to the bulk phases, A P~:
A P ° = A P ~ ' + ~ ( m - - C b ) + . . . (6)
In a similar way, the mean value of the vapor pressure, P ( T ) = p e (~ ) f i , may be written as:
Ap ° e " = P " - - -
2 [d P°]Cm-Cb 2 dc ] 2
- ~ . . . (7)
If one makes use of the Nernst film model, and assumes that eddy diffusion and thermal diffusion are negligible in relation to ordinary diffusion, the following relationship is found between c,, and % D0]:
c., = CbeXp(--J/k) (8)
86 P. Godino et al. / Journal of Membrane Science 121 (1996) 83-93
In Eq. (8) the mass transfer coefficient is defined as usual, k---D/6, D being the ordinary diffusion coefficient and 6 the layer thickness. It is worth saying that the exponent in Eq. 8 is negative for cases a) and b) and positive for case c).
Eqs. (1) and (4)-(8) permit us to write, in a first order approximation:
[ 1 1 Cb dAP° = AP~ L'r AP~ATb J + k
Lr • + - ~ P ( T ) A T b (9)
In this equation, valid for cases (a), (b) and (c), the algebraic sign of AP t is assumed to be always positive and the signs of AT b and J may be positive or negative depending on whether they are proactive or counteractive with it. It is worth pointing out that in Eq. (9) three contributions to the flux appear. The existence of a coupling term, proportional to AptAT b, states that the flux cannot be obtained as a simple addition of two terms proportional to A p~ and ATb, respectively.
On the other hand, Eq. (9) may be simplified in the limits when only one of the externally imposed temperature or concentration differences is acting on the system. For instance, if one imposes the condi- tion AT b = 0, one has:
I 1 c b d A P t l A P ~ (10) j o = + k dc
where the upper index " o " in J means that the flux, in this case, is due to a concentration difference. It is worth pointing out that the concentration-driven wa- ter transfer through the membrane causes a heat flux in the same direction. As a consequence, a trans- membrane temperature difference is created, which gives rise to a decrease in the water vapor pressure difference. This effect has been discussed by Men- gual et al. [10], and its influence will be commented in the section of Results and Discussion.
On the contrary, if one imposes the condition A p~ = 0, one has:
A P ° ( T ) L 7 gt= (11)
R~.Z where the upper index " t " in J means that the flux, in this case, is only due to a temperature difference.
Finally, the case of steady state will be consid- ered. This situation is obtained when the two thermo- dynamic forces act in opposite directions, and in such a way that their contributions cancel each other. This means that the transmembrane temperature dif- ference exactly counteracts the vapor pressure reduc- tion caused by the transmembrane concentration dif- ference. In this case, if one imposes the condition J = 0 in Eq. (9), the following relationship is reached:
2 LP° ( 7") rA T~ t AP~ '~t= (12)
2RT 2 _ L.rA T~t
where AT~ t is an arbitrarily chosen value of the bulk temperature difference and A p t ,St is its "equivalent" steady state bulk concentration contribution to the pressure difference. This magnitude Apt'st may be easily related to the corresponding steady state bulk concentration difference, Ac~, t, by means of thermo- dynamic tables. Obviously, the roles of AT~ t and A P~ '~t in Eq. (12) may be interchanged.
3. Experimental
3.1. Materials
Two commercial membranes have been studied: the TF-200, supplied by Gelman, and the FHLP, supplied by Millipore. These membranes are made of PTFE (polytetrafluorethylene), supported by a polypropylene net (in the case of the Gelman mem- brane) or by a polyethylene net (in the case of the Millipore membrane). Their principal characteristics, as specified by the manufacturer, are as follows: • TF-200: pore diameter 0.2 t~m; thickness 178
~m; empty volume fraction 80%. • FHLP: pore diameter 0.5 Ixm; thickness 175 p~m;
empty volume fraction 85%. The remaining materials employed in the experi-
ments were water and aqueous solutions of sodium chloride. Pure pro-analysis grade chemicals and pure water (deionized and distilled) were used.
3.2. Apparatuses and experimental method
Two experimental devices were used. Each one was essentially similar to those described previously
P. Godino et al. / Journal of Membrane Science 121 (1996) 83-93 87
TB TB
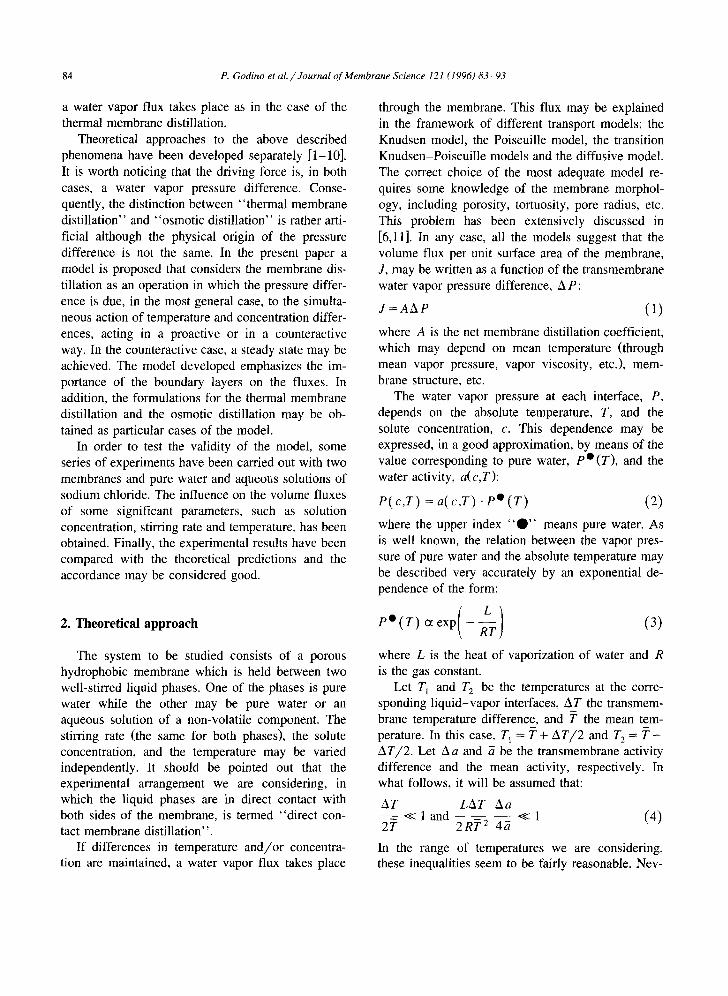
Fig. I. Experimental setup: M, membrane; S, magnetic stirrers; PM, propelling magnet; TB, thermostatic bath; R, reservoir: B, burette; T, thermometer.
in [8,10] (see Fig. 1). The central part of each one of the experimental devices is a cell, which basically consists of two equal cylindrical chambers having a length of 20.5 cm and made of stainless steel. The membrane was fixed between the chambers by means of a PVC holder. Three Viton O-rings were em- ployed to ensure there were no leaks in the whole assembly. The membrane surface area exposed to the flow was 2.75 × 10 -3 m 2.
The temperature requirements were set by con- necting each chamber, through the corresponding water jacket, to a different thermostat. In order to improve the uniformity of temperatures and concen- trations inside each chamber, the liquids were stirred by a chain-driven cell magnetic stirrer assembly. Temperatures were measured with platinum resis- tance thermometers placed near both sides of the membrane. Under these conditions, the temperature was constant within __+ 0.1°C. The solute concentra- tion was measured by means of standard chemical titration (Mohr titration). The maximum error in these measurements is +0.05 tool/1. The value of the volume flux was obtained, in each case, by adjusting the experimental data (volume flowing into the corresponding chamber versus time) to a linear function by a least squares procedure.
4. Results and discussion
For the sake of simplicity, in what follows the considered operation will be denoted TMD (thermal membrane distillation) or OMD (osmotic membrane distillation) when the water vapor pressure difference is obtained by means of an externally imposed tem- perature or concentration difference. When the two differences exist simultaneously, the operation will be denoted CMD (combined membrane distillation).
In [8,10,12,14,16], the phenomena TMD and OMD were studied through the same membranes employed in this work, There a conclusion was reached, the TMD fluxes are, in general, greater than the OMD fluxes, in the studied ranges. With this in mind, the measurements were made in two sets of experiments.
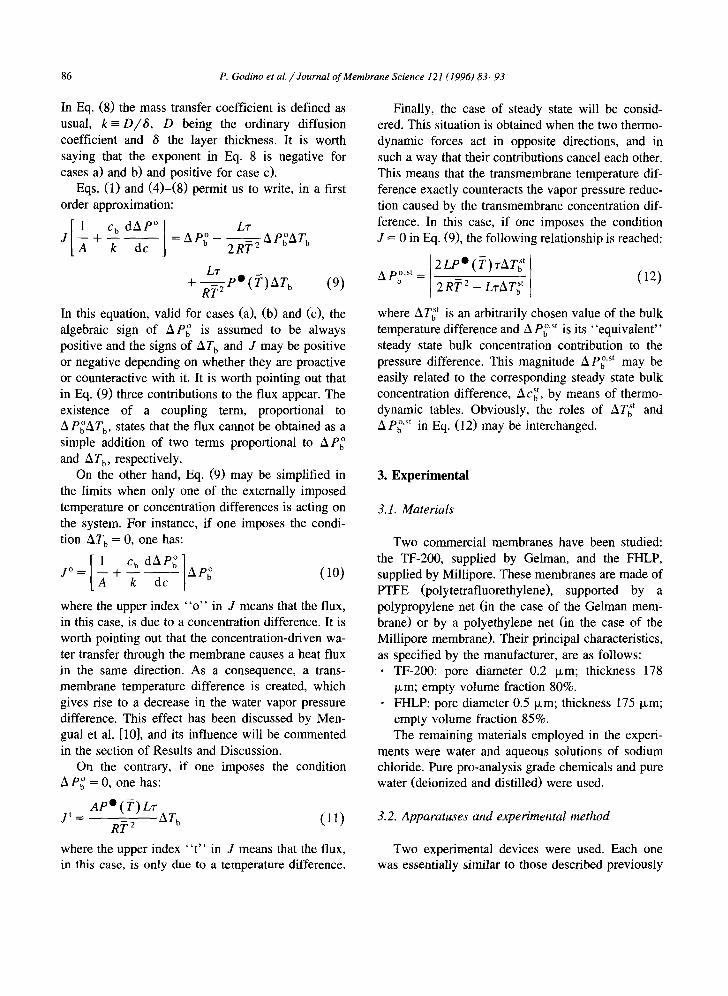
In the first set, the water flux through the mem- brane TF-200 was measured, in different experimen- tal conditions. The mean temperature was varied between 30 and 50°C, with steps of 5 K. The stirring rates were 50, 150, 250 and 350 rpm. The solute concentrations were 0, 1, 2, 3 and 5 mol/1. The bulk temperature difference was 0 or 6 K (proactive or counteractive with the concentration difference). The results appear in Figs. 2-10. Figs. 2-5 correspond to OMD experiments, and Figs. 6-10 correspond to TMD and CMD experiments.
t 8
15 t
12--
0 6 •
ii • " r i
0 2 4 6 Bulk concentration difference (rnof/0 Fig. 2. OMD flux through membrane TF-200 versus bulk concen- tration difference for 50 rpm stirring rate and various mean temperatures: T ( I ) 30°C, ( 0 ) 35°C, ( 0 ) 40°C, (A) 45°C, and ( . ) 50oc.

88 P. Godino et al. / Journal o f Membrane Science 121 (1996) 83-93
1.8
1.5
1.2
~o 0.9
0.6
0.3
0.0 "r i e i e I
0 2 4 Bulk concentrat ion di f ference (tool/I)
Fig. 3. OMD flux through membrane TF-200 versus bulk concen- tration difference for 150 rpm stirring rate and various mean temperatures: T ( I ) 30°C, (!~) 35°C, (0) 40°C, (A) 45°C, and ( , ) 50°c.
1.8
1 5 -
1 2 -
~o 0 9 ~ .
E
0.6
0.3
0.0 i i i i i
2 4 Bulk concentration difference (mol/I)
Fig. 5. OMD flux through membrane TF-200 versus bulk concen- tration difference for 350 rpm stirring rate and various mean temperatures: T ( I ) 30°C, (~) 35°C, (0) 40°C, (A) 45°(2, and (*) 50°C.
In the second set, which refers to the membrane FHLP, the steady states described by Eq. (12) were studied for a stirring rate 100 rpm, a mean tempera- ture 40°C and bulk temperature differences 4, 6, 8,
1.8
1.5
1.2
0.9
E
0.6
0.3
O0 = I i I i
0 2 4 6 Bu lk concentration difference (tool/I)
Fig. 4. OMD flux through membrane TF-200 versus bulk concen- tration difference for 250 rpm stirring rate and various mean temperatures: T ( I ) 30°C, (0) 35°C, (0) 40°C, (A) 45°C, and ( , ) 5ooc.
10 and 12 K. Each one of these temperature differ- ences was maintained between pure water and an aqueous solution with an initial NaC1 concentration of 5 mol / l . Then, the evolution towards the steady state (zero flow situation) was allowed. Finally, the corresponding concentration difference, Ac~ t, was measured and transformed into the corresponding pressure difference value, o st A Pb'. The results are displayed in Fig. 11.
The purposes of the first set of measurements are: (1) to study the influence of the parameters on the fluxes, (2) to quantify the coupling term, and (3) to calculate the net membrane distillation coefficient. The purposes of the second set are: (1) to study the steady states, from concentration measurements, and (2) to test the validity of Eq. (12). It is worth saying that each of the data appearing in Figs. 2-11 is affected by its corresponding error value, which has not been represented for reasons of simplicity. The quantitative importance of the errors may be appreci- ated by the following example: the value of the flux, with its estimated standard deviation, is: 1.50 _+ 0.03 X 10 -6 m / s , for the membrane TF-200; stirring rate 250 rpm; mean temperature 35°C; solute concentra- tion 3 mol/1 and bulk temperature difference 6 K. In what follows, we are going to discuss the results, as
P. Godino et al. / Journal o f Membrane Science 121 (1996) 8 3 - 9 3 89
~E 1 ,-9 o v
u. o
i I I t i
2 4
Bulk concentration difference (mol/I)
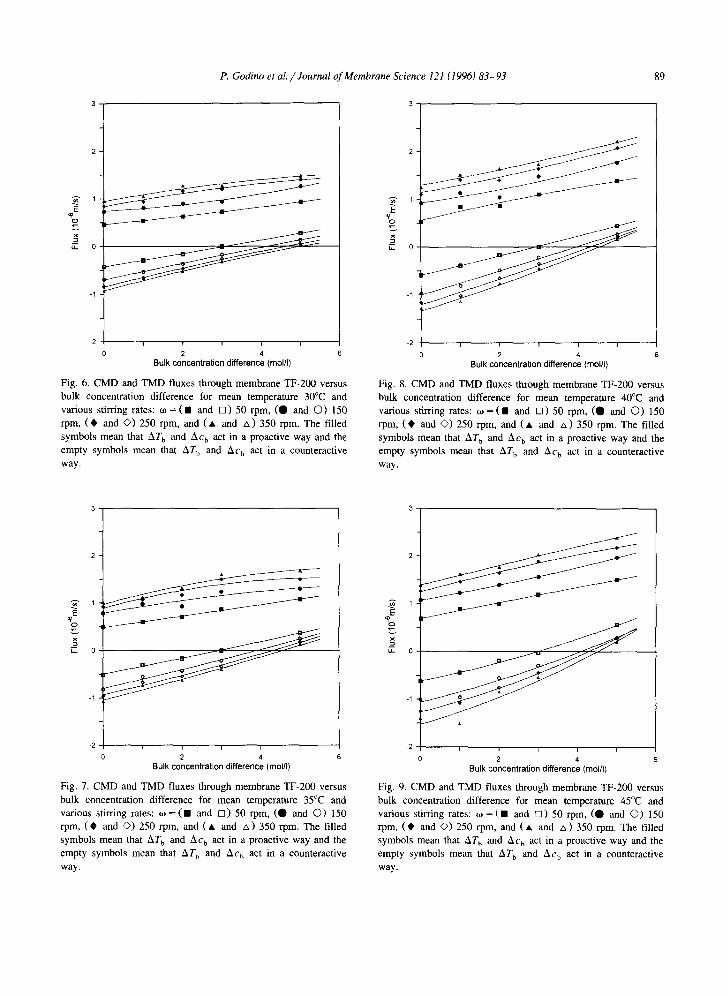
Fig. 6. CMD and TMD fluxes through membrane TF-200 versus bulk concentration difference for mean temperature 30°C and various stirring rates: to =(HI and [3) 50 rpm, (O and O) 150 rpm, ( • and O) 250 rpm, and ( • and A ) 350 rpm. The filled symbols mean that AT b and Ac b act in a proactive way and the empty symbols mean that AT b and Ac b act in a counteractive way.
x
v
,'7 0
- 2 I I I I I
2 4
Bulk concentration difference (tool/I)
Fig. 8. CMD and TMD fluxes through membrane TF-200 versus bulk concentration difference for mean temperature 40°C and various stirring rates: t o=(@ and n ) 50 rpm, (O and O) 150 rpm, ( • and O) 250 rpm, and ( • and A ) 350 rpm. The filled symbols mean that AT b and Ac b act in a proactive way and the empty symbols mean that AT b and Ac u act in a counteractive way.
,q
I I I I I
2 4 Bulk concentration difference (mol/I)
Fig. 7. CMD and TMD fluxes through membrane TF-200 versus bulk concentration difference for mean temperature 35°C and various stirring rates: to =(11 and [3) 50 rpm, (O and O) 150 rpm, ( • and O) 250 rpm, and ( • and zx) 350 rpm. The filled symbols mean that AT b and Ac b act in a proactive way and the empty symbols mean that AT h and Ac b act in a counteractive way.
E /
u- 0
-1
~ 2 i i I i (
0 2 4 Bulk concentration difference (tool/I)
Fig. 9. CMD and TMD fluxes through membrane TF-200 versus bulk concentration difference for mean temperature 45°C and various stirring rates: t o = ( l l and [3)50 rpm, (O and O) 150 rpm, ( • and O) 250 rpm, and ( • and A ) 350 rpm. The filled symbols mean that AT b and Ac b act in a proactive way and the empty symbols mean that AT b and Ac b act in a counteractive way.

9 0 P. Godino et a l . / Journal of Membrane Science 121 (1996) 83-93
• jf~./ E
, 7 0
-1 D
-2 I I I I I
2 4
Bulk concentration difference (mol/I)
Fig. 10. CMD and TMD fluxes through membrane TF-200 versus bulk concentration difference for mean temperature 50°C and various stirring rates: to =(11 and D) 50 rpm, ( 0 and O) 150 rpm, ( • and ~) 250 rpm, and ( • and zx ) 350 rpm. The filled symbols mean that AT b and Ac b act in a proactive way and the empty symbols mean that AT b and Ac b act in a counteractive way.
well as to check the validity of the equations ob- tained in the theoretical section.
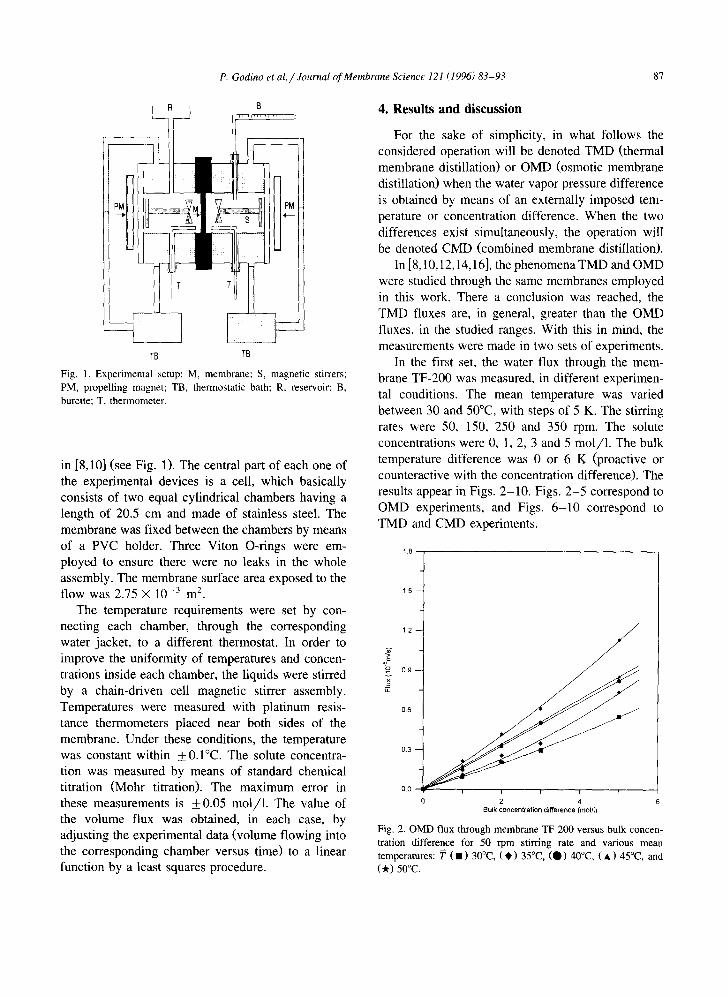
In Figs. 2 -5 , the OMD fluxes are displayed as function of the externally imposed bulk concentra- tion difference. As it was already said in the theoreti- cal section, there is a transmembrane temperature difference created by the concentration-driven water transfer, in the OMD experiments. In [10], a method was proposed to quantify this effect in terms of a bulk temperature difference. Under the present ex- perimental conditions this temperature difference may be estimated in about 0.3 K, in the most un- favourable case, which is lower than the externally imposed temperature difference (_+6 K). On the other hand, a visual inspection shows that the flux increases with mean temperature, stirring rate and bulk concentration difference, according to the re- sults of [ 10].
In Figs. 6 -10 , the values corresponding to c b = 0 mol /1 refer to TMD experiments through the mem- brane TF-200. A visual inspection shows that the magnitudes of the fluxes corresponding to positive and negative values of AT b are similar to one an-
other, although they are not equal. The difference between the values may be influenced by the spatial asymmetry of the membrane. In all the cases, it is possible to notice an increase of the flux with stirring rate and mean temperature, according with the re- sults in the bibliography [6,12].
The remaining values in Figs. 6 - 1 0 (c u = 1-5 mol /1) refer to CMD experiments, carried out with the different solutions studied. The flux is positive when the two thermodynamic forces act in the same direction, which is an expected result. When the two forces act in counteractive manner, the flux is nega- tive for c b = 1, 2 and 3 mol /1 (in these cases the " the rma l " contribution to the flux is larger than the " o s m o t i c " one), or positive for c b = 5 mol /1 (in this case the " o s m o t i c " contribution to the flux is larger than the " the rma l " one). In all the cases, the flux increases with stirring rate, mean temperature and bulk concentration difference.
One of the predictions in the theoretical section is the presence, in Eq. (9), of a contribution to the flux proportional to Ap~AT b. This contribution is nega- tive when the two thermodynamic forces act in the same direction and positive when the forces act in opposite directions. This can be explained if one considers that " same direct ion" means concentra- tion depletion at membrane interface at solution side, with respect to the pure " o s m o t i c " case and that "oppos i te direct ions" means concentration increase at membrane interface at solution side, with respect to the pure " o s m o t i c " case. This behaviour may be confirmed if one compares the CMD fluxes with the corresponding addition or subtraction of the TMD and OMD fluxes, measured in the same experimental conditions. The procedure is as follows:
The OMD fluxes are displayed in Figs. 2 -5 . The TMD fluxes are displayed in Figs. 6 - 1 0 (values corresponding to c b = 0 mo l / l ) . The addition of the OMD and TMD fluxes (for given values of mean temperature and stirring rate) must be compared with the corresponding CMD flux, which is displayed in the section of the Figs. 6 - 1 0 that corresponds to AT b = 6 K. In the same way, the subtraction be- tween those values must be compared with the CMD flux, which appears in the section of the Figs. 6 - 1 0 that corresponds to AT b = - 6 K.
As an example of this kind of calculations, Table 1 shows the results in some particular cases. The
P. Godino et al. / Journal of Membrane Science 121 (1996) 83-93 91
Table 1 Fluxes J and jo -t- j t (10 6 m/s), as a function of mean tempera- ture. Membrane TF-200; AT b=6 K; w=250 rpm; Ac b=5 mol/l
Synergistic ~T (°C)
30 35 40 45 50
J 1.39 1.50 2.07 2.18 2.77 jo + j t 1.51 1.82 2.21 2.50 3.24
Antagonistic T (°C)
30 35 40 45 50
J 0.05 0.18 0.19 0.28 0.33 jo _ j t -0.18 -0.06 -0.05 -0.01 -0.12
second and fifth files of this table reproduce the values of the CMD flux, obtained when the thermo- dynamic forces act in the same direction and in the opposite directions, respectively. The data appearing in the third and sixth files have been obtained by
addition and subtraction, respectively, of the OMD and TMD fluxes. The second and third files must be compared with one another, and the same must be done with the fifth and sixth files. It may be ob- served that the CMD fluxes of the second file are lower than the data appearing in the third file and that the CMD fluxes of the fifth file are higher than the values of the sixth file. In this respect the accor-
dance between the predicted theoretical trend and the experimental results may be considered good. On the other hand, the difference between each one of the measured values of the CMD flux and the value obtained from the addition or subtraction of the TMD and OMD data may be considered a measure of the coupling term.
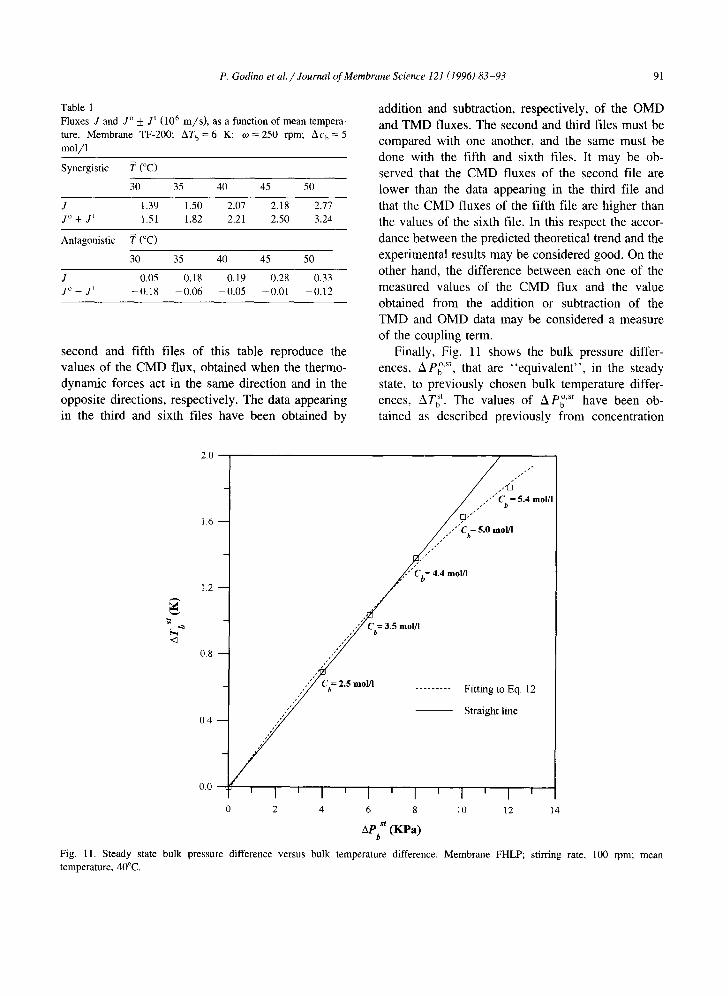
Finally, Fig. 11 shows the bulk pressure differ- o,st ences, A Pb , that are "equiva len t" , in the steady
state, to previously chosen bulk temperature differ- ences, AT~ t. The values of A P~ 'St have been ob-
tained as described previously from concentration
20
= 5 .4 m o l / I
1 6 / . ,-"Cb= 5.0 mol~
12 / / C b = 4.4 mol/l
/
0.4 " - Straight hne
/ o.o ' I ' I ' I ' I ' I ' I '
0 2 4 6 8 10 12 14
AP S (KPa)
Fig. 11. Steady state bulk pressure difference versus bulk temperature difference. Membrane FHLP; stirring rate, 100 rpm; mean temperature, 40°C.
92 P. Godino et al. / Journal of Membrane Science 121 (1996) 83-93
measurements. The data displayed vary between the concentrations 2.5 mol/1 (corresponding to a bulk temperature difference of 4 K) to 5.4 mol/1 (corre- sponding to a bulk temperature difference of 12 K). It is worth mentioning that Eq. (12) predicts a devia- tion from linearity between A P~ 'st and AT~ t, due to the presence of the contribution " -LTAT~ t'' in the denominator of the fraction. This contribution gives rise to a depletion of the concentration difference (or the pressure difference). This depletion can be ob- served especially at the biggest concentration differ- ences (see the dotted line in Fig. 11, which has been obtained by fitting the experimental data to Eq. (12)). In other words, the existence of the coupling term may be shown by the deviation from linearity of the dotted line in Fig. 11.
On the other hand, the continuous lines in Figs. 6-10 correspond to the polynomial fitting of the experimental points. The intercepts of the fitted curves with the horizontal axis (for negative values of the bulk temperature difference) correspond to the steady states described in the theoretical section. In other words, these intercepts are the bulk concentra- tion differences which may be considered "equiv- alent" to the bulk temperature difference 6 K, at the corresponding values of stirring rate and mean tem- perature. A visual inspection of the figures allows us to arrive at some rough quantitative estimations: (1) the bulk concentration difference that is "equivalent" to a bulk temperature difference of 6 K lies between 3 and 5 mol/1; (2) the value of this "equivalent" bulk concentration difference increases when the stirring rate increases, but is practically independent on mean temperature. For example, in the particular case of a mean temperature of 40°C, the bulk con- centration difference "equivalent" to 6 K, in steady state, is about 3 mol / l (for 50 rpm stirring rate) and about 4 mol/1 (for 150 rpm stirring rate). These values may be compared with the ones represented in Fig. 11 (3.5 mol/1 for 100 rpm stirring rate). The agreement between these values may be considered good.
concentration differences acting simultaneously, in a proactive or a counteractive way.
The theoretical approach shows the existence of a coupling term between temperature and concentra- tion differences. This term may be evaluated in different experimental conditions.
The steady states have been obtained from con- centration measurements and from flux measure- ments. The proposed model allows us to describe them adequately.
6. List of symbols
a
A
c D J L P R T
activity net membrane distillation coefficient (m s -2 kg -1)
molar concentration (mol 1-1 ) diffusion coefficient (m 2 s -1) volume flux (m 3 m - 2 s- l ) heat of vaporization of water (J mol- 1 ) pressure (Pa) gas constant (J mol-1 K - l ) temperature (K)
6.1. Greek symbols
layer thickness (m) mass transfer coefficient (m s - l ) temperature polarization coefficient
6.2. Superscripts
• pure o osmotic t thermal st steady state
6.3. Subscripts
b at the bulk phase m at the membrane surface
5. Conclusions
A model is presented that permits us to study membrane distillation processes with temperature and
Acknowledgements
Economical support from the CICYT is acknowl- edged.

P. Godino et al. / Journal of Membrane Science 121 (1996) 83-93 93
References
[1] M.E. Findley, Vaporization through porous membranes, Ind. Eng. Chem., Process Des. Dev., 6 (1967) 226.
[2] E. Drioli and Y. Wu, Membrane distillation: An experimental study, Desalination 53 (1985) 339.
[3] T.J. van Gassel and K. Schneider, Membranes and Mem- brane Processes, Plenum Press, New York, 1986, p. 343.
[4] G.C. Sarti and C. Gostoli, in Membranes and Membrane Processes, Plenum Press, New York, 1986, p. 349.
[5] S. Kimura, S. Nakao and S.I. Shimatani, Transport phenom- ena in membrane distillation, J. Membrane Sci., 33 (1987) 285.
[6] R.W. Schofield, A.G. Fane and C.J.D. Fell, Heat and mass transfer in membrane distillation, J. Membrane Sci., 33 (1987) 299.
[7] A.C.M. Franken, J.A.M. Nolten, M.H.V. Mulder, D. Barge- man and C.A. Smolders, Wetting criteria for the applicability of membrane distillation, J. Membrane Sci., 33 (1987) 315.
[8] L. Pefia, J.M. Ortiz de Zfirate and J.I. Mengual, Steady states in membrane distillation: Influence of membrane wetting, J. Chem. Soc., Faraday Trans., 89(24) (1993) 4333.
[9] R.A. Johnson, Osmotic Distillation, Workshop on Membrane Distillation, Rome, 1986.
[10] J.I. Mengual, J.M. Ortiz de ZSxate, L. Pefia and A. Vel~zquez, Osmotic distillation through porous hydrophobic membranes, J. Membrane Sci., 82 (1993) 129.
[11] R.W. Schofield, A.G. Fane and C.J.D. Fell, Gas and vapour transport through microporous membranes. I and II. Knud- sen-Poiseuille transition and membrane distillation, J. Mem- brane Sci., 53 (1990) 159.
[12] J.M. Ortiz de Zfirate, F. Garcla-Lrpez, and J.I. Mengual, Temperature polarization in non-isothermal mass transport through membranes, J. Chem. Soc., Faraday Trans. 86(16) (1990) 2891.
[13] R.W. Schofield, A.G. Fane, C.J.D. Fell and R. Macoun, Factors affecting flux in membrane distillation, Desalination, 77 (1990) 279.
[14] A. Vel~zquez and J.I. Mengual, Temperature polarization coefficients in membrane distillation, Ind. Eng. Chem. Res., 34(2) (1995) 585.
[15] E. Drioli, Y. Wu and V. Calabro, Membrane distillation in the treatment of aqueous solutions, J. Membrane Sci., 33 (1987) 277.
[16] J.M. Ortiz de Zfirate, F. Garc~a-L6pez and J.l. Mengual, Non-isothermal water transport through membranes, J. Mem- brane Sci., 56 (1991) 181.
Related Documents