RESEARCH ARTICLE Melanoma Cell Adhesion and Migration Is Modulated by the Uronyl 2-O Sulfotransferase Katerina Nikolovska 1,2 , Dorothe Spillmann 3 , Jo ¨ rg Haier 4 , Andrea Lada ´ nyi 5 , Christian Stock 2 , Daniela G. Seidler 1,2 * 1 Institute of Physiological Chemistry and Pathobiochemistry, University of Mu ¨ nster, Mu ¨ nster, Germany, 2 Centre for Internal Medicine, Department of Gastroenterology, Hepatology and Endocrinology, Hannover Medical School, Hannover, Germany, 3 Department of Medical Biochemistry and Microbiology, Biomedical Center, Uppsala University, Uppsala, Sweden, 4 Comprehensive Cancer Center Mu ¨ nster, University Hospital Mu ¨ nster, Mu ¨ nster, Germany, 5 Department of Surgical and Molecular Pathology, National Institute of Oncology, Budapest, Hungary * [email protected] Abstract Although the vast majority of melanomas are characterized by a high metastatic potential, if detected early, melanoma can have a good prognostic outcome. However, once metasta- sised, the prognosis is bleak. We showed previously that uronyl-2-O sulfotransferase (Ust) and 2-O sulfation of chondroitin/dermatan sulfate (CS/DS) are involved in cell migration. To demonstrate an impact of 2-O sulfation in metastasis we knocked-down Ust in mouse mela- noma cells. This significantly reduced the amount of Ust protein and enzyme activity. Fur- thermore, in vitro cell motility and adhesion were significantly reduced correlating with the decrease of cellular Ust protein. Single cell migration of B16V shUst(16) cells showed a decreased cell movement phenotype. The adhesion of B16V cells to fibronectin depended on α5β1 but not αvβ3 integrin. Inhibition of glycosaminoglycan sulfation or blocking fibro- blast growth factor receptor (FgfR) reduced α5 integrin in B16V cell lines. Interestingly, FgfR1 expression and activation was reduced in Ust knock-down cells. In vivo, pulmonary metastasis of B16V shUst cells was prevented due to a reduction of α5 integrin. As a proof of concept UST knock-down in human melanoma cells also showed a reduction in ITGa5 and adhesion. This is the first study showing that Ust, and consequently 2-O sulfation of the low affinity receptor for FgfR CS/DS, reduces Itga5 and leads to an impaired adhesion and migration of melanoma cells. Introduction A critical event in tumorigenesis of melanoma is the conversion from a primary tumor into an aggressive, metastasizing tumor. Tumor metastasis is a complex process involving its stroma, cell migration and invasion. Cell surface glycans, especially proteoglycans are involved in dif- ferent stages of metastasis [1, 2]. Proteoglycans are proteins covalently modified by a linear gly- cosaminoglycan (GAG) chain composed of repeating disaccharide units of an amino sugar and uronic acid [3]. Physiologically, GAGs are involved in multiple cellular functions, such as PLOS ONE | DOI:10.1371/journal.pone.0170054 January 20, 2017 1 / 20 a1111111111 a1111111111 a1111111111 a1111111111 a1111111111 OPEN ACCESS Citation: Nikolovska K, Spillmann D, Haier J, Lada ´nyi A, Stock C, Seidler DG (2017) Melanoma Cell Adhesion and Migration Is Modulated by the Uronyl 2-O Sulfotransferase. PLoS ONE 12(1): e0170054. doi:10.1371/journal.pone.0170054 Editor: Nikos K Karamanos, University of Patras, GREECE Received: August 30, 2016 Accepted: December 28, 2016 Published: January 20, 2017 Copyright: © 2017 Nikolovska et al. This is an open access article distributed under the terms of the Creative Commons Attribution License, which permits unrestricted use, distribution, and reproduction in any medium, provided the original author and source are credited. Data Availability Statement: All relevant data are within the paper and its Supporting Information files. Funding: This work was financially supported by the German Research Foundation (SE1431/3-1) to DGS, German Cancer Aid (#111262) to DGS and CS, and the German Research Foundation - GRK 1549 International Research Training Group ‘Molecular and Cellular GlycoSciences’ to KN. Competing Interests: The authors have declared that no competing interests exist.

Welcome message from author
This document is posted to help you gain knowledge. Please leave a comment to let me know what you think about it! Share it to your friends and learn new things together.
Transcript
RESEARCH ARTICLE
Melanoma Cell Adhesion and Migration Is
Modulated by the Uronyl 2-O Sulfotransferase
Katerina Nikolovska1,2, Dorothe Spillmann3, Jorg Haier4, Andrea Ladanyi5,
Christian Stock2, Daniela G. Seidler1,2*
1 Institute of Physiological Chemistry and Pathobiochemistry, University of Munster, Munster, Germany,
2 Centre for Internal Medicine, Department of Gastroenterology, Hepatology and Endocrinology, Hannover
Medical School, Hannover, Germany, 3 Department of Medical Biochemistry and Microbiology, Biomedical
Center, Uppsala University, Uppsala, Sweden, 4 Comprehensive Cancer Center Munster, University Hospital
Munster, Munster, Germany, 5 Department of Surgical and Molecular Pathology, National Institute of
Oncology, Budapest, Hungary
Abstract
Although the vast majority of melanomas are characterized by a high metastatic potential, if
detected early, melanoma can have a good prognostic outcome. However, once metasta-
sised, the prognosis is bleak. We showed previously that uronyl-2-O sulfotransferase (Ust)
and 2-O sulfation of chondroitin/dermatan sulfate (CS/DS) are involved in cell migration. To
demonstrate an impact of 2-O sulfation in metastasis we knocked-down Ust in mouse mela-
noma cells. This significantly reduced the amount of Ust protein and enzyme activity. Fur-
thermore, in vitro cell motility and adhesion were significantly reduced correlating with the
decrease of cellular Ust protein. Single cell migration of B16VshUst(16) cells showed a
decreased cell movement phenotype. The adhesion of B16V cells to fibronectin depended
on α5β1 but not αvβ3 integrin. Inhibition of glycosaminoglycan sulfation or blocking fibro-
blast growth factor receptor (FgfR) reduced α5 integrin in B16V cell lines. Interestingly,
FgfR1 expression and activation was reduced in Ust knock-down cells. In vivo, pulmonary
metastasis of B16VshUst cells was prevented due to a reduction of α5 integrin. As a proof of
concept UST knock-down in human melanoma cells also showed a reduction in ITGa5 and
adhesion. This is the first study showing that Ust, and consequently 2-O sulfation of the low
affinity receptor for FgfR CS/DS, reduces Itga5 and leads to an impaired adhesion and
migration of melanoma cells.
Introduction
A critical event in tumorigenesis of melanoma is the conversion from a primary tumor into an
aggressive, metastasizing tumor. Tumor metastasis is a complex process involving its stroma,
cell migration and invasion. Cell surface glycans, especially proteoglycans are involved in dif-
ferent stages of metastasis [1, 2]. Proteoglycans are proteins covalently modified by a linear gly-
cosaminoglycan (GAG) chain composed of repeating disaccharide units of an amino sugar
and uronic acid [3]. Physiologically, GAGs are involved in multiple cellular functions, such as
PLOS ONE | DOI:10.1371/journal.pone.0170054 January 20, 2017 1 / 20
a1111111111
a1111111111
a1111111111
a1111111111
a1111111111
OPENACCESS
Citation: Nikolovska K, Spillmann D, Haier J,
Ladanyi A, Stock C, Seidler DG (2017) Melanoma
Cell Adhesion and Migration Is Modulated by the
Uronyl 2-O Sulfotransferase. PLoS ONE 12(1):
e0170054. doi:10.1371/journal.pone.0170054
Editor: Nikos K Karamanos, University of Patras,
GREECE
Received: August 30, 2016
Accepted: December 28, 2016
Published: January 20, 2017
Copyright: © 2017 Nikolovska et al. This is an open
access article distributed under the terms of the
Creative Commons Attribution License, which
permits unrestricted use, distribution, and
reproduction in any medium, provided the original
author and source are credited.
Data Availability Statement: All relevant data are
within the paper and its Supporting Information
files.
Funding: This work was financially supported by
the German Research Foundation (SE1431/3-1) to
DGS, German Cancer Aid (#111262) to DGS and
CS, and the German Research Foundation - GRK
1549 International Research Training Group
‘Molecular and Cellular GlycoSciences’ to KN.
Competing Interests: The authors have declared
that no competing interests exist.
cell–matrix, cell–cell and ligand–receptor interactions. GAGs such as heparin/heparan sulfate
(HS) or chondroitin/dermatan sulfate (CS/DS) can act as low affinity receptor for the biologi-
cal activity of fibroblast growth factors (FGFs) [1, 4, 5] suggesting that CS/DS might have
important regulatory functions [6–8]. CS/DS are galactosaminoglycans composed of N-
acetylgalactosamine (GalNAc) and either D-glucuronic acid (D-GlcUA) or L-iduronic acid (L-
IdoUA). The inversion of D-GlcUA to L-IdoUA occurs on the polymer level by the chondroi-
tin-glucuronate C5-epimerase (EC 5.1.3.19) (DS-epimerase) [7], first described as SART2, a
protein of unknown function over-expressed in cancer cells [9]. The microheterogeneity of
CS/DS depends on the presence of (-4GlcUAβ1-3GalNAcβ1-) and (-4IdoUAα1-3GalNAcβ1-)
which can be differentially sulfated at C4, C6 (GalNAc) and/or C2 (D-GlcUA/L-IdoUA) by spe-
cific sulfotransferases. The minor modification at C2 is introduced by uronyl 2-O sulfotrans-
ferase (UST (no EC number) which transfers a sulfate group from 3’-phosphadenosine-
5-phosphosulfate. UST is encoded by only one gene (UST) [10]. There is evidence that GAG
structures are altered during metastasis of melanoma cells due to up-regulation of CS/DS-
proteoglycans [2, 11, 12]. Notably, melanoma derived GAGs display a shift from HS and DS to
CS in which CS contains high amounts of GlcUA-GalNAc(6S) (ΔdiCS-6S) and ΔdiCS-nS units
[13]. Enzymatic digestion of cell surface CS/DS reduces proliferation and invasion of cancer
cells [14]. The understanding of the mechanism of action of the sulfotransferases has recently
progressed by the discovery that the chondroitin 4-O sulfotransferase encoded by CHST11 is
involved in metastasis of breast cancer [15] and the chondroitin 4,6-O sulfotransferase
encoded by CHST15 in Lewis lung carcinoma (LCC) [16, 17]. However, Ust (small letters,
because mouse) has not been studied in this context. Interestingly, B16 melanoma cells have
1.5 times more DS compared to LCC [18] suggesting that 2-O sulfation of CS/DS might play
an important role in melanoma metastasis.
Previous reports showed that CS/DS affects cell adhesion and migration [7, 19] and that the
lack of L-IdoUA on the cell surface leads to an impaired directed cell migration [20]. In the
central nervous system, a tissue rich in CS-proteoglycans, over-sulfated CS are involved in
neuronal migration and axon regeneration [19, 21]. Recently, a reduction in CHST11 has been
reported for siRNA-mediated versican knock-down in a leiomyosarcoma smooth muscle cell
line [22]. Furthermore, the lack of Ust in skin of decorin-deficient mice impairs Fgf2 and Fgf7
binding and keratinocyte differentiation [23]. The occurrence of 2-O sulfated cell surface CS/
DS can tune the Fgf2-mediated effect on cell migration of CHO cells and fibroblasts [5, 23].
A critical strep in migration is cell adhesion which is mainly mediated via integrins, hetero-
dimeric cell surface receptors which mediate bidirectional signaling between cells and the
extracellular matrix (ECM). During cell migration the function of α5β1 integrin and αvβ3
integrin is tightly regulated [24]. The role of α5 integrin in cancer progression is controversial
[25]. α5 integrin also plays an important role in melanoma cell motility since its upregulation
enhances migration [26, 27]. This is further supported by findings that human carcinomas fre-
quently express high levels of α5β1 integrin which had been correlated with a more aggressive
carcinoma phenotype [25]. For B16F10 melanoma cells a direct correlation of the metastatic
potential and increased α5 integrin function was demonstrated [28].
The aim of the present study was to demonstrate that Ust is a critical regulator of melanoma
cell adhesion and motility in vitro and in vivo. Reduced expression of Ust could be linked to a
significant reduction of α5 integrin mRNA and protein in mouse and human melanoma cells.
Our in vivo data showed that B16VshUst(16) cells have a significantly reduced pulmonary meta-
static potential. Therefore, we can link for the first time Ust and CS/DS 2-O sulfation with α5
integrin expression, an important factor for metastasis of melanoma cells.
Ust and Adhesion
PLOS ONE | DOI:10.1371/journal.pone.0170054 January 20, 2017 2 / 20
Abbreviations: B16V, Mouse melanoma cell line;
CS/DS, chondroitin/dermatan sulfate; GAG,
glycosaminoglycan; MV3, human melanoma cell
line; Ust, uronyl 2-O sulfotransferase.
Materials and Methods
Materials
The following primary antibodies were used: UST D-20 (Santa Cruz Biotechnology), β-actin,
anti α5 integrin, anti β1 integrin (Millipore), Alexa Fluor1 647 anti-mouse CD49e, LEAF™ β1,
α5, αv and β3 integrin blocking antibodies (anti-mouse, BioLegend, California, USA) anti-
rabbit-HRP secondary antibody (GE Healthcare, UK). F-actin was visualized by Alexa488-
conjugated phalloidin (Invitrogen, USA). PD173074, fibronectin, mouse-Fgf2, chondroitin
6-sulfate (CS-6S) (Sigma Aldrich, Deisenhofen, Germany), chondroitin ABC lyase and hepari-
tinase mix (heparinase II/III, 4:1) (Amsbio, UK).
Cell culture
Murine melanoma (B16V) cells [29] were grown to confluence in bicarbonate buffered RPMI
1640 (Sigma) supplemented with 10% (v/v) bovine serum (FBS) at 37˚C in a humidified atmo-
sphere of 5% CO2. Of note, B16V cells display a black color due to their melanin. All experi-
ments were performed at passages where cells contained melanin. Human HT168-M1, HT199
[30] and MV3 [31] melanoma cells were grown in RPMI 1640 with 10% (v/v) FBS and cultured
as described before.
Knock-down of Ust in melanoma cells
B16V cells were stably transfected with shRNA-Ust(m) plasmid as a pool of 3 target-specific
lentiviral vector plasmids, each encoding 19–25 nt (plus hairpin) shRNAs designed to knock-
down Ust gene expression (Santa Cruz), following the manufacturer’s protocol. Control cells
were mock transfected with shRNA plasmid-A. Cells were selected with 10 μg/ml puromycin
(Santa Cruz) for 2 weeks and further subcloned by single cell limiting-dilution. For human
MV3 melanoma cells, UST siRNA and the respective scrambled siRNA were used according
to the manufacturer (Santa Cruz) and the cells were analyzed 48 h after transfection.
RNA extraction and quantitative real-time PCR
Cells were harvested using RNeasy Kit and RNA transcribed into cDNA using Omniscript RT
Kit (both Qiagen, Germany) as described before [32]. cDNA corresponding to 25 ng of total
RNA was used as a template. Expression levels of Ust (mouse and human), β-actin, ubiquitin(primer sequence: [23, 33]), Itgb1 (mItgb1-for 5`-CAA GAG GGC TGA AGA TTA CC-3`,
mItgb1-rev 5`-GGC ATC ACA GTT TTA TCC A-3`), Itgb3 (mItgb3-for 5`-TGG TGC TCAGAT GAG ACT TTG TC-3`, mItgb3-rev 5`-GAC TCT GGA GCA CAA TTG TCC TT-3`), Itga5
(mItga5-for 5`-TGCTAC CTC TCC ACA GAA AAC-3`, mItga5-rev 5`-GCC AGT CTT GGTGAA CTC AG-3`), ITGA5 (hITGA5-for 5`-TGG CCT TCG GTT TAC AGT CC-3`, hIT-
GA5-rev 5`- GGA GAG CCG AAA GGA AAC CA-3`), FgfR1 (mFgfR1-for 5`-CAA CAA GACAGT GGC CCT GGG-3`, mFgfR1-rev 5`-CCGTGC AAT AGA TAA TGA TC-3`) and FgfR3
(mFgfR2-rev 5`-CTCCAG ATA ATC TGG GGA AG3`, mFgfR3-for 5`- GGA GTT CCA CTGCAA GG-3`) were monitored by real-time PCR (ABI PRISM 7500, Applied Biosystems) using
MESA GREEN qPCR Kit (Eurogentec, Germany). Raw data were normalized to the geometric
mean of the control genes β-actin and ubiquitin. Two or more housekeeping genes lead to
much more accurate results [34].
Western blots analysis
~1x10⁶ melanoma cells were lysed using a lysis buffer (7 M Urea, 2 mM Thiourea, 40mM Tris-
HCl, 0,001% (w/v) bromphenol blue, 1% (w/v) ASB-14). Cell lysates were cleared through a
Ust and Adhesion
PLOS ONE | DOI:10.1371/journal.pone.0170054 January 20, 2017 3 / 20
0.2 μm filter, 20–40 μg of protein lysates were analyzed for Ust and α5 integrin. They were
visualized with enhanced chemiluminescence (Perkin-Elmer Life Sciences, USA) and moni-
tored with Fusion-SL 4.2 MP (PeqLab, Germany). Intensities were quantified as described pre-
viously [23, 33]. Of note, immune blots of the lysates before and after filtration led to the same
results. The influence of the cell surface sulfation was evaluated after 6h of cell treatment with
30 mM NaClO3 [5]. For blocking FgfR, cells were incubated for 6h with PD173074 (20 mM)
inhibitor as determined based on titration curves.
Sulfotransferase activity of B16 cell lines
Sulfotransferase reaction was carried out according to the manufacturer’s instructions in a
96-well plate using the universal sulfotransferase assay (R&D). Briefly, protein lysates (25–
200 μg) of B16V cell lines were incubated with 10 mM chondroitin 6-sulfate as substrate,
PAPS (R&D), and a coupling phosphatase as control. The color was developed with a Mala-
chite reagent for 20 min at room temperature and monitored at 620 nm with an ELISA reader.
A phosphate standard curve was used to determine the activity (OD/pmol). The specific activ-
ity was determined with the following equation: Specific activity (pmol/min)/μg) = S(OD/μg)
x CF(OD/pmol) / Time(min), where S is the slope of the line with the OD values of the sulfo-
transferase assay and CF the phosphate conversion factor (taken from the phosphate standard)
[5].
Characterization of cell surface chondroitin/dermatan sulfate and
heparan sulfates
GAGs were extracted from ~2x10⁷ cells and highly-sulfated cell surface CS/DS were released
by β-elimination and purified as described previously [23]. The HexUA content was deter-
mined using an m-hydroxydiphenyl reaction. Uronic acid was hydrolyzed in 80% sulfuric acid
containing tetraborate at 80˚C, incubated with m-hydroxydiphenyl (Sigma Aldrich) at room
temperature and measured at 540nm using heparin as standard [5].
10 μg CS/DS were digested with 10 mU of chondroitin ABC for 2h. The unsaturated disac-
charides were labeled with 5 μl of 0.1 M 2-Aminoacridon (AMAC) in 15% CH3COOH/DMSO
solution. After 10 min incubation at RT, 1 M NaBH3CN was added and the mixture was incu-
bated 16 h at 37˚C followed by fluorophore assisted carbohydrate electrophoresis (FACE).
AMAC-labeled disaccharides were separated on 30% Borate-polyacrylamid gel [35]. HS were
analyzed as described before. In order to analyze HS composition, cell pellets of B16V cell lines
were prepared as described previously. After enzymatic removal of CS/DS, the heparin lyase
I-, II- and III- digested GAGs were fractioned by RPIP-HPLC. The peaks were identified by
co-elution with standard HS disaccharides [5].
Proliferation of melanoma cells
3×10⁴ B16V cells/cm2 cells were seeded and cultured for 24h and starved for 16h prior to the
experiment. Experiments were performed in serum-free RPMI and proliferation was deter-
mined by BrdU incorporation for 16h (Cell Proliferation ELISA, Roche).
Cell adhesion assay
Static adhesion assays were performed with 1×10⁶ cells of the different B16V cell lines or MV3
cells in the presence of the fluorescent marker 2070-bis-(2 carboxyethyl)-5 carboxyfluorescein
acetoxy-methyl ester (Molecular Probes, USA) dissolved in DMSO as described previously
[32, 36]. Labeled cells were seeded in non- or fibronectin-coated (10 μg/ml) 96-well plates and
Ust and Adhesion
PLOS ONE | DOI:10.1371/journal.pone.0170054 January 20, 2017 4 / 20
incubated for 30 to 360 min at 37˚C. Cell adhesion to fibronectin was quantified after 1h
with an ELISA reader (Epoch, Bioteck) as previously described [32]. For further adhesion
experiments cells were preincubated with i) the different LEAF™ integrin blocking antibodies
(5 μg/ml) for 3h at 37˚C [33], ii) 6h pre-treatment with 30(mM NaClO3 or iii) enzymatic diges-
tion of cell surface HS and CS/DS with 4 mU heparitinase II/III and/or chondroitin ABC lyase
for 1h at 37˚C.
Wound scratch assay and migration on 3D collagen-rich matrices
1×10⁵ cells/cm2 of B16V cell lines were seeded in 12-well plates in RPMI medium and starved
overnight. An artificial wound was generated and cells were incubated with serum-free RPMI
medium (control) or RPMI supplemented with 10 ng/ml Fgf2 for 20h at 37˚C. Images were
captured at time points 0 and 20h, using a Zeiss Axiovert 100 microscope with AxioCam ICc1
camera. Cell migration was evaluated as described [5]. For each well 2–4 pictures were
acquired (n = 3 independent experiments).
Primary C57BL/6 skin fibroblasts were cultured for 10 days in 35 mm petri dishes with
1 mM L-ascorbate-2-phosphate (Sigma) to obtain a 3D ECM [37]. Confluent B16V cell lines
were detached from the culture dish with trypsin/EDTA, and B16V cell suspension in serum-
free RPMI1640 was added to the 10 day old and 24h serum-starved C57BL/6 fibroblast cul-
tures. Migration of cells was monitored, evaluated and calculated as described before [38].
Immunofluorescence analysis
1.2×10⁴ cells/cm2 cells were seeded in 8-wells slides (Zell-Kontakt, Germany) and incubated
for 24h. Cells were fixed with 4% PFA/PBS and then blocked with 3% BSA/PBS for 30 min.
Cell surface α5 integrins were incubated with primary antibody Alexa Fluor1 647 anti-mouse
CD49e for 1h. Actin cytoskeleton and nuclei were co-visualized with phalloidin-Alexa-488
and DAPI, respectively. Fluorescence was monitored by a confocal microscope (Zeiss AxioI-
mager M2) with 5–10 pictures per well (n = 3 independent experiments).
Phospho-FGFR1 cell-based phosphorylation ELISA
Mouse/Human/Rat Phospho-FGFR1/FGF Receptor 1 (Y654) Cell-Based Phosphorylation
ELISA Kit was used to determine the activation state of FgfR1 according to manufacturer
instructions (LifeSpan Biosciences). Briefly, 20.000 cells/well were seeded in a 96-well plate
and incubated overnight. Cells were starved overnight followed by treatment with PD173074
(20 nM) for 6 h to inhibit FgfR1. Cells were fixed with 4% PFA for 20 min, washed and blocked
for 1 h prior to the incubation with the first antibodies i) anti-FGFR1-Phospho-Y654, ii) anti-
FGFR1 or iii) anti-GAPDH overnight at 4˚C. HRP-conjugated secondary antibody was incu-
bated for 30 min and developed with a ready to use substrate. The enzyme activity was mea-
sured at OD450 nm (Epoch, Bioteck). GAPDH served as an internal positive control to
normalize the values. Following the colorimetric measurement the crystal violet whole-cell
staining method was used to determine cell density. After staining, the results were analyzed
by normalizing the absorbance values to cell amounts. pY654-FgfR1 was normalized to FgfR1
and GAPDH. The same protocol was applied for α5 integrin and normalized to GAPDH and
cell number.
FACS analysis of cell surface α5 integrin
1 x 10⁶ of B16V cell lines were seeded in a 6-well plate for 24 h. Cells were washed with cold
PBS, scraped from the plates and aliquoted to 1 x 10⁶ cells in 10 μl 2% FBS/PBS. To detect α5
Ust and Adhesion
PLOS ONE | DOI:10.1371/journal.pone.0170054 January 20, 2017 5 / 20
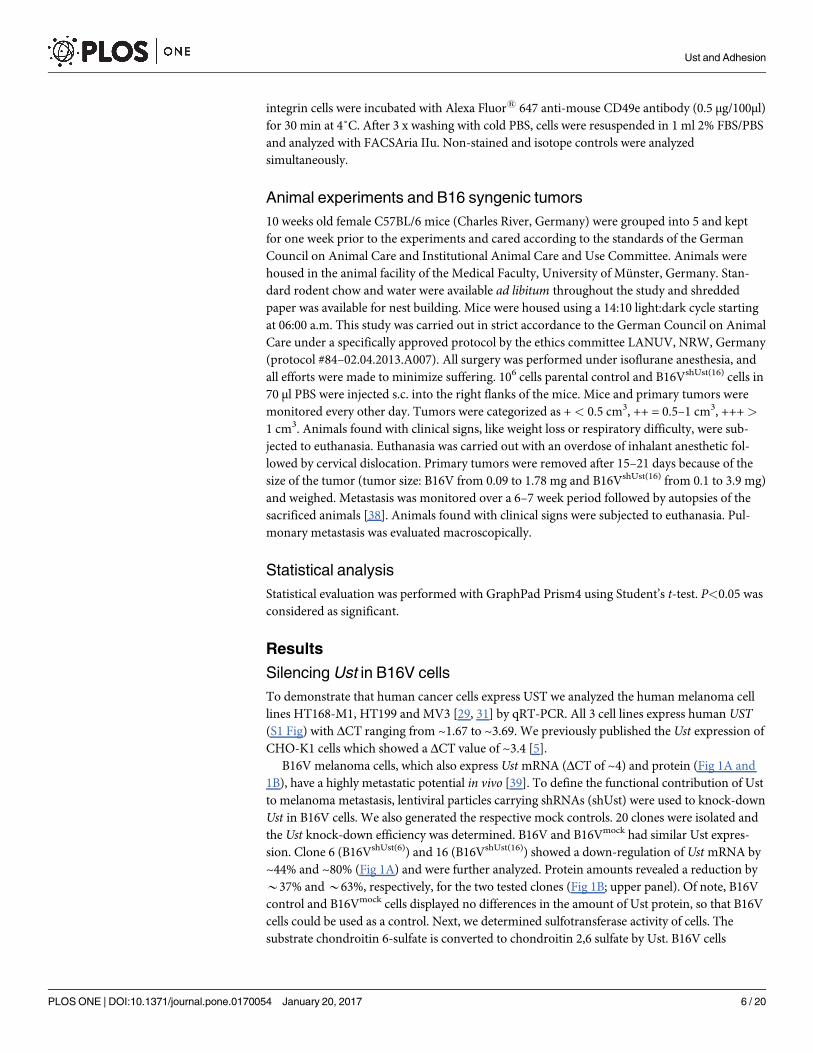
integrin cells were incubated with Alexa Fluor1 647 anti-mouse CD49e antibody (0.5 μg/100μl)
for 30 min at 4˚C. After 3 x washing with cold PBS, cells were resuspended in 1 ml 2% FBS/PBS
and analyzed with FACSAria IIu. Non-stained and isotope controls were analyzed
simultaneously.
Animal experiments and B16 syngenic tumors
10 weeks old female C57BL/6 mice (Charles River, Germany) were grouped into 5 and kept
for one week prior to the experiments and cared according to the standards of the German
Council on Animal Care and Institutional Animal Care and Use Committee. Animals were
housed in the animal facility of the Medical Faculty, University of Munster, Germany. Stan-
dard rodent chow and water were available ad libitum throughout the study and shredded
paper was available for nest building. Mice were housed using a 14:10 light:dark cycle starting
at 06:00 a.m. This study was carried out in strict accordance to the German Council on Animal
Care under a specifically approved protocol by the ethics committee LANUV, NRW, Germany
(protocol #84–02.04.2013.A007). All surgery was performed under isoflurane anesthesia, and
all efforts were made to minimize suffering. 106 cells parental control and B16VshUst(16) cells in
70 μl PBS were injected s.c. into the right flanks of the mice. Mice and primary tumors were
monitored every other day. Tumors were categorized as +< 0.5 cm3, ++ = 0.5–1 cm3, +++ >
1 cm3. Animals found with clinical signs, like weight loss or respiratory difficulty, were sub-
jected to euthanasia. Euthanasia was carried out with an overdose of inhalant anesthetic fol-
lowed by cervical dislocation. Primary tumors were removed after 15–21 days because of the
size of the tumor (tumor size: B16V from 0.09 to 1.78 mg and B16VshUst(16) from 0.1 to 3.9 mg)
and weighed. Metastasis was monitored over a 6–7 week period followed by autopsies of the
sacrificed animals [38]. Animals found with clinical signs were subjected to euthanasia. Pul-
monary metastasis was evaluated macroscopically.
Statistical analysis
Statistical evaluation was performed with GraphPad Prism4 using Student’s t-test. P<0.05 was
considered as significant.
Results
Silencing Ust in B16V cells
To demonstrate that human cancer cells express UST we analyzed the human melanoma cell
lines HT168-M1, HT199 and MV3 [29, 31] by qRT-PCR. All 3 cell lines express human UST(S1 Fig) with ΔCT ranging from ~1.67 to ~3.69. We previously published the Ust expression of
CHO-K1 cells which showed a ΔCT value of ~3.4 [5].
B16V melanoma cells, which also express Ust mRNA (ΔCT of ~4) and protein (Fig 1A and
1B), have a highly metastatic potential in vivo [39]. To define the functional contribution of Ust
to melanoma metastasis, lentiviral particles carrying shRNAs (shUst) were used to knock-down
Ust in B16V cells. We also generated the respective mock controls. 20 clones were isolated and
the Ust knock-down efficiency was determined. B16V and B16Vmock had similar Ust expres-
sion. Clone 6 (B16VshUst(6)) and 16 (B16VshUst(16)) showed a down-regulation of Ust mRNA by
~44% and ~80% (Fig 1A) and were further analyzed. Protein amounts revealed a reduction by
*37% and *63%, respectively, for the two tested clones (Fig 1B; upper panel). Of note, B16V
control and B16Vmock cells displayed no differences in the amount of Ust protein, so that B16V
cells could be used as a control. Next, we determined sulfotransferase activity of cells. The
substrate chondroitin 6-sulfate is converted to chondroitin 2,6 sulfate by Ust. B16V cells
Ust and Adhesion
PLOS ONE | DOI:10.1371/journal.pone.0170054 January 20, 2017 6 / 20
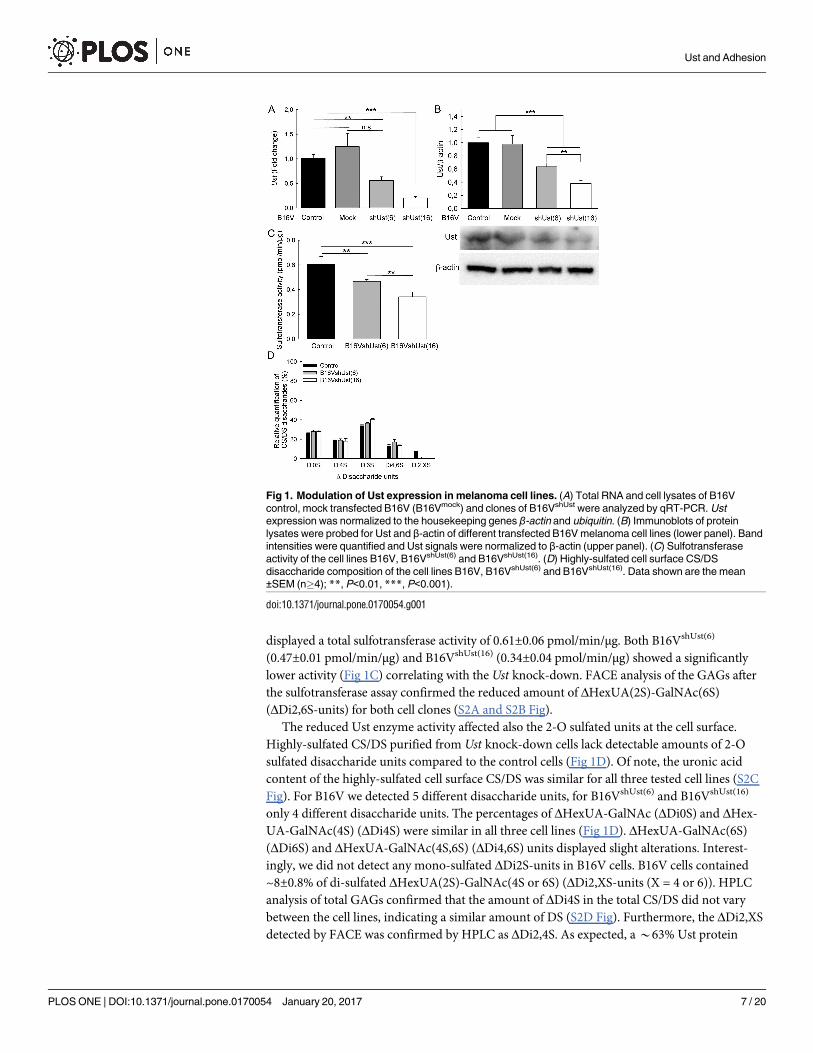
displayed a total sulfotransferase activity of 0.61±0.06 pmol/min/μg. Both B16VshUst(6)
(0.47±0.01 pmol/min/μg) and B16VshUst(16) (0.34±0.04 pmol/min/μg) showed a significantly
lower activity (Fig 1C) correlating with the Ust knock-down. FACE analysis of the GAGs after
the sulfotransferase assay confirmed the reduced amount of ΔHexUA(2S)-GalNAc(6S)
(ΔDi2,6S-units) for both cell clones (S2A and S2B Fig).
The reduced Ust enzyme activity affected also the 2-O sulfated units at the cell surface.
Highly-sulfated CS/DS purified from Ust knock-down cells lack detectable amounts of 2-O
sulfated disaccharide units compared to the control cells (Fig 1D). Of note, the uronic acid
content of the highly-sulfated cell surface CS/DS was similar for all three tested cell lines (S2C
Fig). For B16V we detected 5 different disaccharide units, for B16VshUst(6) and B16VshUst(16)
only 4 different disaccharide units. The percentages of ΔHexUA-GalNAc (ΔDi0S) and ΔHex-
UA-GalNAc(4S) (ΔDi4S) were similar in all three cell lines (Fig 1D). ΔHexUA-GalNAc(6S)
(ΔDi6S) and ΔHexUA-GalNAc(4S,6S) (ΔDi4,6S) units displayed slight alterations. Interest-
ingly, we did not detect any mono-sulfated ΔDi2S-units in B16V cells. B16V cells contained
~8±0.8% of di-sulfated ΔHexUA(2S)-GalNAc(4S or 6S) (ΔDi2,XS-units (X = 4 or 6)). HPLC
analysis of total GAGs confirmed that the amount of ΔDi4S in the total CS/DS did not vary
between the cell lines, indicating a similar amount of DS (S2D Fig). Furthermore, the ΔDi2,XS
detected by FACE was confirmed by HPLC as ΔDi2,4S. As expected, a *63% Ust protein
Fig 1. Modulation of Ust expression in melanoma cell lines. (A) Total RNA and cell lysates of B16V
control, mock transfected B16V (B16Vmock) and clones of B16VshUst were analyzed by qRT-PCR. Ust
expression was normalized to the housekeeping genes β-actin and ubiquitin. (B) Immunoblots of protein
lysates were probed for Ust and β-actin of different transfected B16V melanoma cell lines (lower panel). Band
intensities were quantified and Ust signals were normalized to β-actin (upper panel). (C) Sulfotransferase
activity of the cell lines B16V, B16VshUst(6) and B16VshUst(16). (D) Highly-sulfated cell surface CS/DS
disaccharide composition of the cell lines B16V, B16VshUst(6) and B16VshUst(16). Data shown are the mean
±SEM (n�4); **, P<0.01, ***, P<0.001).
doi:10.1371/journal.pone.0170054.g001
Ust and Adhesion
PLOS ONE | DOI:10.1371/journal.pone.0170054 January 20, 2017 7 / 20
reduction in B16VshUst(16) abolished 2-O sulfated units (Fig 1D). For *37% reduction of Ust
we could not detect 2-O sulfated units by FACE. This can be explained by the limit of detection
because the enzyme activity test showed also a ~40% less 2,6-O sulfation for B16VshUst(6) cells
(S2A and S2B Fig). HS analysis revealed no alterations in the disaccharide composition (S2E
Fig). These data show that we generated B16V melanoma cell lines with different levels of Ust
and 2-O sulfated CS/DS GAGs on the cell surface.
Functional characterization of the B16VshUst cells in vitro
Previously, the importance of cell surface DS [20] and 2-O sulfation [5, 23] for cell migration
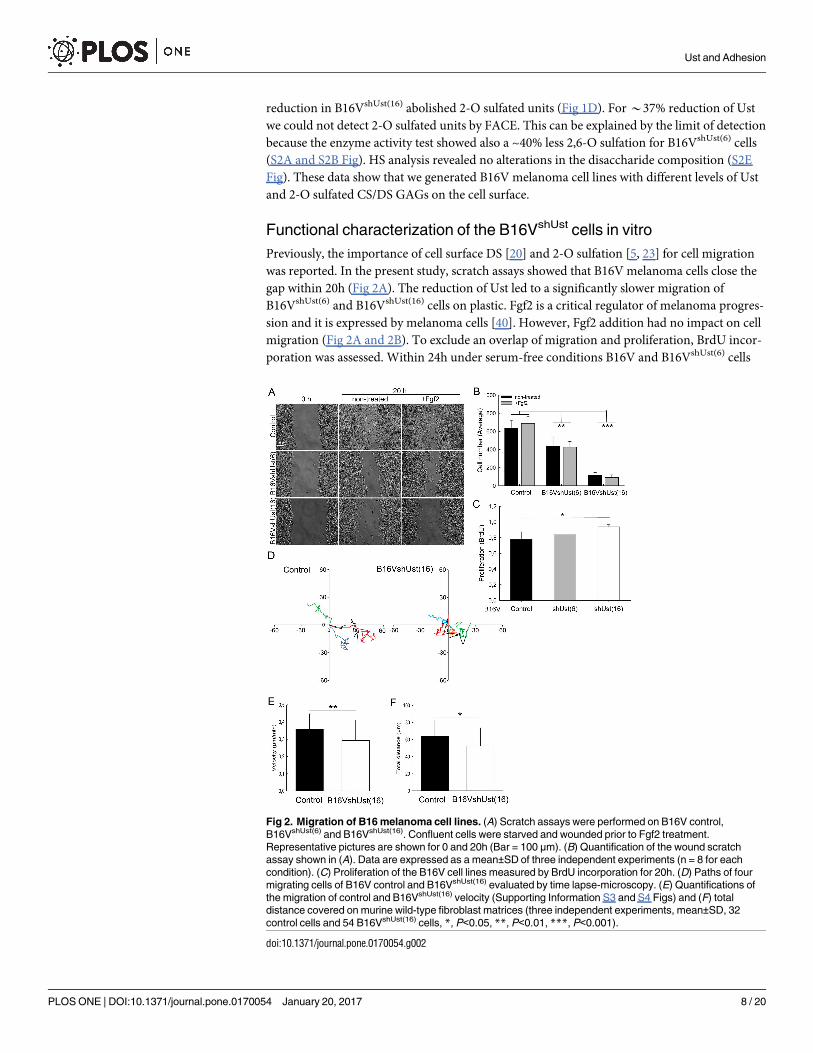
was reported. In the present study, scratch assays showed that B16V melanoma cells close the
gap within 20h (Fig 2A). The reduction of Ust led to a significantly slower migration of
B16VshUst(6) and B16VshUst(16) cells on plastic. Fgf2 is a critical regulator of melanoma progres-
sion and it is expressed by melanoma cells [40]. However, Fgf2 addition had no impact on cell
migration (Fig 2A and 2B). To exclude an overlap of migration and proliferation, BrdU incor-
poration was assessed. Within 24h under serum-free conditions B16V and B16VshUst(6) cells
Fig 2. Migration of B16 melanoma cell lines. (A) Scratch assays were performed on B16V control,
B16VshUst(6) and B16VshUst(16). Confluent cells were starved and wounded prior to Fgf2 treatment.
Representative pictures are shown for 0 and 20h (Bar = 100 μm). (B) Quantification of the wound scratch
assay shown in (A). Data are expressed as a mean±SD of three independent experiments (n = 8 for each
condition). (C) Proliferation of the B16V cell lines measured by BrdU incorporation for 20h. (D) Paths of four
migrating cells of B16V control and B16VshUst(16) evaluated by time lapse-microscopy. (E) Quantifications of
the migration of control and B16VshUst(16) velocity (Supporting Information S3 and S4 Figs) and (F) total
distance covered on murine wild-type fibroblast matrices (three independent experiments, mean±SD, 32
control cells and 54 B16VshUst(16) cells, *, P<0.05, **, P<0.01, ***, P<0.001).
doi:10.1371/journal.pone.0170054.g002
Ust and Adhesion
PLOS ONE | DOI:10.1371/journal.pone.0170054 January 20, 2017 8 / 20
showed similar proliferation rates, only B16VshUst(16) cells displayed a significant increase in
proliferation (Fig 2C). Therefore, we can conclude, that proliferation does not interfere with
migration. Since molecular analysis of clone 6 showed no significant but detectable changes,
we mostly show clone 16 in the following.
To get closer to an in vivo situation we used skin fibroblasts which were cultured for
10 days to deposit their own 3D ECM. Migration of B16V cell lines was monitored by time-
lapse microscopy (movies S3 and S4 Figs). Tracking single cells on the ECM showed that
B16VshUst(16) cells migrated significantly more slowly (0.30±0.12 μm/min) than controls
(0.35±0.09 μm/min) (Fig 2D and 2E). Furthermore, controls covered significantly longer dis-
tances than B16VshUst(16) cells (Fig 2F).
These results show that Ust and consequently CS/DS 2-O sulfation affect melanoma cell
migration. To clarify the altered migration of the B16VshUst cell lines we analyzed cell
adhesion.
Lack of Ust in B16V affects adhesion to fibronectin
Cell surface GAGs influence adhesion and migration of cancer cells [41]. Assessment of
B16VshUst cell adhesion to plastic showed a significant reduction when compared to control
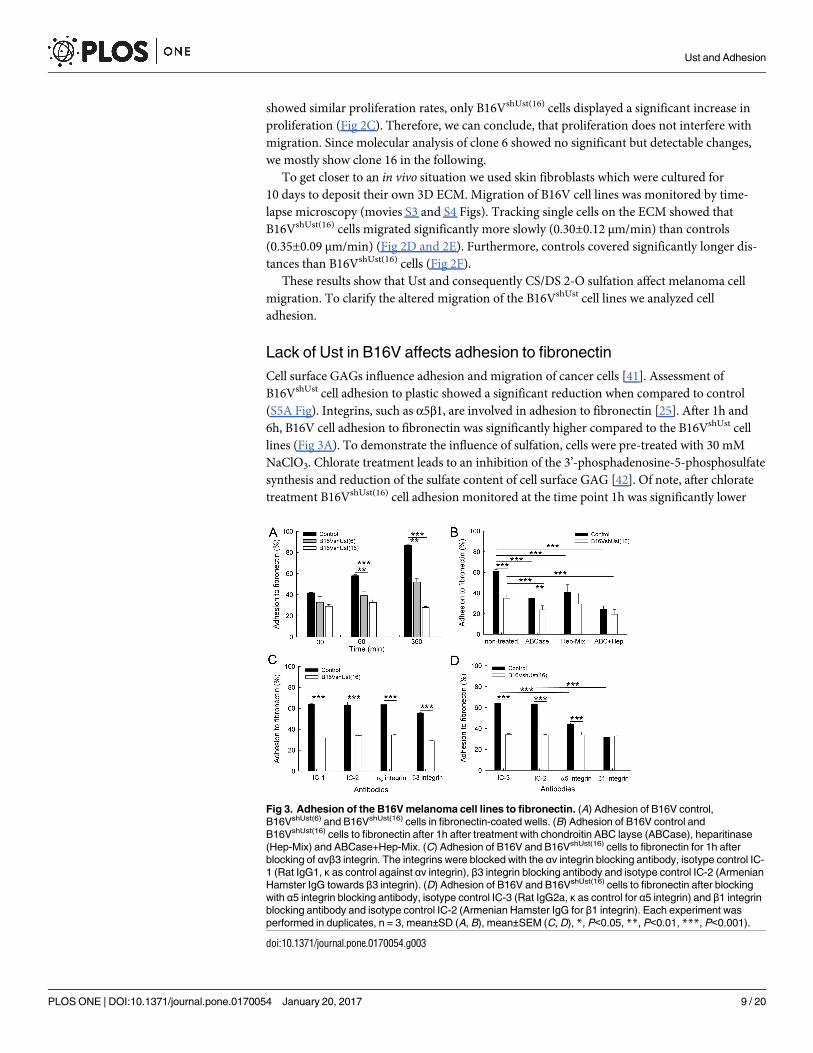
(S5A Fig). Integrins, such as α5β1, are involved in adhesion to fibronectin [25]. After 1h and
6h, B16V cell adhesion to fibronectin was significantly higher compared to the B16VshUst cell
lines (Fig 3A). To demonstrate the influence of sulfation, cells were pre-treated with 30 mM
NaClO3. Chlorate treatment leads to an inhibition of the 3’-phosphadenosine-5-phosphosulfate
synthesis and reduction of the sulfate content of cell surface GAG [42]. Of note, after chlorate
treatment B16VshUst(16) cell adhesion monitored at the time point 1h was significantly lower
Fig 3. Adhesion of the B16V melanoma cell lines to fibronectin. (A) Adhesion of B16V control,
B16VshUst(6) and B16VshUst(16) cells in fibronectin-coated wells. (B) Adhesion of B16V control and
B16VshUst(16) cells to fibronectin after 1h after treatment with chondroitin ABC layse (ABCase), heparitinase
(Hep-Mix) and ABCase+Hep-Mix. (C) Adhesion of B16V and B16VshUst(16) cells to fibronectin for 1h after
blocking of αvβ3 integrin. The integrins were blocked with the αv integrin blocking antibody, isotype control IC-
1 (Rat IgG1, κ as control against αv integrin), β3 integrin blocking antibody and isotype control IC-2 (Armenian
Hamster IgG towards β3 integrin). (D) Adhesion of B16V and B16VshUst(16) cells to fibronectin after blocking
with α5 integrin blocking antibody, isotype control IC-3 (Rat IgG2a, κ as control for α5 integrin) and β1 integrin
blocking antibody and isotype control IC-2 (Armenian Hamster IgG for β1 integrin). Each experiment was
performed in duplicates, n = 3, mean±SD (A, B), mean±SEM (C, D), *, P<0.05, **, P<0.01, ***, P<0.001).
doi:10.1371/journal.pone.0170054.g003
Ust and Adhesion
PLOS ONE | DOI:10.1371/journal.pone.0170054 January 20, 2017 9 / 20
compared to B16V cells (S5B Fig). To narrow down the type of GAGs involved in adhesion, cell
surface CS/DS was digested with chondroitin ABC lyase and HS with heparitinase [5]. Enzy-
matic digestion of CS/DS or HS led to a significantly reduced adhesion of B16V cells compared
to the non-treated cells after 1h. Upon digestion of cell surface CS/DS (ABCase), but not HS,
we observed a significant difference between control and B16VshUst(16) cells. Digestion of both
CS/DS (ABCase) and HS (Hep-Mix) reduced adhesion of both cell types (Fig 3B). To determine
which integrin dimer is responsible for the impaired adhesion of the B16VshUst(16) cells, we
used specific blocking antibodies for αvβ3 and α5β1 integrin and the respective isotype con-
trols. Blocking of αv or β3 integrin had no impact on the adhesion of either B16V cells or
B16VshUst(16) cells to fibronectin when cells were compared to their isotype treated controls or
the non-treated cells (Fig 3C). In contrast, blocking of α5 or β1 integrin significantly reduced
adhesion of B16V to fibronectin compared to isotype treated controls or the non-treated cells
(Fig 3D). Interestingly, B16VshUst(16) cells showed still basal adhesion compared to isotopic
treated control or the non-treated cells (Fig 3D). The results indicate that α5β1 integrin, but not
αvβ3 integrin, mediates adhesion of B16V cells to fibronectin.
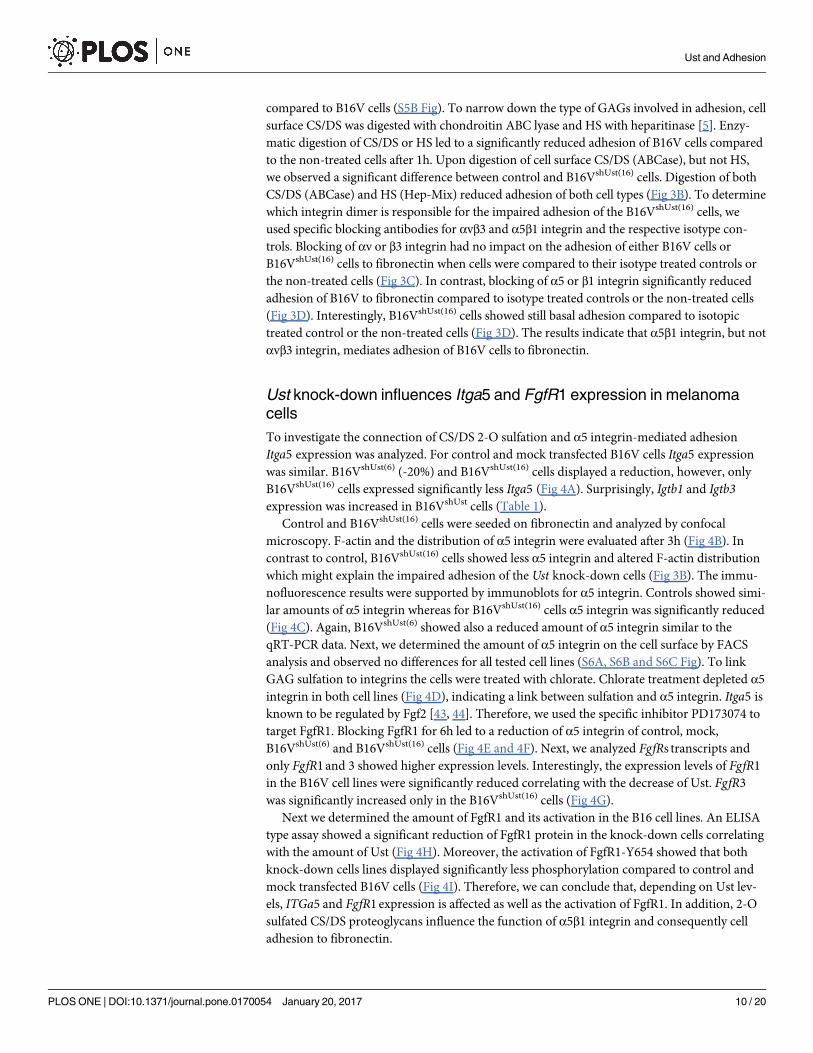
Ust knock-down influences Itga5 and FgfR1 expression in melanoma
cells
To investigate the connection of CS/DS 2-O sulfation and α5 integrin-mediated adhesion
Itga5 expression was analyzed. For control and mock transfected B16V cells Itga5 expression
was similar. B16VshUst(6) (-20%) and B16VshUst(16) cells displayed a reduction, however, only
B16VshUst(16) cells expressed significantly less Itga5 (Fig 4A). Surprisingly, Igtb1 and Igtb3expression was increased in B16VshUst cells (Table 1).
Control and B16VshUst(16) cells were seeded on fibronectin and analyzed by confocal
microscopy. F-actin and the distribution of α5 integrin were evaluated after 3h (Fig 4B). In
contrast to control, B16VshUst(16) cells showed less α5 integrin and altered F-actin distribution
which might explain the impaired adhesion of the Ust knock-down cells (Fig 3B). The immu-
nofluorescence results were supported by immunoblots for α5 integrin. Controls showed simi-
lar amounts of α5 integrin whereas for B16VshUst(16) cells α5 integrin was significantly reduced
(Fig 4C). Again, B16VshUst(6) showed also a reduced amount of α5 integrin similar to the
qRT-PCR data. Next, we determined the amount of α5 integrin on the cell surface by FACS
analysis and observed no differences for all tested cell lines (S6A, S6B and S6C Fig). To link
GAG sulfation to integrins the cells were treated with chlorate. Chlorate treatment depleted α5
integrin in both cell lines (Fig 4D), indicating a link between sulfation and α5 integrin. Itga5 is
known to be regulated by Fgf2 [43, 44]. Therefore, we used the specific inhibitor PD173074 to
target FgfR1. Blocking FgfR1 for 6h led to a reduction of α5 integrin of control, mock,
B16VshUst(6) and B16VshUst(16) cells (Fig 4E and 4F). Next, we analyzed FgfRs transcripts and
only FgfR1 and 3 showed higher expression levels. Interestingly, the expression levels of FgfR1
in the B16V cell lines were significantly reduced correlating with the decrease of Ust. FgfR3
was significantly increased only in the B16VshUst(16) cells (Fig 4G).
Next we determined the amount of FgfR1 and its activation in the B16 cell lines. An ELISA
type assay showed a significant reduction of FgfR1 protein in the knock-down cells correlating
with the amount of Ust (Fig 4H). Moreover, the activation of FgfR1-Y654 showed that both
knock-down cells lines displayed significantly less phosphorylation compared to control and
mock transfected B16V cells (Fig 4I). Therefore, we can conclude that, depending on Ust lev-
els, ITGa5 and FgfR1 expression is affected as well as the activation of FgfR1. In addition, 2-O
sulfated CS/DS proteoglycans influence the function of α5β1 integrin and consequently cell
adhesion to fibronectin.
Ust and Adhesion
PLOS ONE | DOI:10.1371/journal.pone.0170054 January 20, 2017 10 / 20
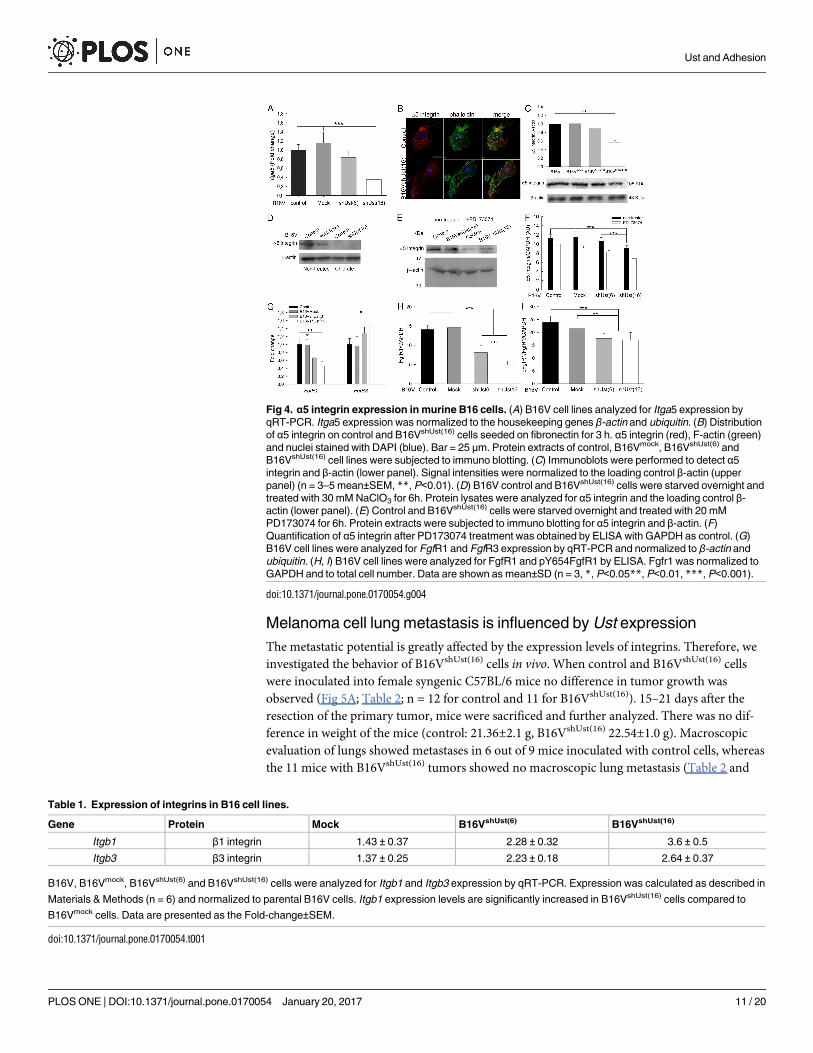
Melanoma cell lung metastasis is influenced by Ust expression
The metastatic potential is greatly affected by the expression levels of integrins. Therefore, we
investigated the behavior of B16VshUst(16) cells in vivo. When control and B16VshUst(16) cells
were inoculated into female syngenic C57BL/6 mice no difference in tumor growth was
observed (Fig 5A; Table 2; n = 12 for control and 11 for B16VshUst(16)). 15–21 days after the
resection of the primary tumor, mice were sacrificed and further analyzed. There was no dif-
ference in weight of the mice (control: 21.36±2.1 g, B16VshUst(16) 22.54±1.0 g). Macroscopic
evaluation of lungs showed metastases in 6 out of 9 mice inoculated with control cells, whereas
the 11 mice with B16VshUst(16) tumors showed no macroscopic lung metastasis (Table 2 and
Fig 4. α5 integrin expression in murine B16 cells. (A) B16V cell lines analyzed for Itga5 expression by
qRT-PCR. Itga5 expression was normalized to the housekeeping genes β-actin and ubiquitin. (B) Distribution
of α5 integrin on control and B16VshUst(16) cells seeded on fibronectin for 3 h. α5 integrin (red), F-actin (green)
and nuclei stained with DAPI (blue). Bar = 25 μm. Protein extracts of control, B16Vmock, B16VshUst(6) and
B16VshUst(16) cell lines were subjected to immuno blotting. (C) Immunoblots were performed to detect α5
integrin and β-actin (lower panel). Signal intensities were normalized to the loading control β-actin (upper
panel) (n = 3–5 mean±SEM, **, P<0.01). (D) B16V control and B16VshUst(16) cells were starved overnight and
treated with 30 mM NaClO3 for 6h. Protein lysates were analyzed for α5 integrin and the loading control β-
actin (lower panel). (E) Control and B16VshUst(16) cells were starved overnight and treated with 20 mM
PD173074 for 6h. Protein extracts were subjected to immuno blotting for α5 integrin and β-actin. (F)
Quantification of α5 integrin after PD173074 treatment was obtained by ELISA with GAPDH as control. (G)
B16V cell lines were analyzed for FgfR1 and FgfR3 expression by qRT-PCR and normalized to β-actin and
ubiquitin. (H, I) B16V cell lines were analyzed for FgfR1 and pY654FgfR1 by ELISA. Fgfr1 was normalized to
GAPDH and to total cell number. Data are shown as mean±SD (n = 3, *, P<0.05**, P<0.01, ***, P<0.001).
doi:10.1371/journal.pone.0170054.g004
Table 1. Expression of integrins in B16 cell lines.
Gene Protein Mock B16VshUst(6) B16VshUst(16)
Itgb1 β1 integrin 1.43 ± 0.37 2.28 ± 0.32 3.6 ± 0.5
Itgb3 β3 integrin 1.37 ± 0.25 2.23 ± 0.18 2.64 ± 0.37
B16V, B16Vmock, B16VshUst(6) and B16VshUst(16) cells were analyzed for Itgb1 and Itgb3 expression by qRT-PCR. Expression was calculated as described in
Materials & Methods (n = 6) and normalized to parental B16V cells. Itgb1 expression levels are significantly increased in B16VshUst(16) cells compared to
B16Vmock cells. Data are presented as the Fold-change±SEM.
doi:10.1371/journal.pone.0170054.t001
Ust and Adhesion
PLOS ONE | DOI:10.1371/journal.pone.0170054 January 20, 2017 11 / 20
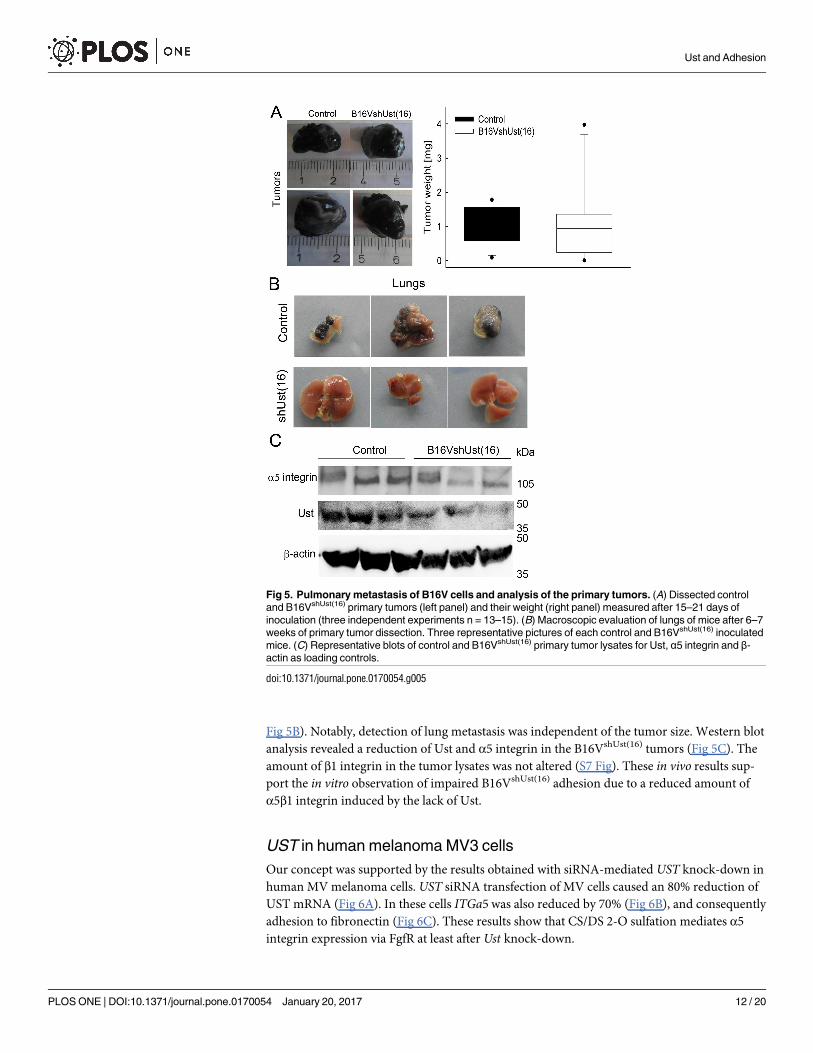
Fig 5B). Notably, detection of lung metastasis was independent of the tumor size. Western blot
analysis revealed a reduction of Ust and α5 integrin in the B16VshUst(16) tumors (Fig 5C). The
amount of β1 integrin in the tumor lysates was not altered (S7 Fig). These in vivo results sup-
port the in vitro observation of impaired B16VshUst(16) adhesion due to a reduced amount of
α5β1 integrin induced by the lack of Ust.
UST in human melanoma MV3 cells
Our concept was supported by the results obtained with siRNA-mediated UST knock-down in
human MV melanoma cells. UST siRNA transfection of MV cells caused an 80% reduction of
UST mRNA (Fig 6A). In these cells ITGa5 was also reduced by 70% (Fig 6B), and consequently
adhesion to fibronectin (Fig 6C). These results show that CS/DS 2-O sulfation mediates α5
integrin expression via FgfR at least after Ust knock-down.
Fig 5. Pulmonary metastasis of B16V cells and analysis of the primary tumors. (A) Dissected control
and B16VshUst(16) primary tumors (left panel) and their weight (right panel) measured after 15–21 days of
inoculation (three independent experiments n = 13–15). (B) Macroscopic evaluation of lungs of mice after 6–7
weeks of primary tumor dissection. Three representative pictures of each control and B16VshUst(16) inoculated
mice. (C) Representative blots of control and B16VshUst(16) primary tumor lysates for Ust, α5 integrin and β-
actin as loading controls.
doi:10.1371/journal.pone.0170054.g005
Ust and Adhesion
PLOS ONE | DOI:10.1371/journal.pone.0170054 January 20, 2017 12 / 20
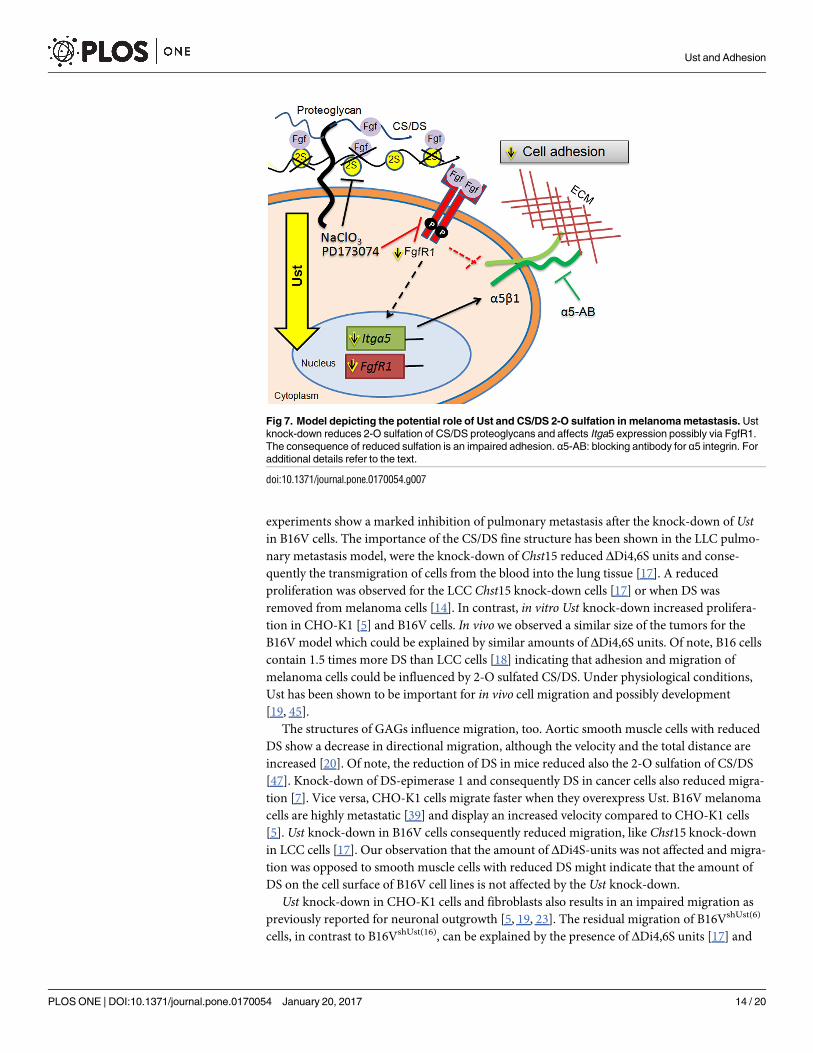
Our results show that Ust and 2-O sulfation levels of CS/DS affect the synthesis of Itga5 and
FgfR1 and, in addition, the function of α5β1 integrin which leads to impaired melanoma cell
adhesion (Fig 7).
Discussion
Migration of tumor cells is an important step during metastasis. The motility of melanoma
cells contributes to their highly invasive and metastatic potential. Melanoma cells display a
shift from HS and DS to CS [13]. However, the function of the fine structure of the 2-O sulfa-
tion of the CS/DS chains and the respective enzymes involved, especially Ust, are not known.
So far the function of Ust has been studied during brain development or under physiological
conditions [5, 19]. CHO-K1 cells express Ust which subsequently leads to CS/DS 2-O sulfa-
tion, later involved in Fgf-2-induced migration [5]. Recently, a patient with a microdeletion on
chromosome 6q25.1 was described with among other symptoms an Ehlers-Danlos syndrome
in skin [45]. The microdeletion included the lack of human UST gene indicating that the
minor sulfation of CS/DS affects also the organization of the extracellular matrix, similar to the
DS [46]. Understanding the impact of Ust and 2-O sulfation might identify potential therapeu-
tic targets in melanoma metastasis.
We used an experimental metastatic model of B16 cells which has the advantage of forming
a primary orthologue tumor followed by metastasis from the skin to the lung [39]. Our in vivo
Table 2. In vivo experiments using control and B16VshUst(16) cells in a C57BL/6 mice tumor metastasis model.
Experiment Mice per strain Removal of primary tumor Analyzed after 6–7 weeks Lung metastasis$
Con B16VshUst(16) Con B16VshUst(16) Con B16VshUst(16)
V1 5 3 (2+) 3 (2+) 2 (1§) 3 1 0
V2 5 5 4 (1#) 3 (2§) 4 3 0
V3 5 4 (1*) 4 (1*) 4 4 2 0
Total 15 12 11 9 11 6 0
106 cells were injected and after 15–21 days primary tumors were removed. After 6–7 weeks mice were dissected and macroscopically evaluated for lung
metastasis.+ mice died before tumor dissection# mice no tumor developed
* mice died during tumor dissection§ mice died during 7 weeks$ macroscopic evaluation
doi:10.1371/journal.pone.0170054.t002
Fig 6. Human melanoma cells and UST knock-down. Expression levels of UST (A) and ITGA5 (B) in
human MV3 melanoma cells after transient UST knock-down with siRNA. Expression was normalized to the
housekeeping gene β-actin. (C) Adhesion to fibronectin of UST knock-down MV3 cells and the respective
control. Data are shown as mean±SEM (n = 3, ***, P<0.001).
doi:10.1371/journal.pone.0170054.g006
Ust and Adhesion
PLOS ONE | DOI:10.1371/journal.pone.0170054 January 20, 2017 13 / 20
experiments show a marked inhibition of pulmonary metastasis after the knock-down of Ustin B16V cells. The importance of the CS/DS fine structure has been shown in the LLC pulmo-
nary metastasis model, were the knock-down of Chst15 reduced ΔDi4,6S units and conse-
quently the transmigration of cells from the blood into the lung tissue [17]. A reduced
proliferation was observed for the LCC Chst15 knock-down cells [17] or when DS was
removed from melanoma cells [14]. In contrast, in vitro Ust knock-down increased prolifera-
tion in CHO-K1 [5] and B16V cells. In vivo we observed a similar size of the tumors for the
B16V model which could be explained by similar amounts of ΔDi4,6S units. Of note, B16 cells
contain 1.5 times more DS than LCC cells [18] indicating that adhesion and migration of
melanoma cells could be influenced by 2-O sulfated CS/DS. Under physiological conditions,
Ust has been shown to be important for in vivo cell migration and possibly development
[19, 45].
The structures of GAGs influence migration, too. Aortic smooth muscle cells with reduced
DS show a decrease in directional migration, although the velocity and the total distance are
increased [20]. Of note, the reduction of DS in mice reduced also the 2-O sulfation of CS/DS
[47]. Knock-down of DS-epimerase 1 and consequently DS in cancer cells also reduced migra-
tion [7]. Vice versa, CHO-K1 cells migrate faster when they overexpress Ust. B16V melanoma
cells are highly metastatic [39] and display an increased velocity compared to CHO-K1 cells
[5]. Ust knock-down in B16V cells consequently reduced migration, like Chst15 knock-down
in LCC cells [17]. Our observation that the amount of ΔDi4S-units was not affected and migra-
tion was opposed to smooth muscle cells with reduced DS might indicate that the amount of
DS on the cell surface of B16V cell lines is not affected by the Ust knock-down.
Ust knock-down in CHO-K1 cells and fibroblasts also results in an impaired migration as
previously reported for neuronal outgrowth [5, 19, 23]. The residual migration of B16VshUst(6)
cells, in contrast to B16VshUst(16), can be explained by the presence of ΔDi4,6S units [17] and
Fig 7. Model depicting the potential role of Ust and CS/DS 2-O sulfation in melanoma metastasis. Ust
knock-down reduces 2-O sulfation of CS/DS proteoglycans and affects Itga5 expression possibly via FgfR1.
The consequence of reduced sulfation is an impaired adhesion. α5-AB: blocking antibody for α5 integrin. For
additional details refer to the text.
doi:10.1371/journal.pone.0170054.g007
Ust and Adhesion
PLOS ONE | DOI:10.1371/journal.pone.0170054 January 20, 2017 14 / 20
the impact of the level of 2-O sulfation. In vivo, for HS not only the amount of sulfation but
also the HS structure affects hedgehog signaling during development [48]. Migration on a
complex ECM generated by fibroblasts requires integrins that recognize several matrix ligands
including fibronectin (e.g. α5β1, αvβ3, α4β1) or collagens (α1β1, α2β1). Previously, we showed
that the lack of decorin and the reduced amount of 2-O sulfated CS/DS in fibroblasts lead to
an increase in β1 integrin [23, 33]. Melanoma cells express α5β1 and αvβ3 integrin which are
involved in adhesion and migration [26] and are tightly regulated [24]. Overexpression of
miR-148b in melanoma cells significantly inhibited metastasis by reducing ITGa5 [49]. In con-
trast to decorin-deficient fibroblasts, B16V Ust knock-down cells displayed a reduction in α5
integrin. B16V cell adhesion to fibronectin was only reduced by blocking α5β1 but not αvβ3.
The cell surface amount of α5 integrin was not altered in B16V Ust knock-down cells indicat-
ing that 2-O CS/DS sulfation functions as a structural component involved in adhesion. Vari-
ous studies showed that cell surface CS and DS and their structures have an impact on cancer
cell adhesion [7, 14, 15, 17, 41]. One might speculate that the level of CS/DS 2-O sulfation on
the cell surface modulates α5β1 integrin conformation and fibronectin binding. This specula-
tion can be supported by a recent publication about different distinct global conformations of
α5β1 integrin which determine adhesive and non-adhesive function to fibronectin. Under
conditions in which the bent-closed conformation predominates, α5β1 integrin impairs adhe-
sion to fibronectin in a K562 cell line [50].
As modulating signaling events, Ust knock-down and consequently, CS/DS 2-O sulfation
are associated with the expression of Itga5 and FgfR1. The reduced expression of Itga5 and
FgfR1 can be explained by the function of CS/DS as low affinity receptors for different growth
factors [1, 2, 7] and therefore affecting signaling. This hypothesis is supported by a reduced
Itga5 expression either after inhibition of cell surface sulfation or by blocking FgfR1. Moreover,
also FgfR1 and its activation are reduced in B16 Ust knock-down cells. The link of α5 integrin,
Fgf2 and FgfR has been demonstrated for angiogenesis [43] and in 3T3 fibroblasts [44]. In
addition, the aggressiveness of melanoma is due to Fgf2 induced α5 integrin expression [28].
Under physiological conditions Fgf2 signaling requires GAGs [1] and we could show that 2-O
sulfated CS/DS are involved in migration [5]. A possible downstream mechanism could be the
transcription factor Twist-1 which has been recently shown to induce Itga5 expression and
leads to epithelial-mesenchymal transition [51]. The link between reduced Twist-1 expression,
lack of DS and adhesion to fibronectin has been shown for Xenopus neural crest cells [52]. Of
note, adhesion of B16VshUst(16) cells was significantly reduced by either inhibiting CS/DS sulfa-
tion or by digesting cell surface GAGs.
To support a possible role of Ust in melanoma, we tested three metastasizing human mela-
noma cell lines, MV3 [31], HT199 and HT168M [30] that all express UST. The biological rele-
vance of the data obtained with mouse melanoma cells is supported by the human melanoma
cell line MV3 which expresses UST. siRNA-mediated UST knock-down in MV3 cells also
showed a reduction in ITGa5 and adhesion.
Overall our data propose Ust and consequently 2-O sulfated CS/DS as a regulator of adhe-
sion via the amount and activation of FgfR1 and the expression of Itga5 in melanoma cells
(Fig 7). In addition, the amount of 2-O sulfated CS/DS influences α5β1 integrin function in
melanoma cells indicating that Ust could be a potential marker for melanoma metastasis and a
target for a therapeutic approach.
Supporting Information
S1 Fig. UST expression in melanoma cell lines. qRT-PCR for UST of three human melanoma
cell lines with high metastasizing potential and murine B16V cells. HT168-M1, HT199
Ust and Adhesion
PLOS ONE | DOI:10.1371/journal.pone.0170054 January 20, 2017 15 / 20
(Ladanyi et al., 2001) and MV3 cells (van Muijen et al., 1991) were previously described.
HT168-M and HT199 revealed similar metastatic potential after intra-splenic injection (Lada-
nyi et al., 2001). All tested cell lines express UST. ΔCT values show that all three human cell
lines express more UST compared to B16V cells.
(JPG)
S2 Fig. Characterization of B16shUst cell lines. B16 cell lysates were subjected to the sulfo-
transferase assay (see Materials and Methods) followed by disaccharide analysis by FACE.
CS6S was used as a substrate to determine the sulfotransferase activity and to obtain ΔDi2,6S
units. The gel following FACE does not allow to distinguish between ΔDi2,6S and ΔDi2,4S
therefore, we used ΔDi2,XS. (A) Borate gel shows a reduced amount of ΔDi2,XS in both
B16VshUst cell lines indicating a reduction in 2-O sulfotransferase activity due to the Ustknock-down. (B) The quantification of the signals (panel A) shows 40% less 2-O sulfated disac-
charides for B16VshUst(6) and 70% less for B16VshUst(6). The FACE analysis supported the
result obtained by the enzyme activity test (see Fig 1C). (C) Uronic acid content of the three
B16V cell lines (n = 3). (D) Quantification of 4-sulfated disaccharides (ΔDi4S) derived from
total cell surface CS/DS and (E) HS disaccharide analysis of B16V and B16VshUst(16) cells
(n = 3).
(TIF)
S3 Fig. Movie of the migration of control B16V cells (B) on 3D matrices generated by fibro-
blasts over 10 days. To obtain a collagen-rich ECM fibroblasts were cultured in the presence
of ascorbate-2-phosphate. The time-lapse microscope took images in 5 min intervals for 2h.
(MOV)
S4 Fig. Movie of the migration of B16shUst(16) cells on 3D matrices generated by fibroblasts
over 10 days. To obtain a collagen-rich ECM fibroblasts were cultured in the presence of
ascorbate-2-phosphate. The time-lapse microscope took images in 5 min intervals for 2h.
(MOV)
S5 Fig. Adhesion of control B16V and B16VshUst(16) cells. (A) Time course for the cell adhe-
sion to plastic. (B) Cell adhesion for 1 h to fibronectin after treatment with 30 mM chlorate for
6 h to inhibit GAG sulfation. Both regiments lead to a reduction of adhesion of the B16V cells
to basal levels of B16VshUst(16) cells, indicating that CS/DS sulfation is involved in adhesion to
fibronectin.
(TIF)
S6 Fig. Cell surface α5 integrin determined by FACS. Histogram of cell surface α5 integrin
expression in B16V, B16Vmock, B16VshUst(6) and B16VshUst(16) cell lines. Living cells were
stained with (A) the antibody CD49e-Alexa647 or (B) the isotype control and subjected to
FACS analysis. (C) Unstained cells were used as control. The histograms are one out of three
representative experiments and display the same amount of α5 integrin on the cell surface of
the 4 cell lines (n = 3).
(TIF)
S7 Fig. Detection of β1 integrin in the tumors. Immuno blots of three control and three
B16VshUst(16) primary tumors lysates for β1 integrin and β-actin as loading control. The β1
integrin blot was used after stripping. Therefore, the loading control β-actin is the same as in
Fig 5C.
(TIF)
Ust and Adhesion
PLOS ONE | DOI:10.1371/journal.pone.0170054 January 20, 2017 16 / 20
Acknowledgments
We thank Margret Bahl and Frauke Spiecker for their technical assistance, the IZKF core unit
of the Medical Faculty of University of Munster for the qRT-PCR and the Core Facility Cell
Sorting (Dr. M. Ballmaier) of the Medical School Hannover. This work was financially sup-
ported by the German Research Foundation (SE1431/3-1) to DGS, German Cancer Aid
(#111262) to DGS and CS and the German Research Foundation—GRK 1549 International
Research Training Group ‘Molecular and Cellular GlycoSciences’ to KN.
Author Contributions
Conceptualization: DGS.
Data curation: DGS.
Formal analysis: KN DS CS DGS.
Funding acquisition: DGS CS KN.
Investigation: KN.
Methodology: DGS KN JH CS DS.
Project administration: KN DGS.
Resources: AL.
Supervision: DGS.
Validation: KN CS DS JH DGS.
Visualization: KN DGS.
Writing – original draft: DGS KN.
Writing – review & editing: KN DS JH AL CS DGS.
References1. Fuster M.M. & Esko J.D. (2005) The sweet and sour of cancer: glycans as novel therapeutic targets.
Nat. Rev. Cancer. 5 526–542. doi: 10.1038/nrc1649 PMID: 16069816
2. Afratis N., Gialeli C., Nikitovic D., Tsegenidis T., Karousou E., Theocharis A.D.et al. (2012) Glycosami-
noglycans: key players in cancer cell biology and treatment. FEBS J. 279 1177–1197. doi: 10.1111/j.
1742-4658.2012.08529.x PMID: 22333131
3. Seidler D.G. (2012) The galactosaminoglycan-containing decorin and its impact on diseases. Curr.
Opin. Struct. Biol. 22 578–582. doi: 10.1016/j.sbi.2012.07.012 PMID: 22877511
4. Taylor K.R., Rudisill J.A. & Gallo R.L. (2005) Structural and sequence motifs in dermatan sulfate for pro-
moting fibroblast growth factor-2 (FGF-2) and FGF-7 activity. J. Biol. Chem. 280 5300–5306. doi: 10.
1074/jbc.M410412200 PMID: 15563459
5. Nikolovska K., Spillmann D. & Seidler D.G. (2015) Uronyl 2-O sulfotransferase potentiates Fgf2-
induced cell migration. J. Cell. Sci. 128 460–471. doi: 10.1242/jcs.152660 PMID: 25480151
6. Esko J.D. & Selleck S.B. (2002) Order out of chaos: assembly of ligand binding sites in heparan sulfate.
Annu. Rev. Biochem. 71 435–471. doi: 10.1146/annurev.biochem.71.110601.135458 PMID:
12045103
7. Malmstrom A., Bartolini B., Thelin M.A., Pacheco B. & Maccarana M. (2012) Iduronic acid in chondroi-
tin/dermatan sulfate: biosynthesis and biological function. J. Histochem. Cytochem. 60 916–925. doi:
10.1369/0022155412459857 PMID: 22899863
8. Mizumoto S., Yamada S. & Sugahara K. (2015) Molecular interactions between chondroitin-dermatan
sulfate and growth factors/receptors/matrix proteins. Curr. Opin. Struct. Biol. 34 35–42. doi: 10.1016/j.
sbi.2015.06.004 PMID: 26164146
Ust and Adhesion
PLOS ONE | DOI:10.1371/journal.pone.0170054 January 20, 2017 17 / 20
9. Nakao M., Shichijo S., Imaizumi T., Inoue Y., Matsunaga K., Yamada A.et al. (2000) Identification of a
gene coding for a new squamous cell carcinoma antigen recognized by the CTL. J. Immunol. 164
2565–2574. PMID: 10679095
10. Kobayashi M., Sugumaran G., Liu J., Shworak N.W., Silbert J.E. & Rosenberg R.D. (1999) Molecular
cloning and characterization of a human uronyl 2-sulfotransferase that sulfates iduronyl and glucuronyl
residues in dermatan/chondroitin sulfate. J. Biol. Chem. 274 10474–10480. PMID: 10187838
11. Garrigues H.J., Lark M.W., Lara S., Hellstrom I., Hellstrom K.E. & Wight T.N. (1986) The melanoma pro-
teoglycan: restricted expression on microspikes, a specific microdomain of the cell surface. J. Cell Biol.
103 1699–1710. PMID: 2430975
12. Wegrowski Y. & Maquart F.X. (2006) Chondroitin sulfate proteoglycans in tumor progression. Adv.
Pharmacol. 53 297–321. doi: 10.1016/S1054-3589(05)53014-X PMID: 17239772
13. Smetsers T.F., van de Westerlo E.M., ten Dam G.B., Overes I.M., Schalkwijk J., van Muijen G.N. et al.
(2004) Human single-chain antibodies reactive with native chondroitin sulfate detect chondroitin sulfate
alterations in melanoma and psoriasis. J. Invest. Dermatol. 122 707–716. doi: 10.1111/j.0022-202X.
2004.22316.x PMID: 15086557
14. Denholm E.M., Lin Y.Q. & Silver P.J. (2001) Anti-tumor activities of chondroitinase AC and chondroiti-
nase B: inhibition of angiogenesis, proliferation and invasion. Eur. J. Pharmacol. 416 213–221. PMID:
11290371
15. Cooney C.A., Jousheghany F., Yao-Borengasser A., Phanavanh B., Gomes T., Kieber-Emmons A.M.
et al. (2011) Chondroitin sulfates play a major role in breast cancer metastasis: a role for CSPG4 and
CHST11 gene expression in forming surface P-selectin ligands in aggressive breast cancer cells.
Breast Cancer Res. 13 R58. doi: 10.1186/bcr2895 PMID: 21658254
16. Li F., Ten Dam G.B., Murugan S., Yamada S., Hashiguchi T., Mizumoto S., et al. (2008) Involvement of
highly sulfated chondroitin sulfate in the metastasis of the Lewis lung carcinoma cells. J. Biol. Chem.
283 34294–34304. doi: 10.1074/jbc.M806015200 PMID: 18930920
17. Mizumoto S., Watanabe M., Yamada S. & Sugahara K. (2013) Expression of N-acetylgalactosamine
4-sulfate 6-O-sulfotransferase involved in chondroitin sulfate synthesis is responsible for pulmonary
metastasis. Biomed. Res. Int. 2013 656319. doi: 10.1155/2013/656319 PMID: 23555092
18. Mizumoto S., Takahashi J. & Sugahara K. (2012) Receptor for advanced glycation end products
(RAGE) functions as receptor for specific sulfated glycosaminoglycans, and anti-RAGE antibody or sul-
fated glycosaminoglycans delivered in vivo inhibit pulmonary metastasis of tumor cells. J. Biol. Chem.
287 18985–18994. doi: 10.1074/jbc.M111.313437 PMID: 22493510
19. Ishii M. & Maeda N. (2008) Oversulfated chondroitin sulfate plays critical roles in the neuronal migration
in the cerebral cortex. J. Biol. Chem. 283 32610–32620. doi: 10.1074/jbc.M806331200 PMID:
18819920
20. Bartolini B., Thelin M.A., Svensson L., Ghiselli G., van Kuppevelt T.H., Malmstrom A. et al. (2013).
Iduronic acid in chondroitin/dermatan sulfate affects directional migration of aortic smooth muscle cells.
PLoS One 8 e66704. doi: 10.1371/journal.pone.0066704 PMID: 23843960
21. Kwok J.C., Warren P. & Fawcett J.W. (2012) Chondroitin sulfate: a key molecule in the brain matrix. Int.
J. Biochem. Cell Biol. 44 582–586. doi: 10.1016/j.biocel.2012.01.004 PMID: 22265655
22. Keire P.A., Bressler S.L., Mulvihill E.R., Starcher B.C., Kang I., Wight T.N. (2016) Inhibition of versican
expression by siRNA facilitates tropoelastin synthesis and elastic fiber formation by human SK-LMS-1
leiomyosarcoma smooth muscle cells in vitro and in vivo. Matrix Biol. 50 67–81. doi: 10.1016/j.matbio.
2015.12.010 PMID: 26723257
23. Nikolovska K., Renke J.K., Jungmann O., Grobe K., Iozzo R.V., Zamfir A.D. et al. (2014) A decorin-
deficient matrix affects skin chondroitin/dermatan sulfate levels and keratinocyte function. Matrix Biol.
35 91–102. doi: 10.1016/j.matbio.2014.01.003 PMID: 24447999
24. Morgan M.R., Byron A., Humphries M.J. & Bass M.D. (2009) Giving off mixed signals—distinct func-
tions of alpha5beta1 and alphavbeta3 integrins in regulating cell behaviour. IUBMB Life 61 731–738.
doi: 10.1002/iub.200 PMID: 19514020
25. Schaffner F., Ray A.M. & Dontenwill M. (2013) Integrin alpha5beta1, the Fibronectin Receptor, as a Per-
tinent Therapeutic Target in Solid Tumors. Cancers (Basel) 5 27–47.
26. McKenzie J.A., Liu T., Jung J.Y., Jones B.B., Ekiz H.A., Welm A.L. et al. (2013) Survivin promotion of
melanoma metastasis requires upregulation of alpha5 integrin. Carcinogenesis 34 2137–2144. doi: 10.
1093/carcin/bgt155 PMID: 23640047
27. McKenzie J.A., Liu T., Goodson A.G. & Grossman D. (2010) Survivin enhances motility of melanoma
cells by supporting Akt activation and {alpha}5 integrin upregulation. Cancer Res. 70 7927–7937. doi:
10.1158/0008-5472.CAN-10-0194 PMID: 20807805
Ust and Adhesion
PLOS ONE | DOI:10.1371/journal.pone.0170054 January 20, 2017 18 / 20
28. Qian F., Zhang Z.C., Wu X.F., Li Y.P. & Xu Q. (2005) Interaction between integrin alpha(5) and fibronec-
tin is required for metastasis of B16F10 melanoma cells. Biochem. Biophys. Res. Commun. 333
1269–1275. doi: 10.1016/j.bbrc.2005.06.039 PMID: 15979576
29. Supino R., Prosperi E., Formelli F., Mariani M. & Parmiani G. (1986) Characterization of a doxorubicin-
resistant murine melanoma line: studies on cross-resistance and its circumvention. Br. J. Cancer 54
33–42. PMID: 3730255
30. Ladanyi A., Gallai M., Paku S., Nagy J.O., Dudas J., Timar J. et al. (2001) Expression of a decorin-like
molecule in human melanoma. Pathol. Oncol. Res. 7 260–266. PMID: 11882905
31. van Muijen G.N., Jansen K.F., Cornelissen I.M., Smeets D.F., Beck J.L. & Ruiter D.J. (1991) Establish-
ment and characterization of a human melanoma cell line (MV3) which is highly metastatic in nude
mice. Int. J. Cancer 48 85–91. PMID: 2019461
32. Bocian C., Urbanowitz A.K., Owens R.T., Iozzo R.V., Gotte M. & Seidler D.G. (2013) Decorin potenti-
ates interferon-gamma activity in a model of allergic inflammation. J. Biol. Chem. 288 12699–12711.
doi: 10.1074/jbc.M112.419366 PMID: 23460644
33. Jungmann O., Nikolovska K., Stock C., Schulz J.N., Eckes B., Riethmuller C.et al. (2012) The dermatan
sulfate proteoglycan decorin modulates alpha2beta1 integrin and the vimentin intermediate filament
system during collagen synthesis. PLoS One 7 e50809. doi: 10.1371/journal.pone.0050809 PMID:
23226541
34. Vandesompele J., De Preter K., Pattyn F., Poppe B., Van Roy N., De Paepe A. et al. (2002) Accurate
normalization of real-time quantitative RT-PCR data by geometric averaging of multiple internal control
genes. Genome Biol. 3 RESEARCH0034.
35. Seidler D.G., Breuer E., Grande-Allen K.J., Hascall V.C. & Kresse H. (2002) Core protein dependence
of epimerization of glucuronosyl residues in galactosaminoglycans. J. Biol. Chem. 277 42409–42416.
doi: 10.1074/jbc.M208442200 PMID: 12207034
36. Seidler D.G., Mohamed N.A., Bocian C., Stadtmann A., Hermann S., Schafers K. et al. (2011) The role
for decorin in delayed-type hypersensitivity. J. Immunol. 187 6108–6119. doi: 10.4049/jimmunol.
1100373 PMID: 22043007
37. Stock C., Jungmann O. & Seidler D.G. (2011) Decorin and chondroitin-6 sulfate inhibit B16V melanoma
cell migration and invasion by cellular acidification. J. Cell. Physiol. 226 2641–2650. doi: 10.1002/jcp.
22612 PMID: 21792923
38. Vahle A.K., Domikowsky B., Schwoppe C., Krahling H., Mally S., Schafers M. et al. (2014) Extracellular
matrix composition and interstitial pH modulate NHE1-mediated melanoma cell motility. Int. J. Oncol.
44 78–90. doi: 10.3892/ijo.2013.2158 PMID: 24173371
39. Nakamura K., Yoshikawa N., Yamaguchi Y., Kagota S., Shinozuka K. & Kunitomo M. (2002) Character-
ization of mouse melanoma cell lines by their mortal malignancy using an experimental metastatic
model. Life Sci. 70 791–798. PMID: 11833741
40. Loffek S., Zigrino P., Angel P., Anwald B., Krieg T. & Mauch C. (2005) High invasive melanoma cells
induce matrix metalloproteinase-1 synthesis in fibroblasts by interleukin-1alpha and basic fibroblast
growth factor-mediated mechanisms. J. Invest. Dermatol. 124 638–643. doi: 10.1111/j.0022-202X.
2005.23629.x PMID: 15737206
41. Fthenou E., Zong F., Zafiropoulos A., Dobra K., Hjerpe A. & Tzanakakis G.N. (2009) Chondroitin sulfate
A regulates fibrosarcoma cell adhesion, motility and migration through JNK and tyrosine kinase signal-
ing pathways. In Vivo 23 69–76. PMID: 19368127
42. Keller K.M., Brauer P.R. & Keller J.M. (1989) Modulation of cell surface heparan sulfate structure by
growth of cells in the presence of chlorate. Biochemistry 28 8100–8107. PMID: 2532538
43. Collo G. & Pepper M.S. (1999) Endothelial cell integrin alpha5beta1 expression is modulated by cyto-
kines and during migration in vitro. J. Cell. Sci. 112 (Pt 4) 569–578.
44. Klein S., Bikfalvi A., Birkenmeier T.M., Giancotti F.G. & Rifkin D.B. (1996) Integrin regulation by endoge-
nous expression of 18-kDa fibroblast growth factor-2. J. Biol. Chem. 271 22583–22590. PMID:
8798427
45. Salpietro V., Ruggieri M., Mankad K., Di Rosa G., Granata F., Loddo I. et al. (2015) A de novo 0.63 Mb
6q25.1 deletion associated with growth failure, congenital heart defect, underdeveloped cerebellar ver-
mis, abnormal cutaneous elasticity and joint laxity. Am. J. Med. Genet. A. 167 2042–2051.
46. Syx D., Van Damme T., Symoens S., Maiburg M.C., van de Laar I., Morton J.et al. (2015) Genetic het-
erogeneity and clinical variability in musculocontractural Ehlers-Danlos syndrome caused by impaired
dermatan sulfate biosynthesis. Hum. Mutat. 36 535–547. doi: 10.1002/humu.22774 PMID: 25703627
47. Maccarana M., Kalamajski S., Kongsgaard M., Magnusson S.P., Oldberg A. & Malmstrom A. (2009)
Dermatan sulfate epimerase 1-deficient mice have reduced content and changed distribution of iduronic
Ust and Adhesion
PLOS ONE | DOI:10.1371/journal.pone.0170054 January 20, 2017 19 / 20
acids in dermatan sulfate and an altered collagen structure in skin. Mol. Cell. Biol. 29 5517–5528. doi:
10.1128/MCB.00430-09 PMID: 19687302
48. Dierker T., Bachvarova V., Krause Y., Li J.P., Kjellen L., Seidler D.G. et al. (2016) Altered heparan sul-
fate structure in Glce(-/-) mice leads to increased Hedgehog signaling in endochondral bones. Matrix
Biol. 49 82–92. doi: 10.1016/j.matbio.2015.06.004 PMID: 26116392
49. Orso F., Quirico L., Virga F., Penna E., Dettori D., Cimino D. et al. (2016) miR-214 and miR-148b Tar-
geting Inhibits Dissemination of Melanoma and Breast Cancer. Cancer Res. 76 5151–5162. doi: 10.
1158/0008-5472.CAN-15-1322 PMID: 27328731
50. Su Y., Xia W., Li J., Walz T., Humphries M.J., Vestweber D. et al. (2016) Relating conformation to func-
tion in integrin alpha5beta1. Proc. Natl. Acad. Sci. U. S. A. 113 E3872–81. doi: 10.1073/pnas.
1605074113 PMID: 27317747
51. Nam E.H., Lee Y., Moon B., Lee J.W. & Kim S. (2015) Twist1 and AP-1 cooperatively upregulate integ-
rin alpha5 expression to induce invasion and the epithelial-mesenchymal transition. Carcinogenesis 36
327–337. doi: 10.1093/carcin/bgv005 PMID: 25600770
52. Gouignard N., Maccarana M., Strate I., von Stedingk K., Malmstrom A. & Pera E.M. (2016) Musculocon-
tractural Ehlers-Danlos syndrome and neurocristopathies: dermatan sulfate is required for Xenopus
neural crest cells to migrate and adhere to fibronectin. Dis. Model. Mech. pii: dmm.024661. [Epub
ahead of print]
Ust and Adhesion
PLOS ONE | DOI:10.1371/journal.pone.0170054 January 20, 2017 20 / 20
Related Documents